
94% of researchers rate our articles as excellent or good
Learn more about the work of our research integrity team to safeguard the quality of each article we publish.
Find out more
ORIGINAL RESEARCH article
Front. Ecol. Evol., 05 February 2025
Sec. Conservation and Restoration Ecology
Volume 13 - 2025 | https://doi.org/10.3389/fevo.2025.1518759
This article is part of the Research TopicCoastal Adaptation Through Nature: Natural and Nature-Based Features (NNBF) ResearchView all 3 articles
 Brian D. Harris1*
 Aleksandra Ostojic1
 Lenore P. Tedesco2Keith VanDerSys3
 Susan Bailey4
 Justin L. Shawler1
 Navid H. Jafari5†Monica Chasten6
Introduction: The beneficial use of dredged material (BUDM) to nourish degrading wetlands is a direct solution to increase surface elevation to help wetlands keep pace with sea level rise (SLR). While there have been numerous demonstrations of BUDM in wetland environments, there is a limited understanding of the resultant spatial and temporal elevation response due to consolidation of the dredged material and underlying wetland foundation soils.
Methods: To address this, surface elevations were monitored following multiple BUDM nourishments on a back-bay island in New Jersey. Field data was compared to consolidation models to assess the viability of current geotechnical modeling practices. Multispectral surveys were performed to document the revegetation of the nourished island over time.
Results: The placement of dredged material smothered the vegetation, but the site experienced significant revegetation (low of 22% cover in August 2021 to 52% in September 2023) after three full growing cycles. Approximately two years post BUDM, the nourished area experienced a 0.19 ± 0.11-m increase in elevation. The comparison of elevation immediately after nourishment and two years post- nourishment found that approximately one-third of elevation loss was the result of consolidation of deposited dredged material and the underlying wetland foundation.
Discussion: It was found that a reliance on solely laboratory data can induce a large degree of uncertainty within projected surface elevations. Thus, the implementation of in-situ geotechnical methods is strongly advised when possible. This investigation allowed for a comprehensive examination of geotechnical modeling methods for planning wetland nourishments, including predicting the ability to keep pace with sea level rise. Ultimately, the two BUDM nourishments offset the effects of SLR by approximately 18-28 years.
Coastal wetlands are highly productive, dynamic systems that provide diverse ecosystem services like wildlife habitat for migratory bird populations, carbon and nutrient sequestration, and storm protection (Mitsch and Gosselink, 1993; Costanza et al., 1998; Day et al., 2008; Reddy et al., 2010; Barbier et al., 2011). They exist at the boundary between land and sea with their distribution limited by inundation and erosion at lower elevations and vegetative competition at the landward boundary (Mendelssohn et al., 1981; Davis et al., 2022). Many of these essential ecosystems are being impacted by the combined effects of hydrologic restrictions, sea level rise, subsidence, and fragmentation that result in reductions in productivity and widespread losses of vast acres as vegetated surfaces transition to open water (Day et al., 2000; Fattet et al., 2011; Harris et al., 2020a; Davis et al., 2022; Cadigan et al., 2023; Harris et al., 2023). For example, wetland loss in the Mississippi River delta continues at an approximate rate of 28 km2 per year due to natural processes such as delta abandonment, subsidence, sea level rise, wave erosion, herbivory, hurricanes, and geologic faults, in addition to anthropogenic activities including levee building, hydrologic isolation, land reclamation for agriculture and industry, canal dredging and associated salt water intrusion, boat-induced shoreline erosion, herbivory by invasive species, and pollution (Boesch et al., 1994; Turner, 1997; Day et al., 2000, 2020).
To rehabilitate these deteriorating environments, hydraulically dredged material (i.e., sediment) can be strategically deposited on degraded wetlands to increase surface elevations and reconnect discontinuous wetlands. This application of uncontaminated dredged material is a form of direct nourishment that could potentially increase the rate of SLR that a marsh can withstand (Davis et al., 2022; Harris et al., 2024). This gain in elevation capital is crucial to long-term wetland stability as it controls the hydroperiod (i.e., flooding frequency and duration) and thereby salinity levels, nutrient availability, plant productivity, and redox potential (Croft et al., 2006; Day et al., 2011; Morris et al., 2013; Jafari et al., 2019a; Harris et al., 2020b). Coastal wetlands occupy elevations between mean sea level (MSL) and mean high water (MHW) (McKee and Patrick, 1988), with optimum growth occurring near the middle of the range (Morris et al., 2002, 2013) while generally wetlands at lower elevations relative to MHW are in more imminent danger of drowning and converting to open water (Davis et al., 2022).
Common sources of dredged materials are waterway and port maintenance events. Historically, this material was taken to upland confined disposal facilities or offshore disposal sites, which permanently removes the sediment from the system. Over the past decades, there has been a shift away from this disposal mindset towards the beneficial use of dredged material (BUDM) to bolster coastal environments. The United States Army Corps of Engineers (USACE) is currently seeking to beneficially use 70% of dredged material by 2030, equating to 100 to 160 million m3within the continental United States annually. Despite the benefits that BUDM offers for both navigation and flood-protection missions, significant knowledge gaps exist on the constructability of wetland nourishments and long-term resiliency of the environment. Coastal managers are faced with a number of construction challenges for BUDM such as: (1) significant uncertainties in dredged sediment characteristics (e.g., slurry density, fines and organic matter concentrations) (Harris et al., 2024; Harris and Shawler, 2025); (2) the placement areas commonly being comprised of easily disturbed, highly heterogeneous deltaic soils (Jafari et al., 2018, 2019a, b); (3) dredged material delivery methods and positions (Harris and Shawler, 2025); and (4) containment efficacy (Singh and Joffrion, 2017). Following dredged material placement, wetland surface elevations and biogeochemistry can be drastically altered due to the compression of highly organic sediment that can lead to a temporal loss in elevation (VanZomeren and Piercy, 2020; Harris et al., 2024), while silt and clay-dominated dredged material, particularly acid sulfate soils, may hinder revegetation due to oxidation of iron sulfides (Berkowitz and VanZomeren, 2020; Puchkoff and Lawrence, 2022; Raposa et al., 2022), all resulting in uncertainty in vegetation response relative to natural reference sites (Raposa et al., 2023) or target restoration goals. These uncertainties can be problematic to the long-term stability of the environment and thus the ability to provide desired ecosystem services.
To address these knowledge gaps, a multi-phase wetland BUDM nourishment project was investigated through a combination of in-situ, laboratory, and geo-spatial methods pre- and post-placement. Sediment testing and subsurface investigations were performed to develop consolidation models and predict future wetland surface elevations, which were compared to field data, while orthomosaics were used to monitor vegetation cover change across the site. Lastly, these validated consolidation models were combined with the Coastal Wetland Evolution Model (CWEM) to assess future site resiliency to sea level rise. This study investigates the following four questions: (1) what is the surface elevation gained from dredged material applied on a well-drained marsh island, (2) what is the magnitude of dredged sediment and wetland foundation consolidation, (3) how rapidly did vegetation re-establish, and (4) what are the potential long-term responses of the nourished system to rising sea levels?
The study site is a 5.4-hectare island located on the bay side of Avalon, New Jersey, USA within a 17-km2 tidal marsh complex and is adjacent to the New Jersey Intracoastal Waterway (NJIWW), Figure 1 (Harris et al., 2020b). Tides in this back-bay environment are semi-diurnal with a normal tidal range of approximately 1.3-m (NOAA, 2024). Sturgeon Island is located nearly 7 kilometers from Townsend Inlet to the north and nearly 8 kilometers from Hereford Inlet to the south, likely indicating minimal inlet-derived sediment reaches the site. The back barrier marsh and channels adjacent to Sturgeon Island experience small waves typically less than <0.25 m, slow currents (~0.1 m/s), and low suspended sediment concentrations (~10-23 mg/L), indicating minimal natural mineral sediment contributions to the island (Fall et al., 2021; Coleman et al., 2022). The island, prior to the BUDM nourishments, ranged in elevation from 0.5-m to 1.3-m NAVD88, with the highest elevations found at the center of the island. The northern half of the island drains to a tidal creek on the eastern side of the island. The island is primarily vegetated by the cordgrass Spartina alterniflora and the invasive common reed Phragmites australis, with tall-form S. alterniflora found between 0.2-m and 0.6-m elevations, short-form S. alterniflora between 0.5 m and 0.7 m, and Phragmites found at elevations >0.9-m NAVD88. The woody shrub Iva frutescens can also be found interspersed from 0.5-m to 0.9-m NAVD88. Sturgeon Island has historically hosted high nesting concentrations of wading birds and is an important nesting site in the state of New Jersey. At least four species of wading birds currently nest there, and the majority of these species are identified as Species of Greatest Conservation Need by New Jersey’s State Wildlife Action Plan (NJDEP, 2018).
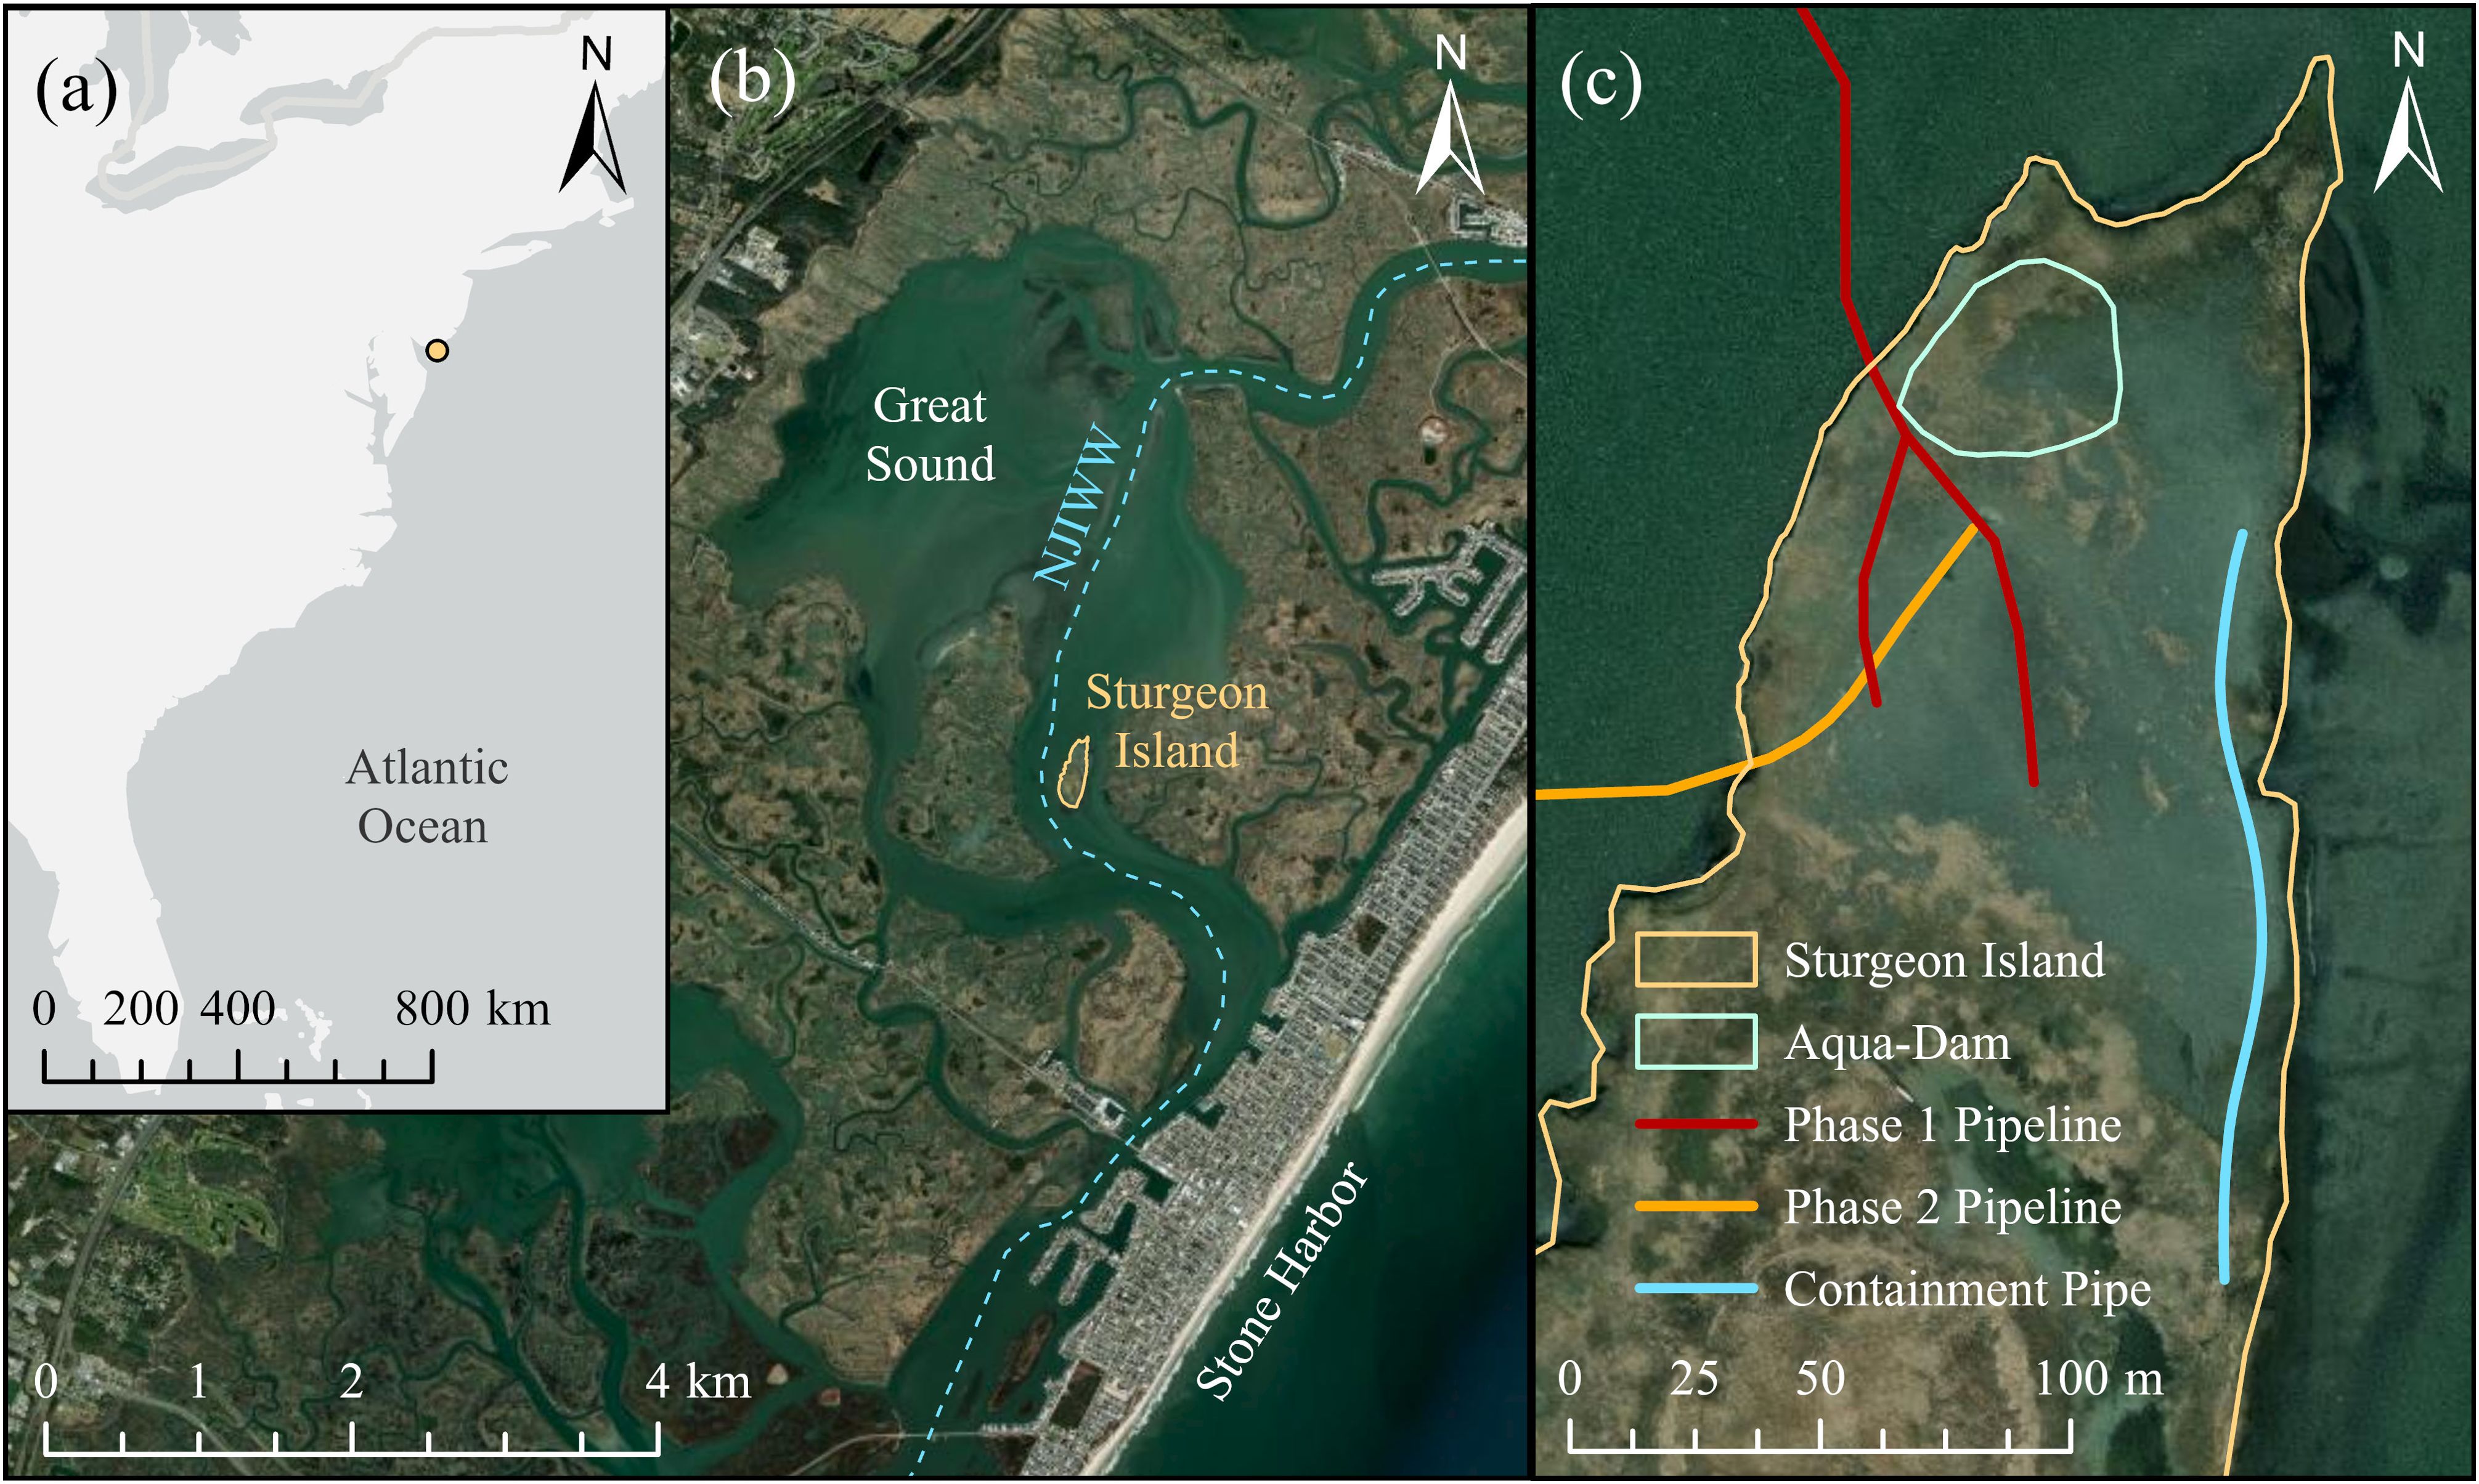
Figure 1. (A) Location of Sturgeon Island, New Jersey, USA, (B) in relation to the New Jersey Intracoastal Waterway (NJIWW), and (C) dredge pipeline and containment layout.
The goal of this BUDM nourishment was to enhance the surface elevation on Sturgeon Island to support nesting bird habitat and stabilize the low-lying northern portion of the island. Dredged material was placed over three phases. Phase 1 utilized the 1,300 horsepower (hp) cutterhead dredge, Fullerton (Barnegat Bay Dredging Co.) with a 0.36-m. (14in.) discharge pipeline (Welp et al., 2024; Perkey et al., 2024a; Harris et al., 2024). Material was dredged from the NJIWW from March 16 to 19, 2020 with the discharge pipe positioned on the northern end of the island and equipped with a wye-valve that directed material across two outfall areas using 0.31-m. (12-in.) pipes. During Phase 2, dredged material was placed directly on the island using the 400-hp cutterhead dredge, Montgomery (Barnegat Bay Dredging Co.), with a 0.31-m. (12in.) discharge pipeline from September 9 to 26, 2020. The discharge pipeline was positioned directly on the wetland surface along the northern end of Sturgeon Island. Lastly, Phase 3 utilized the Fullerton (Barnegat Bay Dredging Co.) to place dredged material on the northwestern portion of the island from September 27 to October 31, 2022, that was contained using hydro-dams to construct a berm feature. However, for this study, this latest nourishment was not considered since it was two years after the initial placements, contained, and impacted only a small portion of the larger nourishment area.
To determine dredged material characteristics, 1-m long soil cores were collected within the NJIWW in March 2020, prior to the start of dredging, using a 0.15-m inner diameter corer. Sediment was extruded from the core, placed in buckets, and shipped back to a laboratory to be processed for gravimetric moisture content [w(%)], organic content via loss on ignition (LOI) [ASTM D2974-20e1 (ASTM International, 2020)], grain size distribution (GSD), and Atterberg Limits. A column settling test was conducted with NJIWW material to predict settling behavior during initial placement and dewatering (Thackston et al., 1988) and a combination of self-weight consolidation testing and standard oedometer consolidation testing was used to determine consolidation magnitudes under its own weight (Cargill, 1986). Results from the self-weight consolidation test provided the void ratio (e), effective vertical stress (σ’v), and hydraulic conductivity (kv) relationships for use in the long-term consolidation modeling of the dredged material.
To determine wetland foundation characteristics (i.e., placement area), soil samples were collected in March 2020, prior to the start of dredging, with 7.62-cm diameter PVC cores and processed for w(%), LOI, and GSD. Sixty (60) cone penetrometer tests (CPTs) were performed across the northern portion of Sturgeon Island to determine site stratigraphy, and the data was processed using a Matlab script to correct the soundings and smooth the data without a distortion of the signal tendency (Savitzky and Golay, 1964; Harris et al., 2021; Cadigan et al., 2022). The CPT equipment was specifically developed for manual use in ultra-soft deltaic and estuarine soils and is capable of providing a consistent shear strength profile to determine subsurface micro-stratigraphy, root-depths, and the presence of shells (Jafari et al., 2019a; Harris et al., 2021). An in-depth description of the CPT methodology and data interpolation is provided in Jafari et al. (2019a). Soil cores were collected to perform standard oedometer consolidation tests (ASTM D2435) to determine the void ratio (e), effective stress (σ’v), and hydraulic conductivity (kv) relationships. However, due to laboratory access restrictions during Coronavirus-19, no consolidation tests were performed on cores collected on Sturgeon Island. To supplement this, two wetland foundation consolidation tests from a previous wetland BUDM site ~400 meters northeast of the site were utilized. This was not an ideal solution, but both sites were within the same tidal marsh network and within the same vegetation type and range of elevation.
In July 2021, following Phases 1 and 2, a Russian peat corer was used to collect disturbed soil samples and record the thickness of dredged material based on visually distinct horizons between the deposited material and in-situ wetland foundation. A total of 33 samples were collected and analyzed for w(%), LOI, and GSD. Surface elevation at each sample location was determined via RTK-GPS and a current elevation of underlying wetland foundation could be inferred by subtracting dredged material thicknesses. This inferred surface is relatively coarse when compared to surface elevations, but it resolved approximate magnitudes of foundation settlement across the nourishment area.
Airborne LiDAR (Laser imaging, Detection, And Ranging) for Sturgeon Island was collected by the Joint Airborne LiDAR Bathymetry Technical Center of Expertise (JALBTCX) in July 2020 as part of the 2020 USACE USGS Topobathy LiDAR: Cape May & Atlantic City, NJ collection. Data was collected using the Coastal Zone Mapping and Imaging LiDAR (CZMIL) system in support of the United States Geologic Survey (USGS) to assess elevation changes along the NJ coast. The final product used for analysis was a 1-m resolution digital elevation model (DEM) based on classified point data compiled to meet a 1-m horizontal accuracy at the 95% confidence level and a 0.20-m vertical accuracy at the 95% confidence level for topographic data.
Uncrewed Aircraft System (UAS) LiDAR for Sturgeon Island was collected by the University of Washington NSF Natural Hazards Engineering Research Infrastructure (NHERI) Reconnaissance Experimental Facility (RAPID) in July 2021. Data was collected using the Phoenix LiDAR Systems miniRanger with 15 mm vertical accuracy. Flight processing was performed using Inertial Explorer and horizonal accuracy tested and corrected against USACE GNSS ground data. Point cloud processing and classification was performed using Phoenix Lab’s Spatial Explorer software. The final product was a 0.3 m resolution bare-earth digital elevation model (DEM) for Sturgeon Island. Table 1 provides a summary of survey types, dates, and specific equipment used within this study.
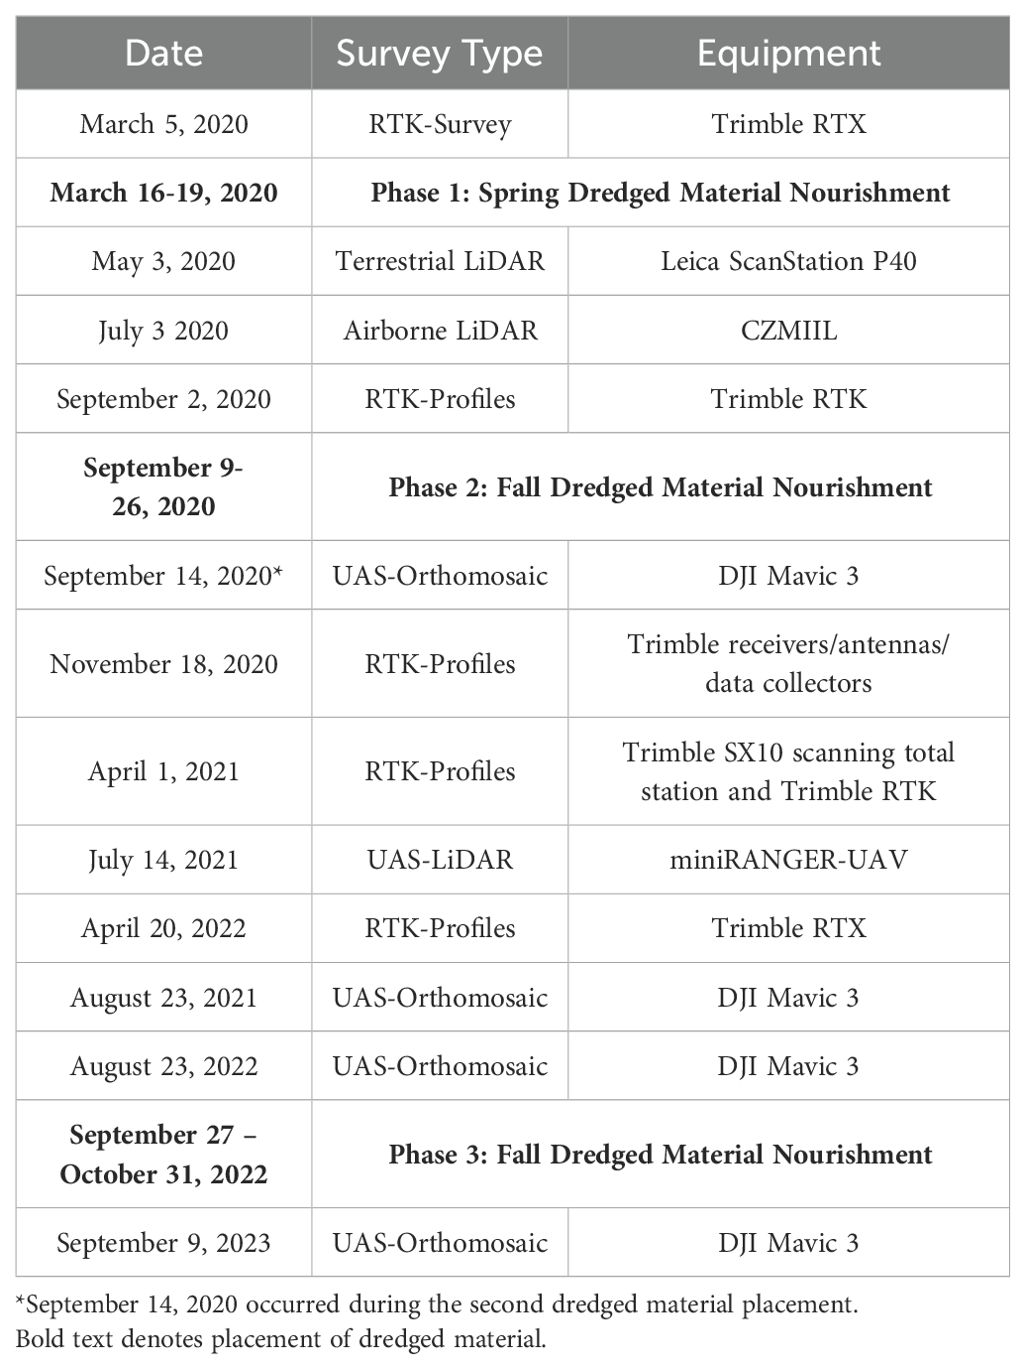
Table 1. Timeline of survey types and equipment on Sturgeon Island, NJ utilized in this study and dredged material placement windows.
Imagery was acquired annually in late summer over four years using a DJI Mavic 3 RTK-enabled drone equipped with a 5-band multispectral sensor. Exact dates are shown in Table 1. All flights were flown at 61-m elevation with an 80% sidelap and 80% frontlap, resulting in a ground sample distance of approximately 1.4-cm. Automated flight pathing was used for all image collections. Flight times were coincident with solar noon, low cloud cover, and low tides. Prior to the flights, differentially corrected ground control points (GCP) were measured with an RTK GNSS receiver (Emlid RS2+) to increase the spatial accuracy of the resultant multispectral imagery. Photo stitching of the imagery was processed using Pix4Dmapper. Post-calibration of multispectral data was performed using a calibrated reference panel before and after the flight. Additionally, downwelling light sensor (DLS) data was used to improve reflectance calibrations during changing light conditions mid-flight.
Subsequent multispectral orthomosaics were classified into 5-class land cover sets in ArcGIS Pro through a pixel-based supervised classification process using Support Vector Machine (SVM) algorithms. Accuracy for all classification types exceeded 85%. SVM-based pixel classifiers have been shown to better discriminate salt marsh plant species than other machine learning algorithms such as Random Forest or Maximum Likelihood (Norris et al., 2024). Classification accuracy was improved by incorporating elevation and Normalized Difference Red Edge (NDRE) bands into 5-band multispectral composites. The additional bands greatly improved the differentiation of species with similar spectral characteristics, like the two different forms of salt marsh cord grass. Comparative changes across the multiyear land cover data were calculated using a customized Zonal Statistics methodology developed in Modelbuilder.
To predict consolidation within the dredged sediment and underlying foundation material (i.e., native marsh), two coupled models were performed to determine (1) self-weight consolidation of the dredged sediment and (2) consolidation of the in-situ wetland due to the applied load of the dredged material. The dredged material was modeled using USACE’s Primary Consolidation Secondary Compression and Desiccation of Dredged Fill (PSDDF) model that is based on finite strain theory because large strains are expected within the dredged fill (Terzaghi et al., 1996; Stark et al., 2005; Jafari et al., 2019c). The dredged material was bounded to the top by atmospheric conditions and an assumed impermeable lower boundary to simulate the underlying wetland material which was predominately clay. The wetland foundation layer consisted of a vegetated root mat and underlying clay layer and was modeled using Terzaghi’s 1-D consolidation theory, which uses small strain theory because the magnitude of settlement is expected to be negligible compared to the original foundation thickness (Terzaghi et al., 1996). The wetland foundation layer was assumed to be single-drained (i.e., drainage in one direction) and was bounded by an underlying sand layer that was assumed to be incompressible and freely draining.
Four specific sites were chosen for consolidation modeling. These sites were selected to cover a range of initial elevations (0.21-m to 0.67-m, NAVD88); depth to sand (1.19-m to 1.65-m), and approximate dredged material thicknesses for both nourishments (low: 0.15-m at Site A; high:0.52-m at Site D). Dredged material thicknesses are approximate values as site access was restricted immediately after dredging concluded. Table 2 provides a summary of values for each site. A range of dredged material and foundation surface elevations was modeled to hindcast a highly compressible, quickly draining scenario and less compressible, slowly draining scenario to encompass the uncertainty in laboratory results. Due to limited field data for the foundation layer, only the compression index (Cc) was varied and not the permeability. Permeability values for the dredged material layer ranged by an order or magnitude in both ways to account for uncertainties in laboratory derived measurements (Tavenas et al., 1983a; Jafari et al., 2019c). The Cc ranged from a less compressible Cc = 0.25, determined from standard oedometer results to a more compressible Cc = 2.10, determined from moisture content relationships (Cc = w(%)/100; Mesri and Ajlouni, 2007) collected on Sturgeon Island prior to dredged material placement. The consolidation models were calibrated through an iterative process of matching overall dredged material elevations, which includes consolidation of the dredged material and underlying foundation, to the field survey points and the July 2021 soil core data which provided the elevation of the foundation, allowing for the calibration of the foundation layer.
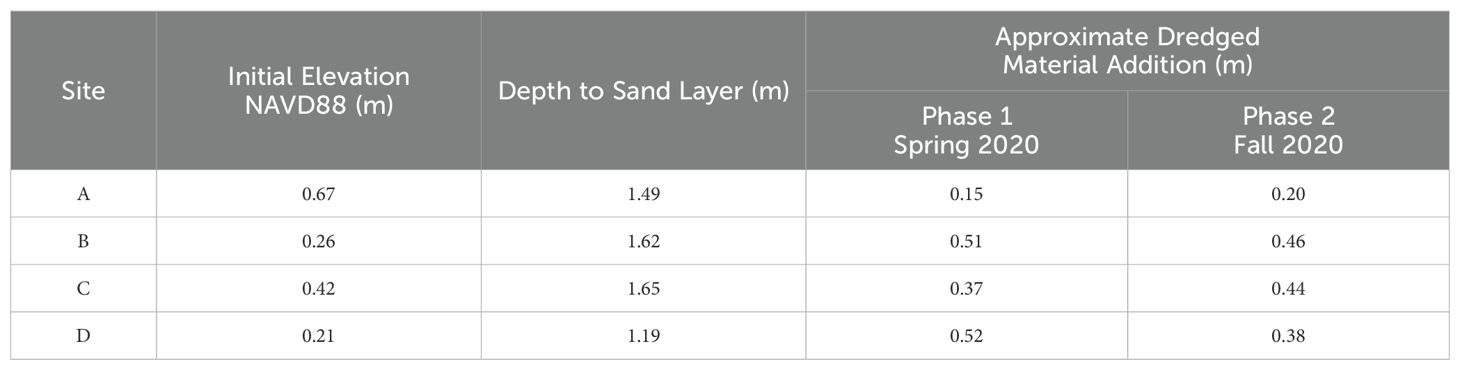
Table 2. Summary of initial elevation, depth to sand layer, and thickness of dredged material additions for phases 1 and 2 for the modeled Sturgeon Island sites.
The Coastal Wetland Equilibrium Model (CWEM), formerly known as the Marsh Equilibrium Model (MEM), was used to predict future marsh function (Morris et al., 2002, 2021). Marsh equilibrium theory states that a dynamic equilibrium exists between marsh platform elevation and sea level, and that marshes are continuously moving in the direction of that equilibrium (Alizad et al., 2016). MEM uses a polynomial formulation for salt marsh productivity and accounts for inputs of suspended sediments and implicitly for the in-situ input of organic matter to the accreting salt marsh platform (Alizad et al., 2016). CWEM combines organic (i.e., marsh elevation vegetation thresholds, peak aboveground biomass, belowground turnover rate, root depth) and inorganic (i.e., water levels, sea level rise rates, suspended sediment concentrations, marsh elevation) inputs to model marsh accretion at given elevations throughout time (Morris et al., 2012; Schile et al., 2014 Alizad et al., 2016). Based on long-term measurements of sediment accretion and marsh productivity, Morris et al. (2002) developed CWEM (then MEM) and calibrated the program at a Spartina alterniflora dominated marsh at North Inlet, SC (Schile et al., 2014). The model assumes that plant productivity is constrained by upper and lower elevation limits and there is an optimum elevation for growth within the tidal frame (Morris et al., 2002; Schile et al., 2014). Ultimately, CWEM was used to determine future standing biomass, inundation intervals, and elevations with time.
Site C was selected to be used within CWEM as dredged material and compressible foundation thicknesses were close to an average among the four sites modeled for consolidation. An initial SLR rate of 0.4 cm/yr was selected (NOAA, 2024) and to account for variations in SLR projections, low, moderate, and high values were used, corresponding to 0.8 cm/yr, 1.0 cm/yr, and 1.2 cm/yr, respectively (Kopp et al., 2019). Table 3 provides a summary of physical and biological inputs used and their respective references for the pre-BUDM placement at Site C and moderate SLR scenario.
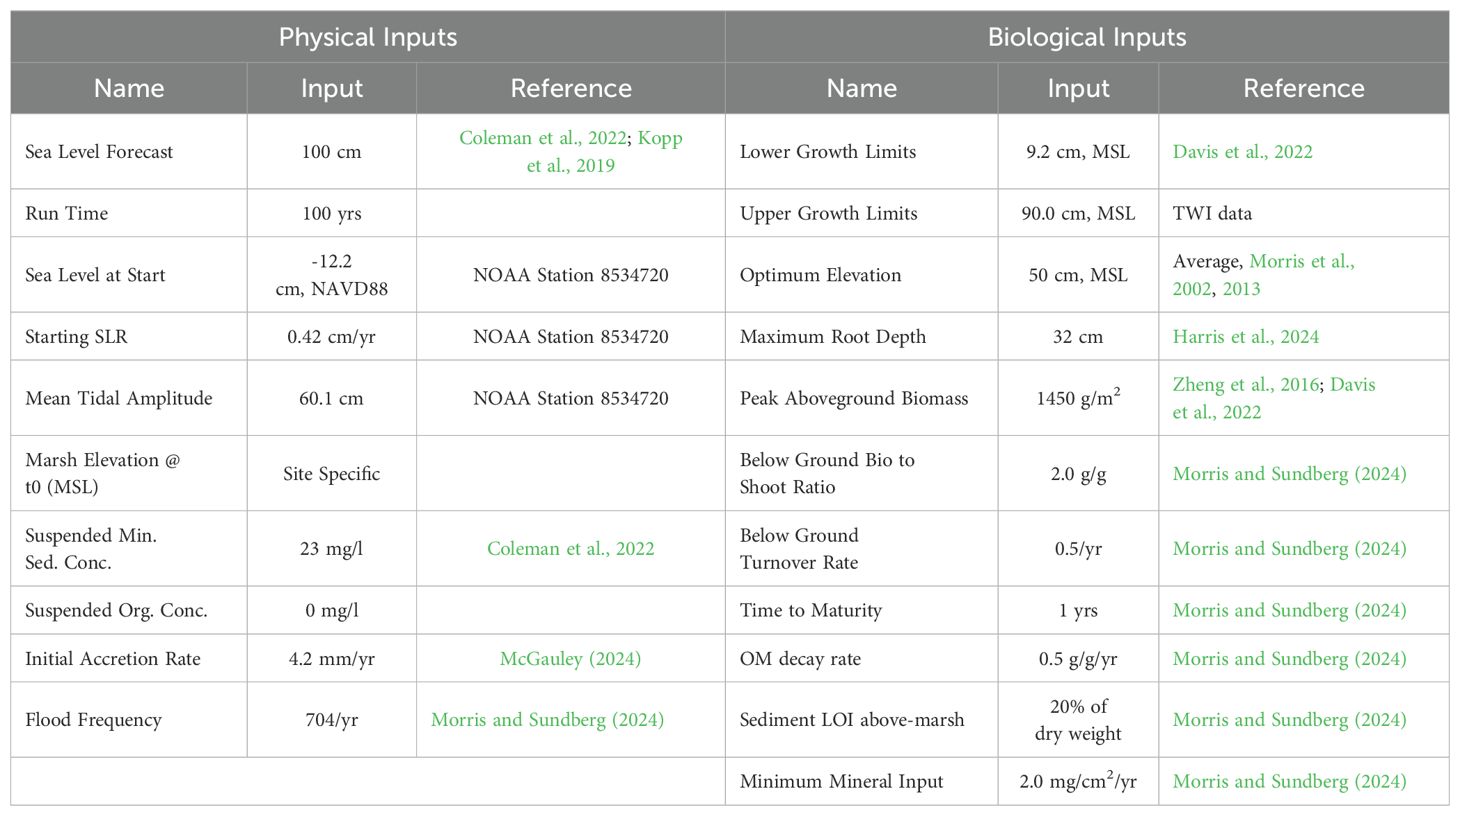
Table 3. Coastal Wetland Equilibrium Model inputs for Site C prior to dredged material placement for a moderate sea level rise scenario.
The general subsurface stratigraphy across the site was a coarse sandy foundation (CPT refusal), overlain by a compressible fine-grained layer, and a vegetated root layer of variable thickness (Figure 2) (Harris, 2020; Harris et al., 2024). Figure 2 shows the depth to sand layer, interpolated from CPT soundings, alongside three example CPT shear strength profiles moving from the center of the island northward. The uppermost vegetated mat layer was signified by a bulb-shaped shear strength that peaked at 174-kPa at CPT-A and extended to a depth of 32-cm. This layer was underlain by a weaker homogenous compressible clay layer that extended to a depth of 43-cm (i.e., 11-cm thick). Beneath this clay layer was a sandy foundation, which significantly increased in shear strength (reaching >100 kpa) causing refusal of the CPT. Approximately 35-m north at CPT B, the vegetated mat extended to 31-cm, similar to the previous site, but the clay layer was 79-cm thick (down to 110-cm below ground surface). Further north, (100-m from CPT A), there was a 35-cm thick vegetated layer, underlain by a 102-cm thick layer (down to 137-cm below ground surface), below which was the sand foundation.
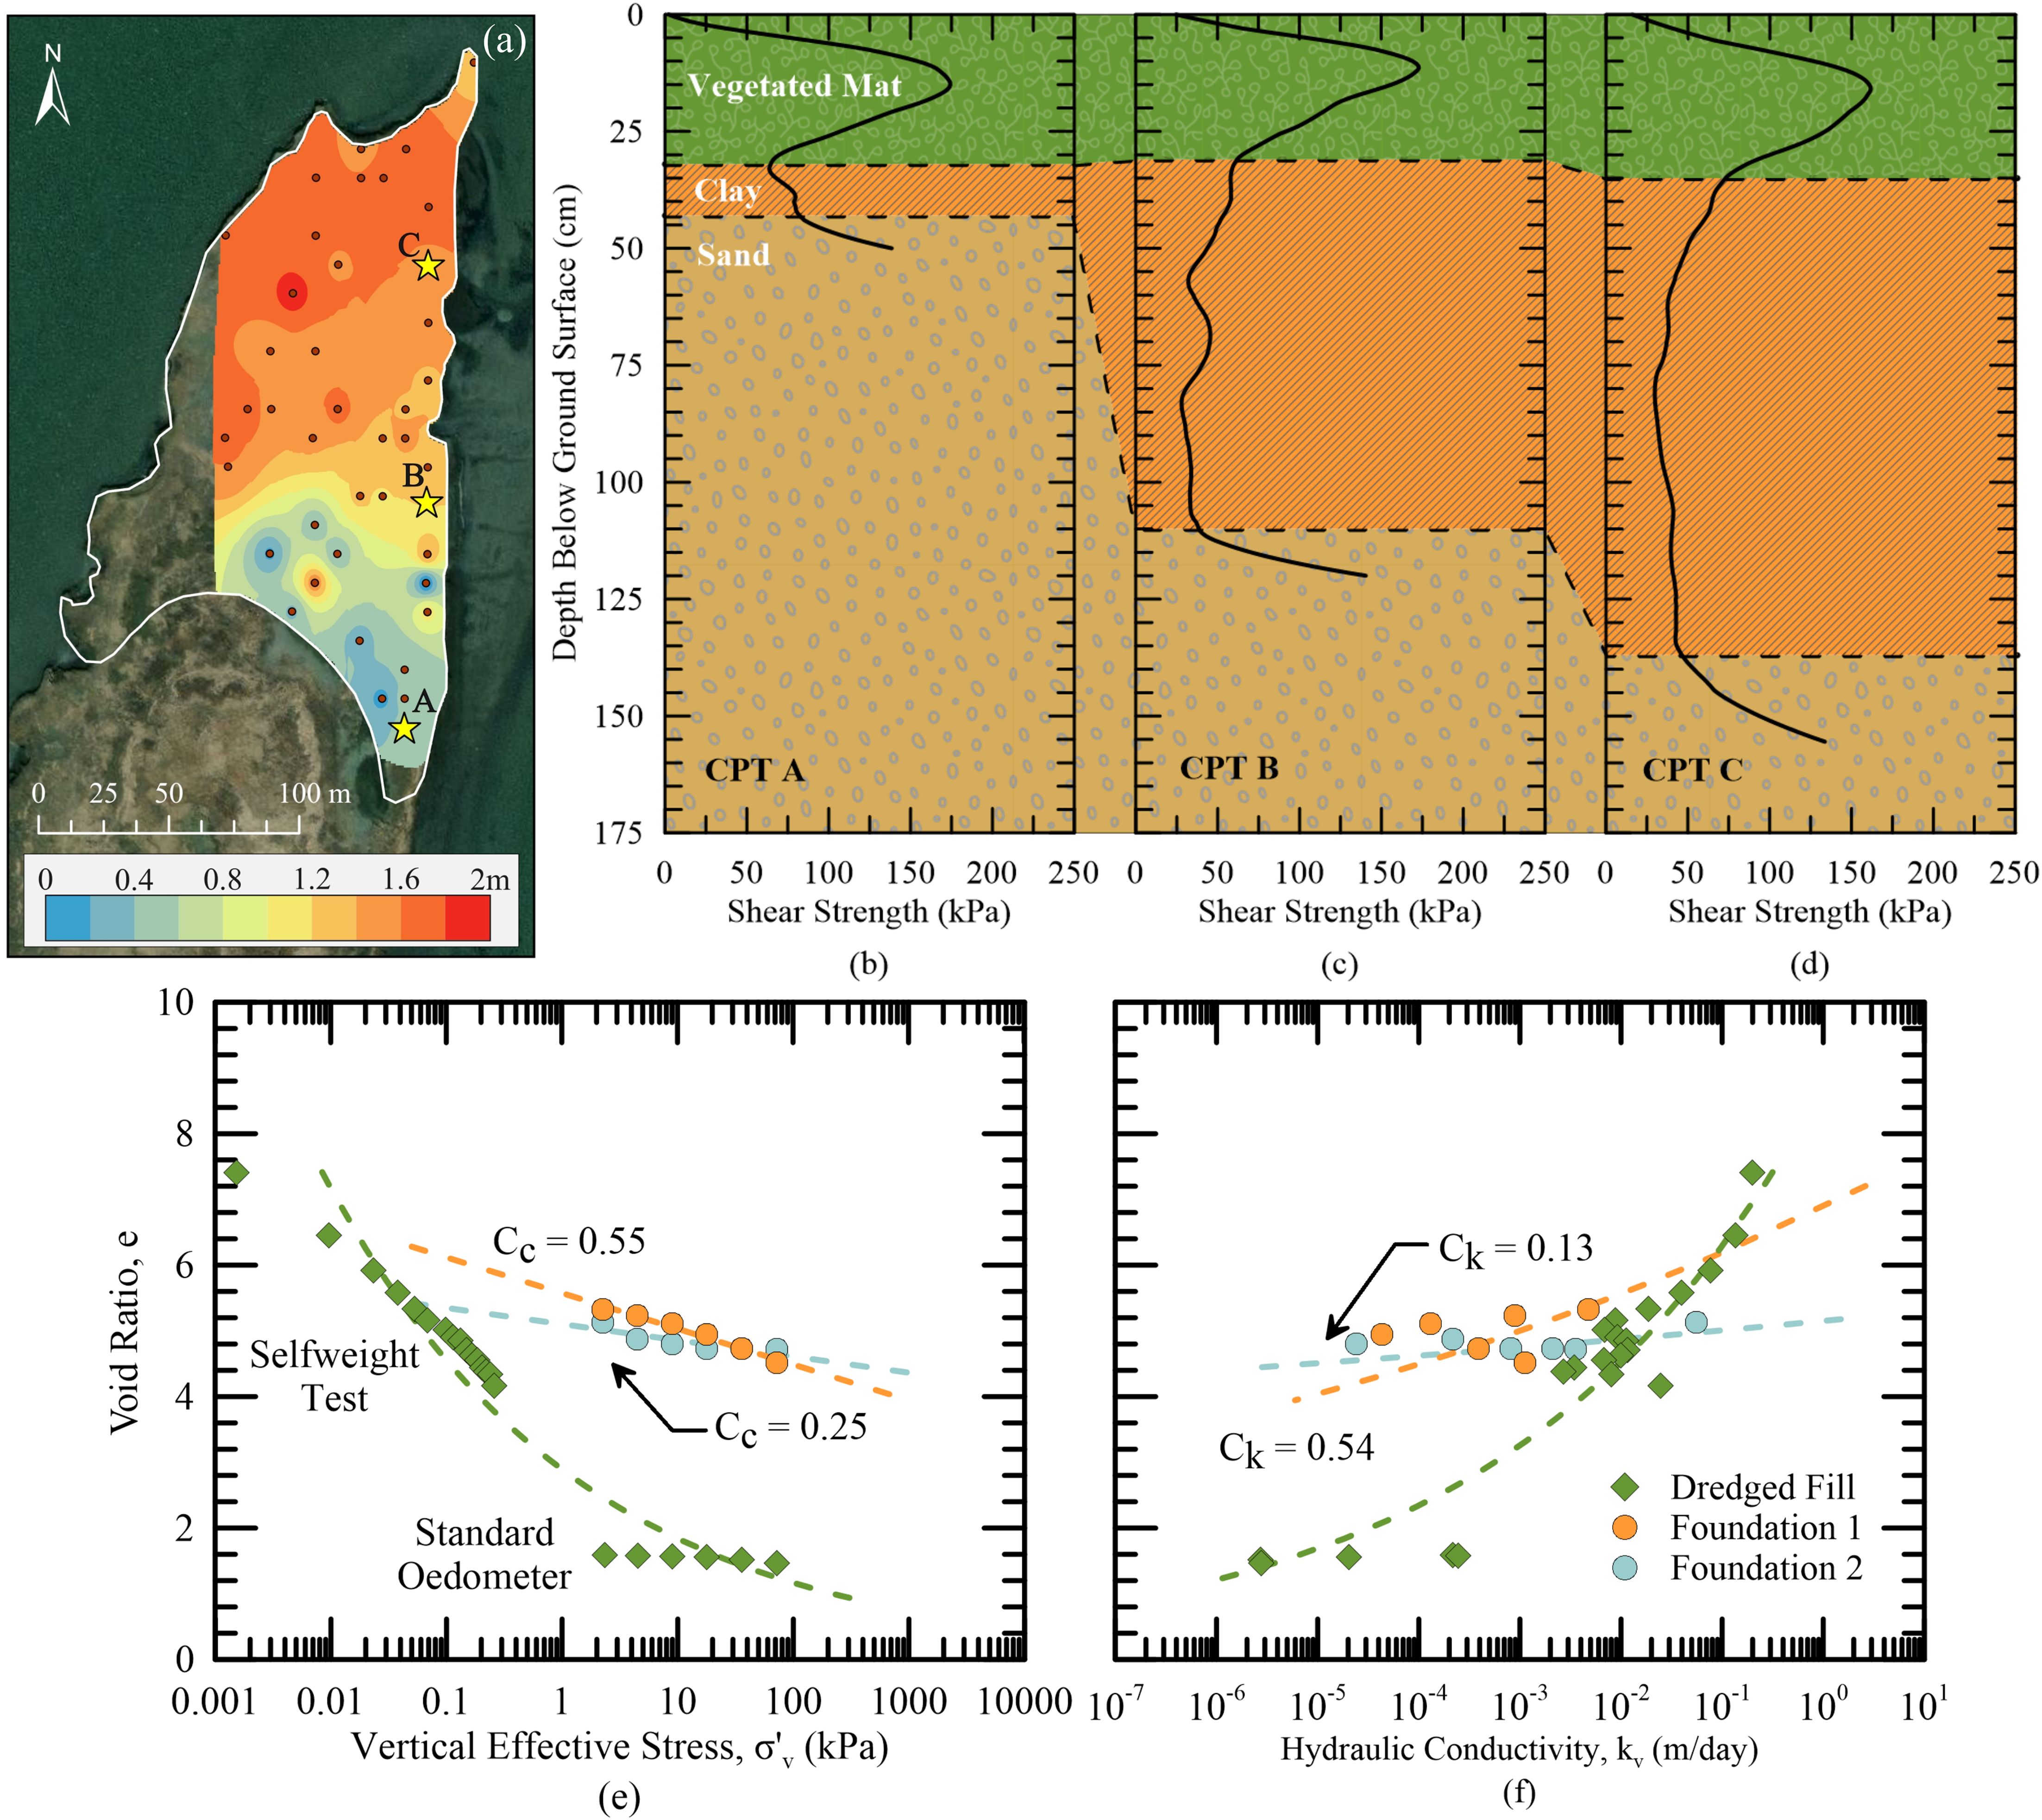
Figure 2. Site Geotechnics. (A) Location of CPTs (black dots) and interpolated depth to underlying sand foundation across the placement site. (B–D) Example shear strength profiles and interpreted stratigraphy moving northward from the center of the island. Profile letters correspond to stars on the map. (E) Void ratio-vertical effective stress and (F) void ratio-hydraulic conductivity relationships for dredged fill and foundation materials. Point data was derived from laboratory testing and dashed lines represent interpolated laboratory data.
The e – σ’v relationship, shown in Figure 2E, controls the magnitude of consolidation. The slope of the linear portion of the relationship is the compression index (Cc). However, a unique Cc cannot be computed for the dredged material sample because the e – σ’v relationship is highly nonlinear over several magnitudes of σ’v, where higher values of Cc lie in the lower σ’v range that decrease continuously with increasing σ’v (Terzaghi et al., 1996). The Cc is influenced by soil composition and structure, and a higher Cc indicates a more compressible soil. For example, a peat deposit can produce Cc between 2 to 12 due to large volumes of water being held within the soil void space (Mesri and Ajlouni, 2007). The foundation samples (Foundation 1 and 2) from the previous BUDM wetland site ~400-m northeast of the site produced Cc values of 0.25 and 0.55, which is uncharacteristic for typical fine-grained wetland soils. Moisture contents w(%) determined from soil cores and grab samples across Sturgeon Island prior to the nourishment ranges from 173% to 210%, which equates to Cc values of 1.7 and 2.1 using Mesri and Ajlouni (2007) correlation [Cc = w(%)/100]. Ultimately, the dredged material consolidation data produced higher Cc’s than the foundation soils which was expected due to large volumes of water entrained within the pore space of dredged material during the dredging process which increases void space (i.e., porosity).
The e – kv relationship, shown in Figure 2F, controls the time-rate at which soil consolidates due to the expulsion of excess pore pressure from within the void space of the soil. Permeability is a function of void space, the shape of the voids related to the shape of the grains, specific surface, arrangement of the soil particles, and the tortuosity of the flow path which directly represents the distribution of the voids (Mesri and Rokhsar, 1974; Mesri and Tavenas, 1983). However, this series of variables that control permeability are not easily quantified. The permeability values presented in Figure 2F were not directly measured but inversely calculated from the coefficient of consolidation (cv) and volume compressibility (mv). Previous studies have shown that indirectly evaluated permeabilities can be off by as much as an order of magnitude (Jafari et al., 2018), while others state they should be disqualified due to large errors produced by abusive assumptions in the methods of interpreting the test results on the basis of Terzaghi’s consolidation theory (Tavenas et al., 1983a). As a result, the installation of field instrumentation, such as piezometers and cone penetrometer dissipation tests, to verify the in-situ permeability values is recommended. A linear e – kv relationship is referred to as the permeability change index (Ck) and is an acceptable representation of the behavior of most natural soft clay and organic soils for volumetric strains under 20% (Tavenas et al., 1983b). However, the data produced by the dredged material self-weight consolidation test resulted in strains in excess of 50%, thus a linear relationship is only observed in the standard oedometer data from the foundation samples and a portion of the dredged fill data (Figure 2F).
Pre-nourishment surface elevations, vegetation type, root-mat thickness, and root-mat peak shear strength are shown in Figure 3. Within the area of interest, the elevations are highest along the western side of the island at 0.7 m NAVD88 and gently slope downward to 0.3 m on the eastern side (see Figure 3A). As the site drains from west to east, a tidal creek is located on the eastern edge of the island. Within the nourishment area, there were two dominant types of vegetation pre-nourishment, short- and tall-form S. alterniflora. The short-form is found at the higher elevations along the western part of the island and transitions to tall-form in the lower elevations along the eastern half (Figure 3B). The root-mat was on average ~32-cm thick but was thicker at lower surface elevations adjacent to the tidal creek. This lower elevation, and thus increased inundation frequency, also resulted in lower shear strengths of ~80 kPa as compared to the 180 to 280-kPa of the short-form S. alterniflora.
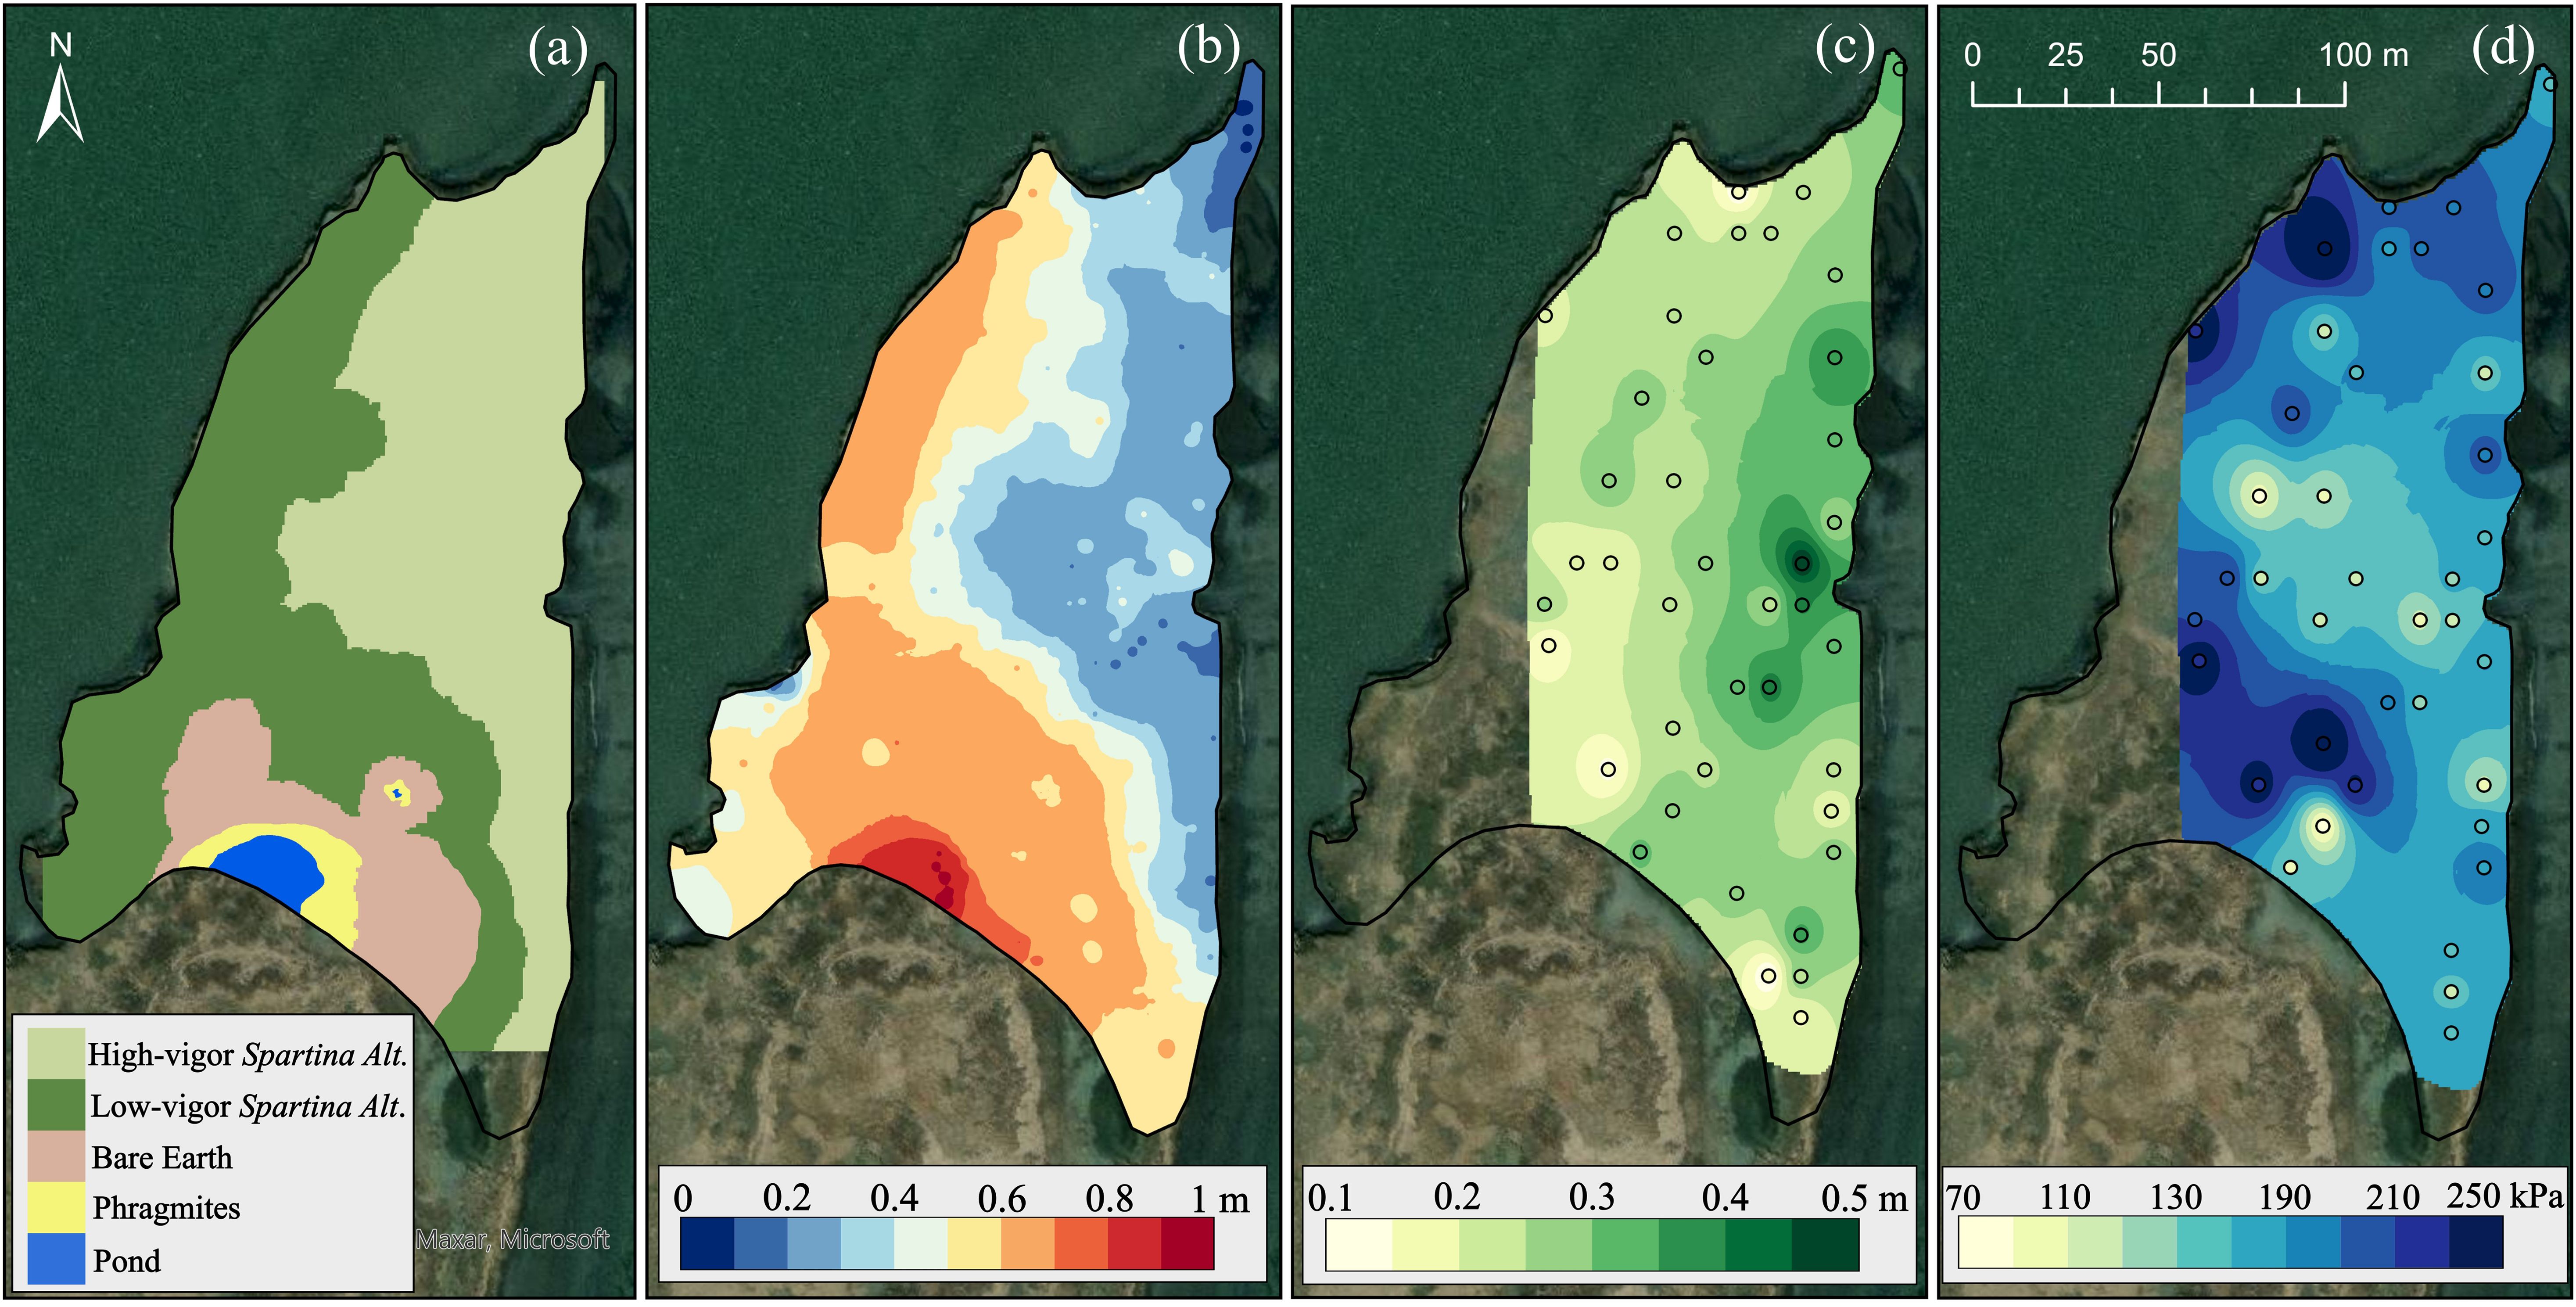
Figure 3. Pre-nourishment (March 2020) (A) Surface landcover description, interpolated surfaces for (B) elevation (NAVD88), (C) vegetated mat thickness, and (D) peak shear strength of the root mat across Sturgeon Island.
Surface elevations along four transects are shown in Figure 4 throughout the study period. March 2020 data (blue in Figures 4B–E) captures the surface elevations prior to BUDM. The March 2020 transects indicate a gradual slope from west to east, with the west end of the island at approximately 0.63-m NAVD88 while the east end of the island was approximately 0.27-m NAVD88. July 2020 data (purple in Figures 4B–E) captures conditions following the Spring 2020 BUDM, which also serve as pre-nourishment elevation conditions for the Fall 2020 BUDM. Average wetland surface elevations increased from 0.41 ± 0.15-m NAVD88 pre-placement to 0.60 ± 0.13-m NAVD88 following the Spring 2020 placement, and a gradual slope from 0.74-m to 0.37-m NAVD88 was still noted on the west and east ends of the transect, respectively. July 2021 data (red in Figures 4B–E) captures surface elevations following the Spring and Fall 2020 BUDM placements and the region between this surface and the March 2020 data is shaded gray to represent the placed dredged material. Average wetland surface elevation for the July 2021 transects was 0.67 ± 0.09-m NAVD88, which highlighted a lower average elevation gain following this placement. The standard deviation is also lower, indicating this second placement filled in lower spots and reduced the average slope (i.e., the wetland surface became flatter). An interpolated foundation surface (i.e., previous wetland surface) derived from sediment cores (orange points Figure 4A; vertical black lines in Figures 4B–E) was compared to the March 2020 initial elevation data to calculate the amount of foundation consolidation due to the induced dredged material loading. Transects 1, 2, and 3 saw an average of 0.09-m of consolidation (0.07-m if Transect 4 included) with values as high as 0.17-m on Transect 2.
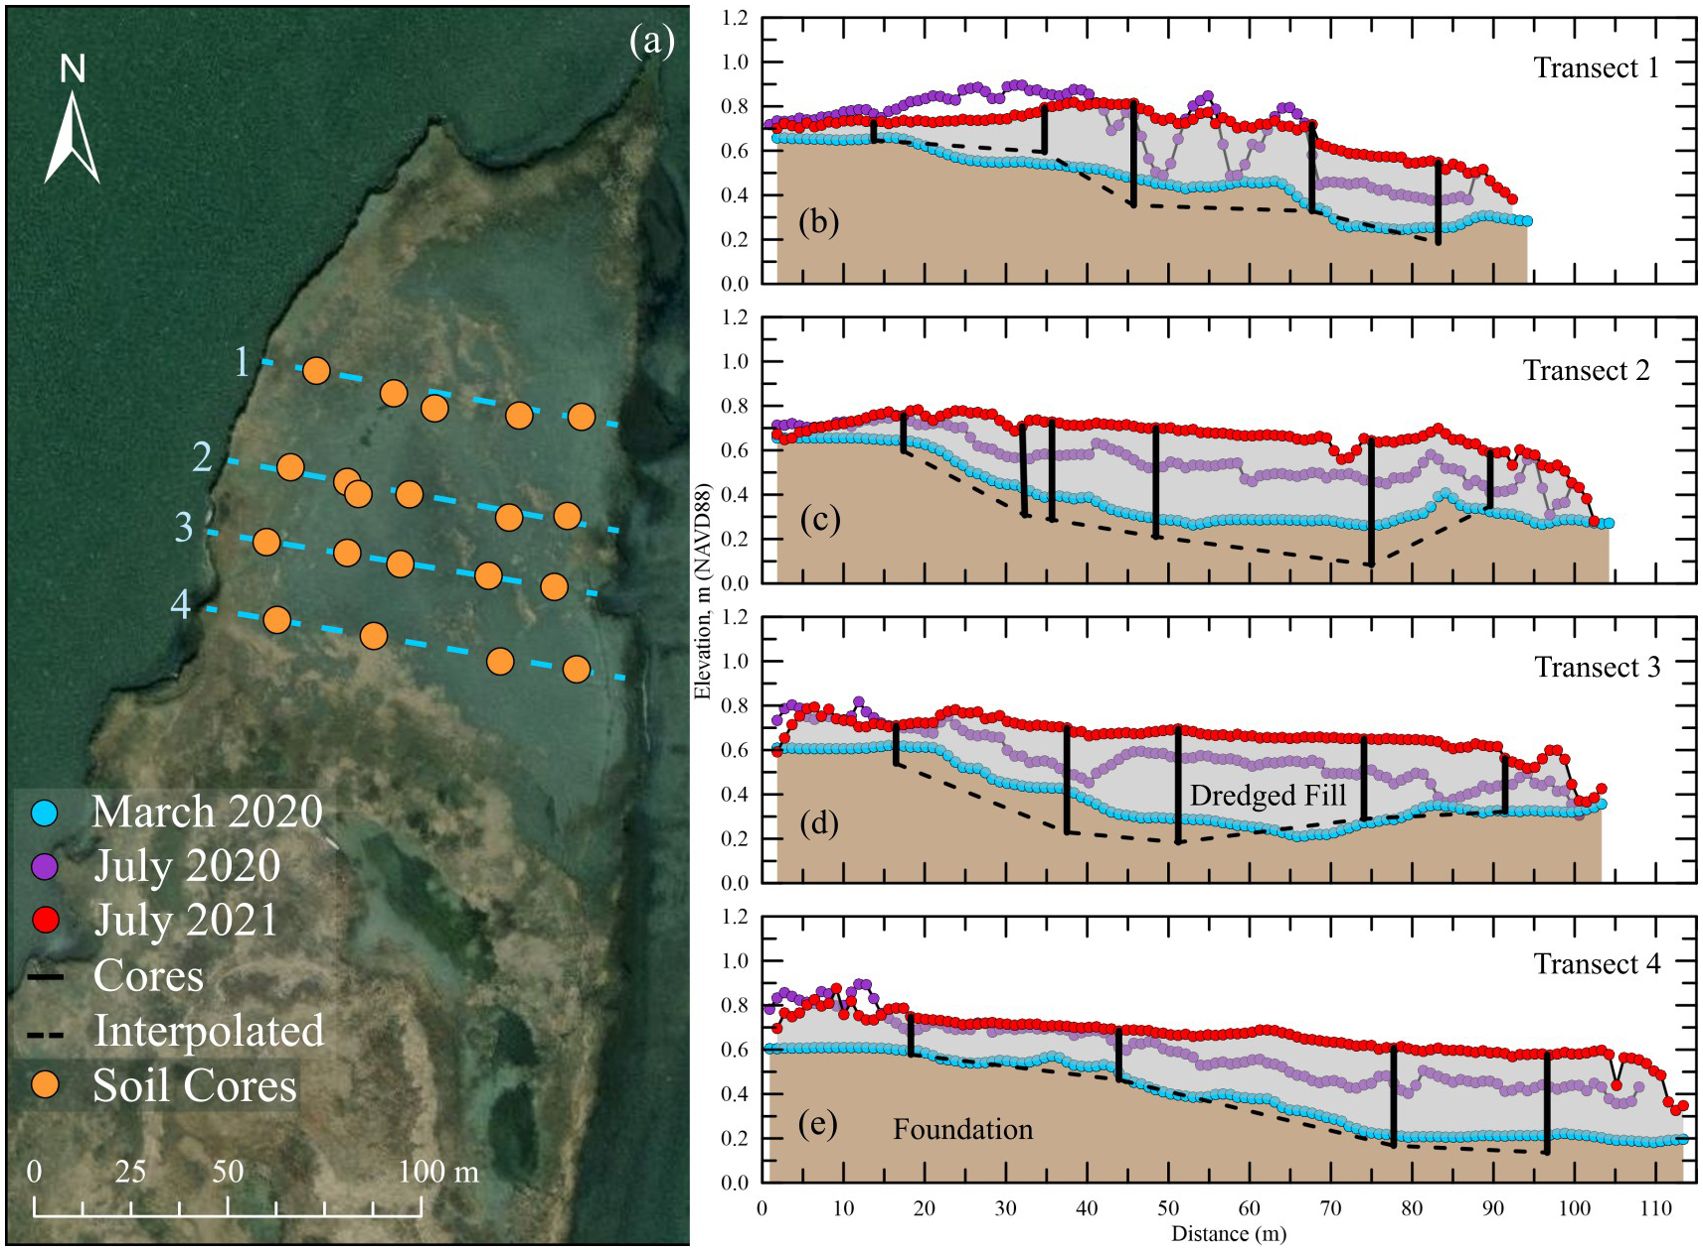
Figure 4. (A) Map of soil core transects, and (B–E) Elevation transects across the placement area from March 2020, July 2020, and July 2021. Solid black lines and dashed black lines indicate the depth of dredged fill at coring locations and the interpolated wetland foundation from cores, respectively. Brown and gray shaded regions represent native wetland foundation and dredged material, respectively.
A summary of orthomosaic surveys and land cover classifications post BUDM are shown in Figure 5. The 2020 data occurred in-between the Spring and Fall nourishments and showed a majority of the nourishment area to be unvegetated. At this point, the majority of the BUDM nourishment area (denoted by the red boundary) was classified as bare earth (65%) while the low marsh portion comprised 34% and occurred at the distal portions of the nourishment area. In 2021, approximately 1 year after the Fall 2020 placement, the bare earth area increased to 77% of the nourishment area while the low marsh portion decreased to under 22% as additional dredged material was deposited the previous September. By 2022, two years post nourishment, the vegetation began to re-establish. The percentage of low marsh area increased to 43% while the bare earth decreased to 56%. In 2023, three years post nourishment, a further increase in low marsh was noticed, which now occupied over half the nourishment area (52%) while the bare earth decreased to 33%. There was a slight increase in open water on the site from 2020 to 2022 (0.1% to ~2%), and a significant increase three years post nourishment to nearly 10% of the nourishment area. Wrack was identified within the nourishment area but never occupied a consistent or significant area (<1%).
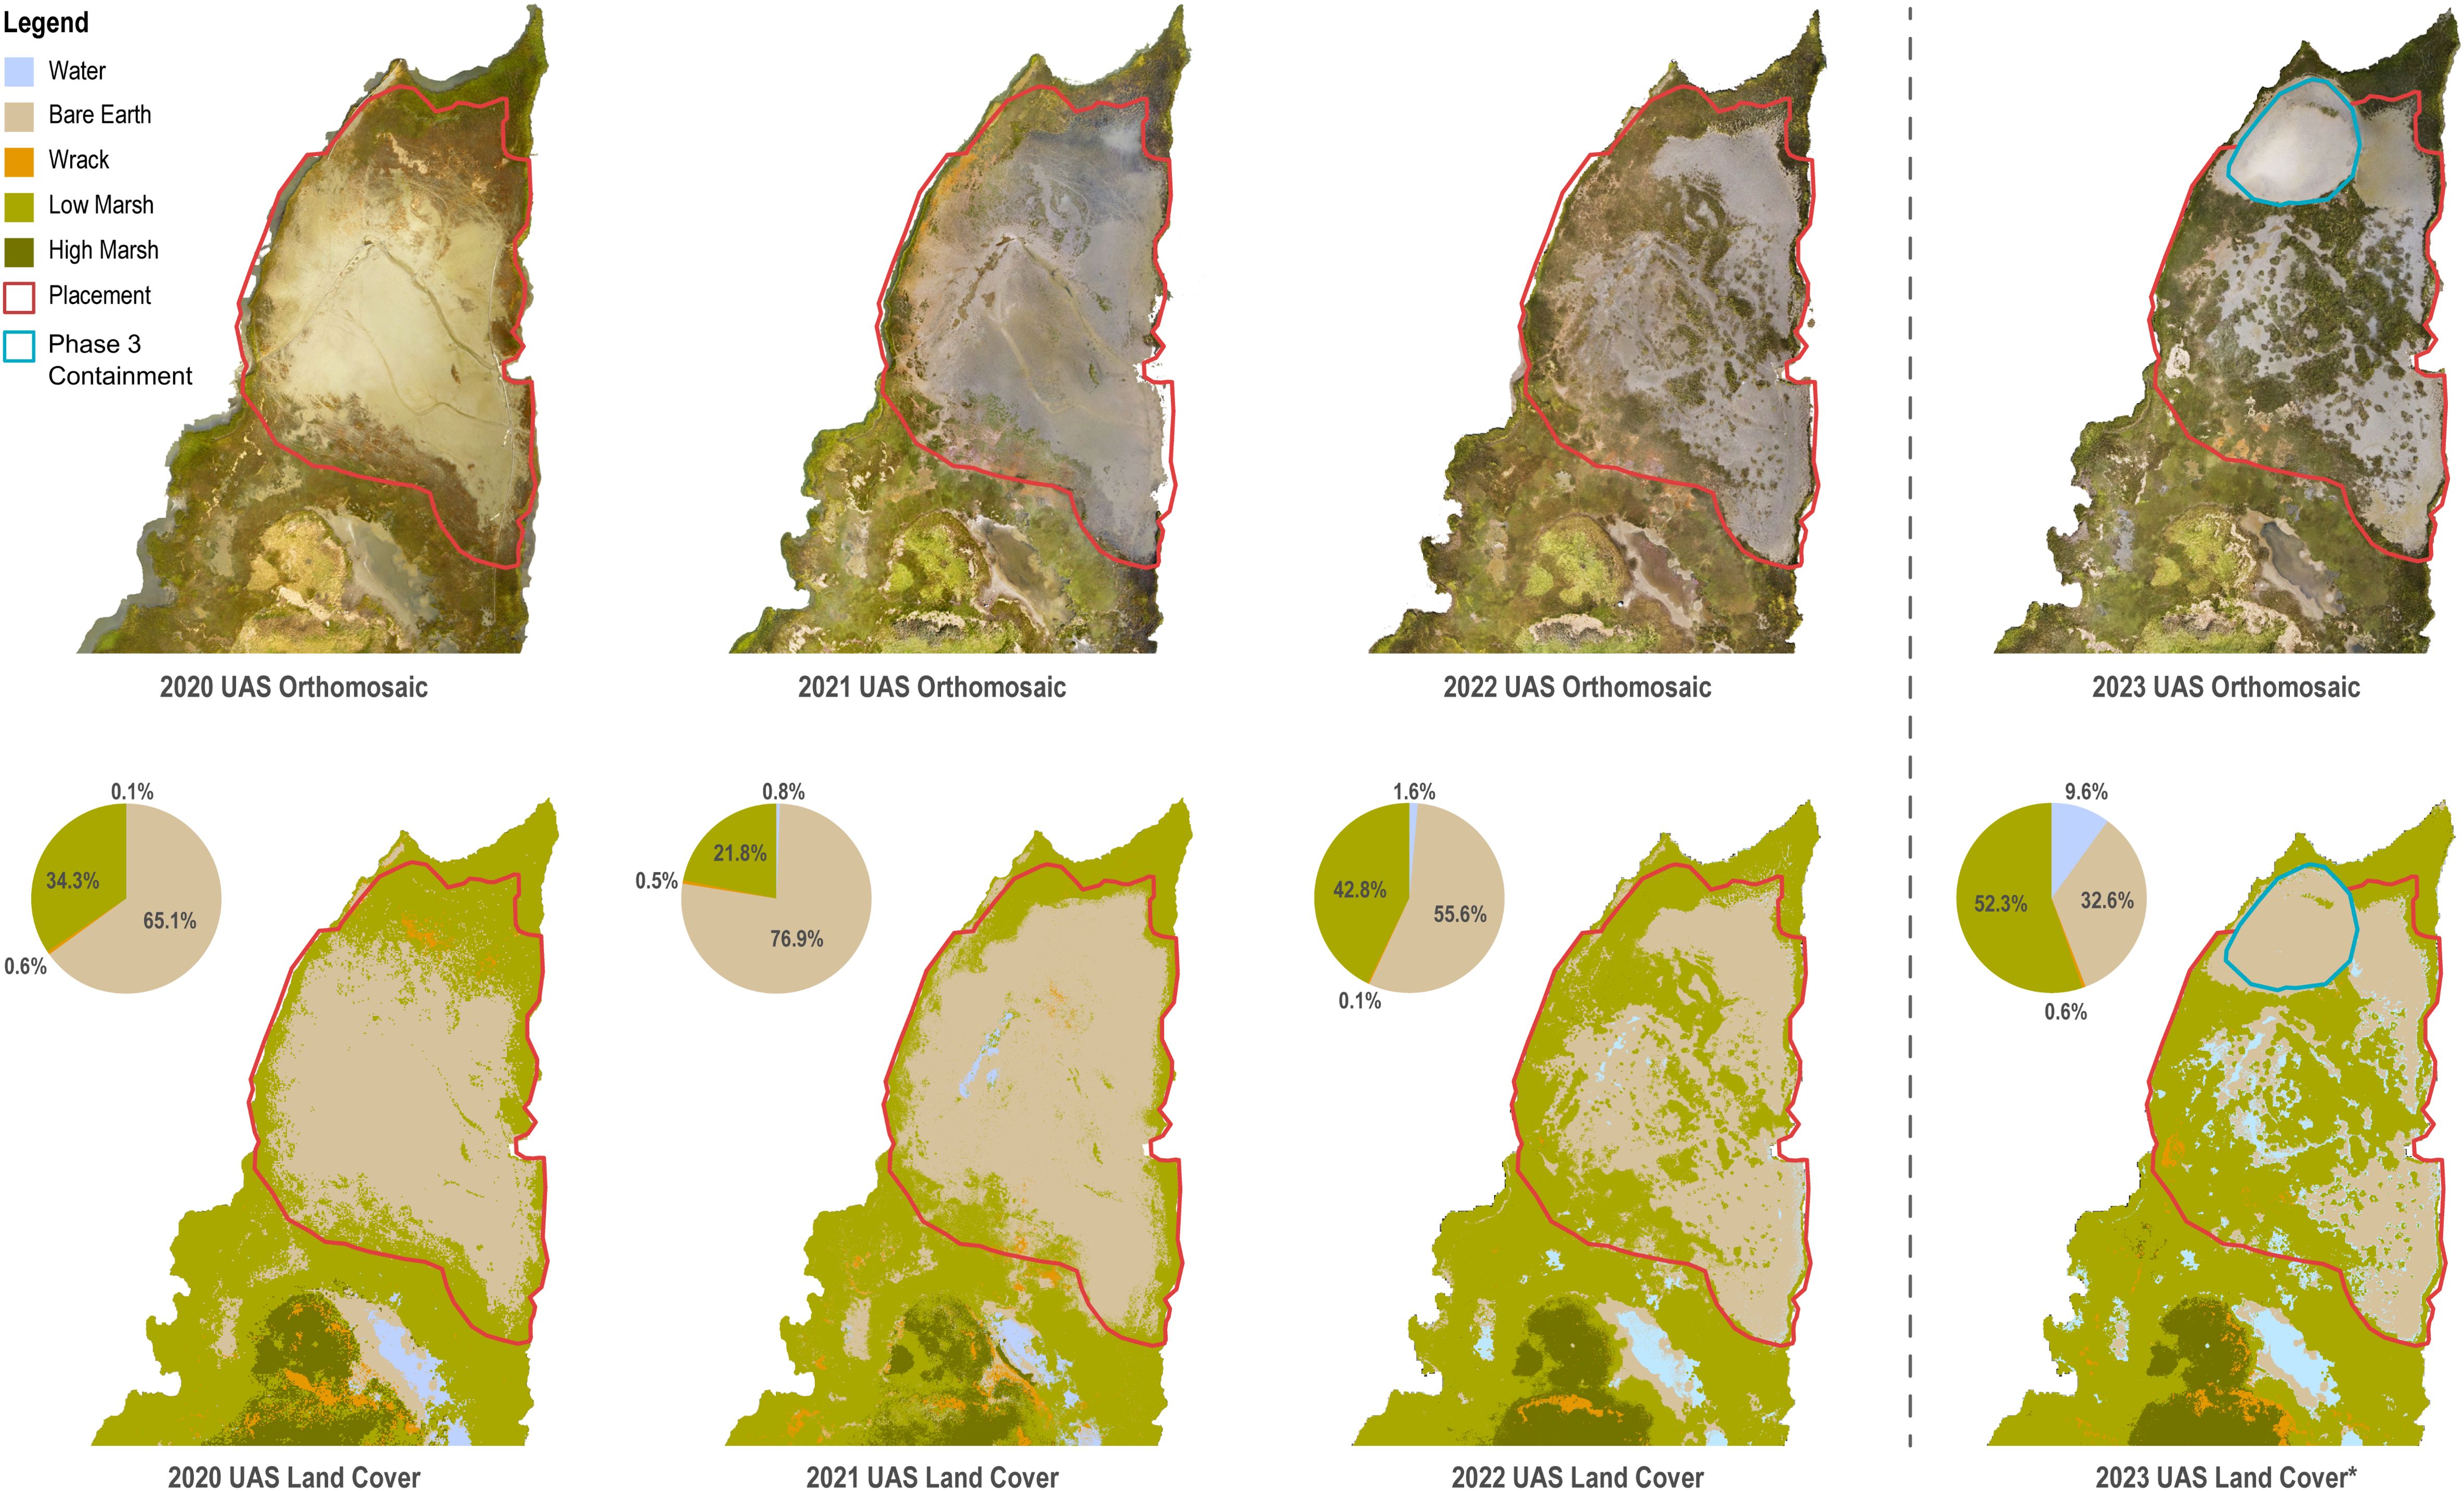
Figure 5. Orthomosaic surveys and land cover classifications from September 14, 2020; August 23, 2021; August 26, 2022; and September 9, 2023. Land cover classifications consisted of water, bare earth, wrack, low marsh, and high marsh with a red boundary line denoting the approximate nourishment area. For 2023 UAS Land Cover* the percentages exclude the Phase 3 placement area since additional dredged material was placed here, altering the vegetation cover.
Survey data of wetland surface elevations are overlayed on estimated ranges of dredged material surface elevations and underlying foundation layers and their respective calibrated surfaces at four (4) sites across the nourishment area in Figure 6. Survey data of the wetland surface show a sharp increase in elevation immediately following the dredged material placements followed by a gradual decrease in elevation. This decrease in elevation is primarily driven by consolidation, where a majority of elevation loss occurs within the first 3 to 6 months. Consolidation occurs because the weight of the dredged material generates excess pore water pressure within the dredged material and underlying foundation. This excess pore pressure dissipates from the soil pore space, reducing soil porosity (i.e., void ratio) until primary consolidation is completed. The shaded ranges of modeled surface and foundation elevation represent the variations of highly compressible dredged material and underlying foundation as the lower band and a less compressible media for the upper band. In general, the field data fell within this potential range. For Sites A-C, the calibrated surface elevations fell within the more compressible side of the band while at D they were on the less compressible end, which could be attributed to a shallower sand confining layer. A summary of base and calibrated conditions for Sites A-D are shown in Table 4.
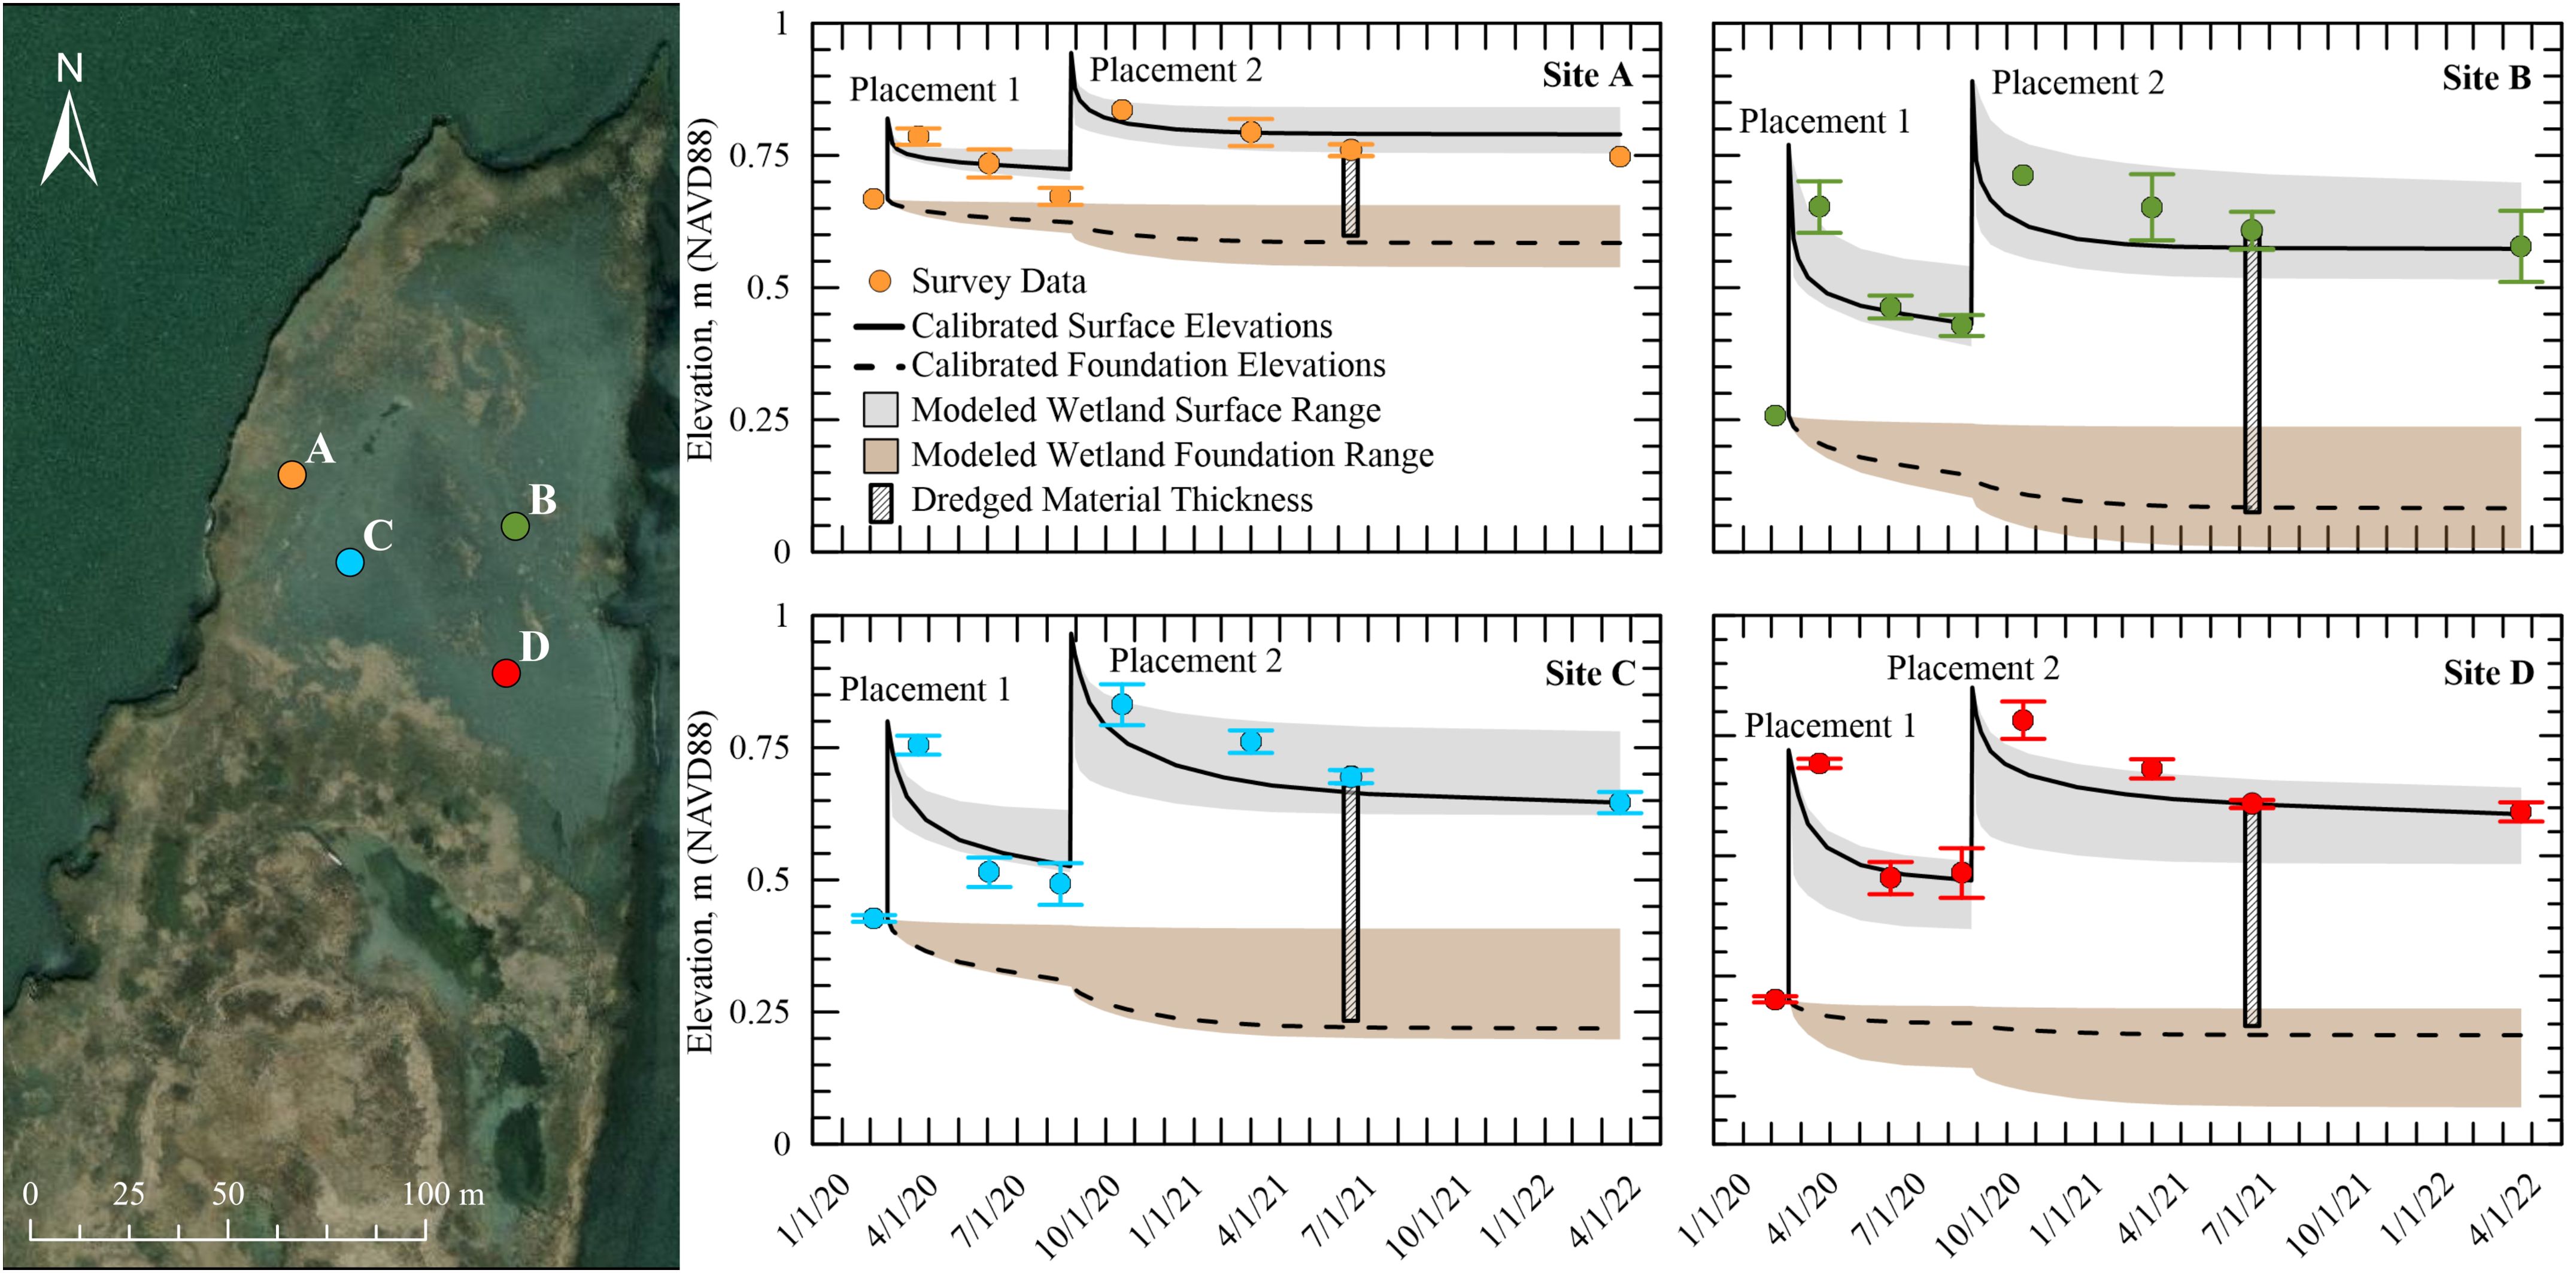
Figure 6. (Left) Map of sites used for consolidation model. (Right) At each site, survey elevation (average values within 2.5-m radius of each point ± 1 standard deviation) overlayed on modeled wetland surface and foundation consolidation ranges and calibrated surface elevations. The thickness of dredged material was determined during the July 2021 survey via Russian Peat Corer borings.
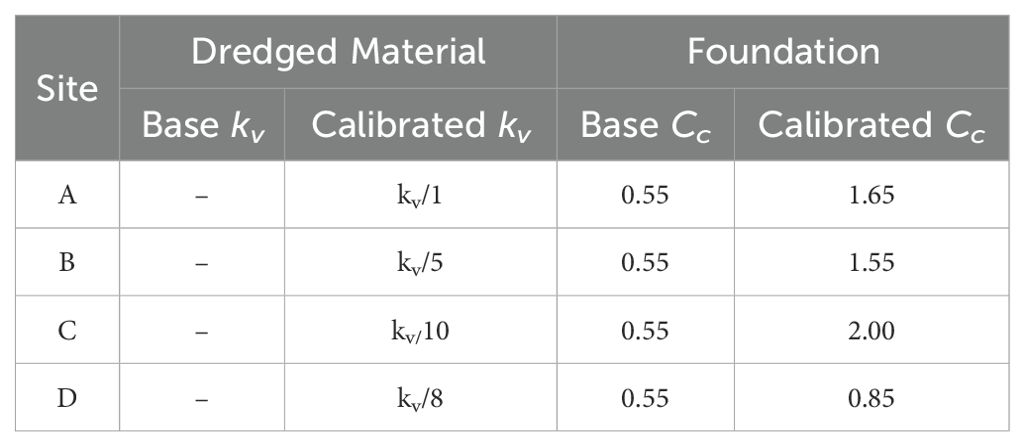
Table 4. Summary of base and calibrated values for relevant permeability (kv) and compression index (Cc) values.
A comparison of approximate dredged material thickness and surface elevation gain derived from field data is shown in Figure 7. The data indicate a positive correlation between approximate dredged material thickness and elevation gain. A linear trend shows that nearly 33% of gained elevation post placement was lost due to self-weight consolidation of the dredged material and primary consolidation of the foundation soils two years post BUDM nourishment. This relationship is dependent on the environment, soil properties of the dredged material and foundation, site geometries (size, slopes, containment), and tidal conditions, among others. In addition, the results displayed are from the unique dredged material placements (e.g., Phase 1 and 2) and not a combination, thus results from the first nourishment may not represent true values of total primary consolidation.
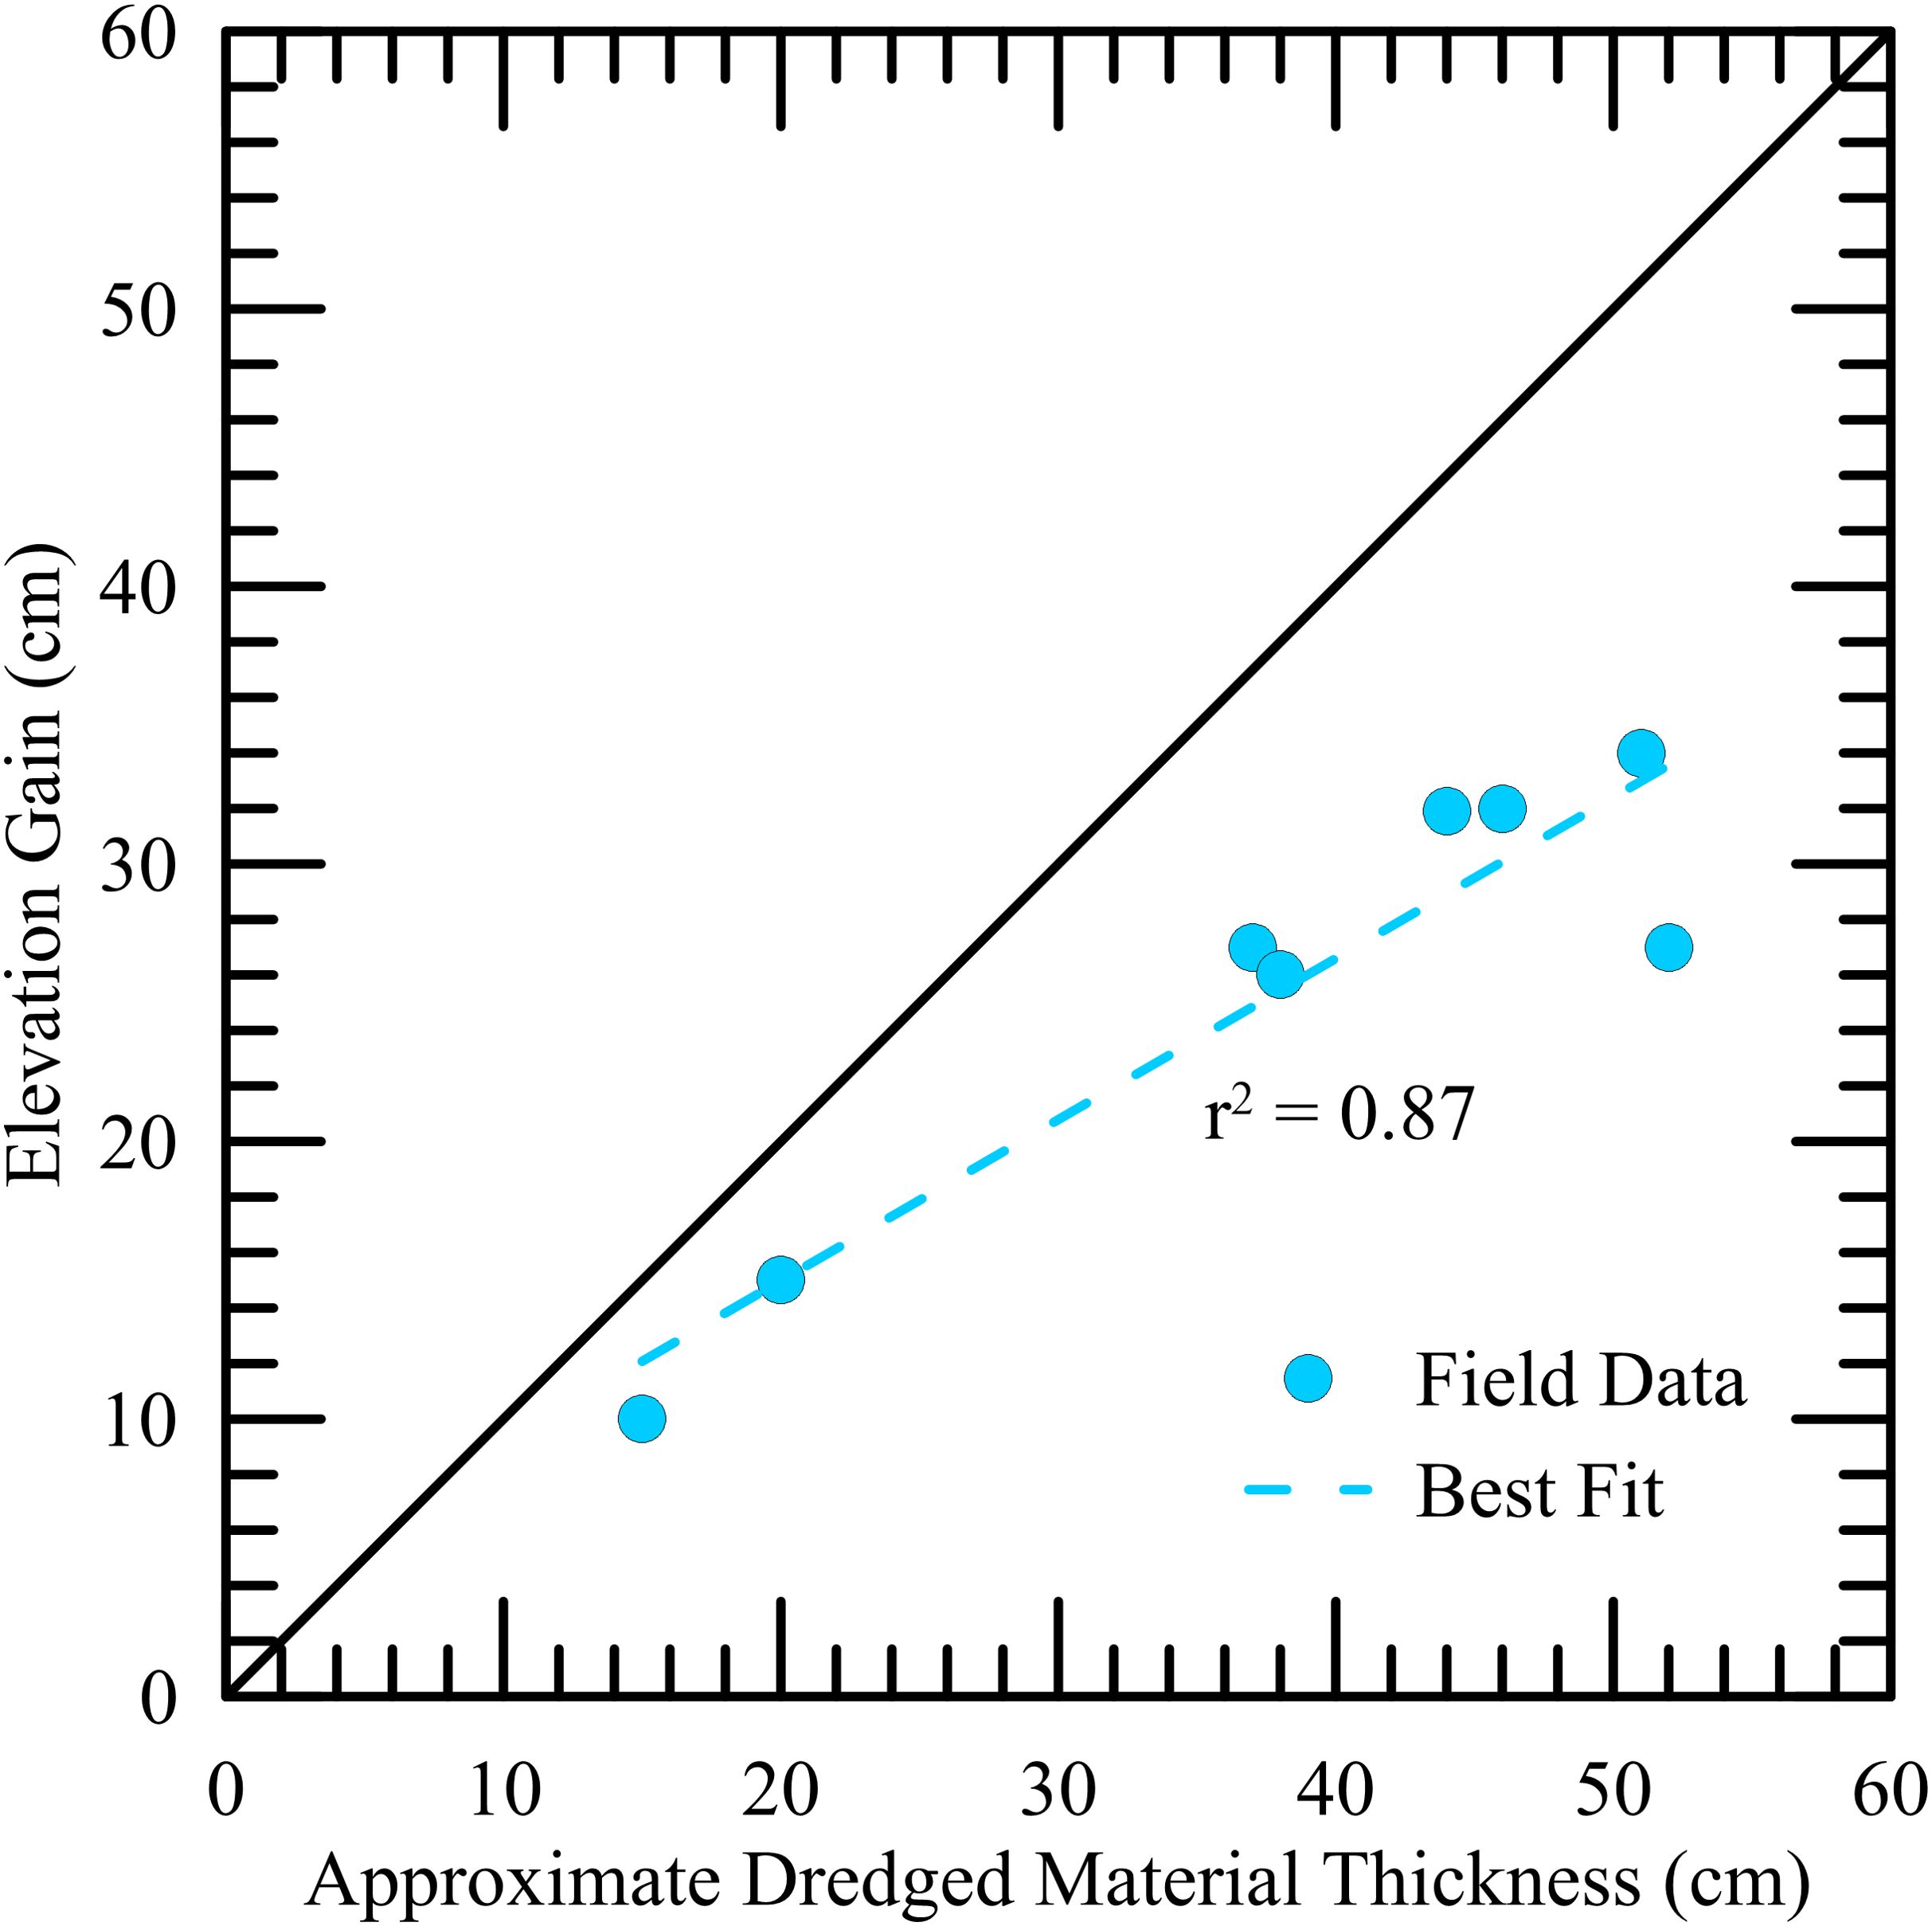
Figure 7. Comparison of approximate dredged fill thickness to elevation gain from field survey data at two years post-nourishment.
The application of BUDM is a viable solution for wetlands that are unable to keep pace with sea level rise (Wigand et al., 2017; Raposa et al., 2023; Davis et al., 2022), and these marsh restorations require a three-dimensional understanding of geomorphic processes (Ganju, 2019). A Spring and Fall 2020 BUDM nourishment on the northern half of Sturgeon Island placed 15,291 m3 of dredged material and resulted in an elevation increase of 0.19 ± 0.11-m two years after placement. A common construction method for BUDM is via hydraulic placement of dredged material (VanZomeren et al., 2019; Davis et al., 2022; Raposa et al., 2023). The hydraulic placement of dredged material will typically result in mounding of coarser-grained sediment in the immediate discharge area while finer-grained sediment remains in suspension longer and travels farther (Whitbeck et al., 2019; Piercy et al., 2023). In addition, scour paths can form as the flow of dredged material finds a path of least resistance away from the discharge point, resulting in a non-uniform surface elevation (Piercy et al., 2023). These topographic features were identified following the initial placement of dredged material on Sturgeon Island (Figure 4). However, with the additional material deposited during Phase 2, the surface appeared flatter as dredged material filled in the surface depressions, and tides and currents reworked material to more stable configurations, though this may be a by-product of the surveying and interpolation methods. The placement of dredged material can impact wetlands by filling in tidal creeks, which are essential to the function of the ecosystem as they facilitate tidal exchange. These can be temporary impacts though, as greater thicknesses of dredged material deposits within these depressions (Tyler and Bailey, 2019; Harris et al., 2021), resulting in higher magnitudes of consolidation and reformation of the depressional features, so the tidal creek network will reestablish itself within the new tidal prism. These observed geomorphic changes at Sturgeon Island emphasize that the collection of high-resolution topographic data prior to BUDM placement is immensely beneficial. In particular, the initial topography can dictate how dredged material will disperse and how to best contain the placed material, whether through natural means (berms, vegetation) or artificial (coir logs, haybales, earthen containment dikes) options.
For BUDM projects, the dynamic nature of geomorphic processes during and immediately (<30 days) post placement should be expected and viewed positively. For example, prior to material placement, the northern portion of Sturgeon Island sloped downward from the west to the east and was drained by a tidal creek network off the eastern edge. This creek made it especially difficult to retain dredged material in the subaerial zones. Despite containment attempts, the dredged slurry consistently scoured a “path of least resistance” underneath or around the containment, which resulted in the nourishment of a mudflat off the eastern edge of the island. In most settings, it is unrealistic to expect complete containment of material. Even with an expansive network of earthen containment dikes and drainage weirs, the complete containment of dredged material is monetarily impossible, and containment methods and their construction may negatively impact the marsh surface and vegetation recovery (Berkowitz and VanZomeren, 2020; Harris et al., 2021). The “loss” (i.e., dispersal) of dredged material from the direct placement area should be anticipated and built into construction monitoring and adaptive management plans when possible to provide maximum benefits as this can develop a more natural and stable transition (i.e., slope) between marsh types. In addition, sediment leaving the immediate system is likely to stay within the region. For example, Perkey et al. (2024a) investigated the fate of dredged material leaving a BUDM nourishment via a network of tidal creeks and found that the majority of material remained within adjacent mudflats. Ultimately, these enhanced mudflats can provide a multitude of ecosystem services from expanded feeding grounds to wave reduction (Perkey et al., 2024a). Furthermore, recent flume erosion tests conducted on fine-grained sediment, similar to what was placed on Sturgeon Island, revealed that shear stresses in excess of 0.4 Pa were required for erosion 30-days after deposition (Perkey et al., 2024b). Under typical tidal conditions, an area adjacent to Sturgeon Island experienced approximate current-induced shear stresses of only 0.05 Pa (Perkey et al., 2024b) meaning the sediment was relatively immobile one month after placement. However, it is possible to exceed these shear stresses during storm induced currents (Perkey et al., 2024a).
Wetland elevation is a primary driver of vegetation species distribution and health as it impacts hydroperiod (i.e., inundation) (Kirwan and Guntenspergen, 2012; Morris et al., 2013; VanZomeren and Piercy, 2020; Jafari et al., 2024). The final elevation of a BUDM nourished wetland depends not only on surface flow and topographic controls but also on consolidation. Specifically, self-weight consolidation of the dredged material and underlying wetland foundation consolidation will produce a reduction of elevation with time (Graham and Mendelssohn, 2013; VanZomeren and Piercy, 2020; Harris, 2020; Harris et al., 2024). For more traditional civil infrastructure settings, the determination of consolidation is often a routine exercise that yields highly accurate results. However, wetland environments are highly dynamic systems driven by biological, geological, geotechnical, and meteorological forcings (French, 2006; Fagherazzi et al., 2012; Harris et al., 2024), and the presence of these uncertainties produces a large range of potential outcomes during hydraulic placement of dredged material in these environments (Harris and Shawler, 2025). Thus, the collection of actual project outcomes (i.e., elevation with time, soil conditions, etc.) is essential to improving predictability of future BUDM marsh enhancement projects. The repeat elevation data collected following the two BUDM placements on Sturgeon Island indicated that most of the consolidation occurred within the ~6 months following placement. This is consistent with consolidation theory. This follows a logarithmic trend where a majority of elevation loss occurs soon after loading is completed and will decrease as time progresses (Terzaghi et al., 1996). Thus, if planning for elevation surveys post BUDM placement, it is recommended to allocate more resources immediately following completion and lengthening the time in-between surveys as time progresses.
A comparison of dredged fill thicknesses to overall elevation gain revealed that approximately one-third of gained elevation was lost due to consolidation two years post placement (Figure 7). This consolidation is a combination of self-weight consolidation of dredged material and primary consolidation of the wetland foundation. By contrast, Graham and Mendelssohn (2013) found that 23-cm of increased elevation following a BUDM nourishment in a brackish marsh in Louisiana was largely erased 2.5-years later. The difference between our observations at Sturgeon Island and that of Graham and Mendelssohn (2013) may be attributable to differing subsurface conditions, as Sturgeon Island has a shallow sand foundation (<2-m below ground surface) that is significantly less compressible than typical deltaic soils found within Louisiana.
Consolidation models can be calibrated to field data using two main adjustments: (1) the time-rate or (2) the magnitude of consolidation (Jafari et al., 2019c). These parameters are determined by soil conditions within the field, but it is notoriously difficult to determine via laboratory experiments because these environments commonly comprise easily disturbed, highly heterogeneous deltaic soils (Jafari et al., 2018, 2019a, b). Previous studies have shown that laboratory-determined soil permeability can be an order of magnitude off from in-situ conditions (Tavenas et al., 1983a; Jafari et al., 2019c), which is largely attributed to sample disturbance within the collection, transportation, and extrusion processes that alter the soil matrix. However, laboratory compressibility data can depict in-situ conditions (Jafari et al., 2018). To account for this uncertainty, a range of potential surface elevations were modeled within the investigation. In general, the field data fell within the faster and more compressible ends of this range (Figure 6). The calibrated foundation Cc values were significantly higher than the base values of 0.25 and 0.55, determined via standard oedometer testing (Table 3). This was not unexpected as these Cc values were uncharacteristically low when compared to Cc values determined via w(%) correlations (1.7 to 2.1). An interpolated foundation surface (original wetland surface) was determined during the July 2021 field survey (Figure 2A). Although the core spacings were coarse (5- to 20-meters), it was estimated that the foundation had consolidated an average of 0.09-m across the transects with values at some locations experiencing as much as 0.17-m of consolidation. This indicates the need to account for foundation consolidation when considering a BUDM nourishment, especially in wetlands with high fines contents and low bulk densities (0.09 g/cm3) (Mudd et al., 2009; Davis et al., 2022). In addition, the in-situ measurement of soil conditions using cone penetrometer tests is strongly recommended over laboratory methods to limit the effects of sample disturbance.
At Sturgeon Island, dredged material thicknesses averaged 39-cm and 37-cm immediately following Phase 1 and Phase 2, respectively. This resulted in an average gain of 19-cm of elevation capital within the immediate placement area following consolidation (Figure 6). At other recent wetland BUDM nourishments within southern New Jersey, dredged material thicknesses averaged 15-cm at Ring Island in 2014, 17-cm at Fortescue in 2016, and 31-cm on the marsh platform and >62-cm within the pools at Avalon in 2014 and 2015 (two phases) (NJDEP, 2023). Outside of the region, 15-cm to 23-cm of sediment was deposited at a marsh within the Brunswick estuary in Georgia (Mohan et al., 2021), while a marsh at Fowl River in Alabama received 15- to 61-cm within the direct placement area and <31-cm in the surrounding fringe areas (Nester and Rees, 1988). It was unclear how long after placement these thicknesses were determined, but most likely the wetland foundation and dredged material would have consolidated to some degree. Regardless, the thicknesses of dredged material deposited at Sturgeon Island, and most full-scale BUDM sites, far exceed natural rates of accretion in the New Jersey region (2–6 mm/yr; Haaf et al., 2022) and storm sedimentation (1–12 cm) observed on many US Atlantic and Gulf Coast marshes (Nyman et al., 1995; Goodbred and Hine, 1995l Cahoon et al., 1995; Baustian and Mendelssohn, 2015; FitzGerald et al., 2020; Moore et al., 2021). This implies that, excepting large-scale overwash events on barrier coasts (e.g. Williams, 2012), burial by BUDM may cause greater disturbance to the marsh systems than natural processes, but the benefits from the gain in elevation capital likely warrant this disturbance.
To understand the long-term effects these BUDM nourishments could have on Sturgeon Island, low, moderate, and high SLR scenarios for pre- and post-BUDM at one location (Site C, Figure 6) in CWEM were evaluated (Figure 8). At the time of this work, CWEM did not have the capability to simulate a disturbance, so these model results represent a fully established wetland at two distinct elevations. The model results indicate S. alterniflora aboveground biomass quantities are initially reduced for the post placement conditions because wetland vegetation, specifically S. alterniflora, exhibits a parabolic distribution with elevation (Morris et al., 2013; Davis et al., 2017) and the pre-nourishment elevation at Site C was at a more optimal inundation frequency. After 30 years, the model predicts that the post-nourishment site will have the same aboveground biomass. Furthermore, the model predicts that the post-nourishment scenario will maintain elevation capital relative to sea level for an additional 18-28 years, reducing the percent inundation.
Figure 8. Comparison of (A) wetland surface elevation, (B) percent inundation, and (C) S. alterniflora aboveground biomass pre- and post-dredged material placement for Site C Shaded bands represent the range of low to high sea level rise rates with the solid line representing the moderate scenario.
Past a certain threshold, the addition of dredged sediment will smother existing vegetation and convert the surface to bare earth (Davis et al., 2022; Harris et al., 2024), as seen at Sturgeon (Figure 5). This concept is consistent with the optimal range for storm-driven overwash deposition on fringing marshes of 5-10 cm, beyond which plant mortality is likely (Walters and Kirwan, 2016). BUDM applications provide immediate elevation gains to at-risk wetlands, but vegetation in nourished wetlands will not resemble control sites for many years post placement and may never approximate reference conditions (Raposa et al., 2023). As for design thicknesses, Raposa et al. (2023) found that vegetation can recolonize faster following a thinner lift of dredged fill when compared to a thicker one, but differences had disappeared at the three-year mark. Similarly, NJDEP (2023) found that vegetation within thinner BUDM colonized faster during the first few years. Douglas et al. (2021) showed vegetation recovery within 3 years at a BUDM with an average thickness of 17-cm. This is consistent with the findings from Sturgeon Island as significant revegetation did not occur until 3 years had passed following an average post-consolidation elevation increase of 19-cm (Figure 5). However, at Ring Island, NJ, vegetation was slow to recover for six years post-placement despite an average placement thickness of only 15-cm (NJDEP, 2023). Taken together, these studies indicate that dredged material thickness is not the only factor determining plant recovery. Instead, long-term plant recovery is dictated primarily by the final marsh surface elevation (NJDEP, 2023). Thus, because significant site disturbance is likely the outcome regardless of material thickness, it is more advantageous to place a thicker dredged material layer so long as sufficient material is available and the target marsh platform elevation will not be exceeded following consolidation.
This study focused on monitoring two BUDM-placements on Sturgeon Island, NJ. Specifically, this investigation determined how much elevation gain occurred, how much loss was attributable to consolidation of the dredged material and foundation soils, how quickly the site revegetated, and the long-term impacts of wetland nourishment when considering projected sea level rise rates. The study concludes that:
● With each BUDM placement, the surface elevation became flatter as dredged material filled in the depressions and was reworked by tides and currents. One-third of the immediate elevation gain was eventually lost two-years post nourishment due to a combination of the dredged fill and wetland foundation consolidation and sediment reworking.
● The surface was elevated on average by 0.19 ± 0.11-m two years after construction. This value accounts for dredged material placement with subsequent consolidation of soil and sediment reworking.
● Consolidation models generally agreed with field conditions, but a reliance upon laboratory derived inputs can contribute large degrees of uncertainty. Instead, modelers should opt for in-situ based methods such as cone penetrometer tests to assess soil conditions.
● Post BUDM, the site was converted to bare earth as the vegetation was smothered by the dredged material. More than half of the nourished area revegetated after three growing cycles post-BUDM, with continued revegetation of the low marsh occurring annually.
● Sufficient material was placed from the two BUDM placements to offset SLR by 18-28 years based on CWEM results.
For any wetland BUDM project, the determination of target elevations is the most critical aspect of the project. This is contingent on the type of soil being dredged, volume of dredged material available, foundation characteristics, topography, tidal ranges, target vegetation species and densities, and the desired project lifespan. It is essential for coastal managers to have realistic expectations for BUDM nourishments and anticipate the site to be bare earth for multiple growing cycles. If sufficient elevations are achieved relative to tidal inundation, more rapid revegetation will occur at lower elevations for S. alterniflora colonization and more slowly at higher elevations with lower tidal inundation frequencies. However, these higher elevations confer increased long-term resiliency of the site that will balance out the short-term disturbance to vegetation. Managers must be prepared for the loss of dredged material from the direct placement area so they can maximize benefits to adjacent areas that may receive material. Lastly, they must account for the consolidation of not only the dredged material, but also the foundation to determine dredged material placement heights and resultant surface elevations.
The original contributions presented in the study are included in the article/supplementary material, further inquiries can be directed to the corresponding author/s.
BH: Conceptualization, Data curation, Formal analysis, Funding acquisition, Investigation, Methodology, Writing – original draft, Writing – review & editing. AO: Formal analysis, Visualization, Writing – original draft. LT: Conceptualization, Investigation, Writing – review & editing. KV: Investigation, Methodology, Writing – original draft, Writing – review & editing. SB: Conceptualization, Investigation, Writing – original draft, Writing – review & editing. JS: Writing – original draft, Writing – review & editing. NJ: Supervision, Writing – review & editing. MC: Funding acquisition, Investigation, Writing – review & editing.
The author(s) declare financial support was received for the research, authorship, and/or publication of this article. Financial support was provided by the US Army Corps of Engineers Dredging Operations and Environmental Research (DOER) Program and the Department of Defense (DoD) through its Science, Mathematics, and Research for Transformation (SMART) program.
The authors would like to acknowledge the U.S. Army Corps of Engineers through the Dredging Operations and Environmental Research (DOER) Program and the Department of Defense (DoD) through its Science, Mathematics, and Research for Transformation (SMART) program. In addition, the authors thank the USACE Philadelphia District, Joint Airborne Lidar Bathymetry Technical Center of Expertise (JALBTCX), The Wetland Institute, and the University of Washington NSF Natural Hazards Engineering Research Infrastructure (NHERI) Reconnaissance Experimental Facility (RAPID) for support of field data collection.
The authors declare that the research was conducted in the absence of any commercial or financial relationships that could be construed as a potential conflict of interest.
The author(s) declare that no Generative AI was used in the creation of this manuscript.
All claims expressed in this article are solely those of the authors and do not necessarily represent those of their affiliated organizations, or those of the publisher, the editors and the reviewers. Any product that may be evaluated in this article, or claim that may be made by its manufacturer, is not guaranteed or endorsed by the publisher.
Alizad K., Hagen S. C., Morris J. T., Medeiros S. C., Bilskie M. V., Weishampel J. F. (2016). Coastal wetland response to sea-level rise in a fluvial estuarine system. Earth’s Future 4 (11), 483–497. doi: 10.1002/2016EF000385
ASTM International (2020). ASTM D2974-20e1: Standard test methods for determining the water (moisture) content, ash content, and organic material of peat and other organic soils (West Conshohocken, Pennsylvania, USA: ASTM International). Available at: https://www.astm.org/d2974-20e01.html (Accessed March 24, 2020).
Barbier E. B., Hacker S. D., Kennedy C., Koch E. W., Stier A. C., Silliman B. R. (2011). The value of estuarine and coastal ecosystem services. Ecol. Monogr. 81, 169–193. doi: 10.1890/10-1510.1
Baustian J. J., Mendelssohn I. A. (2015). Hurricane-induced sedimentation improves marsh resilience and vegetation vigor under high rates of relative sea level rise. Wetlands 35, 795–802. doi: 10.1007/s13157-015-0670-2
Berkowitz J. F., VanZomeren C. M. (2020). Evaluation of iron sulfide soil formation following coastal marsh restoration – observations from three case studies. U.S. Army Corps of Engineers Final Report ERDC/EL TR-20–1 (Vicksburg, MS, USA: U.S. Army Engineer Research and Development Center (ERDC)).
Boesch D. F., Josselyn M. N., Mehta A. J., Morris J. T., Nuttle W. K., Simenstad C. A., et al. (1994). ). Scientific assessment of coastal wetland loss, restoration and management in Louisiana. J. Coast. Res. 20 pp. i–v, i–103.
Cadigan J. A., Bekkaye J. H., Jafari N. H., Zhu L., Booth A. R., Chen Q., et al. (2022). Impacts of coastal infrastructure on shoreline response to major hurricanes in southwest Louisiana. Front. Built Environ. 8, 885215. doi: 10.3389/fbuil.2022.885215
Cadigan J., Jafari N., Wang N., Chen Q., Zhu L., Harris B., et al. (2023). Near-continuous monitoring of a coastal salt marsh margin: Implications to predicting marsh edge erosion. J. Geophysical Res. – Earth Surface. 48 (6), 1087-1088. doi: 10.1002/esp.v48.7
Cahoon D. R., Reed D. J., Day J. W. Jr., Steyer G. D., Boumans R. M., Lynch J. C., et al. (1995). The influence of Hurricane Andrew on sediment distribution in Louisiana coastal marshes. J. Coast. Res. 21, 280–294.
Cargill K. W. (1986). The large strain, controlled rate of strain (LSCRS) device for consolidation testing of soft fine-grained soils. Technical Report GL-86-13 (Vicksburg, Miss: U.S. Army Engineer Waterways Experiment Station, CE).
Coleman D. J., Schuerch M., Temmerman S., Guntenspergen G., Smith C. G., Kirwan M. L. (2022). Reconciling models and measurements of marsh vulnerability to sea level rise. Limnol. Oceanogr. Lett. 7, 140–149. doi: 10.1002/lol2.10230
Costanza R., d’Arge R., de Groot R., Farber S., Grasso M., Hannon B., et al. (1998). The value of ecosystem services: Putting the issues in perspective. Ecol. Economics 25, 67–72. doi: 10.1016/S0921-8009(98)00019-6
Croft A. L., Leonard L. A., Alphin T., Cahoon L. B., Posey M. (2006). The effects of thin layer sand renourishment on tidal marsh processes: Masonboro Island, North Carolina. Estuaries Coasts 29, 737–750. doi: 10.1007/BF02786525
Davis J. L., Morris J. T., Currin C. (2017). Impacts of Fertilization and Tidal Inundation on Elevation Change in Microtidal, Low Relief Salt Marshes. Estuaries and Coasts. doi: 10.1007/s12237-017-0251-0
Davis J., Currin C., Mushegian N. (2022). Effective use of thin layer sediment application in Spartina alterniflora marshes is guided by elevation-biomass relationship. Ecol. Eng. 177, 106566. doi: 10.1016/j.ecoleng.2022.106566
Day J. W., Britsch L., Hawes S., Shaffer G., Reed D., Cahoon D. (2000). Pattern and process of land loss in the Mississippi delta: A spatial and temporal analysis of wetland habitat change. Estuaries Coasts 23, 425–438. doi: 10.2307/1353136
Day J. W., Christian R. R., Boesch D. M., Yáñez-Arancibia A., Morris J., Twilley R. R., et al. (2008). Consequences of climate change on the ecogeomorphology of coastal wetlands. Estuaries Coasts 31, 477–491. doi: 10.1007/s12237-008-9047-6
Day J. W., Clark H. C., Chang C., Hunter R., Norman C. R. (2020). Life cycle of oil and gas fields in the Mississippi River Delta: A review. Water 12, 1492. doi: 10.3390/w12051492
Day J. W., Kemp G. P., Reed D. J., Cahoon D. R., Boumans R. M., Suhayda J. M., et al. (2011). Vegetation death and rapid loss of surface elevation in two contrasting Mississippi delta salt marshes: The role of sedimentation, autocompaction and sea-level rise. Ecol. Eng. 37, 229–240. doi: 10.1016/j.ecoleng.2010.11.021
Douglas S. W., Yepsen M., Flanigan S. (2021). Beneficial Use of Dredged Material for Marsh, Dune and Beach Enhancement in a Coastal New Jersey Wildlife Refuge. Western Dredging Association Journal of Dredging 19 (2).
Fagherazzi S., Kirwan M. L., Mudd S. M., Guntenspergen G. R., Temmerman S., D’Alpaos A., et al. (2012). Numerical models of salt marsh evolution: Ecological, geomorphic, and climatic factors. Rev. Geophysics 50 (1). doi: 10.1029/2011RG000359
Fall K. A., Perkey D. W., Tyler Z. J., Welp T. W. (2021). Field measurement and monitoring of hydrodynamic and suspended sediment within the Seven Mile Island Innovation Laboratory, New Jersey. doi: 10.21079/11681/40980
Fattet M., Fu Y., Ghestem M., Ma W., Foulonneau M., Nespoulous J., et al. (2011). Effects of vegetation type on soil resistance to erosion: Relationship between aggregate stability and shear strength. Catena 87, 60–69. doi: 10.1016/j.catena.2011.05.006
FitzGerald D. M., Hughes Z. J., Georgiou I. Y., Black S., Novak A. (2020). Enhanced, climate-driven sedimentation on salt marshes. Geophysical Res. Lett. 47, e2019GL086737. doi: 10.1029/2019GL086737
French J. (2006). Tidal marsh sedimentation and resilience to environmental change: Exploratory modelling of tidal, sea-level and sediment supply forcing in predominantly allochthonous systems. Mar. Geol. 235, 119–136. doi: 10.1016/j.margeo.2006.10.009
Ganju N. K. (2019). Marshes are the new beaches: integrating sediment transport into restoration planning. Estuaries Coasts 42, 917–926. doi: 10.1007/s12237-019-00531-3
Goodbred S. L. Jr., Hine A. C. (1995). Coastal storm deposition: Salt-marsh response to a severe extratropical storm, March 1993, west-central Florida. Geology 23, 679–682. doi: 10.1130/0091-7613(1995)023<0679:CSDSMR>2.3.CO;2
Graham S. A., Mendelssohn I. A. (2013). Functional assessment of differential sediment slurry applications in a deteriorating brackish marsh. Ecol. Eng. 51, 264–274. doi: 10.1016/j.ecoleng.2012.12.031
Haaf L., Watson E. B., Elsey-Quirk T., Raper K., Padeletti A., Maxwell-Doyle M., et al. (2022). Sediment accumulation, elevation change, and the vulnerability of tidal marshes in the Delaware Estuary and Barnegat Bay to accelerated sea level rise. Estuaries Coasts 45, 413–427. doi: 10.1007/s12237-021-00972-9
Harris B. D., Cadigan J., Day D., Jafari N. (2020b). “Geotechnical characterization of an eroding wetland,” in Geo-Congress (Reston, VA, USA: ASCE, the American Consulting Engineers Council, and the National Society of Professional Engineers), vol. 2020. , 740–748. doi: 10.1061/9780784482810.077
Harris B. D., Day D. J., Cadigan J. A., Jafari N. H., Bailey S. E., Tyler Z. J. (2021). Establishment of soil strength in a nourished wetland using thin layer placement of dredged sediment. PloS One 16, e0251420. doi: 10.1371/journal.pone.0251420
Harris B. D., Johnson C., Jafari N. H., Chen Q., Ozdemir C. E. (2020a). Effects of coupled consolidation and overwash processes on a low-lying headland system. Coast. Eng. 160, 103746. doi: 10.1016/j.coastaleng.2020.103746
Harris B. D. (2020). Geotechnical Properties, Design, and Performance of Natural Infrastructure. LSU Doctoral Dissertations 5399. https://repository.lsu.edu/gradschool_dissertations/5399
Harris B., Lamb-Wotton L., Alawneh O., Jafari N., Troxler T., Day D., et al. (2023). Comparison of coastal marsh below-ground root biomass and shear strength in Louisiana and Everglades National Park. Coast. Sediments. 2023, 811-823. doi: 10.1142/9789811275135_0075
Harris B., Ostojic A., Bailey S., Cadigan J., Shawler J., Chasten M. (2024). “Coastal Wetland Surface Elevation Post Construction: Application of Observational Method to Calibrate Consolidation Models,” in Geo-Congress (Reston, VA, USA: ASCE, the American Consulting Engineers Council, and the National Society of Professional Engineers). 2024
Harris B., Shawler J. (2025). “Elevating Coastal Wetland Restoration,” in Media Matters in Landscape Architecture (University of Pennsylvania).
Jafari N. H., Harris B. D., Cadigan J. A., Chen Q. (2019a). Piezocone penetrometer measurements in coastal Louisiana wetlands. Ecol. Eng. 127, 338–347. doi: 10.1016/j.ecoleng.2018.12.012
Jafari N. H., Harris B. D., Cadigan J. A., Day J. W., Sasser C. E., Kemp G. P., et al. (2019b). Wetland shear strength with emphasis on the impact of nutrients, sediments, and sea level rise. Estuarine Coast. Shelf Sci. 229, 106394. doi: 10.1016/j.ecss.2019.106394
Jafari N., Harris B., Stark T. (2019c). Settlement of the caminada headlands beach and dune nourishment in coastal Louisiana. J. Geotech. Geoenviron. Eng. 145 (12), 05019.
Jafari N., Harris B., Stark T. (2018). Geotechnical investigations at the Caminada headlands beach and dune in coastal Louisiana. Coast. Eng. 142, 82–94. doi: 10.1016/j.coastaleng.2018.04.014
Jafari N. H., Harris B. D., Morris J. T., Cadigan J. A. (2024). Interplay of hydroperiod on root shear strength for coastal wetlands. Geophys. Res. Lett. 51. doi: 10.1029/2023GL106531
Kirwan M. L., Guntenspergen G. R. (2012). Feedbacks between inundation, root production, and shoot growth in a rapidly submerging brackish marsh. J. Ecol.100 (3), 764–770. doi: 10.1111/j.1365-2745.2012.01957.x
Kopp R. E., Andrews C., Broccoli A., Garner A., Kreeger D., Leichenko R., et al. (2019). New Jersey’s rising seas and changing coastal storms: Report of the 2019 Science and Technical Advisory Panel (Trenton, New Jersey: Rutgers, The State University of New Jersey. Prepared for the New Jersey Department of Environmental Protection). Available at: https://par.nsf.gov/servlets/purl/10186574 (Accessed October 17, 2022).
McGauley K. (2024). Estimates of accretion rates of salt marsh islands in southern New Jersey. Chestnut Hill, MA: Boston College, Morrissey School of Arts and Sciences.
McKee K. L., Patrick W. H. (1988). The relationship of smooth cordgrass (Spartina alterniflora) to tidal datums: A review. Estuaries 11, 143–151. doi: 10.2307/1351966
Mendelssohn I. A., McKee K. L., Patrick W. H. (1981). Oxygen deficiency in Spartina alterniflora roots: Metabolic adaptation to anoxia. Science 214, 439–441. doi: 10.1126/science.214.4519.439
Mesri G., Ajlouni M. (2007). Engineering properties of fibrous peats. J. Geotechnical Geoenvironmental Eng. 133, 850–866. doi: 10.1061/(ASCE)1090-0241(2007)133:7(850)
Mesri G., Rokhsar A. (1974). Theory of consolidation for clays. J. Geotechnical Division 100, 889–904. doi: 10.1061/AJGEB6.0000075
Mesri G., Tavenas F. (1983). Discussion of “Permeability and consolidation of normally consolidated soils” by A. Mahinda Samarasinghe, Yang H. Huang, and Vincent P. Drnevich (June 1982). J. Geotechnical Eng. 109, 873–878. doi: 10.1061/(ASCE)0733-9410(1983)109:6(873)
Mohan R., Reemts M., Gupta P., Galloway R., Johnson T., Brown R., et al. (2021). Restoration of estuarine wetlands using thin cover placement: A pilot application in Brunswick, Georgia. Shore Beach 89, 62–72. doi: 10.34237/1008947
Moore G. E., Burdick D. M., Routhier M. R., Novak A. B., Payne A. R. (2021). Effects of a large-scale, natural sediment deposition event on plant cover in a Massachusetts salt marsh. PloS One 16, e0245564. doi: 10.1371/journal.pone.0245564
Morris J. T., Cahoon D. R., Callaway J. C., Craft C., Neubauer S. C., Weston N. B. (2021). “Marsh equilibrium theory: Implications for responses to rising sea level,” in Salt marshes: Function, dynamics, and stresses. Eds. FitzGerald D. M., Hughes Z. J.(Cambridge, United Kingdom: Cambridge University Press), 157–177.
Morris J. T., Edwards J., Crooks S., Reyes E. (2012). “Assessment of carbon sequestration potential in coastal wetlands,” in Recarbonization of the biosphere: Ecosystems and the global carbon cycle. Eds. Lal R., Lorenz K., Huttl R., Schneider B. U., von Braun J. (Springer, New York), 517–531.
Morris J. T., Shaffer G. P., Nyman J. A. (2013). Brinson review: Perspectives on the influence of nutrients on the sustainability of coastal wetlands. Wetlands 33, 975–988. doi: 10.1007/s13157-013-0480-3
Morris J. T., Sundareshwar P. V., Nietch C. T., Kjerfve B., Cahoon D. R. (2002). Responses of coastal wetlands to rising sea level. Ecology 83, 2869–2877. doi: 10.1890/0012-9658(2002)083[2869:rocwtr]2.0.co;2
Morris J. T., Sundberg K. (2024). Responses of coastal wetlands to rising sea-level revisited: The importance of organic production. Estuaries Coasts 47, 1735-1749. doi: 10.1007/s12237-023-01313-8
Mudd S. M., Howell S. M., Morris J. T. (2009). Impact of dynamic feedback between sedimentation, sea-level rise, and biomass production on near-surface marsh stratigraphy and carbon accumulation. Estuar. Coast. Shelf Sci. 82, 377–389. doi: 10.1016/j.ecss.2009.01.028
National Oceanic and Atmospheric Administration (2024). Station home page: Atlantic City, NJ - Station ID: 8534720. NOAA Tides & Currents. Available online at: https://tidesandcurrents.noaa.gov/stationhome.html?id=8534720.
Nester R. D., Rees S. I. (1988). “Thin-Layer Dredged Material Disposal—Fowl River, Alabama, Test Case,” in Environmental Effects of Dredging (Information Exchange Bulletin, Vicksburg, MS), 1–6. Available at: http://hdl.handle.net/11681/4271 (Accessed December 12, 2023).
New Jersey Department of Environmental Protection (2018). New Jersey’s State Wildlife Action Plan (Trenton, NJ: New Jersey Dept. of Environmental Protection, Division of Fish and Wildlife).
New Jersey Department of Environmental Protection and The Nature Conservancy (2023). Beneficial use of dredged material to Enhance Salt Marsh Habitat in New Jersey: Monitoring and Project Assessment. Eds. Yepsen M., Wilburn B., Woollard J. (Trenton, NJ: NJ Department of Environmental Protection, Division of Science and Research), 122.
Norris G. S., LaRocque A., Leblon B., Barbeau M. A., Hanson A. R. (2024). Comparing Pixel- and Object-Based Approaches for Classifying Multispectral Drone Imagery of a Salt Marsh Restoration and Reference Site. Remote Sensing 16 (6), 1049. doi: 10.3390/rs16061049
Nyman J. A., Crozier C. R., DeLaune R. D. (1995). Roles and patterns of hurricane sedimentation in an estuarine marsh landscape. Estuarine Coast. Shelf Sci. 40, 665–679. doi: 10.1006/ecss.1995.0045
Perkey D., Jarrell S., Fall K., Tarpley D., Friedrichs C. (2024b). Production and abundance of macro-aggregate bed clasts from moderately consolidated cohesive beds and their implications for sediment management. J. Sedimentary Res. 94, 37–50. doi: 10.2110/jsr.2023.040
Perkey D. W., Tedesco L. P., Fall K. A., Huff T. P., Chasten M. A. (2024a). Stability of marsh edge berms constructed from fine-grained dredged sediment. Front. Mar. Sci. 11. doi: 10.3389/fmars.2024.1401225
Piercy C., Welp T., Mohan R. (2023). Guidelines for How to Approach Thin-Layer Placement Projects (Vicksburg, MS: U.S: Army Engineer Research and Development Center).
Puchkoff A. L., Lawrence B. A. (2022). Experimental sediment addition in salt-marsh management: Plant-soil carbon dynamics in southern New England. Ecol. Eng. 175, 106495. doi: 10.1016/j.ecoleng.2021.106495
Raposa K. B., Bradley M., Chaffee C., Ernst N., Ferguson W., Kutcher T. E., et al. (2022). Laying it on thick: Ecosystem effects of sediment placement on a microtidal Rhode Island salt marsh. Front. Environ. Sci. 10, 939870. doi: 10.3389/fenvs.2022.939870
Raposa K. B., Woolfolk A., Endris C. A., Fountain M. C., Moore G., Tyrrell M., et al. (2023). Evaluating thin-layer sediment placement as a tool for enhancing tidal marsh resilience: A coordinated experiment across eight US National Estuarine Research Reserves. Estuaries Coasts 46, 595–615. doi: 10.1007/s12237-022-01161-y
Reddy K. R., DeLaune R., Craft C. B. (2010). Nutrients in wetlands: Implications to water quality under changing climatic conditions (Washington, DC, USA: Final Report submitted to U.S. Environmental Protection Agency).
Savitzky A., Golay M. J. E. (1964). Smoothing and Differentiation of Data by Simplified Least Squares ProceduresAnalytical Chemistry 36 (8), 1627–1639. doi: 10.1021/ac60214a047
SChile L. M., Callaway J. C., Morris J. T., Stralberg D., Parker V. T., Kelly M. (2014). Modeling tidal marsh distribution with sea-level rise: Evaluating the role of vegetation, sediment, and upland habitat in marsh resiliency. PloS One 9, e88760. doi: 10.1371/journal.pone.0088760
Singh J., Joffrion R. (2017). Geotechnical standards for marsh creation and coastal restoration projects (Baton Rouge, LA, USA: Louisiana Coastal Protection and Restoration Authority).
Stark T. D., Choi H., Schroeder P. R. (2005). Settlement of dredged and contaminated material placement areas. II: Primary consolidation, secondary compression, and desiccation of dredged fill input parameters. J. Waterway Port Coastal Ocean Eng. 131, 52–61. doi: 10.1061/(ASCE)0733-950X(2005)131:2(52
Tavenas F., Jean P., Leblond P., Leroueil S. (1983a). The permeability of natural soft clays. Part I: Methods of laboratory measurement. Can. Geotechnical J. 20, 629–644. doi: 10.1139/t83-072
Tavenas F., Jean P., Leblond P., Leroueil S. (1983b). The permeability of natural soft clays. Part II: Permeability characteristics. Can. Geotechnical J. 20, 645–660. doi: 10.1139/t83-073
Thackston E. L., Palermo M. R., Schroeder P. R. (1988). Refinement and simplification of column settling tests for design of dredged material containment areas (Vicksburg, MS: U.S: Army Engineer Waterways Experiment Station).
Turner R. E. (1997). Wetland loss in the northern Gulf of Mexico: Multiple working hypotheses. Estuaries 20, 1–13. doi: 10.2307/1352716
Tyler Z., Bailey S. (2019). Laboratory investigation of factors impacting coastal marsh consolidation after nourishment. Coast. Sediments 2019, 880-893. doi: 10.1142/9789811204487_0077
VanZomeren C. M., Acevedo-Mackey D., Murray E., Estes T. J. (2019). Maintaining Salt Marshes in the Face of Sea Level Rise - State of the Practice (Vicksburg, MS: U.S. Army Engineer Research and Development Center (ERDC) Environmental Laboratory).
VanZomeren C. M., Piercy C. D. (2020). Thin layer placement of sediments for restoring ecological function to submerging salt marshes: A quantitative review of scientific literature (Vicksburg, MS, USA: US Army Corps of Engineers).
Walters D. C., Kirwan M. L. (2016). Optimal hurricane overwash thickness for maximizing marsh resilience to sea level rise. Ecol. Evol. 6, 2948–2956. doi: 10.1002/ece3.2024
Welp T. L., Harris B. D., McFall B. C., Tyler Z. J., Beardsley C. T., Eckstein A. M., et al. (2024). Development and testing of the Sediment Distribution Pipe (SDP): A pragmatic tool for wetland nourishment. U.S. Army Corps of Engineers Final Report ERDC-CHL TR-24-8. doi: 10.21079/11681/48411
Whitbeck M., McCullough A., Meyers E., Curson D. (2019). Shorters Wharf Tidal Marsh Resilience Project: Implementation Report (Arlington, Virginia: The Conservation Fund).
Wigand C., Ardito T., Chaffee C., Ferguson W., Paton S., Raposa K., et al. (2017). A climate change adaptation strategy for management of coastal marsh systems. Estuaries Coasts 40, 682–693. doi: 10.1007/s12237-015-0003-y
Williams H. F. (2012). Magnitude of Hurricane Ike storm surge sedimentation: implications for coastal marsh aggradation Vol. 37 (England, UK: Earth Surface Processes and Landforms), 901–906.
Keywords: wetland restoration, consolidation, cone penetrometer test, lidar, ecogeomorphology, compaction, elevation capital
Citation: Harris BD, Ostojic A, Tedesco LP, VanDerSys K, Bailey S, Shawler JL, Jafari NH and Chasten M (2025) Wetland elevation change following beneficial use of dredged material nourishment. Front. Ecol. Evol. 13:1518759. doi: 10.3389/fevo.2025.1518759
Received: 28 October 2024; Accepted: 13 January 2025;
Published: 05 February 2025.
Edited by:
Stephanie Dohner, Naval Research Laboratory, United StatesReviewed by:
Julia Cherry, University of Alabama, United StatesCopyright © 2025 Harris, Ostojic, Tedesco, VanDerSys, Bailey, Shawler, Jafari and Chasten. This is an open-access article distributed under the terms of the Creative Commons Attribution License (CC BY). The use, distribution or reproduction in other forums is permitted, provided the original author(s) and the copyright owner(s) are credited and that the original publication in this journal is cited, in accordance with accepted academic practice. No use, distribution or reproduction is permitted which does not comply with these terms.
*Correspondence: Brian D. Harris, QnJpYW4uRC5IYXJyaXNAdXNhY2UuYXJteS5taWw=
†Present address: Navid H. Jafari, Department of Civil & Environmental Engineering, Texas A&M University, College Station, TX, United States
Disclaimer: All claims expressed in this article are solely those of the authors and do not necessarily represent those of their affiliated organizations, or those of the publisher, the editors and the reviewers. Any product that may be evaluated in this article or claim that may be made by its manufacturer is not guaranteed or endorsed by the publisher.
Research integrity at Frontiers
Learn more about the work of our research integrity team to safeguard the quality of each article we publish.