- 1School of Architecture and Urban Planning, Shenyang Jianzhu University, Shenyang, China
- 2Key Laboratory of City Information and Spatial Perception in Liaoning Province, Shenyang, China
Introduction: Landscape changes resulting from urbanization have profound impacts on biodiversity, threatening the habitat of resident species. Birds are valuable research subjects because of their diversity, wide distribution, and particular sensitivity to environmental changes. Therefore, exploring the relationships between winter birds and environmental variables is essential for designing and managing green spaces during winter. However, the responses of the winter bird communities to environmental variables in cold regions remain unclear.
Methods: In this study, we investigated the winter bird community in the riparian zone of the Hun River in Shenyang. We selected 11 environmental variables of the riparian zone and conducted a principal component analysis to extract seven new components that represent environmental changes. Subsequently, we performed correlation and redundancy analyses on bird diversity indicators and environmental variables.
Results: The results revealed that bird richness, Simpson’s diversity index and Shannon diversity index, was greater in the urban expansion area than in the urban core area. However, abundance was lower in the urban expansion area. Disturbance and built-up components were significantly associated with overall bird diversity, while disturbance, riparian, open vegetation, and suburban vegetation components were significantly linked to the diversity of resident and migratory birds. Birds in the urban expansion area exhibited greater sensitivity to environmental variables compared to those in the urban core area.
Discussion: This study recommend focusing on seasonal influence on birds’ resource use and urbanization level and bird species composition in riparian zones.
1 Introduction
With increased urbanization, the landscape surrounding urban areas has changed significantly compared to previous conditions, resulting in habitat loss, which poses a serious threat to urban biodiversity (Ortega-Alvarez and MacGregor-Fors, 2009; Semeraro et al., 2021; Hooper et al., 2012). A decline in biodiversity diminishes the stability of urban ecosystems and threatens the health of the human living environment. As a vital component of urban ecosystems, bird diversity serves as an important indicator of the health of urban ecosystems (Herrando et al., 2012; Patankar et al., 2021; Mariano-Neto and Santos, 2023). Urban riparian zones play a crucial role in safeguarding these ecosystems due to their high productivity. For birds, riparian zones offer abundant resources and serve as essential habitats and migration corridors (Gregory et al., 2021; Pennington et al., 2008; Nagy et al., 2017). However, there is a lack of effective design and management strategies for winter bird habitats in cold-region urban riparian zones. Given that riparian zones are critical habitats for birds during winter, the environmental quality of these areas is vital for supporting urban bird diversity.
Scholars have engaged in extensive discussions regarding the relationships between urban birds and environmental variables, confirming a correlation between environmental variables and bird diversity (Zhang and Huang, 2018; Adler and Jedicke, 2022; Brennan and Schnell, 2005; Andersen et al., 2023). While most previous studies focused on urban parks, some research has expanded sampling sites to include suburban and rural areas, exploring the differences in the relationships between bird diversity and environmental factors across urban and rural settings (Yang et al., 2020; Zhu et al., 2023). For research methods, scholars commonly use biological surveys, including the line transect method and the point count method, to collect avian data and quantify bird diversity through diversity indices such as species richness, abundance, and Shannon diversity (Suri et al., 2017; Basile et al., 2021; de Albuquerque et al., 2021; Clergeau et al., 1998). Research has demonstrated that changes in land use and the intensity of human activity along urban-rural gradients significantly influence variations in bird diversity. Natural areas typically exhibit the highest levels of species diversity. As urbanization increases, species richness within communities tends to decline. However, studies have shown that suburban areas often harbor greater bird diversity than central urban and rural regions (McKinney, 2008, McKinney, 2002; Marzluff, 2001; Grünwald et al., 2024). Similarly, within urban centers, larger areas or the interiors of well-connected green spaces tend to support higher bird diversity (Collins et al., 2021; Chin et al., 2022); Fernández-Juricic, 2000). In contrast, regions that provide superior living conditions compared to their surroundings, such as higher vegetation coverage (NDVI) or a greater variety of vegetation types, generally support a wider array of bird species (Crooks et al., 2004). Within habitats, vegetation and water are the primary factors influencing bird diversity (Leveau et al., 2020; Keten et al., 2020; Zhang Y. et al., 2022). The richer and more structurally complex the plant species in a habitat, the greater the diversity of birds (Andrade et al., 2018; Zhang et al., 2022; Basile et al., 2021). Additionally, larger watersheds also promote an increase in wetland bird diversity (Huang et al., 2015). Human disturbance, like noise, night lights and human activities in green spaces, negatively impacts bird populations, and these effects are often more pronounced than those of other factors such as food resource and plants cover (Li et al., 2018; Schlesinger et al., 2008; Guo et al., 2019).
Although some existing studies have revealed the relationships between winter birds and environmental variables, few researchers have attempted to investigate the responses of winter birds to changes in environmental variables within cold urban riparian zones (Brawn et al., 2001; Jokimäki and Suhonen, 1998; Doherty and Grubb, 2000; Mason et al., 2006; Turcotte and Desrochers, 2005). Do the conclusions drawn from other regions apply to cold regions? Shenyang is a crucial node in the East Asia-Australia migratory route for birds in Northeast Asia, with many species traveling annually to the rivers on the plains to overwinter. The Hun River is unique; it flows through the urbanized area of Shenyang, connecting the hills in the southeast with the Liao River plain in the west, thereby providing corridors for birds to migrate between lowland and hilly woodlands (Liu et al., 2011; Wang et al., 2019). The natural habitats within the riparian zone of the Hun River have deteriorated due to urbanization in the past. Although much of the riparian green space has been restored in recent years, degradation continues in suburban areas. The significant changes in the landscape of the riparian zone create favorable conditions for studying the responses of winter birds to environmental variables. Therefore, in this study, we surveyed the bird communities and environmental variables of the Hun River riparian zone in Shenyang during the winter months from December 2023 to January of the following year. We explored the relationships between bird diversity and environmental variables through correlation analysis and redundancy analysis. Our aim is to investigate the following:
The composition and diversity of winter bird communities in the riparian zone of the Hun River in Shenyang.
Is there a difference between the responses of winter bird communities to environmental variables and those of bird communities in other seasons?
Is there a difference in the relationship between bird diversity and environmental variables at varying levels of urbanization?
2 Materials and methods
2.1 Study area
Shenyang (41°48′09″N, 123°25′41″E) is situated in the southern region of Northeast China and covers an area of 12,900 km². The city experiences a temperate continental monsoon climate characterized by a prolonged cold season, typically lasting from November of one year to March of the following year, with an average temperature of approximately -4°C and a minimum temperature that can drop as low as -26°C. The Hun River flows south of Shenyang, with a length of about 32 km within the urbanized area (Wang et al., 2013). The riparian zone of the Hun River serves as one of the key ecological corridors in Shenyang, encompassing a total area of approximately 23.2 km² and varying in width from 420 m to 1500 m. Its expansive width and continuous green spaces create an ideal habitat for birds.
The extent of the riparian zone along the Hun River is currently not well defined. For the purposes of this research, the boundary of the riparian zone is defined as the land area within 1,500 meters from the riverbank (Wang and Lyu, 2001). In urban areas, the riparian zone includes developed settlements and parks, while in suburban areas, the primary components consist of construction sites, new settlements, planted forests, and cultivated lands (Figure 1).
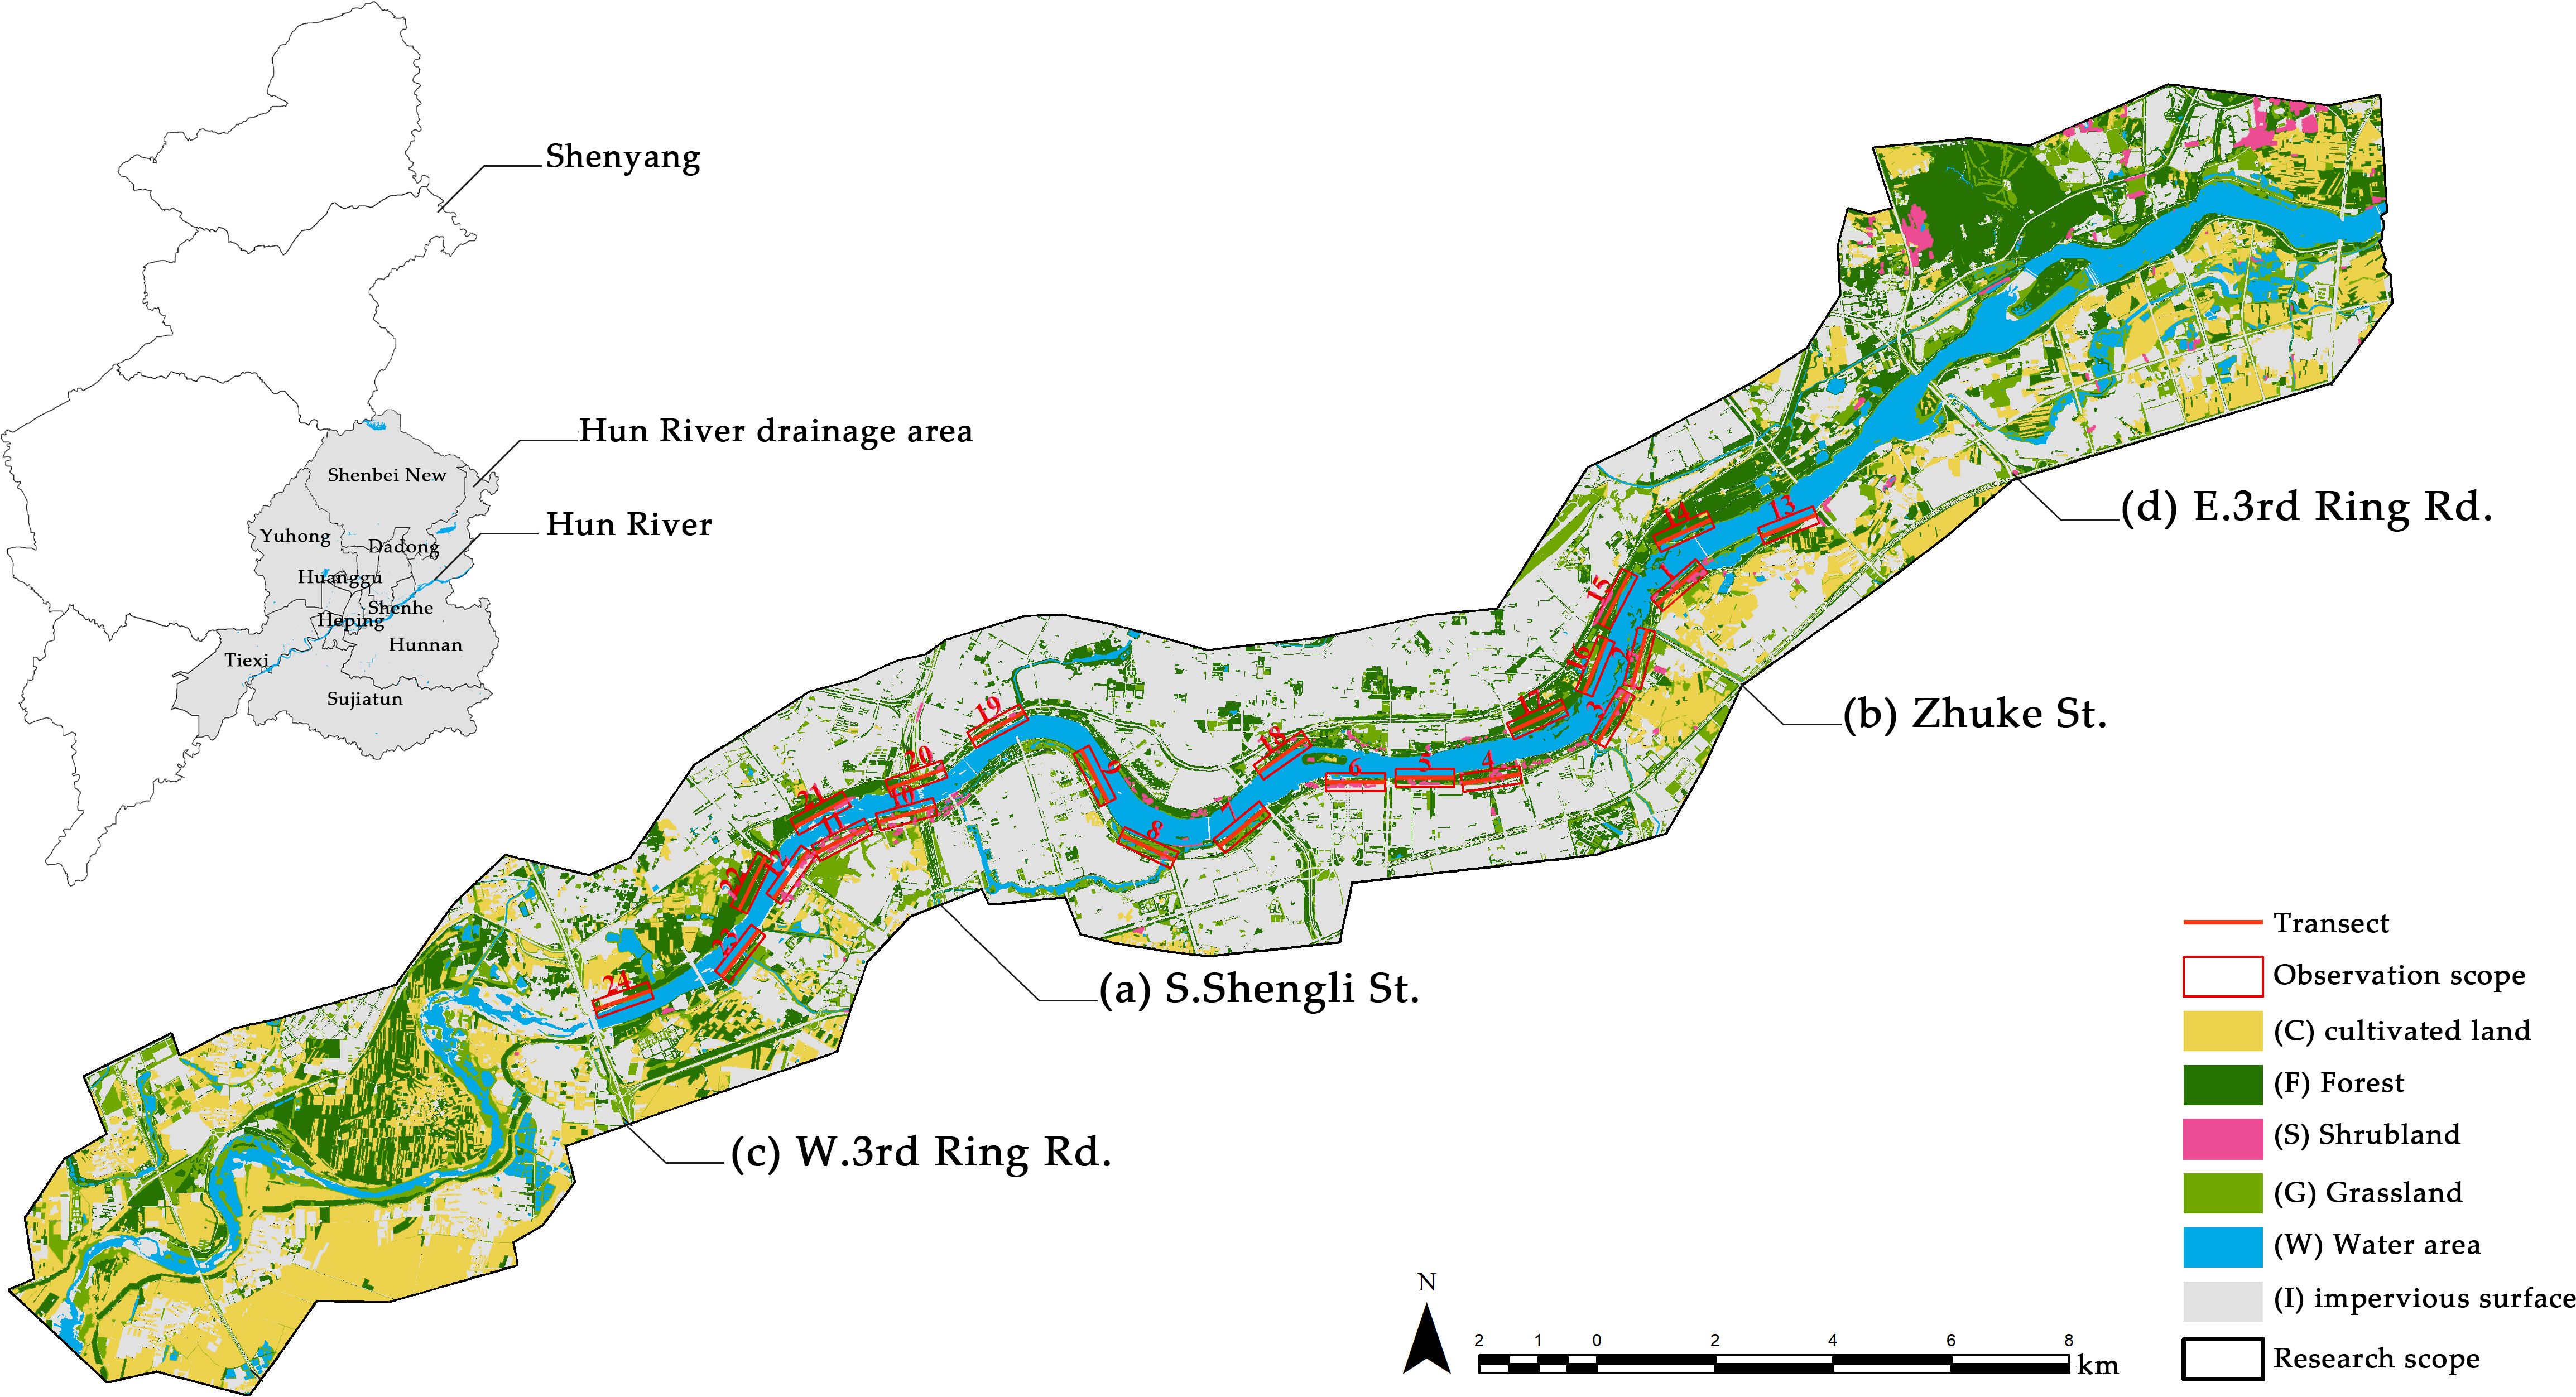
Figure 1. Land cover of the riparian zone of the Hun River in the study area and the distribution of line transects. Traditionally, the area between (A) S. Shengli St. and (B) Zhuke St. has been defined as the urban core area, while the areas between (A) and (C) W. 3rd Ring Rd. and between (B) and (D) E. 3rd Ring Rd. are defined as the urban expansion area.
2.2 Data collection
2.2.1 Bird surveys
Line transects for bird surveys were set within the research area, aligned with the direction of river flow and allocated according to varying degrees of urbanization. We ensured that the transects were distributed on both sides of the Hun River and remained as parallel as possible to the riverbank. Each line transect measured 1 km in length, with a minimum interval of 200 m between each transect to maintain uniformity in the survey (Bibby, 2000). Due to the irregular width of the riparian zone, bird composition and environmental variables varied across different locations (Figure 2). To comprehensively cover all habitats within the riparian zone of the Hun River, we arrange transects at various distances from the riverbank and utilized the proximity tool in ArcMap 10.2 to calculate the distances between the sample lines and the riverbanks for calibration purposes (Supplementary Table A1). Ultimately, a total of 24 bird survey line transects were obtained (Figure 1).
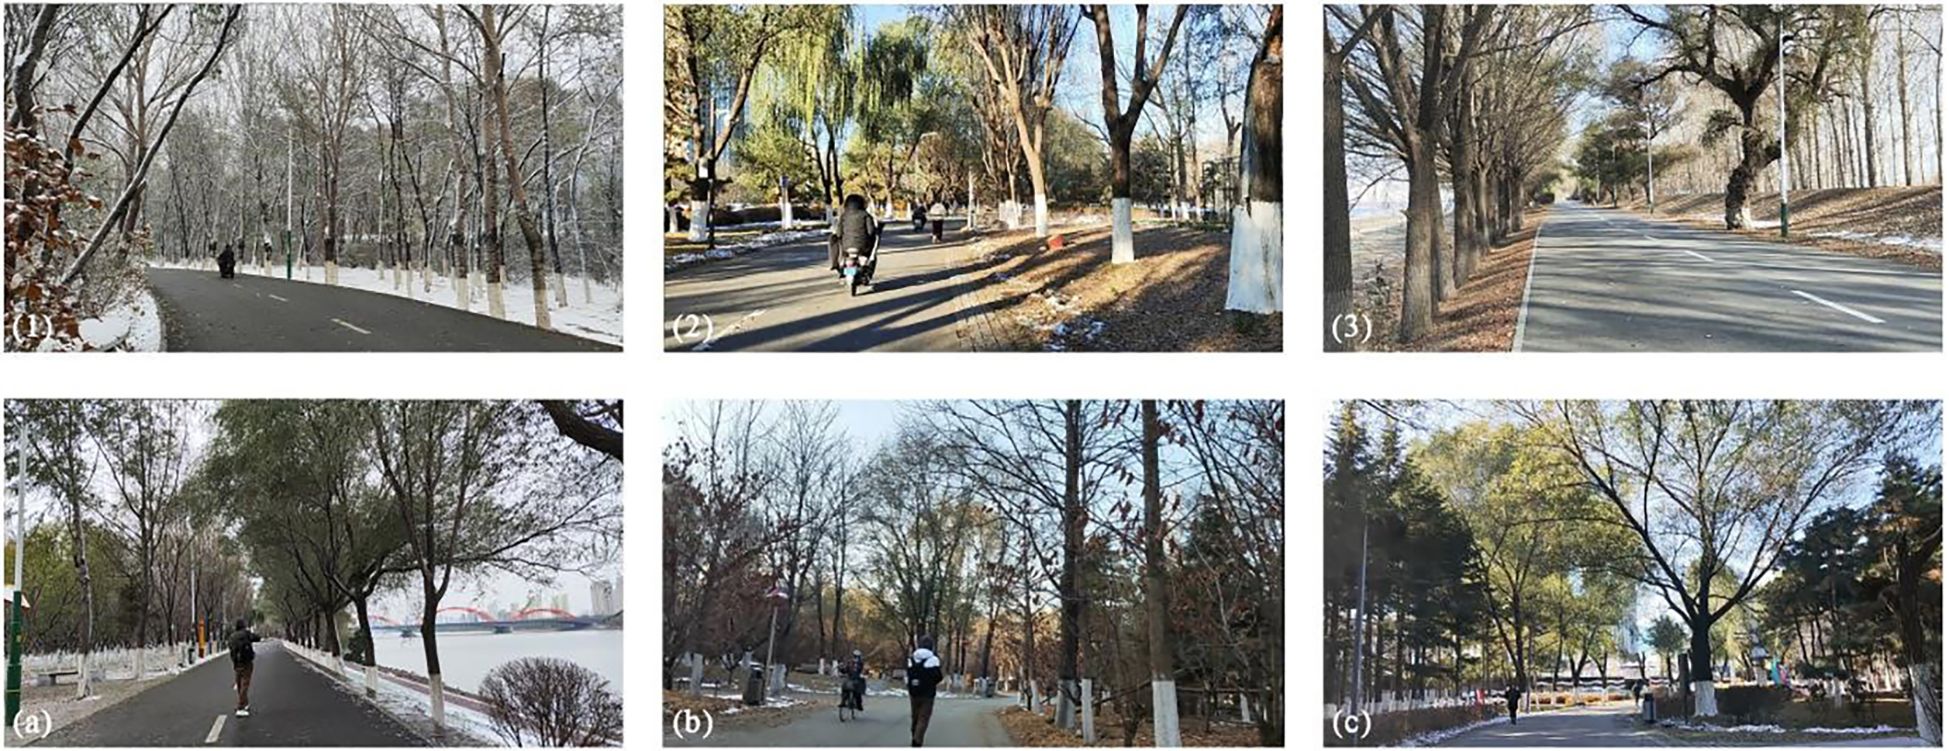
Figure 2. Habitat characteristics at different urbanization gradients (1-3) and distances from riverbanks (A–C).
The bird field surveys were conducted from December 2023 to January 2024, with each survey encompassing all the sample line transects and completed within two days. Surveys were conducted once a month and repeated twice during this study. Sunny, windless weekdays were selected, and field surveys were carried out within four hours after sunrise. During each survey, a group of two observers, equipped with binoculars, walked along the sample line transects in the same direction at a constant speed of 1.5 to 2 km/h. They recorded the names and numbers of birds observed within a distance of 150 m on either side of the sample line, using illustrations to distinguish between resident and migratory birds during the counting process. To minimize errors, birds that flew over the line transect without stopping and those appearing in the same direction as the travel path were not counted. Additionally, all observations were recorded by the same observer.
2.2.2 Environmental variables
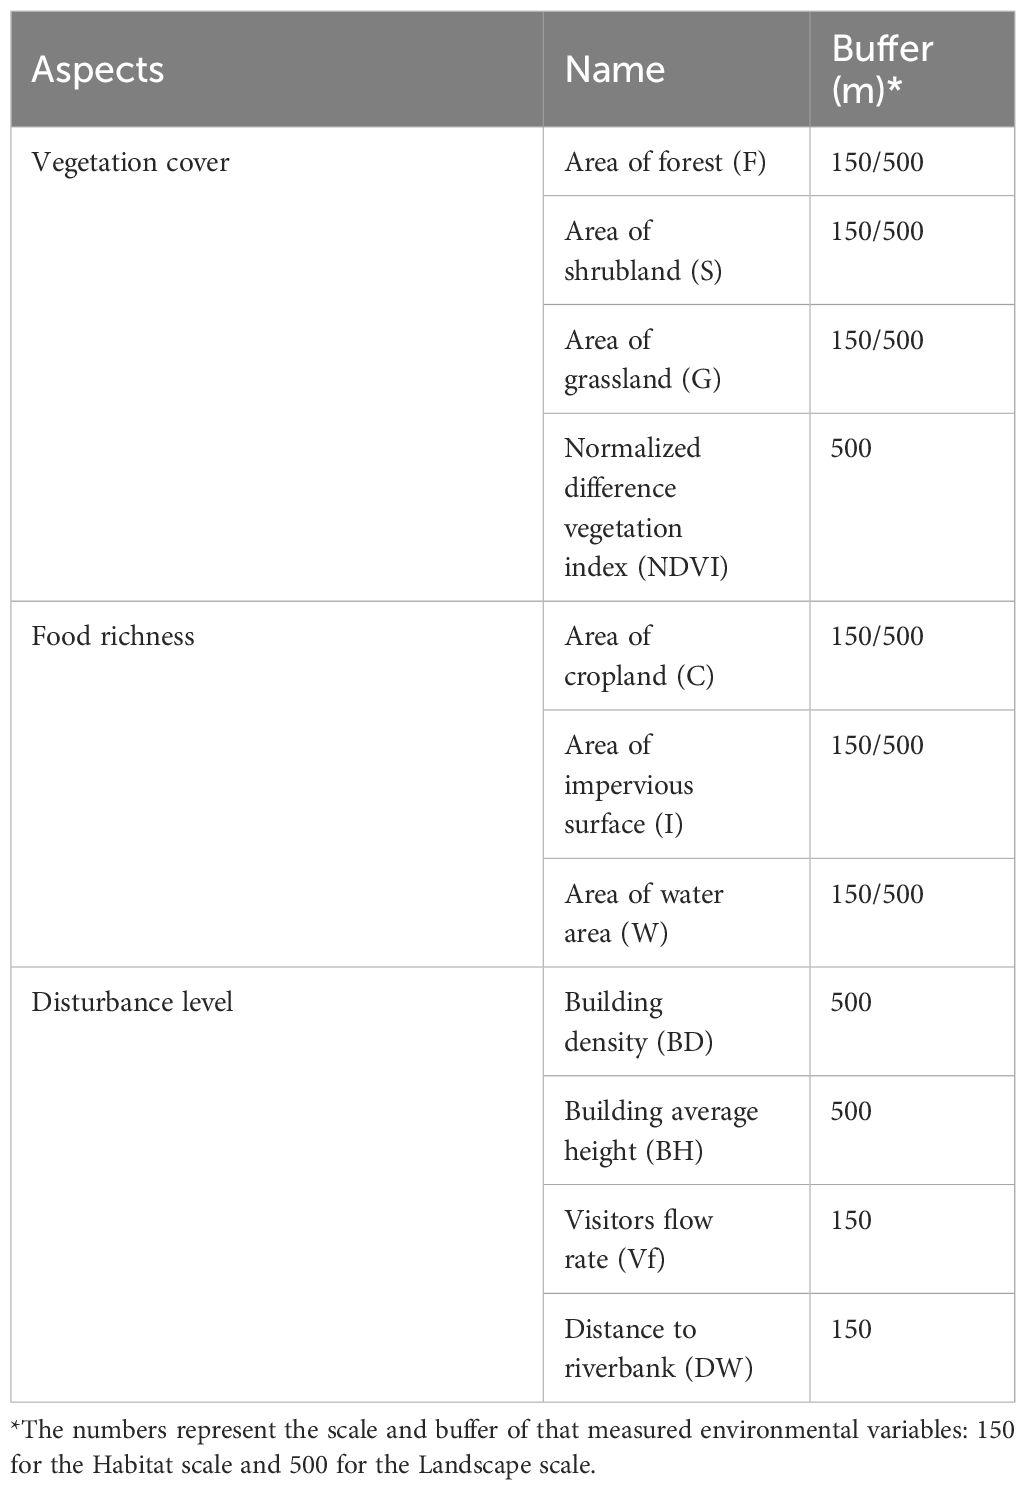
Vegetation, food availability, and disturbance intensity are three types of variables commonly used to predict bird diversity. Natural vegetation is a crucial land cover for birds, as it offers food, shelter, and breeding sites. Notably, different types of vegetation—such as trees, shrubs, and open grasslands—attract various bird species. In addition to natural vegetation, cultivated lands and wetlands serve as significant food sources for birds. Furthermore, some species that have adapted to urban environments can find food on highly urbanized surfaces. The impact of disturbance on bird populations should not be overlooked, as some studies indicate that human disturbance can affect birds even more significantly than other environmental variables (Yang et al., 2015; PIrihandi and Nurvianto, 2022; Cristaldi et al., 2017). We categorized the environmental variables of this study into 3 dimensions based on existing research: vegetation cover, food source richness, and disturbance level (Schlesinger et al., 2008; Melles et al., 2003). Numerous studies have attempted to demonstrate that environmental factors affect biodiversity differently across various scales and have confirmed the influence of scale effects. Given that environmental variables may impact bird diversity to varying degrees at different scales, we measured several environmental variables at 2 distinct scales (Melles et al., 2003). We used the buffer tool in ArcMap 10.2 to generate buffers with distances of 150 m and 500 m for each line transect, corresponding to the habitat scale and landscape scale, respectively (Hostetler and Holling, 2000). We identified 11 environmental variables, as shown in Table 1. The methods used to obtain each environmental variables are described below.
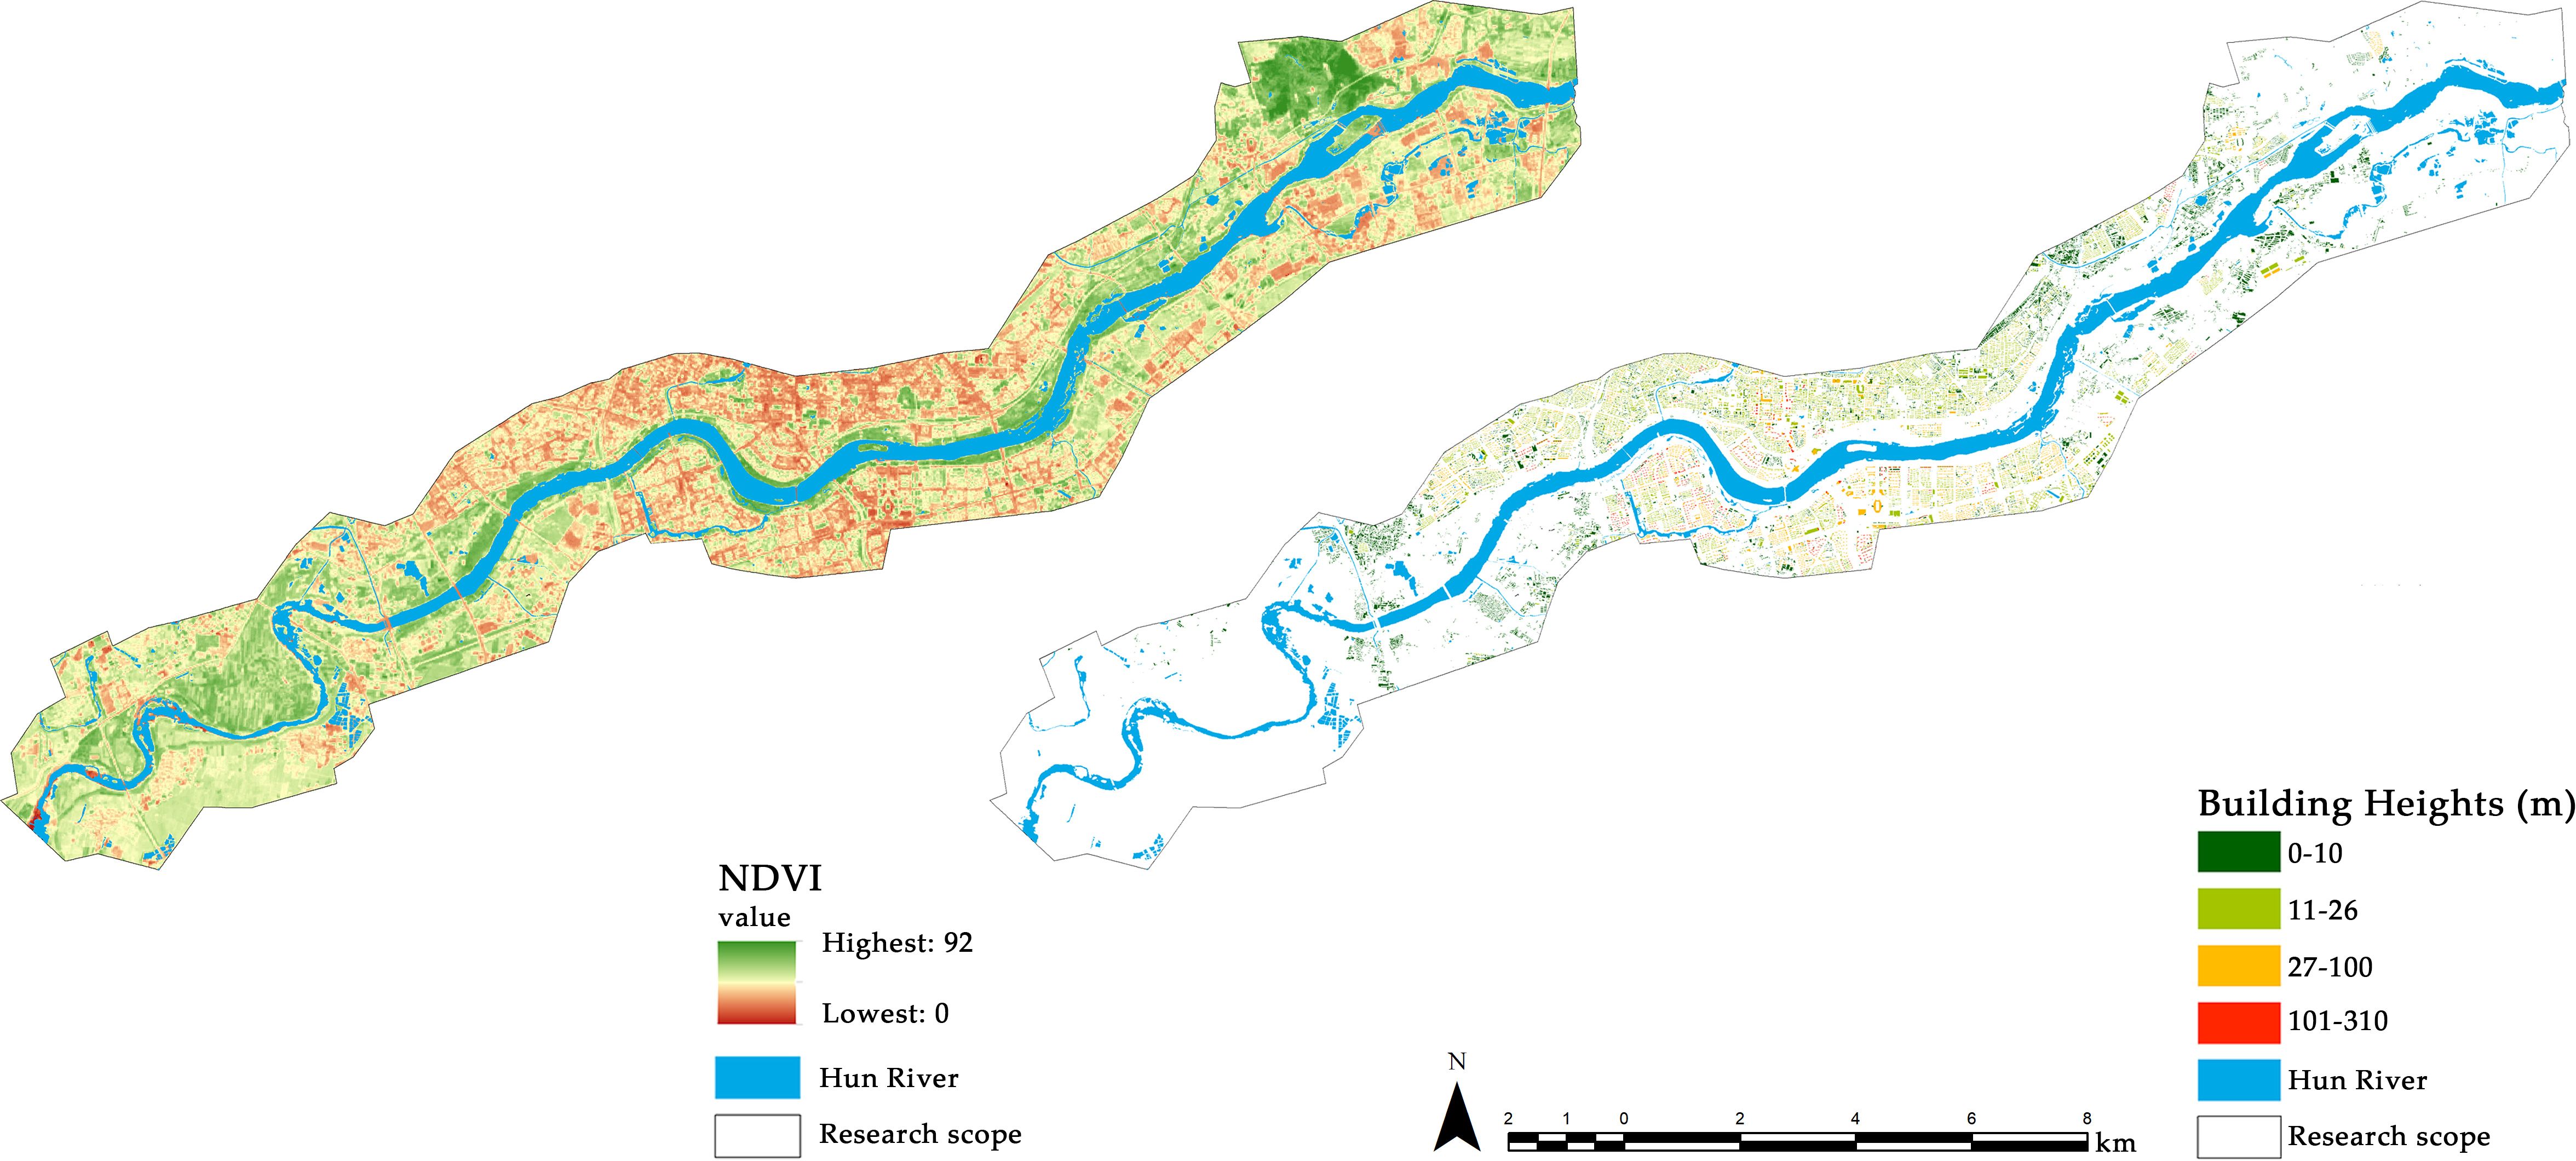
7 environmental variables related to vegetation cover and food richness were obtained in this study by quantifying land cover. We utilized high-resolution image data from March 2024, downloaded from Google Earth Pro version 7.3.6.9750. Remote sensing images within the study area were processed through operations such as rectification and mosaic cropping in ArcMap 10.2. According to the Classification of Land Use Status (GBT 21010-2017) and the classification standards adopted in related studies, the land cover within the study area was categorized into 6 types: cropland (C), forest (F), shrubland (S), grassland (G), water area (W, including both natural and artificial water) and impervious surface (I). Due to the challenges in accurately depicting the extent of unfrozen water on a map, we did not further differentiate frozen water areas. Land cover identification was conducted through visual interpretation in ArcGIS 10.2 (Pennington et al., 2008). We then referenced street maps and conducted field surveys to refine the interpretation results and produce a raster image of the land cover for the study area (Figure 1). To provide a more precise description of the vegetation cover in the riparian zone, we calculated the NDVI values within the study area using ArcMap 10.2 and generated raster images. We then computed the average NDVI value for each transect to represent the overall vegetation cover across the transects (Figure 3). We utilized the two buffer scales generated above to crop the land cover and NDVI layers, resulting in two sets of environmental variable samples for 24 transects.
For the disturbance level, we selected 4 variables: average building height (BH), building density (BD), visitor flow rate (Vf), and average distance of transects from the riverbank (Dw). The building height and area data were obtained from OpenStreetMap (https://www.openstreetmap.org/) and subsequently cropped (Figure 3). For the environmental variables mentioned above, we cropped the land cover maps using each buffer layer to obtain data files for 24 line transects at two different scales and extracted the data using spatial statistical tools. The human flow rate was determined through field surveys. During the bird surveys, an observer recorded the number of visitors passing through each line transect over a period of 10 to 15 minutes.
2.2.3 Urbanization levels
Researchers accept that there is a corresponding change in bird abundance and diversity along the gradient of urbanization, transitioning from rural areas to urban centers. The level of urbanization can be evaluated through various indicators, with the percentage of impervious surfaces serving as a critical measure of land cover, reflecting the extent of human impact on the environment. Additionally, many researchers have employed the distance from the city center as a metric for the urbanization rate at the sample site (PIrihandi and Nurvianto, 2022; Batáry et al., 2018). In this study, we used the impervious surface area and the distance from the city center to classify the urbanization gradient of 24 transects (Díaz-Pacheco and García-Palomares, 2014). The center of the city was established at the intersection of Qingnian Street and Daxi Road (41°47′23″N, 123°25′36″E). We added this central point to ArcMap 10.2. The 24 transects were converted into points, and the distances between these points and the city center were calculated using the point distance tool. We used the natural transect classification method, which used the impervious area at the landscape scale and the distance from the city center to classify the urbanization level of each transect. Since our study area encompasses only the urban core and the surrounding emerging sprawl, there is insufficient environmental variation to warrant dividing our sample into successive gradients of urbanization. Therefore, we opted to categorize our sample into two urbanization gradients: the urban core area (UCA) and the urban expansion area (UEA). This approach also effectively describes the environmental changes within the study area (Clergeau et al., 2001; Lin et al., 2011). The classification results are presented in Figure 4 and Supplementary Table A1. 14 transects in urban expansion area, which are located in suburban regions at the city’s periphery. The landscape along this gradient is characterized by extensive monoculture plantation forests or cultivated land, with a low number of human visitors during the winter months. In contrast, 10 transects in the urban core area, primarily concentrated in the city center. The landscape along this gradient is marked by a high proportion of impermeable surfaces, a more homogeneous environment, and a greater number of visitors in winter.
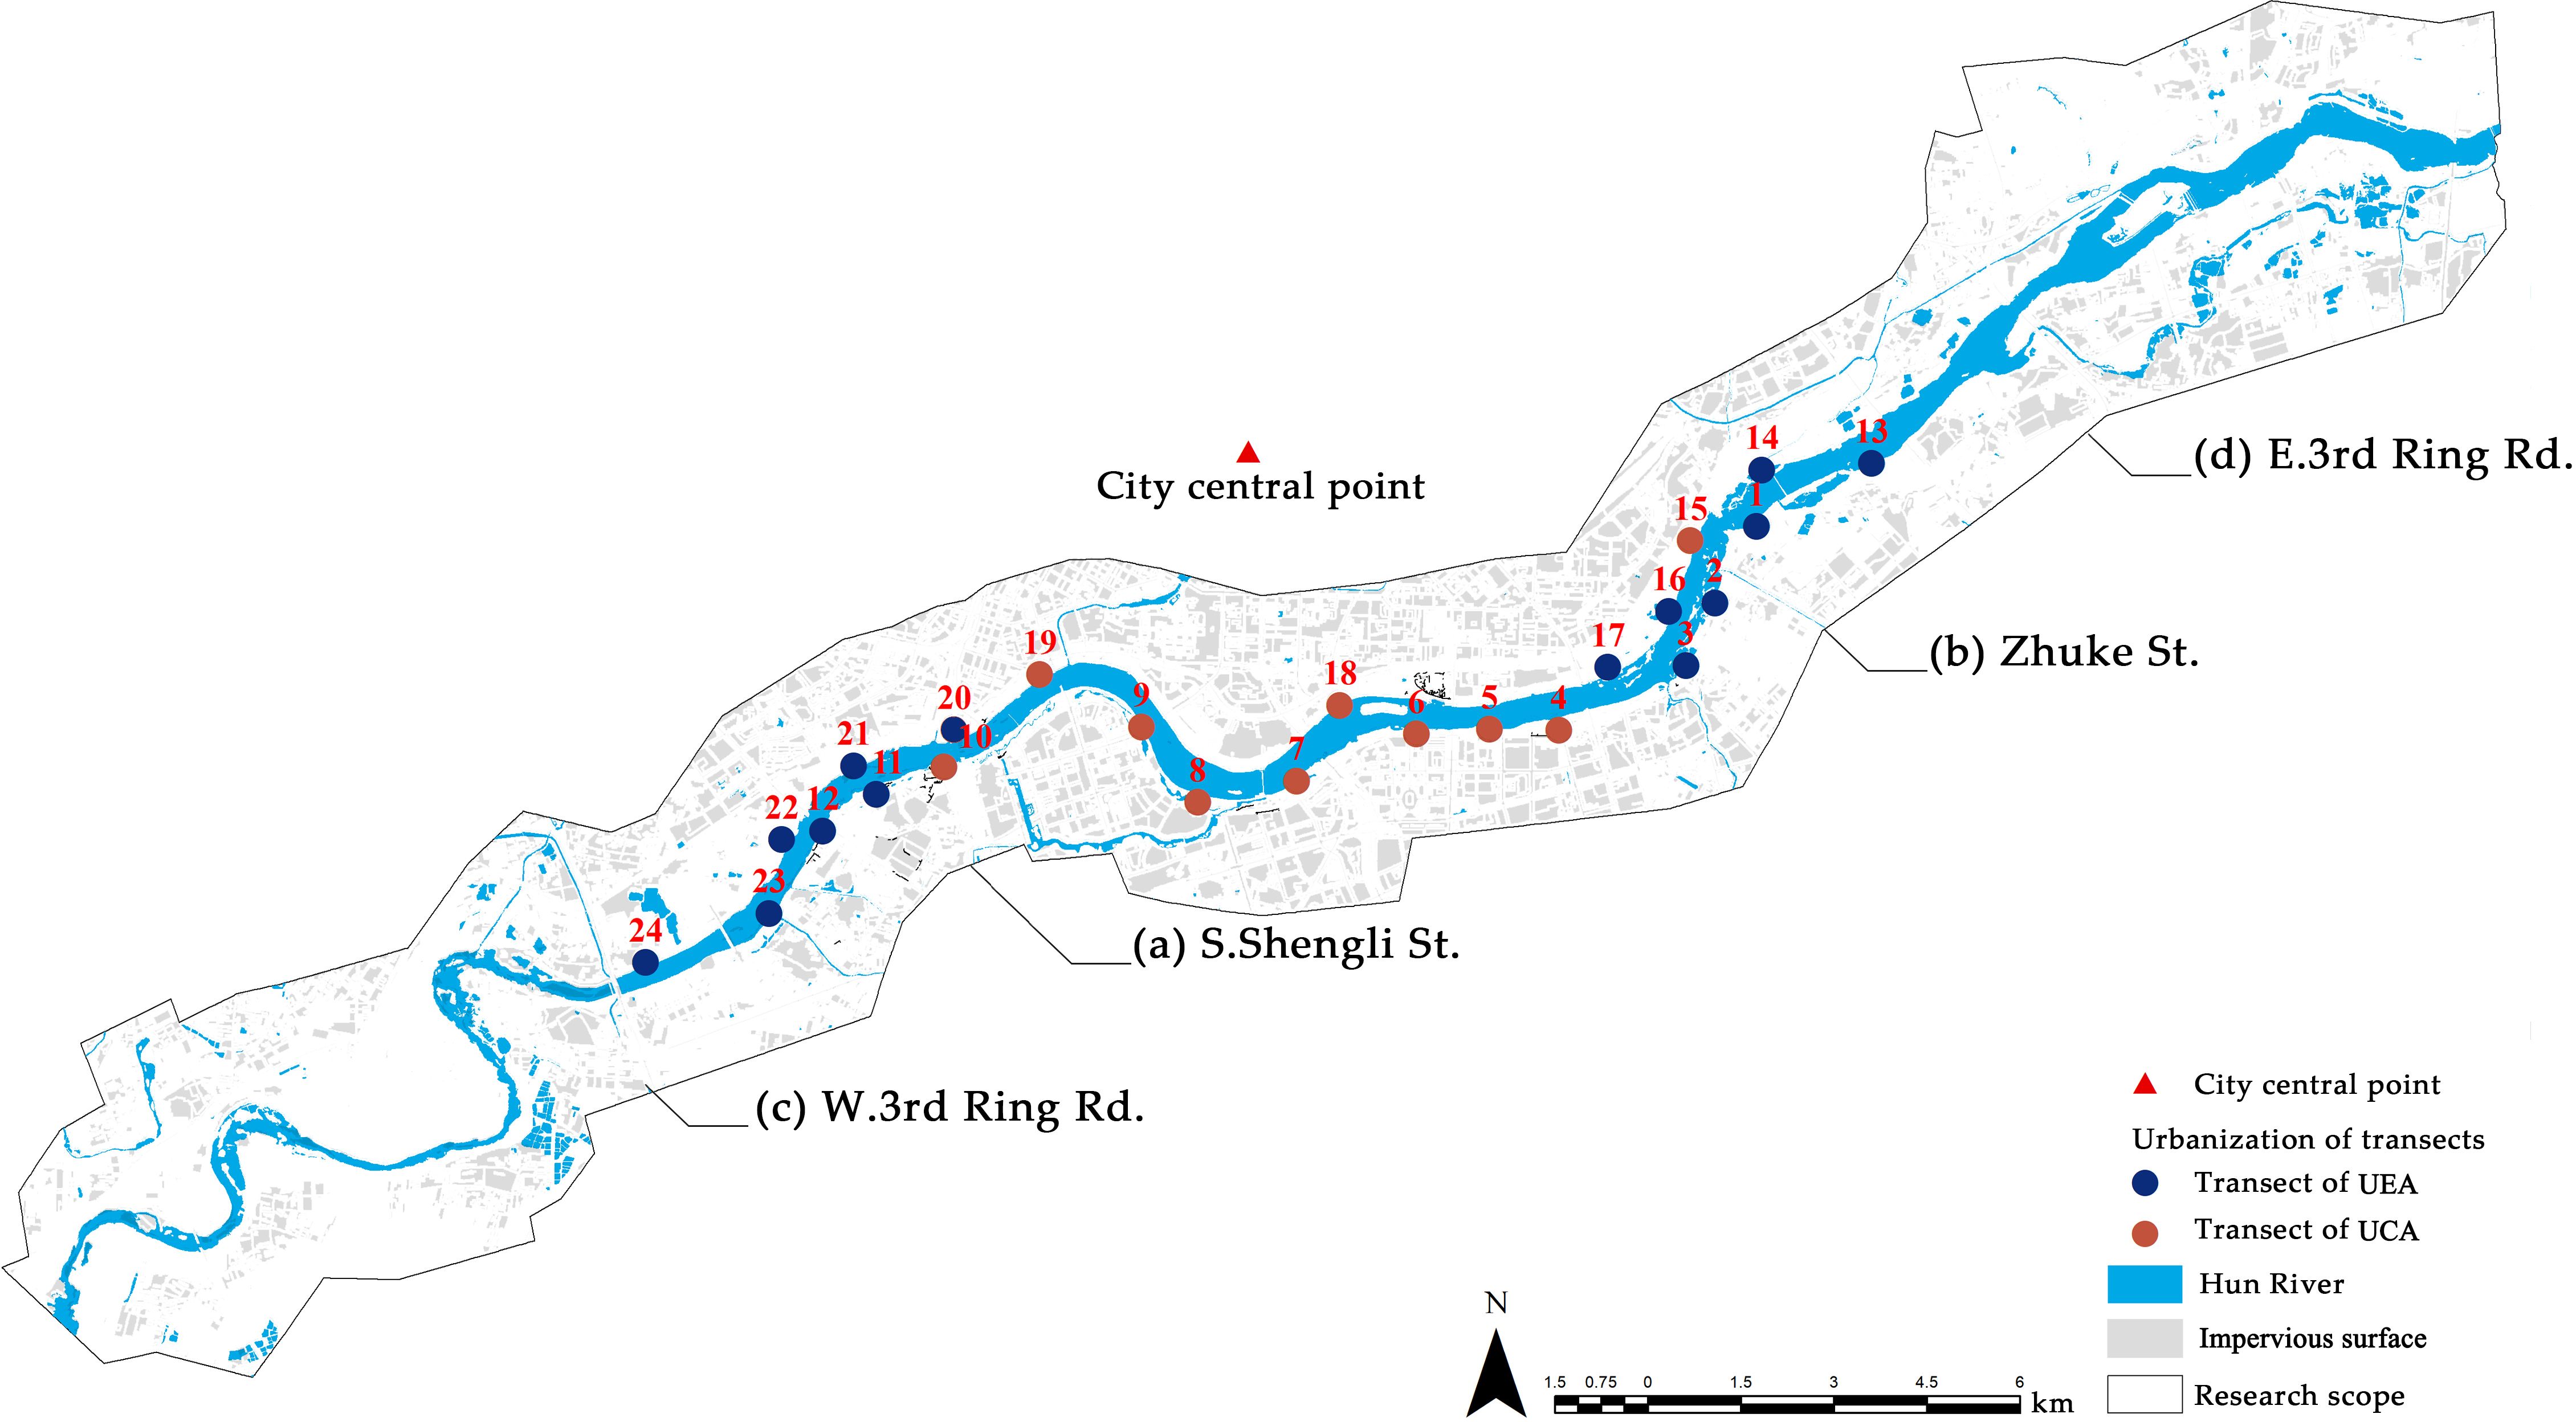
Figure 4. Urbanization gradient division of 24 transects. In this figure, all transacts are represented by points. Blue points represent transacts in the urban expansion area, while red points represent transacts in the urban core area.
2.3 Data processing and analysis
2.3.1 Biodiversity metrics calculation
We used 4 biodiversity metrics: bird richness (BR), bird abundance (BA), Simpson’s diversity index (BSI), and Shannon diversity index of bird communities (BSH) to assess bird diversity across 24 transects. Statistical calculations for these metrics were performed using Excel 2019 and Past 4.13 (Crooks et al., 2004). The equations for each bird diversity metrics are as follows:
For bird richness
Where S is the number of bird species recorded on each transect.
For bird abundance
where ni is the number of individuals of bird i recorded on each transect.
The Simpson diversity index was used.
where ni is the number of individuals of bird i recorded on each transact and n is the total number of all birds’ individuals.
The Shannon-Winner diversity index was used.
where: ni is the number of individuals of bird i recorded on each transact and n is the total number of all birds’ individuals.
2.3.2 Data analysis
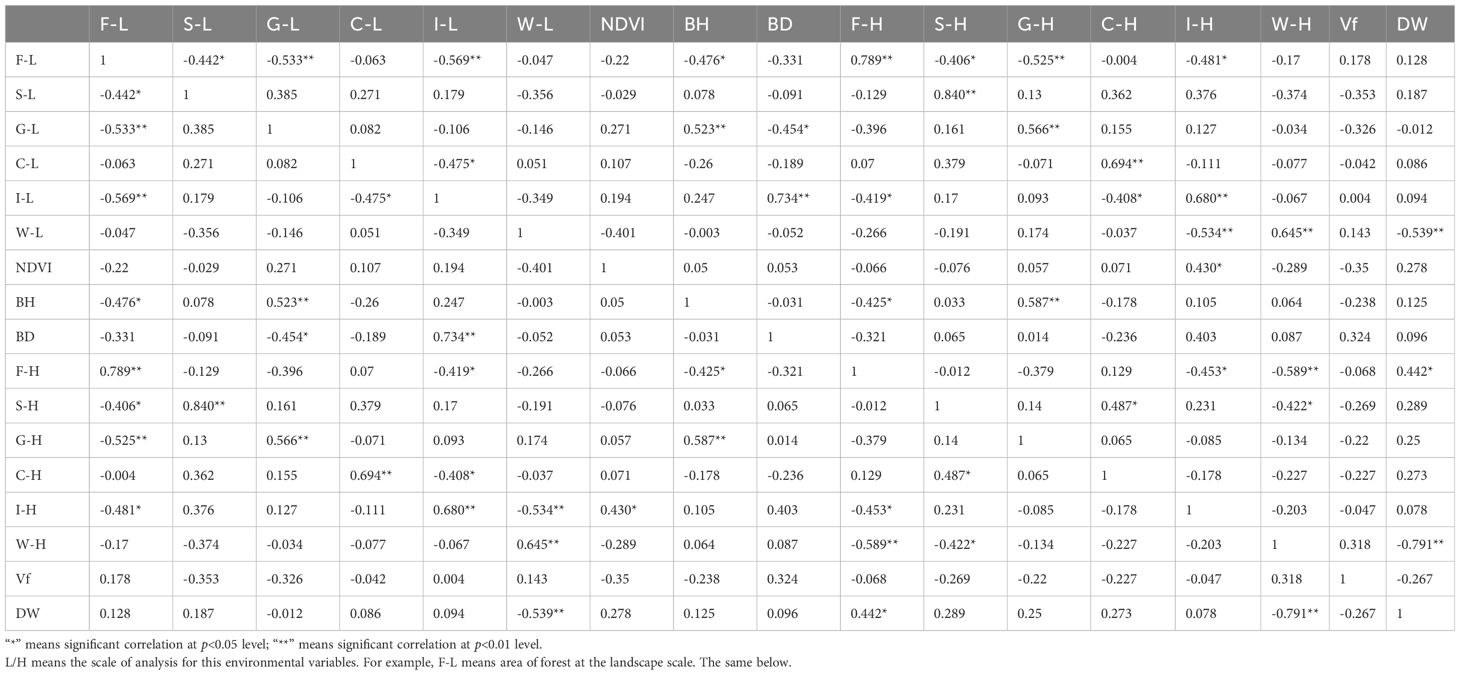
All data analyses in this study were conducted using SPSS 26.(IBM SPSS Version 26, IBM Corp., Armonk, NY, USA). Before examining the relationships between bird diversity and the environmental variables, we performed Pearson correlation analyses on each pair of the 17 environmental variables to assess potential multicollinearity. The results indicated that several environmental variables were highly correlated with one another (Table 2). Consequently, we addressed the issue of multicollinearity through principal component analysis (PCA). To prevent any influence on the subsequent discussion of scale effects, PCA was conducted exclusively on variables measured at the same scale.
7 landscape-scale variables (F-L, S-L, G-L, C-L, I-L, BH, BD) and 6 habitat-scale variables (F-H, S-H, C-H, I-H, W-H, DW) were included in both sets of PCAs, while W-L, NDVI, and G-H were excluded. Since the variable Vf did not exhibit a strong correlation with any other variable, we included it as a separate component in the subsequent analyses. Prior to conducting the PCA, we standardized all variables involved. We selected components with eigenvalues greater than 1 to characterize the original environmental variables. Each component was interpreted based on its variable loadings, with the variable having the highest score for each component carrying greater weight in defining its characteristics. Finally, we utilized the newly synthesized components from the PCA as independent variables in subsequent analyses to reduce the influence of multiple factors while preserving trends in the original environmental variables (Kaiser, 1960).
To determine how components representative of environmental variables affect winter bird communities, we introduced 7 environmental components as explanatory variables into CANOCO 5.0 for redundancy analysis (RDA). This approach allowed us to further investigate the significance and explanatory power of various environmental variables on bird diversity metrics (Hammer and Harper, 2001). We conducted RDA on 24 transects. To assess whether the effects of environmental components on winter bird communities varied across urbanization classes, we divided each transect into two separate groups for RDA based on the urbanization class in which it was located (UCA and UEA).
Because some birds migrate during the winter, the composition of winter bird communities changes significantly compared to that of bird communities in other seasons. To further evaluate the response of birds with different biological characteristics to changes in environmental variables, we used residence type to categorize species within the winter bird communities. Supplementary Table A2 presents the residence types of all the birds we recorded. We determined the richness of resident birds (BR-Res), the abundance of resident birds (BA_Res), the richness of migratory birds (BR_Mig), and the abundance of migratory birds (BA_Mig). We repeated the data analysis steps outlined above for each biodiversity metric (Lepš and Šmilauer, 2003).
3 Results
3.1 Bird diversity of the Hun River riparian zone in winter
A total of 2,310 birds representing 30 species from 7 orders and 17 families were recorded during the field survey (Supplementary Table A2). In the bird community of the Hun River riparian zone, Passeriformes was the taxon with the highest number of species (16 species), followed by Piciformes (5 species) and Anseriformes (4 species). The Tree Sparrow (Passer montanus) had the largest number of individuals (n = 915, relative abundance = 45.68%) and was the dominant species in the community. The recorded birds included both resident and migratory species. There were 19 species of resident birds, accounting for 63.3% of the total species, which included 12 species of Passeriformes, 5 species of Piciformes, and 1 species each of Galliformes and Podicipediformes. Migratory birds, including passage migrants, summer visitors, and winter visitors, accounted for 11 species, comprising four species each of Passeriformes and Anseriformes, as well as one species each of Gruiformes, Pelecaniformes, and Podicipediformes (MacKinnon and Phillipps, 2000; Zheng, 2017).
A total of 26 bird species were recorded in the urban expansion area, representing 86.7% of the overall bird species count, which included 18 resident species and 8 migratory species. In contrast, 20 bird species were identified in the urban core area, comprising 13 resident species and 7 migratory species. The dominant taxon in both levels was Passeriformes, with the Tree Sparrow identified as the most prevalent species; however, its relative abundance was significantly lower in the suburban area compared to the urban area (14.5% vs. 59%). The birds with the second highest abundance in the urban expansion area and urban core area were the Oriental Magpie (Pica serica, n = 137) and the Chinese Spot-billed Duck (Anas zonorhyncha, n = 124), respectively. Differences in the composition of the bird communities in suburban and urban areas are detailed in Supplementary Table A2.
Table 3 presents the diversity indices of all bird species, including both resident and migratory birds, across various urbanization levels. The diversity levels of winter bird communities in the riparian zone of the Hun River exhibited significant changes along 2 levels. The mean values of the BR, BSI and BSH of the transects in the suburban area were higher than those in the urban area; however, the BA was lower in the urban expansion area compared to the urban core area. BR_Res was slightly higher in the suburban area than in the urban area, while BA_Res was considerably lower in the urban expansion area than in the urban core area, reflecting a similar trend in the overall bird population. In contrast, both BR_Mig and BA_Mig were slightly higher in the suburban area than in the urban area. Among all the bird diversity indices, all indices, except for BA and BA_Res, decreased with increasing urbanization. Conversely, BA and BA_Res increased with the level of urbanization (Figure 5).

Table 3. The average diversity indicators of winter bird communities in the Hun River riparian zone (overall and different gradients).
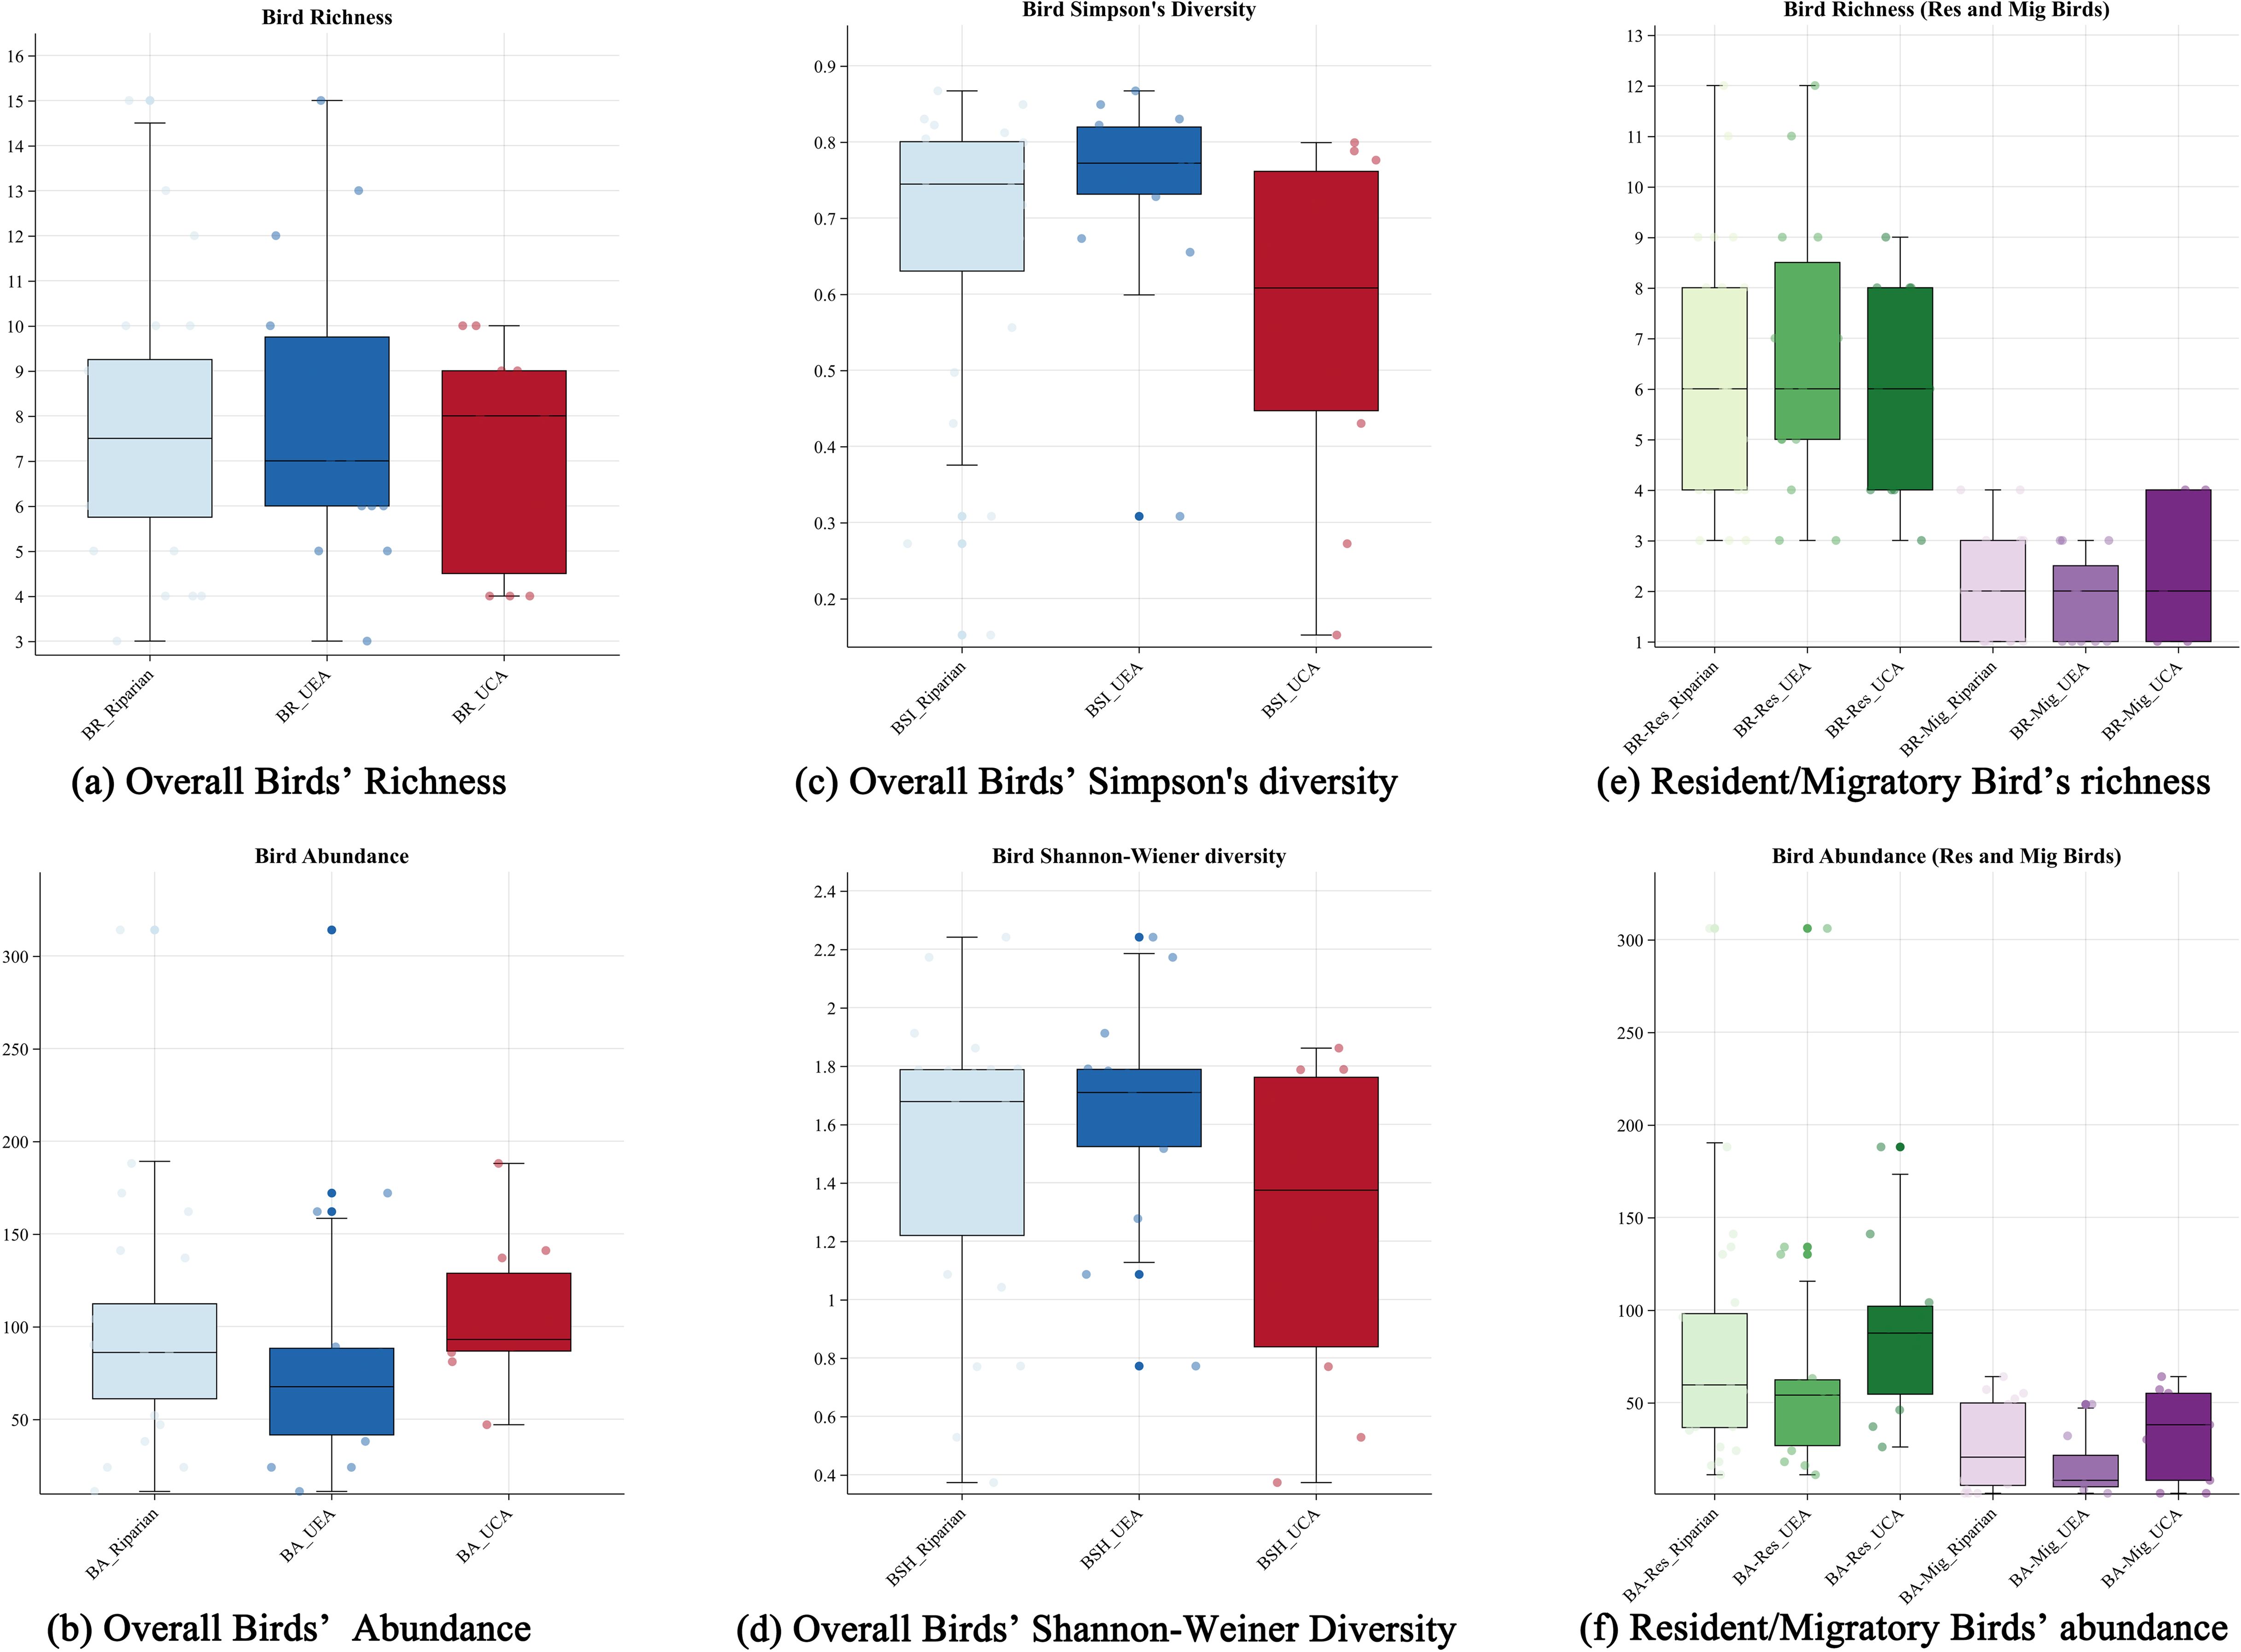
Figure 5. Box plots of winter bird community diversity metrics in the Hun River across the riparian zone, urban expansion area and urban core area. (A–D) depict overall birds, and we use blue and red to describe changes in the metrics. (E, F) describe resident and migratory birds, and we use green and purple to distinguish between resident types and color shades to describe indicator changes.
3.2 Relationships between birds and environmental variables
The results of the principal component analysis are presented in Table 4. Seventeen environmental variables were condensed into seven new components. Three variables were included at the landscape scale, collectively explaining 83.42% of the original variables. Component 1 (hereafter referred to as C1) was primarily influenced by arborvitae woodland cover and impervious surface cover; a higher value of C1 indicates greater impervious coverage, while a lower value corresponds to increased woodland cover. Component 2 (C2) was predominantly determined by grass cover and building density, reflecting the degree of openness surrounding the sample. Component 3 (C3) was mainly explained by scrub and cropland cover; a higher value of C3 indicates a larger sample perimeter. The observed scale comprises four variables and accounts for 86.38% of the original variables. Component 4 (C4) was influenced by watershed area and distance to the riverbank; higher values of C4 correspond to greater distances from the water’s edge. Component 5 (C5) was determined by tree cover and impervious surfaces, reflecting canopy cover. Component 6 (C6) was similarly influenced by scrub and cropland. To facilitate subsequent analyses, we renamed the six components as follows: C1 - Build-up, C2 - Open Vegetation, C3 - Suburban Vegetation, C4 - Water Resource, C5 - Canopy Cover, and C6 - Shrub Cover. The variable Vf was not included in the principal components; for ease of analysis, we designated it as the new component C7 - Disturbance.
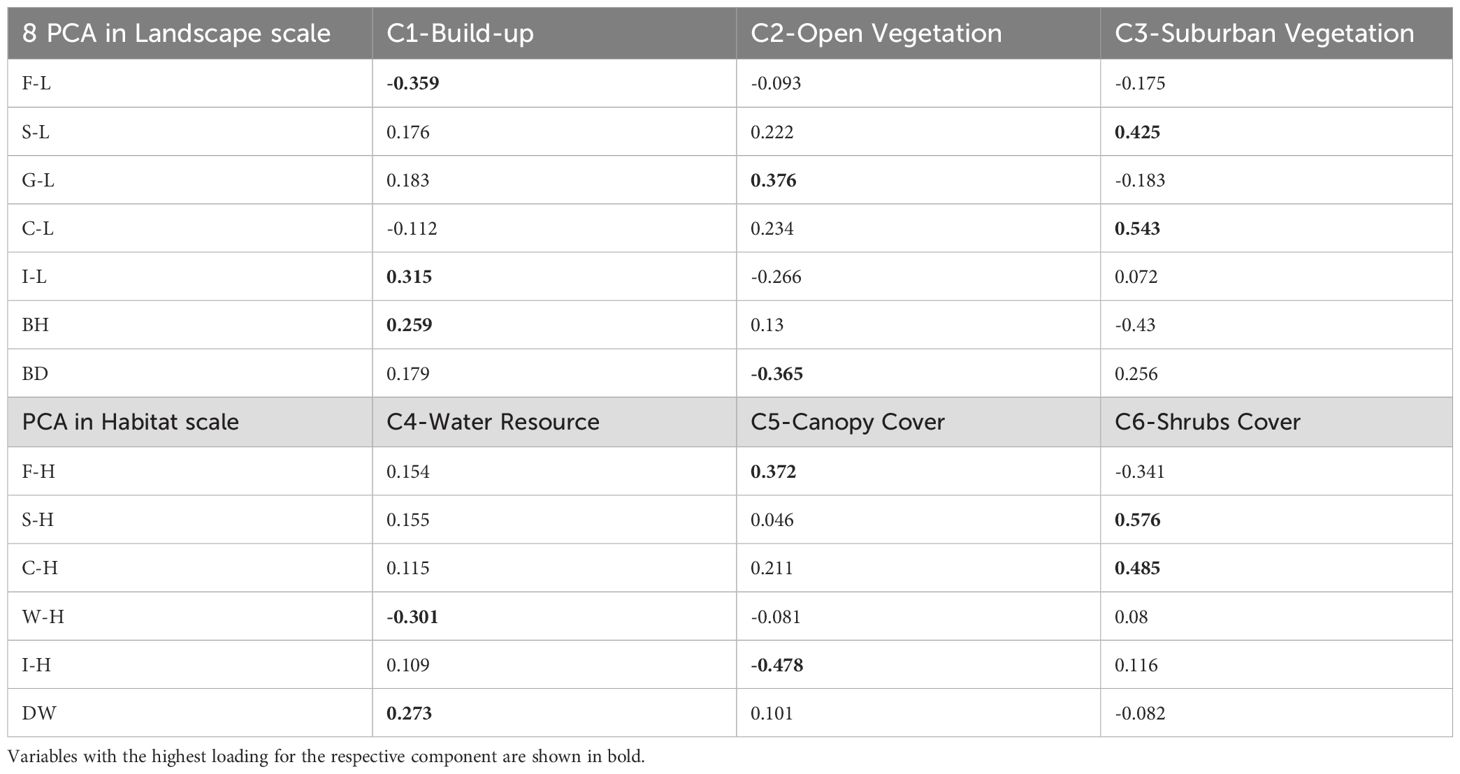
Table 4. Results from two Principal component analyses (PCA) of environmental variables of 2 scales. Each PCA yielded 3 new components, and together six components were generated.
The 7 components mentioned above were introduced as explanatory variables in the RDA to assess their significance in influencing bird diversity. The explained variance and significance of these variables, based on the RDA results, are presented in Tables 5–7. Throughout the riparian zone within the study area, environmental components explained 45.5% of the overall bird diversity, with significant impacts from disturbance and Built-up components. Environmental components explained 53.8% of the resident bird diversity, and the effects of Disturbance, Built-up, and Water Resource components on resident bird diversity metrics were also significant. In contrast, environmental components explained only 32.8% of the migratory birds. Unexpectedly, no component significantly explained the variations in migratory bird richness and abundance in the urban expansion area (Table 5). In the urban expansion area (UEA), environmental components explained 70.3% of the overall birds, and the impacts from disturbance components and open vegetation components on overall bird diversity. Environmental components explained 85% of the resident birds, and disturbance, open vegetation, and Water Resource components significantly influenced the diversity of resident birds. Environmental components explained 39.9% of the total number of migratory birds. Similar to the results of the RDA for the entire riparian area, no single component significantly explained the variations in migratory bird richness and abundance within the urban expansion area, and of the seven components, the Built-up (explained variance=16.6%, p=0.118) and Canopy Cover (explained variance=9%, p=0.304) components had a stronger influence on migratory bird richness, respectively. Within this area, the Disturbance component exerted a considerable influence on both groups of bird diversity metrics. (Table 6). In the urban core area (UCA), environmental components explained 73.8% of the overall bird population, while Disturbance and Build-up components had a significant effect on the significantly influenced overall bird diversity metrics. The environmental components explained 48.4% of the resident bird, with disturbance components having a notable impact on resident bird diversity. Additionally, environmental components explained 64.62% of the total number of migratory birds, with suburban vegetation component had a significant effect on significantly affecting migratory birds. As demonstrated in the UEA, the Disturbance component continues to be the environmental variable component that explains the greatest variation in bird community diversity (65.4% overall) (Table 7).
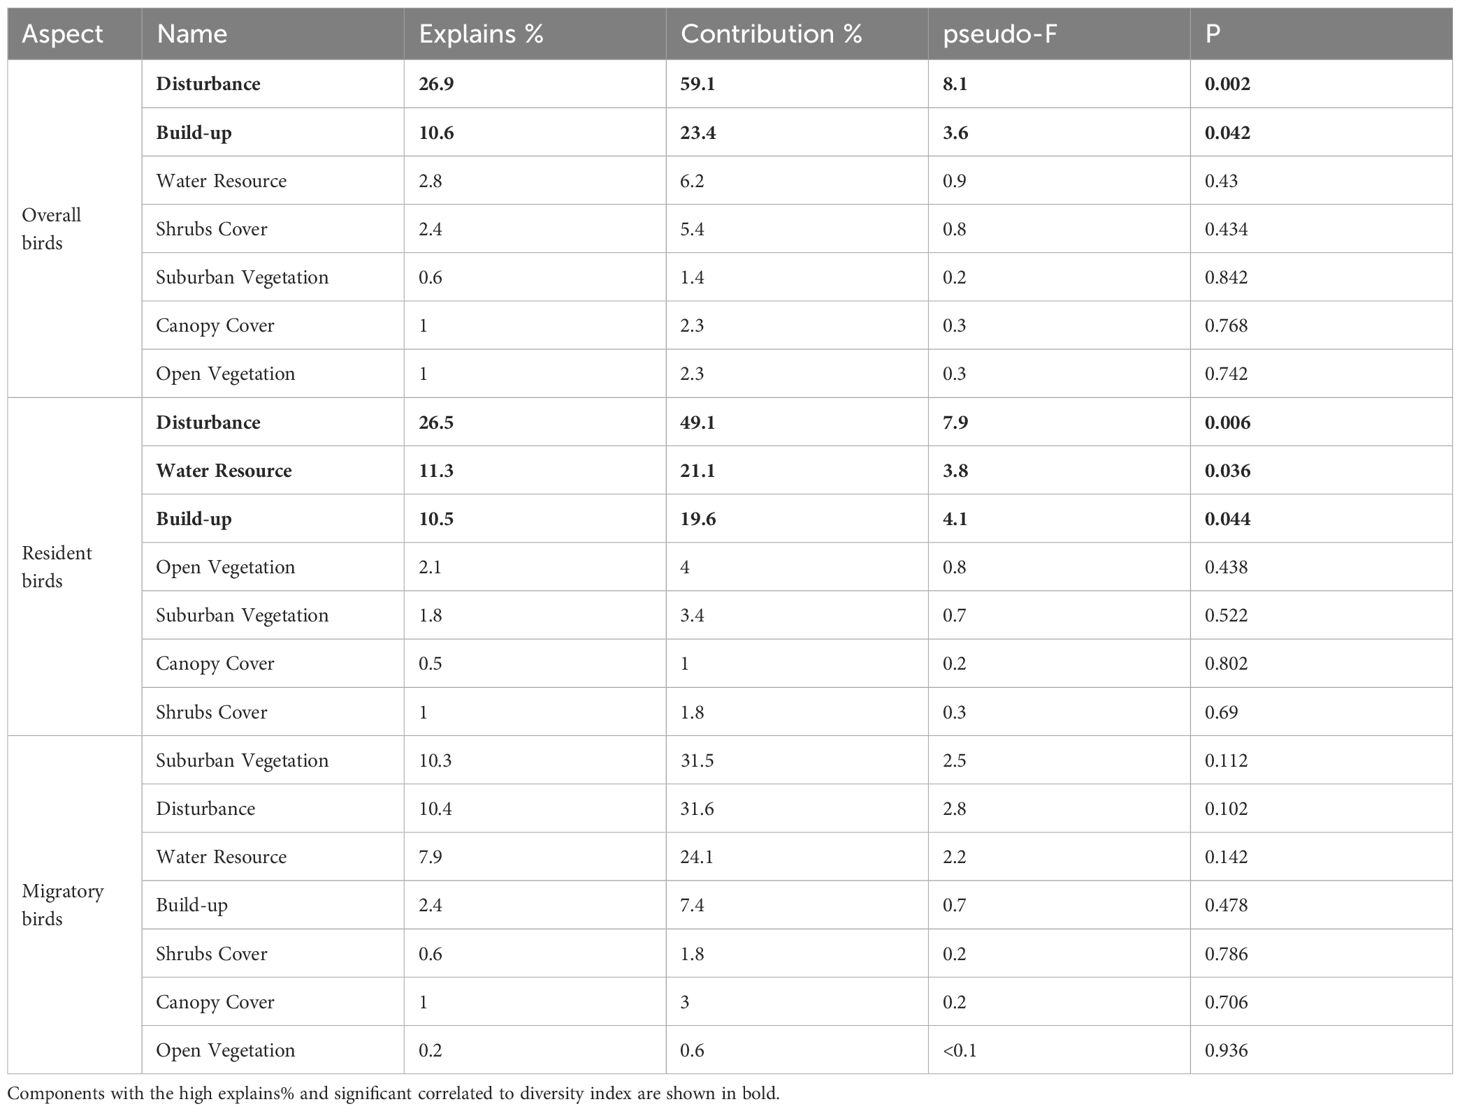
Table 5. Redundancy analysis with biodiversity metrics and influential environmental components in the Hun river riparian.
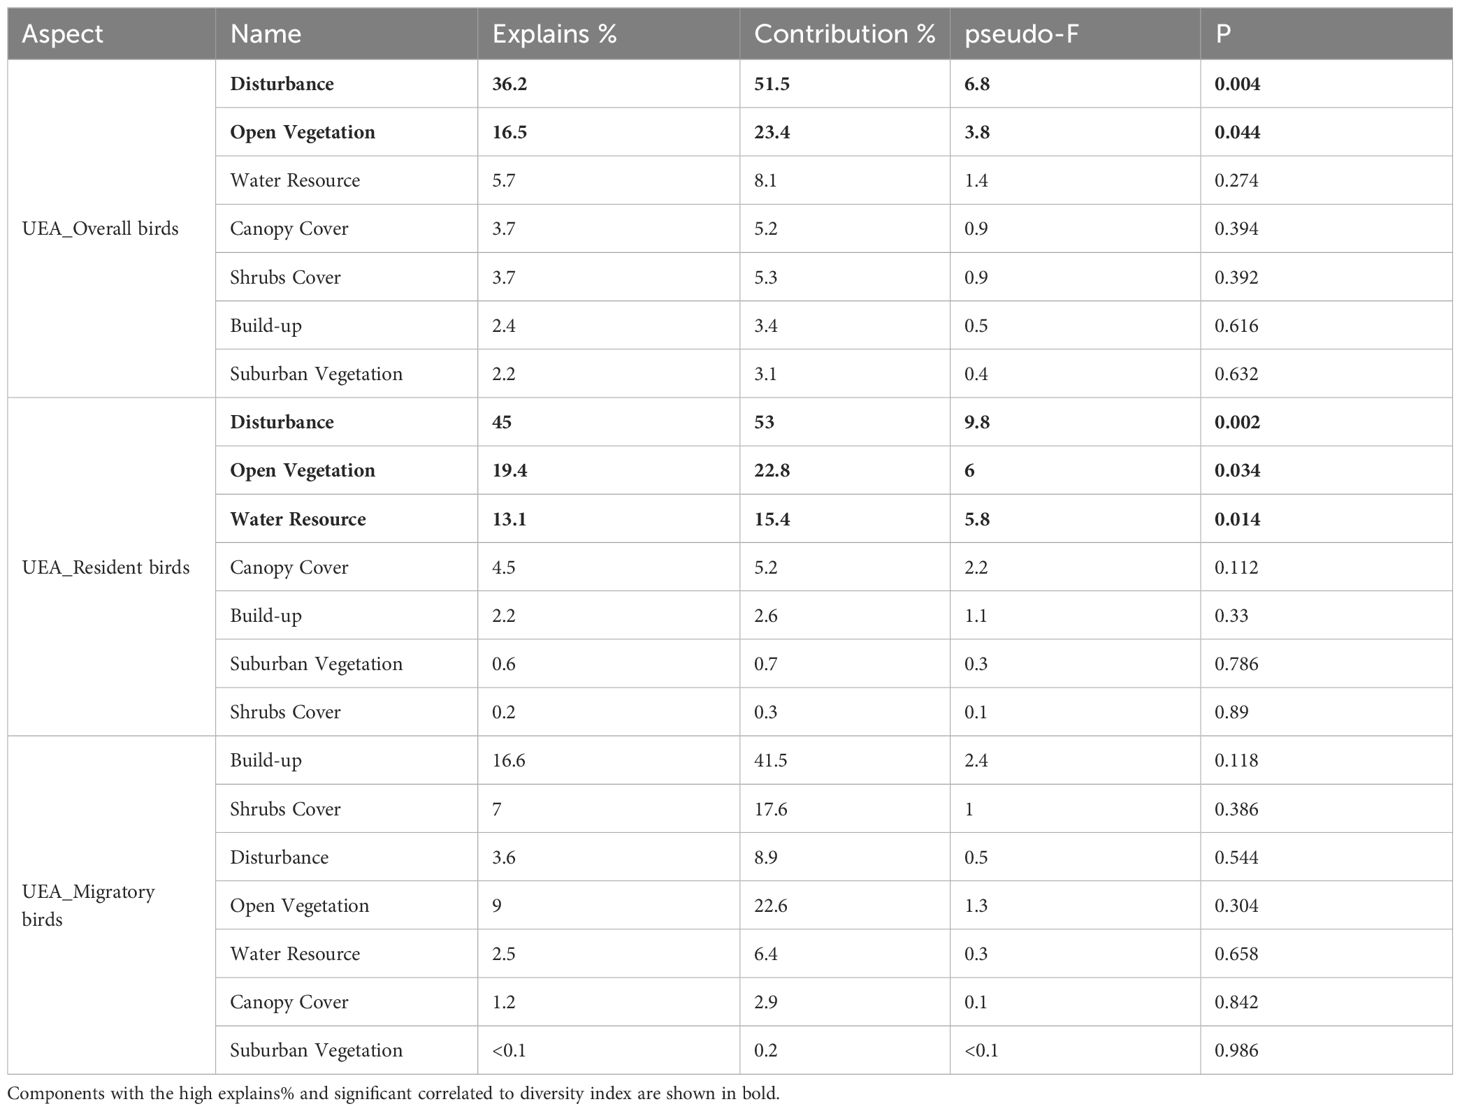
Table 6. Redundancy analysis with biodiversity metrics and influential environmental components in the urban expansion area (UEA).
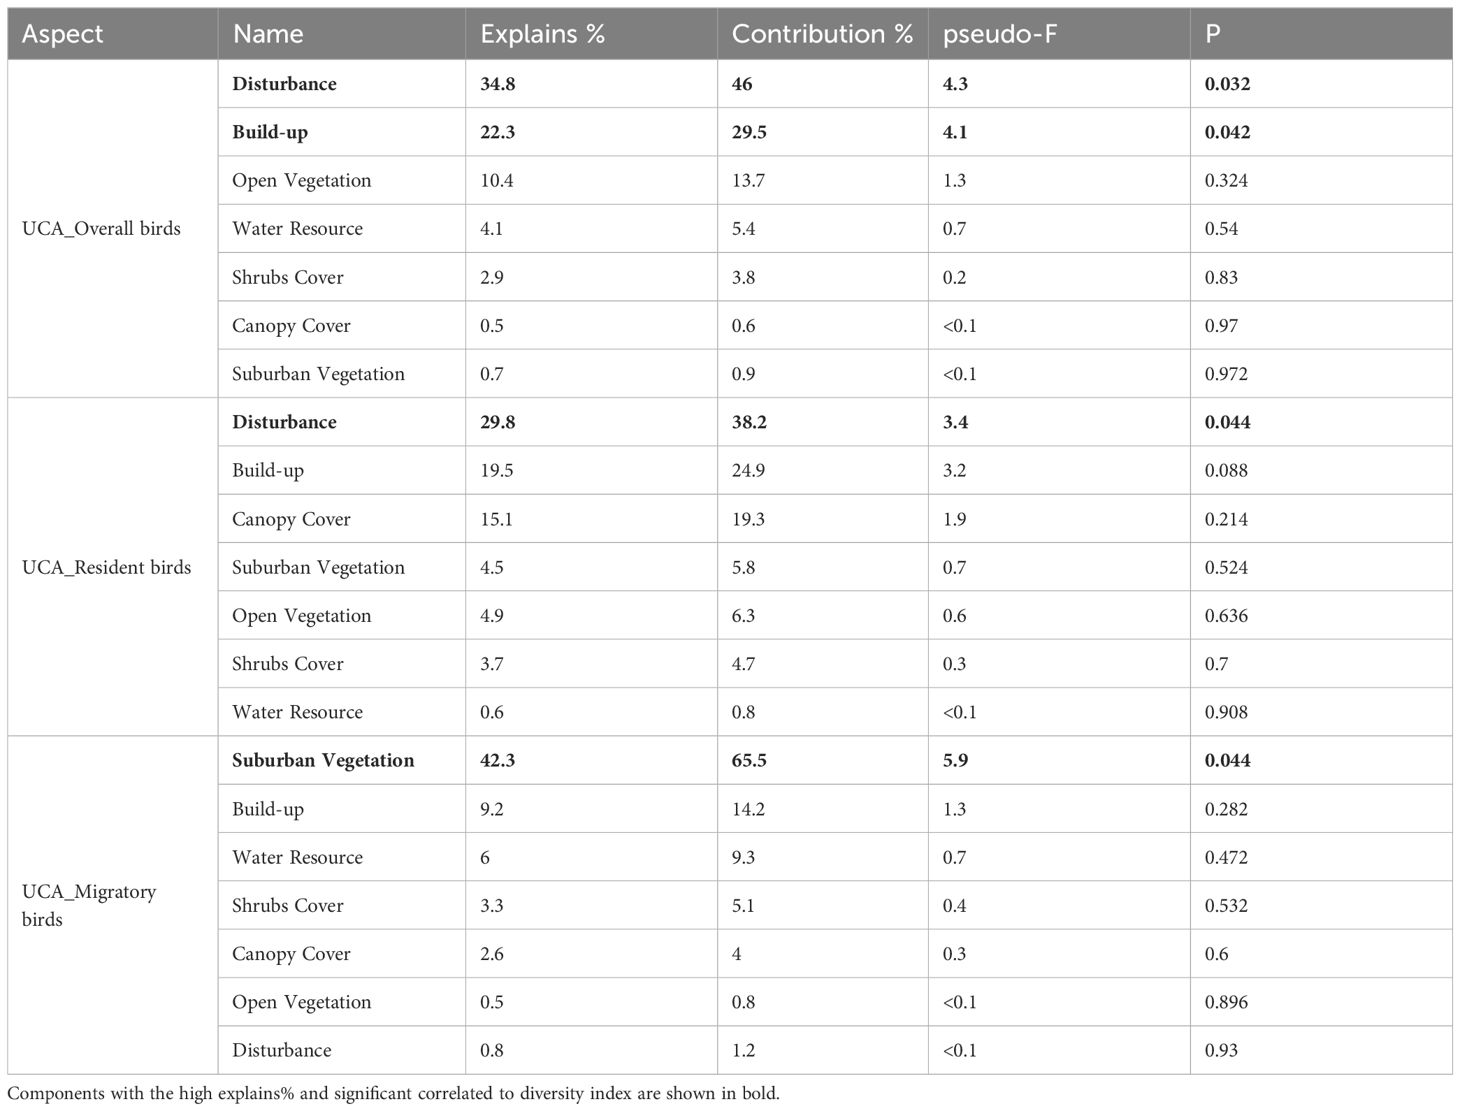
Table 7. Redundancy analysis with biodiversity metrics and influential environmental components in the urban core area.
9 sets of RDA results were obtained, revealing correlations between various environmental components and bird diversity metrics (Figure 6). In the RDA results for the entire riparian zone, urban core area and urban extension area, the disturbance component was significantly negatively correlated with all bird diversity metrics, whereas the Built-up component showed a positive correlation with most of these metrics. The relationships between components representing vegetation and food sources and bird diversity metrics exhibited corresponding changes depending on the RDA sample selection. For the entire riparian zone, the Water Resource component was positively correlated with all overall bird diversity metrics. Additionally, the Open Vegetation, Suburban Vegetation, Shrub cover, and Canopy cover components were positively correlated with bird richness, Simpson’s diversity index, and Shannon-Wiener’s diversity index, but negatively correlated with bird abundance. The Water Resource, Open Vegetation, Suburban Vegetation, and Shrub Cover components were positively correlated with resident bird abundance, while the Canopy Cover component was negatively correlated with both resident bird richness and abundance. The Open Vegetation component was positively correlated with migratory bird abundance and richness, whereas the Suburban Vegetation component was negatively correlated with these metrics. Furthermore, the Shrub Cover and Canopy Cover components were negatively correlated with migratory bird abundance and richness. The relationships between these components and the various bird diversity indicators differed between the urban expansion area and the urban core area. However, in general, there was a positive correlation between the Water Resource component and the overall number of birds, as well as resident birds, and a consistent negative correlation with migratory birds. No uniform pattern was observed for the other components reflecting vegetation cover.
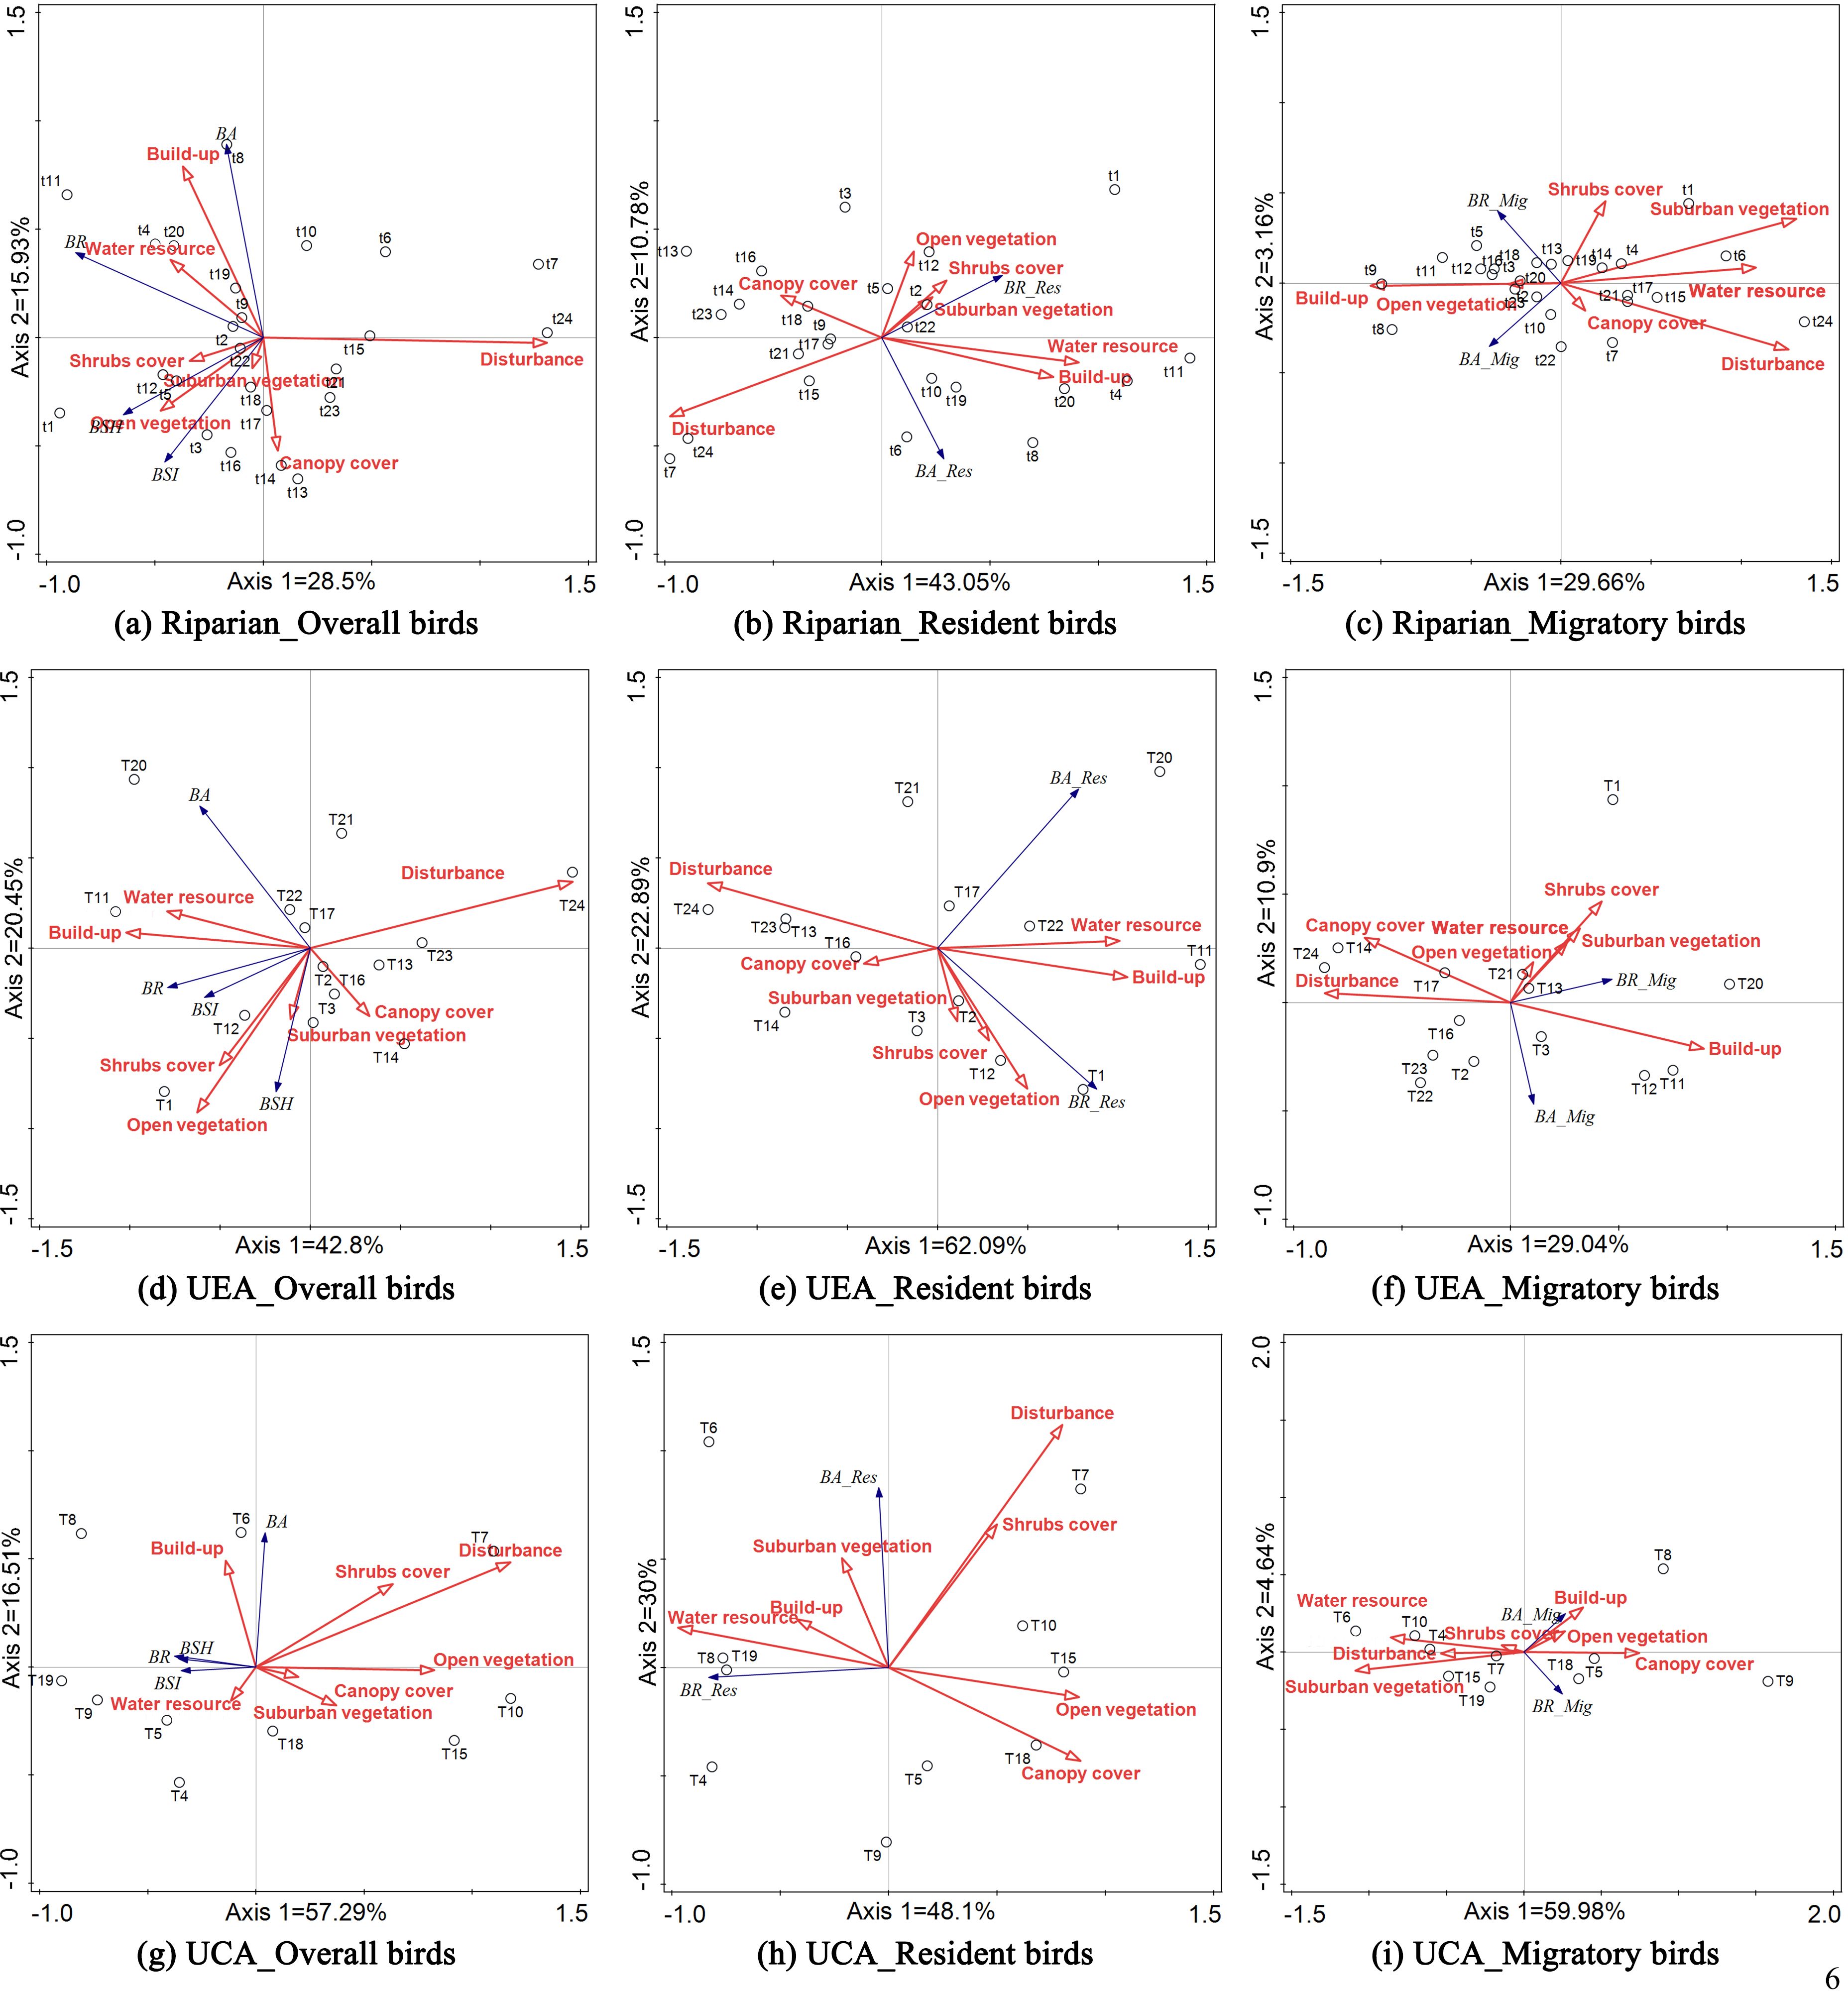
Figure 6. Redundancy analysis tri-plots showing correlation between environmental components and bird diversity metrics in the whole riparian (A–C), urban expansion area (D–F), and urban core area (G–I).
4 Discussion
4.1 Overall winter bird community response to environmental variables
Overall, the winter birds in the Hun River riparian zone were significantly affected by the Disturbance component, exhibiting a strong negative correlation with it. The Disturbance component is explained by the volume of human traffic traversing the sample strip, which indicates the direct impact of human activities in the vicinity of the transect. The negative response of bird communities to direct disturbances supports the hypothesis that human disturbance may have a more pronounced effect than other environmental variables. This finding underscores the importance of managing human activities to conserve biodiversity in urban green spaces (Matuoka et al., 2020; Stevens and Conway, 2020).
The second highest-ranked explanation for overall bird diversity was the Built-up component. This component was primarily characterized by impervious surfaces and woodland cover, which reflect the extent of impervious land within the landscape surrounding the transect. Contrary to the findings of previous studies, significant positive correlations were observed between the built-up component and overall bird abundance. We propose that these results are linked to the major component of the urban bird community and the ways in which urban birds exploit resources in winter environments. Urban bird species, who are called “urban users” or “urban dependents”, may have utilized urban resources to a greater extent than previously assumed. For instance, species such as the Oriental Magpie and Eurasian Tree Sparrow frequently roost on buildings and readily find food in urban areas where food waste accumulates (Bressler et al., 2020; Liordos et al., 2021). Additionally, structures like dikes along rivers can create flowing water surfaces that provide feeding opportunities for waterbirds, even in winter. Based on our observations, nearly all waterbird species were present in sample strips near bridges, dikes, and artificial ponds (Kucherenko, 2023). Although the other components related to vegetation and food were not particularly significant in explaining overall bird diversity, however, the positive and negative correlations between these components and bird diversity can provide valuable insights. Although the components reflecting vegetation cover and food resources (C2, C3, C5, and C6) did not significantly impact bird diversity, they exhibited overall positive correlations with the BSI and BSH. This suggests that vegetation cover positively influences the maintenance of bird diversity (Basile et al., 2021; Miguet et al., 2016; Hughes et al., 2022; Solaro and Sarasola, 2023).
4.2 Differences in the responses of resident and migratory birds to environmental variables
In addition to both exhibiting a negative response to disturbance components, resident and migratory birds demonstrate markedly different reactions to other environmental components. Resident birds were sensitive to the Disturbance, Water Resource, and Built-up component. In contrast, migratory birds were less likely to respond to Disturbance and Water Resource components but showed a stronger correlation with Suburban Vegetation component. It is evident that variations in the species composition of different resident bird taxa primarily account for the differences in their responses to environmental variables. Most winter resident birds—dominated by the Eurasian Tree Sparrow and Oriental Magpie—are skilled at exploiting resources in artificial environments, for instance, many urban birds roost on buildings. During resource-scarce winters, these birds may congregate even more towards the urban core area, as exemplified by the crows and starlings that inhabit major cities (Wilson et al., 2015). The Water Resource component reflects the water area and the distance to the Water Resource, negatively impacting the richness and abundance of resident birds. This finding contrasts with results from other seasonal studies (Keten et al., 2020; Zhang M. et al., 2022). The freezing of most water surfaces during winter causes frozen rivers to lose their function as sources of water and food for many resident birds. Consequently, resident birds exhibited significant positive correlations with the Build-up component and the Water Resource component. Although no environmental variable components demonstrated significant effects on migratory bird diversity indicators in the RDA, the top three environmental variable components, in terms of explanatory power, may still reflect migratory bird responses to environmental conditions to some extent. Regarding disturbance, the impact of human activity on migratory birds was not significant, possibly due to the considerable observation distance we employed. For the primary group of migratory birds, such as geese and ducks, human activities beyond 100m were not influential, as this distance exceeded the birds’ flight threshold (Chen et al., 2010; Wang et al., 2004). The negative correlation between migratory birds and Water Resource components indicates that, at the habitat scale, these birds are more likely to be found near riverbanks and in areas with water. Since the majority of migratory birds are waterbirds (36.3% Passeriformes and Anseriformes, and 9% Podicipediformes, Pelecaniformes, and Gruiformes), they rely heavily on aquatic environments than forest birds do. Additionally, migratory birds exhibit a negative correlation with the Suburban Vegetation component, which is primarily characterized by landscape-scale cropland and scrub cover. Higher values of this component suggest an increase in cropland and natural scrub cover surrounding the riparian zone. It can be inferred that migratory birds prefer to roost outside the riparian zone rather than within it when cropland is present within 1 km of the riparian area. This preference arises because arable land typically offers a more diverse and abundant food supply during winter compared to green fields (Grzędzicka, 2023). It may be more challenging for birds living in suburban areas to survive in winter. The positive impact of increased cultivated land on bird diversity can be attributed to the types of vegetation found in suburban green spaces. Regarding species selection for planted forests, fast-growing tree species are predominantly utilized in suburban riparian zones, however, most of these trees do not retain winter fruits and fail to provide adequate food sources. The scarcity of food plants in suburban riparian zones compels birds to seek potential nourishment in cultivated lands (Møller, 2012; Morelli, 2018; Melles et al., 2003). Combined with edge effects, this may explain the contrasting responses of bird richness and abundance to the Suburban Vegetation and Shrub Cover components. The edges of riparian zones adjacent to arable land exhibit a greater richness than the interiors of both environments. However, the interiors of riparian zones have lower species abundance compared to the exteriors, primarily due to the relatively poor food resources available within the riparian zones, while the nearby cultivated lands are more resource-rich (Henderson et al., 2004; Lee et al., 2022).
4.3 Differences in the response of winter bird communities to environmental variables between urbanization levels
The results of the present study indicate that both overall bird richness and Shannon’s diversity index decline with increasing urbanization, consistent with the findings of most previous studies (Ferenc et al., 2014). In contrast, the overall abundance of birds and resident species, exhibited an increasing trend with the degree of urbanization. This suggests the critical role of green spaces for birds in highly urbanized areas. In urban areas, green spaces serve as rare habitats for birds, supporting larger populations compared to similar areas in suburban areas, as evidenced by the urbanization gradient results (Blair, 1996; Conole and Kirkpatrick, 2011).
The results of this study also confirmed another of our hypotheses regarding the effects of the urbanization gradient: the environmental variables that significantly influence bird diversity differ between urban and suburban areas (Blair, 1996). In the UEA, bird diversity metrics other than BA were positively correlated with most components of the environmental variables reflecting plant cover. Conversely, the opposite trend was observed in the UCA. This finding aligns with previous research indicating that vegetation cover has a more pronounced effect on bird diversity in developed areas compared to urbanized areas (Conole and Kirkpatrick, 2011). The disturbance component emerged as the most significant explanatory variable at both the UCA and UEA urbanization levels, exerting a substantial negative impact on birds, irrespective of the level of urbanization. This observation is consistent with the results of earlier studies, which suggest that human disturbance at the site scale may have a considerably greater negative impact on birds than other factors (Schlesinger et al., 2008; Oneal and Rotenberry, 2009). Notably, the disturbance components accounted for a smaller proportion of the differences in bird diversity in the UCA compared to the UEA, leading us to propose that urban birds may be less sensitive to disturbance. Some studies have indicated that urban-adapted bird species exhibit greater tolerance to human disturbance than urban-avoidant species, resulting in notable differences in their diversity (Grzędzicka, 2023; Croci et al., 2008; Shryock et al., 2017).
The effects of environmental variables on both resident and migratory bird populations varied across different levels of urbanization. In the urban expansion area, the number of resident birds showed a significant positive correlation with the Open Vegetation component, in the urban core area, the number of resident birds was significantly positively correlated with the Built-up component. This finding aligns with studies conducted in various seasons, suggesting that grasses may provide foraging sites for certain bird species that feed on insects or grains (Guo et al., 2019). Resident birds responded positively to open vegetation in areas undergoing urban expansion, and exhibited a strong positive response to impervious surfaces in urban core areas. We speculate that these results stem from differences in resource utilization by bird communities along the urbanization gradient. The bird surveys indicated that the richness and abundance of natural resource-dependent birds, such as pheasants and woodpeckers, were greater in suburban areas (BR=61.11%, BA=24.17%), In contrast, urban-adapted birds, such as tree sparrows and magpies—species that thrive in urban environments and effectively utilize human resources—comprised a significantly larger percentage in both number and species in urban areas (BR=61.54%, BA= 95.41%). Differences in species composition lead to varying responses of resident birds to environmental variables across urbanization gradients (Grzędzicka, 2023; Croci et al., 2008), a finding that is particularly pronounced in winter (Galitsky and Lawler, 2015; Ciach and Fröhlich, 2017). However, when considered alongside the Build-up component, the present study offers a new interpretation of these results. The positive impacts of both factors on bird communities clearly illustrate how landscape heterogeneity can enhance regional bird diversity. The two components reflect the degree of heterogeneity in the riparian zone landscape. In urban riparian zones dominated by woodland cover, appropriate impervious surfaces and grasslands contribute to the creation of heterogeneous environments, which provide increased foraging opportunities for a wider variety and number of bird species.
The results regarding the response of migratory birds to environmental variables across different urbanization classes are particularly surprising. First, the relationships between migratory birds and the Build-up and Disturbance components were consistent for both UCA and UEA, likely due to the reasons described above. However, the relationships between migratory birds and the vegetation cover and food source components exhibited a complete reversal with respect to urbanization class. This shift is also related to differences in species composition across urbanization levels. In urban expansion areas, migratory birds are predominantly wintering woodland species, such as Regulus regulus and Turdus naumanni, which often rely on shrublands and grasslands for shelter and food resources. In contrast, the dominant group in urban core areas consists of waterfowl, such as Mergus merganser, for which shrublands are less appealing. This observation aligns with findings that shrublands tend to negatively impact waterbirds during non-breeding periods (Kath et al., 2009; Tian et al., 2023; Chen et al., 2019; Peterson, 2014) while positively affecting woodland birds (Ballantyne and Nol, 2011).
5 Conclusions
This article investigated the responses of winter bird communities to various environmental variables and the difference between the urban core area and the urban expansion area of these responses. Additionally, we indicated the varying responses of different bird types (resident and migratory) to these environmental factors. The study found that bird communities respond differently to environmental variables in winter compared to other seasons. Environmental factors that may increase or decrease bird diversity in other seasons can have the opposite effect in winter, with the exception of human disturbances. Birds with varying ecological habits and differing degrees of adaptation to urbanization exhibit significant differences in their responses to environmental changes. Additionally, the composition of bird communities in the Hun River riparian zone varies across different urbanization areas during winter. The environmental changes in the riparian zone, driven by urbanization—primarily land cover type, proportion, and the intensity of human disturbances—are the main reasons for this variation. This also highlights the adaptability of different bird species to urban environments. We recommend that when designing urban green spaces that promote bird diversity, attention should be given to how seasonal changes influence birds’ utilization of essential resources for survival in their environment. Additionally, the degree of urbanization surrounding these green spaces and the composition of bird species within them should also be taken into account. This consideration is especially crucial for green spaces such as riparian and coastal zones that traverse areas with varying levels of urbanization.
Data availability statement
The raw data supporting the conclusions of this article will be made available by the authors, without undue reservation.
Author contributions
CW: Conceptualization, Data curation, Formal Analysis, Investigation, Methodology, Software, Visualization, Writing – original draft, Writing – review & editing. YD: Conceptualization, Funding acquisition, Resources, Supervision, Validation, Writing – review & editing. ZL: Validation, Writing – review & editing. QW: Conceptualization, Methodology, Resources, Validation, Writing – review & editing.
Funding
The author(s) declare financial support was received for the research, authorship, and/or publication of this article. Project supported by the Key Research and Development Program Project of Liaoning Province (No. 2024JH2/102500091). Project supported by the Department of Education Science and Research Platform Construction Project of Liaoning Province (No. LJ232410153071).
Acknowledgments
We would like to thank Cong Wang for assistance in collecting environmental data, Hongyan Yin and Chunlin Li for their suggestions on the writing of our manuscript.
Conflict of interest
The authors declare that the research was conducted in the absence of any commercial or financial relationships that could be construed as a potential conflict of interest.
Publisher’s note
All claims expressed in this article are solely those of the authors and do not necessarily represent those of their affiliated organizations, or those of the publisher, the editors and the reviewers. Any product that may be evaluated in this article, or claim that may be made by its manufacturer, is not guaranteed or endorsed by the publisher.
Supplementary material
The Supplementary Material for this article can be found online at: https://www.frontiersin.org/articles/10.3389/fevo.2024.1479231/full#supplementary-material
References
Adler K., Jedicke E. (2022). Landscape metrics as indicators of avian community structures–a state of the art review. Ecol. Indic. 145, 109575. doi: 10.1016/j.ecolind.2022.109575
Andersen A. H., Clausen K. K., Normand S., Vikstrøm T., Moeslund J. E. (2023). The influence of landscape characteristics on breeding bird dark diversity. Oecologia. 201, 1039–1052. doi: 10.1007/s00442-023-05351-8
Andrade R., Bateman H. L., Franklin J., Allen D. (2018). Waterbird community composition, abundance, and diversity along an urban gradient. Landsc Urban Plan. 170, 103–111. doi: 10.1016/j.landurbplan.2017.11.003
Ballantyne K., Nol E. (2011). Nesting habitat selection and hatching success of Whimbrels near Churchill, Manitoba, Canada. Waterbirds. 34, 151–159. doi: 10.1675/063.034.0203
Basile M., Storch I., Mikusiński G. (2021). Abundance, species richness and diversity of forest bird assemblages–The relative importance of habitat structures and landscape context. Ecol. Indic. 133, 108402. doi: 10.1016/j.ecolind.2021.108402
Batary P., Kurucz K., Suarez-Rubio M., Chamberlain D. E. (2018). Non-linearities in bird responses across urbanization gradients: A meta-analysis. Global Change Biol. 24, 1046–1054. doi: 10.1111/gcb.13964
Blair R. B. (1996). Land use and avian species diversity along an urban gradient. Ecol. Appl. 6, 506–519. doi: 10.2307/2269387
Brawn J. D., Robinson S. K., Thompson III, F. R. (2001). The role of disturbance in the ecology and conservation of birds. Annu. Rev. Ecol. Syst. 32, 251–276. doi: 10.1146/annurev.ecolsys.32.081501.114031
Brennan S. P., Schnell G. D. (2005). Relationship between bird abundances and landscape characteristics: the influence of scale. Environ. Monit. Assess. 105, 209–228. doi: 10.1007/s10661-005-3694-x
Bressler S. A., Diamant E. S., Tingley M. W., Yeh P. J. (2020). Nests in the cities: adaptive and non-adaptive phenotypic plasticity and convergence in an urban bird. Proc. R. Soc. B. 287, 20202122. doi: 10.1098/rspb.2020.2122
Chen L., Liu H., Liu Y., Yang P., Zhang (2019). G. Analysis on the variation of waterbird communities in different habitats of khanka lake in China. Scientia Silvae Sinicae. 55, 56–65. doi: 10.11707/j.1001-7488.20190107
Chen J., Zhou L., Xu R., Han D., Liu B., Cao L., et al. (2010). A preliminary study on bird diversity in shore habitats of chaohu lake. Chin. J. Zoology. 45, 139–147. doi: 10.13859/j.cjz.2010.03.021
Chin A. T. M., Ruppert J. L. W., Shrestha N., Fortin M. J. (2022). Urban avian conservation planning using species functional traits and habitat suitability maping. Land. 11, 1831. doi: 10.3390/land11101831
Ciach M., Fröhlich A. (2017). Habitat type, food resources, noise and light pollution explain the species composition, abundance and stability of a winter bird assemblage in an urban environment. Urban Ecosyst. 20, 547–559. doi: 10.1007/s11252-016-0613-6
Clergeau P., Jokimäki J., Savard J. P. L. (2001). Are urban bird communities influenced by the bird diversity of adjacent landscapes? J. Appl. Ecol. 38, 1122–1134. doi: 10.1046/j.1365-2664.2001.00666.x
Clergeau P., Savard J. P. L., Mennechez G., Falardeau G. (1998). Bird abundance and diversity along an urban-rural gradient: a comparative study between two cities on different continents. Condor. 100, 413–425. doi: 10.2307/1369707
Collins L., Paton G. D., Gagné S. A. (2021). Testing the likeable, therefore abundant hypothesis: bird species likeability by Urban residents varies significantly with species traits. Land. 10, 487. doi: 10.3390/land10050487
Conole L. E., Kirkpatrick J. B. (2011). Functional and spatial differentiation of urban bird assemblages at the landscape scale. Landsc Urban Plan. 100, 11–23. doi: 10.1016/j.landurbplan.2010.11.007
Cristaldi M. A., Giraudo A. R., Arzamendia V., Bellini G. P., Claus J. (2017). Urbanization impacts on the trophic guild composition of bird communities. J. Nat. Hist. 51, 2385–2404. doi: 10.1080/00222933.2017.1371803
Croci S., Butet A., Clergeau P. (2008). Does urbanization filter birds on the basis of their biological traits. Condor. 110, 223–240. doi: 10.1525/cond.2008.110.issue-2
Crooks K. R., Suarez A. V., Bolger D. T. (2004). Avian assemblages along a gradient of urbanization in a highly fragmented landscape. Biol. Conserv. 115, 451–462. doi: 10.1016/S0006-3207(03)00162-9
de Albuquerque F. S., Bateman H. L., Boehme C., Allen D. C., Cayuela L. (2021). Variation in temperature, precipitation, and vegetation greenness drive changes in seasonal variation of avian diversity in an urban desert landscape. Land. 10, 480. doi: 10.3390/land10050480
Díaz-Pacheco J., García-Palomares J. C. (2014). A highly detailed land-use vector map for Madrid region based on photo-interpretation. J. Maps. 10, 424–433. doi: 10.1080/17445647.2014.882798
Doherty P. F., Grubb T. C. (2000). Habitat and landscape correlates of presence, density, and species richness of birds wintering in forest fragments in Ohio. Wilson Bulletin. 112, 388–394. doi: 10.1676/0043-5643(2000)112[0388:HALCOP]2.0.CO;2
Ferenc M., Sedláček O., Fuchs R. (2014). How to improve urban greenspace for woodland birds: site and local-scale determinants of bird species richness. Urban Ecosyst. 17, 625–640. doi: 10.1007/s11252-013-0328-x
Fernández-Juricic E. (2000). Bird community composition patterns in urban parks of Madrid: the role of age, size and isolation. Ecol. Res. 15, 373–383. doi: 10.1046/j.1440-1703.2000.00358.x
Galitsky C., Lawler J. J. (2015). Relative influence of local and landscape factors on bird communities vary by species and functional group. Landsc Ecol. 30, 287–299. doi: 10.1007/s10980-014-0138-4
Gregory A., Spence E., Beier P., Garding E. (2021). Toward best management practices for ecological corridors. Land. 10, 140. doi: 10.3390/land10020140
Grünwald J., Auniņš A., Brambilla M., Escandell V., Eskildsen D. P., Chodkiewicz T., et al. (2024). Ecological traits predict population trends of urban birds in Europe. Ecol. Indic. 160, 111926. doi: 10.1016/j.ecolind.2024.111926
Grzędzicka E. (2023). Assessing the role of invasive weeds in the impact of successional habitats on the bird assemblage in overgrowing agriculture. J. Nat. Conserv. 72, 126352. doi: 10.1016/j.jnc.2023.126352
Guo S., Su C., Saito K., Cheng J., Terada T. (2019). Bird communities in urban riparian areas: Response to the local-and landscape-scale environmental variables. Forests. 10, 683. doi: 10.3390/f10080683
Hammer Ø., Harper D. A. (2001). Past: paleontological statistics software package for education and data analysis. Palaeontol. Electron. 4, 1.
Henderson I. G., Vickery J. A., Carter N. (2004). The use of winter bird crops by farmland birds in lowland England. Biol. Conserv. 118, 21–32. doi: 10.1016/j.biocon.2003.06.003
Herrando S., Weiserbs A., Quesada Lara J., Ferrer i Parareda X., Paquet J. I. (2012). Development of an urban bird indicator: using data from monitoring schemes in two large European cities. Anim. Biodivers Conserv. 35, 141–150. doi: 10.32800/abc.2012.35.0141
Hooper D. U., Adair E. C., Cardinale B. J., Byrnes J. E., Hungate B. A., Matulich K. L., et al. (2012). A global synthesis reveals biodiversity loss as a major driver of ecosystem change. Nature. 486, 105–108. doi: 10.1038/nature11118
Hostetler M., Holling C. S. (2000). Detecting the scales at which birds respond to structure in urban landscapes. Urban Ecosyst. 4, 25–54. doi: 10.1023/A:1009587719462
Huang Y., Zhao Y., Li S., von Gadow K. (2015). The effects of habitat area, vegetation structure and insect richness on breeding bird populations in Bei**g urban parks. Urban For Urban Green. 14, 1027–1039. doi: 10.1016/j.ufug.2015.09.010
Hughes A. C., Orr M. C., Lei F., Yang Q., Qiao H. (2022). Understanding drivers of global urban bird diversity. Global Environ. Change. 76, 102588. doi: 10.1016/j.gloenvcha.2022.102588
Jokimäki J., Suhonen J. (1998). Distribution and habitat selection of wintering birds in urban environments. Landsc Urban Plan. 39, 253–263. doi: 10.1016/S0169-2046(97)00089-3
Kaiser H. F. (1960). The application of electronic computers to factor analysis. Educ. Psychol. Meas. 20, 141–151. doi: 10.1177/001316446002000116
Kath J., Maron M., Dunn P. K. (2009). Interspecific competition and small bird diversity in an urbanizing landscape. Landsc Urban Plan. 92, 72–79. doi: 10.1016/j.landurbplan.2009.02.007
Keten A., Eroglu E., Kaya S., Anderson J. T. (2020). Bird diversity along a riparian corridor in a moderate urban landscape. Ecol. Indic. 118, 106751. doi: 10.1016/j.ecolind.2020.106751
Kucherenko V. M. (2023). The diversity-area relationship for waterbird communities in small artificial reservoirs over winter. J. Vertebrate Biol. 72, 23023–23021. doi: 10.25225/jvb.23023
Lee M. B., Chen D., Zou F. (2022). Winter bird diversity and abundance in small farmlands in a megacity of southern China. Front. Ecol. Evol. 10. doi: 10.3389/fevo.2022.859199
Lepš J., Šmilauer P. (2003). Multivariate analysis of ecological data using CANOCO (Cambridge: Cambridge university press).
Leveau L. M., Isla F. I., Bellocq M. I. (2020). From town to town: Predicting the taxonomic, functional and phylogenetic diversity of birds using NDVI. Ecol. Indic. 119, 106703. doi: 10.1016/j.ecolind.2020.106703
Li X., Cao L., Ma C., Li W. (2018). Research on Avian Abundance and Their Correlation ship with Environmental Variables at Coastal Wet-land in Tianjin. Landscape Architecture. 6, 107–112. doi: 10.14085/j.fjyl.2018.06.0107.06
Lin Y. P., Chang C. R., Chu H. J., Cheng B. Y. (2011). Identifying the spatial mixture distribution of bird diversity across urban and suburban areas in the metropolis: A case study in Taipei Basin of Taiwan. Landsc Urban Plan. 102, 156–163. doi: 10.1016/j.landurbplan.2011.04.001
Liordos V., Jokimäki J., Kaisanlahti-Jokimäki M. L., Valsamidis E., Kontsiotis V. J. (2021). Niche analysis and conservation of bird species using urban core areas. Sustainability. 13, 6327. doi: 10.3390/su13116327
Liu M., Hu Y., Zhang W., Zhu J., Chen H., Xi F. (2011). Application of land-use change model in guiding regional planning: a case study in Hun-Taizi River watershed, northeast China. Chin. Geogr. Sci. 21, 10. doi: 10.1007/s11769-011-0497-6
MacKinnon J. R., Phillipps K. (2000). A field guide to the birds of China (Oxford: Oxford University Press).
Mariano-Neto E., Santos R. A. (2023). Changes in the functional diversity of birds due to habitat loss in the Brazil Atlantic Forest. Front. For. Glob. change. 6. doi: 10.3389/ffgc.2023.1041268
Marzluff J. M. (2001). “Worldwide urbanization and its effects on birds,” in Avian ecology and conservation in an urbanizing world (Norwell, Massachusetts: KAP press ), 19–47.
Mason C. F., Hofmann T. A., Macdonald S. M. (2006). The winter bird community of river corridors in eastern England in relation to habitat variables. Ornis Fennica. 83, 73–85.
Matuoka M. A., Benchimol M., de Almeida-Rocha J. M., Morante-Filho J. C. (2020). Effects of anthropogenic disturbances on bird functional diversity: A global meta-analysis. Ecol. Indic. 116, 106471. doi: 10.1016/j.ecolind.2020.106471
McKinney M. L. (2002). Urbanization, biodiversity, and conservation: the impacts of urbanization on native species are poorly studied, but educating a highly urbanized human population about these impacts can greatly improve species conservation in all ecosystems. Bioscience 52, 883–890. doi: 10.1641/0006-3568(2002)052[0883:UBAC]2.0.CO;2
McKinney M. L. (2008). Effects of urbanization on species richness: a review of plants and animals. Urban Ecosyst. 11, 161–176. doi: 10.1007/s11252-007-0045-4
Melles S., Glenn S., Martin K. (2003). Urban bird diversity and landscape complexity: species–environment associations along a multiscale habitat gradient. Conserv. Ecolo. 7, 927–930. doi: 10.5751/ES-00478-070105
Miguet P., Jackson H. B., Jackson N. D., Martin A. E., Fahrig L. (2016). What determines the spatial extent of landscape effects on species? Landsc Ecol. 31, 1177–1194. doi: 10.1007/s10980-015-0314-1
Møller A. P. (2012). Urban areas as refuges from predators and flight distance of prey. Behav. Ecology. 23, 1030–1035. doi: 10.1093/beheco/ars067
Morelli F. (2018). High nature value farmland increases taxonomic diversity, functional richness and evolutionary uniqueness of bird communities. Ecol. Indic. 90, 540–546. doi: 10.1016/j.ecolind.2018.03.035
Nagy G. G., Ladányi M., Arany I., Aszalós R., Czúcz B. (2017). Birds and plants: Comparing biodiversity indicators in eight lowland agricultural mosaic landscapes in Hungary. Ecol. Indic. 73, 566–573. doi: 10.1016/j.ecolind.2016.09.053
Oneal A. S., Rotenberry J. T. (2009). Scale-dependent habitat relations of birds in riparian corridors in an urbanizing landscape. Landsc Urban Plan. 92, 264–275. doi: 10.1016/j.landurbplan.2009.05.005
Ortega-Alvarez R., MacGregor-Fors I. (2009). Living in the big city: Effects of urban land-use on bird community structure, diversity, and composition. Landsc Urban Plan. 90, 189–195. doi: 10.1016/j.landurbplan.2008.11.003
Patankar S., Jambhekar R., Suryawanshi K. R., Nagendra H. (2021). Which traits influence bird survival in the city? A review. Land. 10, 92. doi: 10.3390/land10020092
Pennington D. N., Hansel J., Blair R. B. (2008). The conservation value of urban riparian areas for landbirds during spring migration: land cover, scale, and vegetation effects. Biol. Conserv. 141, 1235–1248. doi: 10.1016/j.biocon.2008.02.021
Peterson T. G. (2014). Wintering waterfowl use of Delta National Forest, Mississippi ([Starkville (MS)]: Mississippi State University).
PIrihandi D. R., Nurvianto S. (2022). The role of urban green space design to support bird community in the urban ecosystem. Biodiversitas J. Biol. Diversity. 23, 2137–2145. doi: 10.13057/biodiv/d230449
Schlesinger M. D., Manley P. N., Holyoak M. (2008). Distinguishing stressors acting on land bird communities in an urbanizing environment. Ecology. 89, 2302–2314. doi: 10.1890/07-0256.1
Semeraro T., Scarano A., Buccolieri R., Santino A., Aarrevaara E. (2021). Planning of urban green spaces: An ecological perspective on human benefits. Land. 10, 105. doi: 10.3390/land10020105
Shryock B., Marzluff J. M., Moskal L. M. (2017). Urbanization alters the influence of weather and an index of forest productivity on avian community richness and guild abundance in the Seattle metropolitan area. Front. Ecol. Evol. 5. doi: 10.3389/fevo.2017.00040
Solaro C., Sarasola J. H. (2023). Breeding performance is explained for coloniality and phenology but not for urbanization in a generalist raptor bird. Urban Ecosyst. 26, 743–753. doi: 10.1007/s11252-022-01319-3
Stevens B. S., Conway C. J. (2020). Predictive multi-scale occupancy models at range-wide extents: Effects of habitat and human disturbance on distributions of wetland birds. Divers. Distrib. 26, 34–48. doi: 10.1111/ddi.12995
Suri J., Anderson P. M., Charles-Dominique T., Hellard E., Cumming G. S. (2017). More than just a corridor: A suburban river catchment enhances bird functional diversity. Landsc Urban Plan. 157, 331–342. doi: 10.1016/j.landurbplan.2016.07.013
Tian B., Nong Y., Huang X., Xie Y. (2023). Spatiotemporal variations of birds under COVID-19 pandemic and implications for urban ecological planning: A case study of Hong Kong. Chin. J. Ecology. 42, 1155–1166. doi: 10.13292/j.1000-4890.202305.032
Turcotte Y., Desrochers A. (2005). Landscape-dependent distribution of northern forest birds in winter. Ecography. 28, 129–140. doi: 10.1111/j.0906-7590.2005.04047.x
Wang P., Chen S., Ding P. (2004). Flush distance: bird tolerance to human intrusion in hangzhou. Zool Res. 3, 214–220.
Wang J., Lyu Z. (2001). A historic review of world urban waterfront development. City Plann. Review. 07, 41–46.
Wang Y., Shi Y., Jin L. Y., Guan S., Huang Z. Q., He H. Y., et al. (2019). Patterns of bird nocturnal migration at Shenyang Taoxian International Airport, Northeast China. Yingyong Shengtai Xuebao. Chin. J. Appl. Ecol. 30, 292–300. doi: 10.13287/j.1001-9332.201901.008
Wang R., Xu T., Yu L., Zhu J., Li X. (2013). Effects of land use types on surface water quality across an anthropogenic disturbance gradient in the upper reach of the Hun River, Northeast China. Environ. Monit. Assess. 185, 4141–4151. doi: 10.1007/s10661-012-2856-x
Wilson R. F., Sarim D., Rahman S. (2015). Factors influencing the distribution of the invasive house crow (Corvus splendens) in rural and urban landscapes. Urban Ecosyst. 18, 1389–1400. doi: 10.1007/s11252-015-0448-6
Yang X., Tan X., Chen C., Wang Y. (2020). The influence of urban park characteristics on bird diversity in Nanjing, China. Avian Res. 11, 1–9. doi: 10.1186/s40657-020-00234-5
Yang G., Xu J., Wang Y., Ding Y., Yuan X., Pei E., et al. (2015). The influence of vegetation structure on bird guilds in an urban park. Acta Ecologica Sinica. 35, 4824–4835. doi: 10.5846/stxb201311042667
Zhang Z., Huang G. (2018). Urban ornithological research in China: a review. Acta Ecol. Sinical. 38, 3357–3367. doi: 10.5846/stxb201703290546
Zhang Y., Huang T., Hu J., Zhu J. (2022). Analysis on the habitat design strategy of community park based on the improvement of bird diversity. J. Landsc. Archit. 38, 106–111. doi: 10.19775/j.cla.2022.03.0106
Zhang M., Ran C., Teng Y., Hao P., Dong L. (2022). Correlation between bird species composition and multi-scale environmental factors in spring in Wenyu River ecological corridor of Beijing. J. Beijing For. Univ. 44, 115–127. doi: 10.12171/j.1000-1522.20210160
Zheng G. (2017). Checklist on the classification and distribution of the birds of China 3 (Beijing: Science Press).
Keywords: cold region city, riparian zones, bird diversity, environmental variables, urbanization gradient
Citation: Wu C, Dong Y, Liang Z and Wang Q (2025) Response of winter bird communities to environmental variables in riparian zones of cold region: a case study in Shenyang, Northeast of China. Front. Ecol. Evol. 12:1479231. doi: 10.3389/fevo.2024.1479231
Received: 11 August 2024; Accepted: 06 December 2024;
Published: 02 January 2025.
Edited by:
Augusto João Piratelli, Federal University of São Carlos, BrazilReviewed by:
Zsolt Végvári, Hungarian Academy of Science, HungaryYuichi Yamaura, Forestry and Forest Products Research Institute, Japan
Chan Ryul Park, National Institute of Forest Science (NIFoS), Republic of Korea
Copyright © 2025 Wu, Dong, Liang and Wang. This is an open-access article distributed under the terms of the Creative Commons Attribution License (CC BY). The use, distribution or reproduction in other forums is permitted, provided the original author(s) and the copyright owner(s) are credited and that the original publication in this journal is cited, in accordance with accepted academic practice. No use, distribution or reproduction is permitted which does not comply with these terms.
*Correspondence: Yukuan Dong, ZG9uZ3lrQHNqenUuZWR1LmNu; Qiushi Wang, d2FuZ19xc0Bzanp1LmVkdS5jbg==
 Chengrun Wu
 Yukuan Dong1,2*