 Rocio Pamela Demartín
 Romina Ghirardi1,2†
- 1Grupo de Estudio Sobre Anfibios, Laboratorio de Biodiversidad y Conservación de Tetrápodos, Instituto Nacional de Limnología Consejo Nacional de Investigaciones Científicas y Técnicas – Universidad Nacional del Litoral (INALI: CONICET-UNL), Santa Fe, Provincia de Santa Fe, Argentina
- 2Instituto de Investigaciones en Ciencias de la Salud, Facultad de Ciencias de la Salud, Universidad Católica de Santa Fe, Santa Fe, Provincia de Santa Fe, Argentina
- 3Departamento de Ciencias Naturales, Facultad de Humanidades y Ciencias, Universidad Nacional del Litoral, Santa Fe, Provincia de Santa Fe, Argentina
Habitat alteration is recognized as one of the most important drivers of biodiversity decline. Urbanization implies a major habitat alteration and its impact on biodiversity depends on type and degrees of habitat modifications. Growing cities generate great heterogeneity with respect to the uses of space that enable the preservation of a certain diversity of amphibians within the urban frame. Our objective is to understand how environments with different levels of urbanization influence local amphibian diversity. We grouped various urban green spaces of a medium-sized and growing city of Argentina in relation to natural and anthropic environmental variables which allows us to describe an urban environmental gradient and we calculate beta diversity among these groups of urban environments considering the richness, composition and abundance of amphibian at each sites’ group. From this, we analyze and tested the differences in the functional diversity of amphibians in the defined urban environmental gradient. We hypothesize that: (i) the described spatial heterogeneity would be related to an elevated beta diversity of amphibians within the urban frame; and (ii) the analysis of functional diversity would reveal a stronger biotic or abiotic filtering of the focal community. We found that groups of urban environments with an intermediate degree of urbanization can present a greater functional diversity and species richness than those that are less urbanized. We identified urban avoiders (T. typhonius, P. santafecinus and P. biligonigerus) and urban tolerant species (E. bicolor, R. arenarum, R. dorbignyi, L. macrosternum, L. latinasus, P. albonotatus, D. nanus and S. nasicus). The replacement beta diversity recorded indicated that the species assemblage changes throughout urban environmental gradient, but functionally similar species thrive in the less to the most urbanized sites, allowing them to occupy the entire functional space of the groups of urban environments with different types and degrees of urbanization.
Introduction
Habitat alteration, such as urban expansion over natural areas, is recognized as one of the most important drivers of biodiversity decline (IUCN, 2023), affecting most of taxonomic groups, including amphibians (Dudgeon et al., 2006; McKinney, 2006; Hamer and McDonnell, 2010). Urbanization with minimal or lack of planning, as described in Angel (2023), may entail habitat isolation, contamination of water bodies and decrease in the quality of green spaces that house biodiversity in large cities (Parris, 2006; Hamer and McDonnell, 2008; Kruger et al., 2015; Seto et al., 2012; Zaffaroni-Caorsi et al., 2022; Yang et al., 2022) and its implication on amphibians’ diversity is still under discussion (Pereyra et al., 2021; Demartín et al., 2024). The impact of urbanization depends on type and degrees of habitat modifications, which are very different in cities in developed countries, such as those in Europe and North America, compared to developing countries, such as those in South America (Sun et al., 2020; Jedwab et al., 2021). The urbanization process in recent decades (urban growth rate –demographic and as territorial extension: percentage of inhabitants who move to live in cities compared to those who live in rural environments) has been much greater in developing countries than in developed countries (Montgomery, 2008; United Nations, 2018; Angel, 2023). Many medium-sized and growing cities in South America present a type of diffuse urban expansion, which includes great heterogeneity with respect to the uses of space (Rausch et al., 2019). This spatial heterogeneity can be an important factor in the generation of different habitat niches, that enable the preservation of a certain diversity of amphibians within the urban frame (Hamer and McDonnell, 2008; Li et al., 2018; Esparza-Orozco et al., 2020; Zhang et al., 2022; Demartín et al., 2024). Still, there is a clear taxonomic and geographic bias in urban ecology studies, with a subrepresentation of herpetofaunal studies and developing countries (Hamer and McDonnell, 2008; Rega-Brodsky et al., 2022; Tan et al., 2023). Even so, the study of amphibians inhabiting urban ecosystems of developing countries have been increasing in the recent past (e.g. Babini et al., 2015; Gonzalez Baffa-Trasci et al., 2020; Pereyra et al., 2021; Ijie et al., 2021; Paludo Smaniotto and Bairos Moreira, 2023; Demartín et al., 2024). This increase can be attributed to the rapid expansion of urban areas (Seto et al., 2012; United Nations, 2018), which has heightened the need to understand how urbanization affects local biodiversity. As cities grow, amphibian habitats are increasingly altered or fragmented (Fahrig, 2003). Studying these changes is essential, as amphibians are highly sensitive to environmental disturbances and serve as critical indicators of ecosystem health (Collins and Storfer, 2003).
The characterization of urban ecosystems and their classification according to the degree of urbanization it is essential to predict diversity patterns and their components. In general, increased urbanization corresponds with a decrease in species richness (Hamer and McDonnell, 2010; Aronson et al., 2014; Zhang et al., 2016; Callaghan et al., 2020). Also, it is related to the homogenization of biological communities, which is defined as the change in previously distinct biotas that have become more similar over time at different levels of organization (McKinney, 2006; Olden and Rooney, 2006; Groffman et al., 2017; Deng et al., 2024). In amphibians, this happens because urbanization alters the breeding sites (Gagné and Fahrig, 2007), causes changes in the availability of the refuge sites (Hodgkison et al., 2007), alters prey availability and structure of foraging sites (López et al., 2015). The processes that shape communities inhabiting urban areas and link with the consequences of habitat anthropogenic alterations and biodiversity loss to ecosystem functioning can be achieved using trait-based functions (Cadotte et al., 2011; Mouillot et al., 2013; Riemann et al., 2017). Functional information has proven to be an important dimension of biodiversity interpretation and a key pillar of modern ecology (Jarzyna and Jetz, 2016; Malaterre et al., 2019). In cities with significant increase in urbanization, understanding the effects of anthropogenic alterations on functional diversity is essential to direct conservation efforts beyond the simple number of species, toward a more inclusive approach that prioritizes species aggregation patterns, ecosystem function and stability (Cadotte et al., 2011; Riemann et al., 2017). The study of the variation in the functional diversity of species linked to green spaces in urban environments provides primary information necessary to understand the patterns of coexistence and interaction in a taxocenosis and generates tools for management and conservation plans in the cities (Kondratyeva et al., 2020; Bonilla-Valencia et al., 2022). Assessing whether observed functional diversity differs from that expected by chance provides a metric of the dispersion of traits across the functional trait space, with increasing clustering or over-dispersion of traits indicating stronger biotic or abiotic filtering of the focal community (Botta-Dukát and Czúcz, 2016).
Due to the diversity of urban green spaces in many cities from South America and other less developed regions, and the limited of information on how these environments influence local biodiversity, we conducted a study to evaluate amphibian diversity in green spaces in the metropolitan area of a growing city from Argentina. Our main objective was to understand how environments with different levels of urban gradients influence local amphibian diversity. To achieve this, first we generated a grouping of a heterogeneous set of urban green spaces of a medium-sized and growing city of Argentina in relation to natural and anthropic environmental variables, which allows us to describe an urban environmental gradient, and we them calculated beta diversity among these groups of urban environments considering the richness, composition and abundance of amphibian at each sites group. From this, we analyzed and tested the differences in the functional diversity of amphibians in the defined urban environmental gradient. We hypothesize that: (i) the described spatial heterogeneity would be related to an elevated beta diversity of amphibians within the urban frame; and (ii) the analysis of functional diversity would reveal a stronger biotic or abiotic filtering of the focal community.
Materials and methods
We carried out sampling in 14 sites in three urban locations, belonging to the metropolitan area of Santa Fe city, including Santa Fe (12) and San José del Rincón (1) cities, and Arroyo Leyes (1) commune (Department La Capital, Province of Santa Fe, Argentina; Figure 1). Santa Fe city (31° 42’S; 60° 46’W) is the administrative and political capital of the Province of Santa Fe. It is the second largest urban center of the province, concentrating around 425,000 inhabitants, according to the data available from the last census (INDEC, 2022). Santa Fe city is situated in the Middle Paraná River floodplain, surrounded by the Salado River to the west and south and the Paraná River fluvial system to the east and south. San José del Rincón city (31° 36′S; 60° 34′W) has a population of more than 11,000 inhabitants (INDEC, 2022) and borders Arroyo Leyes commune to the north and Santa Fe city to the south. It is located 13 km north of its urban center of Santa Fe city. Arroyo Leyes commune (31° 35′S; 60° 33′W) has a population of almost 3,300 inhabitants (INDEC, 2022), borders San José del Rincón city to the south, and is located 18 km north of the urban center of Santa Fe city. The three localities belong to the Espinal ecoregion, characterized by forests and savannas, and to the Paraná Delta and Islands, which includes the floodplains of the middle and lower courses of Paraná and Paraguay rivers (Matteucci et al., 2012). This metropolitan area presents an average annual rainfall of 1060 mm registered during the last 10 years (2013–2022) by the Centro de Informaciones Meteorológicas of the Facultad de Ingeniería y Ciencias Hídricas of the Universidad Nacional del Litoral (CIM: FICH-UNL).
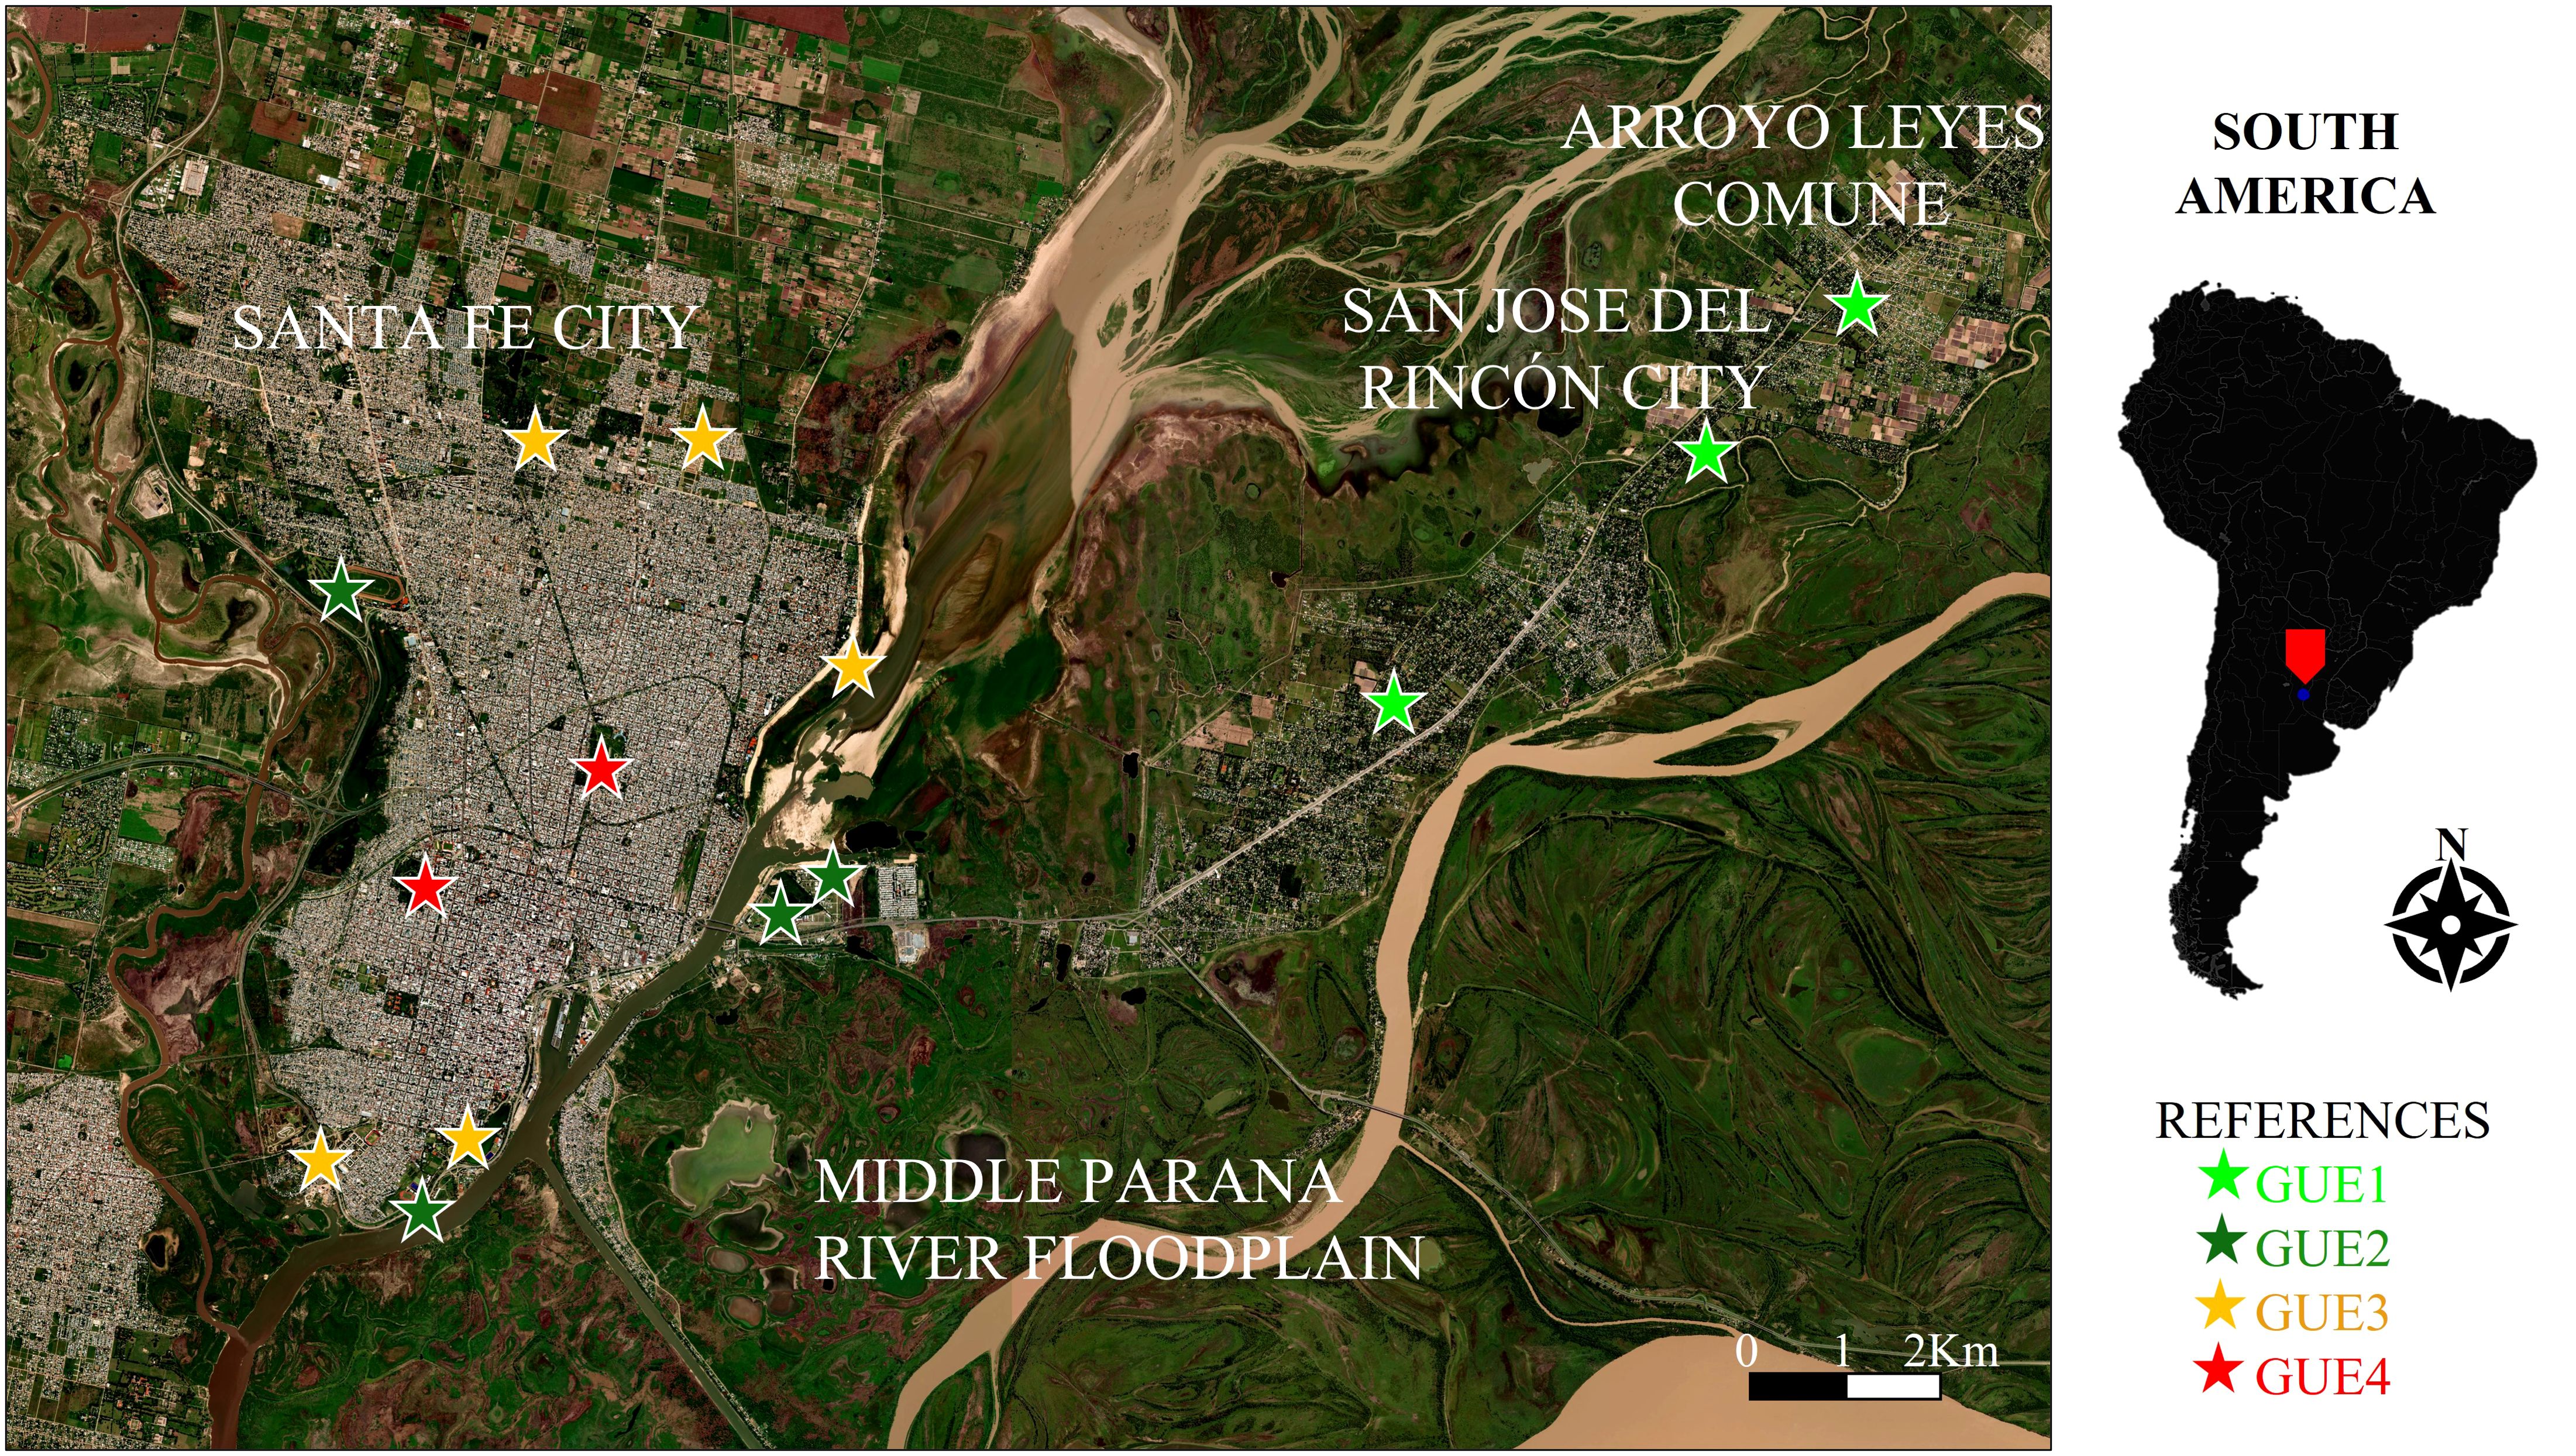
Figure 1. Satellite image with the 14 sampled sites. The location of study area on a South America scale in shown on the right. References = GUE: urban environmental groups, from least (GUE1) to most (GUE4) urbanized.
During the spring and summer months of 2021, 2022 and 2023, we carried out 70 field samplings in the 14 selected urban green spaces, conducting five samplings per site during the first 4 hours after dusk. Each sampling involved active searches on two transects (50m x 2m) for 20 minutes each. Individuals were identified to the species level using the local identification guide (Ghirardi and López, 2020). In the field, we recorded the date and time, sex of individuals and morphometrical variables such snout-vent length, mouth width and femur length with a digital caliper with a precision of 0.01 mm and body mass with a digital weight scale with a precision of 0.01g. We recorded data of activity period of each species and, when possible, we registered reproduction and feeding activity. All individuals were released, after taking the necessary data, in the same place where they were captured.
Environmental variables description and urban environmental gradient definition
We utilized spectral indices and natural (vegetation, water bodies and temperature) and anthropic (building, distance to the urban center, population and time without changes) environmental variables to estimate gradient of urbanization of sites within a 500 m radius buffer zone. To accomplish this, we estimated the centroid of the sampled site and from that point, a radius distance of 500 m was calculated, presumed to represent the potential movement range of an individual (adult amphibian) in an urban setting (Parris, 2006; Ramesh et al., 2012). We described the concentration and health of vegetation using the Normalized Difference Vegetation Index (NDVI), derived from measurements of optical reflectance of sunlight at red (RED) and near-infrared (NIR) wavelengths: NDVI = (NIR − RED)/(NIR + RED) (Rouse et al., 1974; Celemín and Arias, 2022), this index was computed using a SPOT 7 satellite image (date: 12/03/2022) provided by CONAE (https://catalogos.conae.gov.ar/Catalogo/catalogo.html). The amount of impervious soil was determined using the Normalized Difference Built-up Index (NDBI), which employs mid-infrared (MIR) and NIR wavelengths: NDBI = (MIR − NIR)/(MIR + NIR) (Zha et al., 2003), this index was derived from Landsat 8 OLI TIRS satellite images (date: 08/01/2023, path/row: 227/82) downloaded from USGS (https://earthexplorer.usgs.gov/). Additionally, we identified local microclimates (Coelho and Correa, 2013) using Land Surface Temperature (LST) derived from Landsat 8 OLI TIRS satellite images obtained through Climate Engine (Huntington et al., 2017). All indices were calculated using the free software QGIS (version 3.22.13). Landsat 8 products were corrected using the DOS1 (Dark Object Subtraction 1) method with the Semi-Automatic Classification Plugin (SCP) extension. Pixels within the buffer zones of each site were extracted. For NDVI, we tallied pixels greater than 0.3 (attributed to vegetation) and calculated the percentage. Regarding NDBI, we extracted all pixels greater than zero corresponding to buildings and bare soil. Urban pixels were identified by overlaying the NDBI layers on the satellite image. We tallied the pixels within urban areas and calculated the percentage. The distance to the urban centroid of Santa Fe was calculated with Google Earth in Km in a straight line (DC). For LST, we obtained the maximum and minimum temperature per pixel during the years 2020, 2021, and 2022. We then averaged them separately within each buffer, finally calculating the thermal amplitude (TA) by subtracting both values. We calculate the area (m2) of the ephemeral and temporary bodies of water (WB) present in the buffer zone through the visualization of satellite images from Google Earth and we verify their existence by traveling over the terrain after an abundant rainfall. We also categorized sites based on the number of years that show no major changes (e.g., road construction, building construction, deforestation) by at least 30% of the buffer. To do this, we visualized satellite images from previous years (starting from 2002) using the Google Earth platform and classified the years, as follows: (YWC-1) less than 5 years, (YWC-2) between 5 and 10 years, (YWC-3) between 10 and 15 years, (YWC-4) between 15 and 20 years, (YWC-5) more than 20 years. Finally, we categorized the sites by the size of the present population using census data provided by the National Institute of Statistics and Censuses of Argentine (INDEC) as follows: (P-1) less than 999, (P-2) between 1,000 and 1,999, (P-3) between 2,000 and 2,999, (P-4) between 3,000 and 3,999, (P-5) more than 4,000 (Supplementary Table 1).
Finally, we standardize the numerical variables from the buffer zone of the fourteen sampled sites. We calculated the distance matrix using the Daisy function for quantitative and qualitative variables with Gower’s method and the hclust function for hierarchical clustering with Ward’s method. We assigned four clusters and performed a permanova with the ‘Adonis2’ function to evaluate whether the groups formed were different from each other. These analyzes were performed with the ‘vegan’ and ‘cluster’ packages. This method allows us to identify four groups of sampling sites (GUEs) representing an urban environmental gradient. The completeness of the species inventory of GUEs was explored by randomized species rarefaction and extrapolation using Chao’s coverage estimator with the ‘iNEXT’ function of the ‘iNEXT’ package (Hsieh et al., 2016).
Beta diversity analysis
We conducted beta diversity analysis employing the Sørensen index species presence/absence data and Bray-Curtis index with species abundance data. We performed beta diversity partitions and calculated distance matrices using pairwise dissimilarities specifically βsor (total beta diversity), βsim (spatial turnover) and βsne (nestedness) for Sørensen (Baselga, 2010), and βbray (total beta diversity), βbal (spatial turnover) and βgra (nestedness) for Bray-Curtis. We conducted these analyses among the different GUEs using the ‘Betapart’ package and the ‘beta.pair’ and ‘beta.pair.abund’ function. To assess which species contribute the most to the differences between GUEs, a simper analysis was carried out with the ‘vegan’ package (Clarke and Warwick, 2001). The function performs pairwise comparisons of groups and finds the contribution of each species to the average between-group Bray-Curtis dissimilarity.
We tested the relationship of species with urbanization characteristics and GUEs using nonmetric multidimensional scaling (NMDS) ordination based on the abundances. We employed the ‘vegan’ package with the Bray-Curtis dissimilarity index on two axes and incorporated environmental variables using the ‘envfit’ function (Oksanen, 2009) (9999 permutations). To assess the association between species patterns and to determine whether there were species that could be considered indicator species for any of the GUEs we utilized the ‘multipatt’ function from the ‘indicspecies’ package (De Cáceres and Legendre, 2009). This function allows determining lists of species that are associated to a particular GUE or combinations of them.
Functional diversity analyses
For the functional diversity analyses we used eight functional traits (snout-vent length, body mass, mouth width, femur length, reproductive mode, foraging strategy, activity period, ecomorphological group), both from the adult and larval stages of amphibians. We used the morphometric measurements of adult males and females recorded in the field and we completed the life history data that could not be registered in the field with the literature (López et al., 2011, 2015; Ghirardi and López, 2020; Cortés-Gómez et al., 2015). For the tadpoles we used the ecomorphological groups based on the classification of Altig and Johnston (1989) (Table 1). We calculated the functional richness index (FRic), which represents the functional space occupied by an assemblage of species regardless of their abundances; the functional evenness index (FEve), which evaluates how homogeneous the abundances of the species assemblage are distributed in the functional space; the functional divergence index (FDiv), which is defined as the measure of functional dissimilarity that exists between the dominant species of the assemblage, measures how far the most abundant species move from the center of the functional space; and the mean distance of individual species to the centroid of all species in the community (FDis) (Mason et al., 2005; Villéger et al., 2008; Laliberté and Legendre, 2010; Córdova Tapia and Zambrano, 2015). We evaluated differences in these indices between the GUEs with the Kruskal-Wallis test and, where necessary, we performed the Dunn post-hoc test with Benjamini-Hochberg correction. We used the ‘vegan’, ‘FD’, ‘stats’, and ‘dunn.test’ packages (Hollander and Wolfe, 1973; Laliberté et al., 2014; Oksanen et al., 2019).
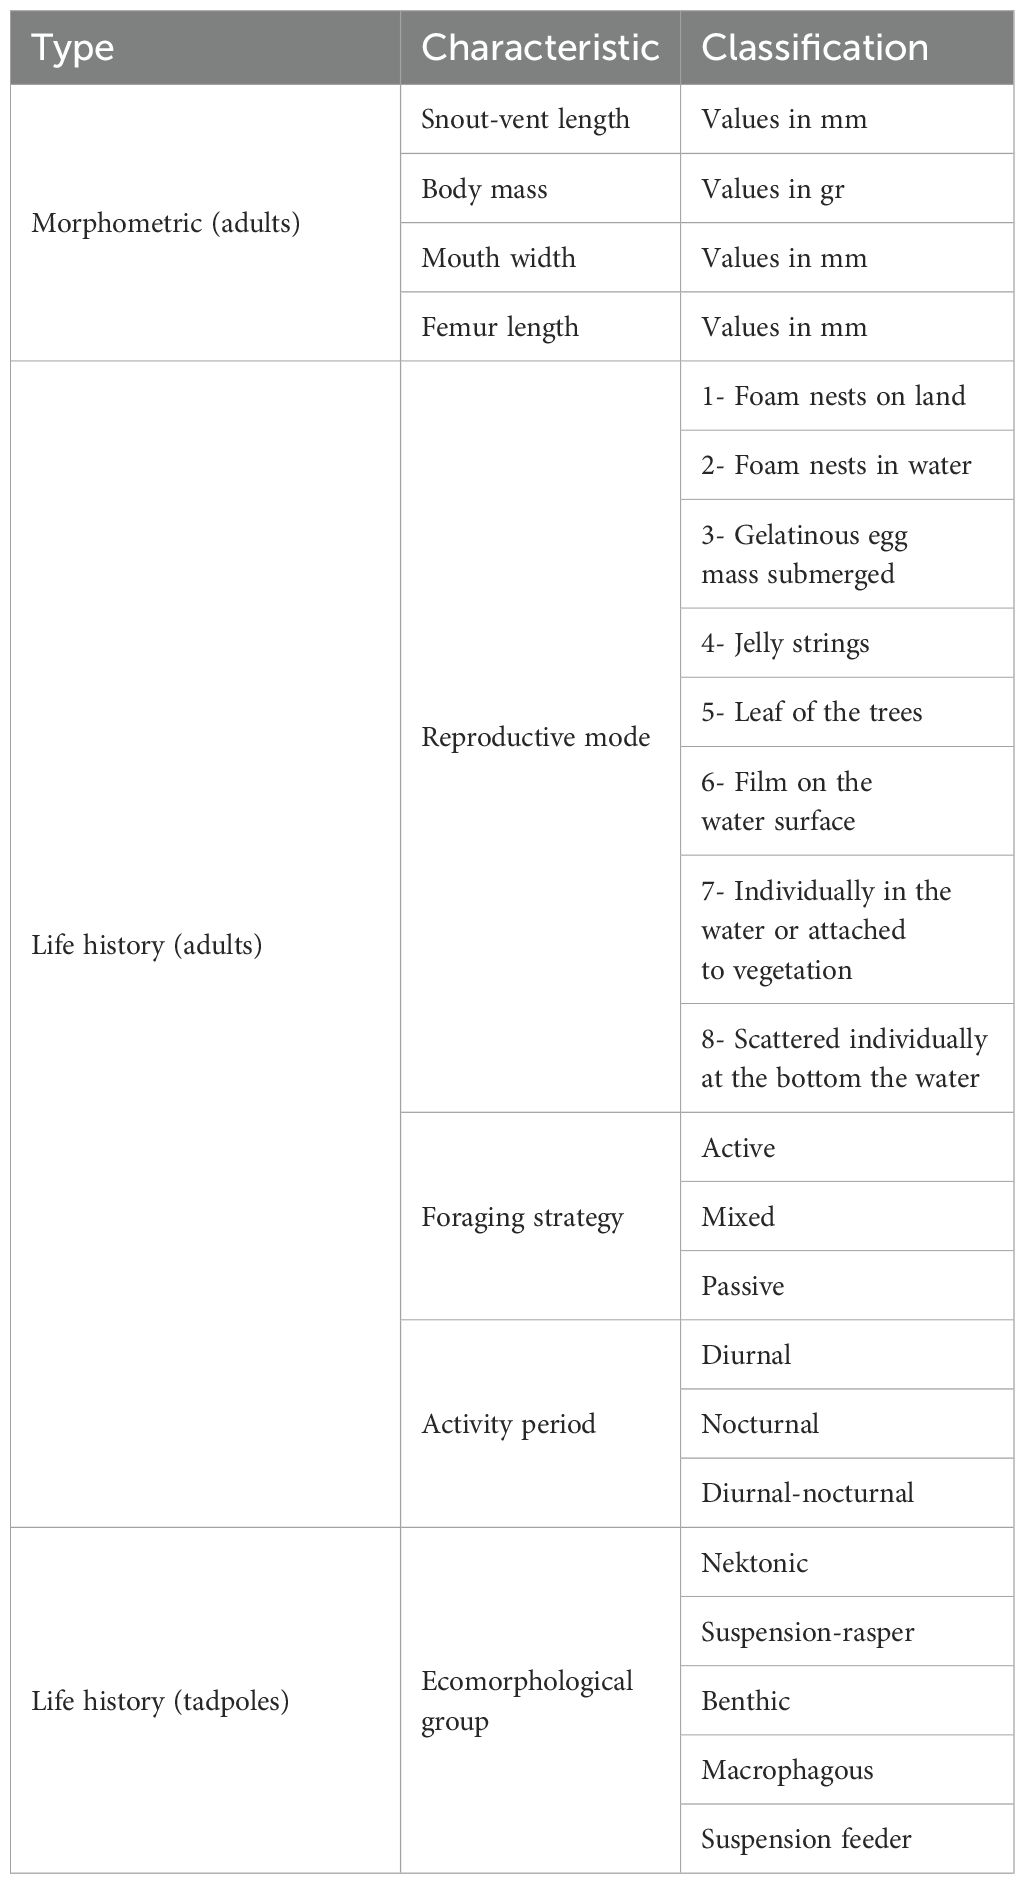
Table 1. Traits used for functional diversity analysis: adult morphometrics, adult life history and tadpole life history.
All analyzes were performed using R software version 4.4.1 (R Core Team, 2024).
Results
We identified four significantly different groups of urban environments (GUEs) (R2 = 0.7174; p=0.001), which we classified from least to most urbanized (Table 2; Supplementary Figure 1).
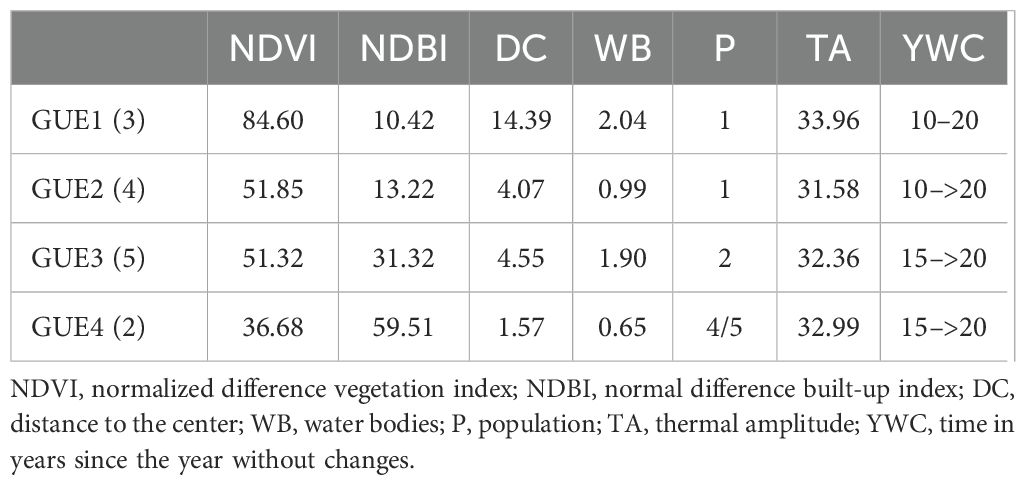
Table 2. The average urbanization characteristics of urban environmental groups (GUEs) are shown, ordered from lowest to highest degree of urbanization (1, 2, 3, 4). The number of urban green spaces included in the GUE is presented in parentheses.
The less urbanized group of urban environments (GUE1) is formed by three urban green spaces that belong to a peripheral neighborhood of the city and two small neighboring towns that are part of the same metropolitan area. It presents the highest NDVI values and the lowest NDBI values, the greatest distance to the urban centroid, the greatest surface of bodies of water, the smallest population, the greatest thermal amplitude and the time since the last major change is between 10 and 20 years (Table 2).
Group two of urban environments (GUE2) is made up of four urban green spaces, two of them are urban natural reserves and two are riverside urban green spaces. It presents an intermediate percentage of NDVI, and a higher NDBI value than GUE1, 4 km distance to the urban centroid, small surface bodies of water, low population size, the lowest thermal amplitude and the last major change is variable between the urban green spaces that compose it averaging 10 to 20 years (Table 2).
Group three of urban environments (GUE3) includes five urban green spaces, three correspond to peripheral neighborhoods of the city of Santa Fe and the other two are a large park and a riverside urban green space. It presents a NDVI percentage similar to GUE2 and the second highest percentage of NDBI, distance to the urban centroid similar to GUE2, the second largest surface of water bodies, population density is intermediate, thermal amplitude intermediate and the last major change occurred mostly more than 20 years ago (Table 2).
Group four of urban environments (GUE4) is constituted of two urban green spaces that belong to large parks in the city of Santa Fe. It has the lowest NDVI and highest NDBI of the four groups, the shortest distance to the urban centroid, the smallest number of bodies of water, the highest population density, the second thermal amplitude and the last major urbanistic change was more than 15 years ago (Table 2).
In total, 26 species of amphibians belonging to 13 genera were recorded. Eight species were present in the four GUEs: Elachistocleis bicolor, Rhinella arenarum, Rhinella dorbignyi, Leptodactylus macrosternum, Leptodactylus latinasus, Physalaemus albonotatus, Dendropsophus nanus and Scinax nasicus. In GUE1 we recorded 15 species belonging to 8 genera, with the species Physalaemus santafecinus, Physalaemus biligonigerus and Trachycephalus typhonius being exclusive to this GUE, as well as the genus Trachycephalus. In GUE2 we recorded 21 species belonging to 13 genera, with the species Pseudis platensis and Scinax acuminatus being exclusive to this GUE, as well as the genus Pseudis. In GUE3 we recorded 19 species belonging to 10 genera, with the species Pseudopaludicola falcipes and Pitecophus azureus being exclusive to GUE3, as well as the genera to which they belong. In GUE4 we recorded 9 species belonging to 6 genera, none of them exclusive to this GUE (Table 3).
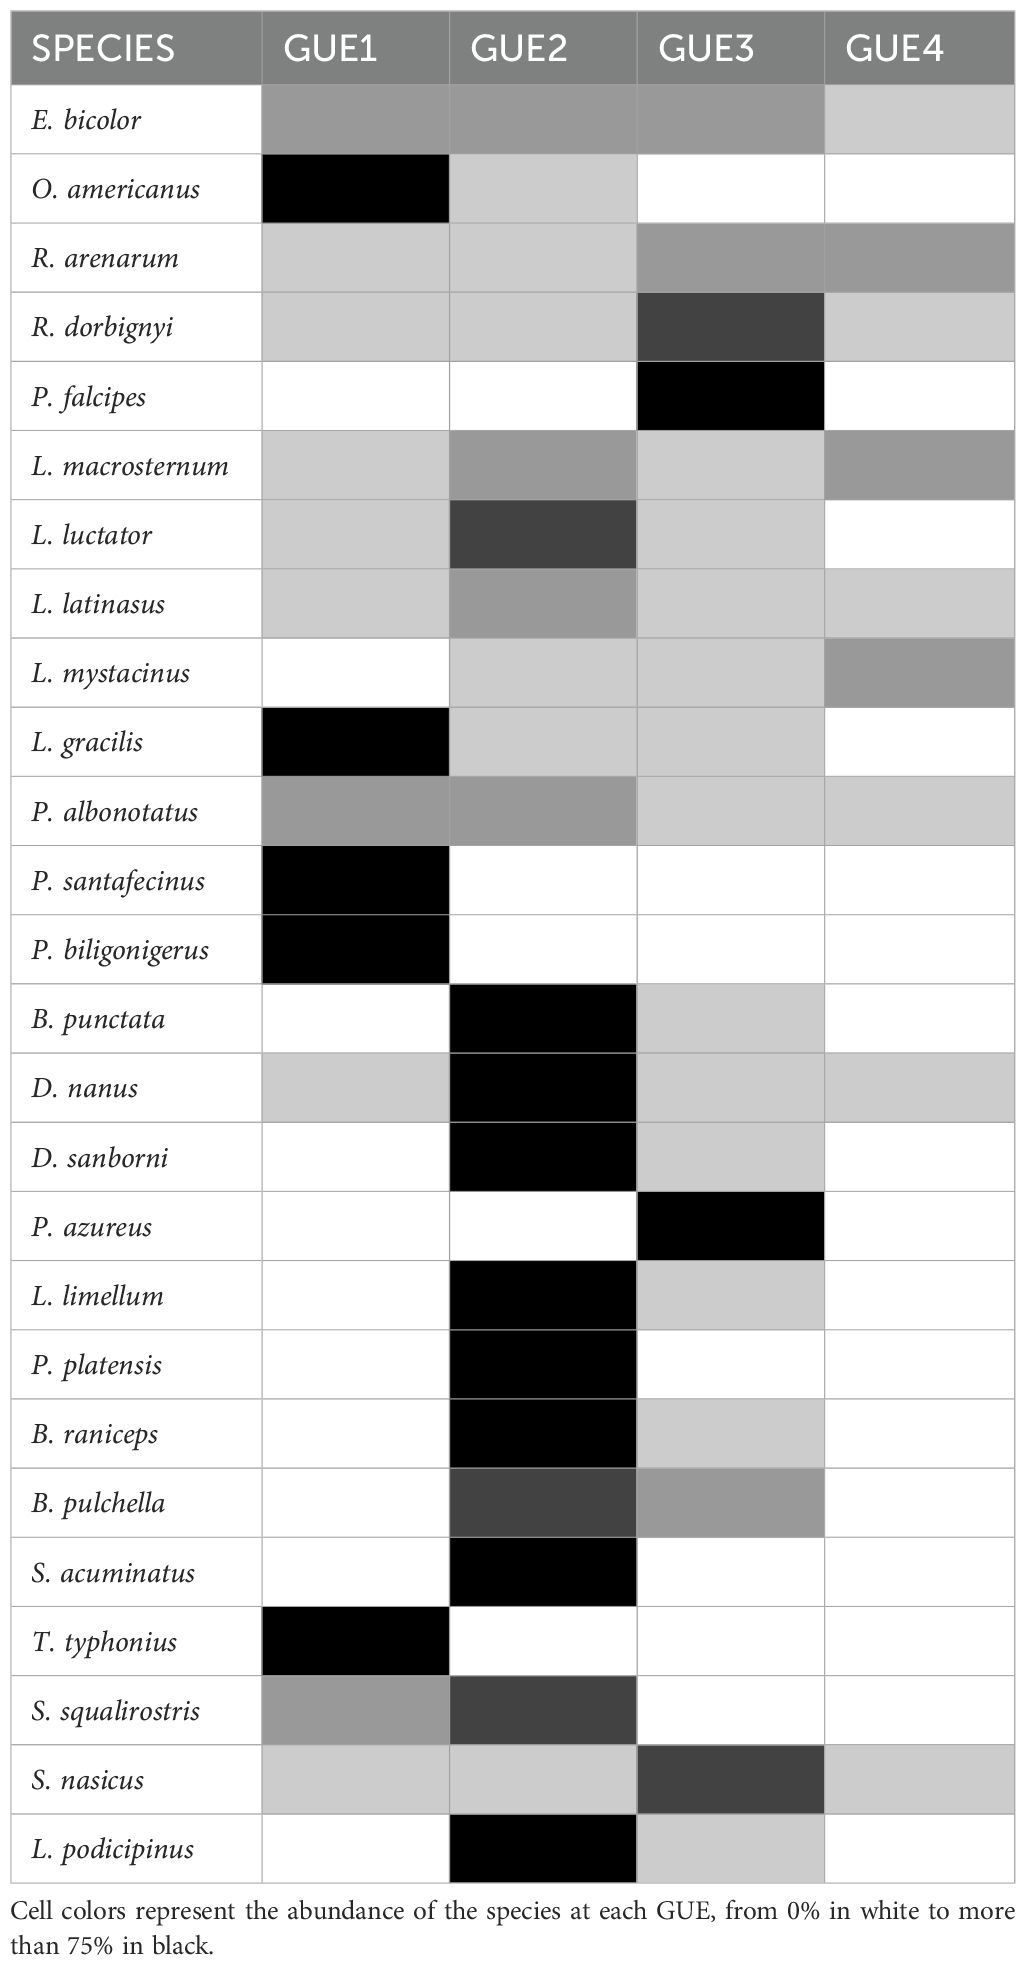
Table 3. Species that are present at each urban environmental group (GUE), from least (GUE1) to most urbanized (GUE4).
Chao’s coverage estimator reached 94% in GUE1, 98% in GUE2, 96% in GUE3 and 100% in GUE4 (Supplementary Figure 2). These high levels of diversity coverage of sampling indicate a reliable representation of the collected species presence/absence data. Consequently, subsequent analyses based on these data are expected to be robust and reliable.
The beta diversity analysis between pairs of GUEs show low to moderate values for the Sørensen index and moderate to high values for the Bray-Curtis index (Table 4). In the Sørensen index, the greatest difference in total beta diversity was between GUE1 and GUE3, as well as between GUE2 and GUE4 (>40%); while the smallest difference was between GUE2 and GUE3 (15%). The Sørensen beta diversity values between GUE1, GUE2 and GUE3 are largely explained by species turnover. Meanwhile, the total Sørensen beta diversity values between GUE4 and GUE2, as well as between GUE4 and GUE3 correspond entirely to the effect of nestedness of the species; while between GUE4 and GUE1 it only partially corresponds to nestedness (66%) (Figure 2).
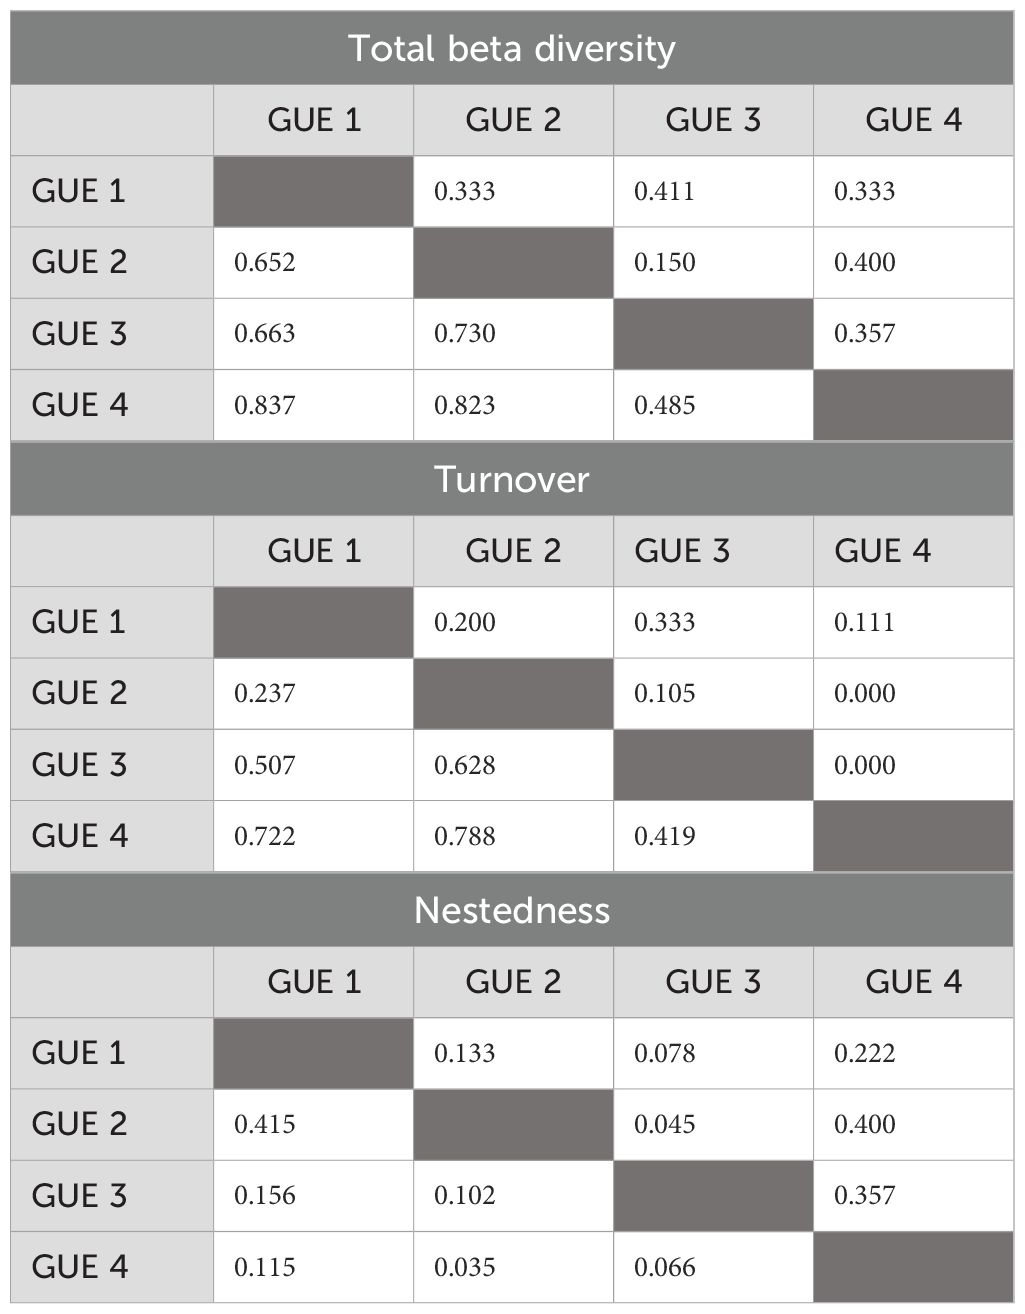
Table 4. Sørensen beta diversity (values above gray cells) and Bray-Curtis beta diversity (values below gray cells) by pairs of urban environments groups, from least (GUE1) to most (GUE4) urbanized groups of urban environments.
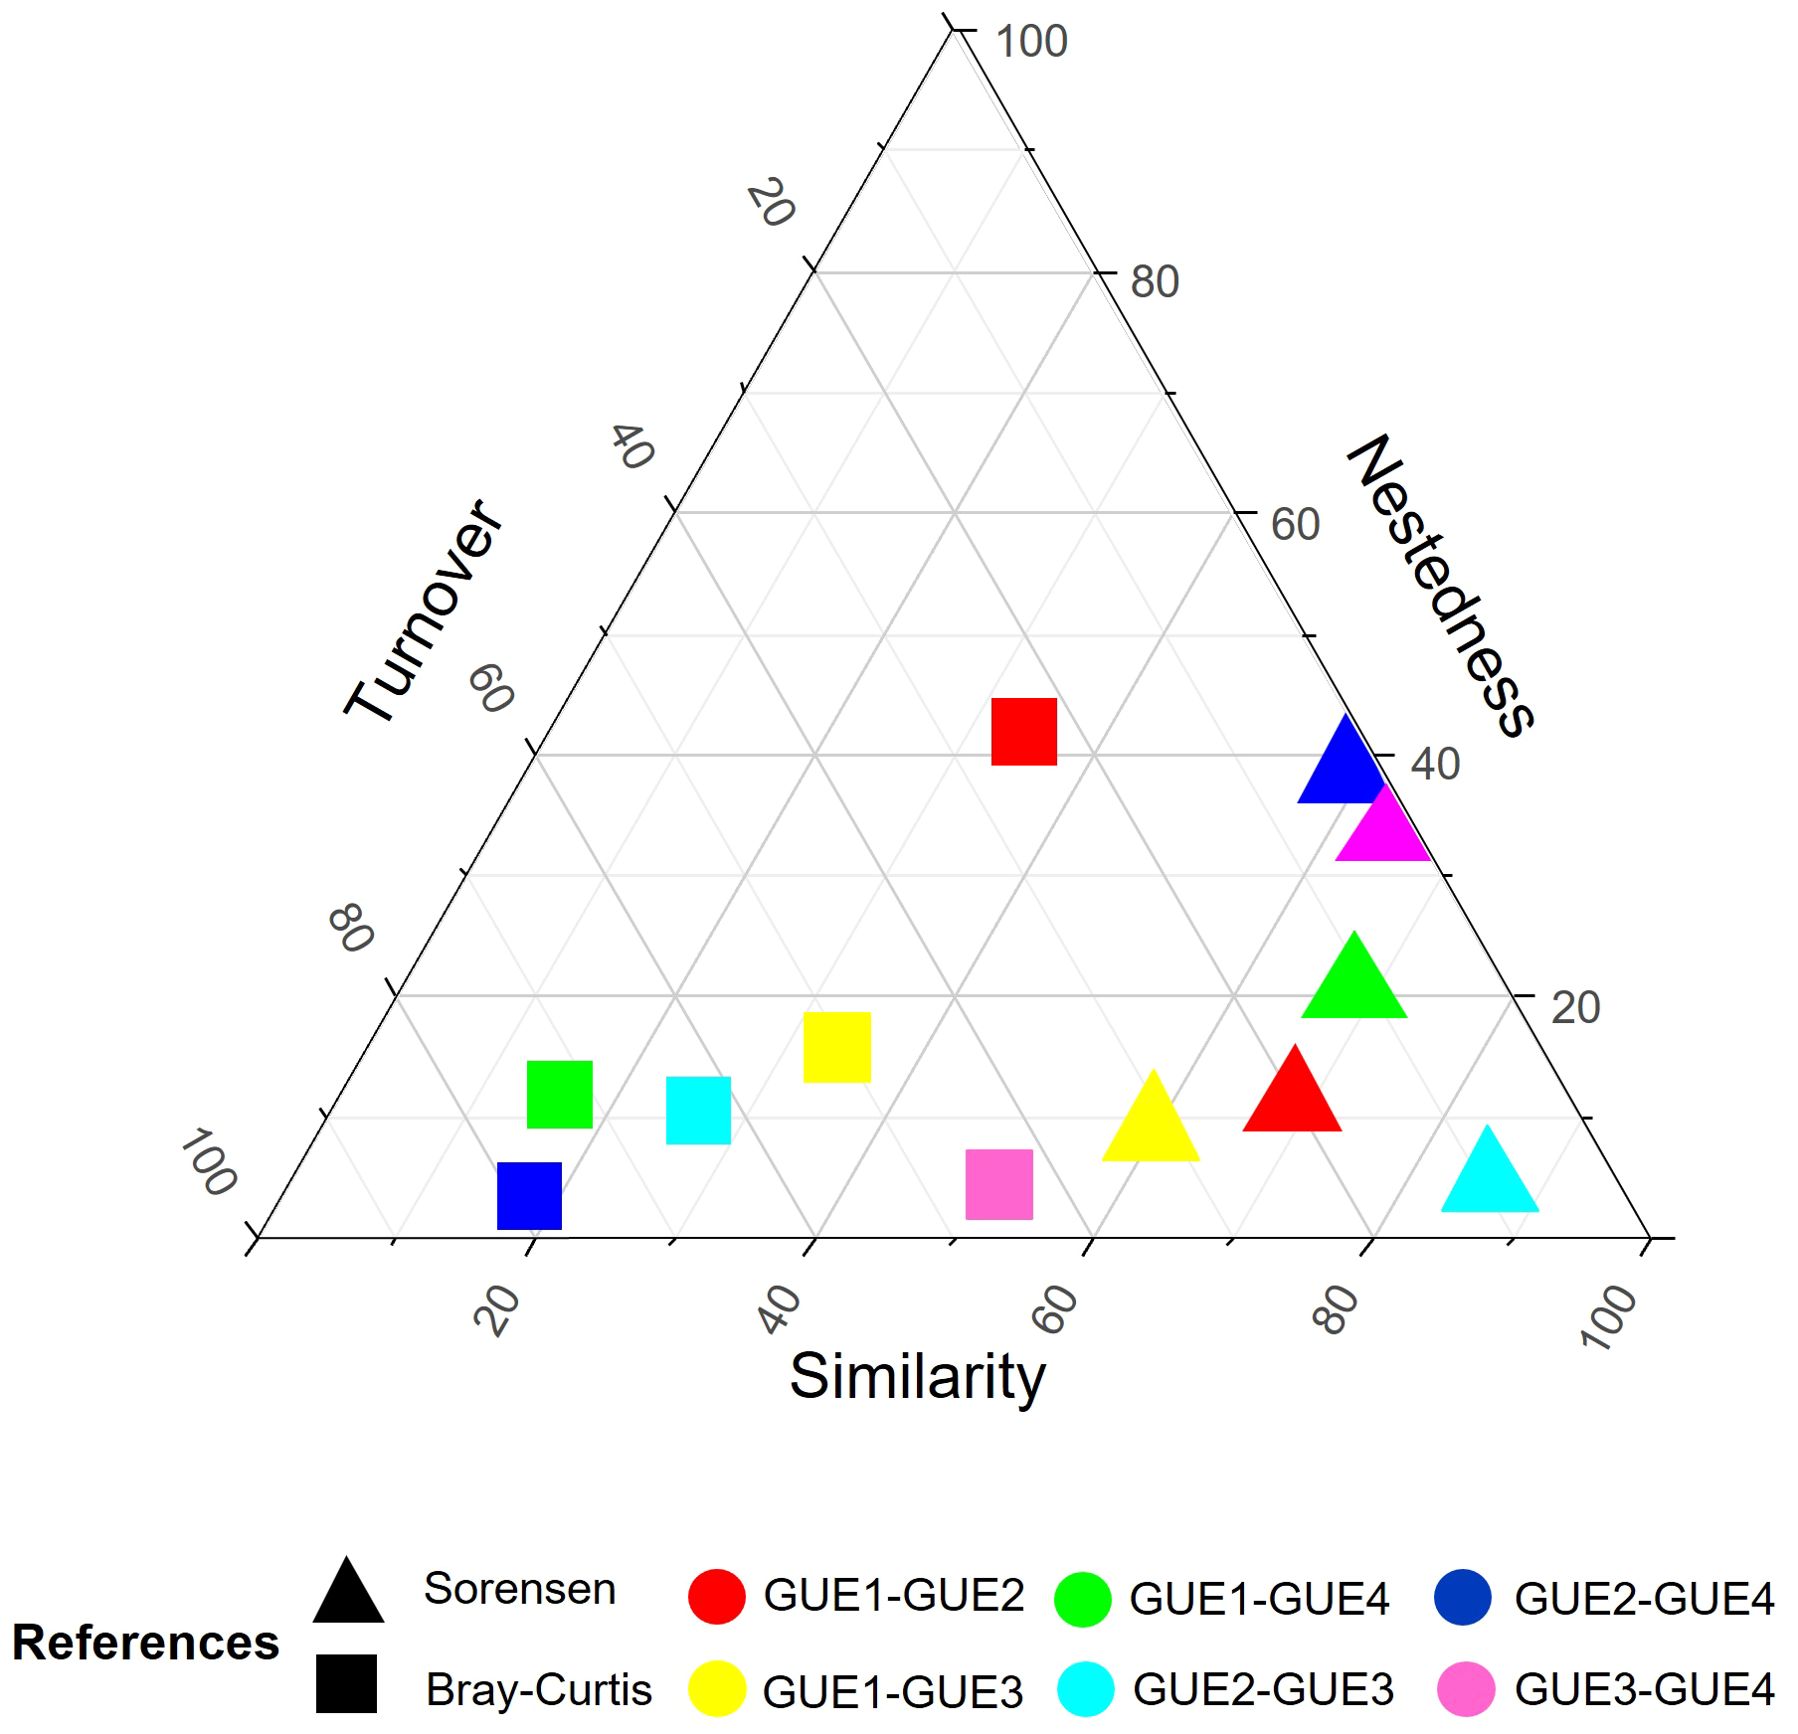
Figure 2. Triangular plot of beta diversity indices. References = GUE: urban environmental groups, from least (GUE1) to most (GUE4) urbanized.
When taking into account the Bray-Curtis index, it is observed that the greatest difference occurs between the GUE1 and GUE4, as well as between GUE2 and GUE4 (>80%); simper analysis shows that the differences between GUE1 and GUE4 are mainly caused by the variation in the abundances of R. arenarum (36.2%) and to a lesser extent E. bicolor (11.5%), and between GUE2 and GUE4 it is caused by the variation in the abundances of R. arenarum (25.27%) and D. nanus (24.72) (Supplementary Table 2). While the smallest difference occurs between GUE3 and GUE4 (48%) and was due to the variation in abundances mainly of R. arenarum (33.82%) and to a lesser extent of R. dorbignyi (11.18%). The Bray-Curtis beta diversity value between GUE1 and GUE2 is explained to a greater extent by nestedness than by the turnover of species and their abundances, the simper analysis shows that in this case the differences are mainly caused by the variation in the abundances of D. nanus (28.33) and to a lesser extent Dendropsophus sanborni (8.22%). Conversely, among the group pairs of GUE2, GUE3 and GUE4, the Bray-Curtis beta diversity is explained to a greater extent by species turnover and their abundances than by nestedness. The simper analysis shows that the differences between GUE2 and GUE3 were mainly caused by the variation in the abundances of D. nanus (25.34%) and to a lesser extent R. arenarum (11.85%) and R. dorbignyi (8.26%), while differences between GUE3 and GUE4 were caused by the variation in the abundances of R. arenarum (33.82%) and R. dorbignyi (11.18%) (Figure 2; Supplementary Table 2).
The functional diversity result shows differences in FRic (chi-square=11.003; p=0.01171), between GUE1 and GUE2 (Z=-2.6191; punadj=0.0088; p=0.0264) and between GUE2 and GUE3 (Z=3.02076403; punadj=0.002521378). There are no statistical differences for FEve, FDis, FDiv between GUEs (p>0.05) (Table 5).
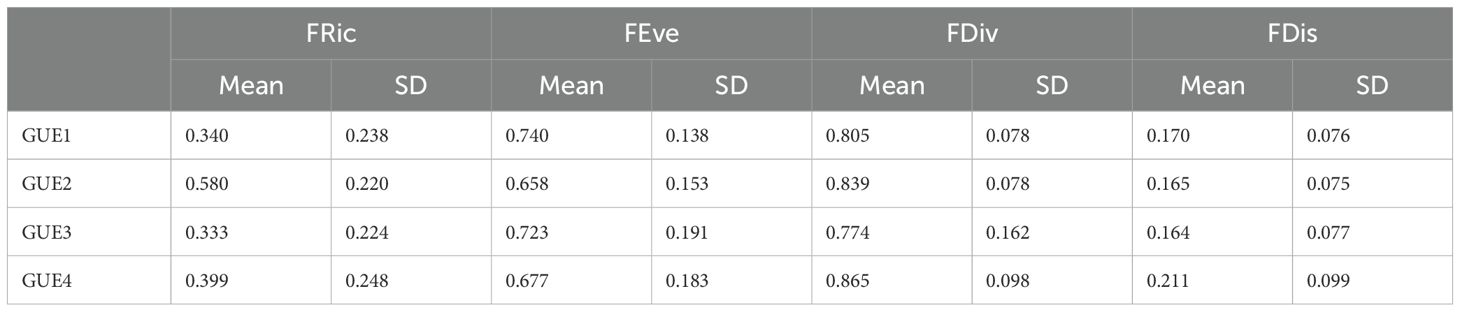
Table 5. Means and standard deviations of functional richness (FRic), functional equitability (FEve), functional divergence (FDiv) and functional dispersion (FDis) of the different urban environmental groups, from least (GUE1) to most urbanized (GUE4).
The NMDS shows significant separation of different GUEs and species (Figure 3). The NMDS ordering (stress=0.01) of the species was positively correlated with the NDVI (r2 = 0.683, p=0.003), NDBI (r2 = 0.747, p=0.002), DC (r2 = 0.718, p=0.003), P (r2 = 0.427, p=0.030). It was not significantly ordered with WB, TA and YWC (p>0.05). NDVI, AT and DC were associated with GUE1, whereas NDBI was associated with GUE4, depicting the urbanization gradient. A total of 5 indicator species were found for the different GUEs. Odontophrynus americanus (stat=0.743, p=0.0433) and Leptodactylus gracilis (stat=0.650; p=0.0287) for GUE1 and Leptodactylus luctator (stat=0.734, p=0.0469), D. nanus (stat=0.706, p=0.0355) and D. sanborni (stat=0.689, p=0.0341) with the GUE2.
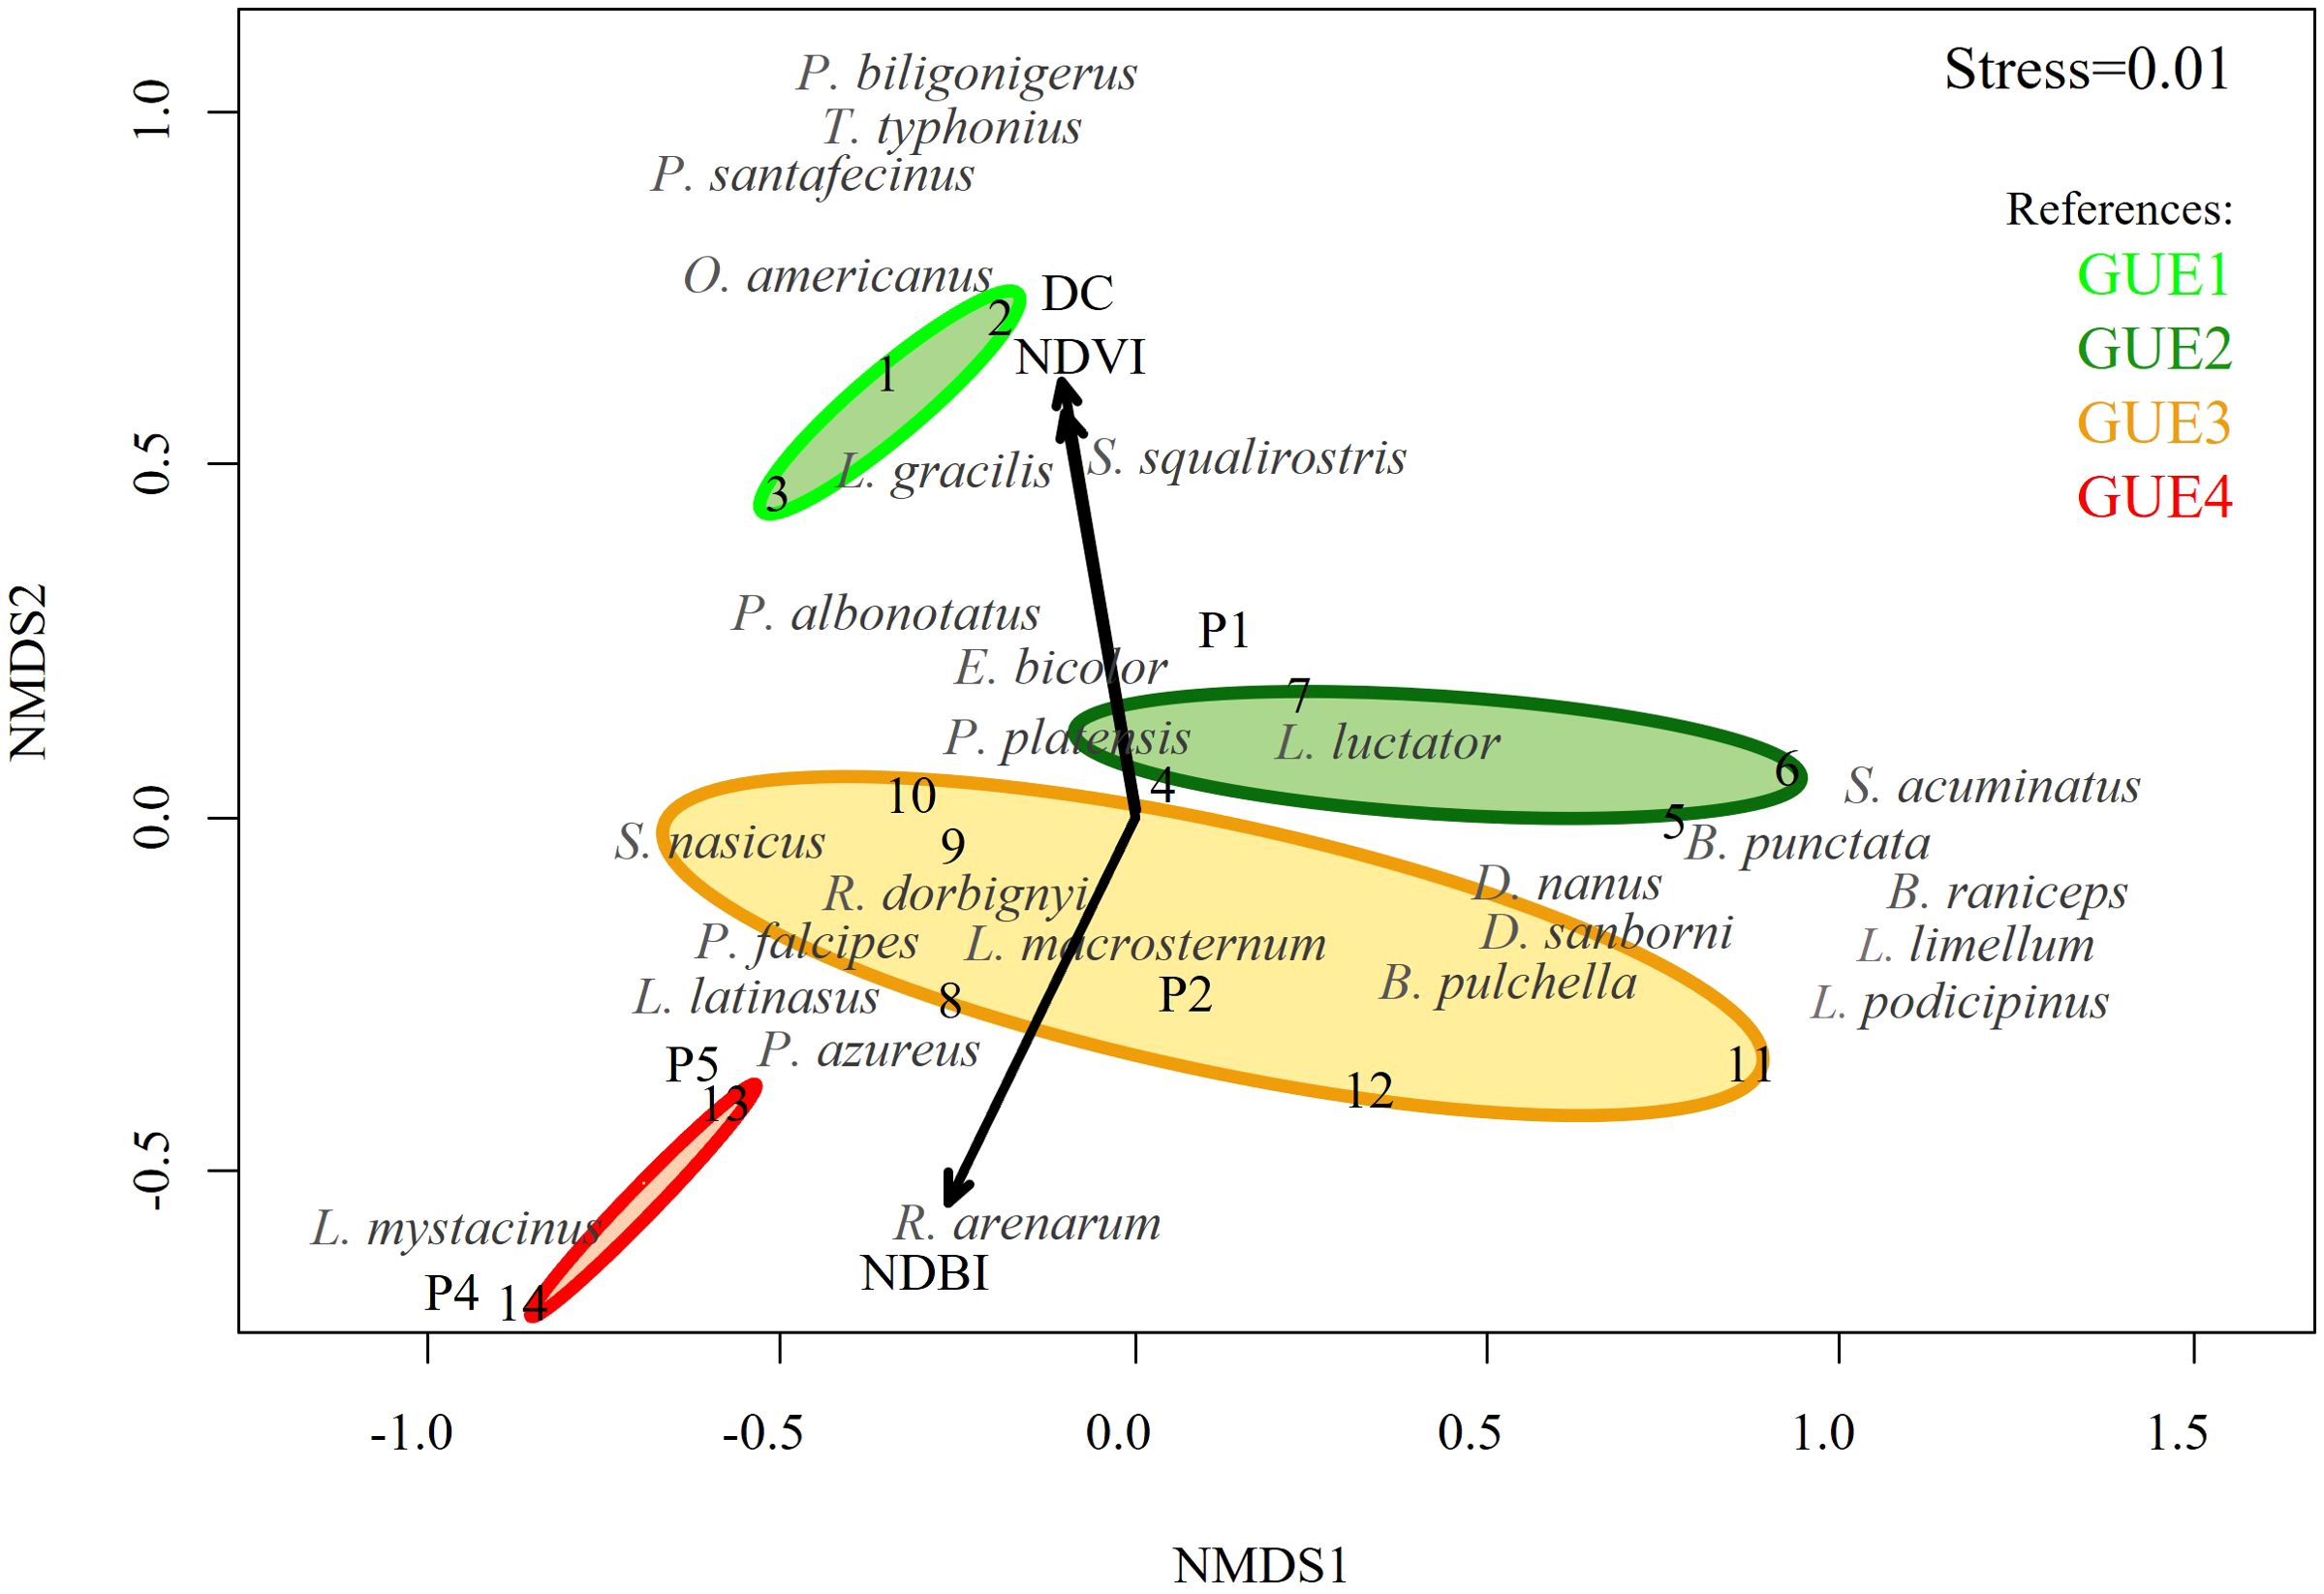
Figure 3. Non-metric multidimensional scaling (NMDS) plot of the species by urban green spaces and urban environmental groups (GUEs), from least (GUE1) to most (GUE4) urbanized. with the best correlated urban variables from the envfit analysis (p<0.05). Species in gray; NDVI: Normalized Difference Vegetation Index; NDBI: Normal Difference Built-up Index; DC: distance to the urban centroid of Santa Fe; P1: population less than 999; P2: population between 1,000 and 1,999; P3: population between 2,000 and 2,999; P4: population between 3,000 and 3,999; P5: population more than 4,000.
Discussion
Several studies indicate that species richness tends to be greater in less urbanized environments (e.g. Pillsbury and Miller, 2008; Zhang et al., 2016; Callaghan et al., 2020). However, we found that areas with an intermediate degree of urbanization may have a greater number of species than less urbanized areas. The greatest richness of species was found in urban green spaces with an intermediate degree of urbanization (N = 21 in GUE2 and N = 19 in GUE3), while those with less urban development (GUE1) had an intermediate richness (N = 15), and those with higher degree of urbanization (GUE4) had the lowest richness compared to the other groups (N = nine). The richness of species in areas with an intermediate degree of urbanization may be related to the heterogeneity of the urban green spaces that are present within GUE2 and GUE3 (Tsianou and Kallimanis, 2020; Moor et al., 2022; Demartín et al., 2024), which presented different habitats that satisfy the needs of a greater richness of species (Demartín et al., 2024). In addition, GUE1 and GUE4 are at opposite extremes in the degree of urbanization and the differences in the taxonomic composition between these groups (i.e., six species and two genera) may be the result of the difference in the type of environmental niches offered by them to amphibians (Demartín et al., 2024).
The greatest difference in total beta diversity, calculated using the Sørensen index, was observed between GUE1 and GUE3, as well as between GUE2 and GUE4, while the smallest difference was found between GUE2 and GUE3. This result suggest that urbanization affects biological communities in a non-linear way, indicating that changes in species composition can be more drastic at the extremes of urbanization gradient (McKinney, 2006). The replacement beta diversity recorded in GUE1, GUE2 and GUE3 indicated that the species assemblage changes throughout urban environmental gradient. Even the most urbanized environment (GUE4) presented a small replacement rate with the least urbanized environment (GUE1), considering only the number of species. This could mean that species adapted to less urbanized conditions are replaced by species that can survive or thrive in more urbanized conditions. On the other hand, the highest nesting values were found between GUE4 and GUE2, as well as between GUE4 and GUE3, indicating that the communities in group GUE4 are a subset of the assemblage of species of sites with an intermediate degree of urbanization (GUE2 and GUE3). Furthermore, the differences between the GUEs increase notably when the abundance of the species is included, where the highest species replacement values were between the GUE4 and GUE2 (79%), followed by GUE4 and GUE1 (72%). More urbanized areas (GUE4) may lose species sensitive to urbanization (such as Leptodactylus luctator, Leptodactylus gracilis, Boana punctata, Dendropsophus sanborni, Lysapsus limellum, among others), and some species become much more abundant in GUE4 compared to GUE1 and GUE2 (e. g. R. arenarum and L. mystacinus); while less urbanized areas (GUE1 and GUE2) maintain a greater diversity of species sensitive to urbanization (e.g. Odontophrynus americanus, Scinax squalirostris, Trachycephalus typhonius). The differences between GUE1 and GUE2 were largely due to nesting, indicateing that GUE2 has a greater abundance and diversity of species, while GUE1 contains a subset of these species in lower abundance. The species assemblage varies both in species richness and abundance throughout the environmental gradient. Many species are lost as the gradient of urbanization increases; yet, increasing environmental urbanization does not completely exclude some other species. For instance, Rhinella arenarum, Dendropsophus nanus, Dendropsophus sanborni, Elachistocleis bicolor and Rhinella dorbignyi were the most abundant species across all metropolitan area, but they were also the species with more noticeable variance in abundances among GUEs. And, with the exception of D. sanborni, present only in GUE2 and GUE3, the other five species were present in every GUE. This suggests that several species are able to find refuge in more urbanized sites and their populations can maintain and thrive in this type of environment (Henderson and Powell, 2001), although, in some cases, with low abundances.
Some studies proposed that there are species that can reach higher abundances in urban environments and that cities that can host rare species, resulting in novel species assemblages (Faeth et al., 2011; Hartop et al., 2015; Hall et al., 2017; Soanes and Lentini, 2019). We did not find rare species in more urbanized environments; still, we found that the species R. arenarum and L. mystacinus were more abundant in more urbanized sites (GUE4) compared to the other GUEs, thus, they could be categorized as urban tolerant species (Adams et al., 2020). On the one hand, some species can be classified as urban avoiders, as is possibly the case of Trachycephalus typhonius, since it was exclusive to less urbanized environments from GUE1. Trachycephalus typhonius is a large-sized species, which requires an extensive and dense surface of tall herbaceous, shrubby and arboreal vegetation to be able to shelter and move (White and Burgin, 2004; Ijie et al., 2021), characteristics generally absent in urban environments. We also found that the indicator species for GUE1 were Odontophrynus americanus and Leptodactylus gracilis. Some authors categorize Physalaemus biligonigerus as an urban tolerant species (Babini et al., 2015; Pereyra et al., 2021), but we found that this species, as well as its congeneric Physalaemus santafecinus, tend to avoid more urbanized environments, since they were also exclusive to sites of GUE1. Also, other authors had considered both species of genus Physalaemus to be more common in more natural environments (Entiauspe-Neto et al., 2016). However, a third member of this genus, Physalaemus albonotatus, was registered in all GUEs, indicating that the environmental filters that act in studied urban gradient are fine enough to screen cogeneric species from the same functional group (with a similar morphology and life history traits). The species E. bicolor, R. arenarum, R. dorbignyi, L. macrosternum, L. latinasus, P. albonotatus, D. nanus and S. nasicus were present in all the GUEs, so they could be considered urban tolerant (Pereyra et al., 2021). Although, some authors have considered them as urban avoiders’ species (Babini et al., 2015; Entiauspe-Neto et al., 2016; Pereyra et al., 2021), several of these species were recorded in urban environments of different cities in South America (Borteiro and Kolenc, 2007; Bionda et al., 2012; Babini et al., 2015; Entiauspe-Neto et al., 2016; Medina et al., 2016; Moser et al., 2021; Ganci et al., 2022; Rivas et al., 2023). The differences found by various authors for both tolerant and avoiders’ urban species may be due to the structural and physical variations among cities, since many medium-sized and growing cities in South America present a type of diffuse urban expansion, which includes great among and within environmental heterogeneity (Rausch et al., 2019), and therefore differences in the urban niches and environmental filters that they present to biodiversity. The indicator species for GUE2, Leptodactylus luctator, Dendropsophus nanus and D. sanborni, can tolerate a certain degree of habitat modification and still find suitable conditions that provide shelters, breeding sites and sufficient food resources (Gagné and Fahrig, 2007; Hamer and McDonnell, 2008).
The greatest functional richness observed in GUE2 should be related to the low building index (NDBI) and population density (P). These variables had similar values in GUE1 but, possibly, greater functional richness in GUE2 is due to the fact this group is a compound of four urban green spaces, of which two are urban natural reserves, highlighting the relevance of protected areas in urban environments to preserve biodiversity. This type of urban green space has several advantages compared to other spaces, in principle, they are continuously managed and controlled environments (Dudley, 2008), they are closed on the perimeter, which reduces access for domestic animals that could prey on amphibians (Woods et al., 2003). Furthermore, they do not have any type of lighting, reducing light pollution that affects amphibians (Gastón et al., 2019; Secondi et al., 2021) and entry to urban natural reserves is prohibited from dusk, which prevents passage of people and consequently of movement and noise during the period of the day of greatest activity of amphibians (Zaffaroni-Caorsi et al., 2022). The absence of differences in FRic between GUE2 and GUE4 can be explained by the fact that GUE4 is a subset of GUE2. Species that persist in GUE4 may be filling the functional space in GUE2, despite the significantly lower number of species in GUE4. This suggests that the species in GUE4 are able to maintain similar ecological functionality in GUE2, occupying available functional niches and contributing to functional stability despite lower species richness (Córdova Tapia and Zambrano, 2015).We did not find a significant difference between GUEs in the rest of the functional diversity indices, possibly due to the turnover of species and their abundances among the GUEs, since some species thrive in the most urbanized sites, allowing them to occupy the entire functional space of the GUEs with different types and degrees of urbanization. The lack of difference in FEve suggests that, regardless of the level of urbanization, species are performing ecological functions similarly across all groups of environments. This indicates that, while the functions might increase, the way these functions are distributed and utilized across species remains consistent, as also suggested by the absence of differences in FDis. Additionally, the lack of difference in FDiv implies that urbanization pressures are not significantly altering resource use by species. Despite changes in species composition due to urbanization, the functional diversity highlights the adaptability of ecosystem functions to urban pressures. This resilience underscores the importance of preserve diverse habitats within urban landscapes to maintain ecological stability and functionality (Mouchet et al., 2010; Córdova Tapia and Zambrano, 2015).
Urban biodiversity responds to both broad-scale urban gradients and fine-scale habitat heterogeneity (Adams et al., 2020). In general, increased urbanization corresponds with a decrease in species richness and biological homogenization (Aronson et al., 2014; Groffman et al., 2017), as we found for amphibians in the Santa Fe metropolitan area. We found that lower urbanization index (the amount of impervious soil), lower population density and higher vegetation cover are important to maintenance of amphibian diversity; as well as the presence of bodies of water with different hydroperiods (Plăiaşu et al., 2012; Tournier et al., 2017) and vegetation patches of different strata and with low pruning maintenance (Fraga-Ramírez et al., 2017; Sievers et al., 2019; Hutto and Barrett, 2021). Also, the presence of urban natural reserves may assure the environmental heterogeneity which allows the existence of a high diversity of amphibians in urban ecosystems (Demartín et al., 2024). One limitation of our study is the absence of a natural site within the urbanization gradient. By not including an environment with no urbanization, our comparisons of taxonomic and functional diversity are restricted to areas with varying degrees of urbanization. Future studies should address this gap by incorporating natural sites to provide a more comprehensive framework for understanding these effects.
Data availability statement
The original contributions presented in the study are included in the article/Supplementary Material. Further inquiries can be directed to the corresponding author.
Ethics statement
Ethical approval was not required for the study involving animals in accordance with the local legislation and institutional requirements because the individuals were captured for the measurement of morphometric variables and then released back at the collection site.
Author contributions
RD: Conceptualization, Data curation, Formal analysis, Investigation, Methodology, Software, Writing – original draft, Writing – review & editing. RG: Conceptualization, Funding acquisition, Methodology, Resources, Writing – original draft, Writing – review & editing. JL: Conceptualization, Investigation, Methodology, Resources, Writing – original draft, Writing – review & editing.
Funding
The author(s) declare financial support was received for the research, authorship, and/or publication of this article. This work was supported by Fondo para la Investigación Científica y Tecnológica (FONCyT PICT2020-Serie A-03835), CAI+D 2020 P I TIPO I 50520190100049LI (Universidad Nacional del Litoral).
Conflict of interest
The authors declare that the research was conducted in the absence of any commercial or financial relationships that could be construed as a potential conflict of interest.
Publisher’s note
All claims expressed in this article are solely those of the authors and do not necessarily represent those of their affiliated organizations, or those of the publisher, the editors and the reviewers. Any product that may be evaluated in this article, or claim that may be made by its manufacturer, is not guaranteed or endorsed by the publisher.
Supplementary material
The Supplementary Material for this article can be found online at: https://www.frontiersin.org/articles/10.3389/fevo.2024.1461147/full#supplementary-material
References
Adams B. J., Li E., Bahlai C. A., Meineke E. K., McGlynn T. P., Brown B. V. (2020). Local- and landscape-scale variables shape insect diversity in an urban biodiversity hot spot. Ecol. Appl. 30, e02089. doi: 10.1002/eap.2089
Altig R., Johnston G. F. (1989). Guilds of anuran larvae: Relationships among developmental modes, morphologies, and habitats. Herpetol. Monogr. 3, 81–109. doi: 10.1002/eap.2089
Angel S. (2023). Urban expansion: theory, evidence and practice. Buildings Cities 4, 124–138. doi: 10.5334/bc.348
Aronson M. F., La Sorte F. A., Nilon C. H., Katti M., Goddard M. A., Lepczyk C. A., et al. (2014). A global analysis of the impacts of urbanization on bird and plant diversity reveals key anthropogenic drivers. Proc. R. Soc B. 281, 20133330. doi: 10.1098/rspb.2013.3330
Babini M. S., Salas N. E., de Lourdes Bionda C., Martino A. L. (2015). Implicaciones de la urbanización en la presencia, distribución y ecología reproductiva de la fauna de anuros de una ciudad del área central de Argentina. Rev. Mex. Biodiver. 86, 188–195. doi: 10.7550/rmb.45528
Baselga A. (2010). Partitioning the turnover and nestedness components of beta diversity. Glob. Ecol. Biogeogr. 19, 134–143. doi: 10.1111/j.1466-8238.2009.00490.x
Bionda C., Salas N., Caraffa E., Baraquet M., Martino A. (2012). On abnormalities recorded in an urban population of Rhinella arenarum from central Argentina. Herpetol. Notes 5, 237–241.
Bonilla-Valencia L., Castillo-Agüero S., Zavala-Hurtado J. A., Espinosa García F. J., Lindig-Cisneros R., Martínez-Orea Y. (2022). Linking functional diversity to ecological indicators: a tool to predict anthropogenic effects on ecosystem functioning. Environ. Rev. 30, 175–183. doi: 10.1139/er-2021-0093
Borteiro C., Kolenc F. (2007). Redescription of the tadpoles of three species of frogs from Uruguay (Amphibia: Anura: Leiuperidae and Leptodactylidae), with notes on natural history. Zootaxa. 1638, 1–20. doi: 10.11646/zootaxa.1638.1.1
Botta-Dukát Z., Czúcz B. (2016). Testing the ability of functional diversity indices to detect trait convergence and divergence using individual-based simulation. Methods Ecol. Evol. 7, 114–126. doi: 10.1111/2041-210X.12450
Cadotte M. W., Carscadden K., Mirotchnick N. (2011). Beyond species: functional diversity and the maintenance of ecological processes and services. J. Appl. Ecol. 48, 1079–1087. doi: 10.1016/j.baae.2021.04.008
Callaghan C. T., Benedetti Y., Wilshire J. H., Morelli F. (2020). Avian trait specialization is negatively associated with urban tolerance. Oikos. 129, 1541–1551. doi: 10.1111/oik.07356
Celemín J. P., Arias M. E. (2022). Variabilidad espacial del índice de vegetación diferencial normalizado (NDVI) en los barrios de la ciudad de Mar del Plata (Argentina) (Mar del Plata, Argentina: II Jornadas Nacionales de Geografía de la Universidad Nacional de Mar del Plata), 163–172.
Clarke K. R., Warwick R. M. (2001). Change in marine communities: an approach to statistical analysis and interpretation. 2nd Edition (United Kingdom: PRIMER-E, Ltd., Plymouth Marine Laboratory, Plymouth, United Kingdom).
Coelho A. L. N., Correa W. D. S. C. (2013). Temperatura de Superfície Celsius do Sensor TIRS/Landsat-8: metodologia e aplicações. Rev. Geogr. Acad. 7, 31–45. doi: 10.18227/1678-7226rga.v7i1.2996
Collins J. P., Storfer A. (2003). Global amphibian declines: sorting the hypotheses. Divers. Distrib. 9, 89–98. doi: 10.1046/j.1472-4642.2003.00012.x
Cortés-Gómez A. M.M., Ruiz-Agudelo C. A., Valencia-Aguilar A., Ladle R. J. (2015). Ecological functions of neotropical amphibians and reptiles: a review. Univ Sci 20, 229–245. doi: 10.11144/Javeriana.SC20-2.efna
Córdova Tapia F., Zambrano L. (2015). La diversidad funcional en la ecología de comunidades. Rev. Ecosis. 24, 78–87. doi: 10.11144/Javeriana.SC20-2.efna17
De Cáceres M., Legendre P. (2009). Associations between species and groups of sites: indices and statistical inference. Ecology. 90, 3566–3574. doi: 10.1890/08-1823.1
Demartín R. P., Ghirardi R., López J. A. (2024). High amphibian diversity throughout urban environmental heterogeneity. Urban Ecosyst. doi: 10.1007/s11252-024-01574-6
Deng J., Zhu Y., Luo Y., Zhong Y., Tu J., Yu J., et al. (2024). Urbanization drives biotic homogenization of the avian community in China. Integr. Zoo. 00, 1–13. doi: 10.1111/1749-4877.12815
Dudgeon D., Arthington A. H., Gessner M. O., Kawabata Z. I., Knowler D. J., Lévêque C., et al. (2006). Freshwater biodiversity: importance, threats, status and conservation challenges. Biol. Rev. 81, 163–182. doi: 10.1017/S1464793105006950
Dudley N. (2008). Directrices para la aplicación de las categorías de gestión de áreas protegidas (Gland (Suiza: Unión Internacional para la Conservación de la Naturaleza, Comisión Mundial de Áreas Protegidas, Consejería de Medio Ambiente de la Junta de Andalucía y Fundación Biodiversidad), 96.
Entiauspe-Neto O. M., Perleberg T. D., de Freitas M. A. (2016). Herpetofauna from an urban Pampa fragment in southern Brazil: composition, structure and conservation. Check List. 12, 1964–1964. doi: 10.15560/12.5.1964
Esparza-Orozco A., Lira-Noriega A., Martínez-Montoya J. F., Pineda-Martínez L. F., de Jesus Mendez-Gallegos S. (2020). Influences of environmental heterogeneity on amphibian composition at breeding sites in a semiarid region of Mexico. J. Arid Environ. 182, 104259. doi: 10.1016/j.jaridenv.2020.104259
Faeth S. H., Bang C., Saari S. (2011). Urban biodiversity: patterns and mechanisms. Ann. New York Acad. Sci. 1223, 69–81. doi: 10.1111/j.1749-6632.2010.05925.x
Fahrig L. (2003). Effects of habitat fragmentation on biodiversity. Annu. Rev. Ecol. Evol. Syst. 34, 487–515. doi: 10.1146/annurev.ecolsys.34.011802.132419
Fraga-Ramírez Y., Suazo-Ortuño I., Avila-Cabadilla L. D., Alvarez-Añorve M., Alvarado-Díaz J. (2017). Multiscale analysis of factors influencing herpetofaunal assemblages in early successional stages of a tropical dry forest in western Mexico. Biol. Conserv. 209, 196–210. doi: 10.1016/j.biocon.2017.02.016
Gagné S. A., Fahrig L. (2007). Effect of landscape context on anuran communities in breeding ponds in the National Capital Region, Canada. Landscape Ecol. 22, 205–215. doi: 10.1007/s10980-006-9012-3
Ganci C. C., Provete D. B., Püttker T., Lindenmayer D., Almeida-Gomes M. (2022). High species turnover shapes anuran community composition in ponds along an urban-rural gradient. Urban Ecosyst. 25, 633–642. doi: 10.1007/s11252-021-01146-5
Gastón M. S., Pereyra L. C., Vaira M. (2019). Artificial light at night and captivity induces differential effects on leukocyte profile, body condition, and erythrocyte size of a diurnal toad. JEZ-A. 331, 93–102. doi: 10.1002/jez.2263
Ghirardi R., López J. A. (2020). Anfibios de santa fe. Ediciones UNL. 2da (Santa Fe: Ediciones UNL). Available online at: https://bibliotecavirtual.unl.edu.ar:8443/handle/11185/6793 (Accessed June 21, 2024).
Gonzalez Baffa-Trasci N. V., Pereyra L. C., Akmentins M. S., Vaira M. (2020). Responses of anuran diversity to wetland characteristics and surrounding landscape in the Southern Andean Yungas, Argentina. Aquat. Conserv.: Mar. Freshw. Ecosyst. 30, 1437–1450. doi: 10.1002/aqc.3346
Groffman P. M., Avolio M., Cavender-Bares J., Bettez N. D., Grove J. M., Hall S. J., et al. (2017). Ecological homogenization of residential macrosystems. Nat. Ecol. Evol. 1, 191. doi: 10.1038/s41559-017-0191
Hall D. M., Camilo G. R., Tonietto R. K., Ollerton J., Ahrne K., Arduser M., et al. (2017). The city as a refuge for insect pollinators. Conserv. Biol. 31, 24–29. doi: 10.1111/cobi.12840
Hamer A. J., McDonnell M. J. (2008). Amphibian ecology and conservation in the urbanising world: a review. Biol. Conserv. 141, 2432–2449. doi: 10.1016/j.biocon.2008.07.020
Hamer A. J., McDonnell M. J. (2010). The response of herpetofauna to urbanization: inferring patterns of persistence from wildlife databases. Austral Ecol. 35, 568–580. doi: 10.1111/j.1442-9993.2009.02073.x
Hartop E. A., Brown B. V., Disney R. H. L. (2015). Opportunity in our ignorance: urban biodiversity study reveals 30 new species and one new Nearctic record for Megaselia (Diptera: Phoridae) in Los Angeles (California, USA). Zootaxa. 3941, 451–484. doi: 10.11646/zootaxa.3941.4.1
Henderson R. W., Powell R. (2001). Responses by the West Indian herpetofauna to human influenced resources. Caribb. J. Sci. 37, 41–54.
Hodgkison S. C., Hero J. M., Warnken J. (2007). The efficacy of small-scale conservation efforts, as assessed on Australian golf courses. Biol. Conserv. 135, 576–586. doi: 10.1016/j.biocon.2006.11.001
Hsieh T. C., Ma K. H., Chao A. (2016). INEXT: An R package for rarefaction and extrapolation of species diversity (Hill numbers). Methods Ecol. Evol. 7, 1451–1456. doi: 10.1111/2041-210X.12613
Huntington J. L., Hegewisch K. C., Daudert B., Morton C. G., Abatzoglou J. T., McEvoy D. J., et al. (2017). Climate engine: cloud computing of climate and remote sensing data for advanced natural resource monitoring and process understanding. Bull. Am. Met. Soc. 98, 2397–2410. doi: 10.1175/BAMS-D-15-00324.1
Hutto D., Barrett K. (2021). Do urban open spaces provide refugia for frogs in urban environments? PloS One 16, 1–19. doi: 10.1371/journal.pone.0244932
Ijie M. E., Alari E. O., Ogoanah S. O., Aisien M. S. O. (2021). Amphibian diversity in urban and peri-urban landscapes of Benin City, a southern Nigerian city in the rainforest biotope. Zoologist. 19, 52–59. doi: 10.4314/tzool.v19i1.8
INDEC (2022). Censo Nacional de Población, Hogares y Viviendas. Available online at: https://www.indec.gob.ar/indec/web/Nivel4-Tema-2-41-165 (Accessed July 05, 2024).
IUCN (2023). Re:wild, synchronicity earth, IUCN SSC amphibian specialist group. State of the world’s amphibians: the second global amphibian assessment (Texas, USA: IUCN). Available at: https://nc.iucnredlist.org/redlist/resources/files/1696400756-SOTWA_GAA2_04Oct2023.pdf.
Jarzyna M. A., Jetz W. (2016). Detecting the multiple facets of biodiversity. Trends Ecol. Evol. 31, 527–538. doi: 10.1016/j.tree.2016.04.002
Jedwab R., Loungani P., Yezer A. (2021). Comparing cities in developed and developing countries: Population, land area, building height and crowding. Reg. Sci. Urban Econ. 86, 103609. doi: 10.1016/j.regsciurbeco.2020.103609
Kondratyeva A., Knapp S., Durka W., Kühn I., Vallet J., Machon N., et al. (2020). Urbanization effects on biodiversity revealed by a two-scale analysis of species functional uniqueness vs. redundancy. Front. Ecol. Evol. 8. doi: 10.3389/fevo.2020.00073
Kruger D. J., Hamer A. J., Du Preez L. H. (2015). Urbanization affects frog communities at multiple scales in a rapidly developing African city. Urban Ecosyst. 18, 1333–1352. doi: 10.1007/s11252-015-0443-y
Laliberté E., Legendre P. (2010). A distance-based framework for measuring functional diversity from multiple traits. Ecology. 91, 299–305.
Laliberté E., Legendre P., Shipley B., Laliberté M. E. (2014). Package ‘fd’. Measuring functional diversity from multiple traits, and other tools for functional ecology. R Package FD, Version 1.0-12.
Li B., Zhang W., Shu X., Pei E., Yuan X., Wang T., et al. (2018). Influence of breeding habitat characteristics and landscape heterogeneity on anuran species richness and abundance in urban parks of Shanghai, China. Urban For. Urban Greening. 32, 56–63. doi: 10.1016/j.ufug.2018.03.017
López J. A., Scarabotti P. A., Ghirardi R. (2011). Seasonal patterns of abundance and recruitment in an amphibian assemblage from the Paraná River floodplain. Interciencia 36, 538–544. Available online at: https://www.redalyc.org/articulo.oa?id=33919424010 (Accessed June 20, 2024).
López J. A., Scarabotti P. A., Ghirardi R. (2015). Amphibian trophic ecology in increasingly human-altered wetlands, US Geological Survey. Herpetol. Conserv. Biol. 10, 819–832. Available online at: http://hdl.handle.net/11336/59860 (Accessed June 20, 2024).
Malaterre C., Dussault A. C., Mermans E., Barker G., Beisner B. E., Bouchard F., et al. (2019). Functional diversity: An epistemic roadmap. BioScience. 69, 800–811. doi: 10.1093/biosci/biz089
Mason N. W., Mouillot D., Lee W. G., Wilson J. B. (2005). Functional richness, functional evenness and functional divergence: the primary components of functional diversity. Oikos. 111, 112–118. doi: 10.1111/j.0030-1299.2005.13886.x
Matteucci S., Rodriguez A., Silva M., de Haro C. (2012). Ecorregiones y complejos ecosistémicos argentinos (Buenos Aires: Orientación Gráfica Editora), 309–348.
McKinney M. L. (2006). Urbanization as a major cause of biotic homogenization. Biol. Conserv. 127, 247–260. doi: 10.1016/j.biocon.2005.09.005
Medina R. G., Ponssa M. L., Aráoz E. (2016). Environmental, land cover and land use constraints on the distributional patterns of anurans: Leptodacylus species (Anura, Leptodactylidae) from Dry Chaco. PeerJ. 4, e2605. doi: 10.7717/peerj.2605
Montgomery M. R. (2008). The urban transformation of the developing world. Science 319(5864), 761–764.
Moor H., Bergamini A., Vorburger C., Holderegger R., Bühler C., Egger S., et al. (2022). Bending the curve: Simple but massive conservation action leads to landscape-scale recovery of amphibians. PNAS. 119, 1–8. doi: 10.1073/pnas.21230701
Moser C. F., Farina R. K., Borges-Martins M., MaChado I. F., Colombo P., Tozetti A. M. (2021). Amphibians of the sinos river basin, southern Brazil. Neotrop. Biol. Conserv. 16, 435–449. doi: 10.3897/neotropical.16.e65843
Mouchet M. A., Villéger S., Mason N. W., Mouillot D. (2010). Functional diversity measures: an overview of their redundancy and their ability to discriminate community assembly rules. Funct. Ecol. 24, 867–876. doi: 10.1111/j.1365-2435.2010.01695.x
Mouillot D., Graham N. A. J., Villéger S., Mason N. W. H., Bellwood D. R. (2013). A functional approach reveals community responses to disturbances. Trends Ecol. Evol. 28, 167–177. doi: 10.1016/j.tree.2012.10.004
Oksanen J. (2009). Ordination and analysis of dissimilarities: tutorial with R and Vegan (Knoxville, TN, USA: University Tennessee).
Oksanen J., Blanchet F. G., Friendly M., Kindt R., Legendre P., McGlinn D., et al. (2019). vegan: community ecology package. Available online at: https://cran.r-project.org/package=vegan (Accessed June 11, 2024).
Olden J. D., Rooney T. P. (2006). On defining and quantifying biotic homogenization. Global Ecol. Biogeogr. 15, 113–120. doi: 10.1111/j.1466-822X.2006.00214.x
Paludo Smaniotto N., Bairos Moreira L. F. (2023). Anuran detectability and calling phenology in urban ponds from the Brazilian Savanna. Cuad. Herpetol. 37, 25–36. Available online at: https://cuadernosdeherpetologia.com/index.php/CdH/article/view/72 (Accessed June 25, 2024).
Parris K. M. (2006). Urban amphibian assemblages as metacommunities. J. Anim. Ecol. 75, 757–764. doi: 10.1111/j.1365-2656.2006.01094.x
Pereyra L. C., Akmentins M. S., Salica M. J., Quiroga M. F., Moreno C. E., Vaira M. (2021). Tolerant and avoiders in an urban landscape: anuran species richness and functional groups responses in the Yungas’ forest of NW Argentina. Urban Ecosyst. 24, 141–152. doi: 10.1007/s11252-020-01016-y
Pillsbury F. C., Miller J. R. (2008). Habitat and landscape characteristics underlying anuran community structure along an urban–rural gradient. Ecol. Appl. 18, 1107–1118. doi: 10.1890/07-1899.1
Plăiaşu R., Băncilă R., Samoilă C., Hartel T., Cogălniceanu D. (2012). Waterbody availability and use by amphibian communities in a rural landscape. Herpetol. J. 22, 13–21. doi: 10.5167/uzh-88472
Ramesh R., Griffis-Kyle K., Perry G., Farmer M. (2012). Urban amphibians of the Texas panhandle: baseline inventory and habitat associations in a drought year. Reptiles Amphibians. 19, 243–253. doi: 10.17161/randa.v19i4.13918
Rausch G. A., Martínez I., Nardelli M. L., Szupiany E. (2019). Concentración/dispersión en Santa Fe, Argentina: problemáticas e interrogantes sobre los procesos urbanos contemporáneos en una ciudad media de América Latina. Cuad. Geogr. Rev. Colomb. Geogr. 28, 66–88. doi: 10.15446/rcdg.v28n1.68757
R Core Team (2024). R: A language and environment for statistical computing (Vienna, Austria: R Foundation for Statistical Computing).
Rega-Brodsky C. C., Aronson M. F., Piana M. R., Carpenter E. S., Hahs A. K., Herrera-Montes A., et al. (2022). Urban biodiversity: State of the science and future directions. Urban Ecosyst. 25, 1083–1096. doi: 10.1007/s11252-022-01207-w
Riemann J. C., Ndriantsoa S. H., Rödel M. O., Glos J. (2017). Functional diversity in a fragmented landscape — Habitat alterations affect functional trait composition of frog assemblages in Madagascar. Global Ecol. Conserv. 10, 173–183. doi: 10.1016/j.gecco.2017.03.005
Rivas L. R., Eversole C. B., Powell R. L. (2023). Urban herpetofauna of trinidad, beni department, Bolivia. Herpetol. Notes. 16, 399–410.
Rouse J. W., Haas R. H., Schell J. A., Deering D. W., Harlan J. C. (1974). Monitoring the vernal advancement and retrogradation (greenwave effect) of natural vegetation, NASA/GSFC Type III Final Report (Greenbelt, Maryland: NASA Goddard Space Flight Center).
Secondi J., Mondy N., Gippet J. M. W., Touzot M., Gardette V., Guillard L., et al. (2021). Artificial light at night alters activity, body mass, and corticosterone level in a tropical anuran. Behav. Ecol. 32, 932–940. doi: 10.1093/beheco/arab044
Seto K. C., Güneralp B., Hutyra L. R. (2012). Global forecasts of urban expansion to 2030 and direct impacts on biodiversity and carbon pools. Proc. Natl. Acad. Sci. 109, 16083–16088. doi: 10.1073/pnas.12116581
Sievers M., Brown C. J., Tulloch V. J. D., Pearson R. M., Haig J. A., Turschwell M. P., et al. (2019). The role of vegetated coastal wetlands for marine megafauna conservation. Trends Ecol. Evol. 34, 807–817. doi: 10.1016/j.tree.2019.04.004
Soanes K., Lentini P. E. (2019). When cities are the last chance for saving species. Front. Ecol. Environ. 17, 225–231. doi: 10.1002/fee.2030
Sun L., Chen J., Li Q., Huang D. (2020). Dramatic uneven urbanization of large cities throughout the world in recent decades. Nat. Commun. 11, 5366. doi: 10.1038/s41467-020-19105-6
Tan W. C., Herrel A., Rödder D. (2023). A global analysis of habitat fragmentation research in reptiles and amphibians: what have we done so far? Biodiversity Conserv. 32, 439–468. doi: 10.1007/s10531-022-02341-0
Tournier E., Besnard A., Tournier V., Cayuela H. (2017). Manipulating waterbody hydroperiod affects movement behaviour and occupancy dynamics in an amphibian. Freshw. Biol. 62, 1768–1782. doi: 10.1111/fwb.12988
Tsianou M. A., Kallimanis A. S. (2020). Geographical patterns and environmental drivers of functional diversity and trait space of amphibians of Europe. Ecol. Res. 35, 123–138. doi: 10.1007/s11284-019-01773-5
United Nations (2018). World urbanization prospects: the 2018 revision (New York, New York: Department of Economic and Social Affairs, Population Division).
Villéger S., Mason N. W., Mouillot D. (2008). New multidimensional functional diversity indices for a multifaceted framework in functional ecology. Ecology. 89, 2290–2301. doi: 10.1890/07-1206.1
White A. W., Burgin S. (2004). Current status and future prospects of reptiles and frogs in Sydney’s urban-impacted bushland reserves in Urban Wildlife: more than meets the eye. Eds. Lunney D., Burgin S. (Wales: Royal Zoological Society of New South Wales), 109–123. doi: 10.7882/FS.2004.087
Woods M., McDonald R. A., Harris S. (2003). Predation of wildlife by domestic cats Felis catus in Great Britain. Mammal Rev. 33, 174–188. doi: 10.1046/j.1365-2907.2003.00017.x
Yang L., Zhao S., Liu S. (2022). A global analysis of urbanization effects on amphibian richness: Patterns and drivers. Global Env. Change 73, 102476. doi: 10.1016/j.gloenvcha.2022.102476
Zaffaroni-Caorsi V., Both C., Márquez R., Llusia D., Narins P., Debon M., et al. (2022). Effects of anthropogenic noise on anuran amphibians. Bioacoustics. 32, 90–120. doi: 10.1080/09524622.2022.2053788
Zha Y., Gao J., Ni S. (2003). Use of normalized difference built-up index in automatically mapping urban areas from TM imagery. Int. J. Remote Sens. 24, 583–594. doi: 10.1080/01431160304987
Zhang W., Li B., Shu X., Pei E., Yuan X., Sun Y., et al. (2016). Responses of anuran communities to rapid urban growth in Shanghai, China. Urban For. Urban Greening. 20, 365–374. doi: 10.1016/j.ufug.2016.10.009
Keywords: Anura, city, beta diversity, functional diversity, developing countries
Citation: Demartín RP, Ghirardi R and López JA (2024) Amphibian diversity across an urban gradient in southern South America. Front. Ecol. Evol. 12:1461147. doi: 10.3389/fevo.2024.1461147
Received: 07 July 2024; Accepted: 21 August 2024;
Published: 12 September 2024.
Edited by:
Laura Pereyra, CONICET Instituto de Ecorregiones Andinas (INECOA), ArgentinaReviewed by:
Camila Moser, Federal University of Pará, BrazilJackson Preuss, University of West of Santa Catarina, Brazil
Copyright © 2024 Demartín, Ghirardi and López. This is an open-access article distributed under the terms of the Creative Commons Attribution License (CC BY). The use, distribution or reproduction in other forums is permitted, provided the original author(s) and the copyright owner(s) are credited and that the original publication in this journal is cited, in accordance with accepted academic practice. No use, distribution or reproduction is permitted which does not comply with these terms.
*Correspondence: Rocio Pamela Demartín, cm9jaW9kZW1hcnRpbkBnbWFpbC5jb20=
†ORCID: Romina Ghirardi, orcid.org/0000-0001-8784-3577
Javier Alejandro López, orcid.org/0000-0002-5156-6915