- 1Key Laboratory of Mariculture and Stock Enhancement in North China Sea, Ministry of Agriculture and Rural Affairs, Dalian Ocean University, Dalian, Liaoning, China
- 2Institute of Geological Sciences, Freie Universität Berlin, Berlin, Germany
- 3Mollusk Research Department, Dalian Shell Museum, Dalian, Liaoning, China
Introduction: The adaptability of intertidal gastropods to their environmental niches is a critical aspect of their survival. Littorina brevicula, a common intertidal snail, exhibits phenotypic plasticity in response to varying tidal conditions. This study investigates the phenotypic plasticity and shell structure of L. brevicula across two disparate tidal zones to understand how these factors influence shell morphology and growth.
Methods: A total of 254 specimens of L. brevicula were collected from the intertidal expanse. The analytical approach was tripartite, including traditional morphometric techniques, geometric morphometric methods (GM), and three-dimensional (3D) model simulation analyses. This comprehensive methodology allowed for a detailed examination of shell morphology and growth patterns.
Results: The results demonstrated that shell growth in the high tidal zone was slower compared to the mid tidal zone. Morphological disparities were evident, with high tidal zone specimens showing lower spires and a more spherical shell conformation, while mid tidal zone specimens had elongated spires and a tower-like shell shape. 3D model simulation analyses revealed different stress distributions; the mid-tide zone simulation showed concentrated stress in a circumscribed region, whereas the high-tide zone simulation showed a more expansive stress distribution across the entire shell.
Discussion: The distinct morphological adaptations observed in L. brevicula across tidal zones suggest a strong influence of environmental factors on shell morphology. The slower growth and different stress distribution patterns in the high tidal zone may be indicative of the snails' response to more challenging environmental conditions. These findings provide essential evidence for understanding the adaptability of intertidal gastropods to their environmental niches.
1 Introduction
Aquatic invertebrates have long been recognized as being significantly influenced by water flow, as documented in prior research (Statzner, 2008; Verhaegen et al., 2019). Many species of aquatic invertebrates exhibit adaptability in response to water flow variations (Hüber, 1870; Statzner, 2008).Gastropods are ideal research subjects for studying the adaptability of species to water flow due to their ability to live in aquatic environments for extended periods (Verhaegen et al., 2019).Jobin and Ippen (1964) conducted a water flow adaptability study on the freshwater snail Australorbis glabratus, suggesting that water flow resistance can alter its movement behavior, causing displacement when the water flow rate exceeds 33cm/s. Moore tested the effects of water flow on the adhesion ability of some Lymnaeidae species on different substrates and found that water flow weakens the attachment ability of gastropods, and different substrates have varying impacts on their attachment ability. Basalt reefs and gravel substrates are suitable for gastropod attachment, while sandy and clay substrates are not. Additionally, small Lymnaeidae individuals are more susceptible to the effects of water flow compared to larger individuals (Moore, 1964). Kitching et al. conducted a study on the intertidal zone inhabitant Nucella lapillus and found that gastropod species exhibit adaptive changes to ocean waves. Specifically, N. lapillus specimens from open coastlines were characterized by wider shell apertures, lighter shell weights, augmented shell mass, larger foot dimensions, and enhanced gripping capabilities in comparison to those from turbulent wave areas (Kitching et al., 1966).
Mollusks exhibit interspecific differences in their ability to withstand water flow (Dussart, 1987). Verhaegen et al. (2019) conducted a study on the water flow adaptability of Potamopyrgus antipodarum employing a diverse array of methodologies, including morphometrics and computational fluid dynamics. They found that the resistance and lift forces experienced by the shell of P. antipodarum increased with increasing shell height. It was determined that the size of the foot correlates with the overall dimensions of the shell rather than the aperture size. Moreover, both the shell shape and foot size were discerned to bear no significant relationship with the displacement velocity of the shell within rapidly flowing water currents.
Understanding the mechanisms underlying the origin and maintenance of biodiversity is an important goal in modern biology (Vonlanthen et al., 2012). The study of morphological variation has emerged as an indispensable facet of such inquiries (Debat and David, 2001; Márquez et al., 2015). Changes in animal morphology are influenced by environmental effects and genetic mutations, and there is often an interaction between morphological variation and environmental factors, with the environment determining the advantageous traits that must exist (Vonlanthen et al., 2012).
The impact of water flow velocity on the shell shape of gastropods is complex (Vergara et al., 2016; Verhaegen et al., 2018a, 2018) and requires further investigation. Previous research on the effects of water flow velocity on gastropods has mainly focused on ecological and behavioral aspects, with morphological investigations remaining relatively scant and disproportionately skewed towards the study of the foot. Furthermore, these studies have not integrated geometric morphometrics, shell stress analysis, and multiple approaches for comprehensive research.
The gastropod Littorina brevicula is primarily found in the northwest Pacific, specifically along the coastlines of China, Japan, and the Korean Peninsula. Its original discovery was made near the Yangtze River estuary in China (Philippi, 1844). It is especially abundant along the coast of Liaoning Province, and its distribution extends southward to Guangdong Province (Zhang, 2008; Yang et al., 2013; Chang et al., 2016). The Littorina brevicula exhibits a gregarious behavior, forming large colonies on rocky surfaces in the intertidal and high tidal zones. It further demonstrates a remarkable capacity to endure protracted aerial exposure (Chang et al., 2016; Zhang et al., 2016).
The present experiment primarily aims to analyze the differences in shell shape of Littorina brevicula across different tidal zones using geometric morphometrics, three-dimensional image analysis techniques. Concurrently, flow velocity conditions in high and mid-tidal zones will be simulated and calculated to investigate the effects of flow velocity on phenotypic plasticity in gastropods. This research will contribute to a better understanding of the adaptability of gastropods to flow velocity and its impact on morphological changes.
2 Material and methods
2.1 Sample collection
During the period from September to November 2020, a total of 254 specimens of L. brevicula (Figure 1A) were collected from the intertidal expanse of the Heishijiao region in Dalian, China (38.87N, 121.55E) (Figure 2A). To demarcate the boundary between the high-tide zone and the mid-tide zone, specific points were identified and sequentially connected. Points 1-5 were determined and connected along the high-tide line during spring tides, while points 6-10 were determined and connected along the high-tide line during neap tides (Figure 2B). A total of 124 specimens were collected in the high-tide zone, and 130 specimens were collected from the mid-tide zone. These specimens were temporarily kept at the Key Laboratory of Northern Mariculture, Ministry of Agriculture and Rural Affairs, Dalian Ocean University for three days, where they were cleaned to remove shell surface attachments, and then measurements and experimental preparations were conducted.
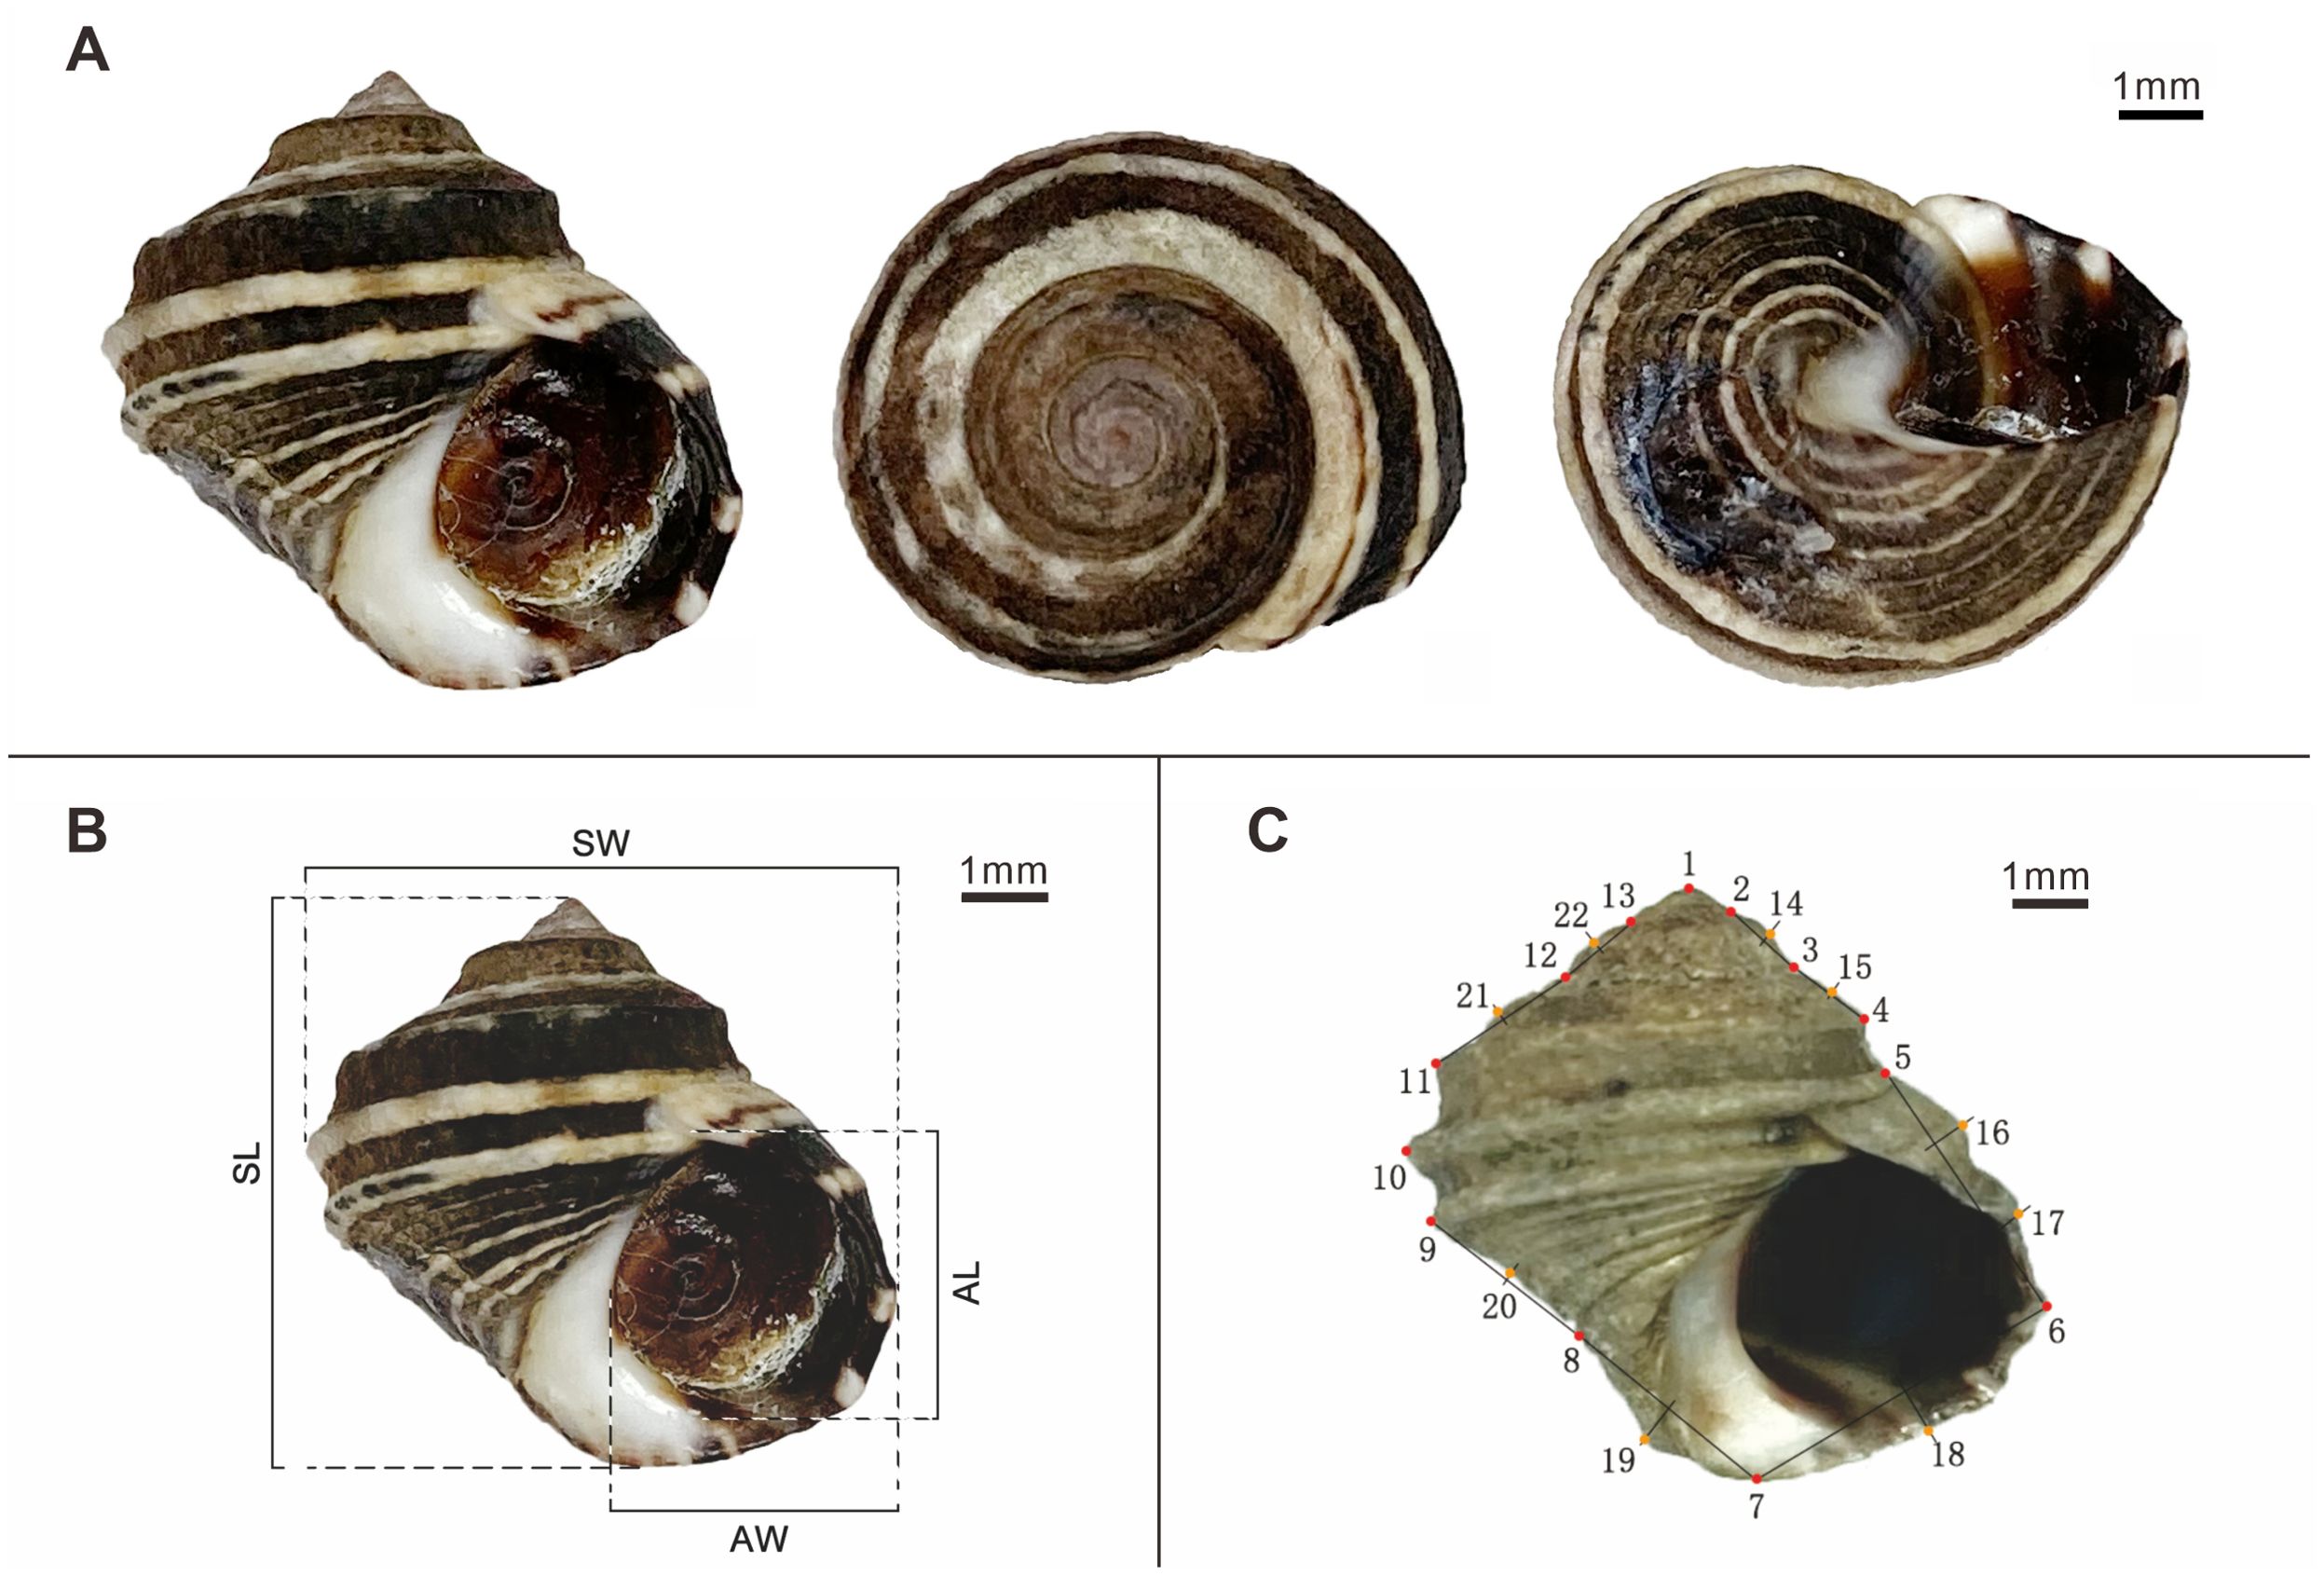
Figure 1. Morphological Illustrations of L. brevicula. (A) Depiction of L. brevicula from the front, top and basal views; (B) Traditional morphometrical measurements of L. brevicula; (C) Localization of the 13 landmarks and 9 semi-landmarks on L. brevicula.
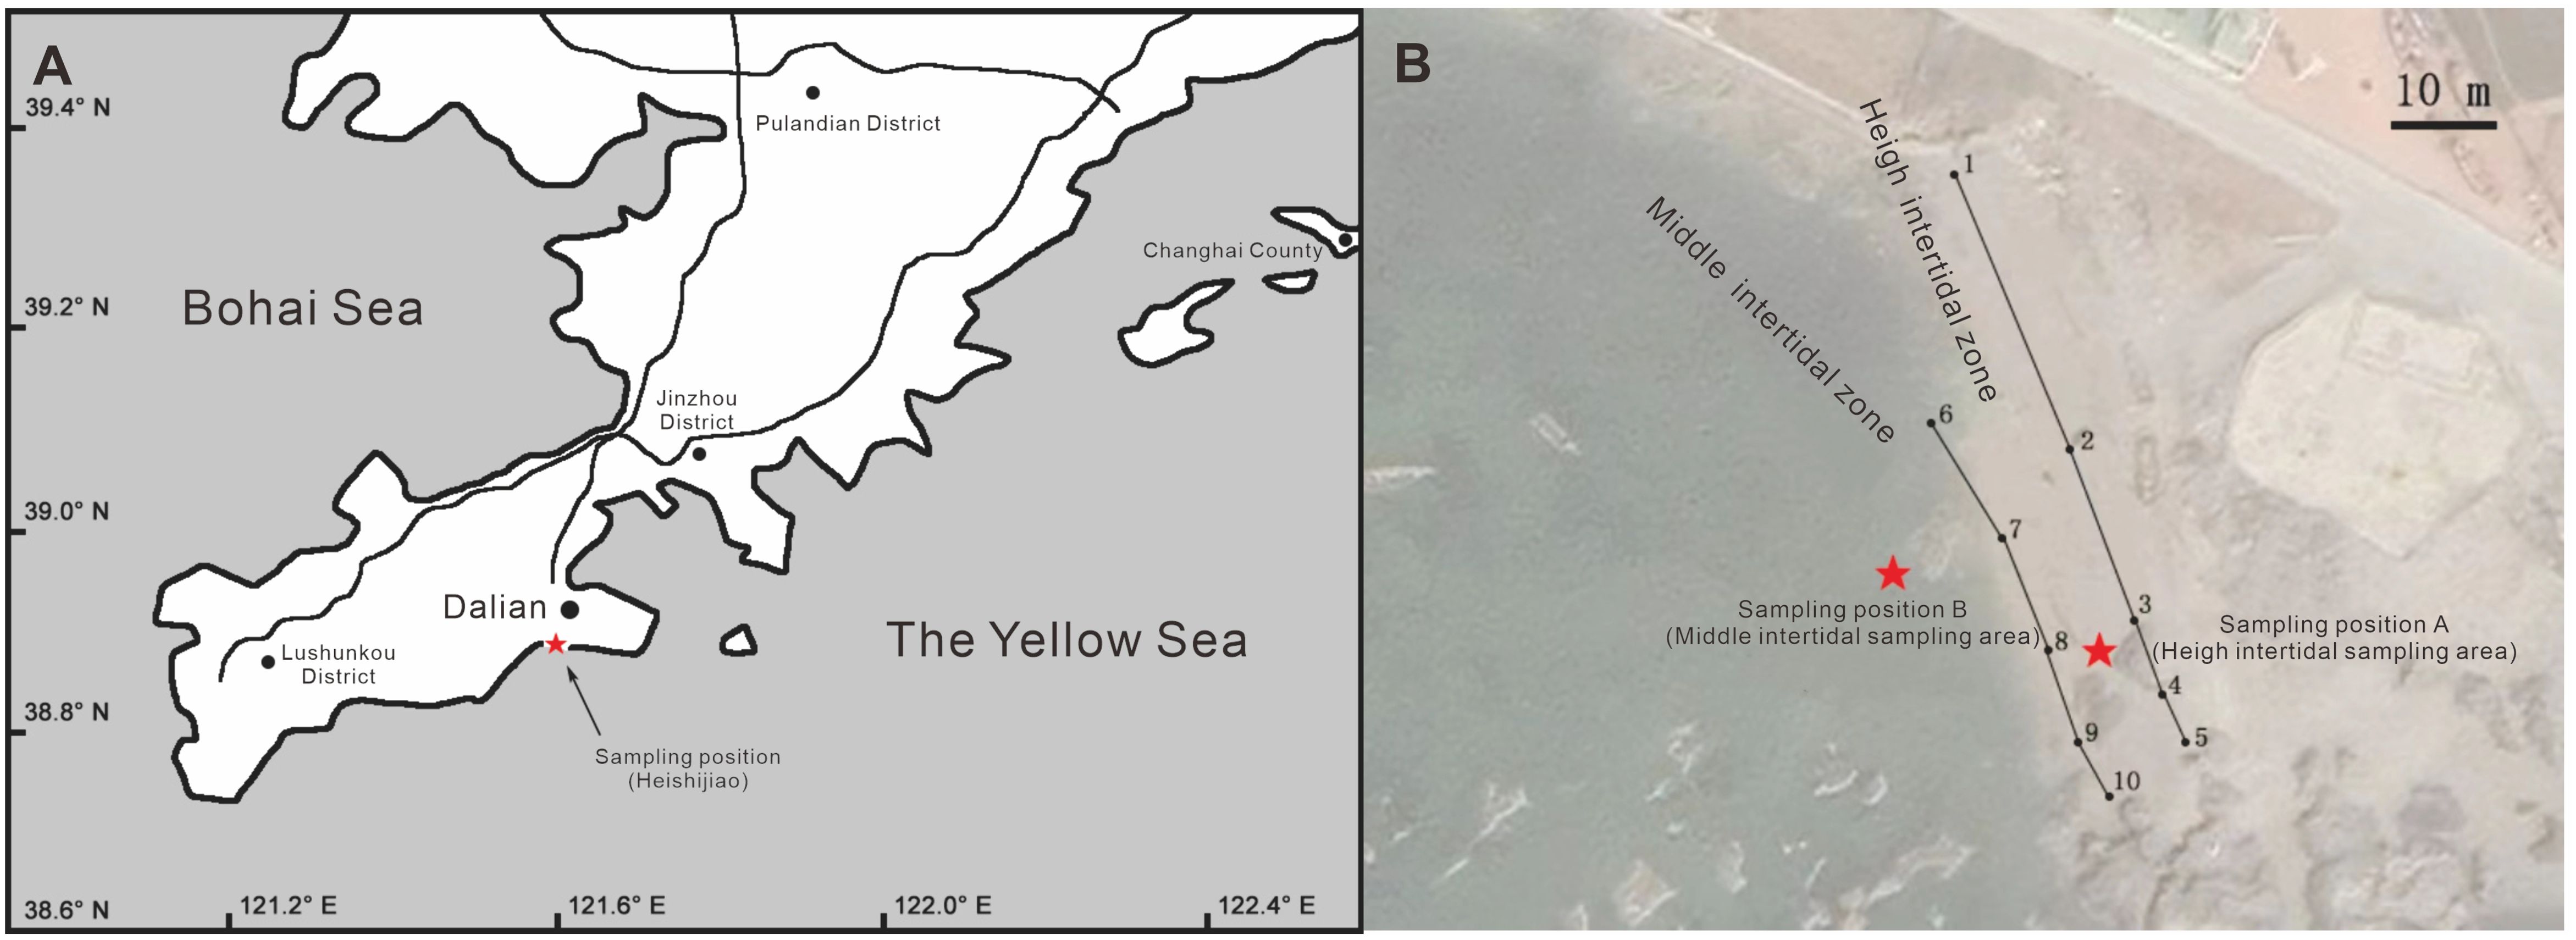
Figure 2. Sampling sites. (A) Indication of sampling positions;(B) Detailed mapping of precise sampling locations.
2.2 Flow velocity measurement
The water flow velocities at sampling points A in the high-tide zone and B in the mid-tide zone (Figure 2B) were measured using the flow velocity meter (XIANGRUIDE LS300-A).The locations for measuring the water flow velocities were the same as the sample collection points. The probe of the flow meter was vertically inserted into the water at the sampling points to measure the flow velocity towards the shore. To minimize the influence of wind and impurities in the water on the impeller of the flow velocity meter and reduce measurement errors, the flow velocity was measured five times at each location, and the average value was calculated. The sampling point in the high-tide zone of the intertidal zone has a higher water flow velocity, with an average velocity of 12.5 cm/s, while the mid-tide zone in the intertidal zone has a lower flow velocity, with an average velocity of 7.0 cm/s. (Supplementary Table S1)
2.3 Morphometric measurements
2.3.1 Traditional morphometric measurements
After cleaning the surface of the shells, electronic calipers (0.01mm) were used to measure the shell length (SL), shell width (SW), aperture length (AL), and aperture width (AW) of the shells. The measurement accuracy was 0.01mm (Figure 1B).
2.3.2 Geometric morphometrics
2.3.2.1 Acquisition of geometric morphometric images
The camera (Canon G12) was used to capture images of the anterior (aperture side) of each individual. To optimize the accuracy and minimize potential errors, a single operator was tasked to conducted the image acquisition and subsequent digitization. The shells were photographed with the umbo’s vertical line on the Y-axis and the disc on the same plane, parallel to the camera at a fixed distance (Lai et al., 2023). The distance was set at 125 mm to ensure consistent scale across different samples and reduce distortion caused by parallax during projection (Mullin and Taylor, 2002).
For the analysis of the two-dimensional images of the samples from two different intertidal zones, a combined approach of landmark points and semi-landmark points (Márquez et al., 2010) was utilized. ImageJ 1.4.3.67 software was used for annotation and digitization. The selection of landmark points was based on their scientific significance, reflecting the morphological differences of the study subject, and ensuring homology across all samples. Semi-landmark points were employed to define the overall contour of the study subject in a more precise manner, complementing the landmark points (Shi, 2017).
Adapted from Neubauer et al. (2021), a total of 22 markers were selected for analysis. Landmark points, representing specific biological characteristics of L. brevicula, were assigned to points 1-13. Semi-landmark points, chosen along the contour line of the shell edge in the two-dimensional image, were assigned to points 14-22.Within the semi-landmark points, points 14-15 and 18-22 were identified as the intersection points of the perpendicular bisectors of the line connecting adjacent landmark points and the contour line of the shell edge. Similarly, points 16-17 represented the intersection points of the perpendicular bisectors at one-third distance of the line connecting adjacent landmark points and the contour line of the shell edge.
A detailed depiction of the selected landmark points and semi-landmark points can be found in Figure 1C; Supplementary Table S2.
2.3.2.3 Geometric morphometric analysis
Generalized Procrustes analysis (GPA) was performed on the morphological dataset of collected samples from two different intertidal zones to eliminate the non-morphological differences caused by changes in direction, position, and proportion during the selection of landmark points and semi-landmark points (Shu et al., 2021). Principal component analysis (PCA) and canonical variate analysis (CVA) were conducted to analyze the overall differences in shape of L. brevicula in the two different intertidal zones. All the above analysis methods were completed using the data analysis software Past v4.03 (Hammer and Harper, 2001).
2.4 Three-dimensional image acquisition and analysis
The samples were fixed on the sample platform with its dorsal sides oriented upwards. Subsequently, an HP3D ProS3 structured light scanner was used to obtain a comprehensive three-dimensional scanning procedure on the samples. The acquired scan data was then imported into the SolidWorks (GeometryWorks 3D) software for the construction of a three-dimensional model (Figure 3), with the resultant model being saved in the stl file format.

Figure 3. Three-dimensional models of L. brevicula. (The blue arrow indicates the direction of the simulated water flow).
For the analysis of the three-dimensional model file, COMSOL Multiphysics 5.6 software was employed. The boundary coordinate system was adjusted to the optimal position, and the default model parameters provided by the software were adopted. The physical field control grid was used to facilitate a detailed examination. The average flow velocity (12.5cm/s, 7.0cm/s) measured at two sampling points (A and B) in the high and mid-tide zones were selectively inputted into the model to conduct a flow-solid coupling analysis. This analysis was specifically designed to simulate the flow rate environments characteristic of the high and mid-tide zones. The water pressure and stress thermal maps in the results were selected, and the color legend was manually adjusted until the thermal map distinction was clear.
3 Results
3.1 Morphometric analysis
3.1.1 Traditional morphometric analysis
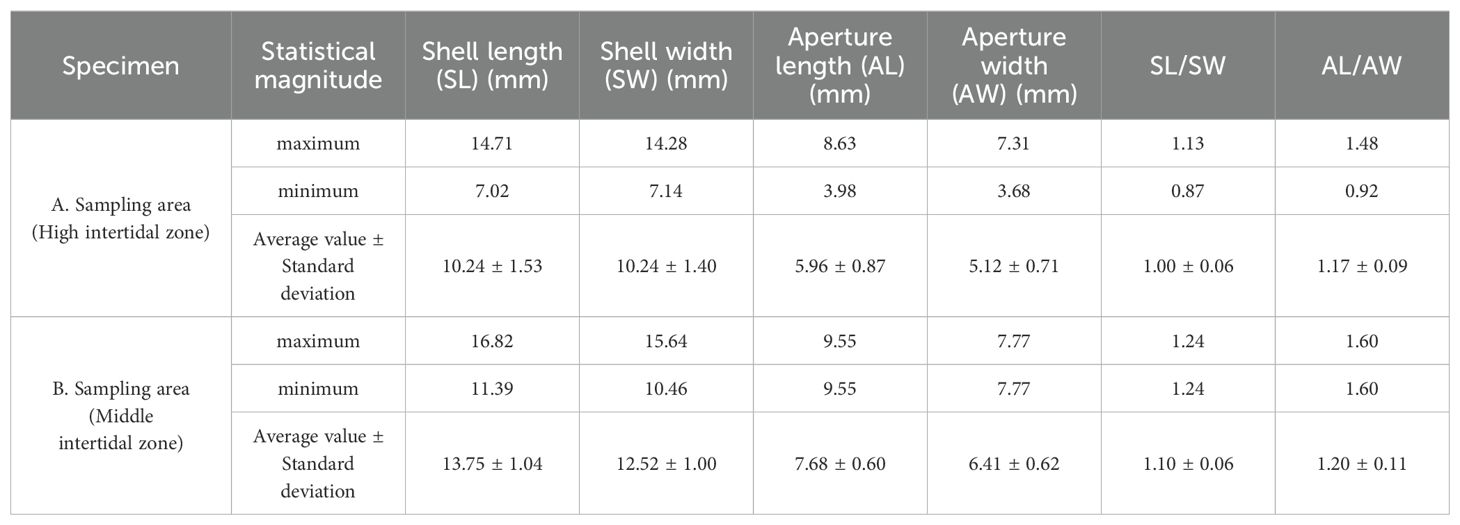
The traditional morphometric analysis results are presented in Table 1. In the high-tide zone, the mean values of shell length, shell width, and aperture length are 10.24mm, 10.24mm, and 5.96mm, respectively. In the mid-tide zone, the corresponding mean values are 13.75mm, 12.52mm, and 7.68mm, respectively. The maximum and minimum values of the shell length-to-width ratio and the aperture length-to-width ratio in the high-tide zone are 1.13 and 1.48, and 0.87 and 0.92, respectively, with average values of 1.00 and 1.17, respectively. For the samples in the mid-tide zone, the maximum and minimum values of the shell length-to-width ratio and the aperture length-to-width ratio are 1.24 and 1.60, and 0.98 and 0.89, respectively, with average values of 1.10 and 1.20, respectively. (Table 1; Supplementary Figure S1)
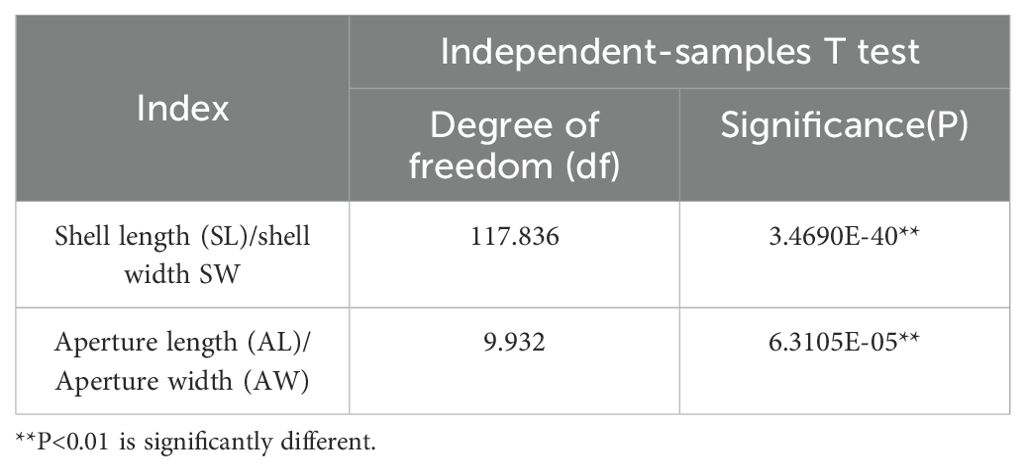
The independent sample t-test of the shell length-to-width ratio and the aperture length-to-width ratio shown in Table 2, indicating that both ratios are statistically significant. From the traditional morphometric results, it is evident that the specimens in the high-tide zone have a smaller shell length-to-width ratio and aperture size compared to those in the mid-tide zone.
3.1.2 Geometric morphometric analysis
Following GPA, the cumulative contribution rate of the top 3 Principal Components (PC) in the PCA results of the sample data reached 61.37%, which can explain the principal morphological variances in the two different tidal zones. PC1 had a contribution rate of 41.28%, and PC2 had a contribution rate of 12.35%. A two-dimensional scatter plot was created using the two PCs with the highest contribution values (PC1 and PC2) as the X and Y axes, respectively (Figure 4). The main variation points for PC1 were 1-2, 6, 10, 13-14, and 16, mainly representing the top portion of the shell and the edge of the body whorl in the later stages; while for PC2, the main variation points were 6, 8-12, 19, and 21, mainly representing the edge of the body whorl in the earlier stages, and the shell base and suture position. In the figure, samples from the high tide zone were predominantly distributed along the positive axis of PC1, while those from the mid-tide zone were mainly distributed along the negative axis of PC1.
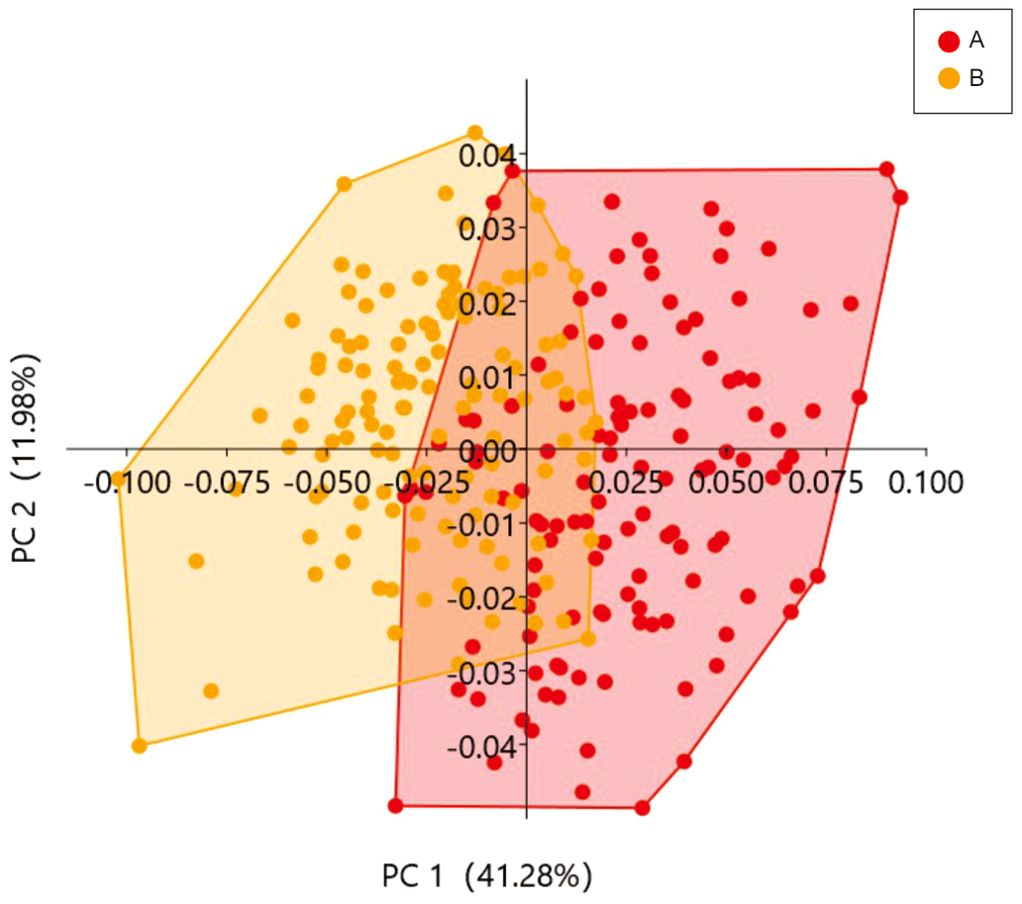
Figure 4. Principal components analysis (PCA) of two groups. (A) Group from the high intertidal zone; (B) Group from the middle intertidal zone.
The differentiation between the high tide zone and the mid-tide zone based on PC2 was not significant. By plotting the Thin-plate splines using the data (Figure 5) and combining it with the PCA results, it can be observed that as PC1 increases, the shell shape tends to become more spherical, with this tendency being most pronounced near the apex of the shell. The results indicate that L. brevicula individuals inhabiting high tidal zones with higher flow velocity and pressure tend to have shorter spires and overall shell shape that is closer to spherical. On the other hand, individuals from the mid-tidal zone with lower flow velocity and pressure exhibit higher spires and an overall shell shape that resembles a tower-like structure.
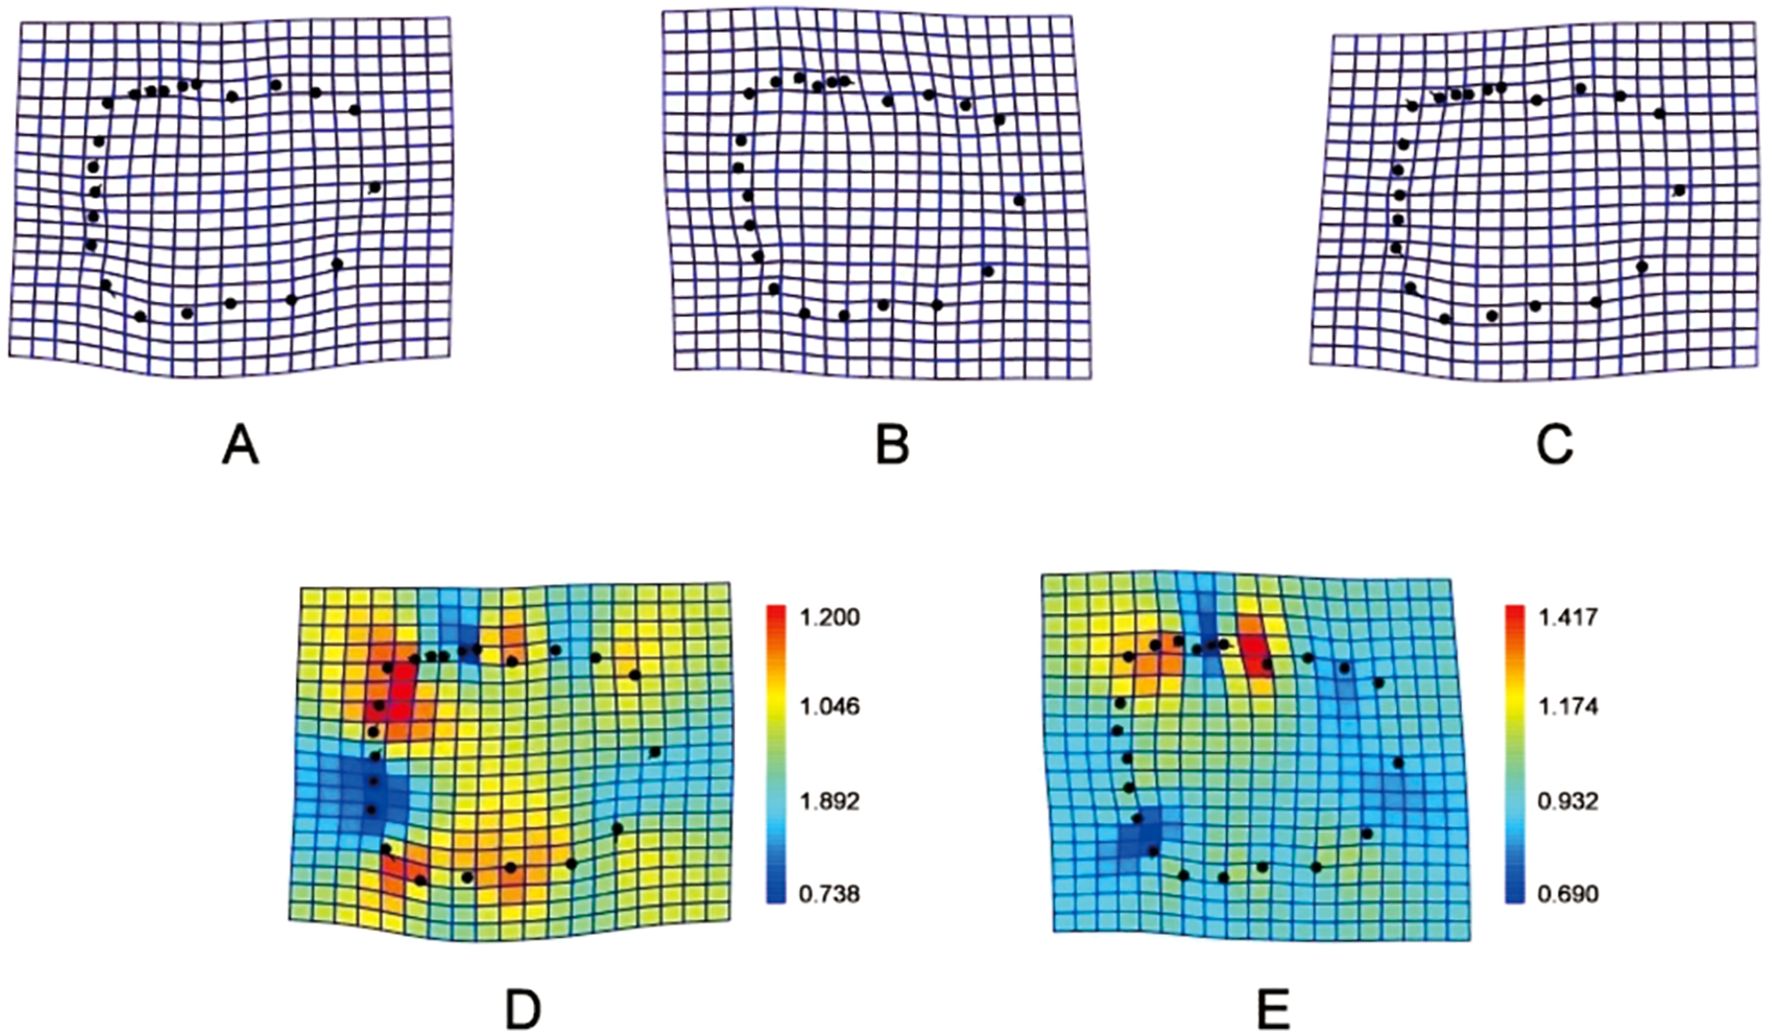
Figure 5. Thin-plate splines diagram of the two groups. (A, D) represent the high intertidal zone group; (B, E) Represent the middle intertidal zone group; (C) Comparison between high and middle intertidal zone groups.
The heat map of the Thin-plate splines reveals that the within-group morphological variation is greater in the samples from the high tide zone than in those from the mid-tide zone. In the PCA results, a Canonical Variate Analysis (CVA) was conducted. The Mahalanobis distance was calculated in the CVA analysis to assign each sample to the group with the smallest average Mahalanobis distance, resulting in linear discriminant classification results. Discriminant function analysis was carried out using the data transformed by Generalized Procrustes Analysis (GPA), with the discriminant variable as the X-axis and the sample frequency as the Y-axis, generating a discriminant histogram (Supplementary Figure S2).
3.2 Three-dimensional imaging experiment analysis
In the simulation analysis of water flow velocity employing the original dimensions of the shell’s 3D model, the flow conditions in the high and mid-tide zones were simulated. Water flow velocities of 12.5 cm/s and 7.0 cm/s were respectively input for the calculation of water pressure and shell surface stress. When water flows laterally through the shell at a higher velocity (12.5 cm/s), a substantial water pressure is generated in the central area of the shell surface and the area above the shell due to the impact of the water flow, with a maximum value of 1.89 Pa. Localized regions such as the shell aperture and the outer side of the body whorl encounter lower water pressure, with a minimum value of 0.74 Pa (Figure 6A). The shell experiences significant stress in both the body whorl and spire, with stress mainly concentrated in the central area impacted by the water flow and around the shell aperture, with a maximum value of 4166.54 N/m2. The stress at the shell base is comparatively small, with a minimum value of 0.07 N/m2 (Figure 6B).
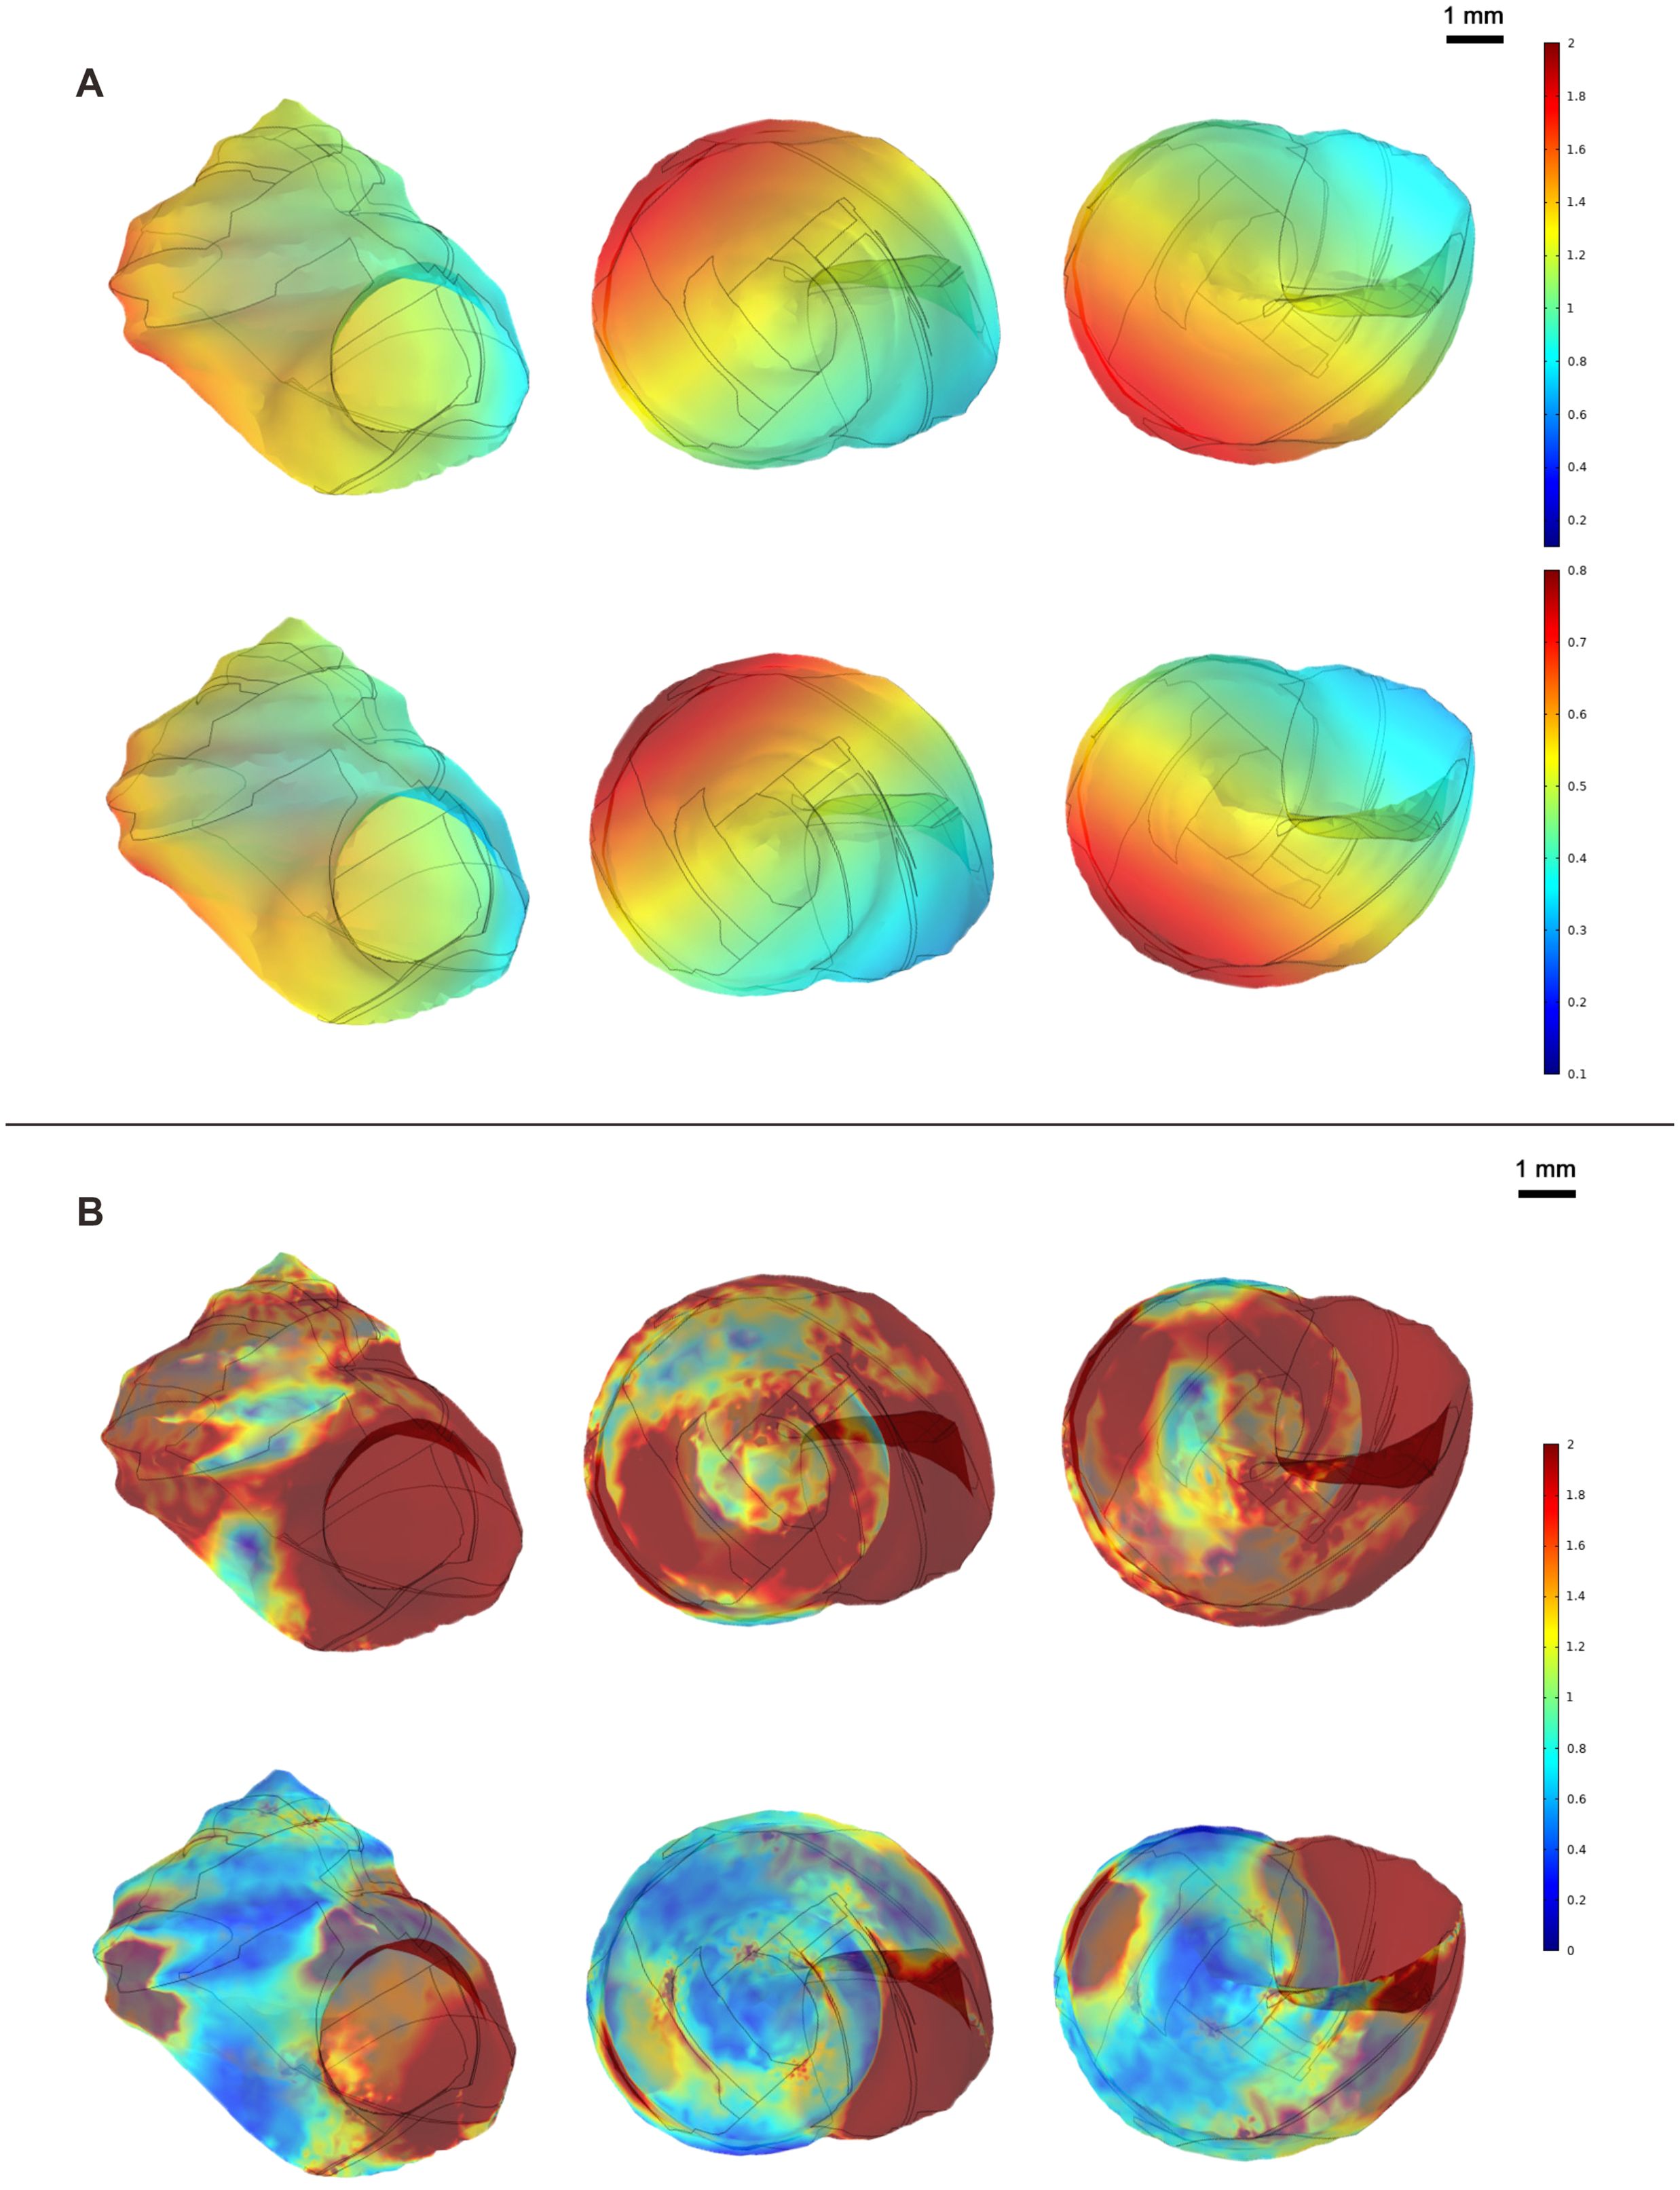
Figure 6. Heat map of water pressure and stress distribution in the two groups. (A) Top row: Water pressure distribution in the high intertidal zone group; Bottom row: Water pressure distribution in the middle intertidal zone group; Units: Pascals (Pa); (B) Top row: Stress distribution in the high intertidal zone group; Bottom row: Stress distribution in the middle intertidal zone group; Units: Newtons per square meter N/m2.
When water flows laterally through the shell at a lower velocity (7.0 cm/s), analogously, a considerable water pressure is formed in the central area of the shell surface and the area above the shell due to the impact of the water flow, with a maximum value of 1.89 Pa. Localized areas, such as the shell aperture and the outer side of the body whorl, encounter lower water pressure, with a minimum value of 0.30 Pa (Figure 6A). The shell experiences stress mainly concentrated in the body whorl and the suture, with the maximum stress occurring in the central area impacted by the water flow and around the shell aperture, with a maximum value of 1633.93 N/m2. The stress at the shell base, the outer side of the body whorl, and around the top of the shell is relatively small, with a minimum value of 0.02 N/m2 (Figure 6B).
The results of the three-dimensional model simulation analysis of water flow velocity indicate that in the simulated high-tide zone flow velocity environment (12.5 cm/s), the stress on the shell is concentrated in the entire body whorl and spire. In the simulated mid-tide zone flow velocity environment (7.0 cm/s), the stress on the shell is mainly concentrated in the area of the body whorl facing the water flow, the shell aperture, and the suture of the spire (Table 3).
4 Discussion
The average shell length, shell width, and aperture length of L. brevicula in the high tidal zone were respectively 10.24 mm, 10.24 mm, and 5.96 mm. In the mid tidal zone, these measurements were respectively 13.75 mm, 12.52 mm, and 7.68 mm. The shell length-to-width ratio and aperture length-to-width ratio were employed to analyze the morphological differences of the samples under varying flow velocities. The results indicate that these ratios can effectively differentiate individuals under different flow velocities. In the high-tide zone, the shells exhibited a smaller shell length-to-width ratio and aperture length-to-width ratio, suggesting a shorter shell with a more rounded aperture. It is crucial to note that the size and shape of the shells are highly distinctive, making it challenging to accurately measure the shell length using a caliper. Therefore, traditional morphometric methods may have limitations in assessing morphological changes and acquiring shape variables independent of size.
The GM method offer significant advantages as it preserves shape variables during analysis. Digital landmark analysis using GM revealed that shells in the high-tide zone exhibit shorter spires and a more spherical overall shape. This observation aligns with previous studies and suggests that the shorter shell shape might enhance the gastropod’s ability to attach to the substrate and withstand the impact of water flow. The results of PCA and CVA indicate a certain extent of overlap in the data from the two zones. This overlap might potentially be attributed to minor inaccuracies in the process of collecting two-dimensional images and selecting landmarks, which may be exacerbated by the small size of the shells. Furthermore, the diverse intertidal environment of the black rock reef area, characterized by various substrates such as sand, large and small rocks, and shell fragments, could also exert an influence on the shell shape of L. brevicula.
In conclusion, the study findings indicate that the shell morphology and stress distribution of the vary under different flow velocities. This provides significant cues for better comprehension the ecological adaptation and evolution of L. brevicula.
5 Conclusion
In this study, geometric morphometric methods, three-dimensional model simulation analysis, and scanning electron microscopy were utilized to investigate the morphological plasticity of L. brevicula collected from Dalian in two distinct tidal zones. The findings of the study are presented as follows:
Geometric morphometric measurements can presented L. brevicula. from the high and mid-tide zones, revealing certain morphological differences. Specifically, under higher flow velocities, the specimens exhibit smaller shell height-to-width and aperture length-to-width ratios, indicating lower spires and rounder apertures. The average shell length-to-width ratio and aperture length-to-width ratio for specimens in the mid-tide zone are 1.10 and 1.20, respectively, whereas in the high-tide zone, the average ratios are 1.00 and 1.17, respectively.
In a simulated mid-tide zone flow environment, the stress distribution on the shell is concentrated on the body whorl facing the water flow, the aperture, and the suture line on the spire, within a relatively restricted range. Conversely, in a simulated high-tide zone flow environment, the stress distribution on the shell is more extensive, with stress concentrated on the entire shell.
Data availability statement
The datasets presented in this study can be found in online repositories. The names of the repository/repositories and accession number(s) can be found in the article/Supplementary Material.
Ethics statement
The manuscript presents research on animals that do not require ethical approval for their study.
Author contributions
SL: Writing – original draft, Writing – review & editing. LS: Writing – original draft. YH: Writing – review & editing. YT: Writing – review & editing. ZH: Writing – review & editing.
Funding
The author(s) declare that financial support was received for the research, authorship, and/or publication of this article. This research was funded by the National Key Research and Development Program of China(2021YFB2600200); Major Science and Technology Projects in Liaoning (2025); the Central Government Subsidy Project for Liaoning Fisheries (2023).
Acknowledgments
The authors are also grateful to the reviewers for the great elaboration of the manuscript through their critical reviewing and comments.
Conflict of interest
The authors declare that the research was conducted in the absence of any commercial or financial relationships that could be construed as a potential conflict of interest.
Generative AI statement
The author(s) declare that no Generative AI was used in the creation of this manuscript.
Publisher’s note
All claims expressed in this article are solely those of the authors and do not necessarily represent those of their affiliated organizations, or those of the publisher, the editors and the reviewers. Any product that may be evaluated in this article, or claim that may be made by its manufacturer, is not guaranteed or endorsed by the publisher.
Supplementary material
The Supplementary Material for this article can be found online at: https://www.frontiersin.org/articles/10.3389/fevo.2024.1454383/full#supplementary-material.
References
Chang Y., Gao X., Wei P., Tian Y. (2016). Liaoning shellfish and economic species breeding (Beijing: China Agriculture Press).
Debat V., David P. (2001). Mapping phenotypes: canalization, plasticity and developmental stability. Trends Ecol. Evol. 16, 555–561. doi: 10.1016/S0169-5347(01)02266-2
Dussart G. B. J. (1987). Effects of water flow on the detachment of some aquatic pulmonate gastropods. Am. Malacological Bull. 5(1), 65–72.
Hammer Ø., Harper D. A. (2001). Past: paleontological statistics software package for educaton and data anlysis. Palaeontologia electronica 4(1), 1–9.
Hüber L. V. (1870). “Zur naturgeschichte der unionen,” in Jahrbucher des naturhistorischen Landes-Museum von Kärnthen. Klagenfurt: Kleinmayr, 10, 150–157.
Jobin W. R., Ippen A. T. (1964). Ecological design of irrigation canals for snail control. Science 145, 1324–1326. doi: 10.1126/science.145.3638.1324
Kitching J. A., Muntz L., Ebling F. J. (1966). The ecology of Lough Ine. XV. The ecological significance of shell and body forms in Nucella. J. Anim. Ecol. 35, 113–126. doi: 10.2307/2693
Lai S., Xie Y., Huang X., Mao J., Wang X., Tian Y., et al. (2023). Ontogenetic changes during the life span of the scallop Patinopecten yessoensis determined using a geometric morphometric method. J. Shellfish Res. 42, 259–264. doi: 10.2983/035.042.0208
Márquez F., Amoroso R., Sainz M. F. G., van der Molen S. (2010). Shell morphology changes in the scallop Aequipecten tehuelchus during its life span: a geometric morphometric approach. Aquat. Biol. 11, 149–155. doi: 10.3354/AB00301
Márquez F., Vilela R. A. N., Lozada M., Bigatti G. (2015). Morphological and behavioral differences in the gastropod Trophon geversianus associated to distinct environmental conditions, as revealed by a multidisciplinary approach. J. Sea Re. 95, 239–247. doi: 10.1016/j.seares.2014.05.002
Moore I. J. (1964). Effects of water currents on fresh-water snails. Stagnicola palustris Physa propinqua. Ecol. 45, 558–564. doi: 10.2307/1936108
Mullin S. K., Taylor P. J. (2002). The effects of parallax on geometric morphometric data. Comput. Biol. Med. 32, 455–464. doi: 10.1016/S0010-4825(02)00037-9
Neubauer T. A., Anistratenko O., Anistratenko V. V., Kijashko P., Stoica M., van de Velde S., et al. (2021). A revision of the poorly known Pontocaspian gastropod genus Abeskunus, and its Central Paratethyan origin. Historical Biol. 33, 1580–1597. doi: 10.1080/08912963.2020.1720015
Philippi R. A. (1844). Descriptiones testaceorum quorundam novorum, maxime chinensium. Z. für Malakozoologie 2, 161–167.
Shi Y. (2017). Introduction of morphometrics and a case study on fusulinid foraminifera. Acta Micropalaeontologica Sin. 34, 179–191. doi: 10.16087/j.cnki.1000-0674.2017.02.006
Shu Y., Shi L., Lai S., Tian Y., Chang Y. (2021). Morphometric study and comparison of scallops (Chlamys farreri) cultured in different water depth. Acta Hydrobiol. Sin. 45, 132–139. doi: 10.7541/2021.2019.215
Statzner B. (2008). How views about flow adaptations of benthic stream invertebrates changed over the last century. Int. Rev. Hydrobiol. 93, 593–605. doi: 10.1002/iroh.200711018
Vergara D., Fuentes J. A., Stoy K. S., Lively C. M. (2017). Evaluating shell variation across different populations of a freshwater snail. Molluscan Res. 37, 120–132. doi: 10.1080/13235818.2016.1253446
Verhaegen G., Herzog H., Korsch K., Kerth G., Brede M., Haase M. (2019). Testing the adaptive value of gastropod shell morphology to flow: a multidisciplinary approach based on morphometrics, computational fluid dynamics and a flow tank experiment. Zoological Lett. 5, 1–13. doi: 10.1186/s40851-018-0119-6
Verhaegen G., McElroy K. E., Bankers L., Neiman M., Haase M. (2018a). Adaptive phenotypic plasticity in a clonal invader. Ecol. Evol. 8, 4465–4483. doi: 10.1002/ece3.4009
Verhaegen G., Neiman M., Haase M. (2018b). Ecomorphology of a generalist freshwater gastropod: complex relations of shell morphology, habitat, and fecundity. Organisms Diversity Evol. 18, 425–441. doi: 10.1007/s13127-018-0377-3
Vonlanthen P., Bittner D., Hudson A. G., Young K. A., Müller R., Lundsgaard-Hansen B., et al. (2012). Eutrophication causes speciation reversal in whitefish adaptive radiations. Nature 482, 357–362. doi: 10.1038/nature10824
Yang W., Cai Y., Kuang X. (2013). Color atlas of aconomic mollusca from the South China Sea (Beijing: China Agriculture Press).
Keywords: water flow, traditional morphometrics, geometric morphometrics, 3D model, phenotypic plasticity
Citation: Lai S, Shi L, Han Y, Tian Y and Hao Z (2025) Adaptation of shell morphology to different tidal zones—insights into phenotypic plasticity of Littorina brevicula. Front. Ecol. Evol. 12:1454383. doi: 10.3389/fevo.2024.1454383
Received: 08 November 2024; Accepted: 18 December 2024;
Published: 08 January 2025.
Edited by:
Zhu Wanlong, Yunnan Normal University, ChinaReviewed by:
Lin Zhang, Hubei University of Chinese Medicine, ChinaYue Ren, Shanxi Agricultural University, China
Copyright © 2025 Lai, Shi, Han, Tian and Hao. This is an open-access article distributed under the terms of the Creative Commons Attribution License (CC BY). The use, distribution or reproduction in other forums is permitted, provided the original author(s) and the copyright owner(s) are credited and that the original publication in this journal is cited, in accordance with accepted academic practice. No use, distribution or reproduction is permitted which does not comply with these terms.
*Correspondence: Ying Tian, dGlhbnlpbmdAZGxvdS5lZHUuY24=; Zhenlin Hao, aGFvemhlbmxpbkBkbG91LmVkdS5jbg==
†These authors have contributed equally to this work and share first authorship
 Siqi Lai1†
 Ying Tian
 Zhenlin Hao