 Yongshu Wang
 Xiangdong Yan2
- 1College of Arts and Design, Yunnan University, Kunming, China
- 2School of Fine Arts, Yunnan Normal University, Kunming, China
- 3Faculty of Forestry, Southwest Forestry University, Kunming, China
- 4Gejiu Municipal Housing and Urban-Rural Development Bureau, Gejiu, China
- 5School of Communication and Design Art, Yunnan University of Finance and Economics, Kunming, China
- 6College of Forestry, Beijing Forestry University, Beijing, China
Introduction: The selection of an optimal scale or granularity in landscape analysis is pivotal for uncovering inherent patterns and changes driven by processes. Variations in spatial resolution can significantly alter the proportions and distributions of various landscape types, thereby impacting the assessment of landscape patterns. Despite its importance, the scale factor is frequently neglected in studies focusing on long-term landscape dynamics.
Methods: Bridging this gap, we utilized remote sensing imagery data from 1986 to 2020 for Lushui City, integrating remote sensing (RS) and geographic information system (GIS) technologies to generate land cover maps. Our focus centered on investigating the sensitivity of landscape pattern indices within the 30–1000m scale. Combining the first scale domain with an information loss assessment model, we identified the optimal granularity for the analysis, conducting a detailed spatiotemporal examination of landscape pattern from 1986 to 2020 using the index analysis method.
Results and discussion: The results show that: (1) The dominance of forests in Lushui City, yet reveal a significant increase in construction land area over the study period, primarily driven by the conversion of forest and grassland. (2) Among the 10 examined indices, four (PD, ED, TE, and LSI) demonstrated predictable responses to changes in granularity, while three (PAFEAC, COHESION, AI) exhibited unpredictable stepwise reactions. Three indices (LPI, SHDI, PLAND) displayed minimal regularity to granularity changes. (3) The optimal long-term landscape analysis granularity for Lushui was identified as 100 m. (4) Before 1996, the city’s landscape exhibited characteristics of aggregation, good connectivity, and minimal anthropogenic disturbance. However, post-1996, the landscape experienced disruptions, leading to an overall increase in fragmentation. The expansion of cultivated land and construction land due to urbanization has intensified landscape fragmentation. However, policies such as converting cropland to forest and planned ecological civilization initiatives have restored forest coverage and improved landscape cohesion and connectivity in Lushui City. This research offers vital insights for ecological planning and resource management in alpine valley watershed cities, deepening our grasp of landscape pattern evolution.
1 Introduction
Landscapes are heterogeneous regions composed of multiple ecosystems or mosaics of different land use type (Su and Fu, 2012), and their patterns have become a crucial focus of ecological research. They are both the concrete manifestation of landscape heterogeneity and the result of various ecological processes operating at different scales (Wagner and Fortin, 2005). Diverse landscape types, such as large grasslands, beautiful lakes, and impressive mountains, offer tourism a wide variety of natural resources. Studying landscape patterns and their dynamic evolution processes enables a deeper understanding of the interaction mechanisms between human activities and the natural environment, revealing the distribution characteristics and interrelationships of land resources within a region. This, in turn, provides a scientific basis for land use planning, urban planning, tourism resource development, and more (Gustafson, 1998; Fu et al., 2001; Dadashpoor et al., 2019). Through landscape pattern analysis, we can identify the factors and mechanisms that generate and control spatial patterns, compare the spatial patterns and effects of different landscapes, and uncover the impacts of landscape changes on landscape services (Ma et al., 2019; Van der Sluis et al., 2019; Li et al., 2020). Then serves as a solid theoretical foundation for the scientific planning and development of tourism resources.
Notably, the influence of landscape patterns on ecological processes exhibits a pronounced scale dependence, making scale selection a crucial factor in guiding the scientific exploration of land-use landscape changes and ecological effects in the study area (Zhang et al., 2020). This scale effect is not only pivotal for maintaining ecological balance but also profoundly influences the planning and design of tourism activities, as the diversity, integrity, and accessibility of landscapes exhibit varying degrees of charm at different scales, thereby determining the attractiveness and sustainability of tourism resources. Research on the spatial scale of landscape patterns distinguishes between artificially defined boundaries and natural landscape boundaries. Artificially defined boundaries correspond to various administrative levels, such as global, national, provincial, county, and township scales. In contrast, natural landscape boundaries are represented in features such as watersheds, wetlands, grasslands, and protected areas.
In landscape scale studies, the granularity effect plays a pivotal role. Granularity refers to the smallest identifiable unit in a landscape, usually corresponding to the maximum resolution and size of pixels in spatial data and image materials. It significantly influences the description and analysis results of landscape patterns (Xiao and Li, 2003). Previous granularity studies have revealed that observed landscape patterns may differ at different granularities. Smaller granularities can provide more detailed information but may lead to excessive subdivision and increased noise, while larger granularities can simplify the analysis but may overlook some important details (Zhang et al., 2013; Wu et al., 2016; Teng et al., 2016; Fang et al., 2017). Therefore, selecting an appropriate granularity is crucial in landscape pattern research, considering the location and characteristic differences of the study area, as well as the methods, range, and step size of granularity division (Nagendra et al., 2004). Only when the measurement scale, research objectives, and intrinsic features align with the study area can landscape indices accurately display and reflect the landscape patterns of the study area (Pan et al., 2019). However, most studies focus solely on the impact of spatial scale on landscape patterns for a specific period, emphasizing the scale effect of static patterns and paying less attention to the scale effect of dynamic pattern changes. There is a particular lack of research on the spatial granularity effect of land-use pattern changes.
In alpine gorge areas, the complex topography and varied climatic conditions, coupled with the generally steep slopes of arable land, collectively form the natural bottleneck for land use efficiency in such regions (Bao et al., 2015). Additionally, frequent natural disasters such as landslides and debris flows pose a severe threat to ecological safety and the sustainable use of land resources (Chen and Shi, 2018; Huang et al., 2020). Against the backdrop of rapid urbanization, alpine gorge areas are also inevitably profoundly affected by this trend. On one hand, the occupation of surrounding high-quality arable land and ecological land exacerbates the contradictions and conflicts between different types of land use; on the other hand, indiscriminate expansion strategies further intensify the degree of land fragmentation, posing a serious challenge to regional ecological security (Li, 2022). Concurrently, the implementation of ecological restoration projects such as converting farmland back to forest has played a positive role in mitigating land fragmentation and restoring landscape connectivity (Li et al., 2021). However, the dynamic balance between destruction and conservation continually reshapes the landscape pattern. In this context, an in-depth investigation of the dynamic characteristics of multi-scale landscape patterns and their granularity thresholds in alpine gorge areas can enhance our understanding of biodiversity maintenance mechanisms within large-scale geographical contexts and provide vital theoretical support for the development of scientifically sound ecological conservation strategies. Although academic studies have addressed the spatiotemporal variations in landscape patterns in alpine gorge watersheds (Liang et al., 2014; Huang et al., 2021; Wang et al., 2023), there are still many gaps regarding the optimal scale of analysis.
Lushui city is located in the heart of the Nujiang River Basin. The Nujiang River Basin is a region of remarkable heterogeneity and diversity on a global scale, forming high mountains, deep valleys and unique river valley ecosystems, it has various landscape types and rich ecological resources. The dynamic changes in landscape patterns within the basin directly impact crucial ecosystem services such as water conservation and soil retention. As a nationally prioritized ecological functional zone for soil and water conservation, and a testing ground for China’s conservation efforts, Lushui holds significant ecological strategic importance. Given Lushui’s relatively underdeveloped economic base, urbanization, agricultural expansion, and infrastructure development have pronounced impacts on landscape patterns and their spatio-temporal variations. This makes Lushui a critical area for study. Moreover, the city’s diverse ethnic groups and rich cultural heritage lead to varied land use practices that significantly influence landscape patterns and their temporal evolution, warranting in-depth investigation. Therefore, this study focuses on Lushui City to explore the dynamic changes in multi-scale landscape patterns and analyze the optimal spatial resolution required in this complex terrain with sensitive human-nature interactions. Such research is crucial for understanding the interactions between humans and landscapes within large-scale geographical contexts and for developing scientifically informed ecological protection strategies.
This study used long-term land classification data from 1986 to 2022. We selected key landscape pattern indices to analyze the grain effect of landscape patterns at multiple scales. Through fitting function analysis, we explored the grain response characteristics of landscape patterns across different scales and inferred the optimal grain thresholds for each spatial scale. This research provides a foundational understanding and reference for spatial grain selection in subsequent landscape pattern optimization, ecosystem function analysis, forest landscape restoration, and ecological rehabilitation. It also highlights the role and importance of the grain effect in landscape changes.
2 Materials and methods
2.1 Study area
Lushui City (99°09’ – 99°34’E, 25°33’ – 26°32’N) is located in Nujiang Prefecture in the northwest of Yunnan, China (Figure 1). With a maximum horizontal extent of 58 km, a vertical span of 108 km, and covering an area of 3203.04 km² (Li et al., 2019). Lushui City experiences an Indian Ocean tropical monsoon climate. Its unique topography creates a three-tier vertical climate, encompassing a river valley subtropical zone, a mountain temperate zone, and a high-altitude frigid zone. Overall, the climate features a small annual temperature difference, significant daily temperature fluctuations, noticeable dry and wet season variations, and indistinct seasonal changes (Li et al., 2021).
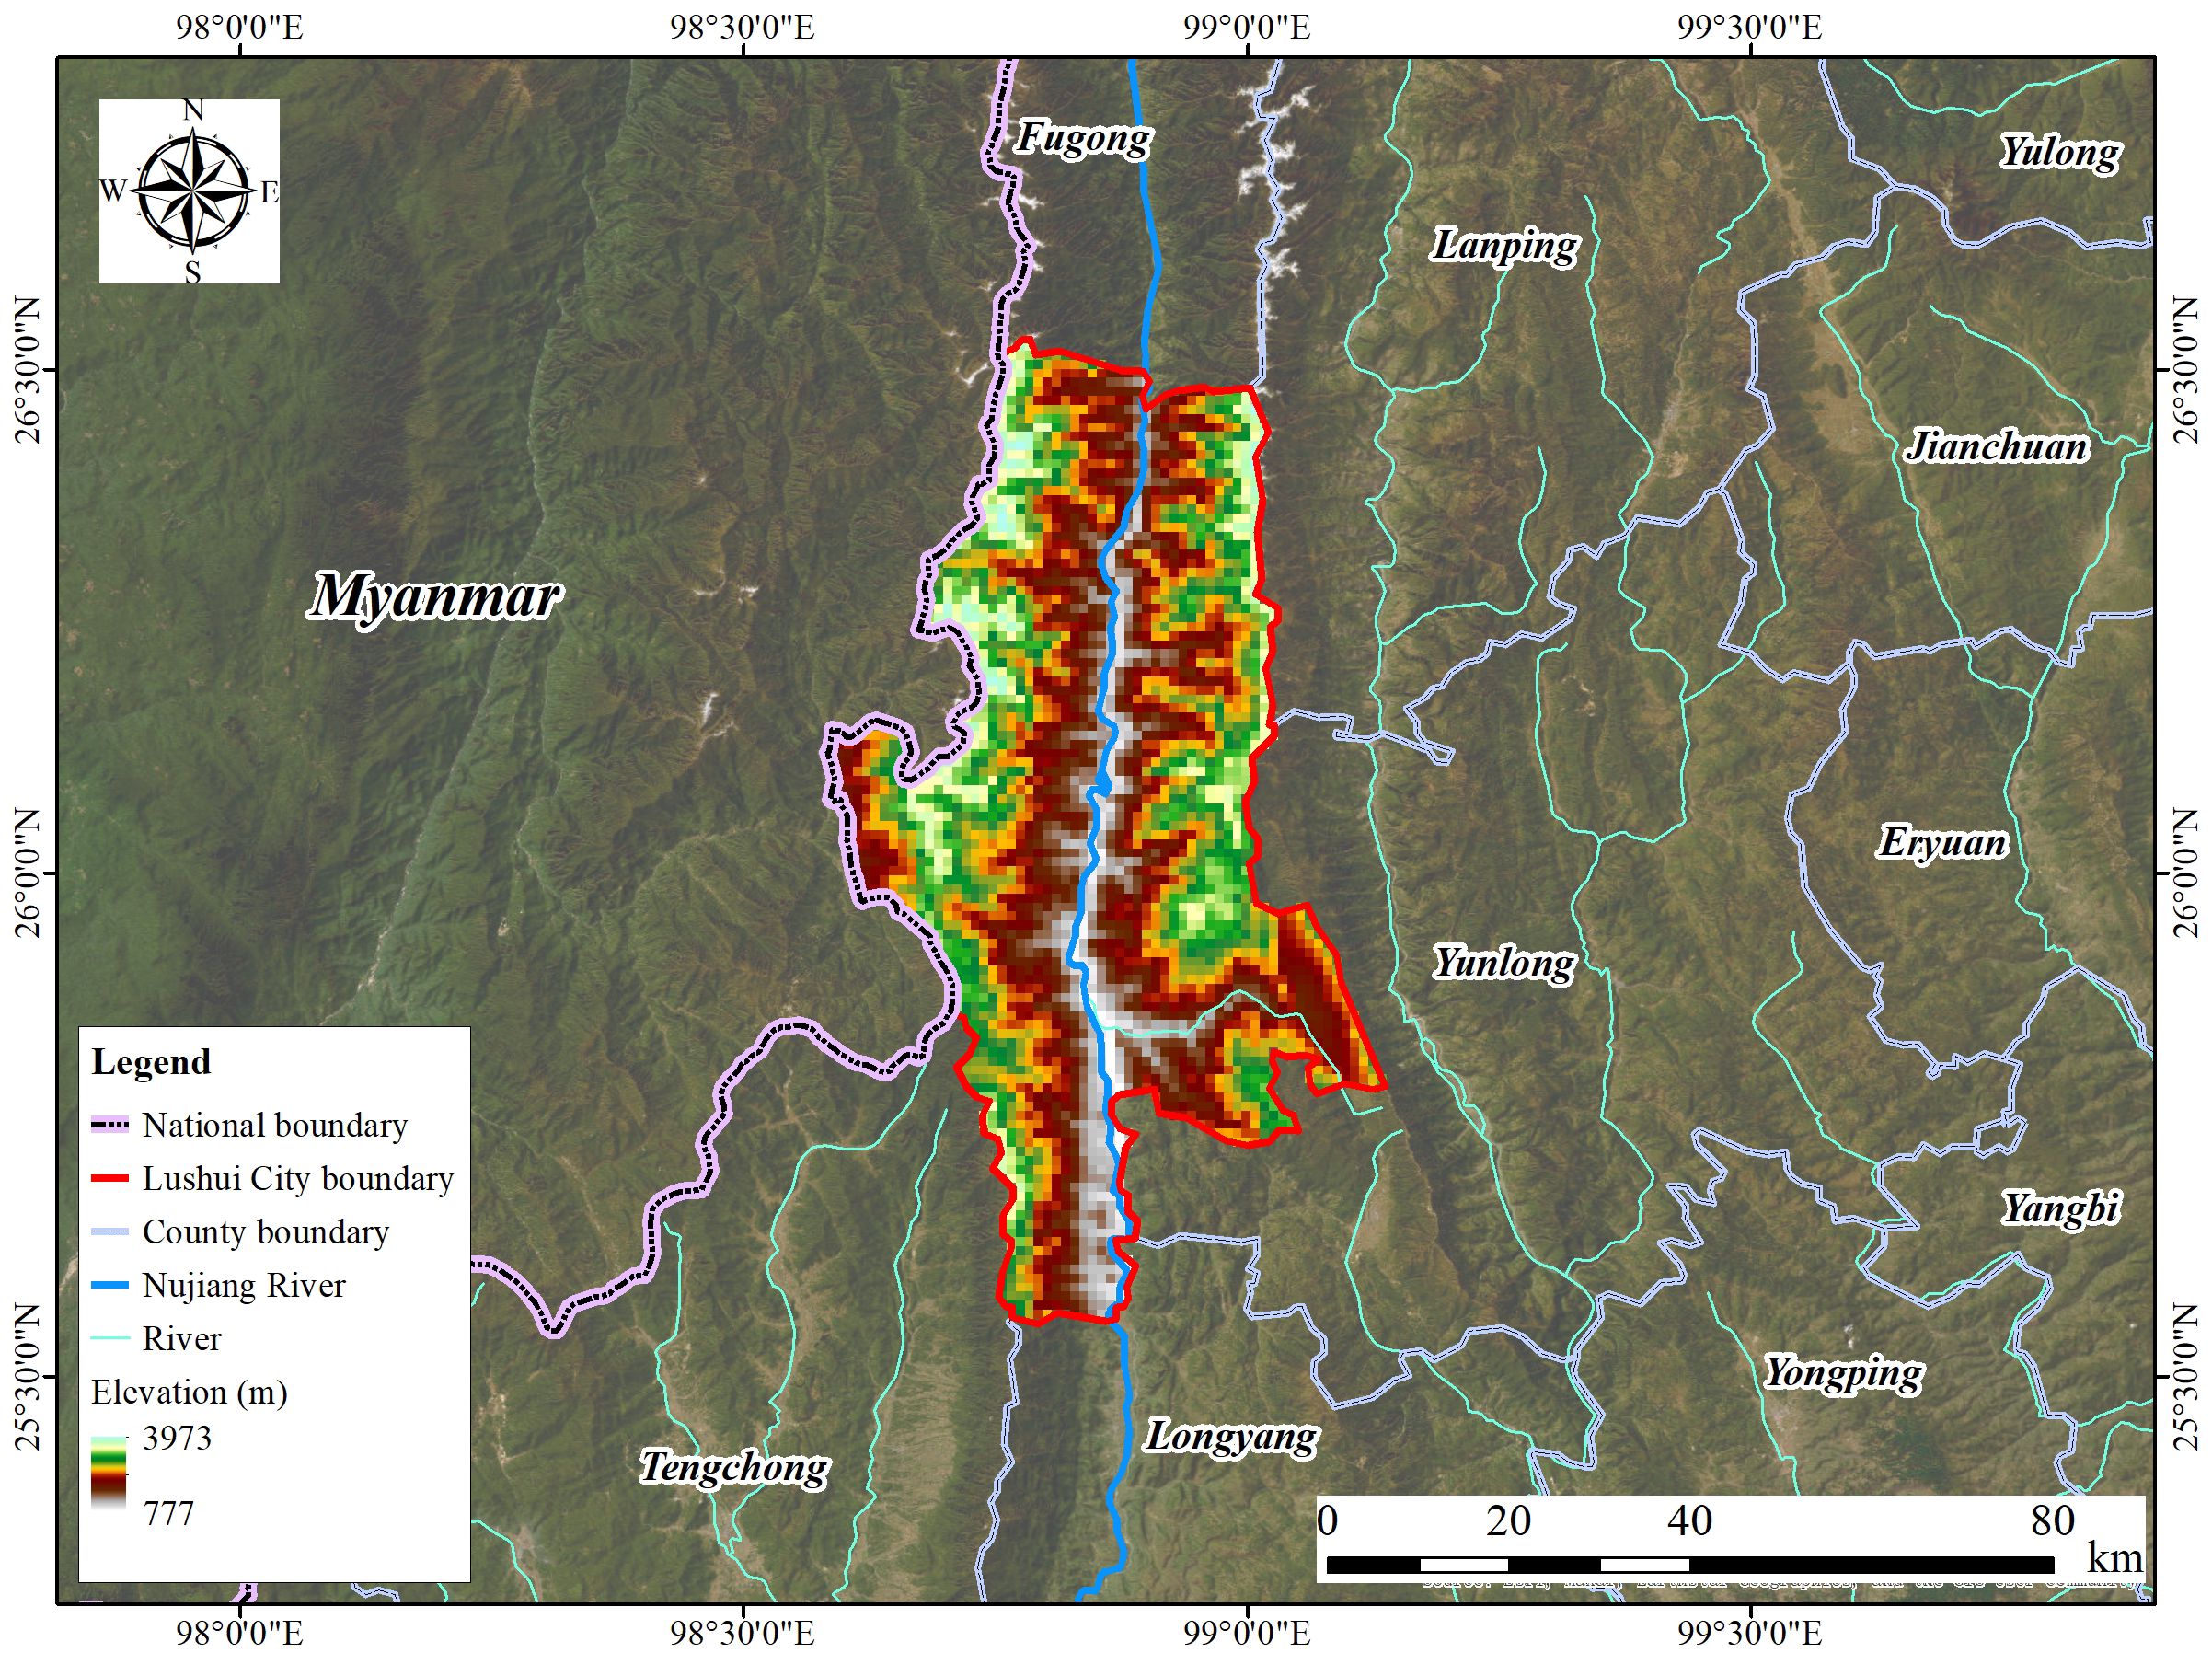
Figure 1. Location and the digital elevation model (DEM) of the study area.
Lushui City is located at the core area of the Nujiang River Basin, a crucial high mountain and deep valley topographic region. As a typical high-mountain gorge region, approximately 94% of the city’s terrain is mountainous, with forests constituting the major land use type. It is designated as a national key ecological function area for soil and water conservation and serves as a pilot base for soil and water conservation efforts in China. The Nujiang River basin is a region of significant heterogeneity and diversity on a global scale, featuring unique alpine gorge landscapes and river valley ecosystems. The landscape patterns and their dynamic changes within the basin directly impact regional ecosystem services such as water conservation and soil retention. Additionally, these patterns significantly shape the area’s biodiversity and the complexity of its ecological processes. With the annual increase in forest coverage in Lushui City, the ecological environment has significantly improved. Lushui City has a population of approximately 200,000 people, primarily composed of Han and various ethnic minorities, with a high proportion of minority populations contributing to its rich cultural diversity. Economically, Lushui City is predominantly agricultural, with key crops including rice, corn, and wheat, alongside significant cultivation of tea, walnuts, and edible fungi as cash crops. In recent years, the development of the tourism industry, particularly eco-tourism centered around high mountain gorges and ethnic culture, has rapidly emerged as a crucial driver of local economic growth.
2.2 Data collection and processing
The research data spans from 1986 to 2022 and comprises Landsat images sourced from the United States Geological Survey (USGS). These images underwent essential preprocessing steps, such as radiometric calibration, atmospheric correction, subset, and mosaicking, to obtain the image data for Lushui City in 1986, 1996, 2004, 2010, 2016, and 2022. The bad tape problem in the Landsat 7 satellite image was fixed with the “landsat_gapfill” plugin in ENVI software. All images were processed using the WGS-1984 coordinate system, and specific details about each image are provided in Table 1.
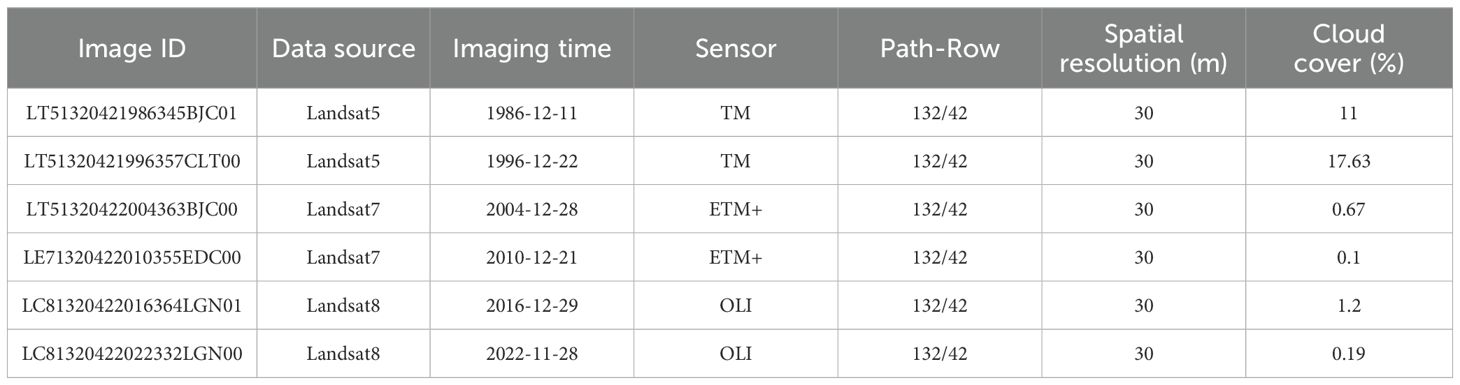
Table 1. Data source and detailed information.
Taking into account the current state of the study area and guided by principles of practicality, scientific rigor, and comprehensiveness, the research categorized land use in the study region into five main groups: cultivated land, forest land, grassland, construction land, and water bodies. This classification followed the system provided by the China Academy of Sciences Resource and Environmental Science Data Center for land use remote sensing monitoring.
The widely utilized Maximum Likelihood Classification method was applied in the computer interpretation process, with ground truth data utilized for accuracy verification during the primary classification (Valjarević, 2024). To maintain an accuracy level exceeding 80%, a human-machine interactive interpretation mode was employed for visual interpretation and correction.
Utilizing remote sensing and Google Earth historical images, we selected 100 sample points per year in each study area. The ENVI 5.3 software platform was employed for analysis, and accuracy verification was performed using the evaluation module based on the confusion matrix (Zhang et al., 2017). The results confirm that the Kappa coefficients for various periods exceed 0.8, ensuring an overall accuracy consistently above 85% (Tables A1–A6).
2.3 Landscape pattern indices
This study utilized landscape pattern analysis software to compute landscape indices and analyze the spatial patterns of land use in Lushui City at two levels: landscape and landscape class. At the class-level indexes, the study identified features such as the quantity and spatial configuration of individual patch types. At the landscape level, the main identified features encompassed the spatial patterns of the entire landscape mosaic, including composition and configuration. To comprehensively explore the relationship between various patches in the city and urban development changes in Lushui City, the study selected landscape-level indices, namely Cohesion (COHESION), Shannon’s Diversity Index (SHDI), Perimeter-Area Fractal Dimension (PAFRAC), Edge Density (ED), Patch Density (PD), and Largest Patch Index (LPI). At the class level, the study considered four aspects: Percentage of Landscape (PLAND), Landscape Shape Index (LSI), Total Edge (TE), and Aggregation Index (AI). The calculation formulas and significance of landscape pattern indices are presented in the Table 2.
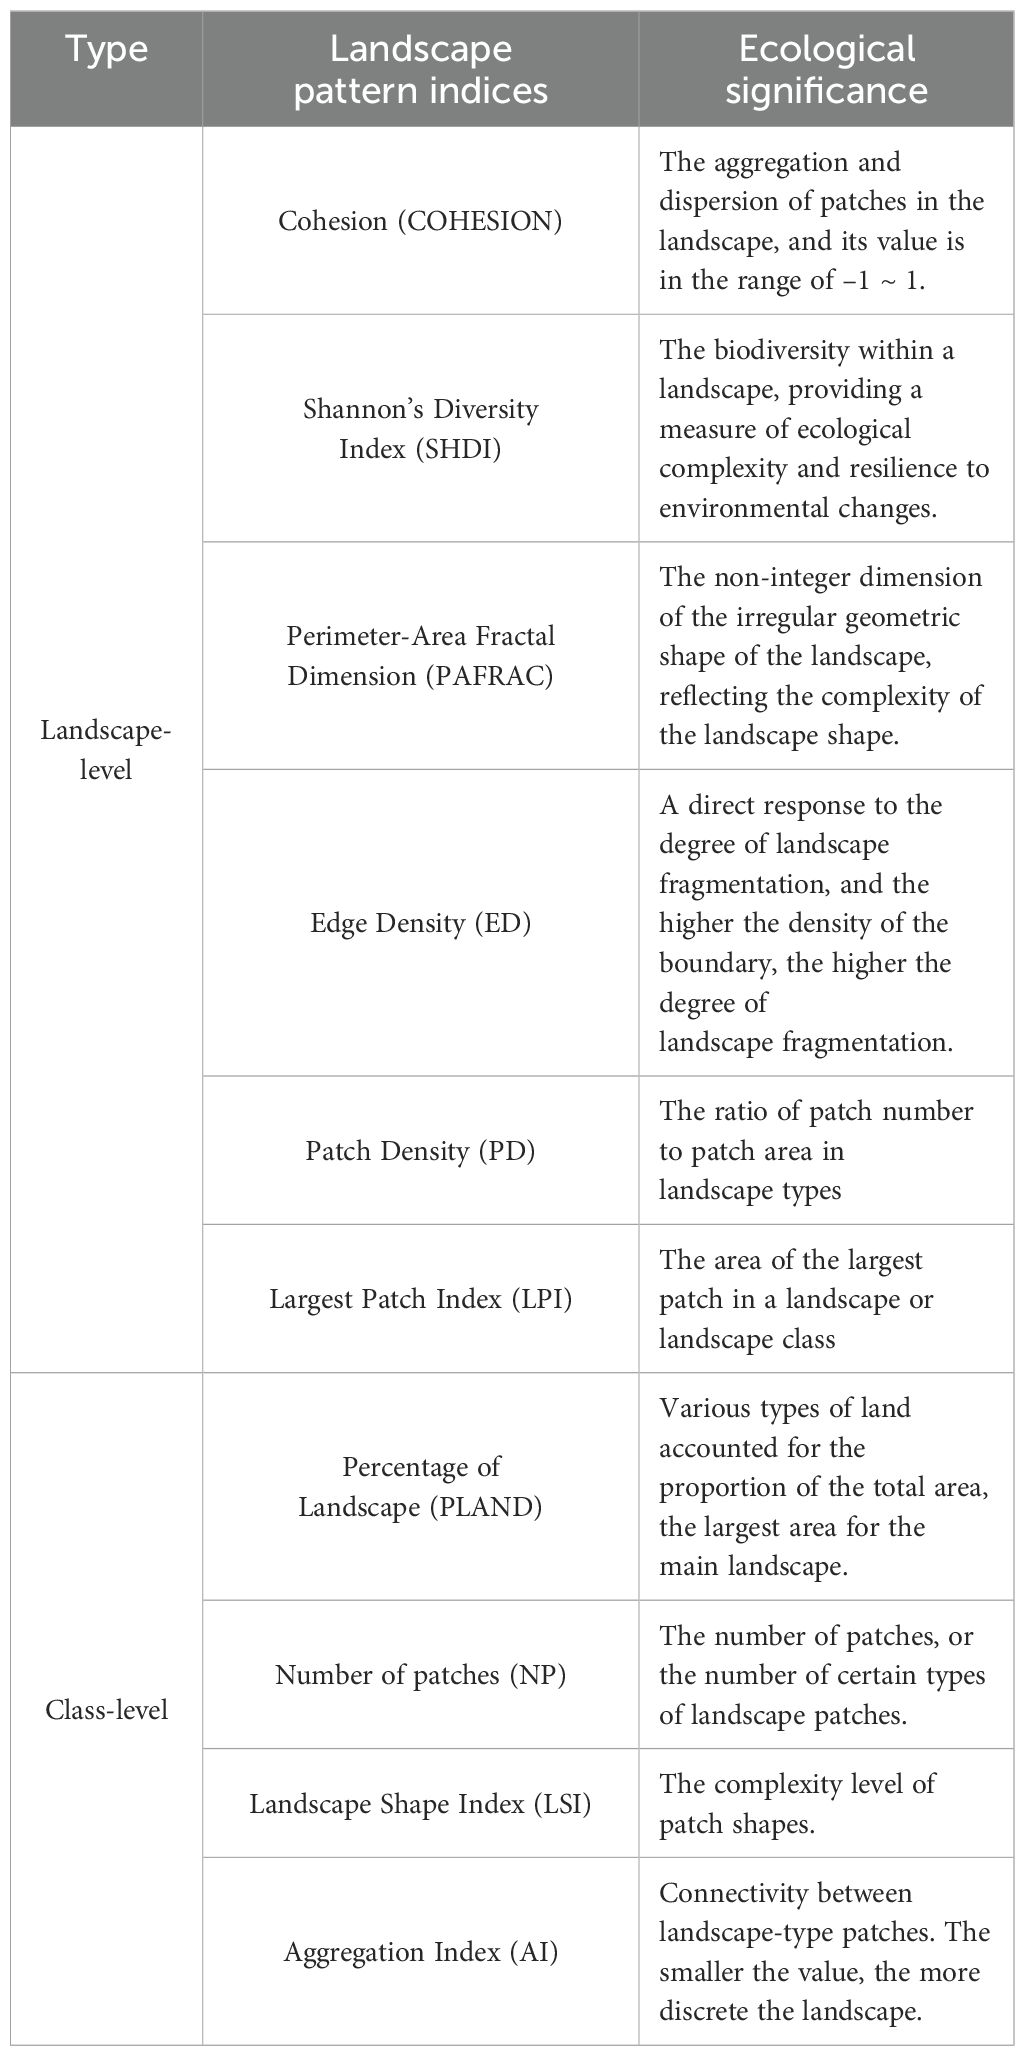
Table 2. Ecological significance of landscape pattern indices.
2.4 Spatial grain analysis
2.4.1 First scale domain
This study explores granularity, focusing on the spatial resolution of remote sensing images and the size of the analysis data raster. Using annual 30m-resolution remote sensing images of Lushui City, the research explores the sensitivity of landscape pattern indices to granularity variations across different spatial resolutions. Landscape classification vector maps were imported, vector data were rasterized, and resampling was conducted through the dominant type method within a granularity range of 30-1000m (Zhao et al., 2003). Among the selected 25 granularity sizes, each raster was imported to calculate landscape pattern indices, enabling a comprehensive analysis of the granularity effect in Lushui City. The first scale domain, where landscape indices change with grain size, holds the most landscape feature information. Determined by the first inflection point on the response curve of landscape indices, the first scale domain is the region between the two inflection points (Zhao et al., 2003). To ensure efficient data processing and present rich landscape feature information in landscape pattern studies, the spatial granularity slightly larger than the minimum granularity value within the first scale domain should be chosen as the suitable granularity for the study area.
2.4.2 Information loss evaluation model
In the resampling of land-use landscape data to coarsen granularity, alterations in the boundaries and perimeters of raster data occur, causing changes in adjacent land class attributes and resulting in the loss of effective information. Hence, in landscape pattern analysis, it is recommended to choose a scale domain with minimal and relatively stable landscape information loss. To quantify the information loss for different landscape classes during data resampling, the absolute values of landscape information losses are summed (Zhai et al., 2018). Following this principle, the information loss evaluation model is expressed as follows:
where: represents the percentage of information loss for a specific landscape pattern index; is the total amount of information loss for that landscape pattern index; is the sum of baseline data values (30m) for all landscape types; is the corresponding raster data value for the ith landscape type for that index; is the baseline data value (30m) for the th landscape type for that index; is the total number of land-use landscape types.
3 Results
3.1 Land use changes in Lushui City from 1986 to 2022
3.1.1 Changes in land use structure
According to Table 3, the land use structure changes in Lushui City from 1986 to 2022 exhibit the following characteristics: (1) Cultivated land has shown an overall increase, expanding its proportion from 11.75% to 20.25% of the total area. Forest, a major land use type in Lushui City, has decreased from 2169.29 km² to 1956.79 km². However, during the periods 1986-1996 and 2010-2016, forest increased, possibly due to afforestation projects. (2) Grassland area declined from 1986 to 1996, saw an increase from 1996 to 2010, and then decreased again, constituting approximately 14% overall. (3) Construction land witnessed a significant increase, growing from 27.25 km² in 1986 to 102.30 km² in 2022, reflecting urbanization characteristics. (4) The overall proportion of water bodies is relatively low, exhibiting a decrease followed by an increase during the study period.
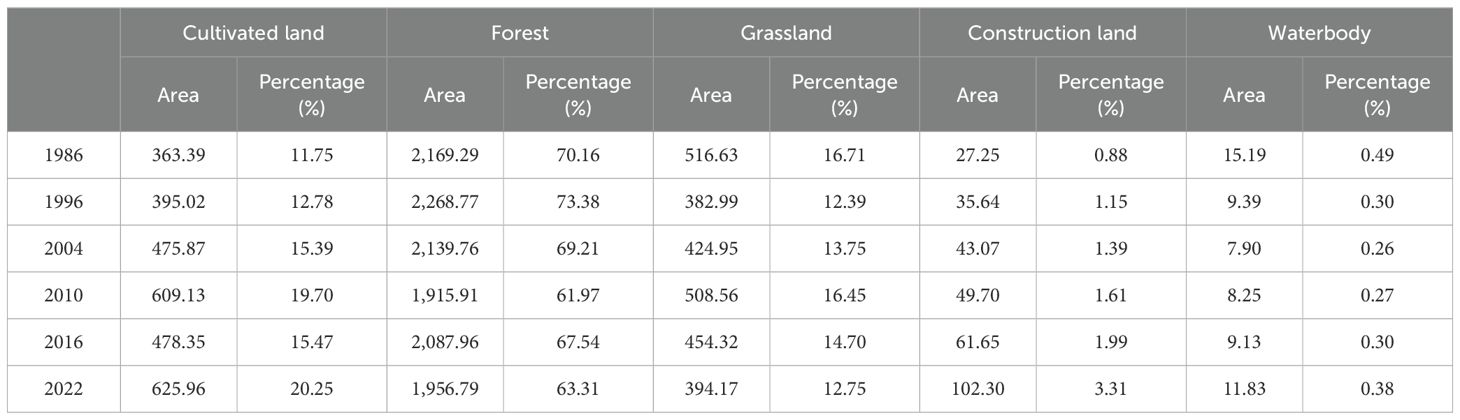
Table 3. Land use structure in Lushui city from 1986 to 2022.
3.1.2 Land use transfer characteristics
Between 1986 and 2022, Lushui City witnessed frequent transitions among different land use types, primarily due to significant conversions involving forest land, cultivated land, and grassland (Figure 2). During the periods 1996-2004, 2004-2010, and 2016-2022, forest converted to cultivated land by 196.05 km², 170.88 km², and 159.39 km², respectively. In the years 2016-2022, construction land underwent rapid expansion, predominantly transitioning from forest (27.99 km²) and cultivated land (25.25 km²). This phase marked an accelerated urbanization process, characterized by a development pattern focused on incremental land use, resulting in extensive expansion of the central urban area and substantial encroachment of construction land onto cultivated land and other land types.
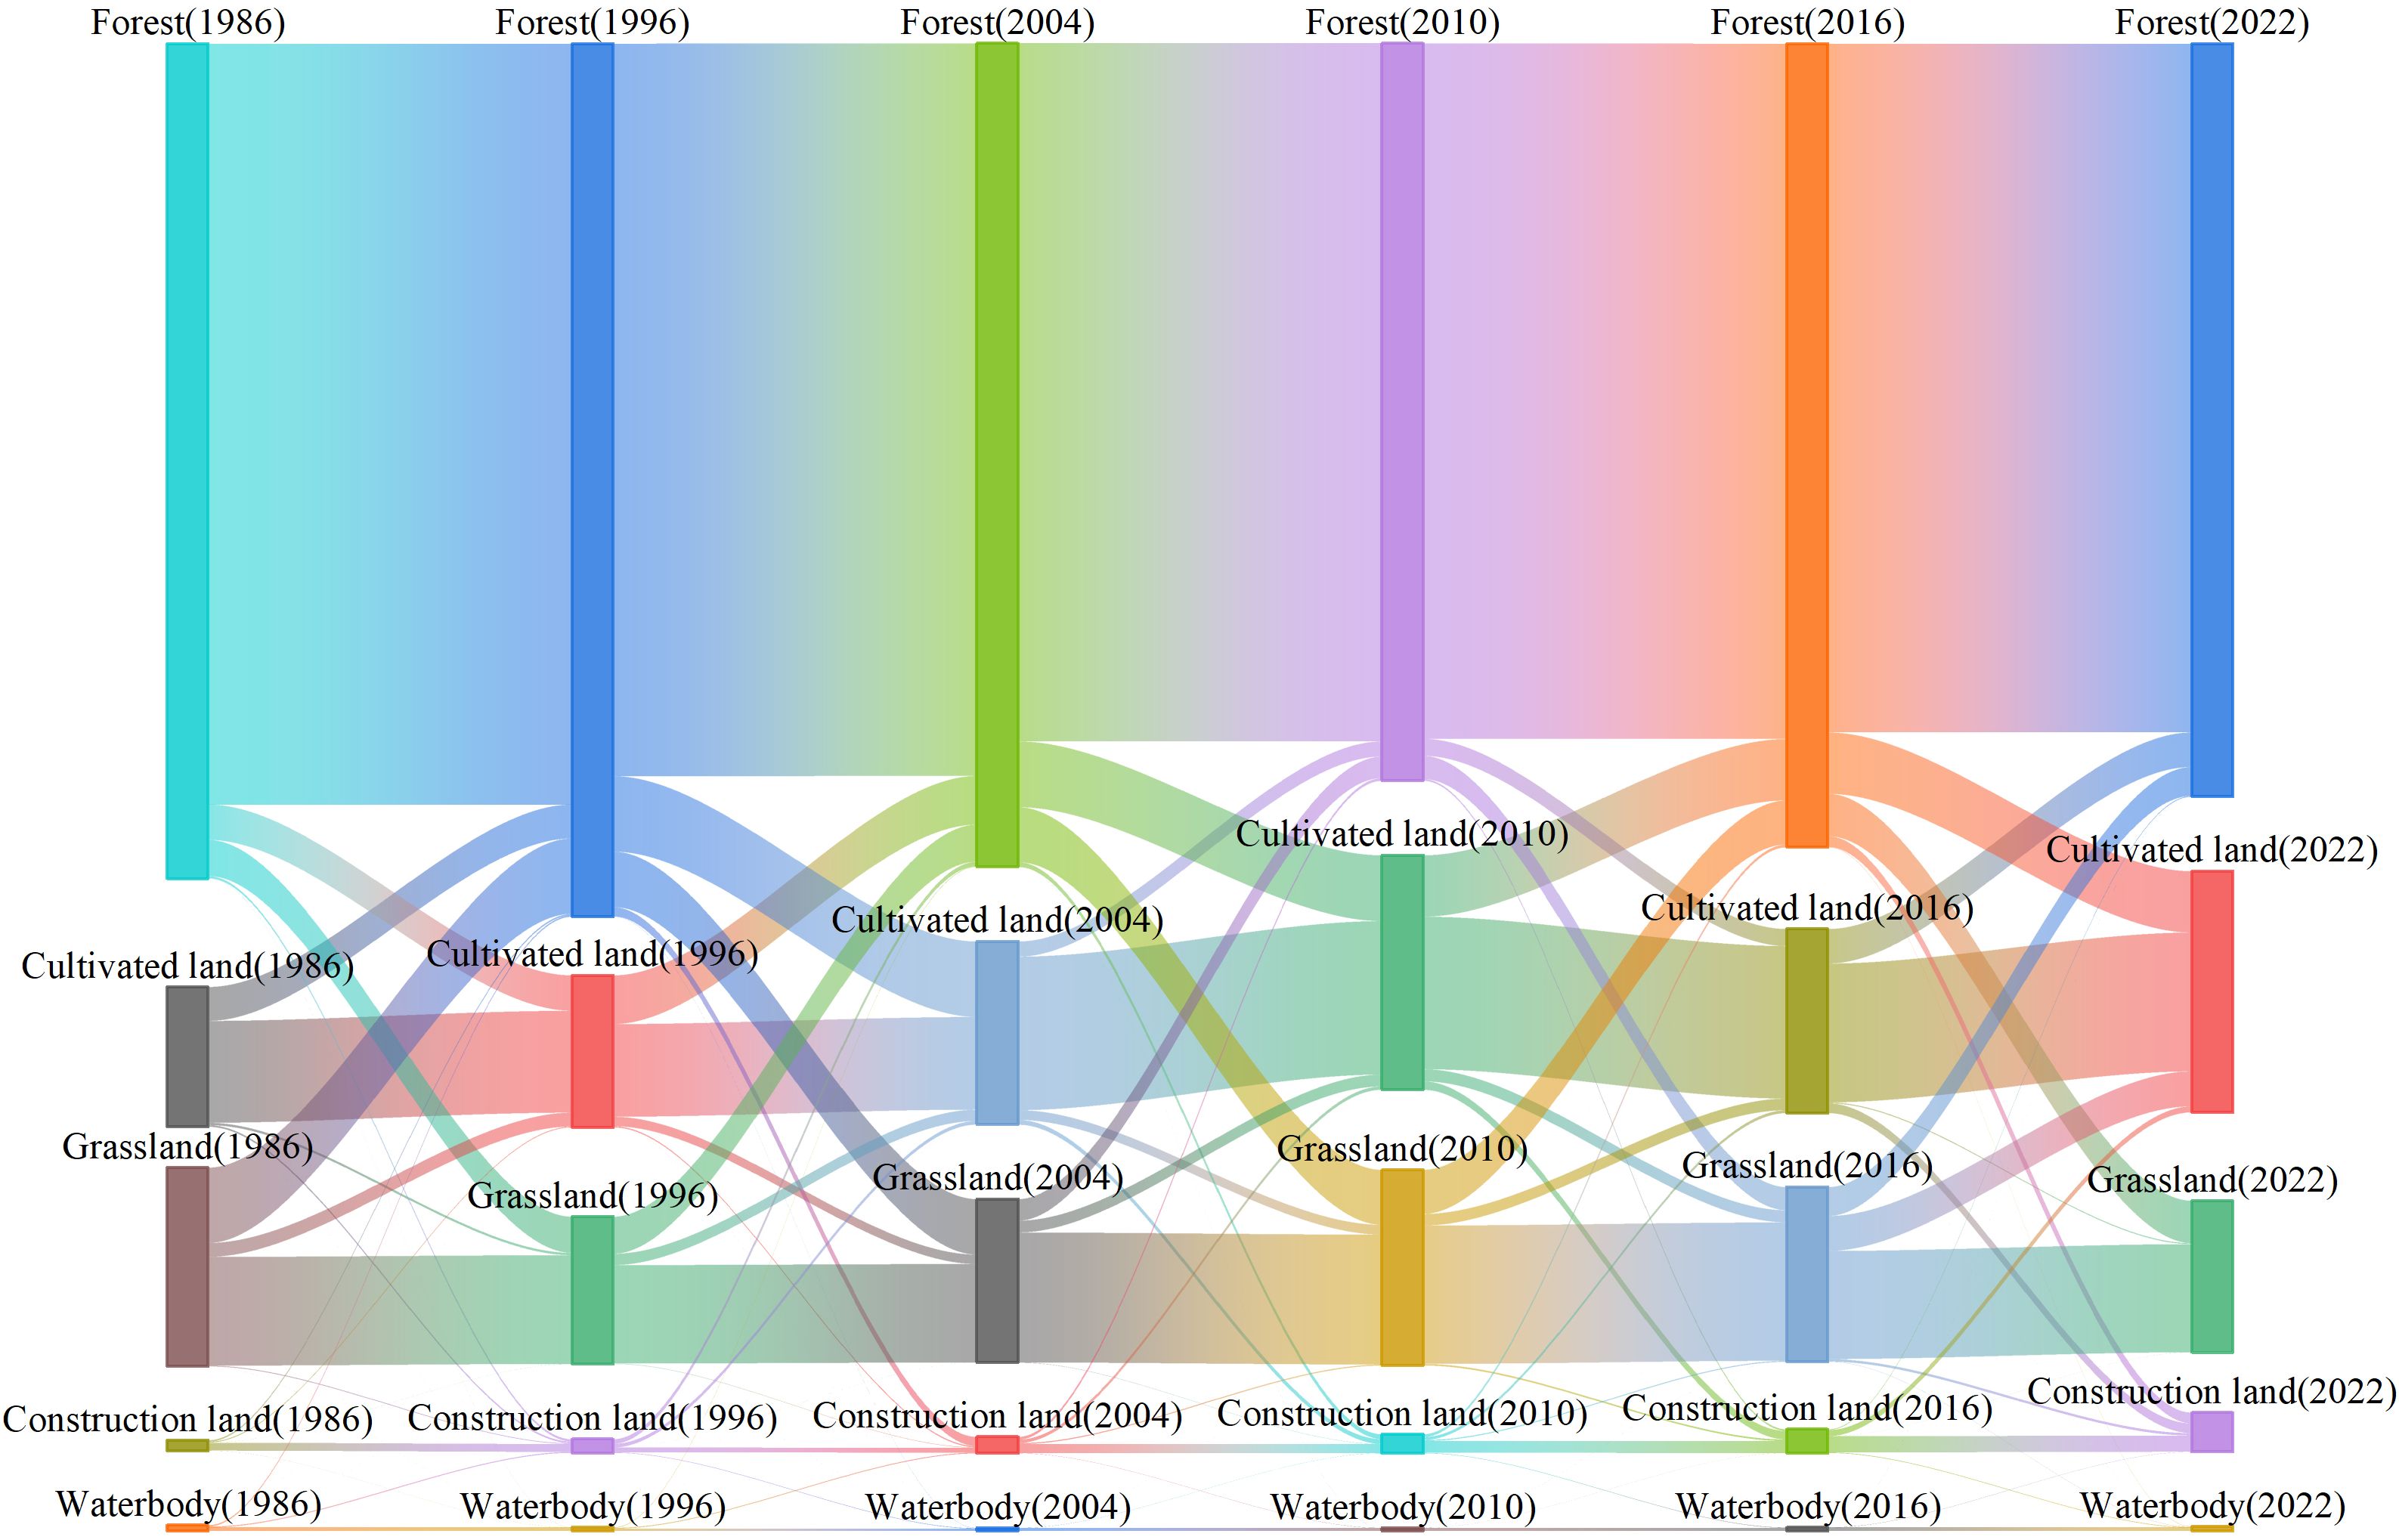
Figure 2. Land types transfer map.
3.2 The spatiotemporal scale effect of landscape pattern indices
3.2.1 Scale effect of landscape-level landscape pattern indices
Changes in landscape granularity can modify patch boundaries, segmentation, or fusion, thereby altering landscape patterns and leading to corresponding adjustments in the indices used to characterize these patterns.
At the temporal scale, discerning the consistency of landscape index response curves across six periods allows for the classification of indices into three types: Type I exhibits predictable responses to scale changes, exemplified by PD and ED; Type II demonstrates step-like responses that are less predictable, like PAFRAC and COHESION; Type III displays instability and lacks consistent scale relationships during scale changes, typified by LPI and SHDI.
From Figure 3, it is evident that both PD and ED in Lushui City’s land use landscapes follow a decreasing “L” trend as granularity increases, displaying a strong fit with power functions, with R2 exceeding 0.96 (Table A7). This highlights the high predictability of these indices, facilitating accurate extrapolation or interpolation of landscape features at various spatial scales. PD notably declines as granularity increases, particularly before reaching 100m, with a lesser decrease between 100-200m, and stabilization occurring after 200m, with minimal granularity-induced fluctuations. Similarly, ED experiences rapid decreases within the 30-100m granularity range, followed by gradual flattening beyond 500m. This trend suggests that as granularity rises, smaller patches within the landscape merge gradually with dominant ones, thereby reducing landscape fragmentation, promoting a more uniform landscape shape, and enhancing the dispersion of different land use types. The consistency in PD and ED variations across different periods indicates that the scale effects of these two indices remain unaffected by time.
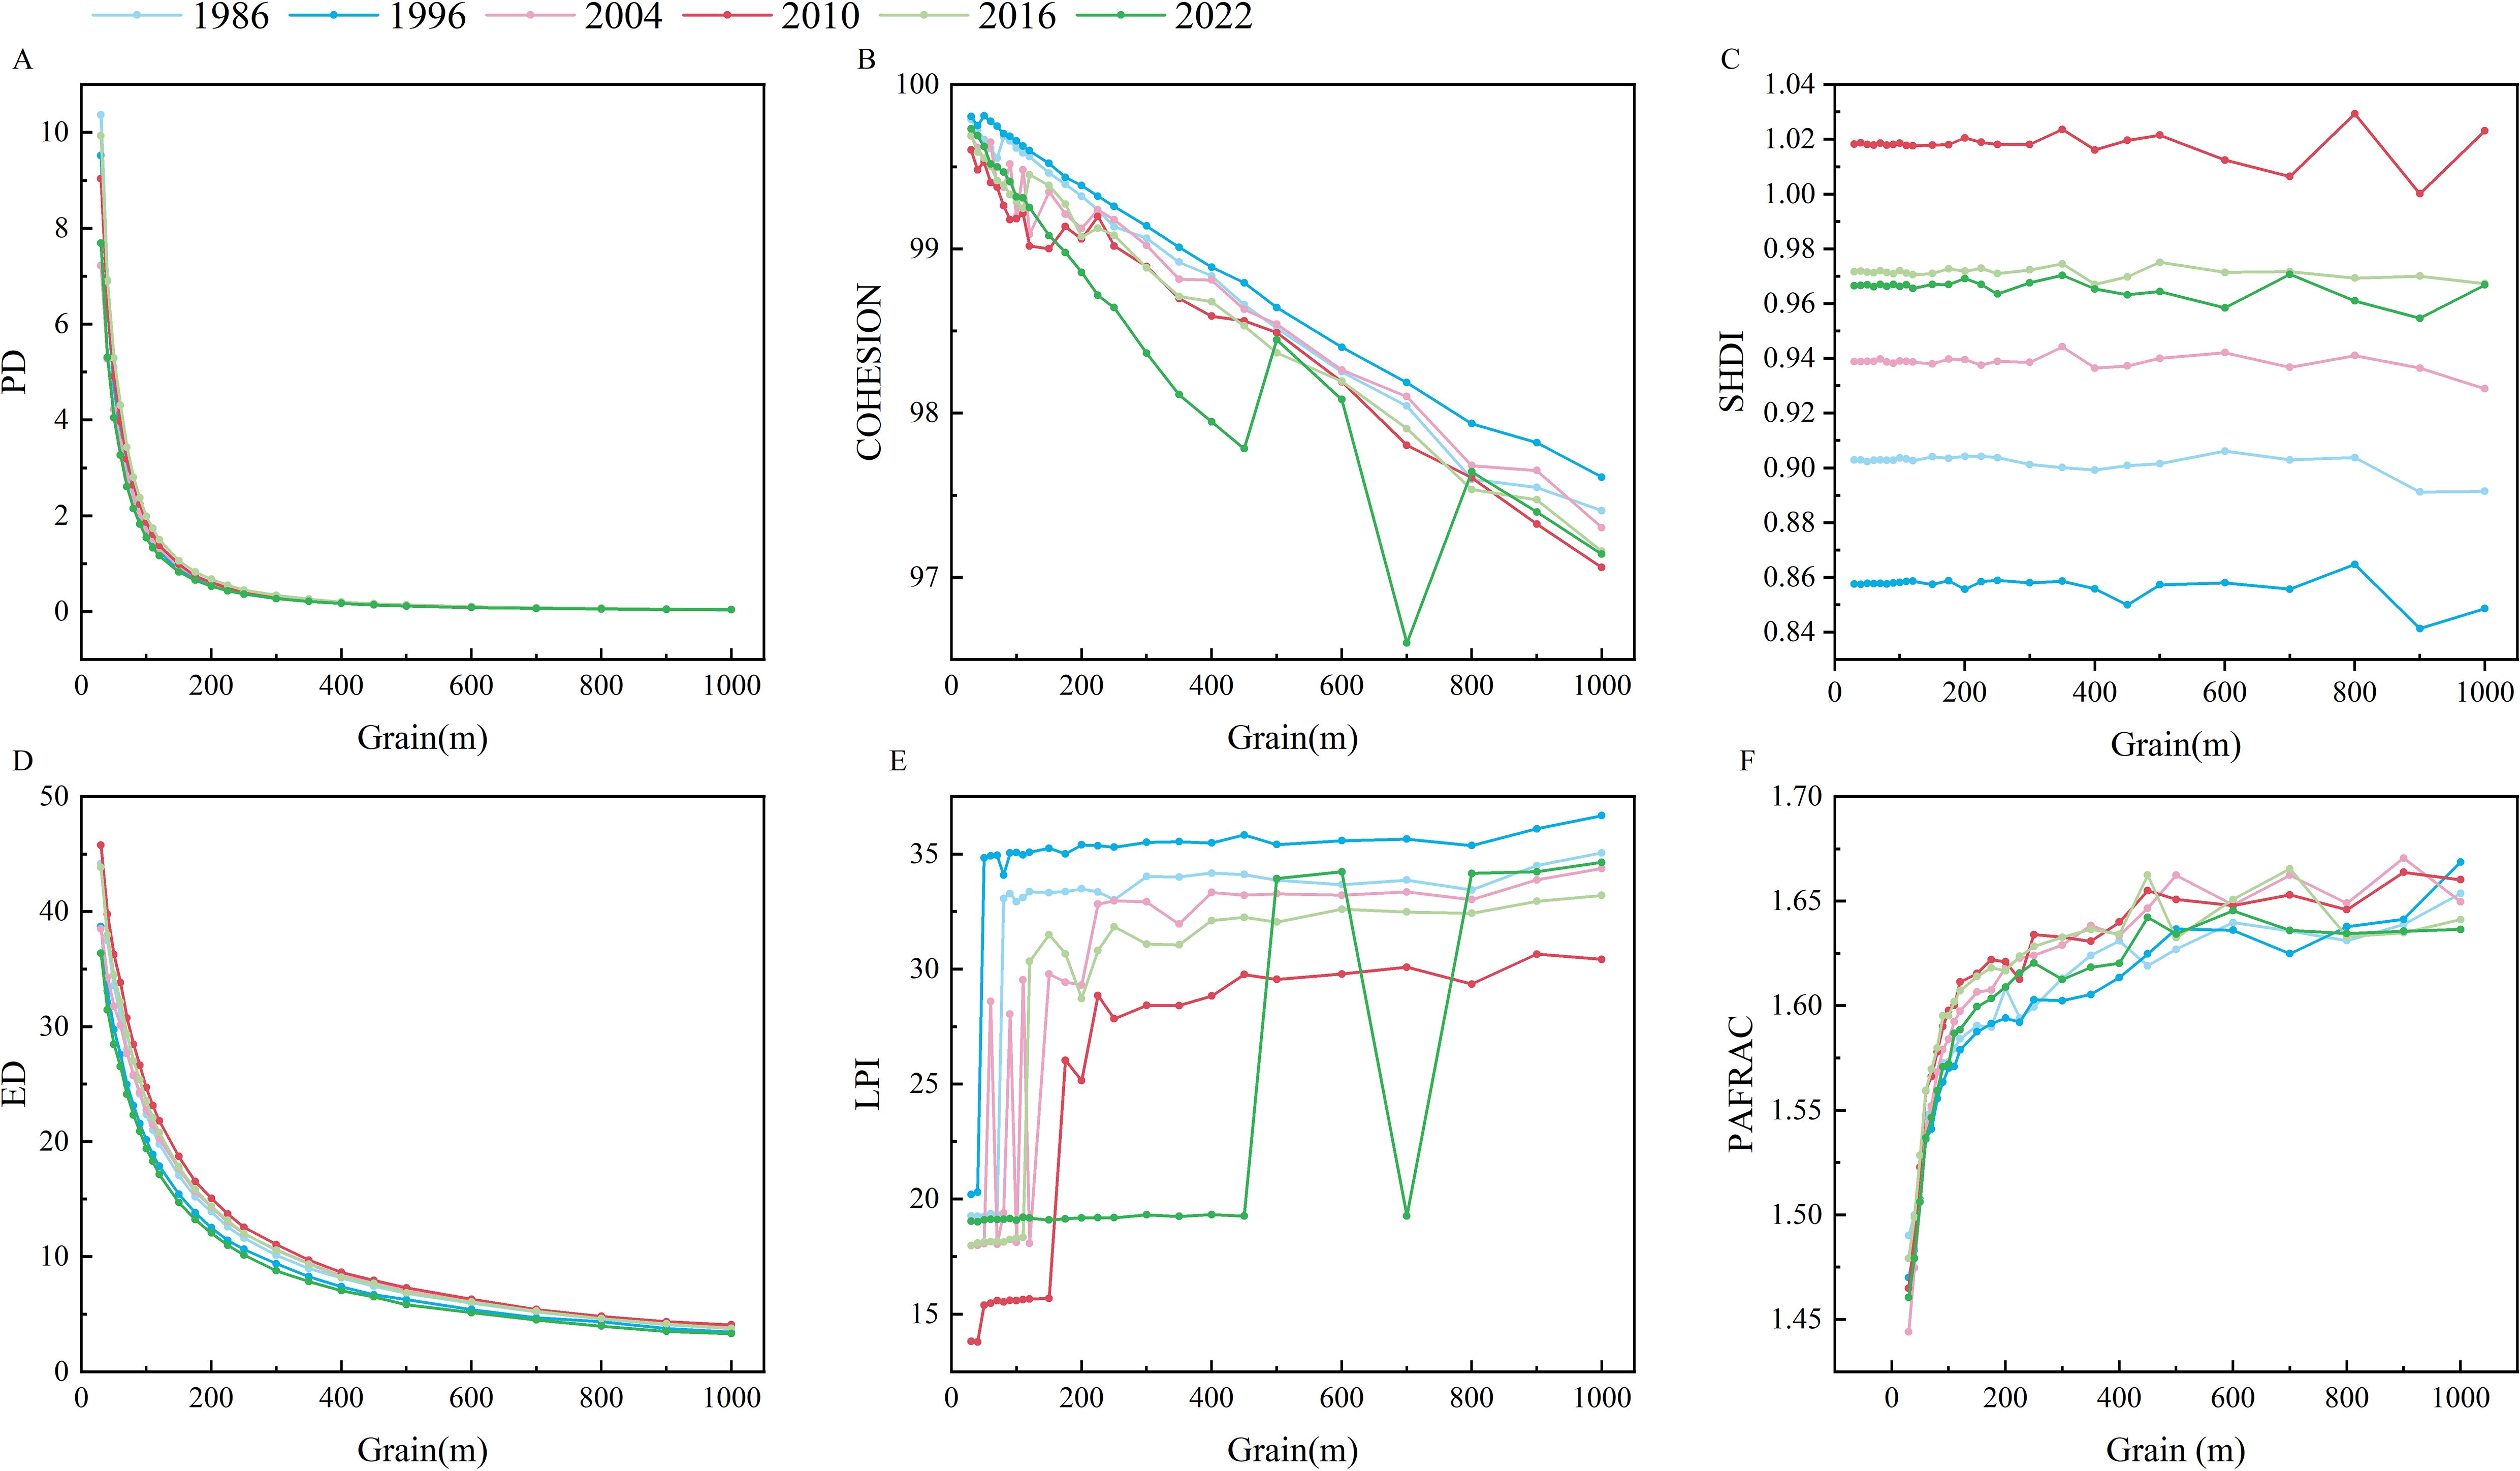
Figure 3. Landscape level exponential granularity response curve. (A) Patch Density (PD); (B) Cohesion Index (COHESION); (C) Shannon’s Diversity Index (SHDI); (D) Edge density (ED); (E) Largest Patch Index (LPI); (F) Perimeter Area Fractal Dimension (PAFRAC).
Type II PAFRAC demonstrates a step-like increase with increasing granularity, with the first inflection point occurring between 60-100m. At a granularity of 100m, it undergoes a gradual increase across all years, albeit with slight variations. Before 200m, the most significant growth occurred in 2010, while after 250m, the increase peaked in 1996, with 2016 showing the most fluctuation between 400m-800m. In contrast, COHESION exhibits a step-like decrease with increasing granularity, with more pronounced changes at smaller scales. The first inflection point for Patch Cohesion ranges from 40-110m across different years, with notable fluctuations observed in 2022.
Type III LSI shows varying ranges of the first inflection point, spanning from 40-450m across different years. Unlike other indices, the inflection points for Landscape Shape Index are relatively broad and shift over time, with the first inflection point occurring at 450m in 2022. This suggests significant variability in the response of Landscape Shape Index to granularity across different periods. SHDI displays the first inflection point ranging from 120m to 225m in different years.
3.2.2 Scale effects of class-level landscape pattern indices
At the class level (Figure 4), PLAND exhibits irregular changes with increasing granularity. Generally, PLAND for grassland, forest land, cultivated land, construction land, and water bodies shows minimal variation with granularity before 150m, followed by increased fluctuations after 150m. PLAND responses to scale differ across different years. TE and LSI decrease with increasing granularity for all five land types, following predictable power curves for grassland, cultivated land, forest land, and construction land, with significant reductions in variation after a granularity of 100m and a flattening trend after 200m. Comparatively, despite varying initial granularity values (30m) for these land types across different years, their responses to granularity exhibit consistent trends and magnitudes over time, indicating that the scale response of these indices is not influenced by time. The TE of water bodies shows a step-like decreasing trend with increasing granularity, with most years exhibiting an inflection point around 120m, while the first inflection point for water body LSI ranges from 60-120m, reflecting the sensitivity of edge indicators for this land type to scale changes compared to others. AI shows a two-stage response to scale, with slight variations between different land types. Grassland, cultivated land, and forest land exhibit a significant decline before 200m, followed by a slowing trend after 200m, with a few inflection points. Construction land and water bodies enter a stable period around 100m, with both frequency and magnitude of index changes increasing with scale. The variations in these indices for different land types also differ across different years.
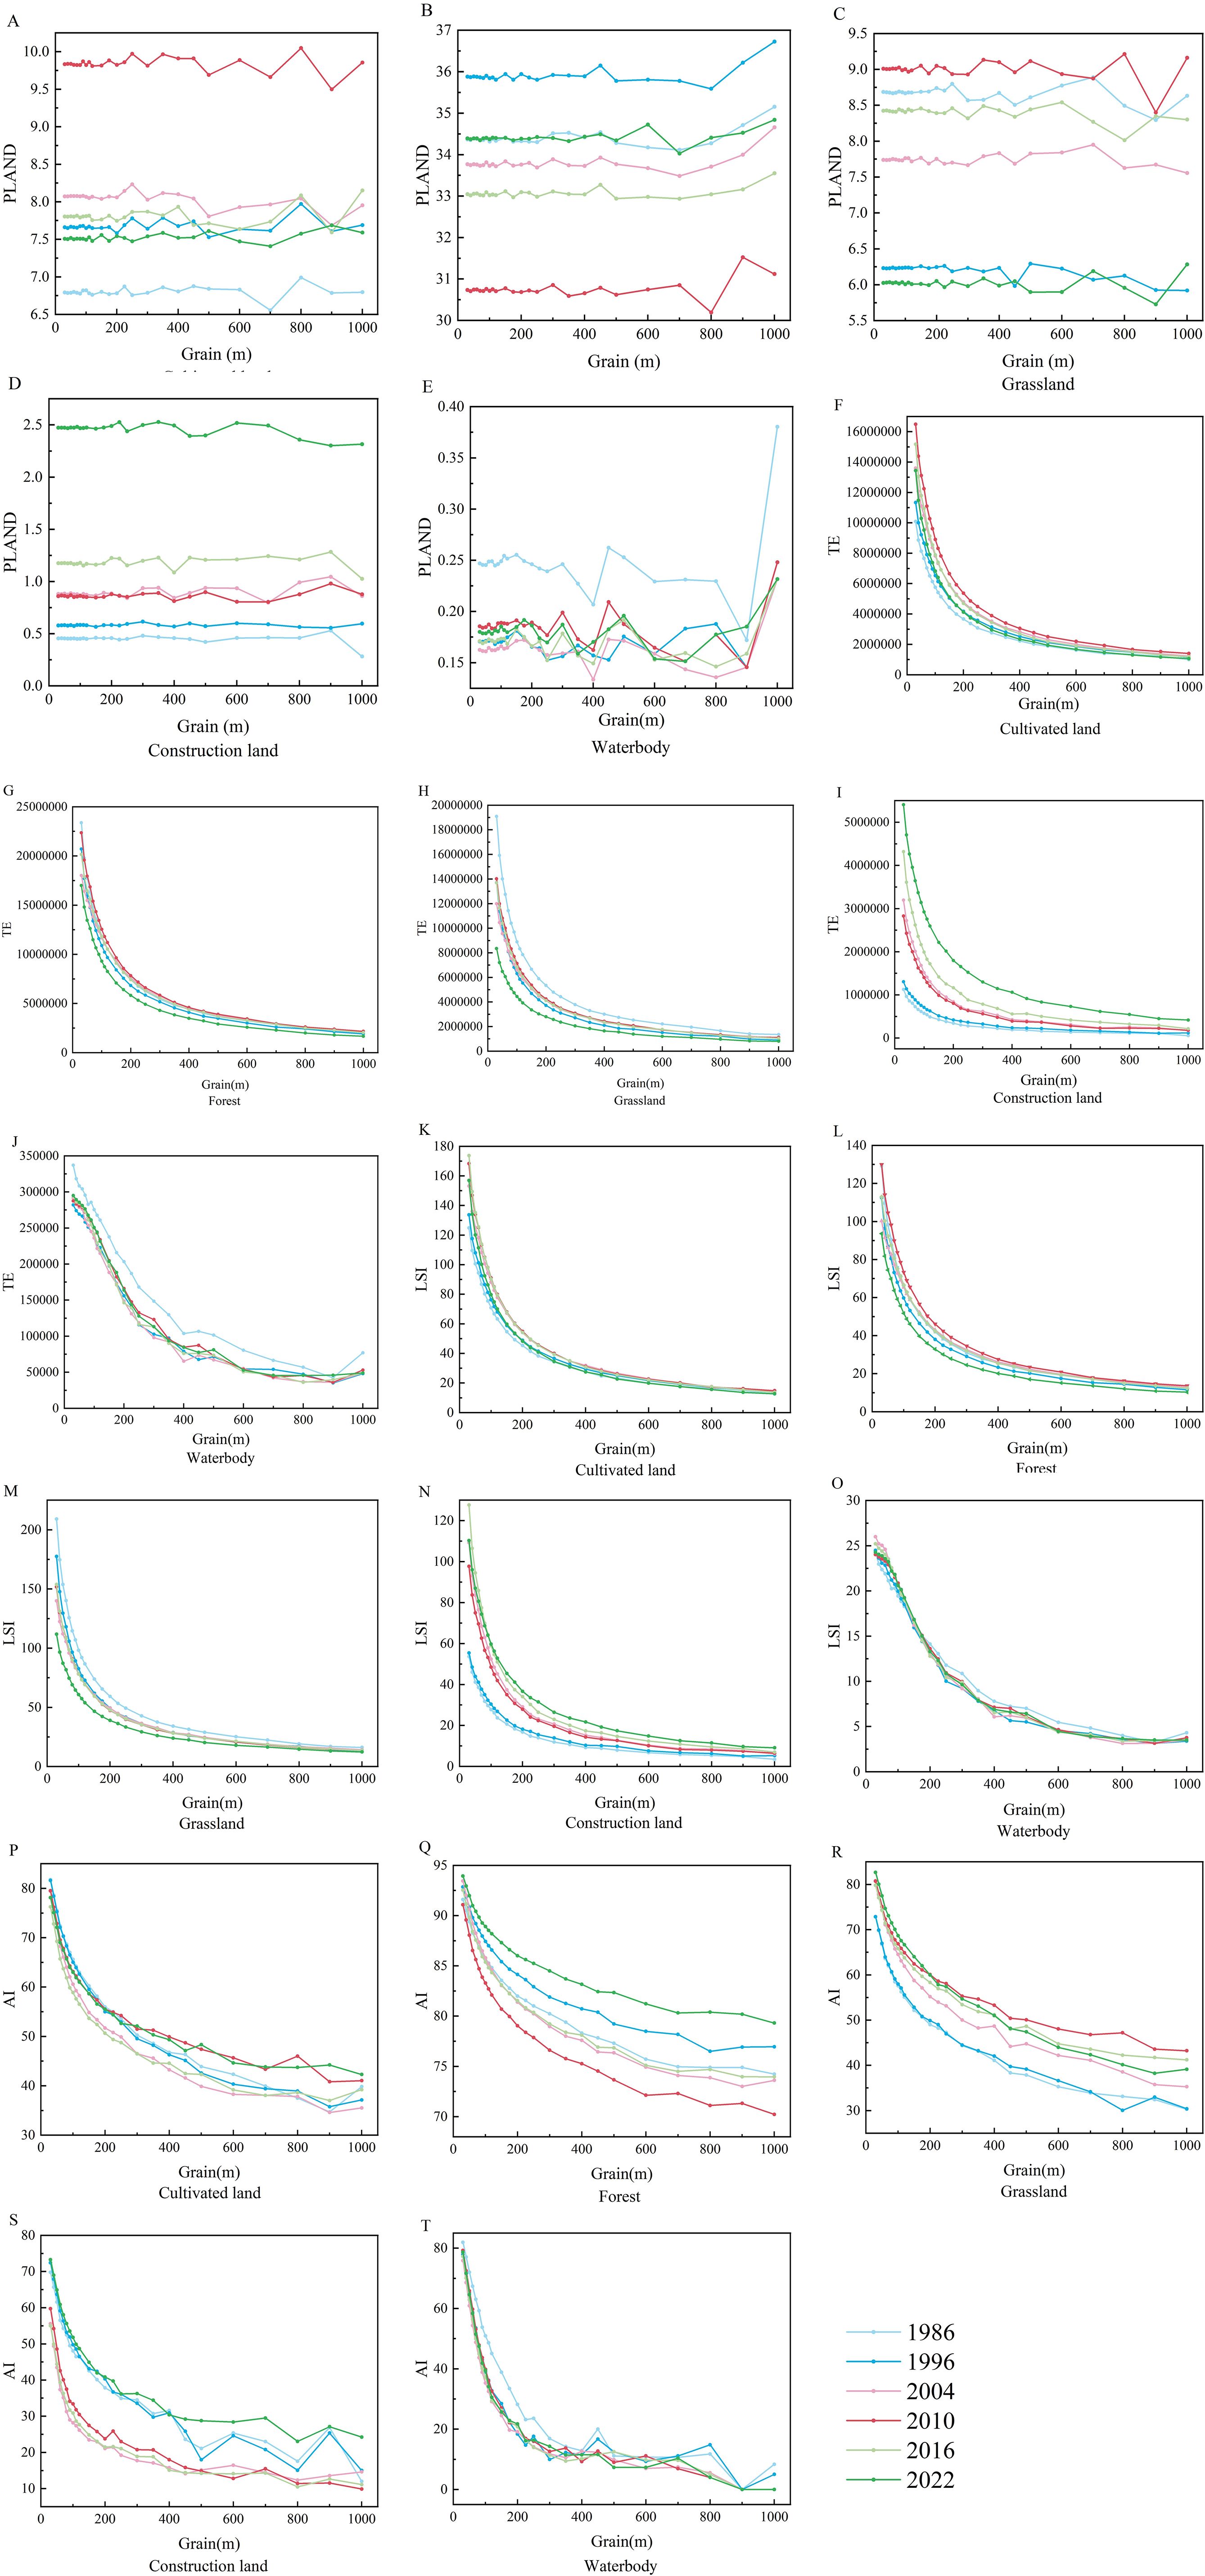
Figure 4. Landscape type horizontal exponential granularity response curve. (A) PLAND-Cultivated land; (B) PLAND-Forest; (C) PLAND-Grassland; (D) PLAND-Construction land; (E) PLAND-Waterbody; (F) TE-Cultivated land; (G) TE-Forest; (H) TE-Grassland; (I) TE-Construction land; (J) TE-Waterbody; (K) LSI-Cultivated land; (L) LSI-Forest; (M) LSI-Grassland; (N) LSI-Construction land; (O) LSI-Waterbody; (P) AI-Cultivated land; (Q) AI-Forest; (R) AI-Grassland; (S) AI-Construction land; (T) AI-Waterbody.
3.3 Determination of suitable granularity for landscape pattern analysis
3.3.1 First scale domain
By employing the first scale domain method to analyze the granularity response curves of landscape-level indices in Lushui City across different years, we found consistent scale inflection points for the chosen six indices at 100m and 200m. Similarly, through an examination of the granularity response curves of class-level indices across various land use types, we determined the first scale domain and appropriate granularity range for each index, as detailed in Table 4. The first scale domain is categorized into two ranges: 30-100m and 30-200m. Consequently, we conclude that the optimal scale for landscape pattern analysis in Lushui City is 100m.
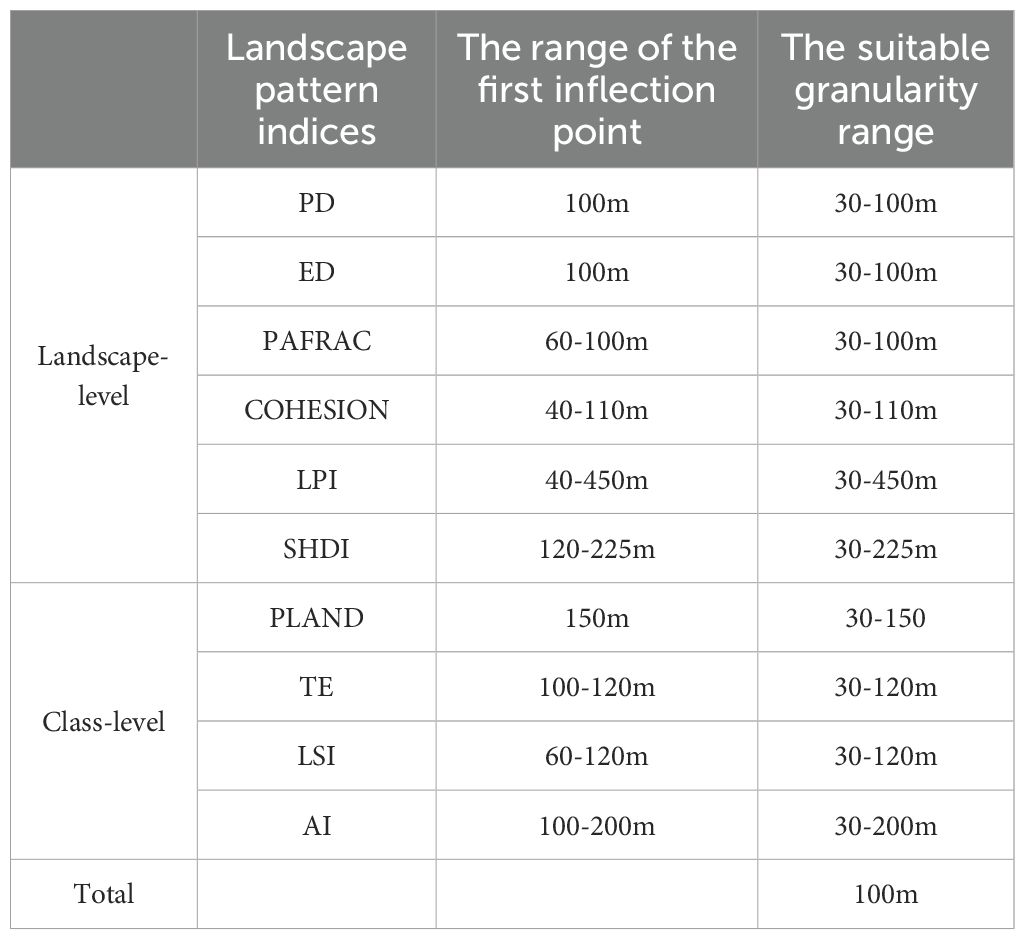
Table 4. The first scale domain of each index.
3.3.2 Information loss evaluation model
This study investigated the impact of granularity on the landscape information loss of 10 landscape pattern indices in Lushui City from 1986 to 2022, as illustrated in Figure 5. Generally, the information loss of each index increases with granularity, but they display diverse trends. Indices like PD, ED, TE, and LSI witness rapid information loss as scale increases. PD and LSI stabilize after 300m, while ED and TE plateau after 400m. Thus, a narrower scale range is preferable for these indices. PAFRAC and AI show fluctuating information loss with scale, with the first inflection point typically around 100m, followed by stable fluctuations after 450m. Across different years, COHESION, SHDI, and PLAND exhibit minor fluctuations within the initial 100m range but experience rapid information loss thereafter. The information loss curves of LPI vary notably among different years, with most indicating the first inflection point around 100m. Overall, all landscape indices demonstrate relatively stable changes and minimal information loss around 100m. Based on the analysis of the information loss evaluation model, the suitable granularity range for landscape pattern analysis is determined to be 100m.
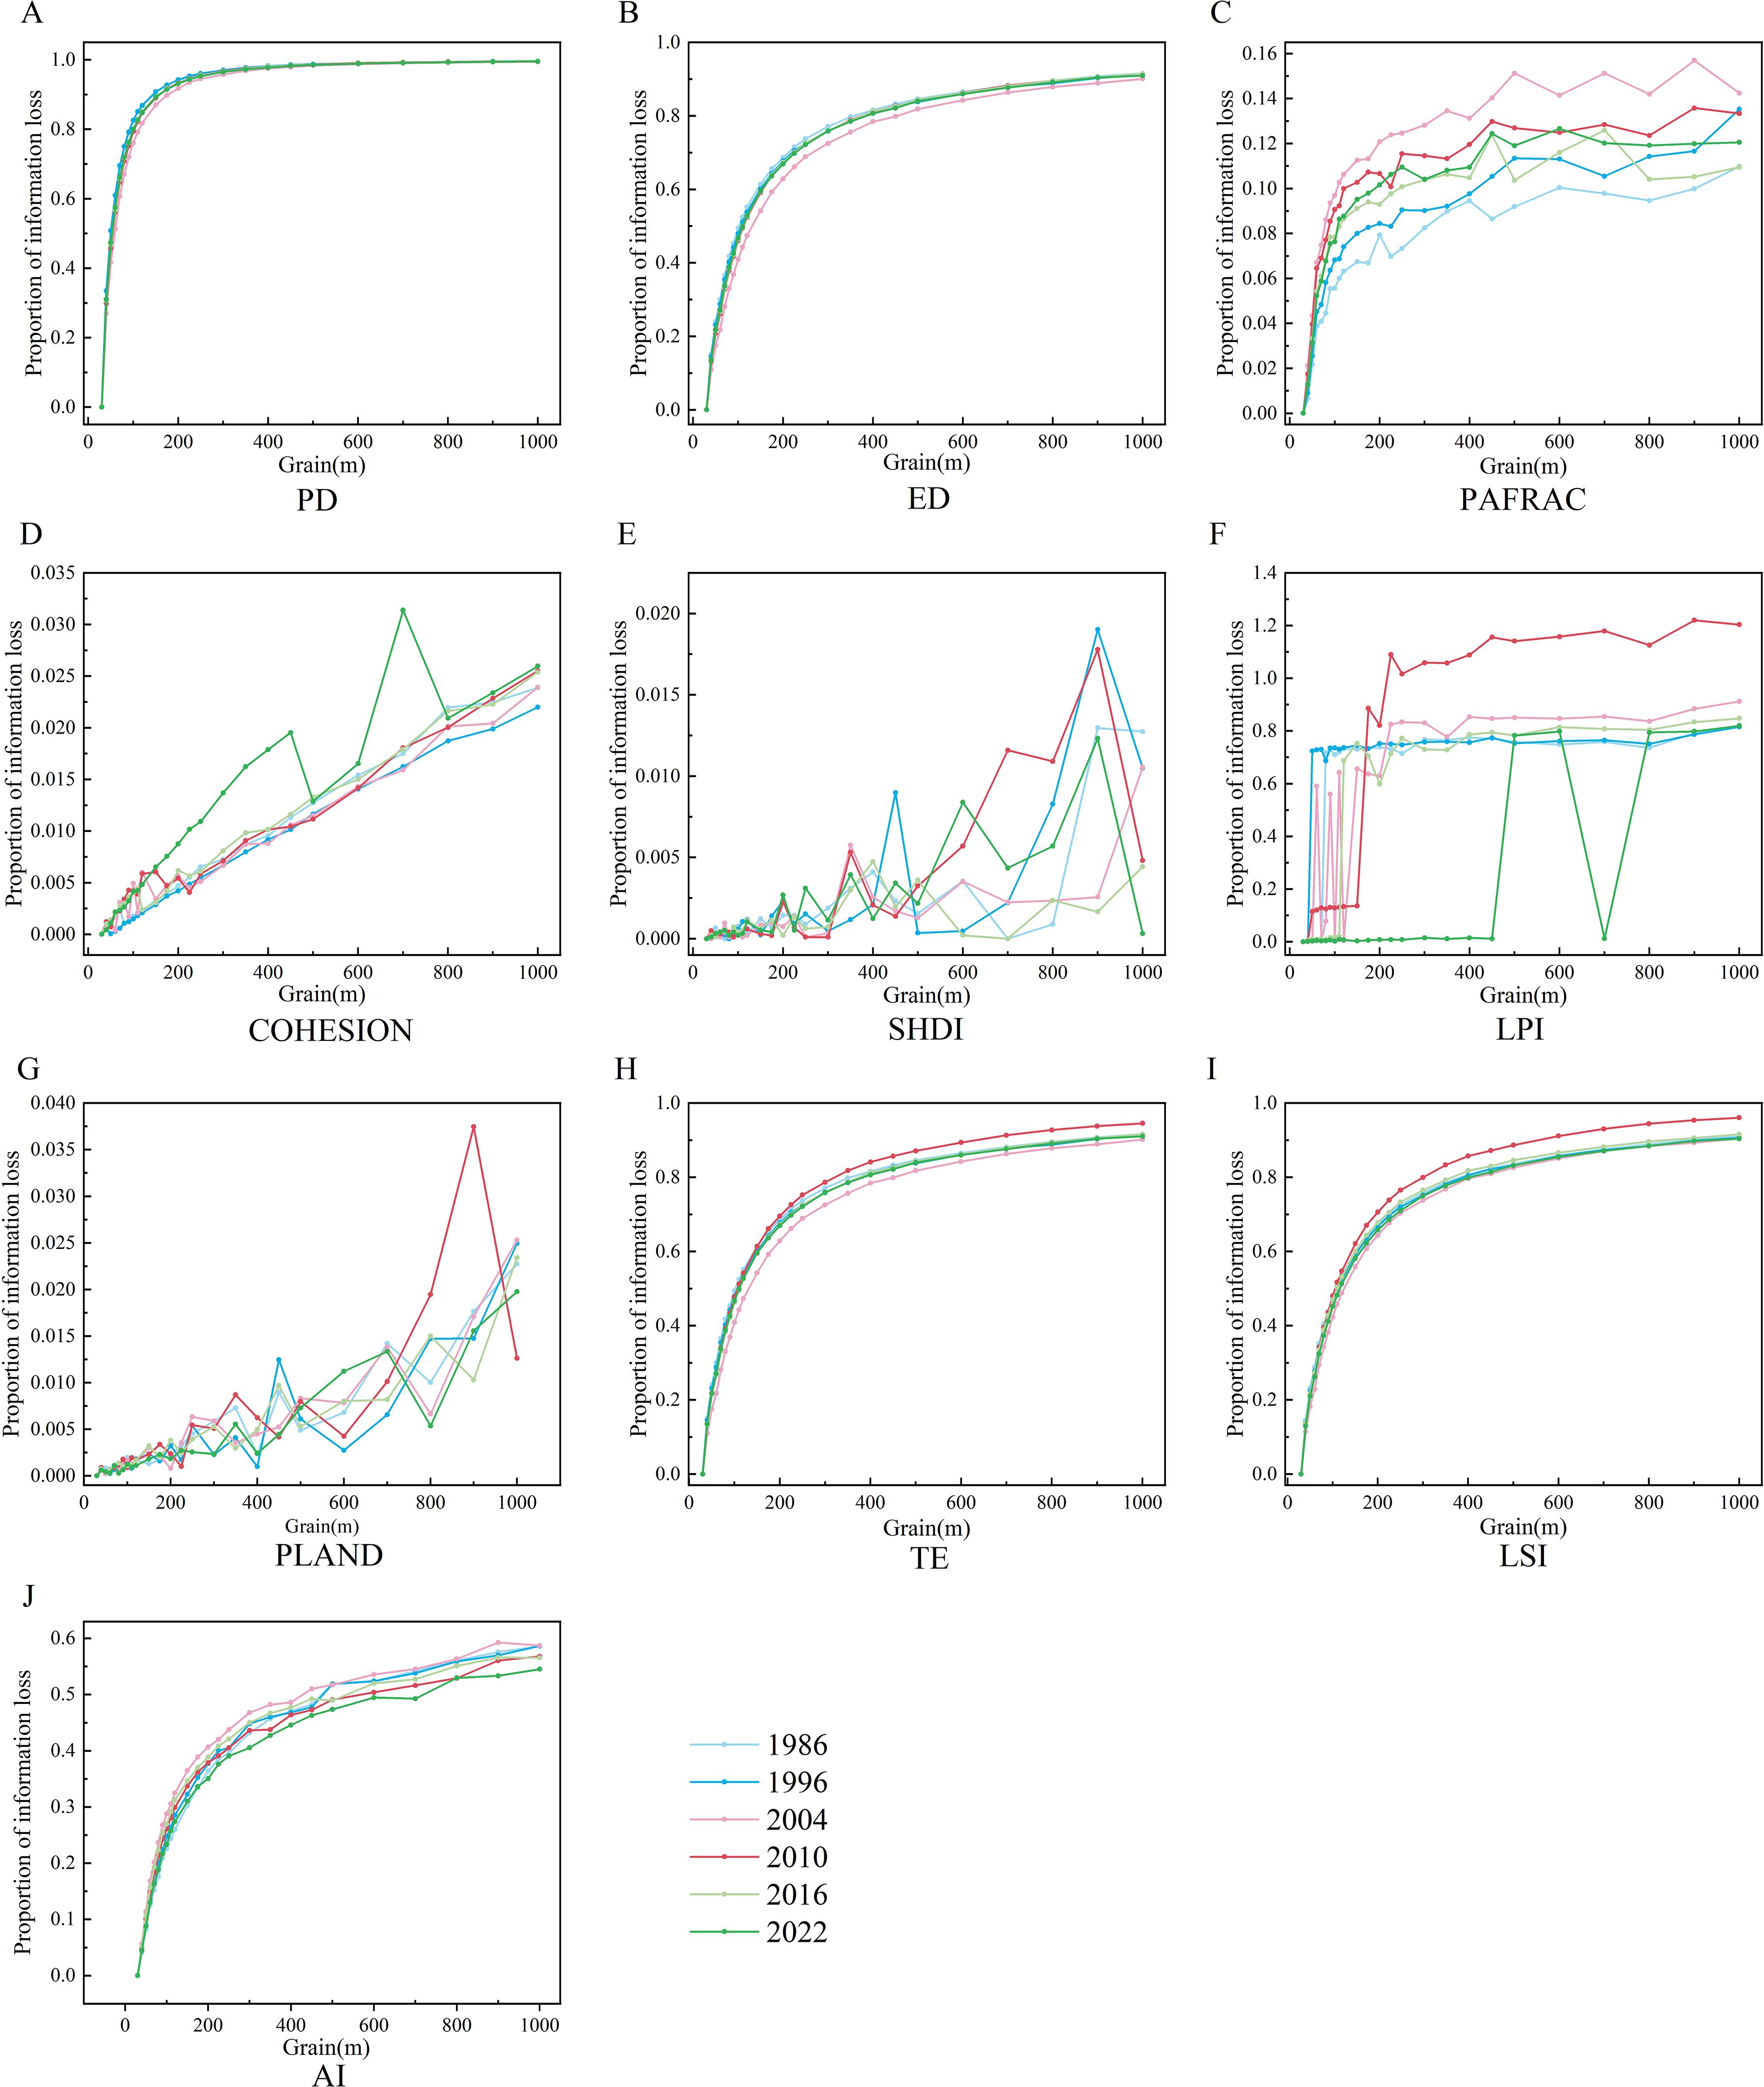
Figure 5. Information loss of landscape pattern indices for different grain sizes. (A) PD; (B) ED; (C) PAFRAC; (D) COHESION; (E) SHDI; (F) LPI; (G) PLAND; (H) TE; (I) LSI; (J) AI.
3.4 The spatiotemporal variation of landscape pattern indices in Lushui City
3.4.1 The spatiotemporal variation of landscape pattern indices at the landscape level
We selected a granularity of 100 meters as the most suitable scale for analyzing landscape pattern changes in Lushui City. Consequently, we conducted a spatiotemporal analysis of landscape pattern indices for six periods using a granularity of 100 meters. The analysis results of six landscape indices at the landscape level, including PD, ED, PAFRAC, COHESION, LPI, and SHDI, in the study area are shown in Figure 6.
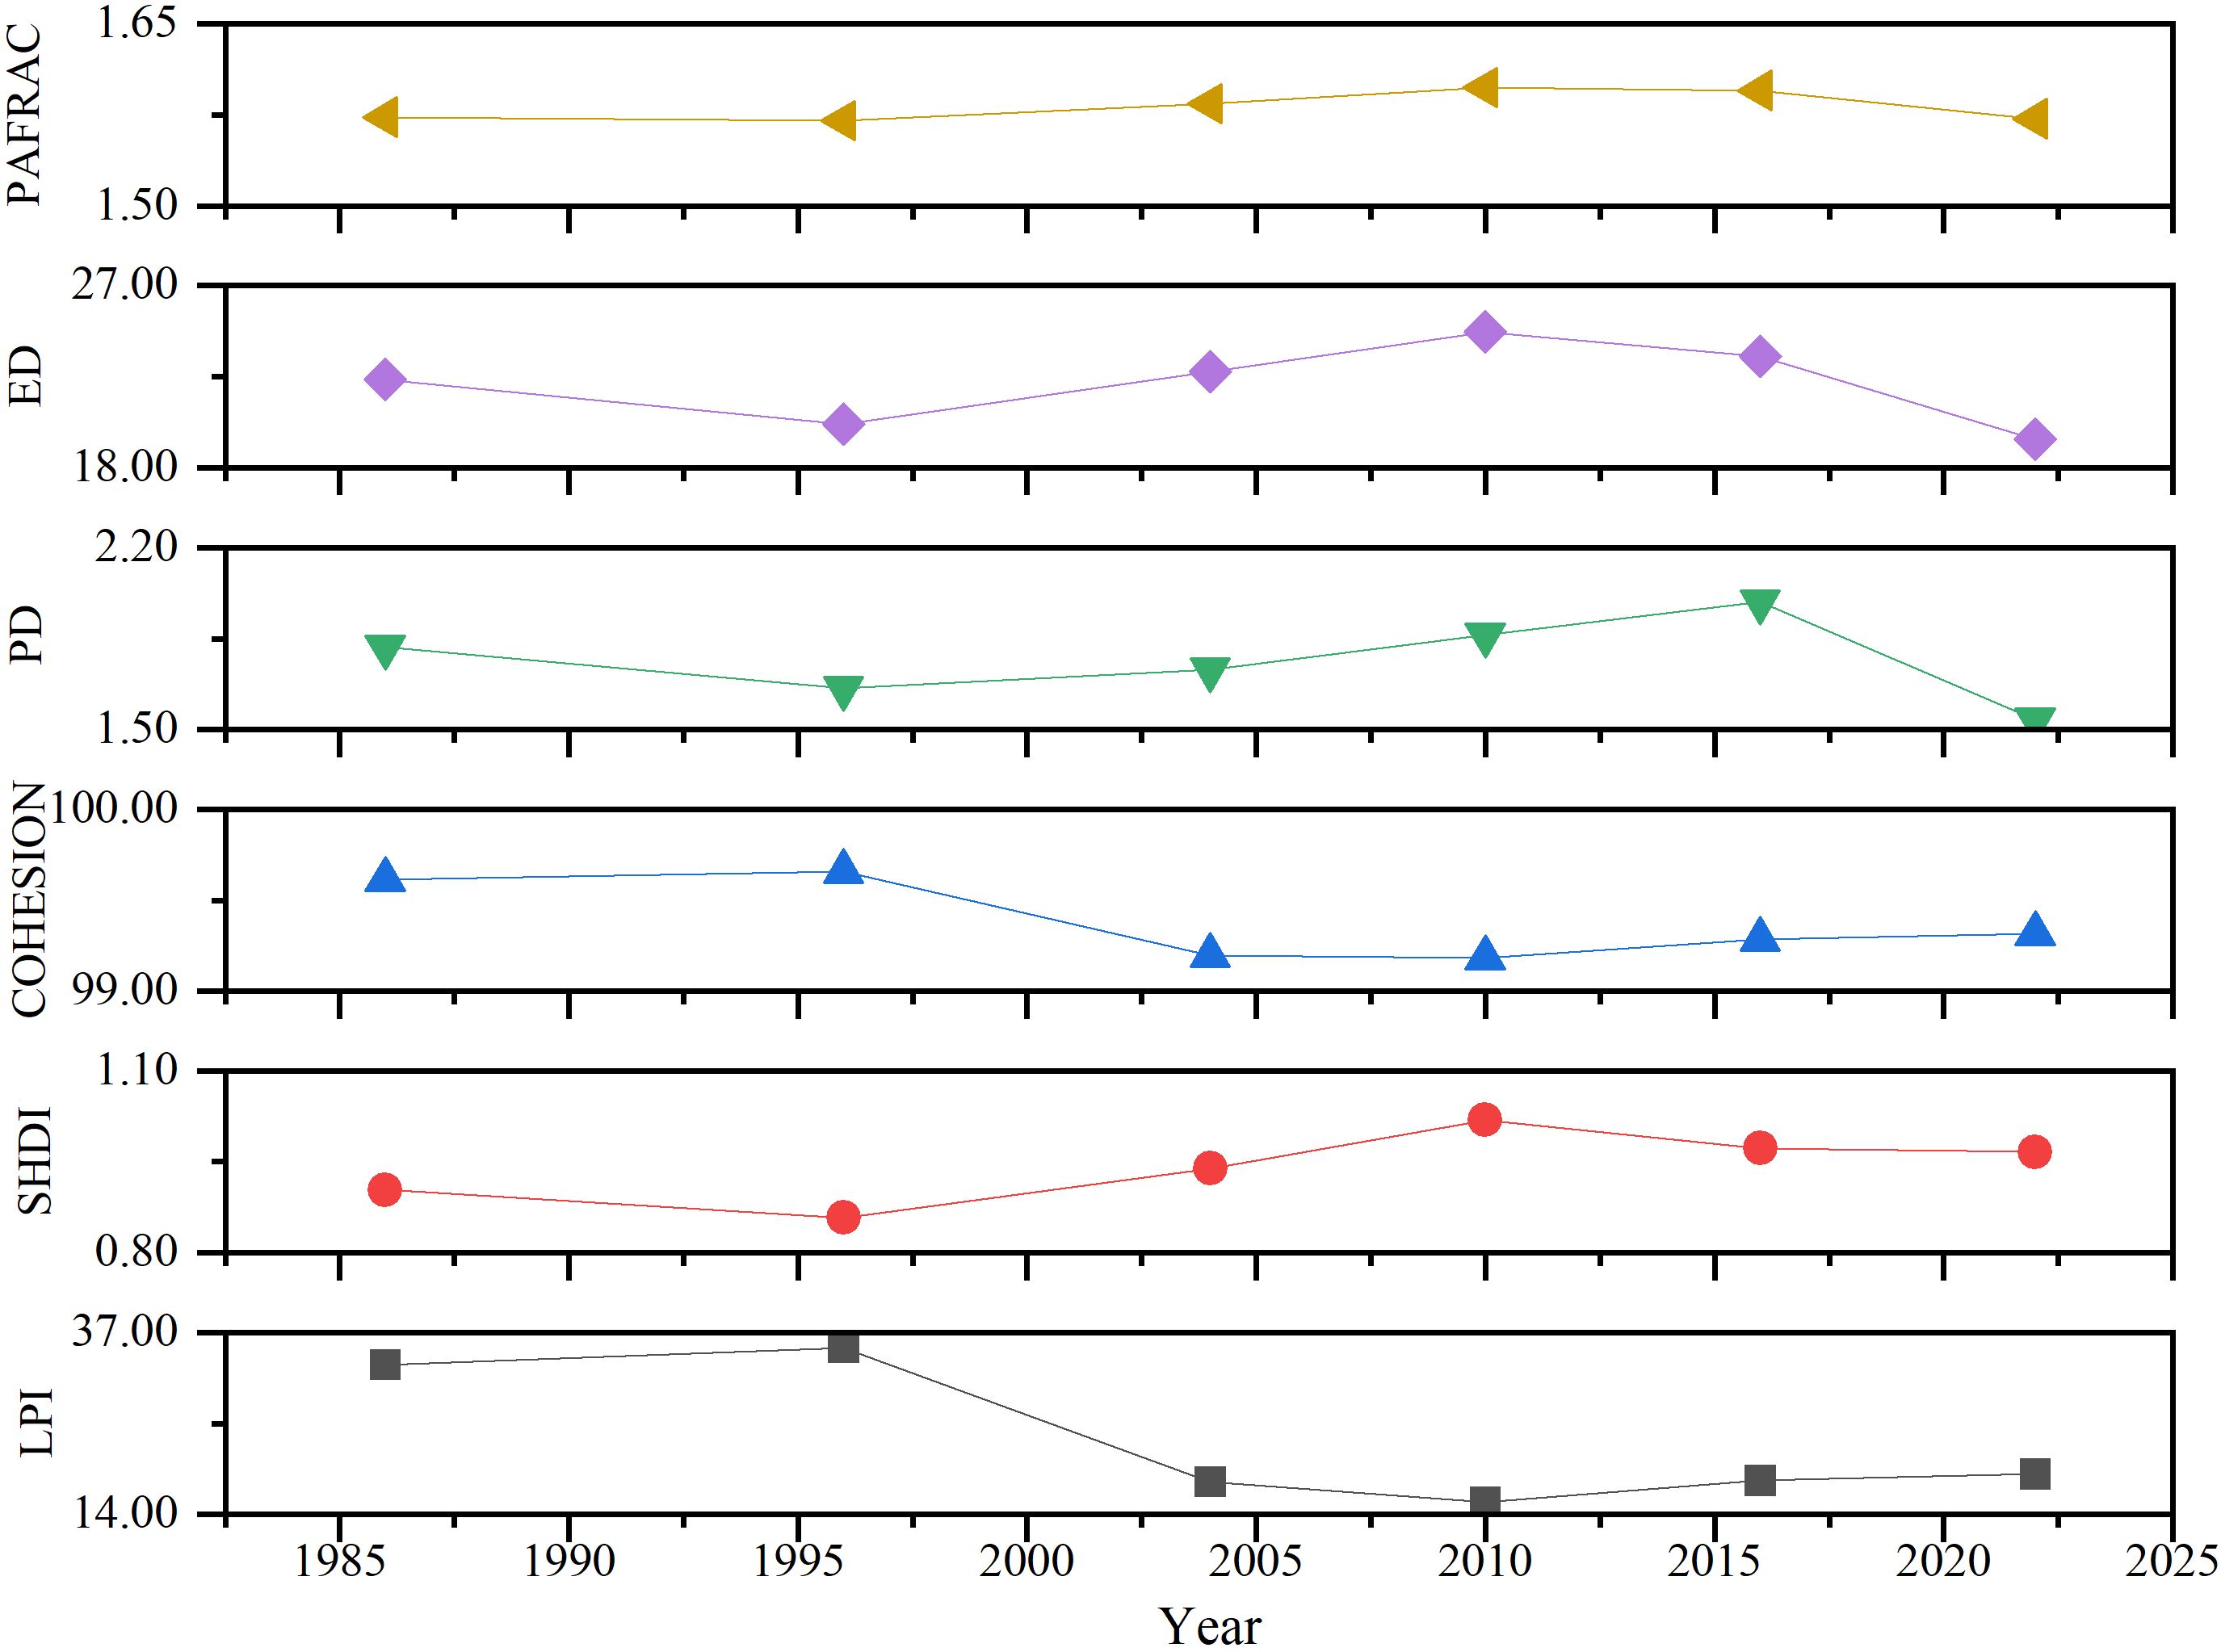
Figure 6. Spatiotemporal variation of landscape pattern indices at landscape level in Lushui City.
PAFRAC shows overall stability, peaking at 1.60 in 2010, reflecting the most intricate landscape shapes during that period. Similarly, ED reached its peak in 2010, indicating significant landscape fragmentation in Lushui City. PD fluctuated between 1.54 and 1.99, with an initial decline, subsequent increase, and another decline. PD steadily rose from 1996 to 2016, hitting a peak of 1.991 in 2016. SHDI declined from 1986 to 1996, then rose to a peak of 1.019 in 2010 before gradually decreasing. COHESION and LPI followed similar trends from 1986 to 2022, peaking before 1996, declining steadily until 2010, and then experiencing a slight increase. These trends suggest reduced human impact on the landscape before 1996, increasing interference thereafter, and some improvement post-2010.
In summary, Lushui City’s landscape exhibited a high level of cohesion and connectivity before 1996, with minimal human interference. However, after 1996, the landscape began to degrade, showing increased fragmentation, reaching its peak in 2010, before gradually recovering. This shift could be attributed to the city’s urban development trajectory. Following 1996, the economy underwent rapid growth, accelerating urbanization and causing ongoing destruction and encroachment on natural landscapes. However, after 2010, the construction of ecological civilization was incorporated into the five-in-one overall layout of socialism with Chinese characteristics. Lushui City has deeply implemented this initiative, commencing vigorous efforts to protect the environment, leading to the restoration of landscapes.
3.4.2 The spatiotemporal variation of landscape pattern indices at the class level
The characteristics of different landscape types vary significantly (see Figure 7). Forest consistently dominates Lushui City’s landscape, having the highest PLAND values, followed by cultivated land and grassland, whereas construction land and water bodies exhibit lower PLAND values. Forest and cultivated land both peaked in TE values in 2010, while grassland reached its maximum in 1986. Regarding LSI, grassland and cultivated land have relatively larger indices, indicating more irregular patch shapes in these two land types. Water bodies consistently have the smallest and relatively stable LSI values over different years, suggesting relatively simple patch shapes. Conversely, there is an increasing trend in construction land’s LSI, indicating a gradual shift towards irregular patch shapes in this land type. Forest and cultivated land show relatively stable changes in AI from 1986 to 2022, while grassland shows a trend of gradual enhancement, indicating strong spatial aggregation. Construction land and water bodies fluctuate over different years, primarily due to their susceptibility to human disturbance, leading to instability in their aggregation levels.
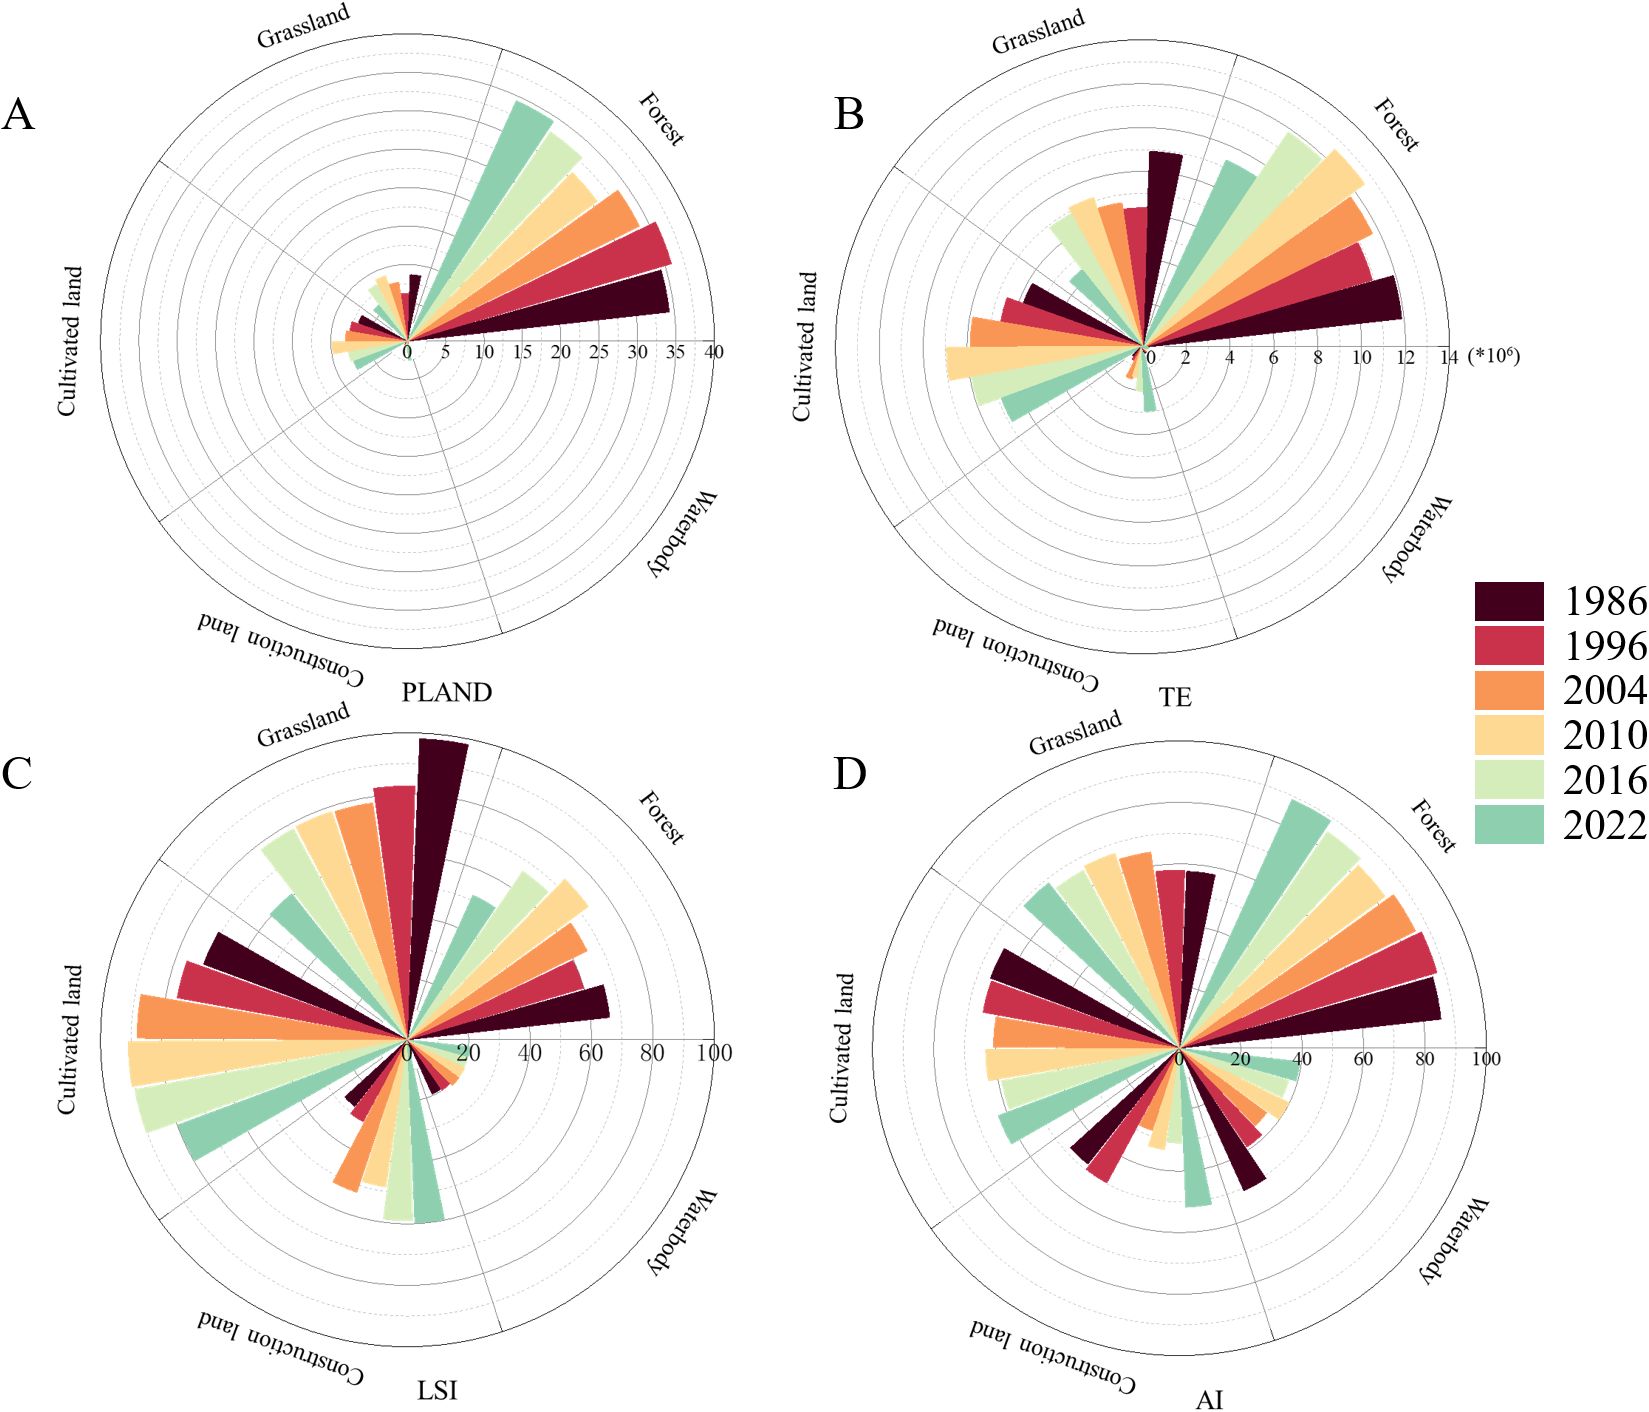
Figure 7. Spatiotemporal variation of landscape pattern indices at the class level of Lushui City. (A) PLAND; (B) TE; (C) LSI; (D) AI.
4 Discussion
4.1 Response of landscape metrics to changing grain size
This study examines variations in landscape indices across multiple grain sizes, encompassing both landscape and class levels, to provide a comprehensive portrayal of analyzed landscapes. We selected 10 commonly used landscape indices, including six at the landscape level and four at the class level. Notably, indices such as PD and ED at the landscape level, and LSI and TE at the class level, decreased as grain size increased. This trend is attributed to patch fusion with larger grain sizes, reducing patch numbers, weakening boundary effects, and decreasing shape indices. Conversely, indices like COHESION at the landscape level and AI at the class level showed a stepped downward trend due to enlarged grain sizes blurring patch boundaries and merging smaller patches. This disrupts landscape connectivity, reducing overall cohesion and aggregation. Larger grain sizes also tend to homogenize landscape appearance, potentially dispersing patch type distributions and further lowering COHESION and AI values. Furthermore, changes in grain size influence patch type dominance, potentially reducing landscape diversity and homogenizing aggregation areas. This observation aligns with findings by Zhang et al (Zhang et al., 2020). On the other hand, PAFRAC exhibited a stepped upward trend with increasing grain size, consistent with Qiao et al.’s findings (Qiao et al., 2022), validating our results. LPI and SHDI at the landscape level, as well as PLAND at the class level, did not exhibit regular changes with scale variations. This aligns with observations of landscape granularity effects in coastal wetlands by Peng et al. in Yancheng (Tian et al., 2019). LPI increased with grain size due to patch merging up to a certain threshold, beyond which the largest patch stabilized, fluctuating within a specific range. The inconsistent scale relationship for indices like SHDI and PLAND may be due to Lushui City’s dominance by forest landscapes, comprising over 60% of the area, which minimizes the impact of grain size changes on landscape diversity and class proportions.
Due to the nonlinear ecological processes and interactions within landscapes, the changes in landscape pattern indices may exhibit different forms with increasing scale (Li et al., 2023). Autocorrelation within landscapes, characterized by similar structures across spatial scales, may lead to power-law curve changes in some indices (Li et al., 2022). However, the inherent diversity and heterogeneity within landscapes can result in irregular or unpredictable trends in response to scale changes, influenced by factors like terrain, land use, and natural environment variations across regions (Wu et al., 2000).
This study combines qualitative and quantitative methods to determine the optimal landscape analysis granularity for Lushui City, pinpointing it at 100 meters. These methods have been extensively validated in other regions like Guiyang, Chongqing, and Shanghai (Wang et al., 2021; Guan et al., 2022; Hu et al., 2023). Despite a slightly larger optimal granularity compared to previous studies within a similar area range, this variation is attributed to differences in regional landscape dynamics and characteristics (Ren et al., 2018; Wang and Li, 2021). Notably, Lushui City’s landscape is predominantly forested, with forest landscapes showing lower sensitivity to scale changes compared to other land types. Moreover, our long-term analysis of landscape indices considers variations across different time points, justifying the selection of a slightly larger optimal granularity than that of a single time series.
4.2 Patterns of landscape pattern changes
The changes in land use are easily driven by multiple factors. Land use changes in Lushui City are closely related to local policies. The main land use type in Lushui City is forestland. During the study period, land use transitions primarily occurred among forestland, cultivated land, and grassland. From 1986 to 2010, the area of cultivated land increased. This was because during this period, Lushui City’s economy was predominantly agricultural, directly promoting the expansion of agricultural land in the region. From 2010 to 2016, there was an increase in forestland area while cultivated land area decreased. During this period, Lushui City responded to the national policy of Grain for Green Program by initiating reforestation projects (Li et al., 2021). From 2016 to 2022, Lushui City actively responded to the national call for poverty alleviation and, as one of the deeply impoverished areas, implemented large-scale territorial spatial transformation actions. In this series of measures, the advancement of projects such as relocation and road construction directly led to a sharp increase in construction land area (Li, 2022). While accelerating urbanization, Lushui City also closely followed the national guidelines for protecting cultivated land, making the protection and construction of high-standard farmland a major task (Yang et al., 2023). Consequently, cultivated land area was restored during this period.
The changes in land use types are the main reasons for the transformation of landscape patterns, and quantitatively studying the evolution of landscape patterns is a necessary process to understand the consequences of land use changes (Nie et al., 2022; Ma et al., 2023). Among the selected indicators, PAFRAC, ED, and SHDI show consistent trends: they decreased from 1986 to 1996, increased from 1996 to 2004, and then continued to decrease. In contrast, COHESION and LPI changed oppositely. It can be inferred that Lushui City experienced two significant turning points in landscape pattern changes, namely in 1996 and 2010. In 1996, COHESION and LPI reached their highest values, indicating good connectivity and clustering of species in the landscape, suggesting minimal human interference in Lushui City’s landscape before this time (Yang et al., 2022b). From 1996 to 2010, PAFRAC, ED, and SHDI increased, indicating increased complexity in landscape patch shapes, fragmentation, and heterogeneity, often associated with human activities such as land development and urbanization processes. The unreasonable expansion of urbanization led to continuous natural patches becoming discontinuous patches (Luo et al., 2022), resulting in landscape degradation and increased overall fragmentation after 1996. After 2010, urban development in Lushui City entered a planning phase. While advancing urbanization, the city also emphasized ecological civilization construction, and vegetation restoration not only changed the composition and spatial structure of the landscape types but also improved regional ecosystem functions (Huang et al., 2022).
Urbanization drives modernization and economic growth, propelling regional economic and social advancement. Yet, it also triggers swift alterations in landscape dynamics (Hong et al., 2021).
4.3 Uncertainty
This study offers insights into the long-term landscape analysis scale in Lushui City. However, due to data limitations and real-world constraints, uncertainties persist. Initially, Landsat satellite images with a 30-meter resolution were utilized, and land classification was performed through visual interpretation, posing challenges in ensuring classification accuracy. Nonetheless, the accuracy of land use classification significantly influences the sensitivity of landscape indices (Liu et al., 2021). Lower spatial resolution images may compress or merge individual features, thereby affecting the calculation of landscape pattern indices. For instance, in sparsely populated urban areas, a 30-meter resolution may lead to four times as many buildings compared to a 15-meter resolution (Bhatta et al., 2010). Therefore, future studies could employ higher resolution images, such as 10m or 5m, coupled with field detection points to enhance land classification accuracy. However, it’s crucial to acknowledge that while high spatial resolution images enhance interpretability, they may generate numerous patches, posing challenges during classification algorithm application. Moreover, heightened heterogeneity in high-resolution images significantly impacts spatial correlation and heterogeneity analysis.
In terms of indicator selection, although the landscape pattern indices used in this study provide information about landscape organization, form, connectivity, and diversity, which can describe and quantify the spatial structure and pattern characteristics of landscapes for analyzing the scale response of landscape features, they have overlooked the interaction relationships between landscape patches. These relationships, known as topological indices (Zhang et al., 2023), have been proven to have significant impacts on landscape connectivity and ecological service functions. Future research incorporating topological indices will help in understanding the variations in landscape ecological processes at different scales.
This study focuses on Lushui City as a representative area of alpine gorge watershed, deeply analyzing how land use changes trigger significant changes in landscape patterns across temporal and spatial dimensions. However, it is worth noting that although the research has touched upon the surface changes in landscape patterns, it has not yet conducted a thorough and systematic quantitative analysis of the core factors driving these changes. Existing research has clearly indicated that hydrological processes, climatic conditions, and extensive human activities all act as key drivers that can profoundly impact landscape patterns (Yang et al., 2022a; Kisvarga et al., 2023; Xiong et al., 2023). These drivers, each independently and interwoven with others, collectively shape the evolutionary trajectory of regional landscapes.
In light of this, future research should strive to fill these gaps by constructing scientifically sound quantitative models and indicator systems to conduct in-depth analyses of the driving factors behind landscape patterns. This effort will not only help us better understand the internal logic and external manifestations of landscape evolution in high mountain gorge areas but also provide robust scientific foundations and data support for regional ecological conservation, land use planning, and sustainable development strategies.
5 Conclusion
This study, conducted using remote sensing images spanning from 1986 to 2022, employed the first scale domain and an information loss model to determine the optimal granularity for long-term landscape analysis. It also examined the spatiotemporal changes of landscape pattern indices. The key findings are summarized as follows:
1. The primary land type in Lushui City is forest. During the agricultural dominance period (1986-2010), cultivated land increased. Following the implementation of the policy to Grain for Green Program (2010-2016), forest expanded while cultivated land decreased. During the high-speed urbanization phase from 2016 to 2022, the area of construction land sharply increased. However, concurrently, policies to protect cultivated land contributed to a partial recovery in cultivated land area. The land changes in Lushui City have been significantly influenced by policies.
2. Due to the increased grain size leading to patch fusion and weakened boundary effects, four indicators (PD, ED, TE, and LSI) show a predictable “L” shaped decreasing trend with grain size variation, largely unaffected by time. The homogenization and singularization of landscapes caused by larger grain sizes result in two indicators (COHESION, AI) exhibiting a stair-like declining trend, while PAFRAC shows a stair-like upward trend, with lower predictability and slight differences across different temporal scales. Three indicators (LPI, SHDI, PLAND) show no discernible pattern with grain size changes. Therefore, when conducting landscape pattern analysis, priority may be given to selecting indicators that demonstrate predictability.
3. The suitable granularity of the index selected in this study is between 30-200m., with variations observed across different years. In 2022, landscape indices showed a more pronounced response to scale changes. At the class level, water bodies in Lushui City are the most sensitive to scale effects. Combining with an information loss model, conducting long-term landscape analysis of Lushui City at a 100-meter scale is most suitable, as it reduces data volume while maintaining a relatively low amount of information loss. Landscape indices exhibit significant scale effects. Choosing appropriate scales and landscape indices facilitates further analysis of landscape patterns.
4. This study, based on landscape pattern indices such as PAFRAC, ED, SHDI, COHESION, and LPI, reveals two critical turning points in the landscape pattern changes in Lushui City: 1996 and 2010. Before 1996, landscape connectivity and clustering were relatively high. From 1996 to 2010, with increasing human activities, landscape fragmentation intensified, and heterogeneity increased. However, since 2010, urban development has entered a planning phase, focusing on ecological civilization construction, which has improved ecosystem functions. The damage to Lushui City’s landscape due to urban construction and land changes has been somewhat restored after reasonable planning and ecological conservation efforts.
In essence, this study sheds light on effective land management and ecological conservation strategies in Lushui City through a thorough examination of landscape pattern indices and scale effects over an extensive time frame. It furnishes a logical foundation for harmonizing ecological preservation with sustainable development.
Data availability statement
Publicly available datasets were analyzed in this study. The data sources and access links are indicated in the text. Requests to access these datasets should be directed to MjAyMzAwMjVAeW51LmVkdS5jbg==.
Author contributions
YW: Conceptualization, Writing – original draft. XY: Formal analysis, Writing – review & editing. QF: Data curation, Writing – review & editing. LW: Visualization, Writing – review & editing. DC: Writing – review & editing. ZY: Methodology, Writing – review & editing.
Funding
The author(s) declare financial support was received for the research, authorship, and/or publication of this article. This research was funded by Ministry of Education’s Humanities and Social Sciences Research Fund for Youth Fund, China (20YJC760003).
Conflict of interest
The authors declare that the research was conducted in the absence of any commercial or financial relationships that could be construed as a potential conflict of interest.
Publisher’s note
All claims expressed in this article are solely those of the authors and do not necessarily represent those of their affiliated organizations, or those of the publisher, the editors and the reviewers. Any product that may be evaluated in this article, or claim that may be made by its manufacturer, is not guaranteed or endorsed by the publisher.
References
Bao H., Ding Y., Li Y. (2015). Study on ecological restoration mode in alpine valley area —a case study of lushui county of nujiang city. For. Resour. Manage. 0, 103. doi: 10.13466/j.cnki.lyzygl.2015.05.018
Bhatta B., Saraswati S., Bandyopadhyay D. (2010). Urban sprawl measurement from remote sensing data. Appl. Geogr. 30, 731–740. doi: 10.1016/j.apgeog.2010.02.002
Chen X., Shi X. (2018). Geoscience landscape division and tourism zonation in the mid-southern section of the Hengduan Mountains, eastern Qinghai-Tibet Plateau. J. Mt. Sci. 15, 894–917. doi: 10.1007/s11629-017-4529-2
Dadashpoor H., Azizi P., Moghadasi M. (2019). Land use change, urbanization, and change in landscape pattern in a metropolitan area. Sci. Total Environ. 655, 707–719. doi: 10.1016/j.scitotenv.2018.11.267
Fang S., Zhao Y., Han L., Ma C. (2017). Analysis of landscape patterns of arid valleys in China, based on grain size effect. Sustainability 9, 2263. doi: 10.3390/su9122263
Fu B., Chen L., Ma K., Wang Y. (2001). Theory and application of landscape ecology (Beijing, China: Science Press).
Guan D., Jiang Y., Cheng L. (2022). How can the landscape ecological security pattern be quantitatively optimized and effectively evaluated? An integrated analysis with the granularity inverse method and landscape indicators. Environ. Sci. pollut. Res. 29, 41590–41616. doi: 10.1007/s11356-021-16759-1
Gustafson E. J. (1998). Quantifying landscape spatial pattern: what is the state of the art? Ecosystems 1, 143–156. doi: 10.1007/s100219900011
Hong T., Yu N., Mao Z., Zhang S. (2021). Government-driven urbanisation and its impact on regional economic growth in China. Cities 117, 103299. doi: 10.1016/j.cities.2021.103299
Hu C., Wu W., Zhou X., Wang Z. (2023). Spatiotemporal changes in landscape patterns in karst mountainous regions based on the optimal landscape scale: A case study of guiyang city in guizhou province, China. Ecol. Indic. 150, 110211. doi: 10.1016/j.ecolind.2023.110211
Huang J., Xu H., Duan X., Li X., Wang P. (2020). Activity patterns and controlling factors of debris flows in the Upper Salween Alpine Valley. Nat. Hazards 103, 1367–1383. doi: 10.1007/s11069-020-04039-z
Huang K., Peng L., Wang X., Chen T. (2022). Integrating landscape connectivity and natural-anthropogenic interaction to understand karst vegetation restoration: A case study of guizhou province, China. Front. Ecol. Evol. 10. doi: 10.3389/fevo.2022.844437
Huang X., Ye Y., Zhang Z., Ye J., Gao J., Bogonovich M., et al. (2021). A township-level assessment of forest fragmentation using morphological spatial pattern analysis in Qujing, Yunnan Province, China. J. Mt. Sci. 18, 3125–3137. doi: 10.1007/s11629-021-6752-0
Kisvarga S., Horotán K., Wani M. A., Orlóci L. (2023). Plant responses to global climate change and urbanization: Implications for sustainable urban landscapes. Horticulturae 9, 1051. doi: 10.3390/horticulturae9091051
Li C., Zhao J., Hou W. (2023). Nonlinear effects of landscape patterns on ecosystem services at multiple scales based on gradient boosting decision tree models. Remote Sens. 15, 1919. doi: 10.3390/rs15071919
Li K., Feng M., Biswas A., Su H., Niu Y., Cao J. (2020). Driving factors and future prediction of land use and cover change based on satellite remote sensing data by the LCM model: a case study from gansu province, China. Sensors-basel. 20, 2757. doi: 10.3390/s20102757
Li Q., Jin T., Peng Q., Lin J., Zhang D., Huang J., et al. (2022). Identifying the extent of the spatial expression of landscape fragmentation based on scale effect analysis in southwest China. Ecol. Indic. 141, 109120. doi: 10.1016/j.ecolind.2022.109120
Li Y. (2022). Research on Spatio-temporal Evolution and Optimization of Territorial Space in Lushui Based on “Three types of space.” (Kunming, China: Yunnan University).
Li Y., Wang D., Yuan J., Liu X. (2021). Remote sensing evaluation of ecological environment quality in lushui city under the influence of the conversion of cropland to forest project. Res. Soil Water Conserv. 28, 266–274. doi: 10.13869/j.cnki.rswc.2021.04.030
Li Y., Xie Y., Liu X., Duan Y., Zhu J. (2019). Ecological security evaluation of Lushui County based on GIS. Yangtze River 50, 56–62. doi: 10.16232/j.cnki.1001-4179.2019.06.012
Liang J., Liu Y., Ying L., Li P., Xu Y., Shen Z. (2014). Road impacts on spatial patterns of land use and landscape fragmentation in three parallel rivers region, Yunnan Province, China. Chin. Geogr. Sci. 24, 15–27. doi: 10.1007/s11769-014-0652-y
Liu H., Huang B., Zhan Q., Gao S., Li R., Fan Z. (2021). The influence of urban form on surface urban heat island and its planning implications: evidence from 1288 urban clusters in China. Sustain. Cities Soc 71, 102987. doi: 10.1016/j.scs.2021.102987
Luo Y., Wang Z., Zhou X., Hu C., Li J. (2022). Spatial-temporal driving factors of urban landscape changes in the karst mountainous regions of southwest China: a case study in central urban area of guiyang city. Sustainability 14, 8274. doi: 10.3390/su14148274
Ma J., Khromykh V., Wang J., Zhang J., Li W., Zhong X. (2023). A landscape-based ecological hazard evaluation and characterization of influencing factors in Laos. Front. Ecol. Evol. 11. doi: 10.3389/fevo.2023.1276239
Ma L., Bo J., Li X., Fang F., Cheng W. (2019). Identifying key landscape pattern indices influencing the ecological security of inland river basin: the middle and lower reaches of shule river basin as an example. Sci. Total Environ. 674, 424–438. doi: 10.1016/j.scitotenv.2019.04.107
Nagendra H., Munroe D. K., Southworth J. (2004). From pattern to process: Landscape fragmentation and the analysis of land use/land cover change. Agriculture Ecosyst. Environ. 101, 111–115. doi: 10.1016/j.agee.2003.09.003
Nie W., Yang F., Xu B., Bao Z., Shi Y., Liu B., et al. (2022). Spatiotemporal evolution of landscape patterns and their driving forces under optimal granularity and the extent at the county and the environmental functional regional scales. Front. Ecol. Evol. 10. doi: 10.3389/fevo.2022.954232
Pan Y., Lu X., Yu D., Huang J., Sun X., Xu Z. (2019). Quantitative relationships between soil landscape index and classification grain. J. Soils Sediments 19, 903–916. doi: 10.1007/s11368-018-2093-1
Qiao X., Liu L., Yang Y., Gu Y., Zheng J. (2022). Urban expansion assessment based on optimal granularity in the huaihe river basin of China. Sustainability 14, 13382. doi: 10.3390/su142013382
Ren M., Wang Z., Wang Z., Zeng Y., He L. (2018). Grain size effect of karst mountainous urban landscape pattern indices in the central guizhou: a case study of anshun city. Chin. J. Ecol. 37, 3137. doi: 10.13292/j.1000-4890.201810.038
Su C., Fu B. (2012). Discussion on links among landscape pattern,ecological process, and ecosystem services. Chin. J. Nat. 34, 277–283. doi: 10.3969/j.issn.0253-9608.2012.05.005
Teng M., Zeng L., Zhou Z., Wang P., Xiao W., Dian Y. (2016). Responses of landscape metrics to altering grain size in the three gorges reservoir landscape in China. Environ. Earth Sci. 75, 1–13. doi: 10.1007/s12665-016-5605-6
Tian P., Cao L., Li J., Pu R., Shi X., Wang L., et al. (2019). Landscape grain effect in yancheng coastal wetland and its response to landscape changes. IJERPH 16, 2225. doi: 10.3390/ijerph16122225
Valjarević A. (2024). GIS-based methods for identifying river networks types and changing river basins. Water Resour Manage. doi: 10.1007/s11269-024-03916-7
Van der Sluis T., Pedroli B., Frederiksen P., Kristensen S. B., Busck A. G., Pavlis V., et al. (2019). The impact of european landscape transitions on the provision of landscape services: an explorative study using six cases of rural land change. Landscape Ecol. 34, 307–323. doi: 10.1007/s10980-018-0765-2
Wagner H. H., Fortin M.-J. (2005). Spatial analysis of landscapes: concepts and statistics. Ecology 86, 1975–1987. doi: 10.1890/04-0914
Wang H., Li C. (2021). Analysis of scale effect and change characteristics of ecological landscape pattern in urban waters. Arabian J. Geosci. 14, 569. doi: 10.1007/s12517-021-06831-y
Wang J., Li L., Zhang T., Chen L., Wen M., Liu W., et al. (2021). Optimal grain size based landscape pattern analysis for Shanghai using landsat images from 1998 to 2017. Pol. J. Environ. Stud. 30, 2799–2813. doi: 10.15244/pjoes/129702
Wang X., Yang S., Yang R., Yang Z. (2023). Analysis of the spatiotemporal evolution and factors influencing ecological land in northwest yunnan from the perspective of leading the construction of a national ecological civilization. Diversity 15, 1074. doi: 10.3390/d15101074
Wu J., Jelinski D. E., Luck M., Tueller P. T. (2000). Multiscale analysis of landscape heterogeneity: Scale variance and pattern metrics. Ann. Gis 6, 6–19. doi: 10.1080/10824000009480529
Wu W., Xu L., Zhang M., Ou M., Fu H. (2016). Impact of landscape metrics on grain size effect in different types of patches: a case study of wuxi city. Acta Ecol. Sin. 36, 2740–2749. doi: 10.5846/stxb201405171015
Xiao D., Li X. (2003). Forefronts and future strategies of landscape ecology. Acta Ecologica Sin. 23, 1615–1621. doi: 10.3321/j.issn:1000-0933.2003.08.020
Xiong Y., Mo S., Wu H., Qu X., Liu Y., Zhou L. (2023). Influence of human activities and climate change on wetland landscape pattern—a review. Sci. Total Environ. 879, 163112. doi: 10.1016/j.scitotenv.2023.163112
Yang C., Deng W., Yuan Q., Zhang S. (2022a). Changes in landscape pattern and an ecological risk assessment of the changshagongma wetland nature reserve. Front. Ecol. Evol. 10. doi: 10.3389/fevo.2022.843714
Yang D., Lou Y., Zhang P., Jiang L. (2022b). Spillover effects of built-up land expansion under ecological security constraint at multiple spatial scales. Front. Ecol. Evol. 10. doi: 10.3389/fevo.2022.907691
Yang X., Huang X., Zong S., Tang L., Yin X., Luo Y. (2023). Reflection on risk prevention of agricultural industry in lushui city under the background of rural revitalization. Trop. Agric. Sci. Technol. 46, 74–78. doi: 10.16005/j.cnki.tast.2023.04.014
Zhai J., Hou P., Zhao Z., Xiao R., Yan C., Nie X. (2018). An analysis of landscape pattern spatial grain size effects in qinghai lake watershed. Remote Sens. Nat. Resour. 30, 159–166. doi: 10.6046/gtzyyg.2018.03.22
Zhang H., Lin S., Yu Q., Gao G., Xu C., Huang H. (2023). A novel forest EcoSpatial network for carbon stocking using complex network theory in the yellow river basin. Remote Sens. 15, 2612. doi: 10.3390/rs15102612
Zhang L., Shi Y., Liu Y. (2013). Effects of spatial grain change on the landscape pattern indices in yimeng mountain area of shandong province, east China. Chin. J. Ecol. 32, 459. doi: 10.13292/j.1000-4890.2013.0152
Zhang Q., Chen C., Wang J., Yang D., Zhang Y., Wang Z., et al. (2020). The spatial granularity effect, changing landscape patterns, and suitable landscape metrics in the three gorges reservoir area 1995–2015. Ecol. Indic. 114, 106259. doi: 10.1016/j.ecolind.2020.106259
Zhang S., Fan W., Li Y., Yi Y. (2017). The influence of changes in land use and landscape patterns on soil erosion in a watershed. Sci. Total Environ. 574, 34–45. doi: 10.1016/j.scitotenv.2016.09.024
Zhao W., Fu B., Chen L. (2003). The effects of grain change on landscape indices. Quaternary Sci. 23, 326–333. doi: 10.3321/j.issn:1001-7410.2003.03.011
Appendix A
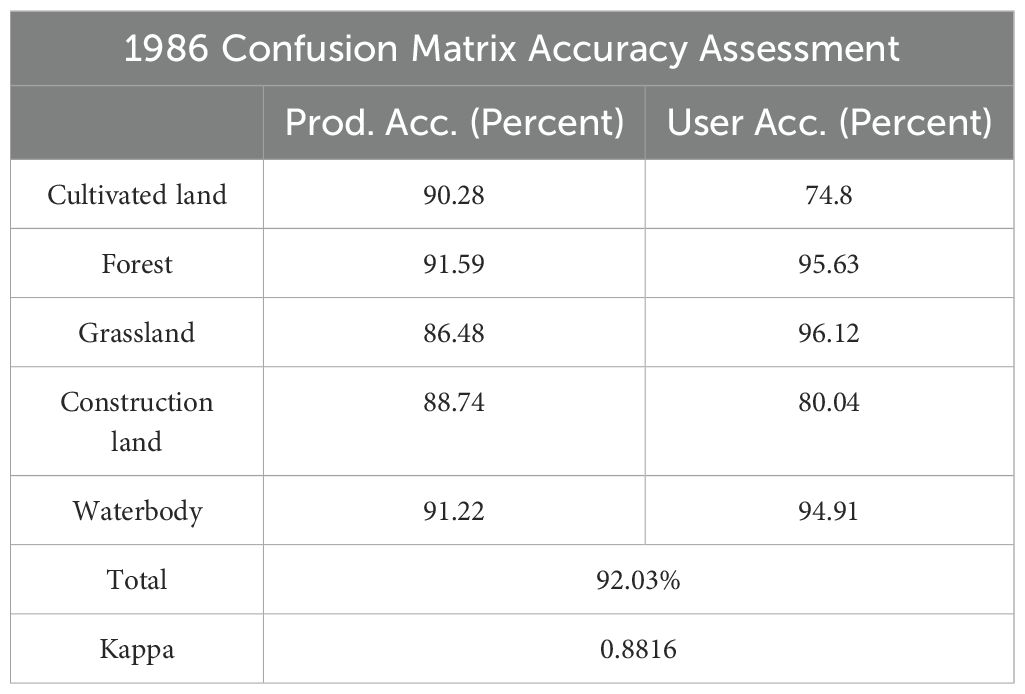
Table A.1. Evaluation of computer interpretation accuracy (1986).

Table A.2. Evaluation of computer interpretation accuracy (1996).
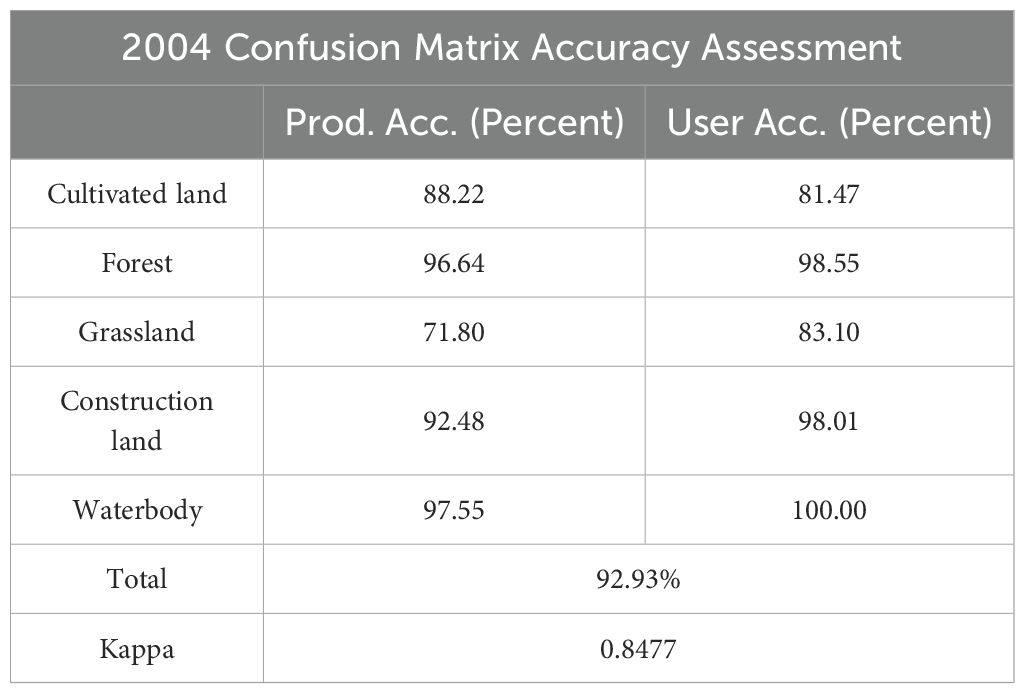
Table A.3. Evaluation of computer interpretation accuracy (2004).

Table A.4. Evaluation of computer interpretation accuracy (2010).

Table A.5. Evaluation of computer interpretation accuracy (2016).
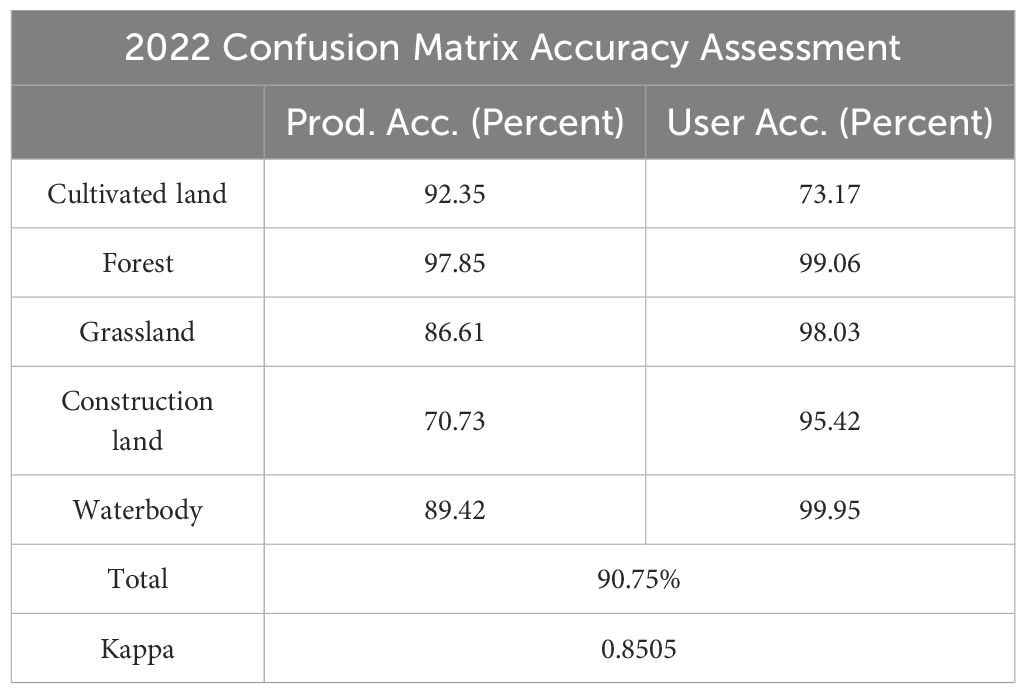
Table A.6. Evaluation of computer interpretation accuracy (2022).
Appendix B
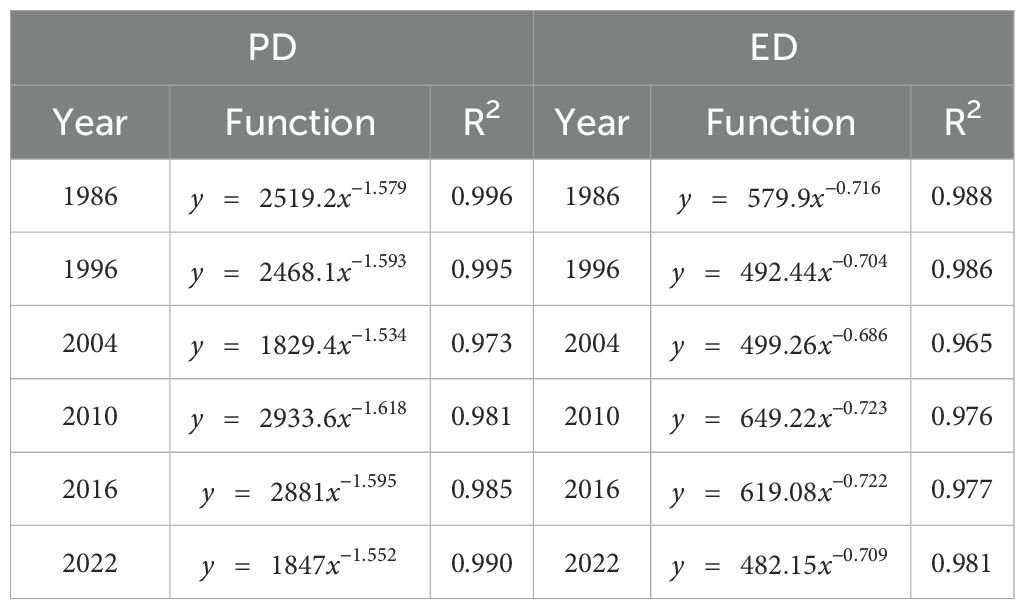
Table A.7. Landscape pattern indices granularity fitting function.
Keywords: spatial granularity, Lushui City, land use, landscape pattern, spatiotemporal changes
Citation: Wang Y, Yan X, Fang Q, Wang L, Chen D and Yu Z (2024) Spatiotemporal variation of alpine gorge watershed landscape patterns via multi-scale metrics and optimal granularity analysis: a case study of Lushui City in Yunnan Province, China. Front. Ecol. Evol. 12:1448426. doi: 10.3389/fevo.2024.1448426
Received: 13 June 2024; Accepted: 19 August 2024;
Published: 06 September 2024.
Edited by:
Luciana Mastrolonardo, University of Studies G. d’Annunzio Chieti and Pescara, ItalyReviewed by:
Aleksandar Valjarević, University of Belgrade, SerbiaHanxi Wang, Harbin Normal University, China
Copyright © 2024 Wang, Yan, Fang, Wang, Chen and Yu. This is an open-access article distributed under the terms of the Creative Commons Attribution License (CC BY). The use, distribution or reproduction in other forums is permitted, provided the original author(s) and the copyright owner(s) are credited and that the original publication in this journal is cited, in accordance with accepted academic practice. No use, distribution or reproduction is permitted which does not comply with these terms.
*Correspondence: Zhexiu Yu, eXpoZXhpdUBiamZ1LmVkdS5jbg==