 Jixing Huang
 Shuqi Yang1
 An Zhang
- 1College of Digital Economy, Fujian Agriculture and Forestry University, Fuzhou, China
- 2Faculty of Artificial Intelligence, Guilin University of Electronic Technology, Guilin, China
- 3College of Economics and Management, Fujian Agriculture and Forestry University, Fuzhou, China
- 4State Key Laboratory of Resources and Environmental Information System, Institute of Geographical Sciences and Natural Resources Research, Chinese Academy of Sciences, Beijing, China
Identifying ecosystem service functions, clarifying the spatiotemporal trade-offs and synergies of terrestrial ecosystem services and their driving mechanisms, and exploring differentiated ecological functional zoning are crucial steps in achieving healthy regional ecosystem management, and are conducive to developing diversified ecological restoration strategies, establishing a robust cross-regional collaborative management mechanism, implementing differentiated ecological management strategies, and contributing to the construction of a Beautiful China. This paper, based on the InVEST model, Pearson correlation, GeoDetector, and Spatiotemporal Geographically Weighted Regression models, constructs a spatial quantification model of the trade-offs and synergies among five key ecosystem service functions—habitat quality, soil retention, water conservation, food supply, and carbon sequestration—of China’s terrestrial ecosystems from 2000 to 2020. It explores the influencing factors of terrestrial ecosystem services in China and their spatiotemporal heterogeneity, thereby investigating the future strategies for ecological functional zoning and management of China’s national land space. The results indicate that: (1) during 2000–2020, China’s food supply and soil conservation have increased. However, the habitat quality, water conservation, and carbon sequestration have decreased. (2) Significant spatial and temporal heterogeneities exist in the key ecosystem services of China’s terrestrial ecosystems. (3) Natural, economic, and social factors all impact China’s terrestrial key ecosystem services. Among them, slope, annual average precipitation, land development intensity, and vegetation coverage are the main influencing factors, and different factors exhibit significant spatial heterogeneity. (4) Significant trade-offs/synergy effects among critical terrestrial ecosystem services exist in China. (5) China’s national territory is divided into four ecological protection functional zones: ecological restoration areas, ecological control areas, resilient development areas, and ecological conservation areas, and explores differentiated zoning optimization control paths.
1 Introduction
Terrestrial ecosystems refer to the unity formed by the interaction between biological communities and the natural environment, in contrast, ecosystem services functions (ESS) are the various provisioning, regulating, supporting, and cultural benefits that humans can obtain from ecosystems, which can directly or indirectly promote the natural conditions and utilities that sustain human development (Smith et al., 2013; Le Provost et al., 2023). Meanwhile, various ESS exist in a trade-off/synergistic relationship (Keith et al., 2017). Therefore, clarifying the spatial and temporal patterns of ESS is crucial for protecting sustainable urban development in China.
In recent decades, 60% of the global ESS are continuously degrading (Eger et al., 2023). According to a report from the State Council, China has achieved a rapid urbanization process in the past 20 years, with an urbanization rate reaching 64.7%. However, it has also brought a series of ecological issues. As of 2022, the extent of soil erosion in China covered an area of 2.65 million km2, which corresponding to approximately 27.96% of the land area. The degraded area accounts for 38.7% of the national territory. China’s ecological environment is gradually deteriorating. Exploring the causes of ecological issues has become a top priority. It plays a vital role in protecting ecosystems according to effectively assessing the trade-offs/synergies of the regional ecosystem services, which can promote more scientific and standardized management of ecosystem services in China.
In recent decades, the research on ESS has achieved fruitful results. In 1997, Costanza proposed the corresponding concept of ESS as the processes and conditions maintaining human survival and production (Chung et al., 2021). Afterwards, ESS rapidly became a hot research topic for scholars domestically and internationally. In existing research, in terms of research methods, Li et al. (2024) and Tsai and Lee (2023) used the single-factor method (Costanza et al., 2014; Zhang et al., 2010; Xie et al., 2015) to calculate the value of ecosystem services in ecological functional areas and agricultural ecosystems, as well as the trade-offs, synergies, and driving factors between different functions. However, the parameter standards and methods for ecosystem service values are difficult to unify in different ecosystems. This method lacks consideration of the threats posed by natural erosion and human activities to various ecosystem services and cannot accurately reflect the spatial and temporal heterogeneity of different ESS. Therefore, the quantitative measurement of various ESS derived from the InVEST model considers the impact of natural erosion and human activities, enhancing the accuracy and rationality of ESS assessment and better reflecting the spatial heterogeneity characteristics of ESS. The mutual effects and driving mechanisms of various ESS at different spatial scales are the focus of current research by scholars domestically and internationally. Many studies take national (Turner et al., 2014; Ran et al., 2023; Sun et al., 2024), regional (Xu et al., 2023; Zhou et al., 2024), and local (Sun et al., 2023; Pan et al., 2024) areas as research regions, exploring the spatial and temporal evolution characteristics and trade-offs and synergies of ecosystem services functions at multiple scales (Sharp et al., 2015; Feng et al., 2023; Zhang et al., 2023). Some scholars have also attempted to explore the influencing factors of regional ESS based on models such as correlation analysis (Chen et al., 2020), regression analysis (Xue et al., 2024), geographical detector (He et al., 2024), and geographically weighted regression (Xuemao et al., 2024). For instance, Zhang et al. (2023) quantified the amount of sand fixation and other ESS in Xinjiang Province using the wind erosion correction equation and analyzed the spatial distribution of the impact degree of its driving factors through the geographically weighted regression model(GWR). However, the geographical detector model mainly reveals the primary influencing factors of different geographical phenomena and cannot explore the spatial differentiation characteristics of different influencing factors. The geographically weighted regression model only considers the spatial heterogeneity of the current situation and cannot scientifically describe the magnitude of the driving forces of the driving factors, while the spatial and temporal geographically weighted regression model (GTWR) further considers the impact in the time dimension based on the geographically weighted regression model. Therefore, combining the geographical detector with the spatial and temporal geographically weighted regression model can reveal the main influencing factors in a region and further explore the spatial heterogeneity characteristics of different major influencing factors. This approach can more scientifically reflect influencing factors’ strength and dynamic stability distribution (Huang et al., 2022; Qiu et al., 2023). Meanwhile, previous studies have mainly focused on the spatial and temporal evolution characteristics, trade-offs and synergies, and driving mechanisms of ESS in the study area, whereas research on ecological functional zoning and control pathways derived from ESS characteristics is relatively lacking.
In summary, scholars from different backgrounds have conducted in-depth research on the spatial and temporal characteristics of ecosystem services, but they have mainly focused on the value of ecosystem services at small spatial scales and explored their driving mechanisms through a single approach. However, research on the comprehensive measurement of the spatial heterogeneity of key driving factors of ESS at large spatial scales and the fine-scale ecological functional zoning and optimization pathways is relatively limited. In view of this, this study constructed spatial quantitative models for five key ESS functions in China from 2000 to 2020, including habitat quality, soil conservation, water retention, food provision, and carbon sequestration, based on the InVEST model, spatial and temporal geographically weighted regression model, geographical detector, and trade-off synergy model. It quantitatively measured the spatial and temporal characteristics, trade-offs/synergies, and driving mechanisms of key ESS in China and measured the spatial and temporal evolution characteristics and trade-off synergy relationships of ESS in China’s terrestrial ecosystems from 2000 to 2020 using a combination of InVEST and Pearson. It is expected that the study of the spatial and temporal evolution characteristics and internal mechanisms of ESS will facilitate ecological functional zoning research and provide differentiated land spatial management pathways. These can serve as benchmarks for evaluating regional ESS protection policies, providing a theoretical basis for the scientific management of China’s terrestrial ecosystems.
2 Materials and methods
2.1 Study area
This study selected China as the research area, with 31 provinces (excluding Macao, Taiwan, and Hong Kong), that have experienced rapid urbanization. China accounts for only 6.44% of the world’s land area and feeds 18.04% of the world’s total population (Figure 1). China has significant regional differences in socioeconomic, natural resources, and ecological environment. The topography is complex. The mountainous environment is widespread within the country, with hills and plateaus. China’s overall climate conditions are warm in the south and cold in the north, with a large temperature difference. Rainfall and heat occur in the same season, with rainfall decreasing from southeast to northwest. The diverse and complex climate and topography create different natural features and abundant animal and plant resources in various regions. Along with rapid urbanization, the stability of the country’s ecosystem has also been severely disturbed. This has led to serious ecological problems such as habitat degradation in coastal areas, aggravated soil erosion, increasing degradation of arable land fertility, and frequent natural disasters. Severe ecological forms seriously threaten the security and stability of China’s terrestrial ecosystems.
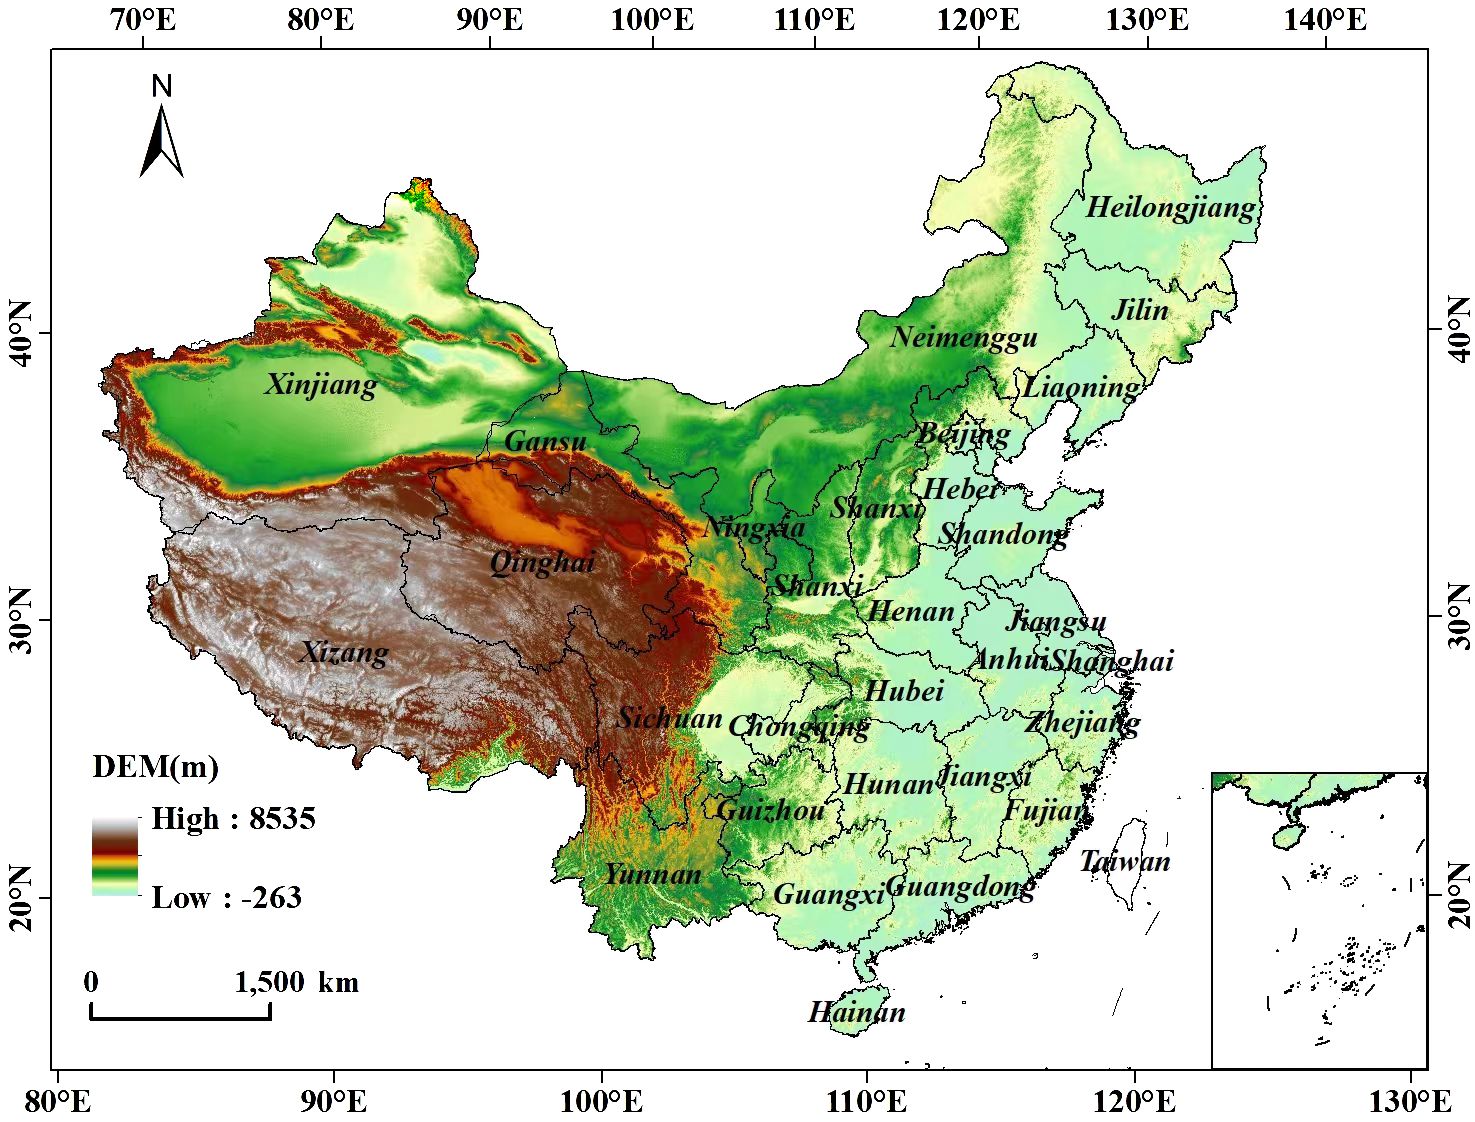
Figure 1. Location of the study area.
2.2 Data sources and processing
2.2.1 Data sources
2.2.2 Data processing
Based on the InVEST model, this study constructed assessment models for five key ESS of China’s terrestrial ecosystems for the years 2000, 2010, and 2020. It explored the spatial and temporal evolution of different ESS, trade-offs and synergies, spatial and temporal driving mechanisms, ecological functional zoning, and optimization management pathways. The data involved in the study mainly included land use, soil types, vegetation cover, topography, climate hydrology, socio-economic statistics, and other basic data (Table 1). The land use data was sourced from the CLCD dataset, which has high spatial and temporal consistency and is based on 5,463 visual interpretation samples, with an overall interpretation accuracy of 80%. Normalization was performed according to the requirements of the InVEST model for raster data such as precipitation, temperature, and vegetation cover. For statistical data such as grain yield and soil texture, after data entry and organization, spatial interpolation was used to fill in missing data for some counties, followed by rasterization. A GIS spatial database was constructed based on the ArcGIS software platform, with the projection coordinate system unified to Krasovsky_1940_Albers.

Table 1. Data sources and processing.
2.2.3 Model validation
The model’s accuracy validation is crucial for measuring of regional ESS and their influencing factors. Therefore, this study carries out model accuracy validation in two main parts. The first part involves ESS measured by the InVEST model, mainly through cross-validation with ESS results calculated by other relevant scholars in the same study area. By comparing the differences in ESS with those of other scholars, the accuracy and reliability of ESS measured by this method are validated. The second part concerns the measurement of influencing factors of ESS. This study mainly uses the geographical detector and geographically weighted regression model to measure the intensity of influencing factors of different ESS and their spatial and temporal differentiation characteristics. To verify the advantages of this model, this study compares and validates the advantages of the GTWR model by comparing it with three common influencing factor detection models: GTWR, GWR, and OLS. The validation of the models characterizes the superior effectiveness of the InVEST model and the spatial and temporal geographically weighted regression model in accurately revealing China’s terrestrial ecosystem services and their driving mechanisms.
2.3 Research methods
2.3.1 Assessment of ecosystem service function
The InVEST model will spatially quantify the five key ESS to characterize the spatial and temporal patterns of key ecosystem services in China. The models for different ecosystem services are constructed as follows:
2.3.1.1 Food supply
The regional food supply function is significantly linearly correlated with food production (Zhao et al., 2012). This study combines each county’s grain production, land distribution, and NDVI data to achieve the spatial quantification of China’s FP in 1km grids from 2000 to 2020.
In the equation, is the total grain production of the o-th grid, is the NDVI value of the o-th grid. is the sum of NDVI of cultivated land and is the total grain production.
2.3.1.2 Water yield
The Seasonal Water Yield module within the InVEST is used to calculate the WY. The setting and selection of model-related parameters, such as actual evapotranspiration, mainly refer to the InVEST user manual (Allen et al., 1998; Canadell et al., 1996; Zhou et al., 2005; Xie et al., 2017).
In the formula, represents the water yield of the i-th grid, which is used to characterize the potential WY of the grid unit. represents actual evapotranspiration of the i-th grid.
2.3.1.3 Sediment delivery ratio
The Sediment Delivery Ratio module within the InVEST is used to calculate both potential and actual soil erosion and then achieve the spatial quantitative calculation of soil and water conservation (Redhead et al., 2016).
In the equation, is the quantity of soil and water conservation (measured in metric tons) within a specific grid unit, is the potential soil erosion amount, is the actual soil erosion amount.
2.3.1.4 Carbon storage and sequestration
The Carbon Storage and Sequestration module within the InVEST was used to evaluate carbon sequestration across four distinct carbon pools (Xiao et al., 2017).
In the equation, is the total carbon storage of the ecosystem, is the belowground carbon storage, is thes dead organic matter carbon storage, is the aboveground carbon storage, is the soil carbon storage.
2.3.1.5 Habitat quality
The Habitat Quality module within the InVEST is used to evaluate the region’s habitat. The model comprehensively considers the influence of threat sources (Xu et al., 2022; Sun et al., 2018; Xie et al., 2018; Bhagabati et al., 2014).
In the equation, represents habitat quality; represents the habitat suitability index; is the square of the habitat threat index;
2.3.2 Trade-offs/synergy model
Where trade-off is used to characterize the trade-off situation between various ecosystem service functions, and synergy is used to characterize the mutually beneficial relationship between various ecosystem service functions (MEA, 2005; Rodríguez et al., 2006). Therefore, this study calculated the correlation coefficient between ecosystem services based on the Pearson correlation coefficient, with the P value used to test its significance (Terrado et al., 2016).
In the formula, Q represents the correlation coefficient, and x and y represents variables linked to two types of ecosystem services and i represents the i-th year. When |P|< p>0.05, the representation of correlation is not significant. When < |P|< , the representation of correlation is significant. When |P|≥ , the representation of correlation is extremely significant.
2.3.3 Geographic detector model
Geographic detectors assess the relationship between variables by analyzing how their spatial distributions align (Zhao et al., 2020; Zuo et al., 2022).
In the formula, q represents the extent of the driving factor’s influence, o represents the stratification of independent and dependent variables, N represents the total pixel count, represents the number of pixels within the o-th layer.
2.3.4 Spatial and temporal geographically weighted regression model
The GTWR model helps reduce errors and parameter estimation biases, achieving synchronous interpretation of geographical spatial and temporal differentiation mechanisms. Based on the results of geographic detection, this study uses the GTWR model to analyze the spatial heterogeneity of the selected main influencing factors on different ecosystem service functions.
In the equation, represents the dependent variable; is the intercept; , , and represent the longitude, latitude, and time of the x-th unit, respectively.
3 Analysis of results
3.1 Spatial and temporal patterns of ecosystem service functions
The spatial and temporal patterns and quantity changes of the different ecosystem services in China are shown in Figures 2, 3. Overall, these five ecosystem service functions have undergone significant temporal changes.
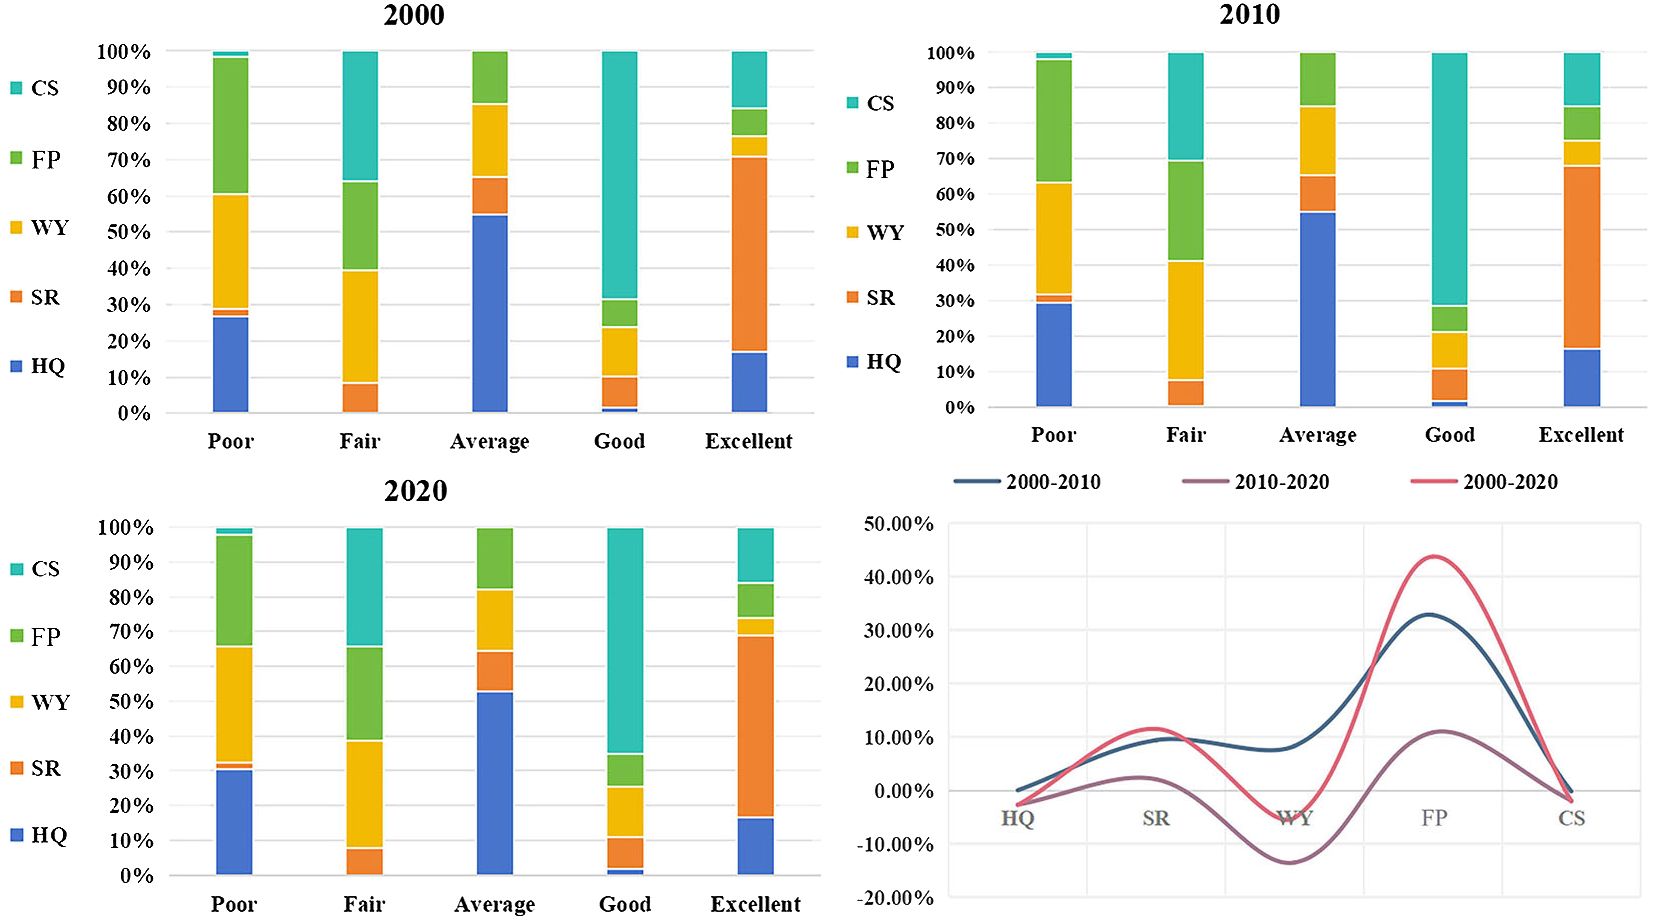
Figure 2. Proportion and change of terrestrial ecosystem service area in China from 2000 to 2020.
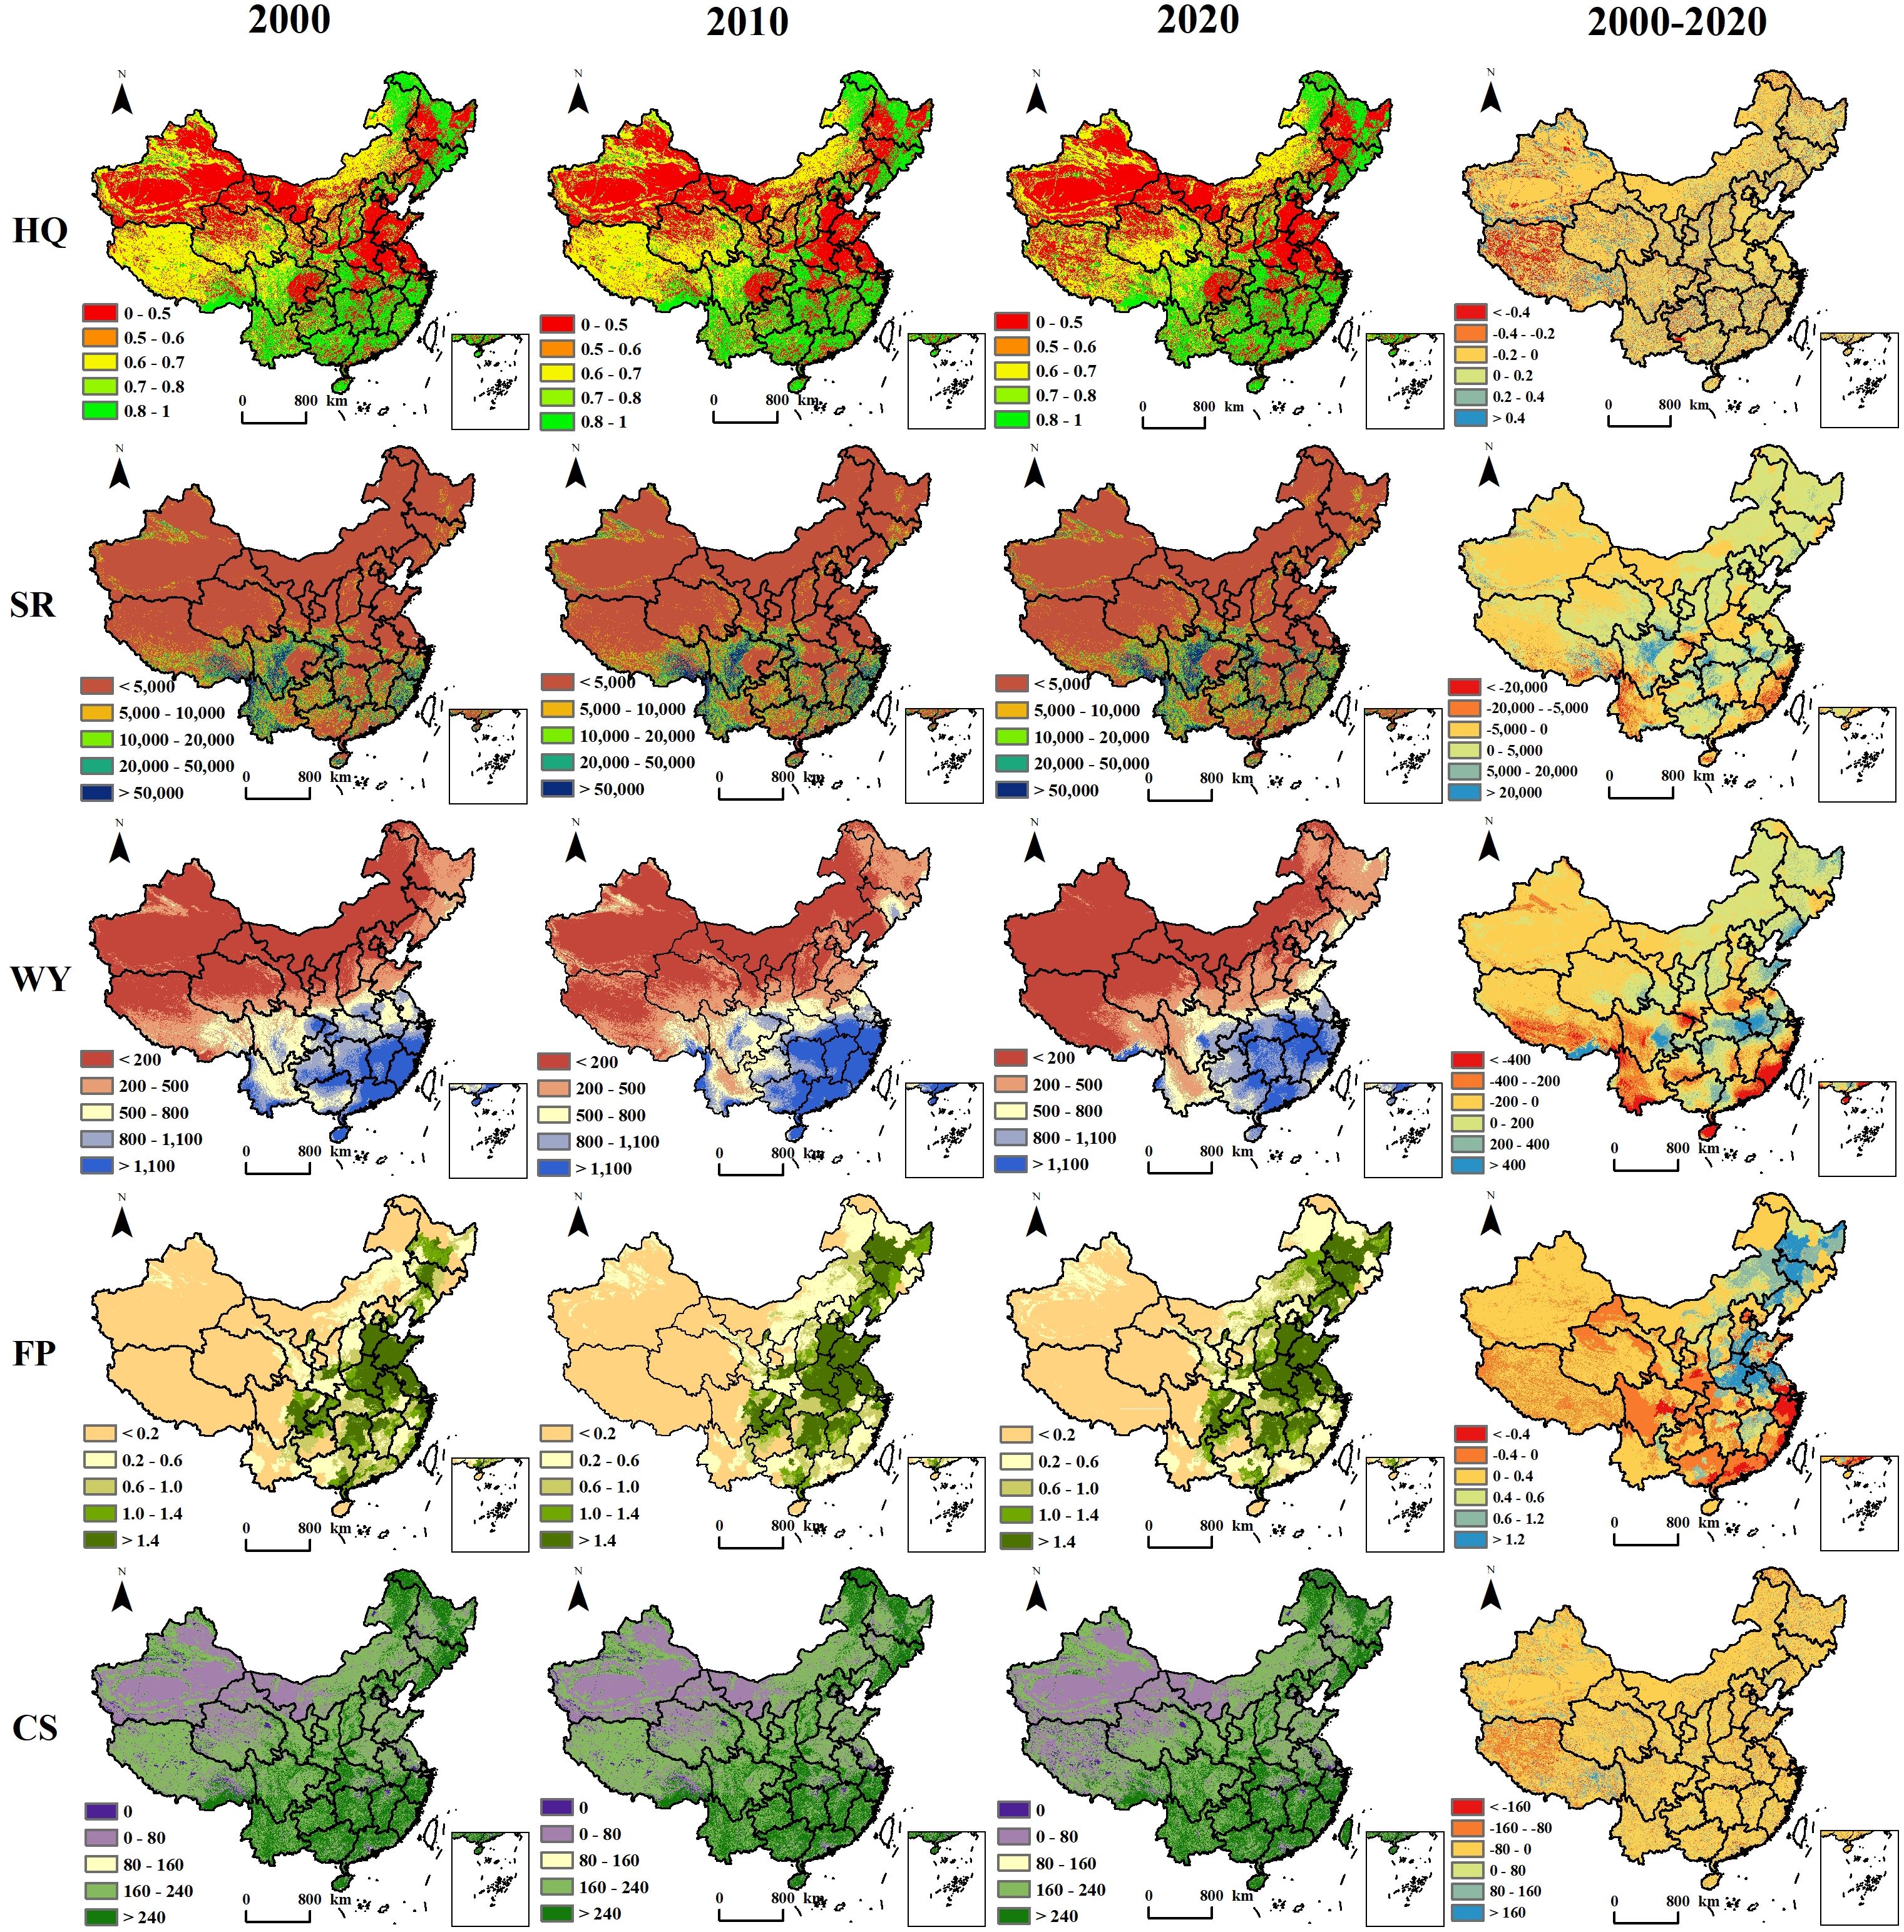
Figure 3. Spatial and temporal pattern of the ecosystem services in China from 2000 to 2020(t/hm−2).
Specifically, the overall HQ in China exhibited a declining trend from 2000 to 2020, with the mean decreasing from 0.578 to 0.563, representing a 2.68% overall decrease. High HQ areas are primarily concentrated in China’s southeastern coastal provinces such as Fujian, Zhejiang, Guangxi, Hainan, and Guangdong, as well as the eastern regions of Heilongjiang, Liaoning, and Jilin provinces; medium HQ is primarily concentrated in Qinghai, Inner Mongolia and the northeastern region of Tibet; low HQ areas are primarily concentrated in Sichuan, Jiangsu, Shandong, and Hebei. Combining China’s land use types and natural environmental data, China’s rapid urbanization has resulted in a steady expansion of both construction land and arable land, as well as an intensification of human activities, leading to a continuous decline in HQ. High-quality areas are mainly found in central and southeastern coastal regions, with a relatively large area of forest cover and ample rainfall, providing good habitat suitability and less threat to the habitat. Areas with medium to low HQ are primarily concentrated in the Sichuan Basin, Jianghan Plain, and the Songnen Plain. These areas have relatively less vegetation cover, mostly arable land, indicating a close relationship between HQ and vegetation coverage.
China’s overall SR showed an increasing trend, rising from 5862t/hm−2 to 6543t/hm−2 from 2000 to 2020, representing an overall increase of 11.53%. The SR showed a basic trend of increase in provinces such as Yunnan, Fujian, Zhejiang, and Hainan, while it exhibited a basic trend of decrease in provinces such as Sichuan, Hubei, and Hunan. The northern provinces of China, including Xinjiang, Qinghai, Inner Mongolia, Gansu, Shanxi, and Hebei, exhibit a significant concentration of areas with high SR, while low SR areas are mainly concentrated in the southeastern coastal area such as Yungui Plateau, Hengduan Mountains region, including provinces such as Tibet, Yunnan, Fujian, Zhejiang, and Sichuan. Research has revealed that SR is influenced by various factors, including elevation, precipitation, and topographical changes (Huang et al., 2010). The coastal areas have significantly higher rainfall than the northwest region, and some areas have significant topographical variations, coupled with a reduction in forest and grassland areas, further exacerbating erosion. In recent years, Cropland has been converted to forest and grassland, and afforestation projects, have expanded the vegetation coverage area, to some extent alleviating soil erosion in the southeastern coastal areas. Additionally, provinces with high SR have extensive grassland areas and relatively low rainfall, which to some extent reduces water and soil erosion, thus favoring SR. Therefore, these regions have a strong soil and water conservation capacity. On the other hand, provinces with lower SR have extensive unused land with significant topographical variations and steep slopes, coupled with higher rainfall, resulting in weaker SR capacity in these areas.
Between 2000 and 2020, China’s overall WY showed a fluctuating downward trend, with the average decreasing from 375mm/hm−2 to 355mm/hm−2, a decrease of 5.09%. The WY in Xinjiang, Inner Mongolia, Qinghai, Gansu, and other provinces showed an overall increasing trend, while in Fujian, Guangdong, Yunnan, Tibet and other provinces mainly showed a decreasing trend. The regional differences in China’s WY are obvious. High WY areas are mainly concentrated in the southeastern coastal provinces of Guangdong, Fujian, Zhejiang, and Yunnan, and the low WY areas are primarily concentrated in the northwest of China. In recent years, rapid urbanization has resulted in constant expansion of construction land. and the impervious layers brought about by the expansion of buildings have increased water conservation in these provinces. The northwest region has less precipitation, resulting in lower water conservation. Precipitation increased slightly in 2010 compared to 2000, with small fluctuations in temperature and a slight increase in water conservation. However, from 2000 to 2020, there was a significant increase in temperature, which raised the potential evaporation of plants, leading to a decrease in WY.
Between 2000 and 2020, China’s FP showed a significant increase with large fluctuations, increasing from 0.48t/hm−2 to 0.69t/hm−2, representing an overall increase of 43.75%. The areas where FP increased spatially are mainly located in provinces such as Jiangsu, Henan, Anhui, Shandong, and Jilin, while the areas where it decreased are mainly in provinces such as Guangdong, Sichuan, and Fujian. The valuable areas of FP are primarily concentrated in eastern China, such as Jiangsu, Shandong, Hebei, Henan, and Anhui provinces. These regions have gentle slopes, good accessibility, abundant water and soil resources, and favorable conditions for agricultural production, making them the main distribution areas of arable land. Low FP areas are mainly concentrated in the northwestern region of China, encompassing Xinjiang, Qinghai, Tibet, and Gansu provinces. These regions have high altitudes, varied terrain, and relatively low rainfall, which are not conducive to grain production.
During 2000–2020, China’s overall CS showed a slight downward trend, decreasing from 174t/hm−2 to 171t/hm−2, representing a 2.01% decrease. Spatially, the main areas of decline in CS are mainly concentrated in Tibet and Xinjiang, and other provinces are mostly evenly distributed. Recently, rapid development has led to a reduction in carbon sequestration capacity. High CS areas are primarily concentrated in eastern China, specifically Zhejiang, Guangdong, and Fujian provinces. Low CS areas are primarily concentrated in the northwest region, including Xinjiang, Qinghai, and Tibet, showing an east–high–west–low spatial and temporal distribution pattern. Due to the close relationship between CS and vegetation coverage as well as land use types (Wang et al., 2020; Ding et al., 2023). The eastern region of China has a vast forested area with dense vegetation, demonstrating robust carbon sequestration capabilities, while the western region has lower vegetation coverage, complex terrain, and a large area of desert and grassland, resulting in weaker carbon sequestration capacity and much lower carbon reserves compared to the eastern provinces.
3.2 Trade-offs/synergies of ecosystem services
Based on the spatial quantitative assessment of five critical terrestrial ecosystem services in China, the Pearson rank correlation coefficient model was used. The results revealed that, at a significance level of 0.01, China’s five critical terrestrial ecosystem services were significantly correlated. In this paper, a positive correlation coefficient and a larger value represent a stronger synergy between the functions of the different ecosystem services. Conversely, a negative correlation coefficient and a smaller value represent a stronger trade-off effect between ecosystem services. This study categorized the trade-offs/synergies between different ecosystem services into five levels: strong trade-off (Q<−0.5), trade-off (−0.5<Q<0), unrelated (Q=0), synergy (0<Q<0.5), and strong synergy (Q>0.5), thus revealing the trade-offs/synergies of ecosystem services in China (Figures 4, 5).
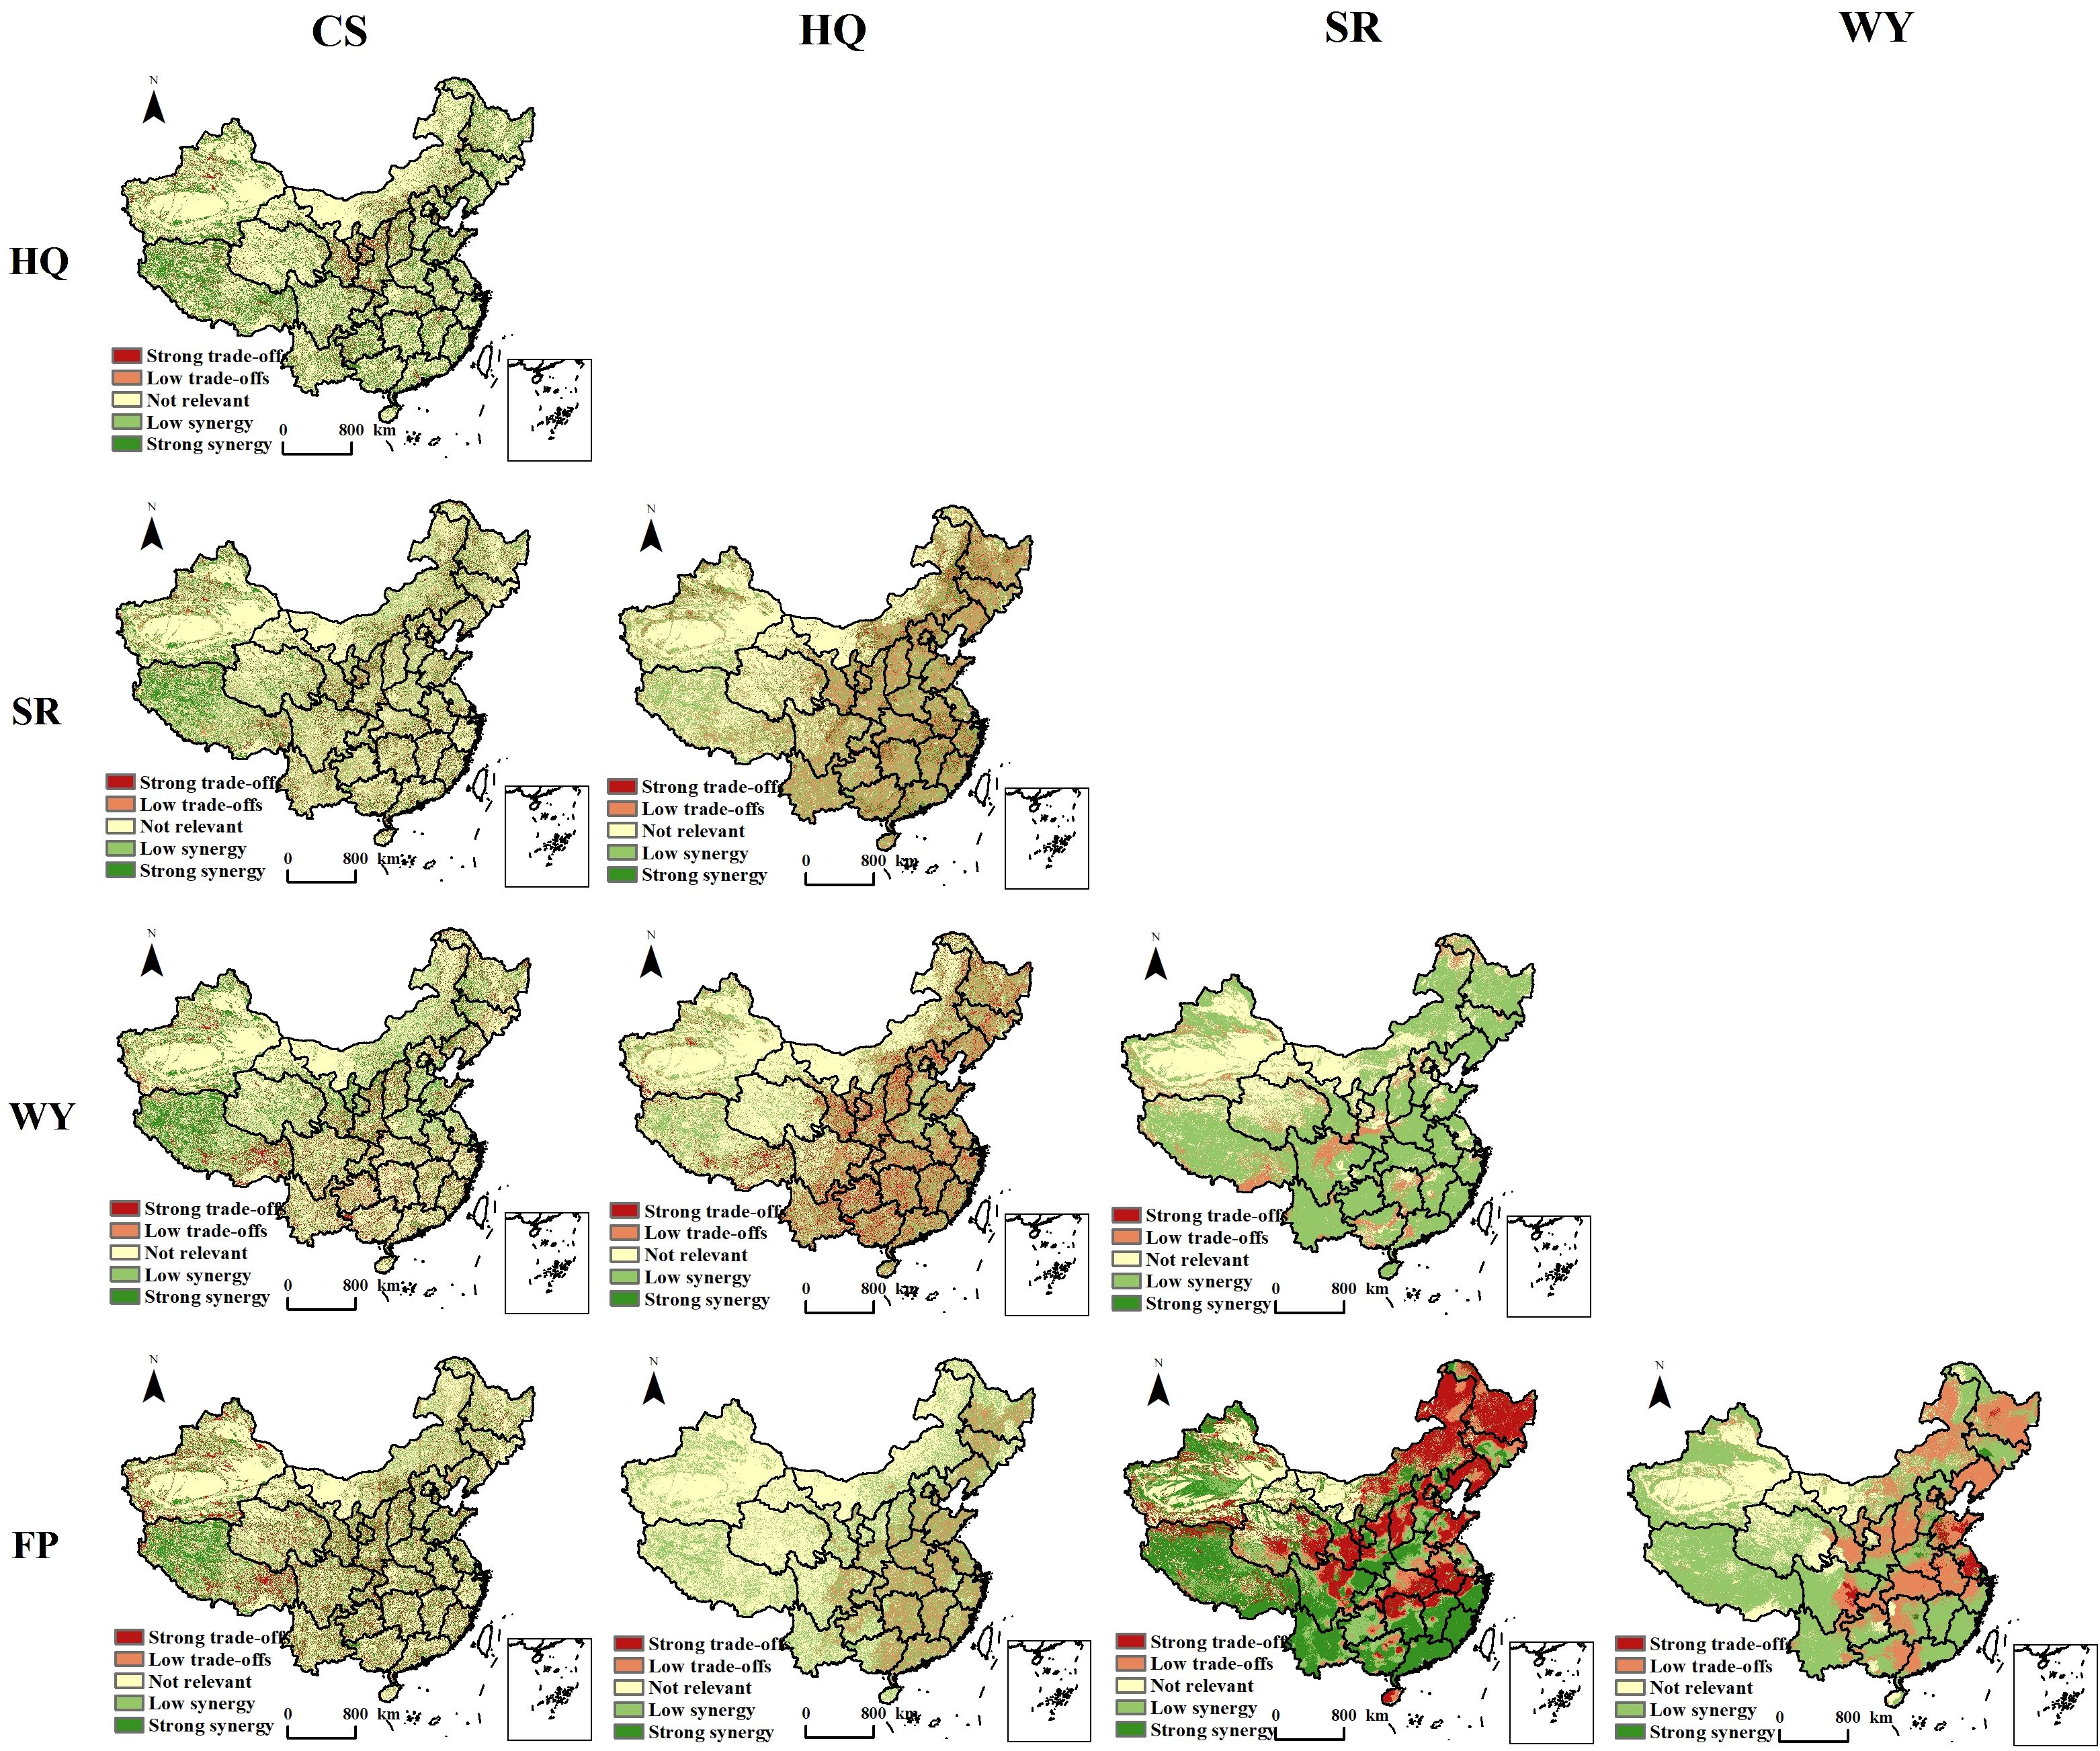
Figure 4. Spatial characteristics of trade-offs and synergies of ecosystem services in China.
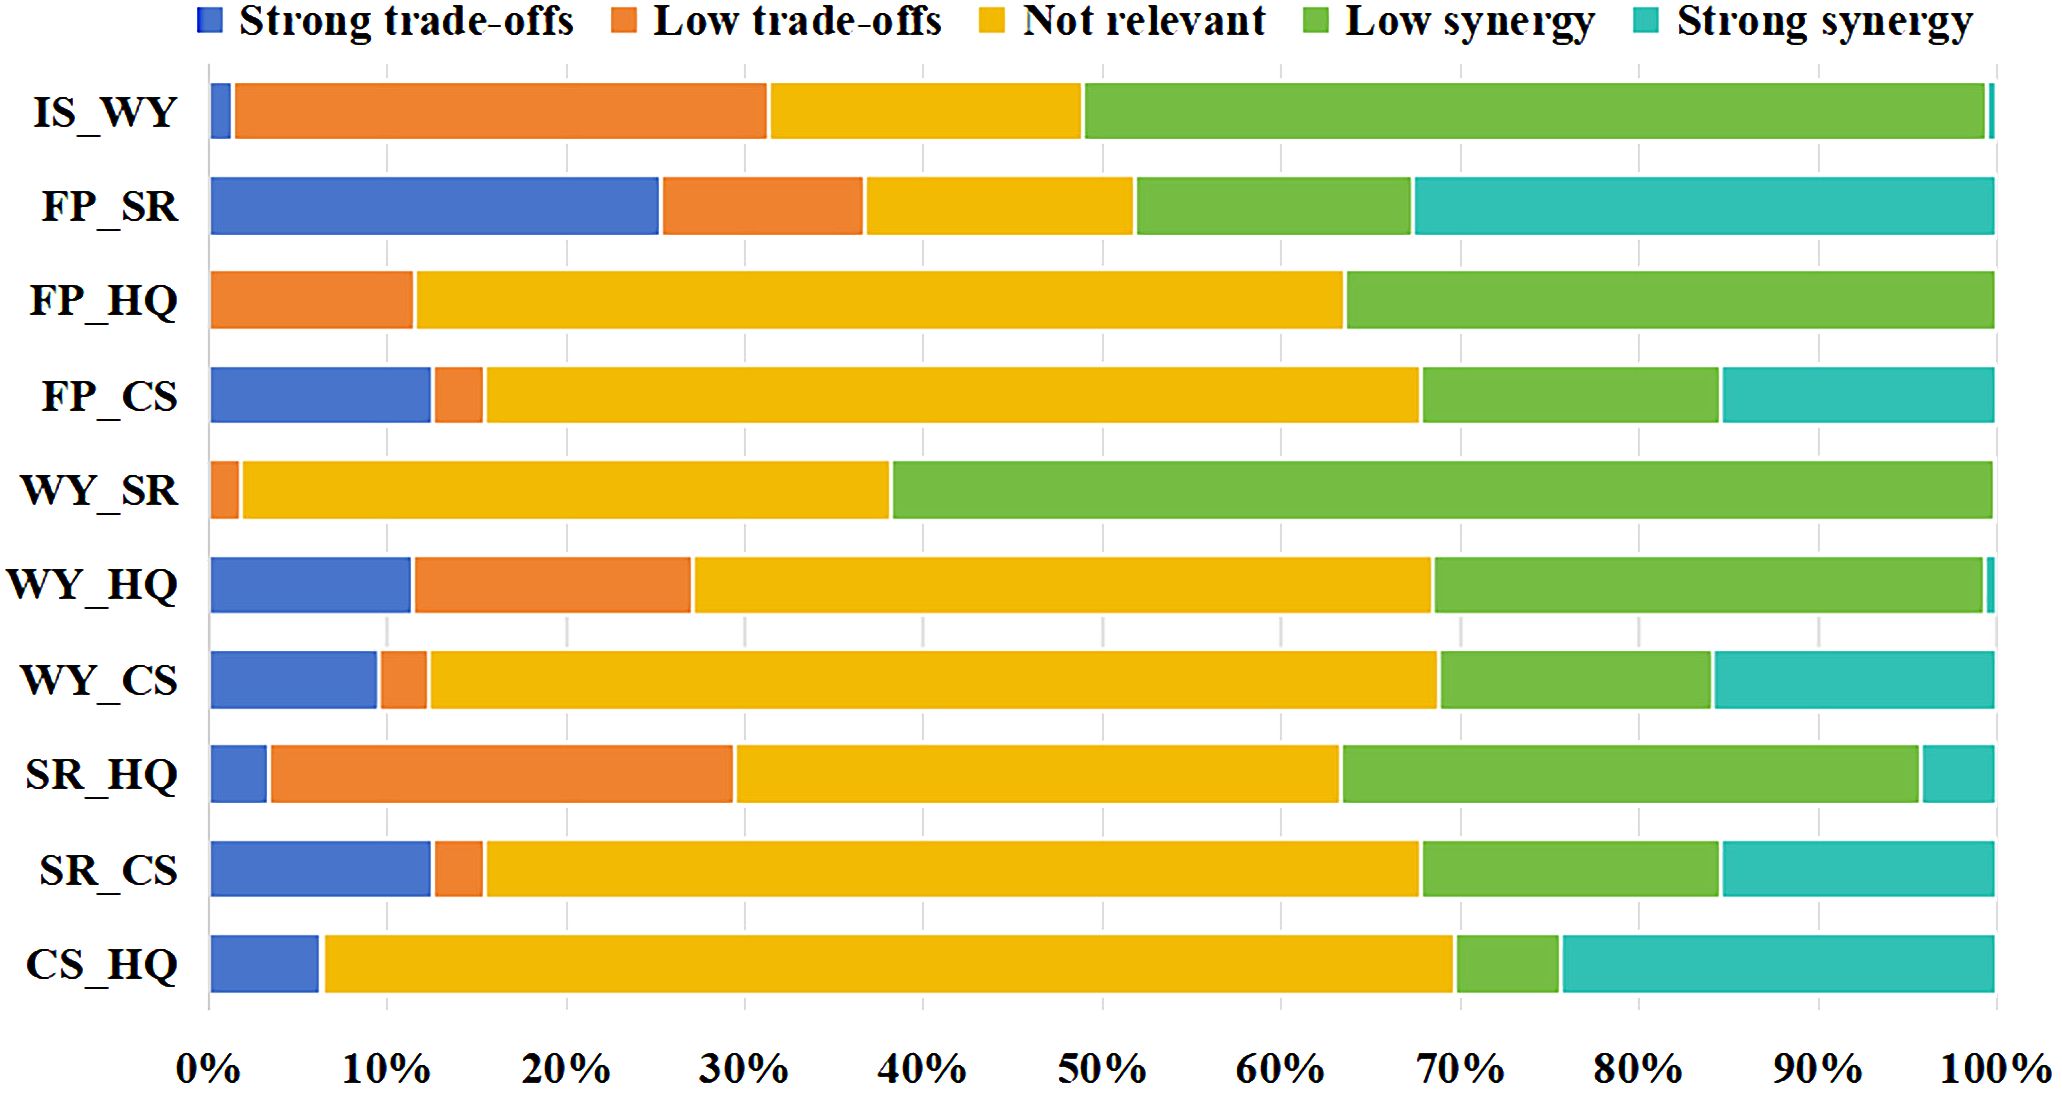
Figure 5. Proportion of ecosystem service trade-offs and synergies in China.
Specifically, HQ and CS show high synergy and unrelatedness, with a strong synergy and synergy area ratio of 30.3%, and an unrelated area ratio of 63.3%. The synergy areas are mainly distributed in provinces such as Tibet, Fujian, Heilongjiang, Jilin, and Zhejiang, while the unrelated areas are mainly concentrated in Xinjiang, Inner Mongolia, and other provinces; the trade-off areas are mainly distributed in Gansu, Ningxia, and Shaanxi. HQ and SR exhibit a combination of balanced, unrelated, and synergistic relationships, with the balanced area ratio of 26%, a synergy area ratio of 32.44%, and the unrelated area ratio of 33.87%. Using the “Hu Huanyong Line” as a dividing line (Zhao et al., 2022). HQ and WY exhibit both synergy and unrelatedness, with a synergy area ratio of 30.86%, mainly located in Tibet, Xinjiang and Qinghai, and the unrelated area ratio of 41.4%, mainly distributed in Xinjiang, Inner Mongolia, Hubei, and Hunan. HQ and FP mainly exhibit an unrelated and synergistic relationship, with an synergy area ratio of 36.5%, which are mainly located in Yunnan, Sichuan, Tibet, and Xinjiang, and an unrelated area ratio of 51%, which are mainly distributed in Xinjiang and Inner Mongolia. WY and CS mainly exhibit unrelated, synergistic, and strong synergistic relationships, with the synergy and strong synergy area accounts for 31.2%, mainly distributed in Henan, Xinjiang, Tibet, and Inner Mongolia, and the unrelated area accounts for 56%, mainly distributed in Xinjiang, Inner Mongolia, and southeastern coastal provinces. WY and SR mainly exhibit a synergistic and unrelated relationship, with a synergic area ratio of 61.7%, mainly distributed in Xinjiang, Yunnan, as well as Fujian, Zhejiang, Guangdong, and other eastern provinces of China, and the unrelated area ratio of 36%, mainly concentrated in Qinghai, Xinjiang, Inner Mongolia, and other provinces. WY and FP mainly exhibit a synergistic and balanced relationship, with the synergyc area ratio of 50.55%, mainly distributed in provinces such as Yunnan, Sichuan, Fujian, and Jiangxi, and a balanced area ratio of 29.9%, mainly distributed in provinces such as Heilongjiang, Anhui, Hubei, and Shandong. CS and SR mainly exhibit an unrelated and synergistic relationship, with a synergy area ratio of 21%, mainly distributed in provinces such as Tibet, Heilongjiang, Qinghai, and Jiangsu, and an unrelated area ratio of 54%, mainly located in areas such as Xinjiang and Inner Mongolia. CS and FP mainly exhibit an unrelated and synergistic relationship, with a synergy area ratio of 16.8%, mainly distributed in provinces such as Heilongjiang, Inner Mongolia, and Jiangsu, and an unrelated area ratio of 52%, mainly located in provinces such as Xinjiang and Inner Mongolia. FP and SR mainly exhibit strong balanced and strong synergistic relationships, with a strong trade-off area ratio of 25.3%, mainly concentrated in Heilongjiang, Jilin, Anhui, and Shandong provinces, and the strong synergy area ratio of 32.6%, mainly distributed in provinces such as Fujian, Guangdong, Yunnan, and Tibet.
3.3 Spatial and temporal driving mechanisms of ecosystem services
3.3.1 Geographical detection of main influencing factors
From multiple dimensions such as nature, economy, and society, this study takes HQ、WY、SR、 CS and FP as the dependent variables for ecosystem services. It uses ten potential independent variables (X1~X10), including average annual temperature, average annual precipitation, elevation, slope, river network density, NDVI, per capita GDP, population density, construction intensity, and road network density (Table 2). This study employs the factor detection module of the geographical detector model to quantitatively detect the main influencing factors and their effects at the county level. The detection results indicate that these ten driving factors all pass significance tests at different levels and can be considered important driving factors of ecosystem services in China. The magnitude of the p-value determines the importance of the influencing factors. Then the key influencing factors of different ecosystem service functions are identified.
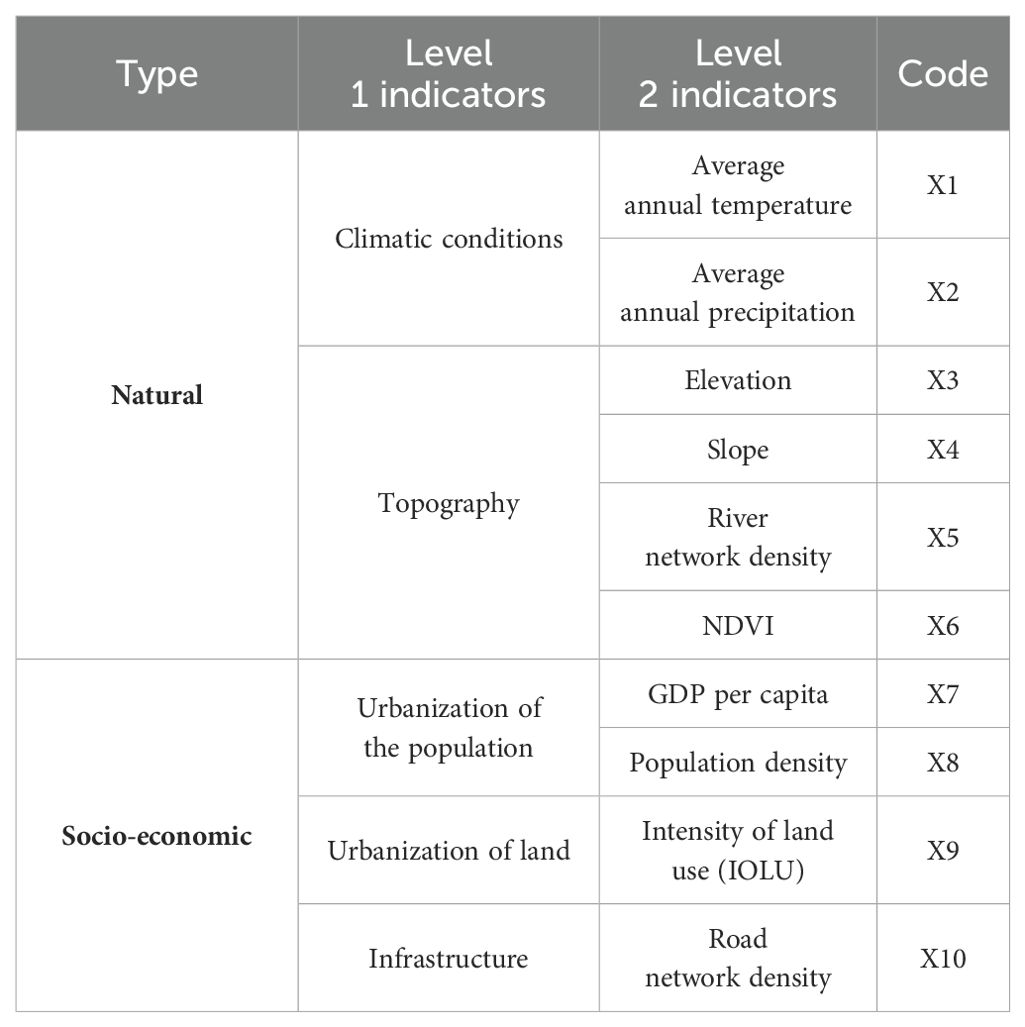
Table 2. Driving factors of terrestrial ecosystem services in China.
The geographical detection results of the main influencing factors of ecosystem services in China from 2000 to 2020 are shown in Figure 6. Overall, the main influencing factors of HQ, WY, SR, CS, and FP exhibit significant differences and change over time. Specifically, slope (X4) is the dominant factor in HQ variation, followed by construction intensity (X9) and population density (X8). The degree of influence q value on ESS fluctuates slightly but tends to be consistent, indicating that social and natural factors impact HQ changes in the region. NDVI (X6) is the dominant factor affecting CS variation, followed by precipitation (X2) and population density (X8). The q value of NDVI’s influence on CS significantly increases from 0.42 to 0.60, indicating that the impact of NDVI on forest carbon sequestration efficiency gradually strengthened from 2000 to 2020. Construction intensity (X9) is the dominant factor in FP variation, followed by population density (X8) and slope (X4). Factors such as elevation (X3) and temperature (X1) have a weak impact on FP, and the q value of the impact of construction intensity (X9) on FP decreases from 0.47 to 0.43, indicating the significant impact of urban land expansion and human activities on regional FP. Slope (X4) is the dominant factor in SR variation, with the q-value fluctuating between 0.57 and 0.60, followed by precipitation (X2) and elevation (X3), indicating that the region’s slope, precipitation, and other natural background and inducing factors have a significant impact on SR. Precipitation (X2) is the dominant factor in WY, followed by temperature (X1) and water network density (X5), indicating that factors such as precipitation and temperature are decisive factors affecting regional WY. Therefore, natural and social factors both have an important impact on different ESS, and human activities gradually intensify the interference with the natural environment, affecting the regional ESS.
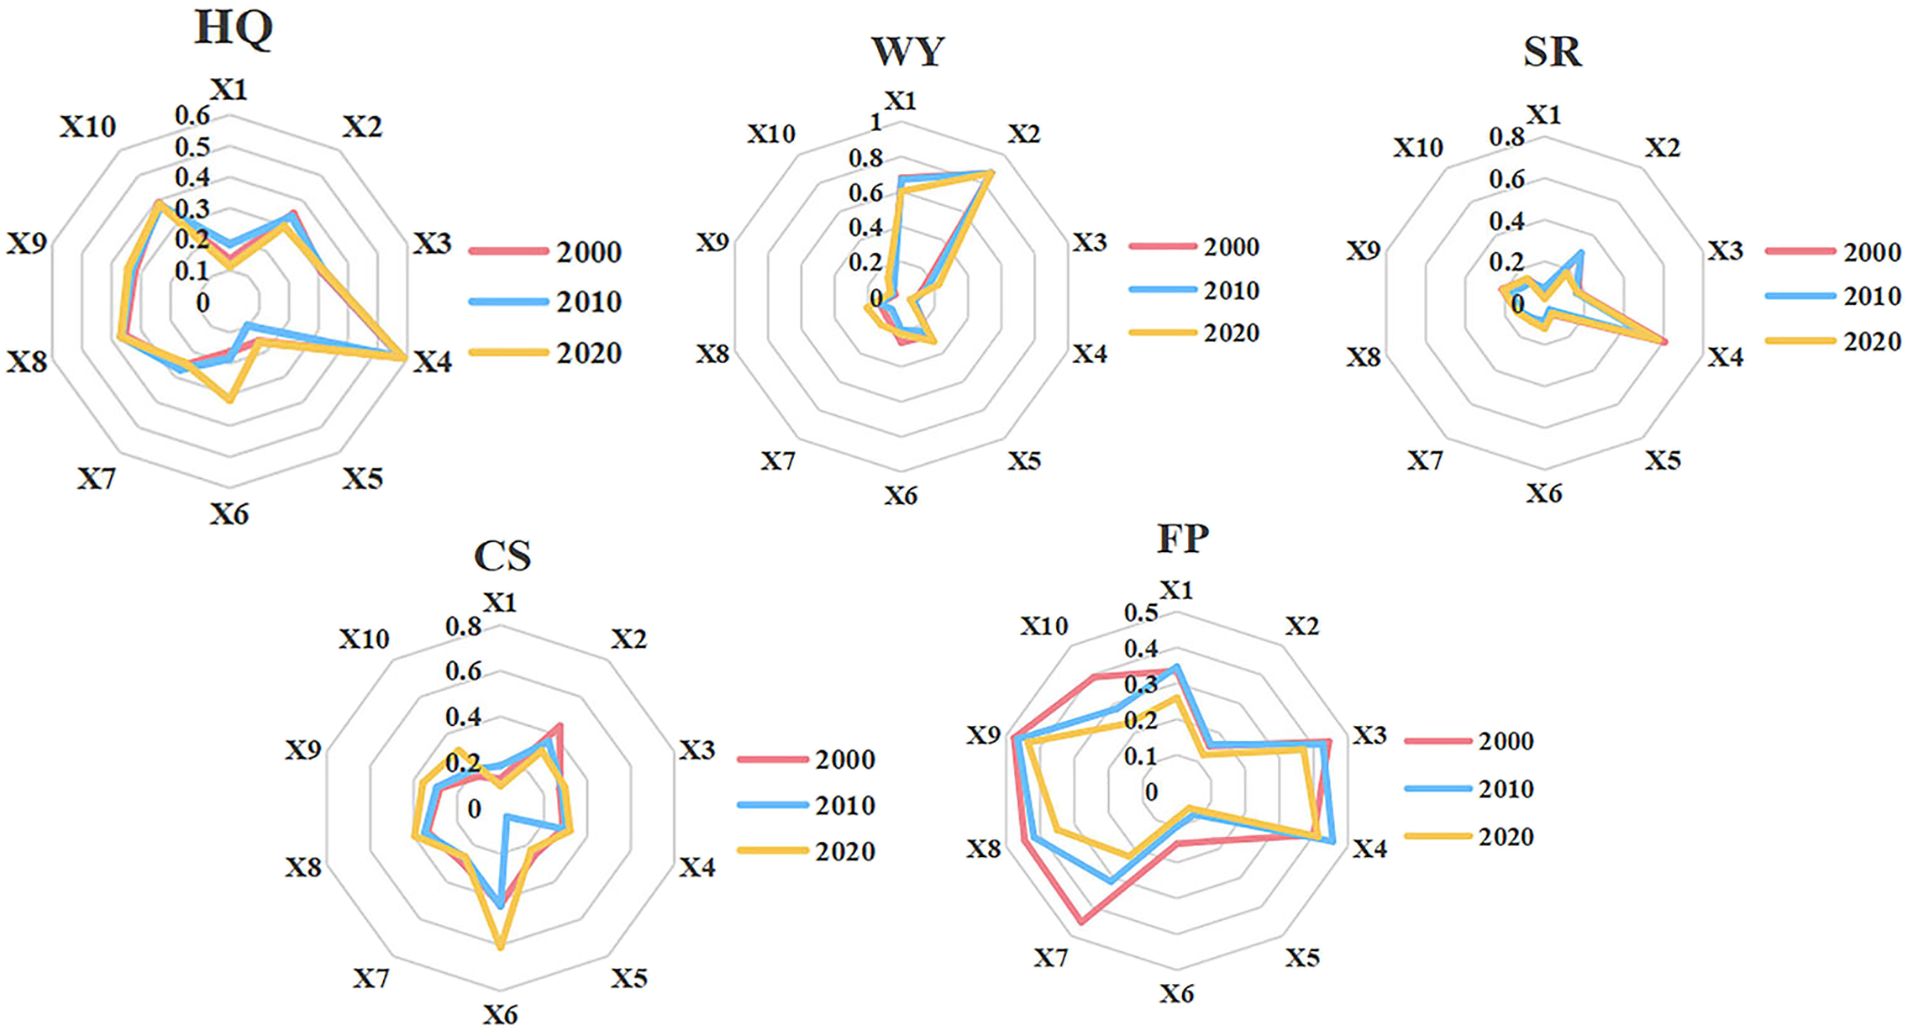
Figure 6. q-value of influencing factors of the spatial relationship of terrestrial ecosystem services in China.
3.3.2 Comparison of model accuracy
The evaluation of ESS driving factors using OLS and GWR models has been widely applied. This study selected GTWR, GWR, and OLS models to explore the evaluation accuracy of driving factors for ecosystem services, and the comparison results of three models are shown in Table 3. Using the GTWR model, a regression analysis was conducted on the five terrestrial ecosystem services (HQ, SR, WY, FP, CS) in China, with R−2 values of 0.77344, 0.77913, 0.88813, 0.49095, 0.68375, adjusted R−2 values of 0.77341, 0.77910, 0.88813, 0.49087, 0.68370, and AICC values of −13543.2, −44085.4, −37266.4, −9560.2, −15413.6, respectively. Therefore, the GTWR model was used to analyze the spatial heterogeneity of influencing factors of ecosystem services, which performed well and outperformed the fitting effects of the GWR and OLS models.
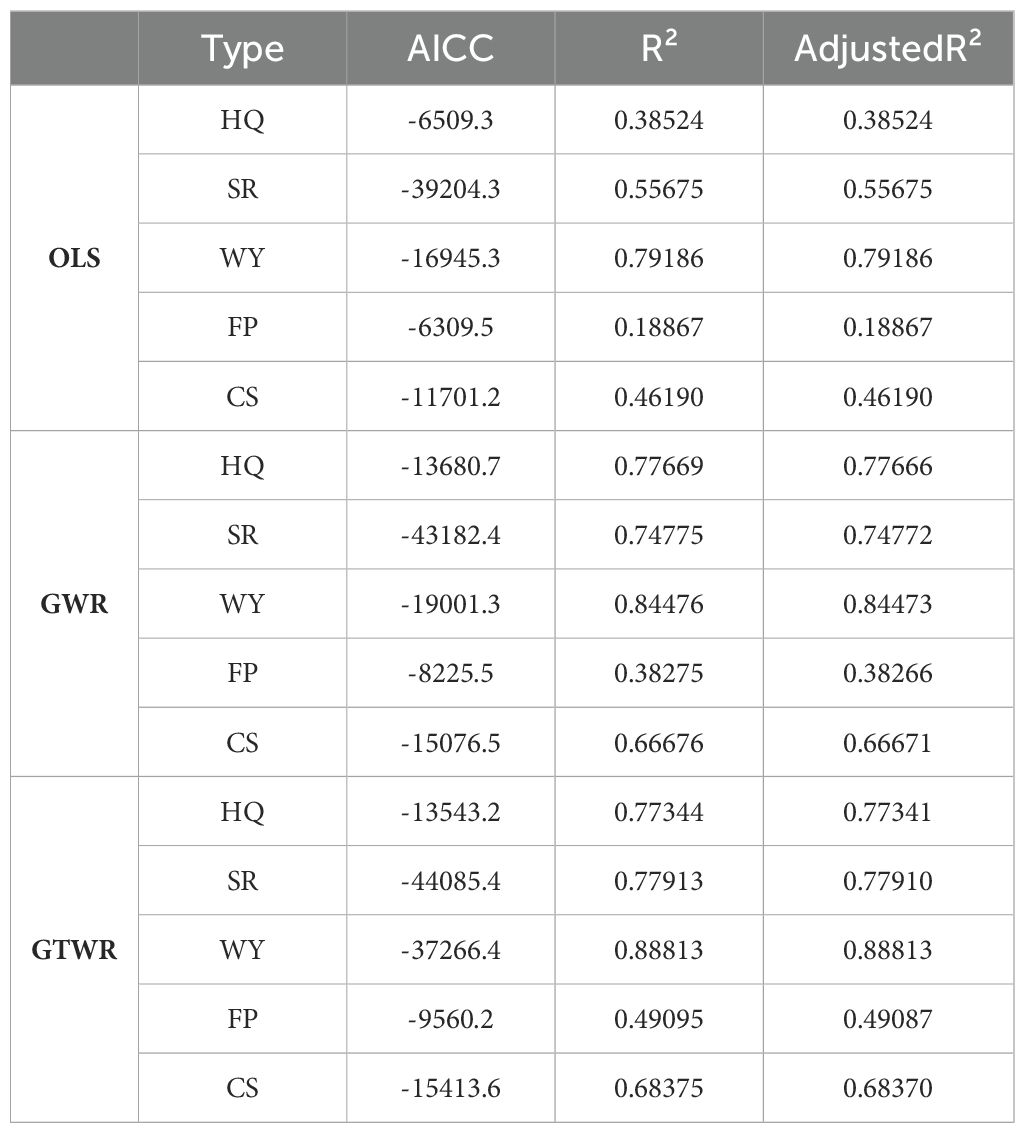
Table 3. Comparative analysis between regression models.
3.3.3 Spatial heterogeneity analysis of influencing factors
Based on the main influencing factors of different ecosystem service functions detected by the geographical detector, the GTWR model is employed to analyze the spatial heterogeneity characteristics of influence factors of ecosystem services. According to the size of the q value, the detection results of the geographic detector found that factors such as slope, rainfall, IOLU, and NDVI are the core influencing factors of the five ecosystem services of HQ, SR, WY, FP, and CS. Among them, the slope factor is the core influencing factor of the HQ and SR; rainfall is the core influencing factor of WY; IOLU is the core influencing factor of FP; and NDVI is the core influencing factor of CS. Thus this study combines ArcGIS with the GTWR model to analyze the spatial heterogeneity characteristics of different dominant influence factors on these 5 ESS (Figure 7).

Figure 7. Spatial distribution characteristics of influence factors of ecosystem services.
Overall, slope, rainfall, IOLU, and NDVI show significant spatial heterogeneity in influencing crucial terrestrial ecosystem service functions in China. Specifically, between 2000 and 2020, the slope’s trend on HQ was relatively consistent, showing a positive correlation nationally. Its impact changes are relatively small and show a slight decreasing trend, with an overall stable trend and slight downward trend from northeast to southwest. The areas of lower impact are mainly distributed in Yunnan, Tibet, and Sichuan provinces; the regions with moderate impact are primarily located in Gansu, Inner Mongolia, and Xinjiang provinces, while the areas with significant impact are primarily located in Heilongjiang, Jilin, and Liaoning provinces. The degree of slope’s impact on SR gradually decreases, continuously decreasing from the southeastern coast to the inland areas. Regions with higher slopes are more affected by rainfall, resulting in higher degrees of soil erosion. The higher impact areas are mainly distributed in Hainan, Fujian, Zhejiang, and Guangdong. Rainfall and WY show a spatially positive correlation, indicating that WY is mainly influenced by rainfall. The higher the rainfall, the greater the WY. There is a southeast-to-northwest trend of varying values, with rainfall’s impact on WY gradually expanding from inland China to the southeastern coast. The regions with lower impact primarily include Tibet, Xinjiang, Qinghai, and other provinces while the areas of moderate impact are mainly concentrated in Yunnan, Sichuan, and other provinces, and the areas of higher impact are mainly concentrated in Zhejiang, Anhui, Jiangsu, and other provinces. IOLU and FP show a significant positive correlation spatially. The impact of IOLU on FP gradually weakens, decreasing from inland China to the southeastern coast. Lower impact areas are mainly concentrated in Tibet, Xinjiang, and other provinces, while moderate impact areas are mainly distributed in Hainan, Guangxi, Guangdong, and other provinces, and the areas of higher impact intensity are mainly distributed in Sichuan, Hubei, Hunan, and other provinces. NDVI and CS show a significant positive correlation spatially, with the impact of NDVI on CS gradually expanding from western to eastern China. The areas of lower impact are mainly distributed in Inner Mongolia, Beijing, Hebei, Shanxi, and other provinces, while the areas of moderate impact are mainly concentrated in Tibet, Xinjiang, Qinghai, and other provinces, and the areas of higher impact are mainly distributed in Heilongjiang, Fujian, Zhejiang, Guangdong, and other provinces.
4 Discussion
4.1 Validation of ecosystem service measurements
Quantifying ESS based on the InVEST model is widely recognized domestically and internationally due to its mature and scientific evaluation system. In light of this, this paper conducts an assesses of China’s terrestrial ecosystem ESS using the InVEST model. Its evaluation results serve as an important basis for subsequent comprehensive ESS assessments and functional zoning. The accuracy of the evaluation results determines the reliability of subsequent work. To ensure the scientific nature of the evaluation results, we conduct accuracy validation analysis through the evaluation results of other scholars. Considering the current lack of relevant research on the assessment of China’s terrestrial ecosystem ESS, we conduct a comparative analysis with the evaluation results of related studies from similar years.
For HQ, the average annual HQ values in the study area for 2000, 2010, and 2020 were 0.578, 0.578, and 0.563, respectively. Yu et al. (2024) measured HQ at the provincial scale for 31 provinces in China using the InVEST model, showing average HQ indices of approximately 0.614, 0.613, and 0.612 for 2000, 2010, and 2020, respectively. Su et al. (2024) measured HQ at the city scale in China from 2010 to 2020 using the InVEST model, showing a slight downward trend, consistent with this study’s conclusions. For FP, the average annual FP values in the study area for 2000, 2010, and 2020 were 0.483t/hm−2, 0.642t/hm−2, and 0.695t/hm−2, respectively. Tian et al. (2024) estimated FP in China from 2000 to 2020, showing significant improvement in FP across major urban agglomerations over 20 years, consistent with this study’s results. For CS, the average annual CS values in the study area for 2000, 2010, and 2020 were 174t/hm−2, 174t/hm−2, and 174t/hm−2, respectively. Zhang et al. (2017) estimated CS in China’s terrestrial ecosystems for 2010 using the InVEST model, with results around 190t/hm−2, slightly different from this study’s results but within the same range. For SR, the average annual SR values in the study area for 2000, 2010, and 2020 were 5862t/hm−2, 6415t/hm−2, and 6543t/hm−2, respectively. Yu et al. (2024) estimated SR in China from 1990 to 2020 using the InVEST model, with results ranging between 5000t/hm−2 and 5500t/hm−2, slightly different from this study’s SR measurements but generally consistent and showing a significant upward trend. For WY, the average annual WY values in the study area for 2000, 2010, and 2020 were 375mm/hm−2, 406mm/hm−2, and 355mm/hm−2, respectively. Su et al. (2024) measured WY at the city scale in China from 2010 to 2020 using the InVEST model, with results of 631mm/h−2 and 583mm/hm−2 for 2010 and 2020, respectively, showing a downward trend over the decade. Yu et al. (2024) measured WY in China for 2000, 2010, and 2020 using the InVEST model, with results ranging between 330mm/hm−2 and 380mm/hm−2, showing a rising then falling trend, consistent with this study’s results.
In summary, the results of measuring China’s terrestrial HQ, CS, SR, WY, and FP using the InVEST model, despite some differences with those of other scholars, likely due to differences in scales and model parameters chosen, generally fall within the same range as those measured by other scholars at city, provincial, and urban agglomeration scales. ESS results measured are largely consistent. Therefore, the results of measuring ecosystem services at the county scale in China using the InVEST model in this paper have strong scientific validity and feasibility.
4.2 Spatial and temporal pattern of comprehensive ecosystem services
This study standardized the five types of ESS and constructed a comprehensive ecosystem service index using the method of equal weight allocation from 2000 to 2020, and further explored the spatial and temporal pattern of comprehensive ecosystem services in China (Figure 8). Between 2000 and 2020, the comprehensive ecosystem services in China remained consistent, the basic trend shows higher levels in the southeast and lower levels in the northwest. The low-value areas of comprehensive ecosystem services are mainly distributed in provinces such as Xinjiang, Inner Mongolia, and Qinghai; the regions with intermediate impact levels are primarily concentrated in provinces like Tibet Gansu, and high-value areas are concentrated in Guangdong and Zhejiang. Between 2000 and 2020, the overall comprehensive ecosystem service function slightly decreased. The average ecosystem service function index declined slightly from 0.284 in 2000 to 0.266 in 2020, suggesting a minor overall decrease nationwide. This may be due to China’s rapid economic development and continuous urbanization, which have caused a certain degree of damage to the domestic ecology (Wang et al., 2022). The areas with increasing comprehensive ecosystem service functions are mainly in Heilongjiang, Inner Mongolia, and Anhui provinces. The southeastern and coastal terrains are mostly low mountains, hills, and plains, with small fluctuations in terrain and influenced by the ocean, resulting in low-temperature differences, high rainfall, suitable for plant growth, and relatively high vegetation coverage. Inland terrains are mostly high mountains and basins with large fluctuations in terrain, large temperature differences, low rainfall, and relatively low vegetation coverage (Hu et al., 2021). Meanwhile, the southeastern region has a large population and rapid economic development, leading to relatively prosperous agricultural development in the east.
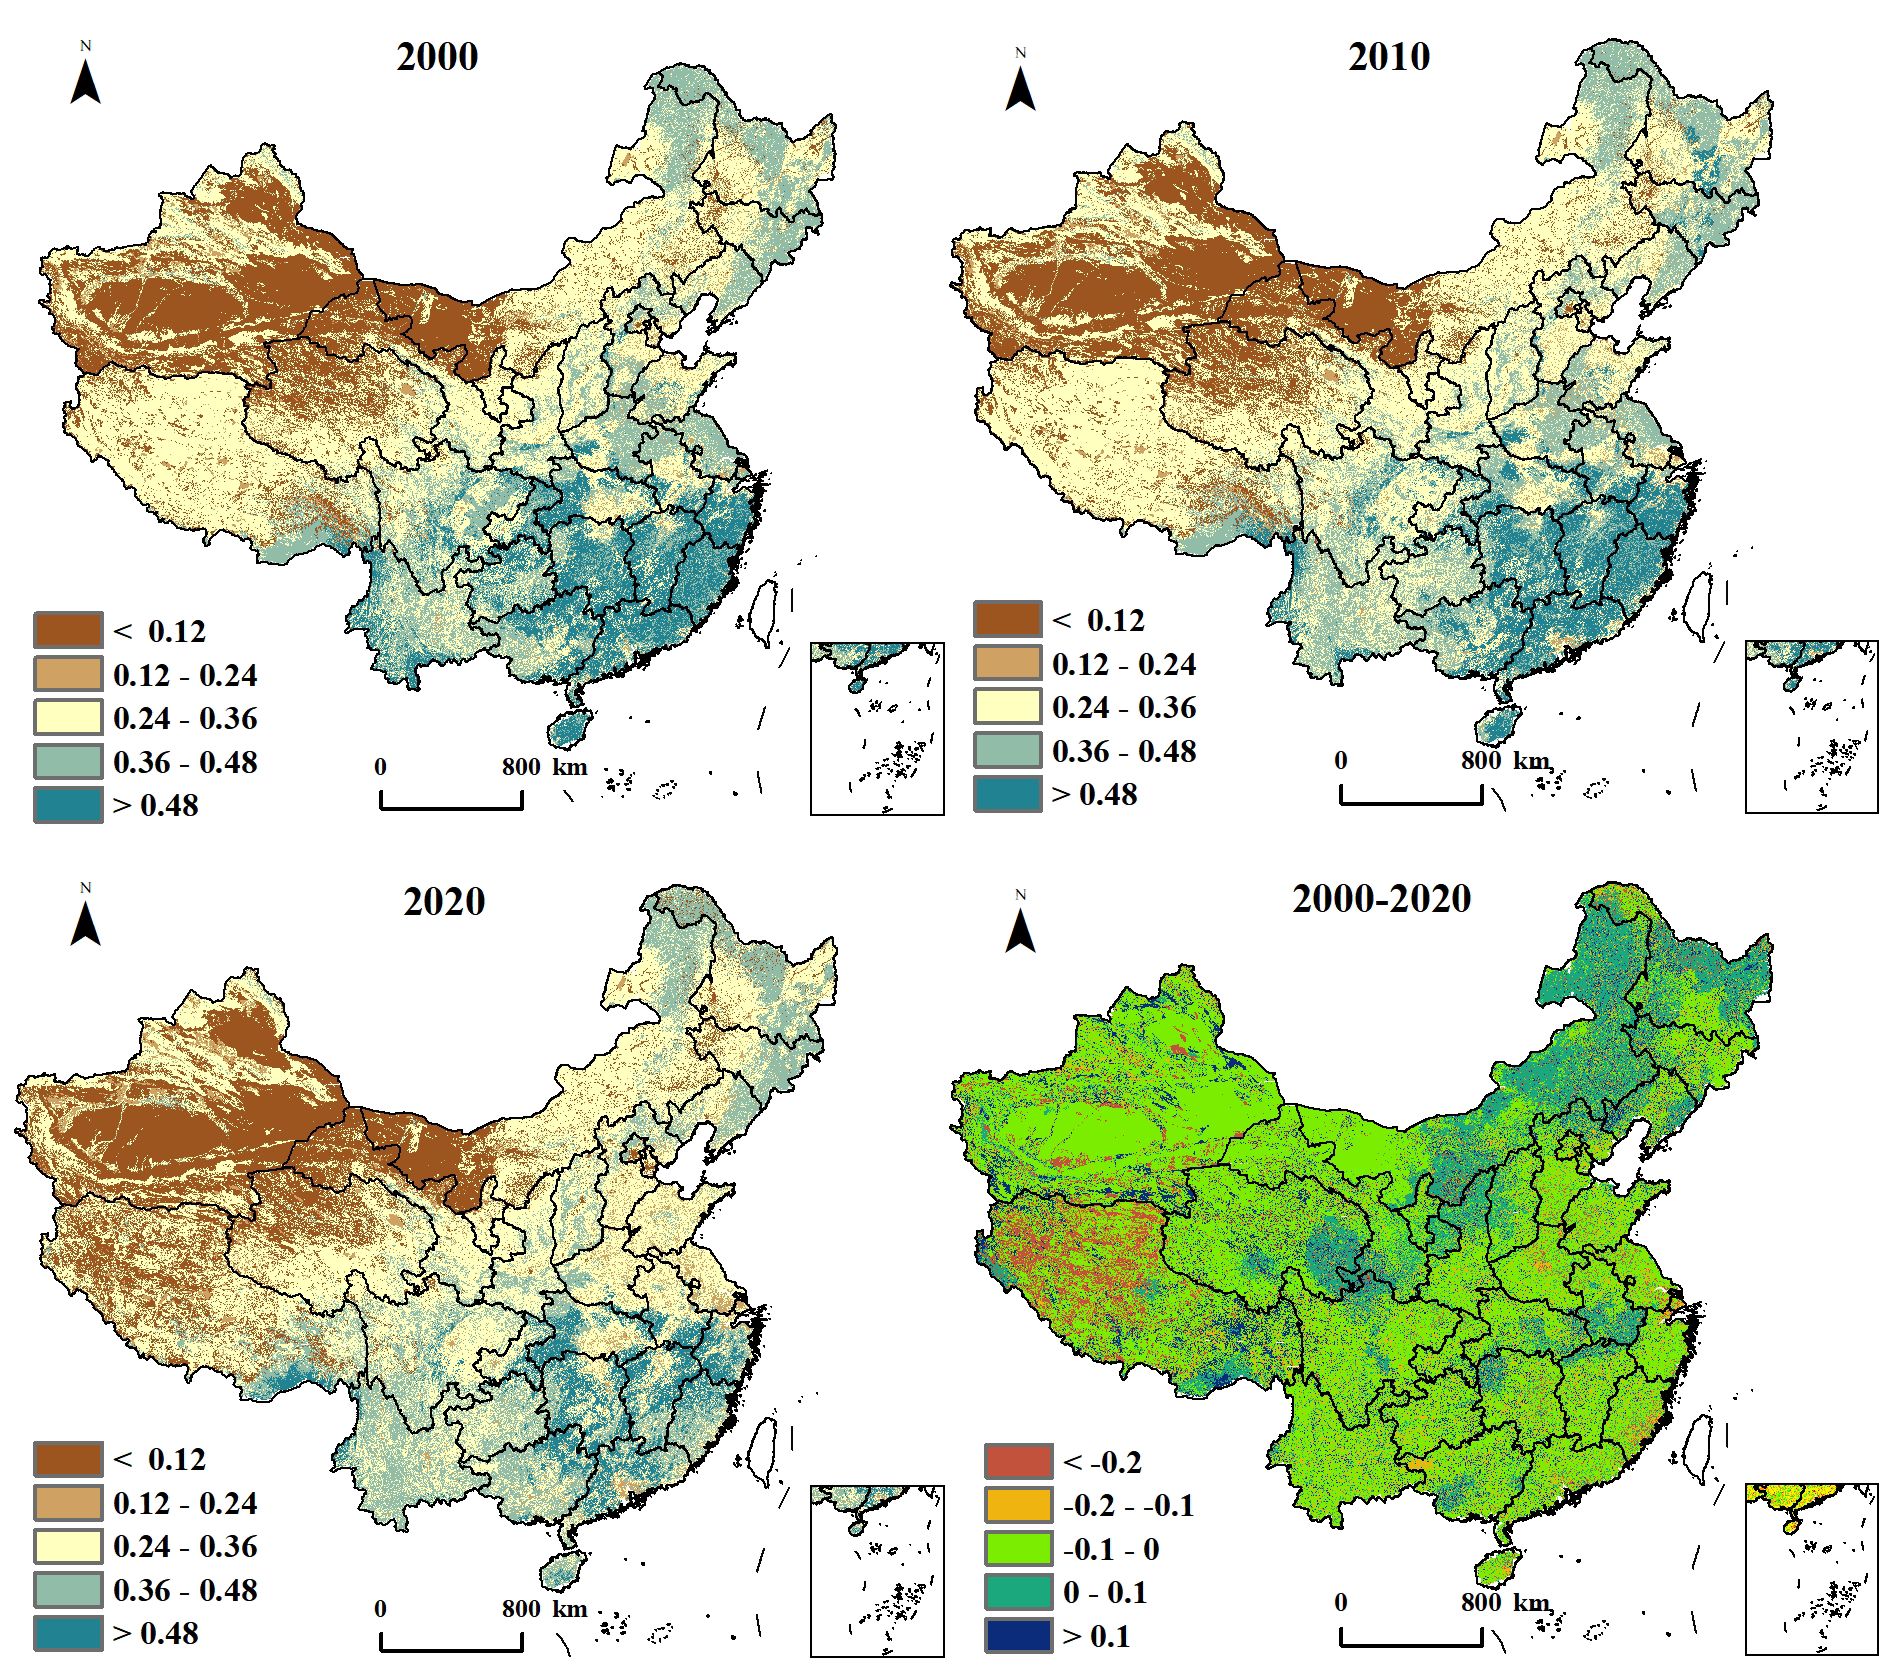
Figure 8. Spatial change trend of comprehensive ecosystem services in China from 2000 to 2020.
4.3 Ecosystem service responses to land use
Based on the spatial overlay of land use types in 2020 with five ESS: HQ, SR, WY, FP, and CS, to investigate how various terrestrial ecosystem services in China respond to land use, as shown in Table 4. Different ESSs also exhibit significant spatial heterogeneity in response to land use types (Muyi et al., 2019). Specifically, HQ has low values in unused land and high values in forest areas, SR and WY have low values in unused land and grassland, with high values in forest areas, FP has low values in water areas and high values in cultivated land. CS have low values mainly concentrated in construction land areas, while high values are mainly concentrated in forest areas. Different land use types exhibit distinct spatial heterogeneity in response to ESS. The response of cultivated land to HQ, SR, and WY is mainly concentrated in low values, while the response to FP and CS is mainly concentrated in high values. The response of grassland to SR, WY, and FP is mainly concentrated at low values, while the response to HQ and CS is mainly concentrated at moderate values. The response of water areas to SR, WY, CS and FP mainly focuses on low values, while the response to HQ mainly focuses on high values. The response of construction land to HQ, SR, and WY mainly focuses on low values, while the response to FP and CS mainly focuses on high values. Unused land consistently exhibits a low response to various ESS. It can be seen that forest land exhibits a significant response to high ESS values, while unused land shows a notable response to low ESS values. ESS demonstrates a significant response to land use types, with both low and high values for HQ, primarily low values for SR and WY, mainly moderate values for FP, and primarily high values for CS.
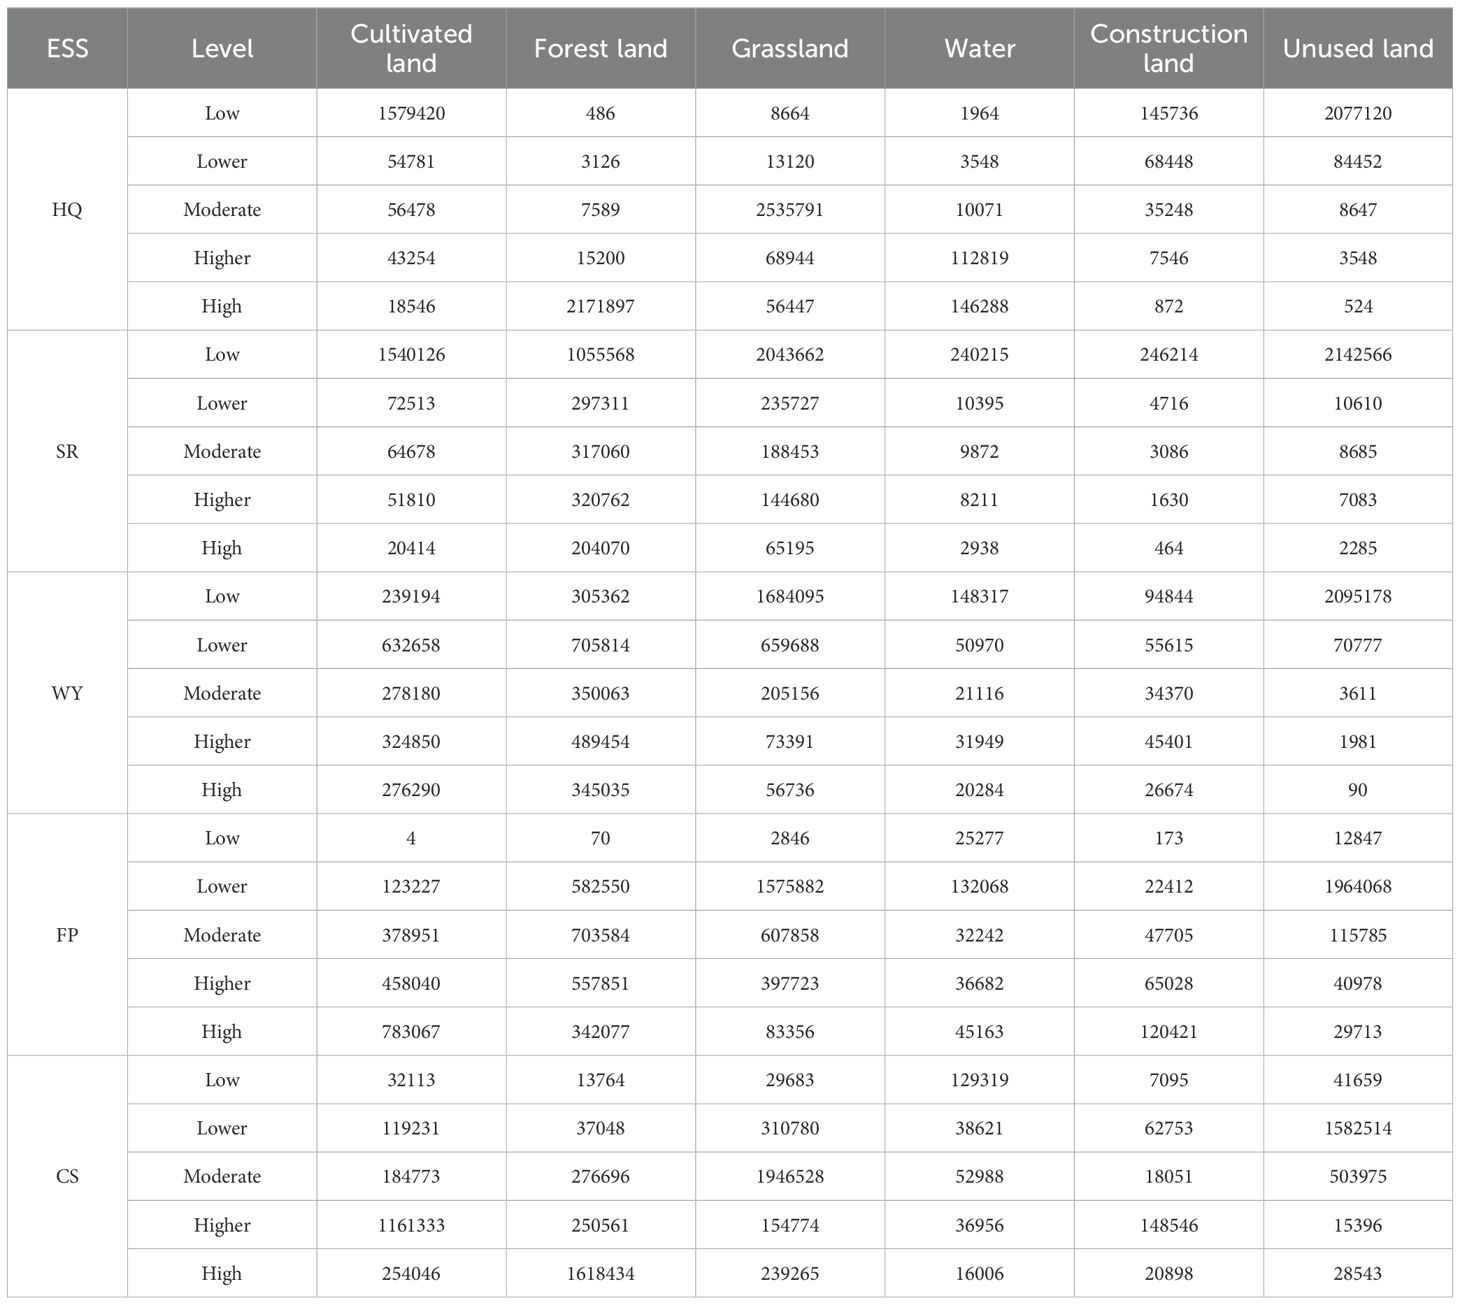
Table 4. Responses of land use types to terrestrial ecosystem services in China.
4.4 Functional zoning of ecosystem services
Based on the comprehensive ecosystem services from 2000 to 2020, Chinese county-level units are used as the basis. It combines cumulativeness with spatial dynamics, covering the current stage characteristics and long-term evolution process of comprehensive ecosystem service functions. First, based on the long-term evolution process, it is divided into three evolutionary characteristics: ecological degradation type, ecological stability type, and ecological development type. Then based on the comprehensive ecosystem service function regions in 2020, it is divided into nine ecological function precautionary areas (Figure 9).
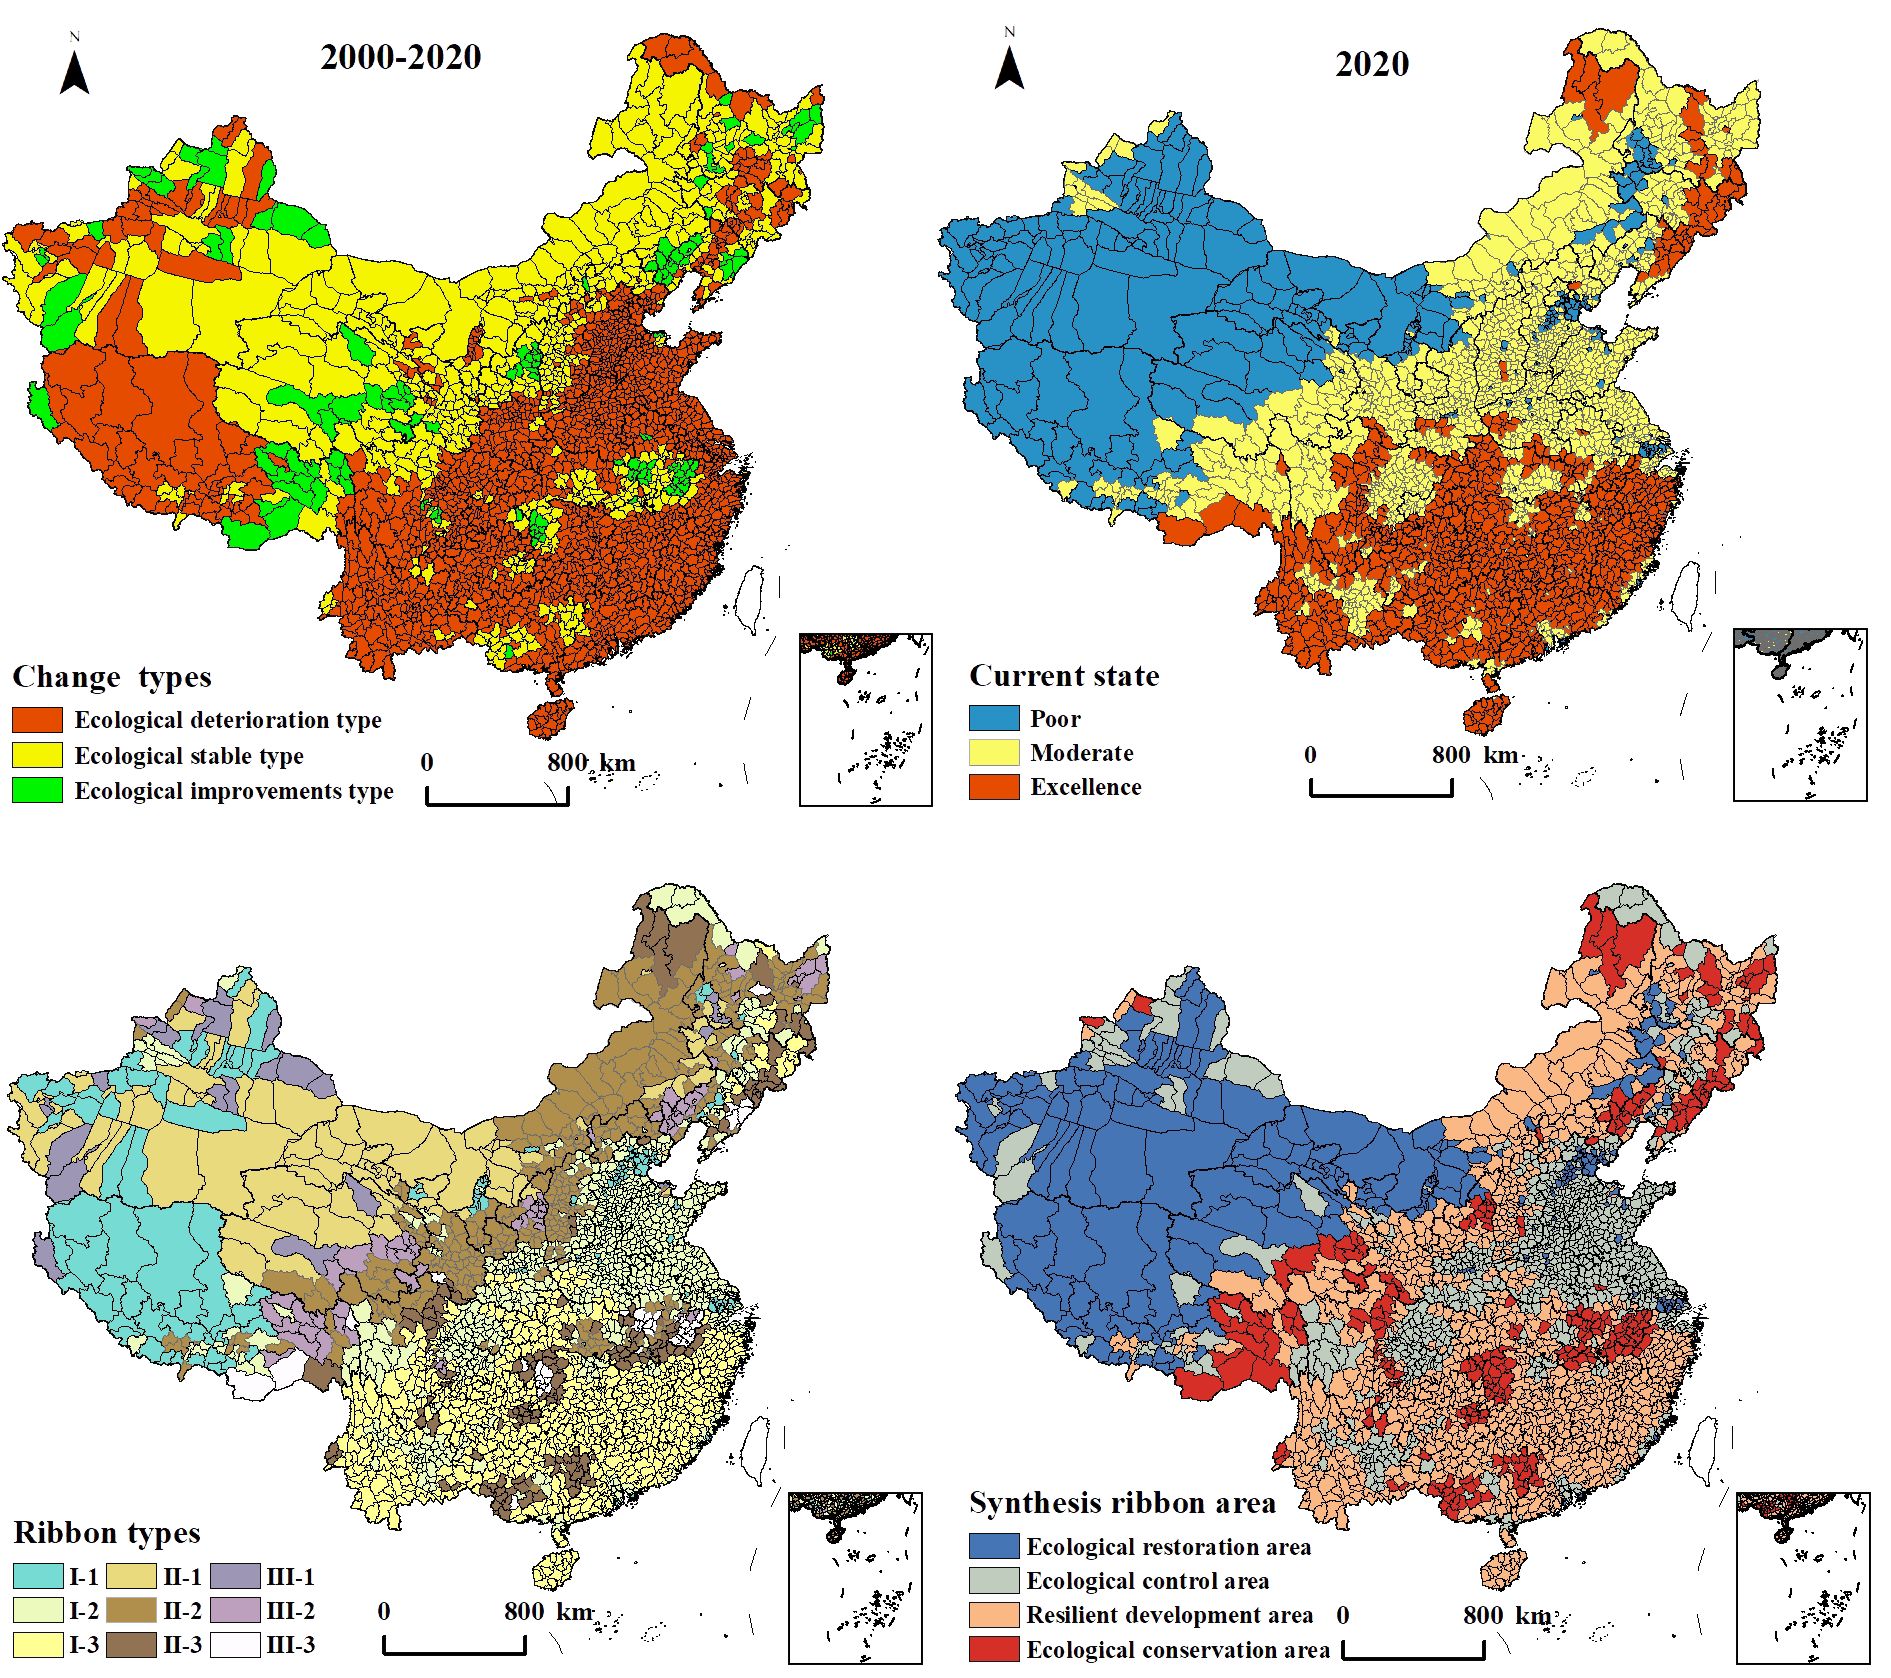
Figure 9. Distribution of functional areas in China from a dynamic perspective.
Among them, the ecological degradation type includes I-1, I-2 and I-3 which represent the current status of low-level ecosystem service supply, and have shown a trend of degradation, stability, and optimization over the past 20 years. The ecological stability type includes II-1, II-2 and II-3, which represent the current status of moderate-level ecosystem service supply, and have shown a trend of degradation, stability, and optimization over the past 20 years. The ecological development type includes III-1, III-2 and III-3, representing the current status of high-level ecosystem service supply and have showing a trend of degradation, stability and optimization.
Specifically, the proportion of areas with ecological degradation type is 46.92%. Among them, I-1 is mainly located in China’s western region, encompassing the northern regions of Tibet, Tianjin, and Xinjiang provinces, mainly consisting of unused land and construction land. I-2 is predominantly situated in Jiangsu, Shandong, Henan, Shaanxi and other provinces, mainly consisting of arable land and construction land, and is the core construction area of China. I-3 is mainly situated in southern China, such as Fujian, Zhejiang, Jiangxi and other provinces. The proportion of areas with ecological stability type is 43.58%. Among them, II-1 is primarily situated in the northern part of Qinghai the western part of Inner Mongolia, and the eastern region of Xinjiang, mainly consisting of unused land, combining production and living areas in various locations (Yang et al., 2023). II-2 is mostly located in Ningxia, Shanxi and other provinces, as well as the eastern counties of Inner Mongolia, mainly composed of grassland and construction land. II-3 is mostly located in the southern part of Jilin Province, the northern part of Inner Mongolia, and the southeastern counties of Guangxi. These areas consist primarily of woodland and construction land. The proportion of areas with ecological development type is 9.51%. Among them, III-1 is mostly located in Hotan and Pishan County in Xinjiang Province and Qumalai County in Qinghai Province, which are primarily grassland-dominated regions, with scattered construction land in each county, and are easily affected by disturbances from other areas. III-2 is mostly located in the northeastern counties of Tibet and Maduo County in Qinghai Province. These areas consist predominantly of grassland. III-3 is primarily situated in the southern region of Tibet and the northwest area of Hunan Province. These areas consist predominantly of grassland and woodland, strongly resistant to disturbances (Liu et al., 2023).
4.5 Optimization path of territorial spatial zoning
Based on the spatial and temporal evolution characteristics and cumulative overlay, China’s land space is divided into four major types of ecological protection functional zones: ecological restoration area, ecological control area, resilient development area, and ecological conservation area. The basis for division, control objectives, and zoning characteristics are shown in (Table 5). Among them, the ecological restoration area mainly includes two ecological system functional zones, I-1 and I-2, which are concentrated in western China, such as Tibet and Xinjiang. These areas are characterized by high altitude, low vegetation coverage, natural constraints, high degree of fragmentation in construction, high sensitivity, and once damaged, the ecological system functions will suffer losses, making a recovery more difficult (Chen et al., 2019). The ecological control area mainly includes two types of ecological system functional zones, II-2 and III-1.These areas are primarily situated in the northeastern part of China.
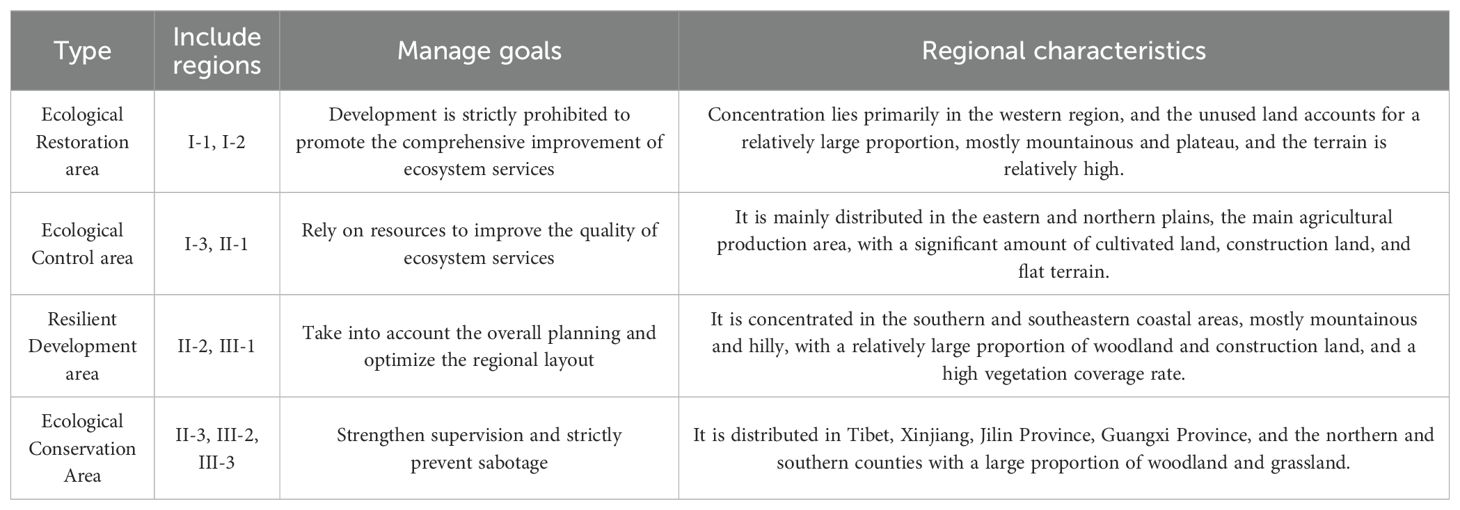
Table 5. Classification and regional distribution characteristics of functional areas.
The Sichuan Basin, Jiangsu, Shandong, Sichuan, Inner Mongolia, Heilongjiang, and other provinces. These areas are the main grain-producing region of China, where the contradictions between agricultural production, construction expansion, and ecological protection are particularly prominent. The resilient development area mainly includes two types of ecological system functional zones, I-3 and II-1, which are mainly situated in the southern and southeastern coastal, such as Hainan, Yunnan, Fujian and Zhejiang. These areas have relatively high vegetation coverage, which is important for maintaining biodiversity. Mountainous and hilly terrain, superior coastal and natural conditions, and a land use pattern with intersecting distribution of woodland, water, and construction land characterize it. The ecological conservation area mainly includes three types of ecological system functional zones, II-3, III-2, and III-3, which are mainly situated in the southern and northern parts of Jilin Province, the western and eastern parts of Guangxi, the southern part of Anhui Province, and the southern part of Tibet. The overall ecological environment in these areas is relatively good, with abundant forest resources, making it a core area with good ecological system service functions in China.
Based on the spatial and temporal evolution characteristics and cumulative overlay, China’s land space is divided into four major types of ecological protection functional zones: ecological restoration area, ecological control area, resilient development area, and ecological conservation area. The basis for division, control objectives, and zoning characteristics are shown in (Table 5). Among them, the ecological restoration area mainly includes two ecological system functional zones, I-1 and I-2, concentrated in western China, such as Tibet and Xinjiang. These areas are characterized by high altitude, low vegetation coverage, natural constraints, high degree of fragmentation in construction, high sensitivity, and once damaged, the ecological system functions will suffer losses, making a recovery more difficult (Chen et al., 2019). The ecological control area mainly includes two types of ecological system functional zones, II-2 and III-1.These areas are primarily situated in the northeastern part of China.
The Sichuan Basin, Jiangsu, Shandong, Sichuan, Inner Mongolia, Heilongjiang, and other provinces. These areas are the main grain-producing region of China, where the contradictions between agricultural production, construction expansion, and ecological protection are particularly prominent. The resilient development area mainly includes two types of ecological system functional zones, I-3 and II-1, which are mainly situated in the southern and southeastern coastal, such as Hainan, Yunnan, Fujian and Zhejiang. These areas have relatively high vegetation coverage, which is of significant importance for maintaining biodiversity. It is characterized by mountainous and hilly terrain, superior coastal and natural conditions, and a land use pattern with intersecting distribution of woodland, water, and construction land. The ecological conservation area mainly includes three types of ecological system functional zones, II-3, III-2, and III-3, which are mainly situated in the southern and northern parts of Jilin Province, the western and eastern parts of Guangxi, the southern part of Anhui Province, and the southern part of Tibet. The overall ecological environment in these areas is relatively good, with abundant forest resources, making it a core area with good ecological system service functions in China.
4.6 Research contributions, shortcomings and prospects
This study, based on the InVEST model, explores the spatial and temporal patterns, driving mechanisms, trade-offs, synergies, and functional zoning characteristics of key ESS in China’s terrestrial ecosystems from 2000 to 2020. The study found that the capacities of three ecosystem services, HQ, CS, and WY, have declined over the 20 years, while FP and SR have increased. Multi-dimensional factors, including natural, social, and economic aspects, have a significant impact on each ESS. Meanwhile, the synergy between WY and SR and between FP and WY is the most significant, while the trade-off and strong trade-off relationships between FP and SR are the most significant. Therefore, this study attempts to construct a long-term quantitative assessment system for various ESS in China’s terrestrial ecosystems. This system can scientifically identify the current status of ESS in different regions of China, the trade-offs and synergies, and the driving mechanisms. It can further explore the functional areas of China’s future ecosystems and the zoning and regulation pathways. This provides new insights for improving the ESS assessment framework and analytical pathways, especially exploring the driving mechanisms of regional ESS based on the geographical detector model and the spatial and temporal geographically weighted regression model. It also explores ecological functional zoning and optimization pathways for land space, providing important theoretical guidance for future large-scale ESS assessments and optimizations. Additionally, this study calculated the spatial and temporal patterns and driving mechanisms of finely scaled terrestrial ESS at a 1km grid scale in China from 2000 to 2020. This can effectively maximize ESS benefits and more scientifically and systematically manage China’s terrestrial ecosystem ESS. It plays a significant role in protecting regional ecosystem security, promoting high-quality sustainable natural development, and providing decision-making support for China’s land spatial planning from a planning and management perspective. Therefore, this study has important practical significance for ensuring China’s ecological security and optimizing regional land spatial patterns.
However, although this study effectively reveals the spatial and temporal patterns and driving mechanisms of key ESS in China’s terrestrial ecosystems from 2000 to 2020, there are still some limitations due to data and technical methods. For example, this study only quantitatively represents key ESS in China’s terrestrial ecosystems through supporting, provisioning, and regulating functions and does not include cultural functions in the assessment model of regional ESS. Furthermore, the current research mainly focuses on measuring ESS at a 1km grid scale in China from 2000 to 2020. It does not explore the spatial and temporal evolution patterns of ESS over a longer time dimension. The revelation of the spatial and temporal patterns of ESS and the analysis of the fine-scale phenomena and internal mechanisms of regional ESS are relatively general and require further research in the future. Therefore, in future research on the spatial and temporal characteristics and internal mechanisms of regional ESS, current advanced technologies such as big data, machine learning, and deep learning can be integrated to construct refined and differentiated models for calculating ESS. This can reveal the spatial and temporal evolution characteristics and internal driving mechanisms of key ESS in China’s terrestrial ecosystems over time series. Additionally, the fine-scale differential characteristics and mechanisms of regions can be deeply analyzed, studying the spatial differentiation and internal mechanisms of ESS in different functional zones, thereby improving the accuracy and depth of regional ESS assessments.
5 Main conclusions
This study comprehensively applies methods such as the InVEST model, the balance and coordination model, geographic detector, and GTWR model to quantitatively evaluate the spatial and temporal balance/coordination of five key ecosystem services in China’s terrestrial areas from 2000 to 2020. It analyzes the main factors influencing different ecosystem service functions and their spatial heterogeneity, and then explores the functional zoning of ecosystem services in China and differentiated zoning control strategies. The main conclusions are as follows:
1. From 2000 to 2020, the average annual values of other key ecosystem services in China, except for food provision and soil conservation, have declined. The overall ecosystem services show a decreasing trend from high in the southeast to low in the northwest.
2. From 2000 to 2020, the functions of key terrestrial ecosystem services in China have been comprehensively affected by multiple dimensions, including natural, economic, and social factors. Among them, slope, average annual rainfall, construction land intensity, and vegetation coverage are the dominant influencing factors. There are significant differences and spatial heterogeneity characteristics among different factors.
3. From 2000 to 2020, key terrestrial ecosystem services in China had more synergy and strong synergy relationships and fewer trade-off and strong trade-off relationships among key terrestrial ecosystem services in China. The synergy between water retention and soil conservation, and between food provision and water retention, was the most significant, while the trade-off and strong trade-off relationships between food provision and soil conservation were the most notable.
4. Based on the evolution trends and current characteristics of ecosystem services, the land space is divided into four major types of ecological functional control zones: ecological restoration zone, ecological control zone, flexible development zone, and ecological conservation zone. Future differentiated zoning optimization pathways are formulated for different control zones.
Data availability statement
The raw data supporting the conclusions of this article will be made available by the authors, without undue reservation.
Author contributions
JH: Conceptualization, Data curation, Methodology, Writing – original draft, Writing – review & editing. SY: Data curation, Formal analysis, Writing – original draft, Writing – review & editing. WZ: Data curation, Resources, Writing – original draft. JL: Funding acquisition, Investigation, Supervision, Writing – review & editing. YZ: Data curation, Methodology, Supervision, Writing – review & editing. JR: Methodology, Resources, Supervision, Writing – original draft. YD: Formal analysis, Project administration, Supervision, Writing – review & editing. AZ: Funding acquisition, Resources, Supervision, Writing – original draft.
Funding
The author(s) declare financial support was received for the research, authorship, and/or publication of this article. This research was supported by the National Key Research and Development Program of China (No. 2022YFC3002804), the Major Project of Fujian Provincial Social Science Research Base(No. FJ2023JDZ029), the Fujian Provincial Department of Finance Project (No. KSC22R06D), the Program of Research Institute of Xi Jinping Ecological Civilization, Fujian Agriculture and Forestry University (No. STWMSX23-01) and the Youth Backbone Training Fund of Fujian Agriculture and Forestry University (No. K1523020B).
Acknowledgments
The authors would like to express thanks to the reviewers and editors for their invaluable contributions to the improvement of this paper.
Conflict of interest
The authors declare that the research was conducted in the absence of any commercial or financial relationships that could be construed as a potential conflict of interest.
Publisher’s note
All claims expressed in this article are solely those of the authors and do not necessarily represent those of their affiliated organizations, or those of the publisher, the editors and the reviewers. Any product that may be evaluated in this article, or claim that may be made by its manufacturer, is not guaranteed or endorsed by the publisher.
Supplementary material
The Supplementary Material for this article can be found online at: https://www.frontiersin.org/articles/10.3389/fevo.2024.1443683/full#supplementary-material
References
Allen R. G., Pereira L. S., Raes D., Smith M. (1998). Guidelines for computing crop water requirements. Irrigation drainage paper 56, 300. doi: 10.1016/j.eja.2010.12.001
Bhagabati N. K., Ricketts T., Sulistyawan T. B. S., Conte M., Ennaanay D., Hadian O., et al. (2014). Ecosystem services reinforce Sumatran tiger conservation in land use plans. Biol. Conserv. 169, 147–156. doi: 10.1016/j.biocon.2013.11.010
Canadell J., Jackson R. B., Ehleringer J. B., Mooney H. A., Sala O. E., Schulze E. D. (1996). Maximum rooting depth of vegetation types at the global scale. Oecologia 108, 583–595. doi: 10.1007/BF00329030
Chen T., Feng Z., Zhao H., Wu K. (2020). Identification of ecosystem service bundles and driving factors in Beijing and its surrounding areas. Sci. Total Environ. 711134687. doi: 10.1016/j.scitotenv.2019.134687
Chen F., Li H., Zhang A. (2019). Ecological risk assessment based on terrestrial ecosystem services in China. Acta Geogr. Sin. 74, 432–445. doi: 10.11821/dlxb201903003
Chung M. G., Frank K. A., Pokhrel Y., Dietz T., Liu J. (2021). Natural infrastructure in sustaining global urban freshwater ecosystem services. Nat. Sustain 4, 1068–1075. doi: 10.1038/s41893-021-00786-4
Costanza R., De Groot R., Sutton P., van der Ploeg S., Anderson S. J., Kubiszewski I., et al. (2014). Changes in the global value of ecosystem services. Global Environ. Change 26, 152–158. doi: 10.1016/j.gloenvcha.2014.04.002
Ding Y., Wang L. Z., Gui F., Zhao S., Zhu W. Y. (2023). Ecosystem carbon storage in Hangzhou bay area based on inVEST and PLUS models. Environ. Sci. 44, 3343–3352. doi: 10.13227/j.hjkx.202204080
Eger A. M., Marzinelli E. M., Beas-Luna R., Blain C. O., Blamey L. K., Byrnes Jarrett E. K. (2023). The value of ecosystem services in global marine kelp forests. Nat. Commun. 14, 1894. doi: 10.1038/s41467-023-37385-0
Feng X., Li Y., Wang X., Yang J., Yu E., Wang S., et al. (2023). Impacts of land use transitions on ecosystem services: a research framework coupled with structure, function, and dynamics. Sci. Total Environ. 901, 166366. doi: 10.1016/j.scitotenv.2023.166366
Hu S., QIU H., WANG N., Cui Y., Cao M., Wang J., et al. (2021). The influence of terrain on loess landslides in Loess Plateau. Acta Geographica Sin. 76, 2697–2709. doi: 10.11821/dlxb202111008
Huang B., Wu B., Barry M. (2010). Geographically and temporally weighted regression for modeling spatio-temporal variation in house prices. Int. J. geographical Inf. Sci. 24, 383–401. doi: 10.1080/13658810802672469
Huang C., Zhao D., Deng L. (2022). Landscape pattern simulation for ecosystem service value regulation of Three Gorges Reservoir Area, China. Environ. Impact Assess. Rev. 95, 106798. doi: 10.1016/j.eiar.2022.106798
Keith H., Vardon M., Stein J. H., Stein J. L., Lindenmayer D. (2017). Ecosystem accounts define explicit and spatial trade-offs for managing natural resources. Nat. Ecol. Evol. 1, 1683–1692. doi: 10.1038/s41559-017-0309-1
Le Provost, Schenk V., Penone C., Thiele J., Westphal C., Allan C. (2023). The supply of multiple ecosystem services requires biodiversity across spatial scales. Nat. Ecol. Evol. 7, 236–249. doi: 10.1038/s41559-022-01918-5
Li W., Chen X., Zheng J., Zhang F., Yan Y., Hai W., et al. (2024). A multi-scenario simulation and dynamic assessment of the ecosystem service values in key ecological functional areas: A case study of the Sichuan province, China. Land 13, 468. doi: 10.3390/land13040468
Liu T., Yu L., Chen X., Wu H., Lin H., Li C., et al. (2023). Environmental laws and ecological restoration projects enhancing ecosystem services in China: A meta-analysis. J. Environ. Manage. 327, 116810. doi: 10.1016/j.jenvman.2022.116810
Muyi H. U. A. N. G., Wenze Y. U. E., Bin F. A. N. G., Shaoru F. E. N. G. (2019). Scale response characteristics and geographic exploration mechanism of spatial differentiation of ecosystem service values in Dabie Mountain area, central China from 1970 to 2015. Prog. Chem. 74, 1904. doi: 10.11821/dlxb201909015
Pan H., Du Z., Wu Z., Zhang H., Ma K., et al. (2024). Assessing the coupling coordination dynamics between land use intensity and ecosystem services in Shanxi’s coalfields, China. Ecol. Indic. 158, 111321. doi: 10.1016/j.ecolind.2023.111321
Qiu H., Zhang J., Han H., Cheng X., Kang F. (2023). Study on the impact of vegetation change on ecosystem services in the Loess Plateau, China. Ecol. Indic. 154, 110812. doi: 10.1016/j.ecolind.2023.110812
Ran L., Fang N., Wang X., Piao S., Chan C. N., Li S., et al. (2023). “Substantially enhanced landscape carbon sink due to reduced terrestrial-aquatic carbon transfer through soil conservation in the chinese loess plateau,” in Earth's Future. 11, e2023EF002345. doi: 10.1029/2023EF002345
Redhead J. W., Stratford C., Sharps K., Jones L., Ziv G., Clarke D., et al. (2016). Empirical validation of the InVEST water yield ecosystem service model at a national scale. Sci. Total Environ. 569, 1418–1426. doi: 10.1016/j.scitotenv.2016.06.227
Rodríguez J. P., Beard J. T.D., Bennett E. M., Cumming G. S., Cork S. J., Agard J., et al. (2006). Trade-offs across space, time, and ecosystem services. Ecol. Soc. 11 (1), 28. doi: 10.5751/ES-01667-110128
Sharp R., Tallis H. T., Ricketts T., Guerry A. D., Wood S. A., Chaplin-Kramer R., et al. (2015). “InVEST version 3.2. 0 user’s guide,” in The Nature Conservancy, and World Wildlife Fund (Stanford, CA, USA: The Natural Capital Project).
Smith L. M., Case J. L., Smith H. M., Harwell L. C., Summers J. K. (2013). Relating ecoystem services to domains of human well-being: Foundation for a US index. Ecol. Indic. 28, 79–90. doi: 10.1016/j.ecolind.2012.02.032
Su R., Duan C., Chen B. (2024). The shift in the spatiotemporal relationship between supply and demand of ecosystem services and its drivers in China. J. Environ. Manage. 365, 121698. doi: 10.1016/j.jenvman.2024.121698
Sun X., Lu Z., Li F., Crittenden J. C. (2018). Analyzing spatio-temporal changes and trade-offs to support the supply of multiple ecosystem services in BeiKingg, China. Ecol. Indic. 94, 117–129. doi: 10.1016/j.ecolind.2018.06.049
Sun M., Yu G., Chen Z. L., Hao T., Yang M., Zhu X., et al. (2024). Climate-shaped vegetation dominated the spatial pattern of the Bowen ratio over terrestrial ecosystems in China. Agric. For. Meteorology. 344, 2024. doi: 10.1016/j.agrformet.2023.109816
Sun L., Yu H., Sun M. (2023). Yutao Wang,Coupled impacts of climate and land use changes on regional ecosystem services. J. Environ. Manage. 326, 116753. ISSN 0301-4797. doi: 10.1016/j.jenvman.2022.116753
Terrado M., Sabater S., Chaplin-Kramer B., Mandle L., Ziv G., Acuña V. (2016). Model development for the assessment of terrestrial and aquatic habitat quality in conservation planning. Sci. total Environ. 540, 63–70. doi: 10.1016/j.scitotenv.2015.03.064
Tian H. Y., Liu X., Su Z. H. (2024). Spatial and temporal characteristics of food ecological total factor productivity in the Yangtze River economic zone. Chin. J. Ecol. Agric. 32, 344–354. doi: 10.1016/j.ijggc.2017.09.005
Tsai H.-W., Lee Y.-C. (2023). Effects of land use change and crop rotation practices on farmland ecosystem service valuation. Ecol. Indic. 155, 110998. ISSN 1470-160X. doi: 10.1016/j.ecolind.2023.110998
Turner K. G., Odgaard M. V., Bøcher P. K., Dalgaard T., Svenning J. C. (2014). Bundling ecosystem services in Denmark: Trade-offs and synergies in a cultural landscape. Landscape Urban Plann. 125, 89–104. doi: 10.1016/j.landurbplan.2014.02.007
Wang X. M., Liu X. C., Long Y. X., Zhang Y. (2020). Spatial-temporal changes and influencing factors of ecosystem services in Shaoguan City based on improved InVEST. Res. Soil Water Conserv. 27, 381–388. doi: 10.13869/j.cnki.rswc.2020.05.047
Wang S., Cui Z., Lin J., Xie J., Su K. (2022). The coupling relationship between urbanization and ecological resilience in the Pearl River Delta. J. Geogr. Sci. 32, 44–64. doi: 10.11821/dlxb202104013
Xiao Q., Hu D., Xiao Y. (2017). Assessing changes in soil conservation ecosystem services and causal factors in the Three Gorges Reservoir region of China. J. Cleaner Production 163, S172–S180. doi: 10.1016/j.jclepro.2016.09.012
Xie Z., Gao Y., Li C., Zhou J., Zhang T. (2017). Spatial heterogeneity of typical ecosystem services and their relationships in different ecological–functional zones in BeiJing–TianJing–Hebei Region, China. Sustainability 10, 6. doi: 10.3390/su10010006
Xie W., Huang Q., He C., Zhao X. (2018). Projecting the impacts of urban expansion on simultaneous losses of ecosystem services: A case study in BeiJing, China. Ecol. Indic. 84, 183–193. doi: 10.1016/j.ecolind.2017.08.055
Xie G. D., Zhang C. X., Zhang L. M., Chen W. H., Li S. M. (2015). Improvement of the evaluation method for ecosystem service value based on per unit area. J. Nat. Resour 30, 1243. doi: 10.11849/zrzyxb.2015.08.001
Xu Z., Peng J., Dong J., Liu Y., Liu Q., Lyu D., et al. (2022). Spatial correlation between the changes of ecosystem service supply and demand: An ecological zoning approach. Landscape Urban Plann. 217, 104258. doi: 10.1016/j.landurbplan.2021.104258
Xu W., Song J., Long Y., Mao R., Tang B., Li B. (2023). Analysis and simulation of the driving mechanism and ecological effects of land cover change in the Weihe River basin, China. J. Environ. Manage. 344, 118320. doi: 10.1016/j.jenvman.2023.118320
Xue Z., Meng X., Liu B. (2024). Spatiotemporal evolution and driving factors of ecosystem services in the upper Fenhe watershed, China. Ecol. Indic. 160, 111803. ISSN 1470-160X. doi: 10.1016/j.ecolind.2024.111803
Xuemao Z., Binggeng X., Kaichun Z., Junhan L., Chuan Y., Jianyong X., et al. (2024). Mapping ecosystem service clusters and exploring their driving mechanisms in karst peak-cluster depression regions in China. Ecol. Indic. 158, 111524. doi: 10.1016/j.ecolind.2023.111524
Yang F., Jin X., Liu J., Zhang X., Song J., Li Q., et al. (2023). Assessing landscape ecological risk in rapidly urbanized areas from the perspective of spatiotemporal dynamics. Trans. Chin. Soc. Agric. Eng. (Transactions csAE) 39, 253–261. doi: 10.11975/j.issn.1002-6819.202305242
Yu C., Zhou J., Zhang Z. (2024). Exploring the classification of China's ecosystem service networks and their driving factors based on current status and evolutionary trends. Appl. Geogr. 168, 103321. doi: 10.1016/j.apgeog.2024.103321
Zhang B., Li W., Xie. G. (2010). Ecosystem services research in China: progress and perspective. Ecol. Econ. 69, 1389–1395. doi: 10.1016/j.ecolecon.2010.03.009
Zhang Y., Kogure T., Nishizawa O., Xue Z. (2017). Different flow behavior between 1-to-1 displacement and co-injection of CO2 and brine in Berea sandstone: insights from laboratory experiments with X-ray CT imaging. Int. J. Greenhouse Gas Control. 66, 76–84. doi: 10.1016/j.ijggc.2017.09.005
Zhang Z., Wan H., Peng S., Huang L. (2023). Differentiated factors drive the spatial heterogeneity of ecosystem services in Xinjiang Autonomous Region, China. Front. Ecol. Evol. 11, 1168313. doi: 10.3389/fevo.2023.1168313
Zhao W. L., He Z., He J., Zhu L. (2012). Remote sensing estimation for winter wheat yield in Henan based on the MODIS-NDVI data. Geographical Res. 31, 2310–2320. doi: 10.11821/yj2012120018
Zhao X. Q., Shi X. Q., Li Y. H., Li Y. M., Huang P. (2022). Spatio-temporal pattern and functional zoning of ecosystem services in the karst mountainous areas of southeastern Yunnan. Acta Geogr. Sin. 77, 736–756. doi: 10.11821/dlxb202203016
Zhao R., Zhan L., Yao M., Yang L. (2020). A geographically weighted regression model augmented by Geodetector analysis and principal component analysis for the spatial distribution of PM2. 5. Sustain. Cities Soc. 56, 102106. doi: 10.1016/j.scs.2020.102106
Zhou W., Liu G., Pan J., Feng X. (2005). Distribution of available soil water capacity in China. J. Geographical Sci. 15, 3–12. doi: 10.1007/BF02873101
Zhou S., Huang Y., He H., Zhang Z. (2024). Focusing on structural changes and future risks of ecosystems: An opportunity-cost based ecosystem service account for riparian ecosystems and its case study. Ecol. Indic. 158, 111523. doi: 10.1016/j.ecolind.2023.111523
Keywords: ecosystem services, driving mechanisms, geodetector, geographically weighted regression, trade-offs and synergies
Citation: Huang J, Yang S, Zhu W, Lin J, Zhu Y, Ren J, Dai Y and Zhang A (2024) Spatial and temporal characterization of critical ecosystem services in China’s terrestrial area, 2000–2020: trade-off synergies, driving mechanisms and functional zoning. Front. Ecol. Evol. 12:1443683. doi: 10.3389/fevo.2024.1443683
Received: 04 June 2024; Accepted: 08 August 2024;
Published: 30 August 2024.
Edited by:
Pedzisai Kowe, Midlands State University, ZimbabweReviewed by:
Lei Shi, Shandong Jianzhu University, ChinaOshneck Mupepi, Midlands State University, Zimbabwe
Copyright © 2024 Huang, Yang, Zhu, Lin, Zhu, Ren, Dai and Zhang. This is an open-access article distributed under the terms of the Creative Commons Attribution License (CC BY). The use, distribution or reproduction in other forums is permitted, provided the original author(s) and the copyright owner(s) are credited and that the original publication in this journal is cited, in accordance with accepted academic practice. No use, distribution or reproduction is permitted which does not comply with these terms.
*Correspondence: Jinhuang Lin, amhfbGluQGZhZnUuZWR1LmNu