 Qinghai Deng
 Xinming Zhang
 Liping Zhang*
 Xin Shao
95% of researchers rate our articles as excellent or good
Learn more about the work of our research integrity team to safeguard the quality of each article we publish.
Find out more
ORIGINAL RESEARCH article
Front. Ecol. Evol. , 02 July 2024
Sec. Conservation and Restoration Ecology
Volume 12 - 2024 | https://doi.org/10.3389/fevo.2024.1423234
This article is part of the Research Topic Coastal Wetlands: Conservation and Ecosystem Services View all articles
Introduction: This study aims to investigate the impact of human activities on the evolution of coastal wetlands in the Liaohe River Delta. Understanding these impacts is crucial for the management, protection, and sustainable development of the ecological environment in the region.
Methods: Quantitative analysis of the evolution of coastal wetlands along the Liaohe River from 1995 to 2020 using Landsat series remote sensing images. This study examines the changes in different landscapes and explores the impact of human activities on wetlands through methods such as land transfer matrix, landscape pattern index, and human activity hotspots.
Results: The results show that the area of coastal wetlands in the Liaohe River Delta exhibited a fluctuating downward trend from 1995 to 2020. The eastern and western parts of the delta experienced greater disturbance to wetland landscapes due to human activities, while the northern and southern parts were mostly waters and reed lands with a smaller degree of human disturbance. Human activities have led to significant changes in farmland, ponds, rice paddies, construction land, and reed fields, thereby promoting the evolution of coastal wetlands.
Discussion: This article discusses the characteristics of landscape pattern evolution in the study area, as well as the impact of human interference, economy, policies, and other factors on it, and compares it with the evolution patterns of other coastal wetlands in China. The changes in the landscape pattern of the study area are mainly reflected in the reduction and fragmentation of natural wetland areas, which are closely related to human activities, especially the development of construction and agriculture. The main economic manifestation is that the increase in land demand due to economic and urban development has led to the transformation of natural wetlands into construction land and other artificial landscapes. The implementation of regulations such as the Wetland Protection Law has contributed to the rational use and ecological restoration of wetlands, and also reflects the influence of policy factors. Compared with other studies, coastal wetlands in China generally face issues of degradation and loss, mainly caused by human activities, but also affected by natural factors such as rising sea levels, changes in coastlines, and climate change.
The coastal wetland ecosystem is located in the transition zone between land and sea and includes salt marshes, mudflats, mangroves, swamps, etc. It is one of the most diverse and valuable ecosystems in the world (Zuo et al., 2020), and coastal wetlands also have various functions, such as regulating hydrology (Su et al., 2021), regulating climate (Chang et al., 2021), providing habitats for organisms (Ostrowski et al., 2021), and purifying pollutants (Haarstad et al., 2012). As natural carbon sinks, they have a significant impact on global carbon cycling and mitigating climate change, playing an important role in global carbon storage. It is estimated that the carbon storage of coastal wetlands in 2017 was between 10,447–2,506 Mt. But it is also one of the most threatened ecosystems (Feng et al., 2023).
Although China’s coastal wetlands account for only 15% of the total area of wetlands in the country, the coastal area it protects accounts for 40% of the population and more than 60% of the country’s GDP. Since China’s accession to the Convention on Wetlands in 1992, research on coastal wetlands in China has developed rapidly and has successively completed the national coastal wetland survey (Zhang et al., 2005), the study of southern mangrove forests (Jiang et al., 2015), the study of coastal wetlands around the Bohai Sea (Wei et al., 2022), and the development of coastal wetland nature reserves (Hu et al., 2020). Between 1984 and 2011, the area of coastal wetlands in China significantly decreased, and then recovered due to protection and restoration measures. This reflects the effectiveness and rationality of protection and recovery efforts in recent years (Wang et al., 2021). However, research on the microbial communities in coastal wetlands is not yet sufficient, and more attention needs to be paid to the role of these microorganisms in ecosystem processes (Lumibao et al., 2024). In addition, current research may not fully consider the impact of human activities on the evolution of coastal wetlands, especially in terms of long-term impacts on land use change.
The estuarine wetland of the Liaohe River Delta is the largest warm-temperate coastal wetland in Asia, and it has the largest wetland nature reserve in the China-Shuangtai River Estuary (i.e., Liaohe Estuary) National Nature Reserve (Wang and Zhang, 2024). The Liaohe River Delta Marine Economic Zone is one of the most important marine economic zones of China and has great prospects for development.
As an important agricultural base, the Liaohe River Delta’s utilization of paddy fields and drylands contributes significantly to the local economy. However, the shift in land use, especially the shrinking of wetland areas, has negatively affected ecosystem functions and biodiversity. To mitigate wetland degradation, measures such as returning farmland to wetlands have been taken with a view to restoring wetland ecosystems. Nevertheless, ecological restoration projects tend to be small-scale and decentralized, and lack a systematic and holistic approach. Therefore, there is an urgent need to develop more scientific and integrated restoration strategies and measures to achieve comprehensive restoration of wetland ecosystems.
Current research on the Liaohe River Delta focuses on various aspects, such as wetland biological and hydrological connectivity (Chen et al., 2023a, 2023b), the influence of vegetation on climate (Yang et al., 2021), ecological and environmental benefits (Yin et al., 2021), biodiversity evaluation (Yu et al., 2020), the role of wetland soils (Wan et al., 2018), heavy metal pollution (Yan et al., 2018), and crop management (Wang et al., 2017). However, studies incorporating human activities are still limited. The Liaohe River Delta is an important marine economic zone in China, and with population growth and continuous urban development, the scale and number of human activities are increasing, and the impacts on the geologic environment are becoming increasingly serious (Li, 2011); therefore, the importance of analyzing the impacts of human activities on wetland changes in this zone is becoming increasingly prominent, and effective coastal wetland management policies require consistent monitoring programs (Valeria et al., 2021). Therefore, this paper quantitatively analyzed the evolution of coastal wetlands from 1995 to 2020 by combining six periods of remote sensing data of coastal wetlands in the Liaohe River Delta and studied the impacts of human activities on coastal wetlands in the Liaohe River Delta by combining the intensity of human disturbances, the landscape pattern index and other indices, with the aim of providing a basis for the sustainable development of land resources in the Liaohe River Delta region and the rational planning of human activities.
The Liaohe River Delta is located at the confluence of the Liao River and the Daliao River at the mouth of the sea, neighboring the Bohai Sea to the east and the Yellow Sea to the south, with geographic locations of 120.18°~124.32°N and 38.72°~40.35°E, and it is one of the largest coastal deltas in China (Figure 1).
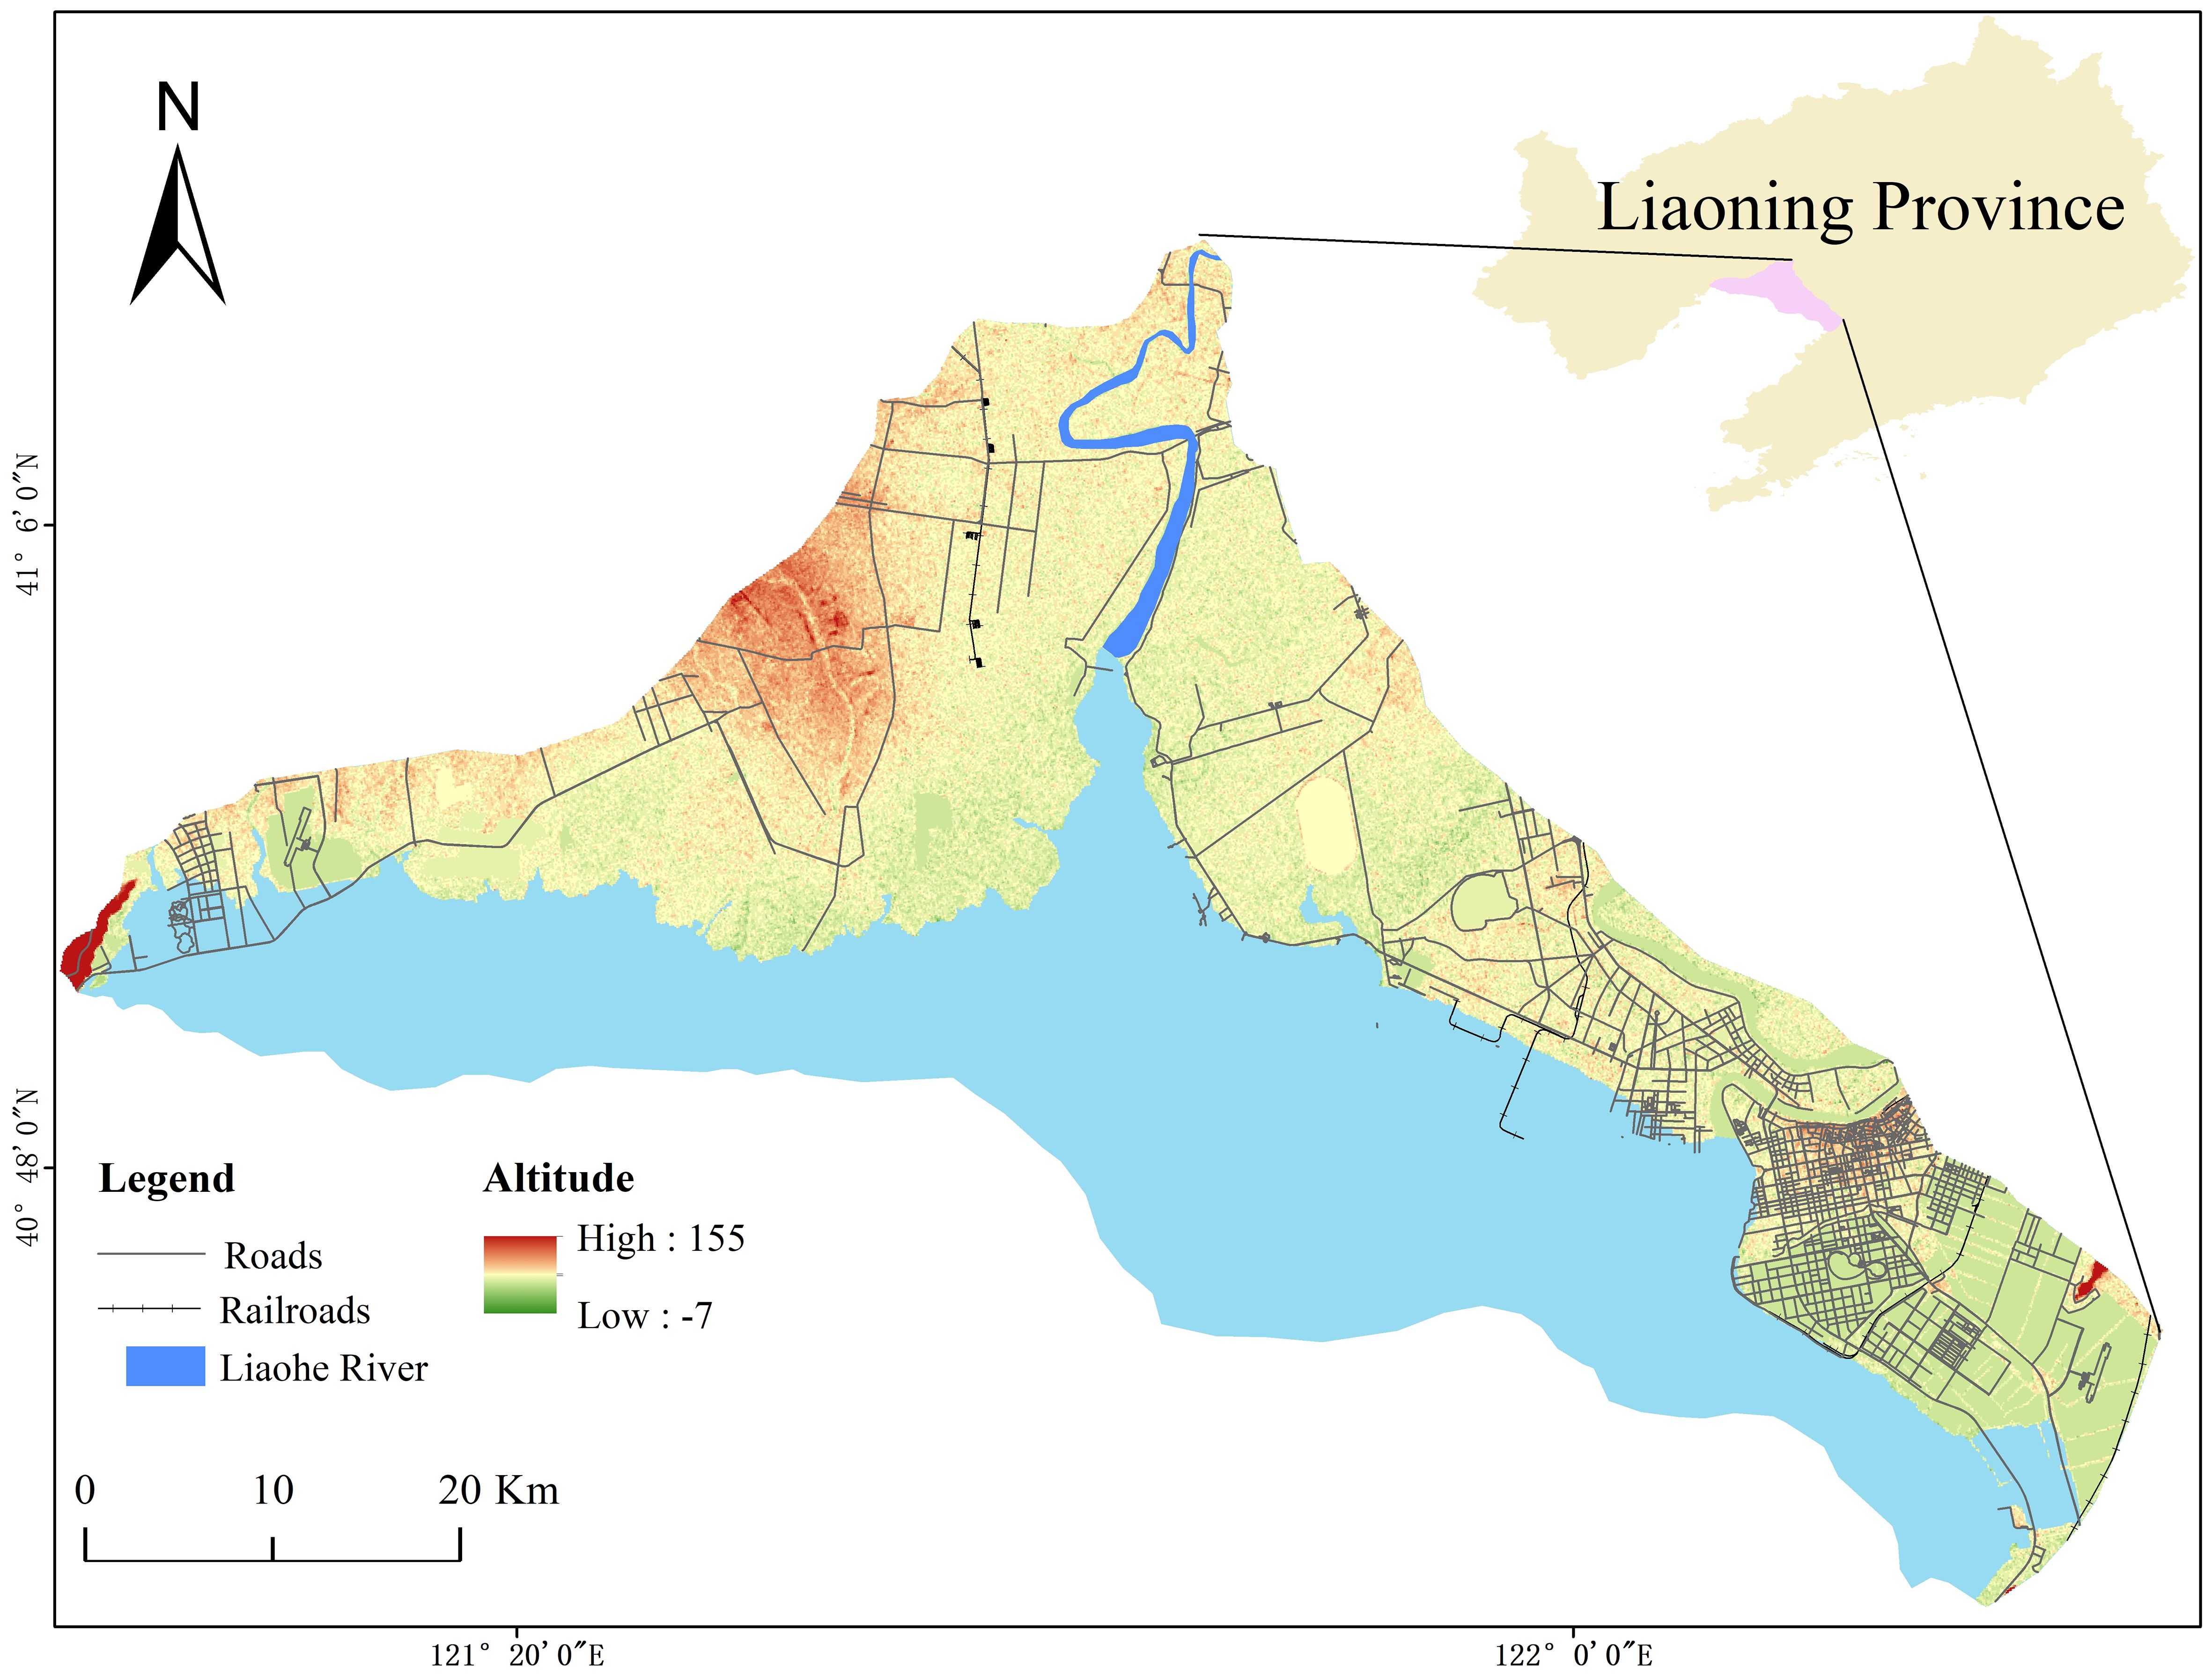
Figure 1 Location map of the study area.
The topography of the Liaohe River Delta is relatively flat, with an average elevation of less than 10 m and a maximum of no more than 20 m. The region has a temperate, semi-moist monsoon climate, with an average annual rainfall of 650 mm and an average annual temperature of 8.5°C. The estuary has a high tidal range and a low tidal range. The tidal range in the estuary averages 3.9 m. There are many breeding ponds in and around the marshes and large areas of paddy fields in the east, and in the north, there are reed beds stretching over hundreds of square kilometers, the largest in the world in terms of area.
In this paper, Landsat sequence images (Table 1) and GMTED 2010 global DEM data downloaded from the Geospatial Data Cloud website (http://www.gscloud.cn/) were used. The cloud cover of all the selected remote sensing images is less than 10%. The utilized remote sensing images were preprocessed via radiometric calibration, atmospheric correction, seamless mosaicing and fine cropping.
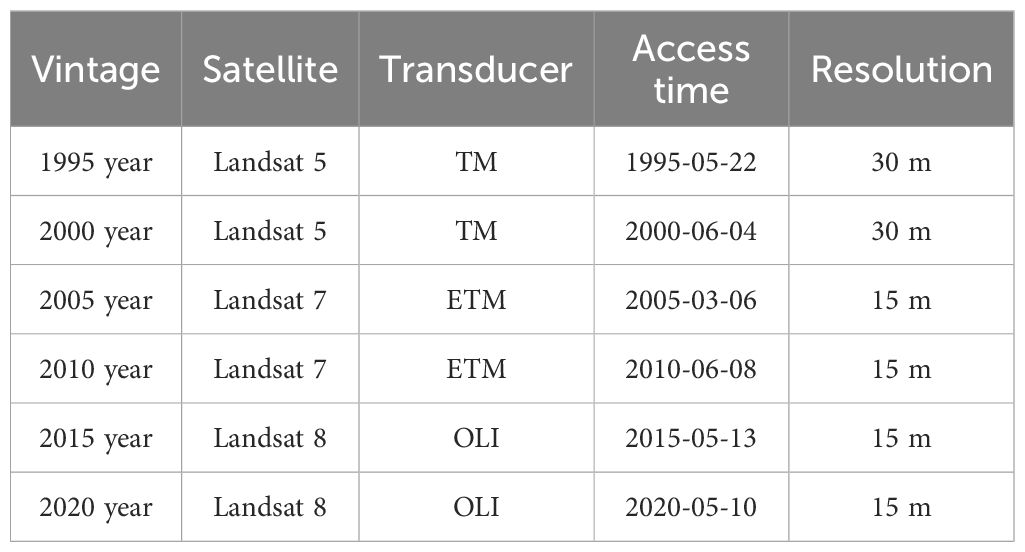
Table 1 Satellite remote sensing image information.
The classification and regression tree (CART) method is based on remote sensing image data and other spatial data and obtains classification rules and classifies remote sensing images through expert experience, simple mathematical statistics and induction methods (Rutkowski et al., 2024). Compared with traditional decision tree classification, CART has more reliable performance and more accurate calculation results.
According to the remote sensing interpretation of land use types in the Liaohe River Delta based on the boundary contours of different feature types, band inversion and Google Earth images, ROI zones were established. Training samples of remote sensing images were obtained, and CART classification decision trees were established based on the CART acquisition rules to obtain the results of land use classification in the study area (Table 2).
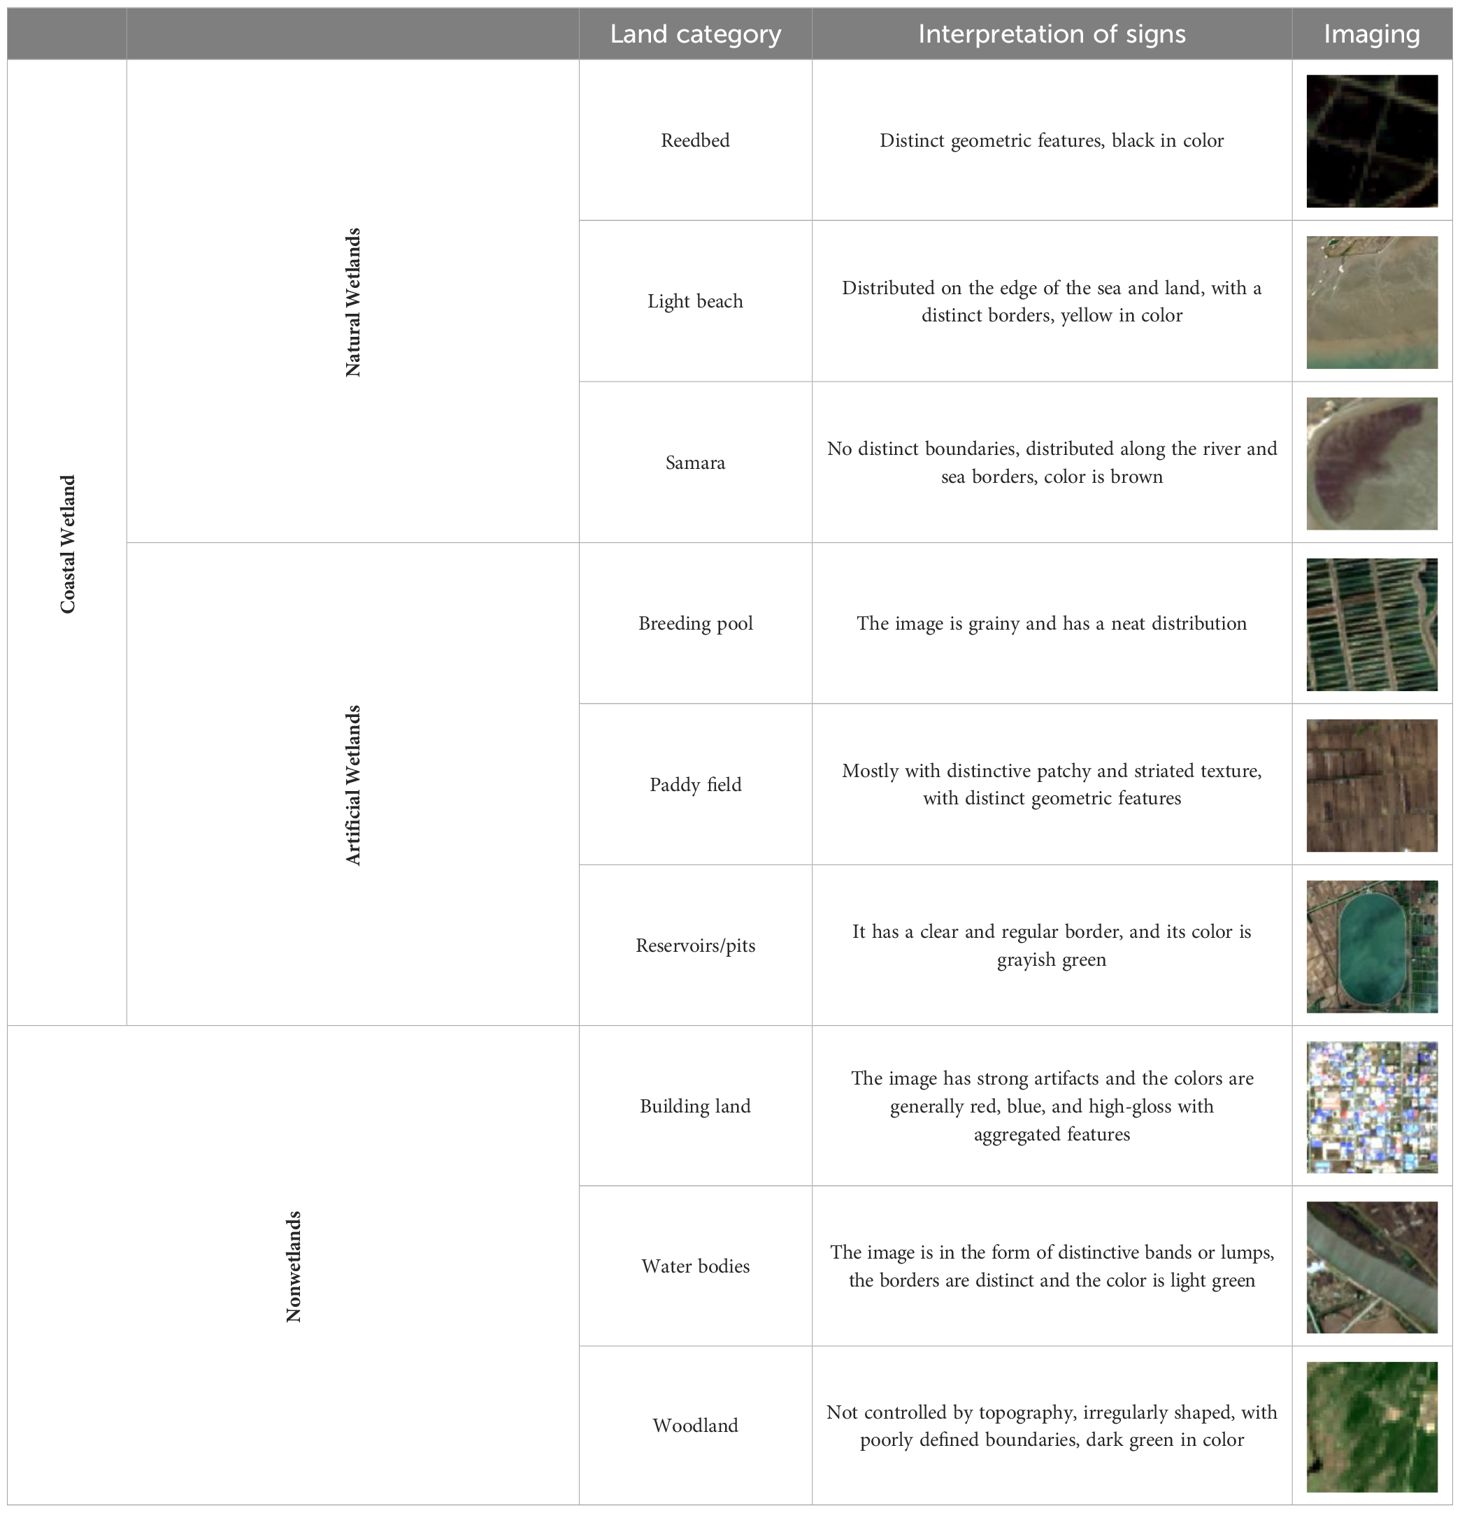
Table 2 Interpretation table of the remote sensing images of the land use types in the Liaohe River Delta.
In this paper, landscape type is land use type, and through remote sensing image interpretation, we are able to identify different land use types within the Liaohe River Delta, and the identification and categorization of these types is the key to understanding the impact of human activities on the evolution of coastal wetlands in the Liaohe River Delta.
A landscape pattern is the spatial arrangement of landscape patches of different sizes, shapes and types. It is the result of the coupling of various human activities and natural factors at different scales (Dou et al., 2023). Landscape pattern indices highly condense landscape pattern information and reflect the basic characteristics of landscape structural composition and spatial configuration (Peng et al., 2020). In this paper, the number of patches (NP), patch density (PD) and maximum patch index (LPI) were selected as the indices to study the evolution of landscape patterns in wetlands, and the percentage of landscape type (PLAND), maximum patch index (LPI), landscape shape index (LSI) and mean plate subdimension number (FRAC_MN) were selected as indices to study the wetland landscape response to anthropogenic gradients (Table 3).
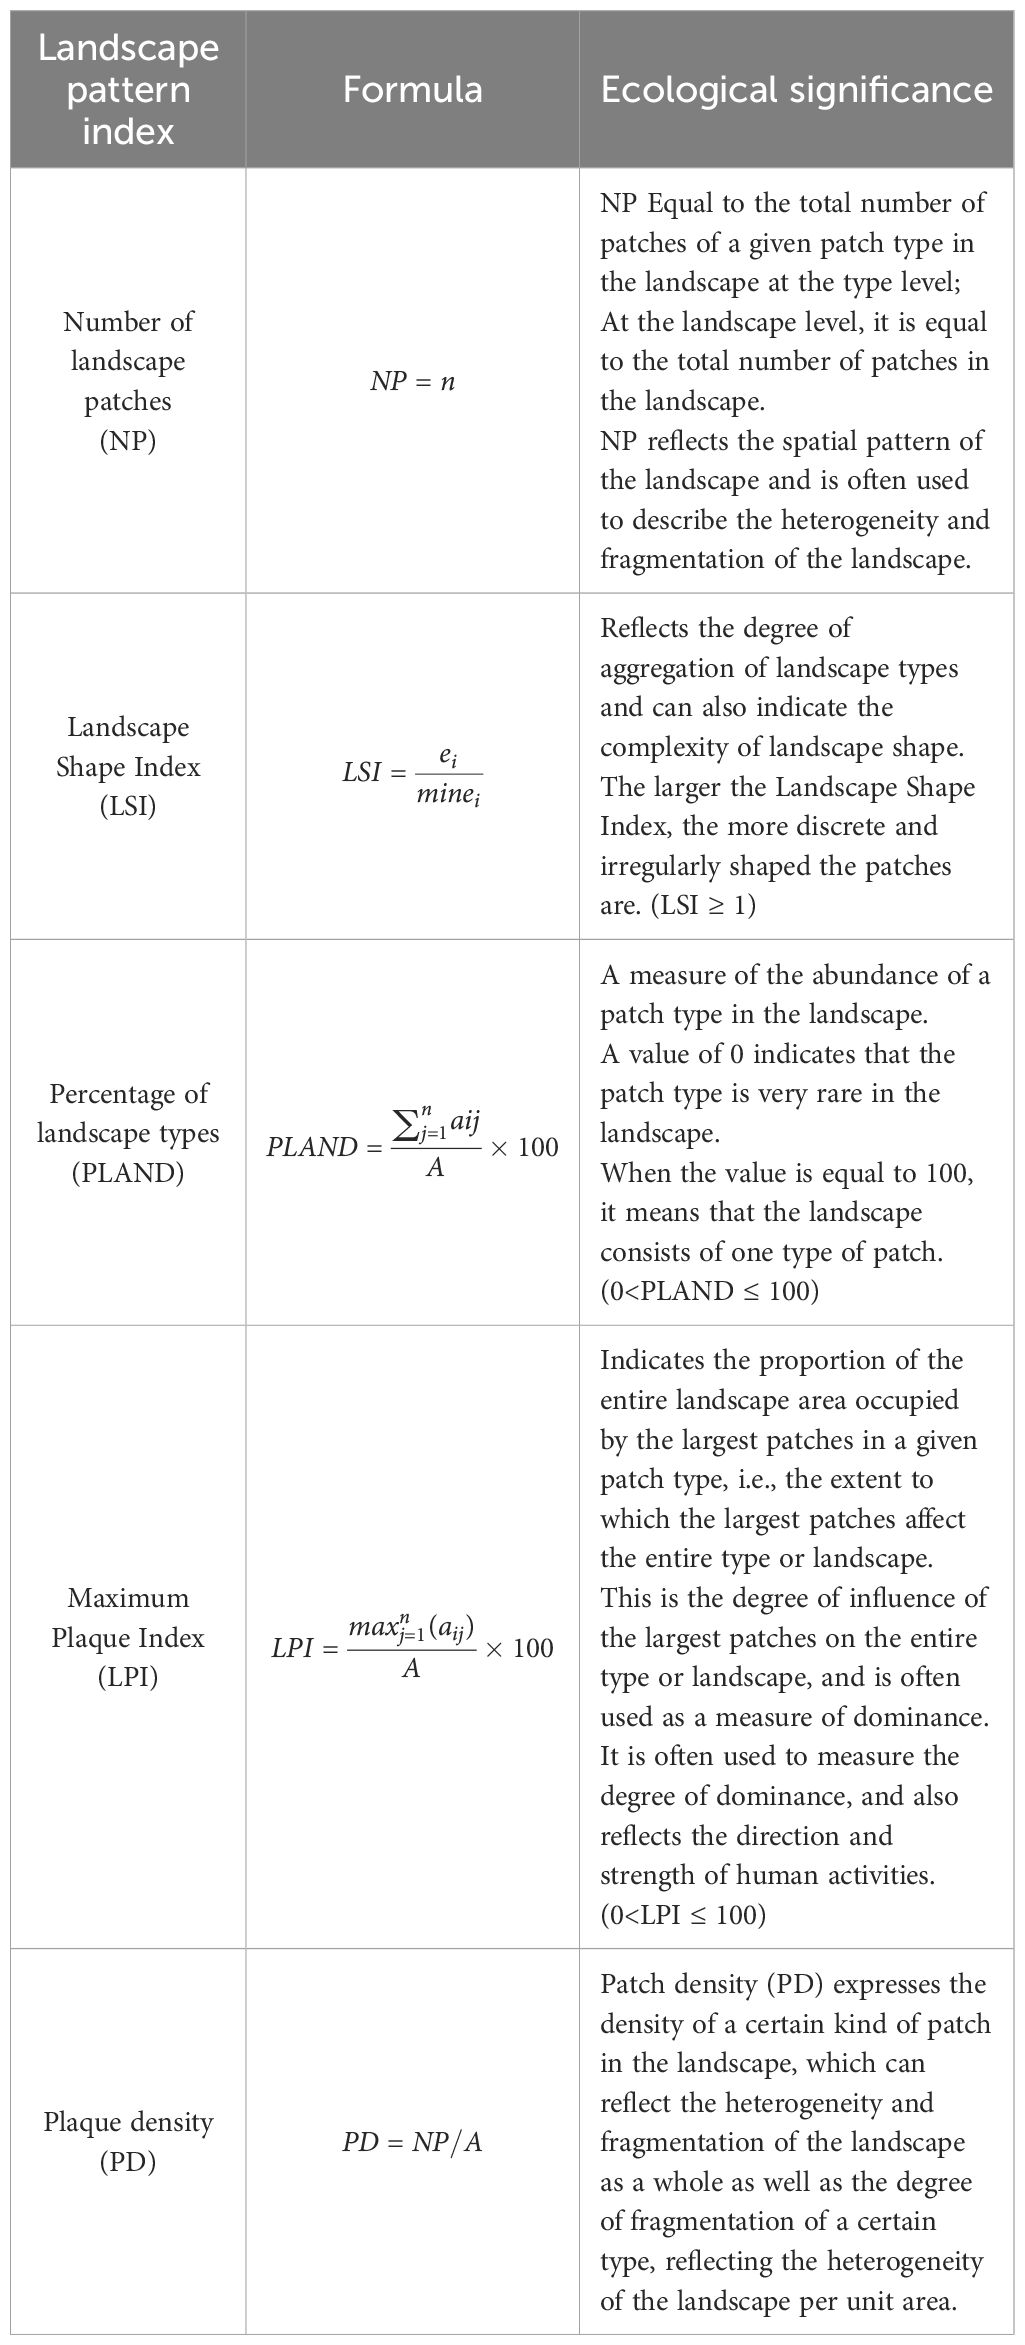
Table 3 Landscape pattern index calculation methods and their ecological implications.
Human disturbance intensity is used to evaluate the degree of impact of human activities on ecosystems (Xu et al., 2016), and human disturbance intensity can be measured by assessing the distribution, arrangement and combination of different landscape types in the landscape and the characteristics of dynamic changes. In this paper, combining the Classification of Land Use Status Quo (GB/T21010–2017) and previous research results (Zhang, 2021; Xie et al., 2022), the nine landscape types that were identified were assigned the disturbance index (Table 4). Using the Create Fishing Net tool in ArcGIS 10.8, a fishing net with 11536 grids was established, each grid was an evaluation unit, the intensity of human interference within each evaluation unit was calculated through Equation 1, and the spatial distribution map of human interference intensity was drawn through the hotspot analysis tool.
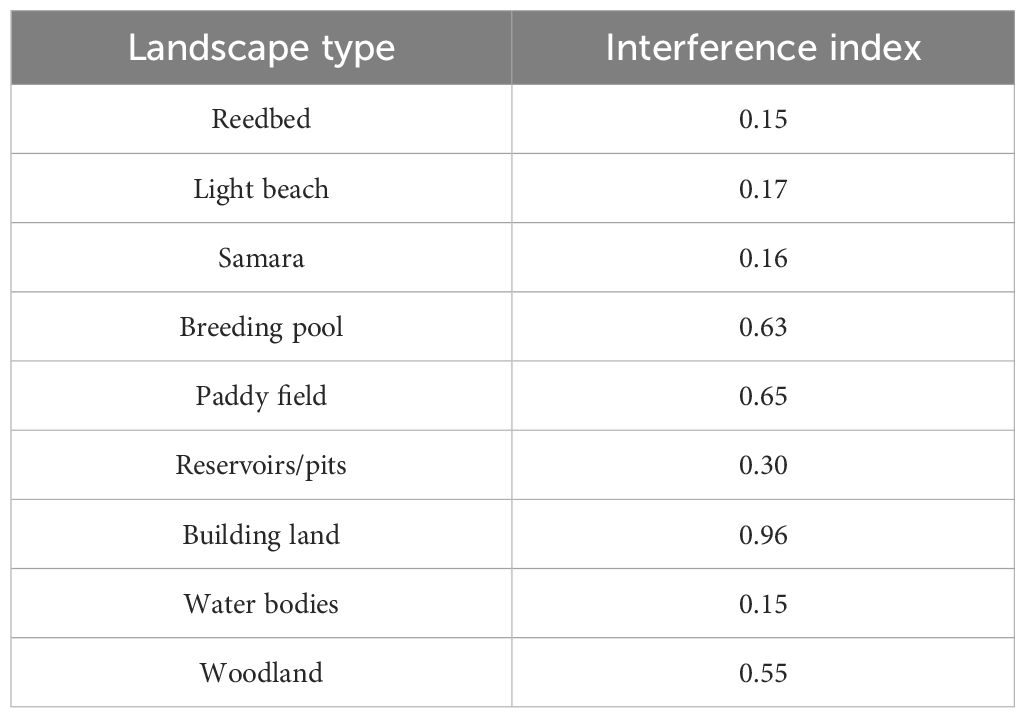
Table 4 Interference index (According to GB/T21010–2017, Xie et al., 2022 and Zhang, 2021).
In Equation 1, M is the intensity of human disturbance, n is the landscape type, h is the disturbance index, and fn is the area share of the landscape type when the landscape type is h.
The high disturbance zone and higher disturbance zone are the main areas where human activities affect the land use type transformation, and the degree of disturbance is categorized into five levels by ArcGIS 10.8 using the natural discontinuity grading method: high disturbance zone (3~2), higher disturbance zone (2~1), medium disturbance zone (1~−1), lower disturbance zone (−1~−2), and low disturbance zone (−2~−3). And export the data of each interference zone and the land use type of each year was analyzed by spatial overlay with the exported hotspot data to obtain the relationship between the correlation between the land use type and human activities. The wetland landscape classification maps of each period were overlaid with five human disturbance intensities, and the landscape type maps of different intensity zones in each period were intercepted and imported into FRAGSTATS 4.2 software to calculate the landscape pattern index.
On the basis of analyzing the characteristics of wetland evolution and the intensity of human activities, the Pearson correlation coefficient model was used to analyze the correlation between human activity indicators and wetland evolution by combining the changes in the area of various types of wetlands and other indicators that may have an impact on human activities. The relationship between the intensity of human disturbances and wetland evolution from a single perspective is relatively one-sided, and GDP growth is usually accompanied by urbanization, industrialization and infrastructure expansion, which may encroach on wetlands through land development. The development of aquaculture, on the other hand, requires watersheds and may enclose wetlands to expand farming areas, with implications for wetland ecology. Population growth leads to rising demand for housing, food and resources, prompting changes in land use patterns, including wetland conversion. Together, these factors pose potential risks to coastal wetlands. So GDP, aquatic products, and population data were introduced to explore the mechanism of the influence of the factors that are dominated by human activities and supplemented by social conditions on the evolution of coastal wetlands, and the calculation formula is as follows:
In Equation 2, is the correlation coefficient between variables x and y; h x and h y are the wetland area and impact factors in year h, respectively; and denote the mean value of the wetland area and the mean value of the impact factor data in the corresponding years, respectively; i is a yearly variable; and n is the number of years.
In 1995, breeding ponds and paddy fields were the main types of artificial wetlands, accounting for 67.67% and 30.52%, respectively, of the artificial wetlands, and reed fields and light beaches were the main types of natural wetlands, accounting for 65.10% and 33.86%, respectively, of the natural wetlands. In 2020, breeding ponds and paddy fields accounted for 74.38% and 22.70%, respectively, of the artificial wetlands, and reed fields and light beaches accounted for 54.45% and 39.85%, respectively, of the natural wetlands. Overall, 54.45% and 39.85% of the wetlands are natural wetlands, respectively. From 1995 to 2020, the area of reed land in natural wetlands decreased substantially, and the area of light beach increased and fluctuated, but there was a large range of changes in each period. The area of breeding ponds in artificial wetlands increased and fluctuated, and paddy fields tended to increase first and then decrease. Waters and light beaches in nonwetlands showed the opposite trend, and the area of constructed land increased substantially (Figure 2). From 1995 to 2015, due to the substantial increase in the area of construction land in the Liaohe River Delta, a large area of coastal wetlands was transformed into nonwetlands dominated by construction land, and the area of coastal wetlands in the Liaohe River Delta generally decreased from 1,882.00 km2 to 1,618.37 km2. The proportion of natural wetlands decreased from 56.51% to 44.40%, and the proportion of manmade wetlands increased from 43.49% to 55%. The proportion of natural wetlands decreased from 56.51% to 44.40%, and the proportion of artificial wetlands increased from 43.49% to 55.60%, which indicates that the Liaohe River Delta coastal wetland was greatly disturbed by human activities and that the proportion of artificial wetlands expanded gradually. In 2020, the proportion of natural wetlands in the coastal wetlands of the Liaohe River Delta increased significantly, accounting for 55.26%, and the proportion of artificial wetlands decreased to 44.74% (Figure 3).
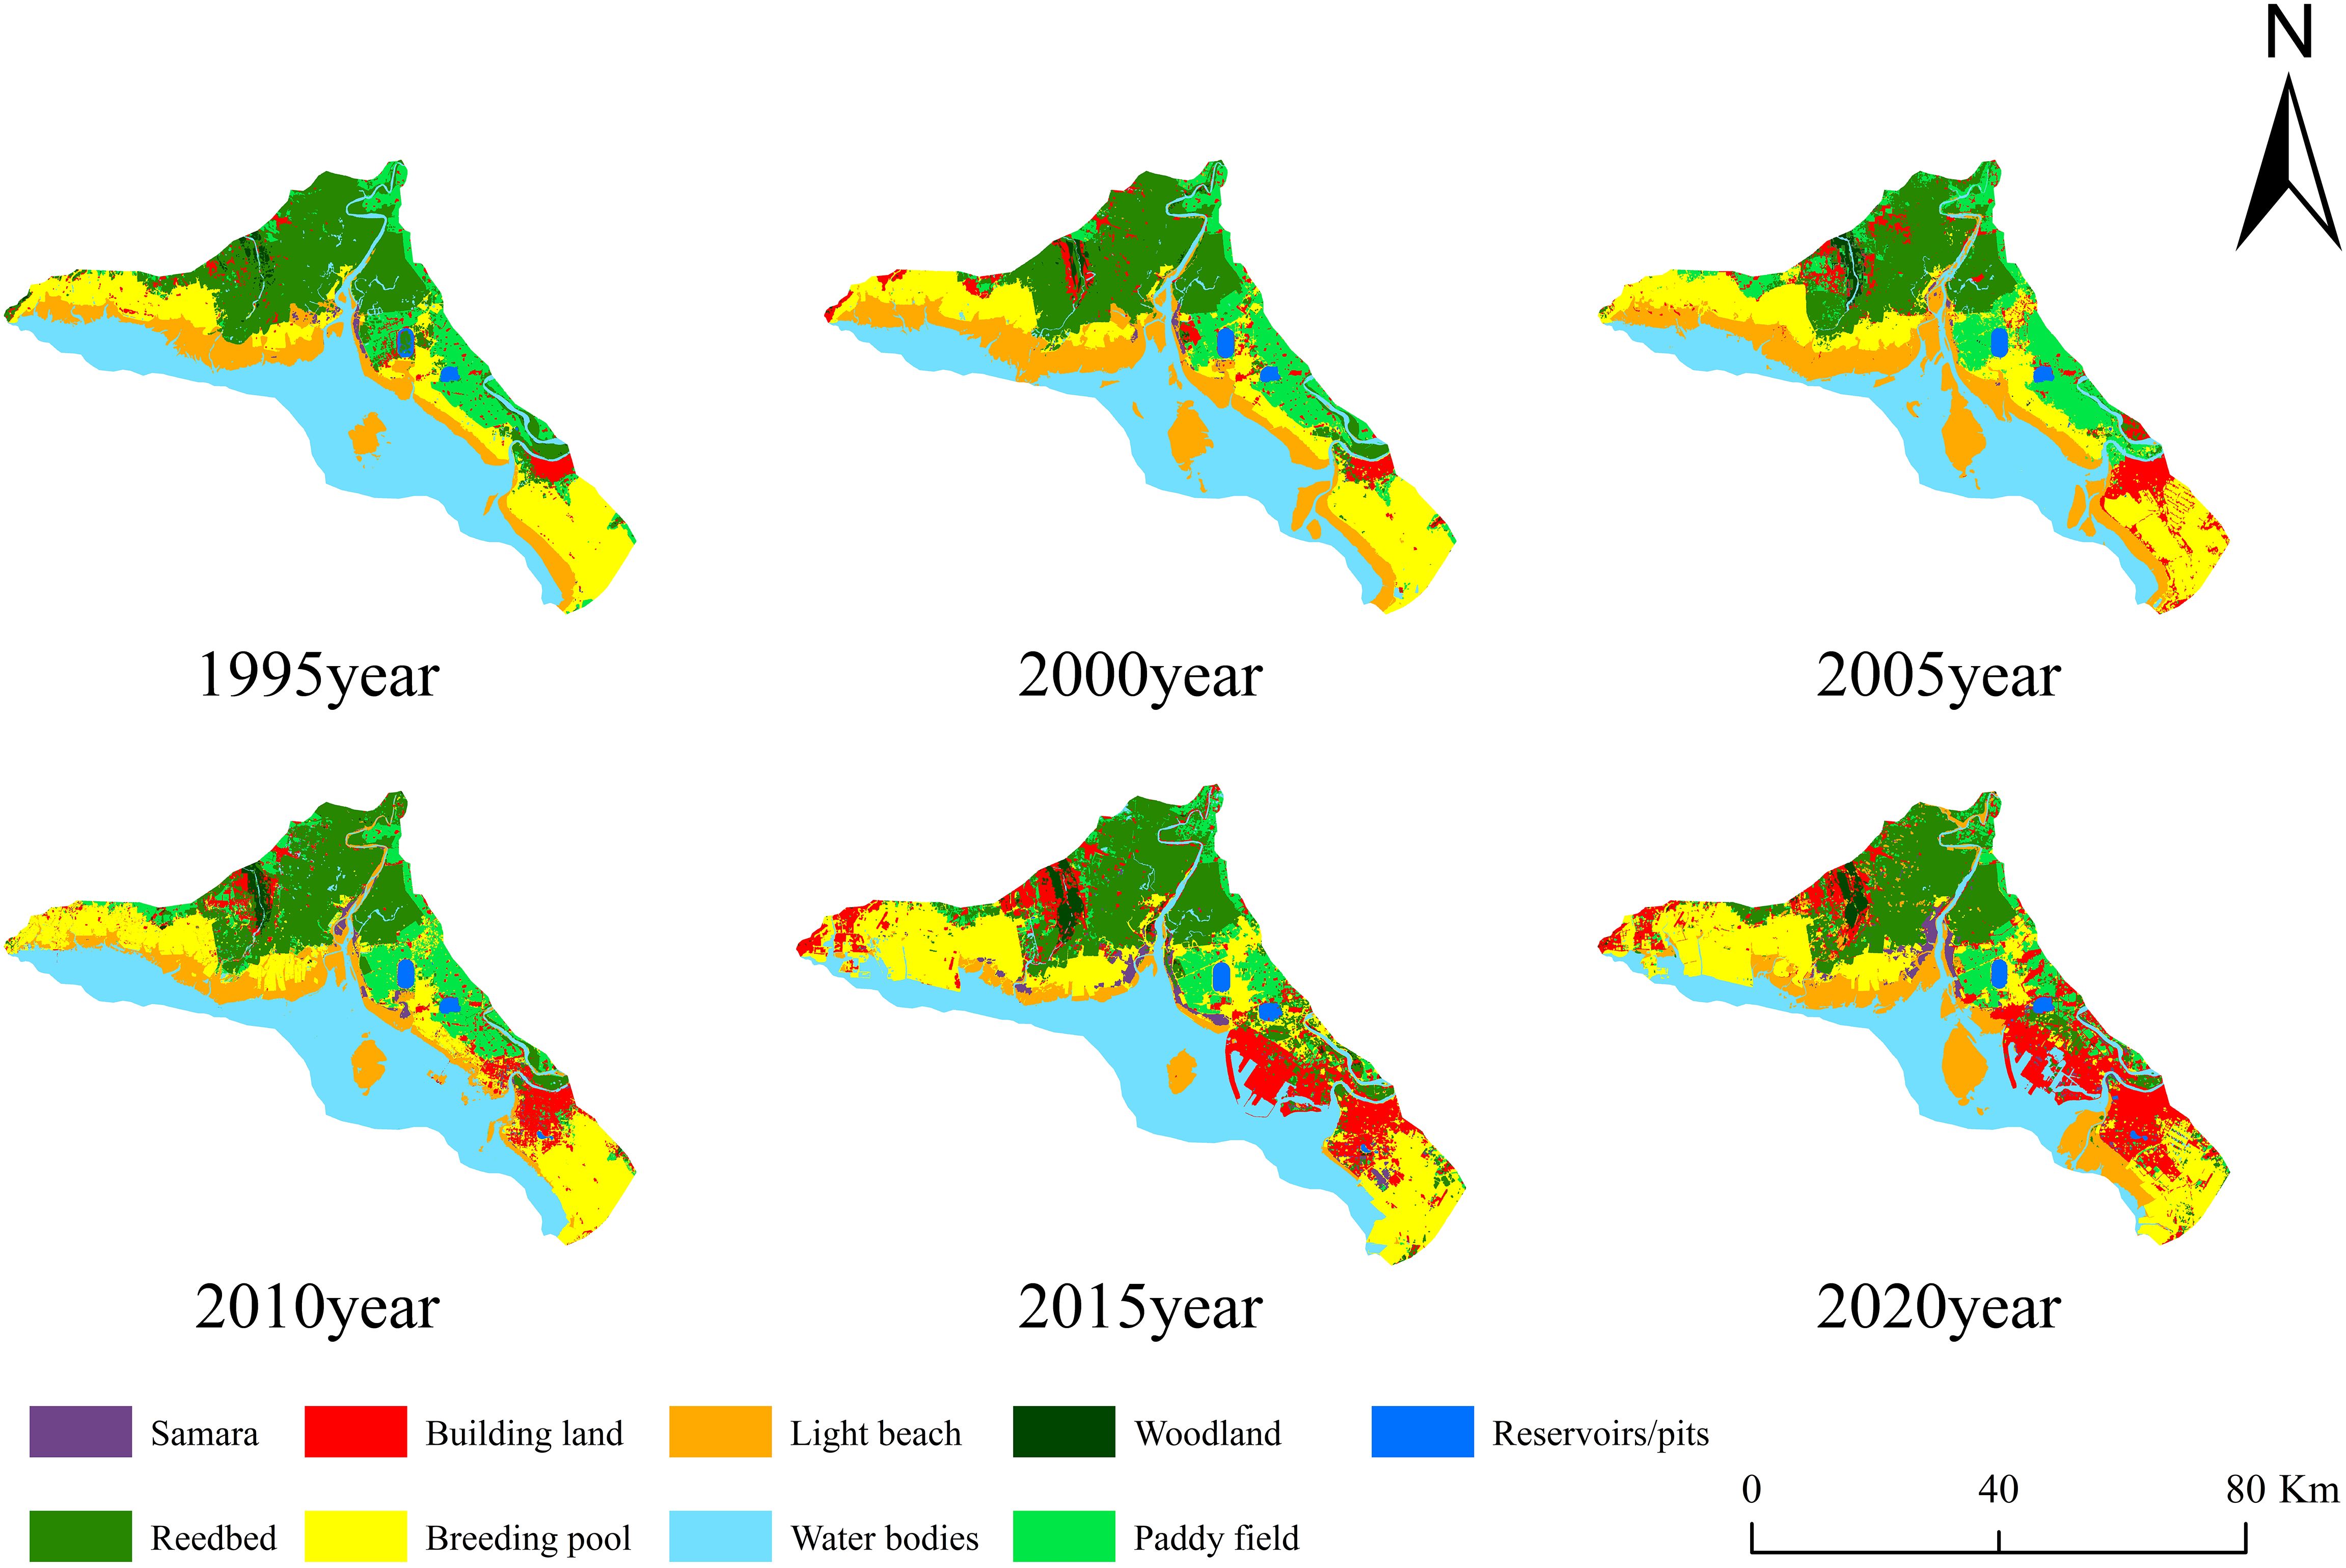
Figure 2 Map of the land-use types in the Liaohe River Delta for the six time periods.
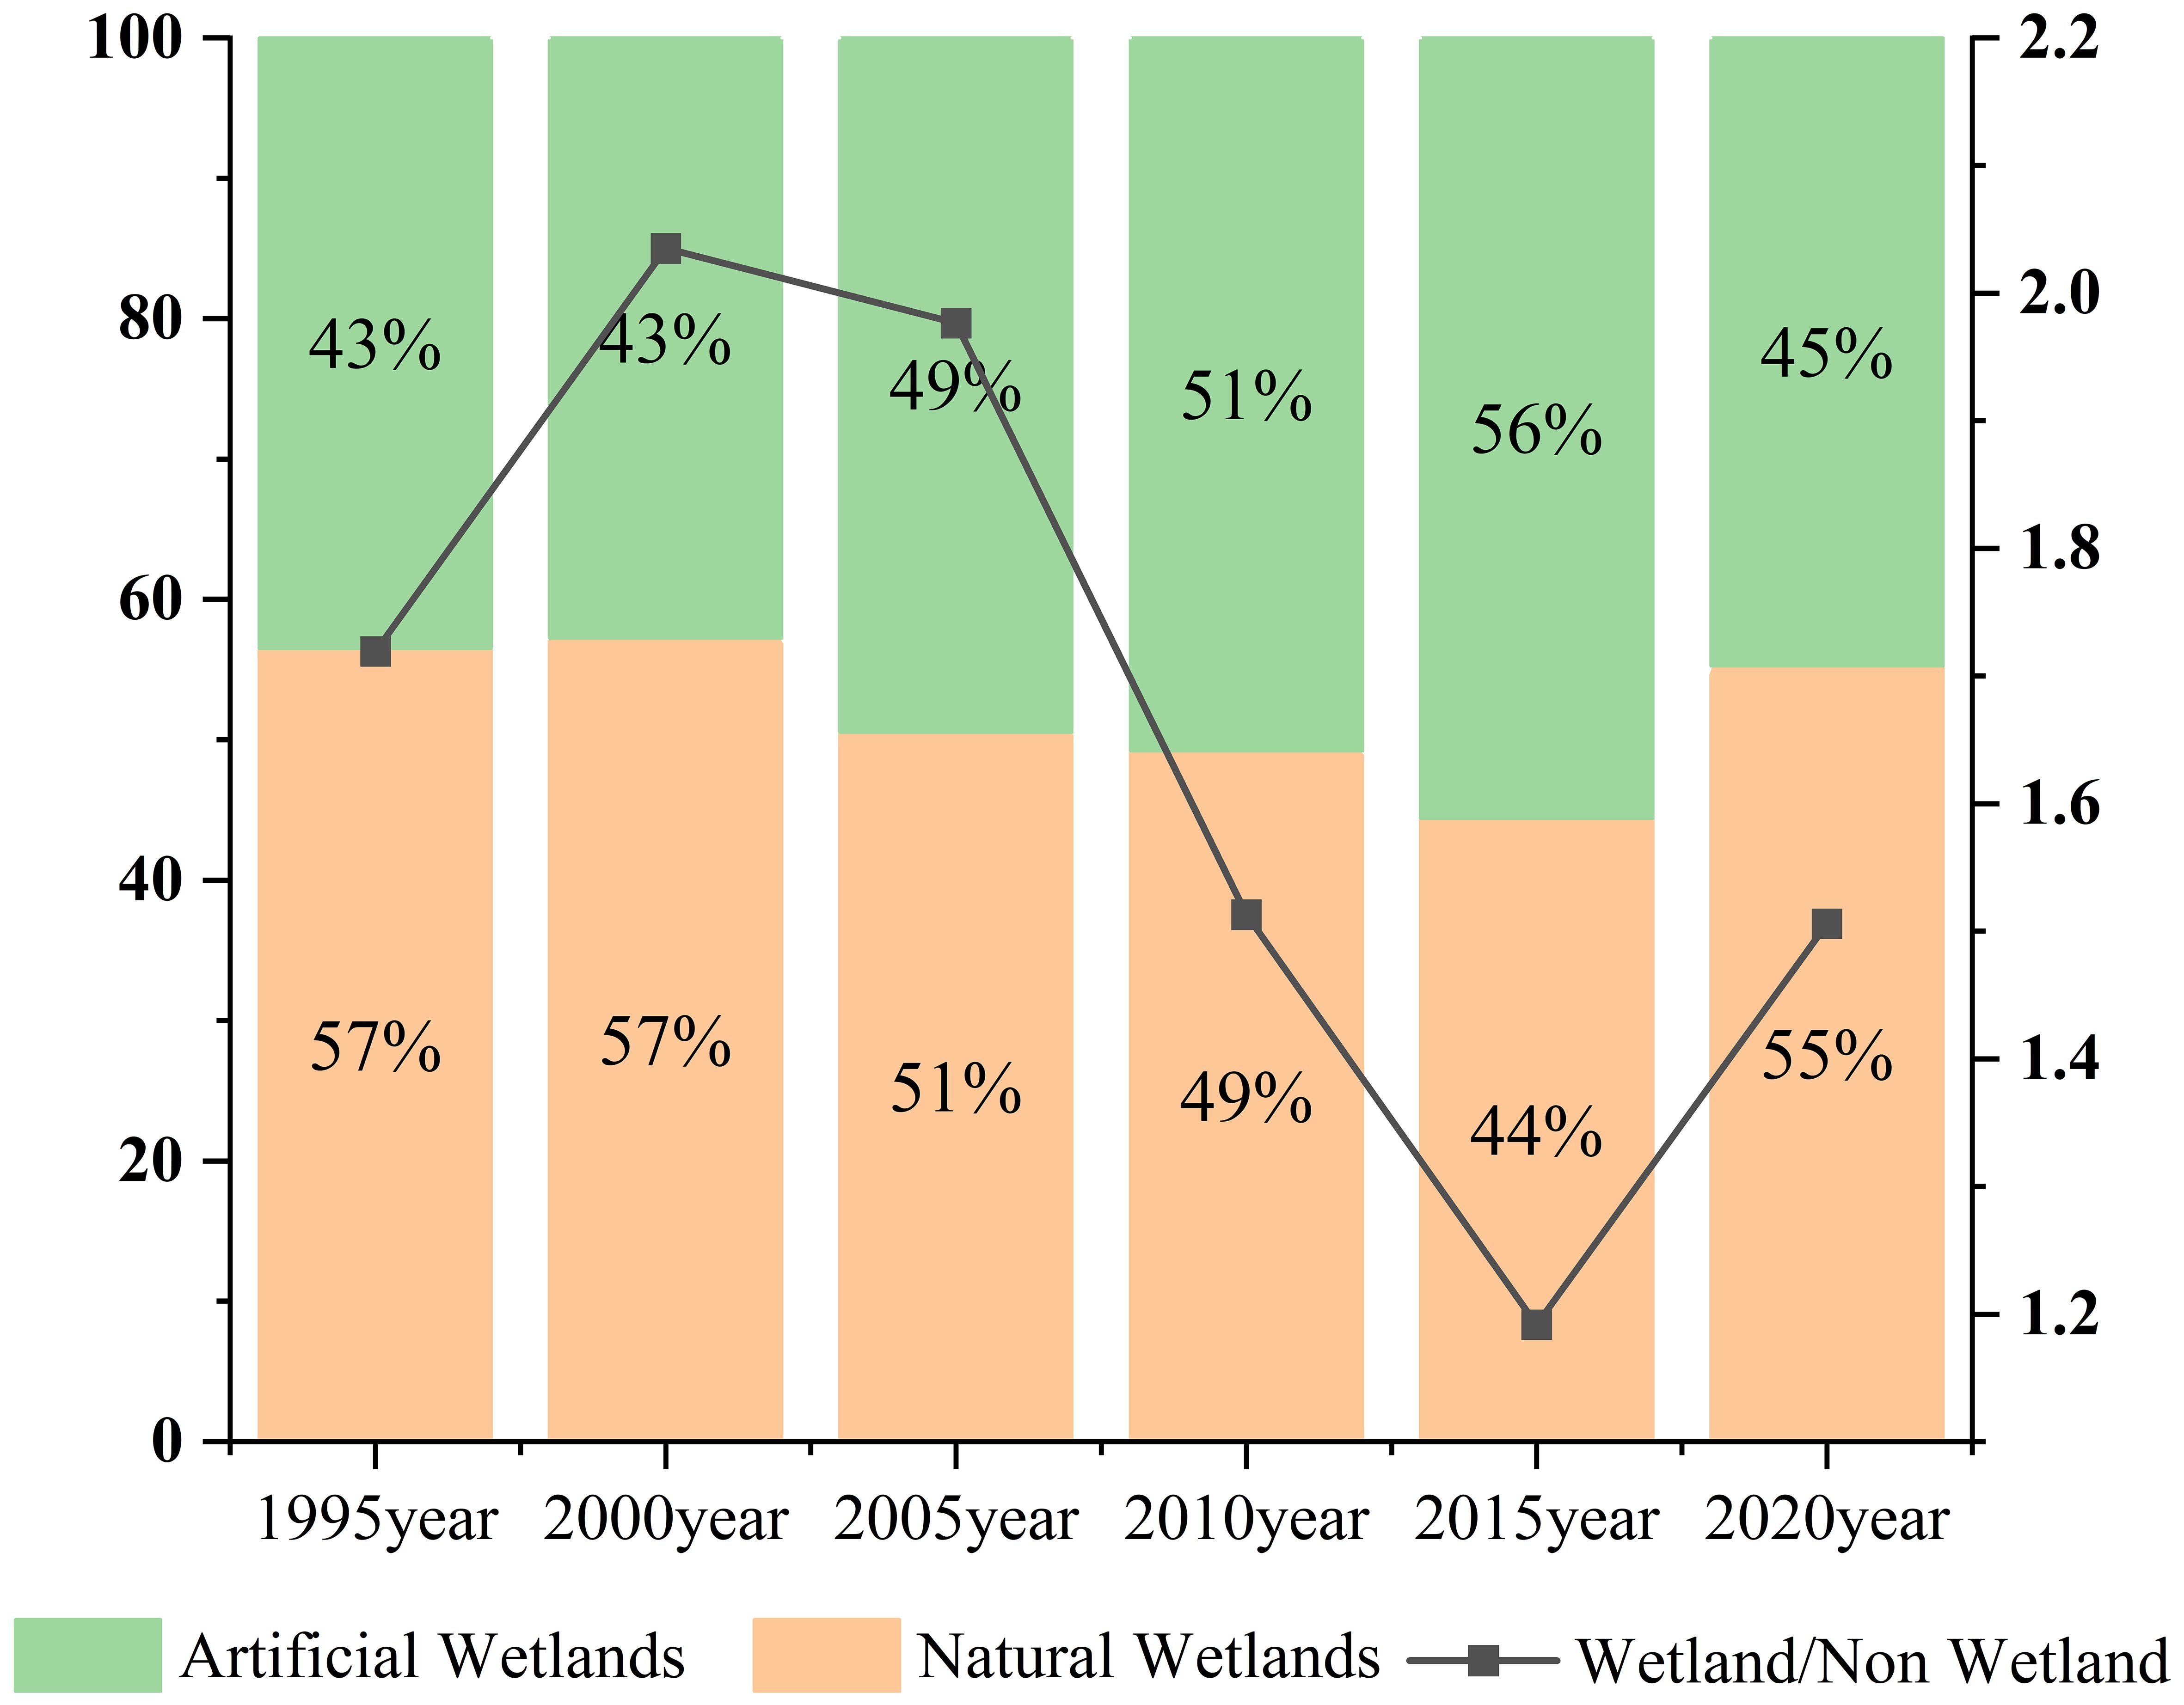
Figure 3 The proportion of natural and artificial wetlands and the proportion of wetlands and non wetlands in each period.
During the period from 1995 to 2020, the patch density of each landscape type of coastal wetlands in the Liaohe River Delta basically showed different degrees of growth, among which the patch density of paddy fields increased the most, from 0.60/km2 in 1995 to 2.66/km2, an increase of 2.06/km2; the patch density of winged alkali poncho showed an upward and then downward trend, from 4.7/km2 in 1995 to 16.22/km2 in 2005, and then decreased to 4.49/km2 by 2020, compared with 1995, which also decreased by 0.21/km2. The density of the winged alkali pontic patches increased and then decreased, from 4.7 patches/km2 in 1995 to 16.22 patches/km2 in 2005, and then decreased to 4.49 patches/km2 in 2020, which was a decrease of 0.21 patches/km2 compared with that in 1995 (Figure 4A).
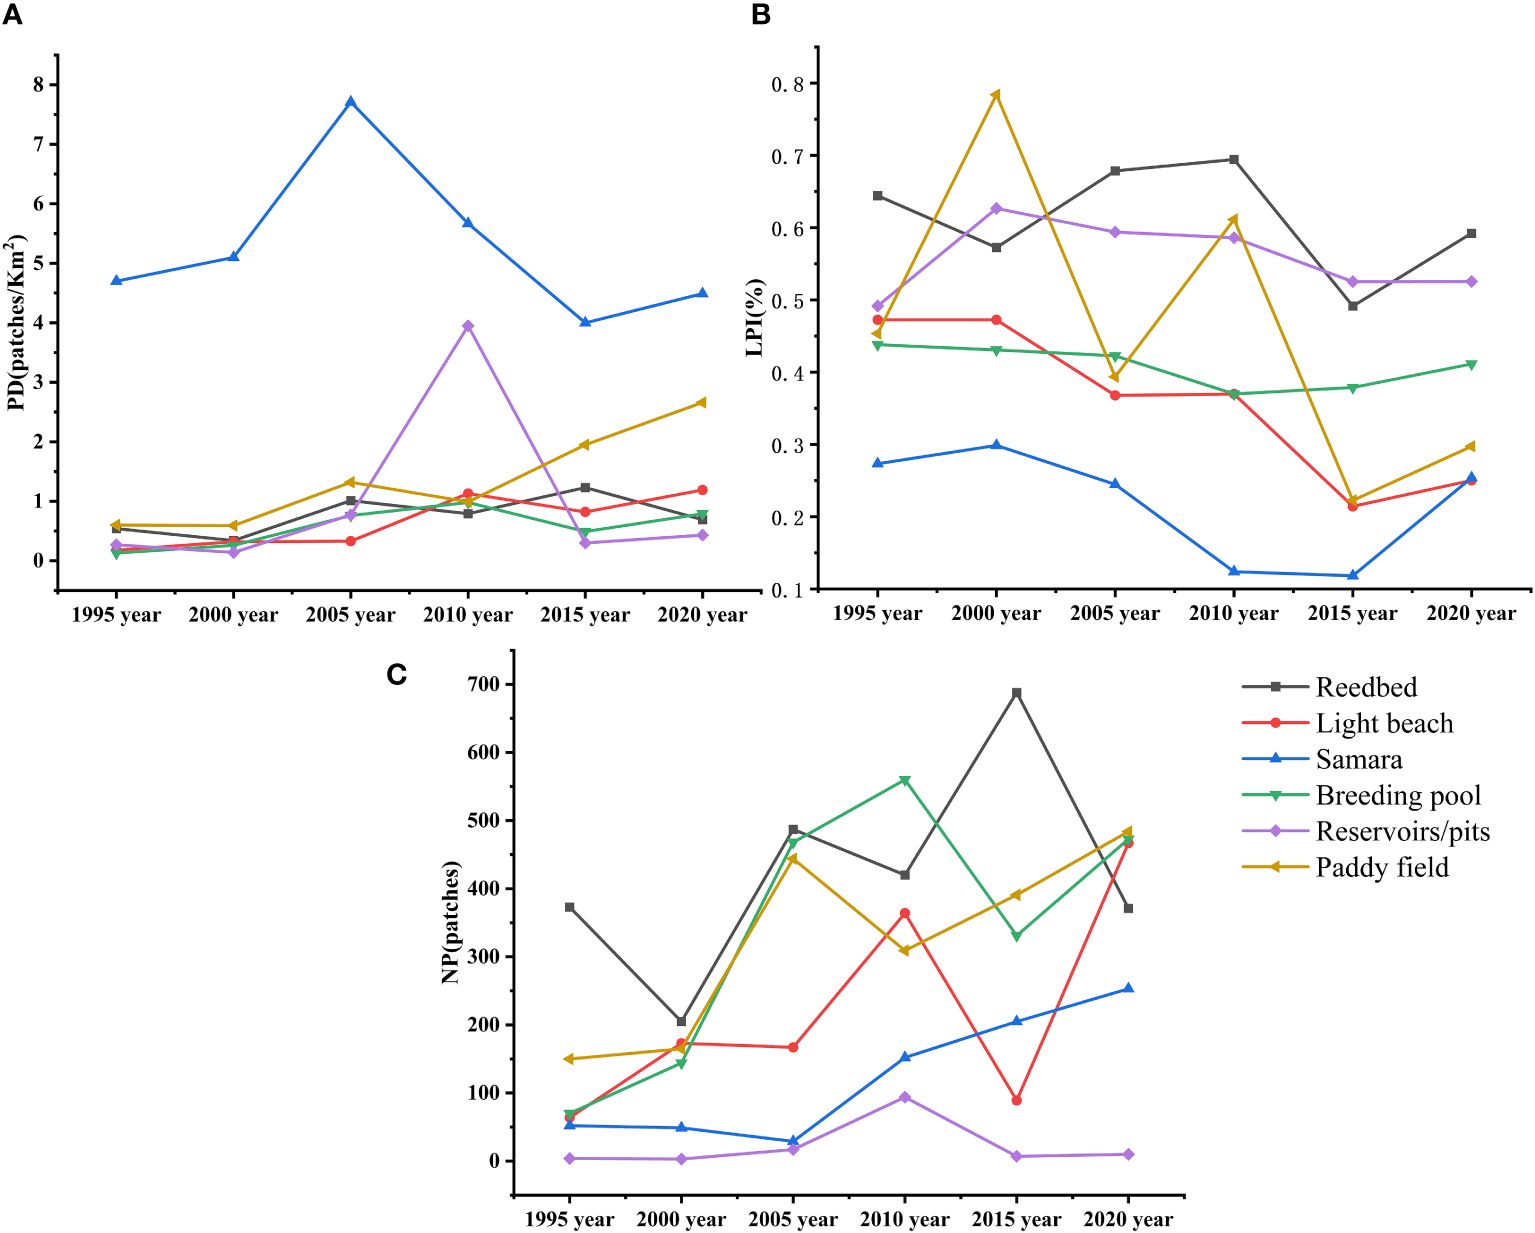
Figure 4 Changes in the landscape indices of coastal wetlands: (A) is the patch density (PD) in the landscape pattern of coastal wetlands in the Liaohe River Delta from 1995 to 2020; (B) is the maximum patch index (LPI); (C) is the number of patches (NP).
During the period from 1995 to 2020, reed fields, breeding ponds and reservoir ponds remained on a large scale, indicating that their landscape aggregation was high and that the overall change was not significant; the maximum landscape indices of light beach and wing alkali flats were relatively small, indicating that they tended to be decentralized in general, and the overall change was obvious (Figure 4B).
The numbers of wetland patches in the six periods between 1995 and 2020 were 1,383, 1,310, 2,448, 2,487, 2,636 and 2,620, respectively. The overall fluctuations increased, of which the light beach and breeding pond experienced large changes and the greatest increase in number; both increased by 403 patches by 2020, with increases of 629.69% and 575.71%, respectively. Compared to the final change, the amount of reed land did not increase, but fluctuations during the period were large, and the greatest number of 688 patches was reached in 2015 (Figure 4C).
From 1995 to 2000, among the coastal wetlands, 393.54 km2 of natural wetlands were converted into artificial wetlands and nonwetlands, mainly into aquaculture ponds (147.33 km2) and construction land (149.64 km2), and 318.44 km2 of artificial wetlands and nonwetlands were converted into natural wetlands, of which the largest area was water (216.45 km2); 317.13 km2 of artificial wetlands were converted into natural wetlands and nonwetlands, mainly into reedbeds (71.47 km2) and construction land (214.71 km2). The largest area was watershed (216.45 km2); 317.13 km2 of artificial wetlands were converted into natural wetlands and nonwetlands, mainly into reed land (71.47 km2) and construction land (214.71 km2); and 299.43 km2 of natural wetlands and nonwetlands were converted into artificial wetlands, of which the largest area was light beach (117.86 km2) (Table 5).
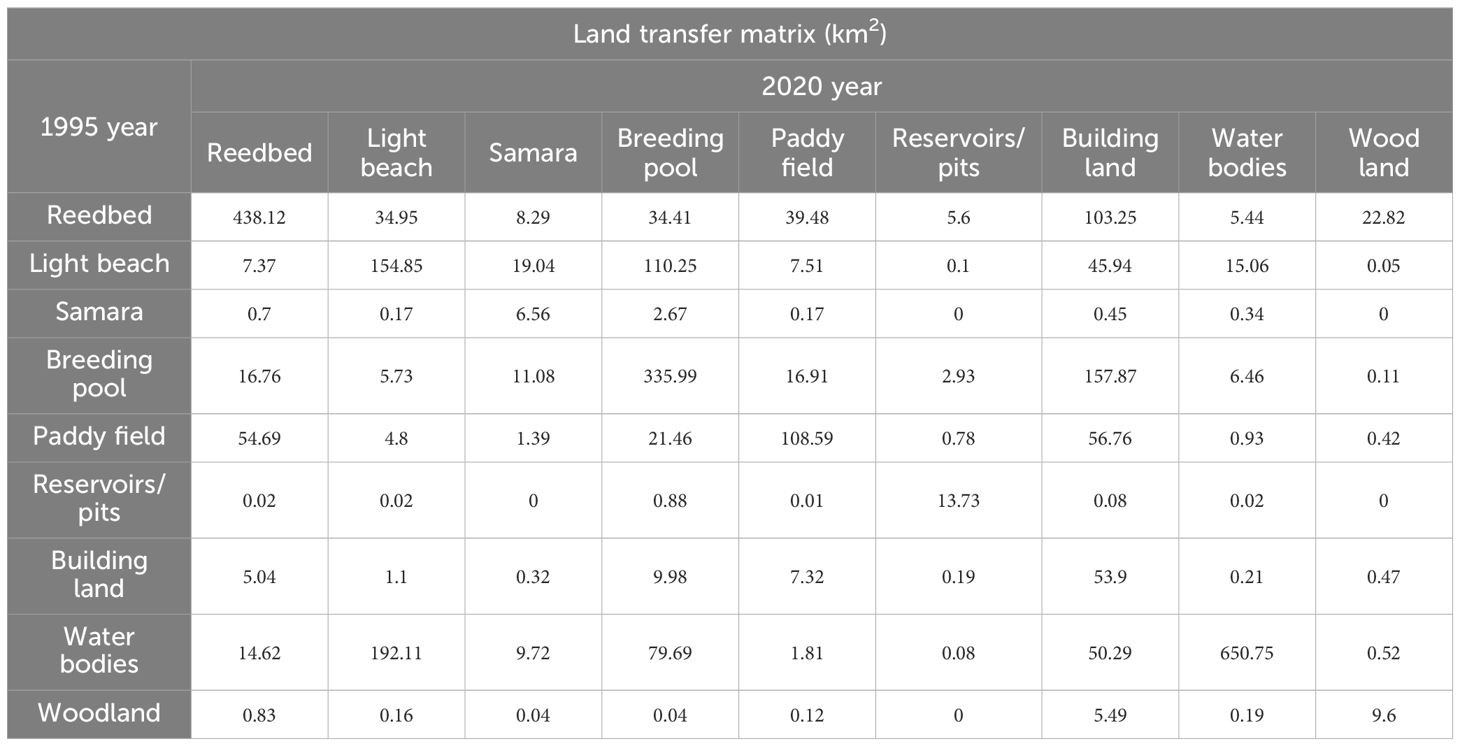
Table 5 The land transfer matrix 1995–2020.
During the period from 1995 to 2000, the coastal wetlands in the Liaohe River Delta generally remained relatively stable. However, due to economic development and construction demands, in the northwestern part of the region, some reed lands and other wetlands were converted to different land use types, such as built-up land, resulting in a large reduction in wetlands. During the period from 2005 to 2010, on the other hand, the wetlands in general remained relatively stable, but natural wetlands such as light beaches, alkali ponies and reed fields mainly formed in the northern part of the region, leading to an increase in the area of wetlands in the northern part of the region (Figure 5).
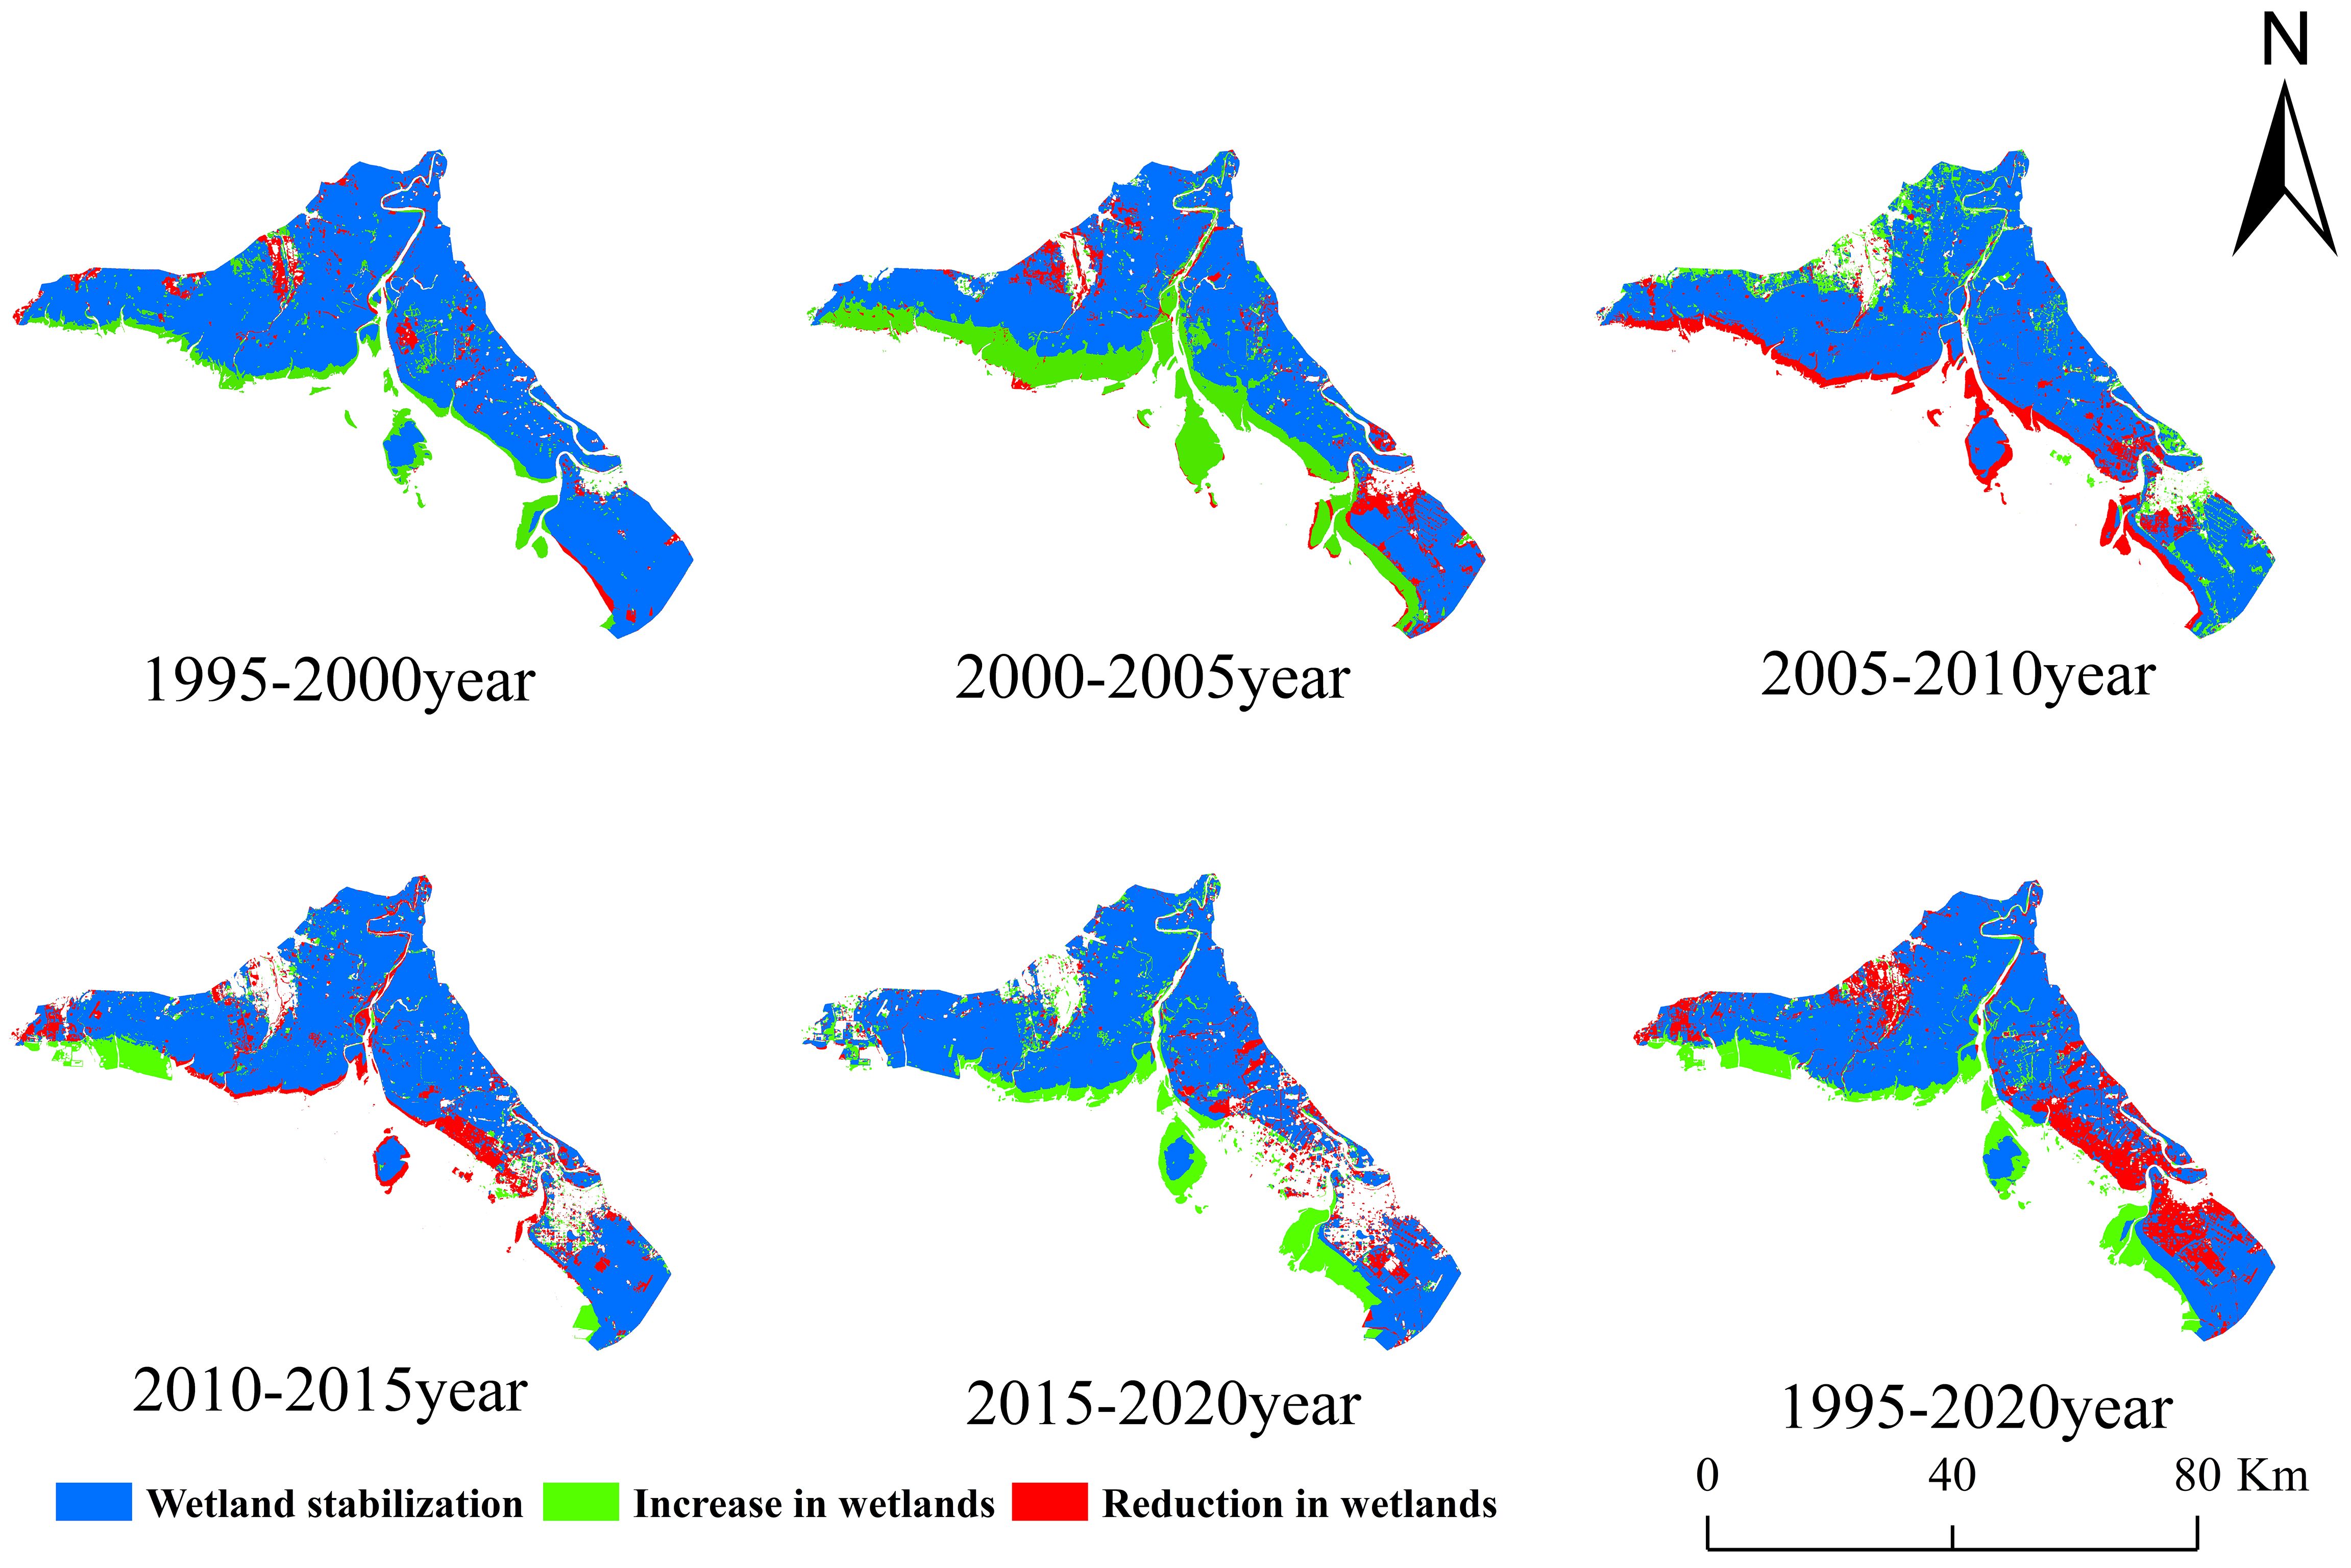
Figure 5 Spatial changes in wetlands between six periods in the Liaohe River Delta.
The distribution pattern of human disturbance intensity in the study area during the six periods was relatively consistent, with high disturbance areas mainly distributed on the east and west sides of the study area. The northern and southern sides are low interference zones and remain stable throughout the year. The medium interference zone and higher interference zone are mainly distributed at the edge of the high-intensity zone and are more variable. The range of the lower interference zone is relatively small, it is mainly distributed around the low interference zone, and there is no significant change (Figure 6).
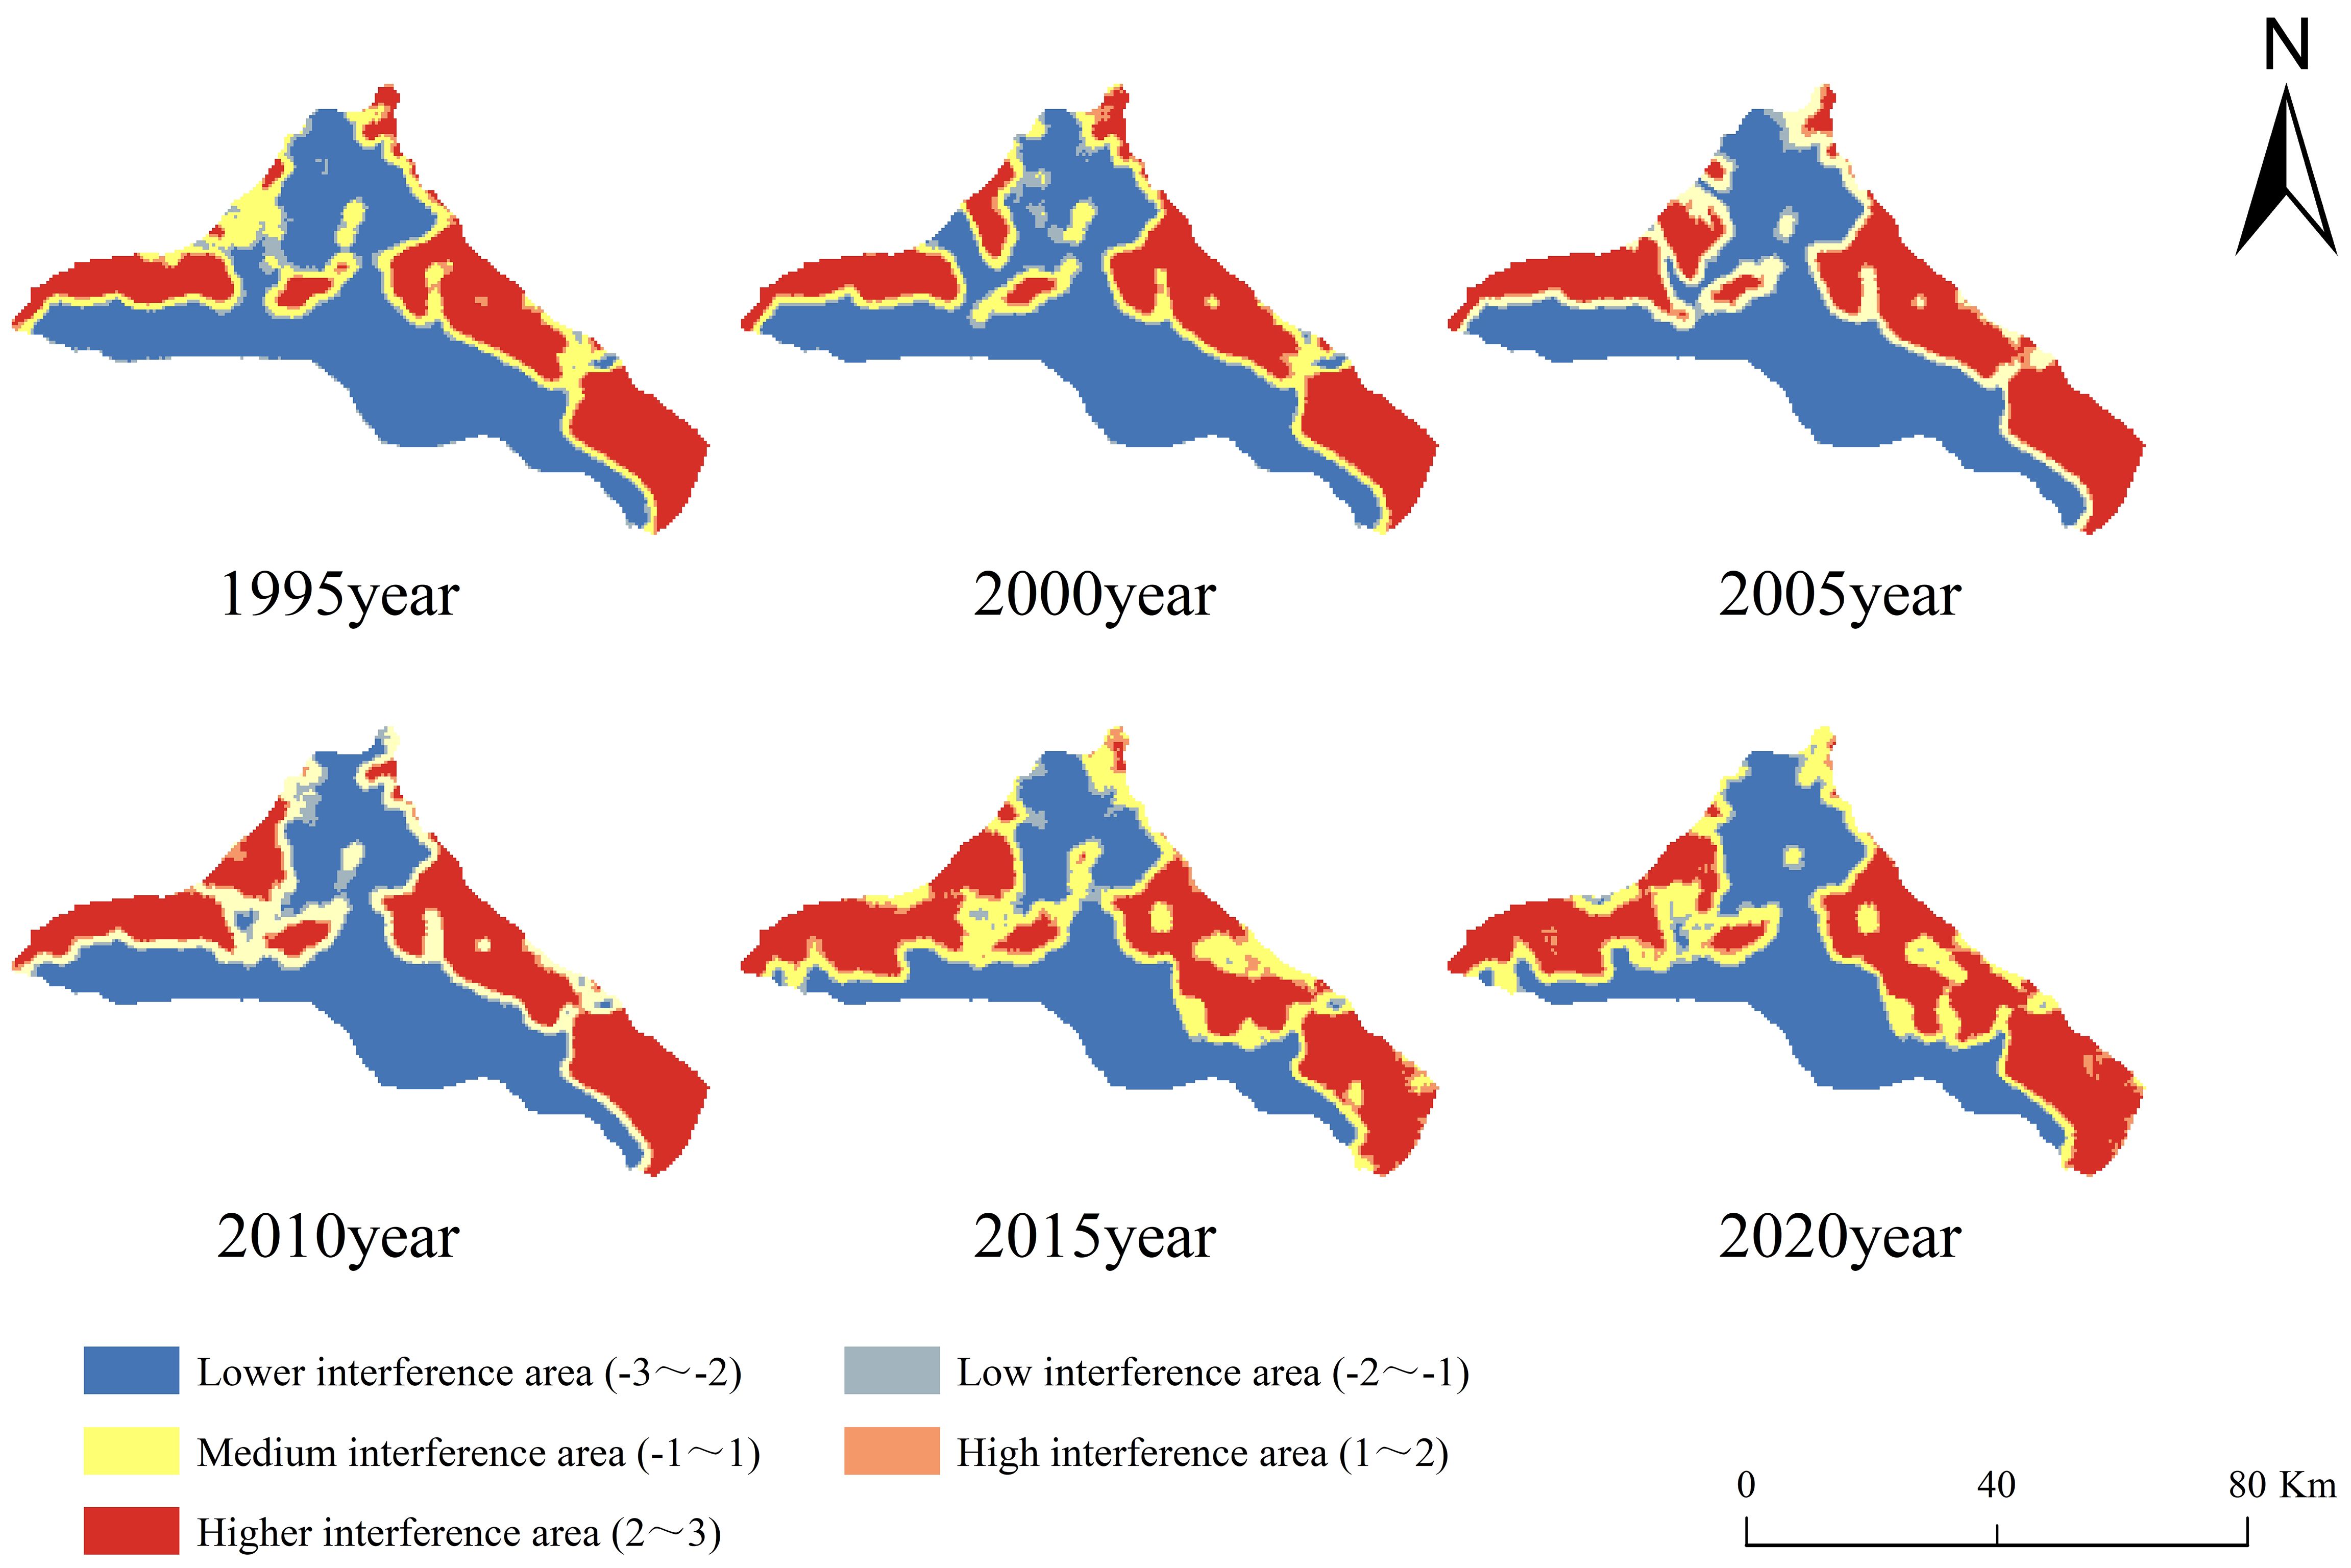
Figure 6 Spatial distribution of the intensity of human disturbance in the Liaohe River Delta during six periods of time.
In the west, there are obvious changes in the interference zone, some low interference zones are gradually transformed into higher interference zones and high interference zones, and the area is gradually expanding. In the eastern coastal area, some of the low-disturbance zones changed to high-disturbance zones between 2010 and 2020 and remained relatively stable. In the north and south, water and reed fields dominate and are the main reasons for the low level of anthropogenic disturbance. In contrast, on the east and west sides, the increase in human activities such as breeding ponds, paddy fields and building sites resulted in a greater intensity of human disturbance in the area.
To explore more intuitively the interannual changes in human disturbance intensity and disturbance area in the Liaohe River Delta, the number of grids of different disturbance areas and the mean value of human disturbance intensity were counted in each period (Figure 7), which were used to explore the relationship between the change in disturbance area and the mean value of the disturbance index.
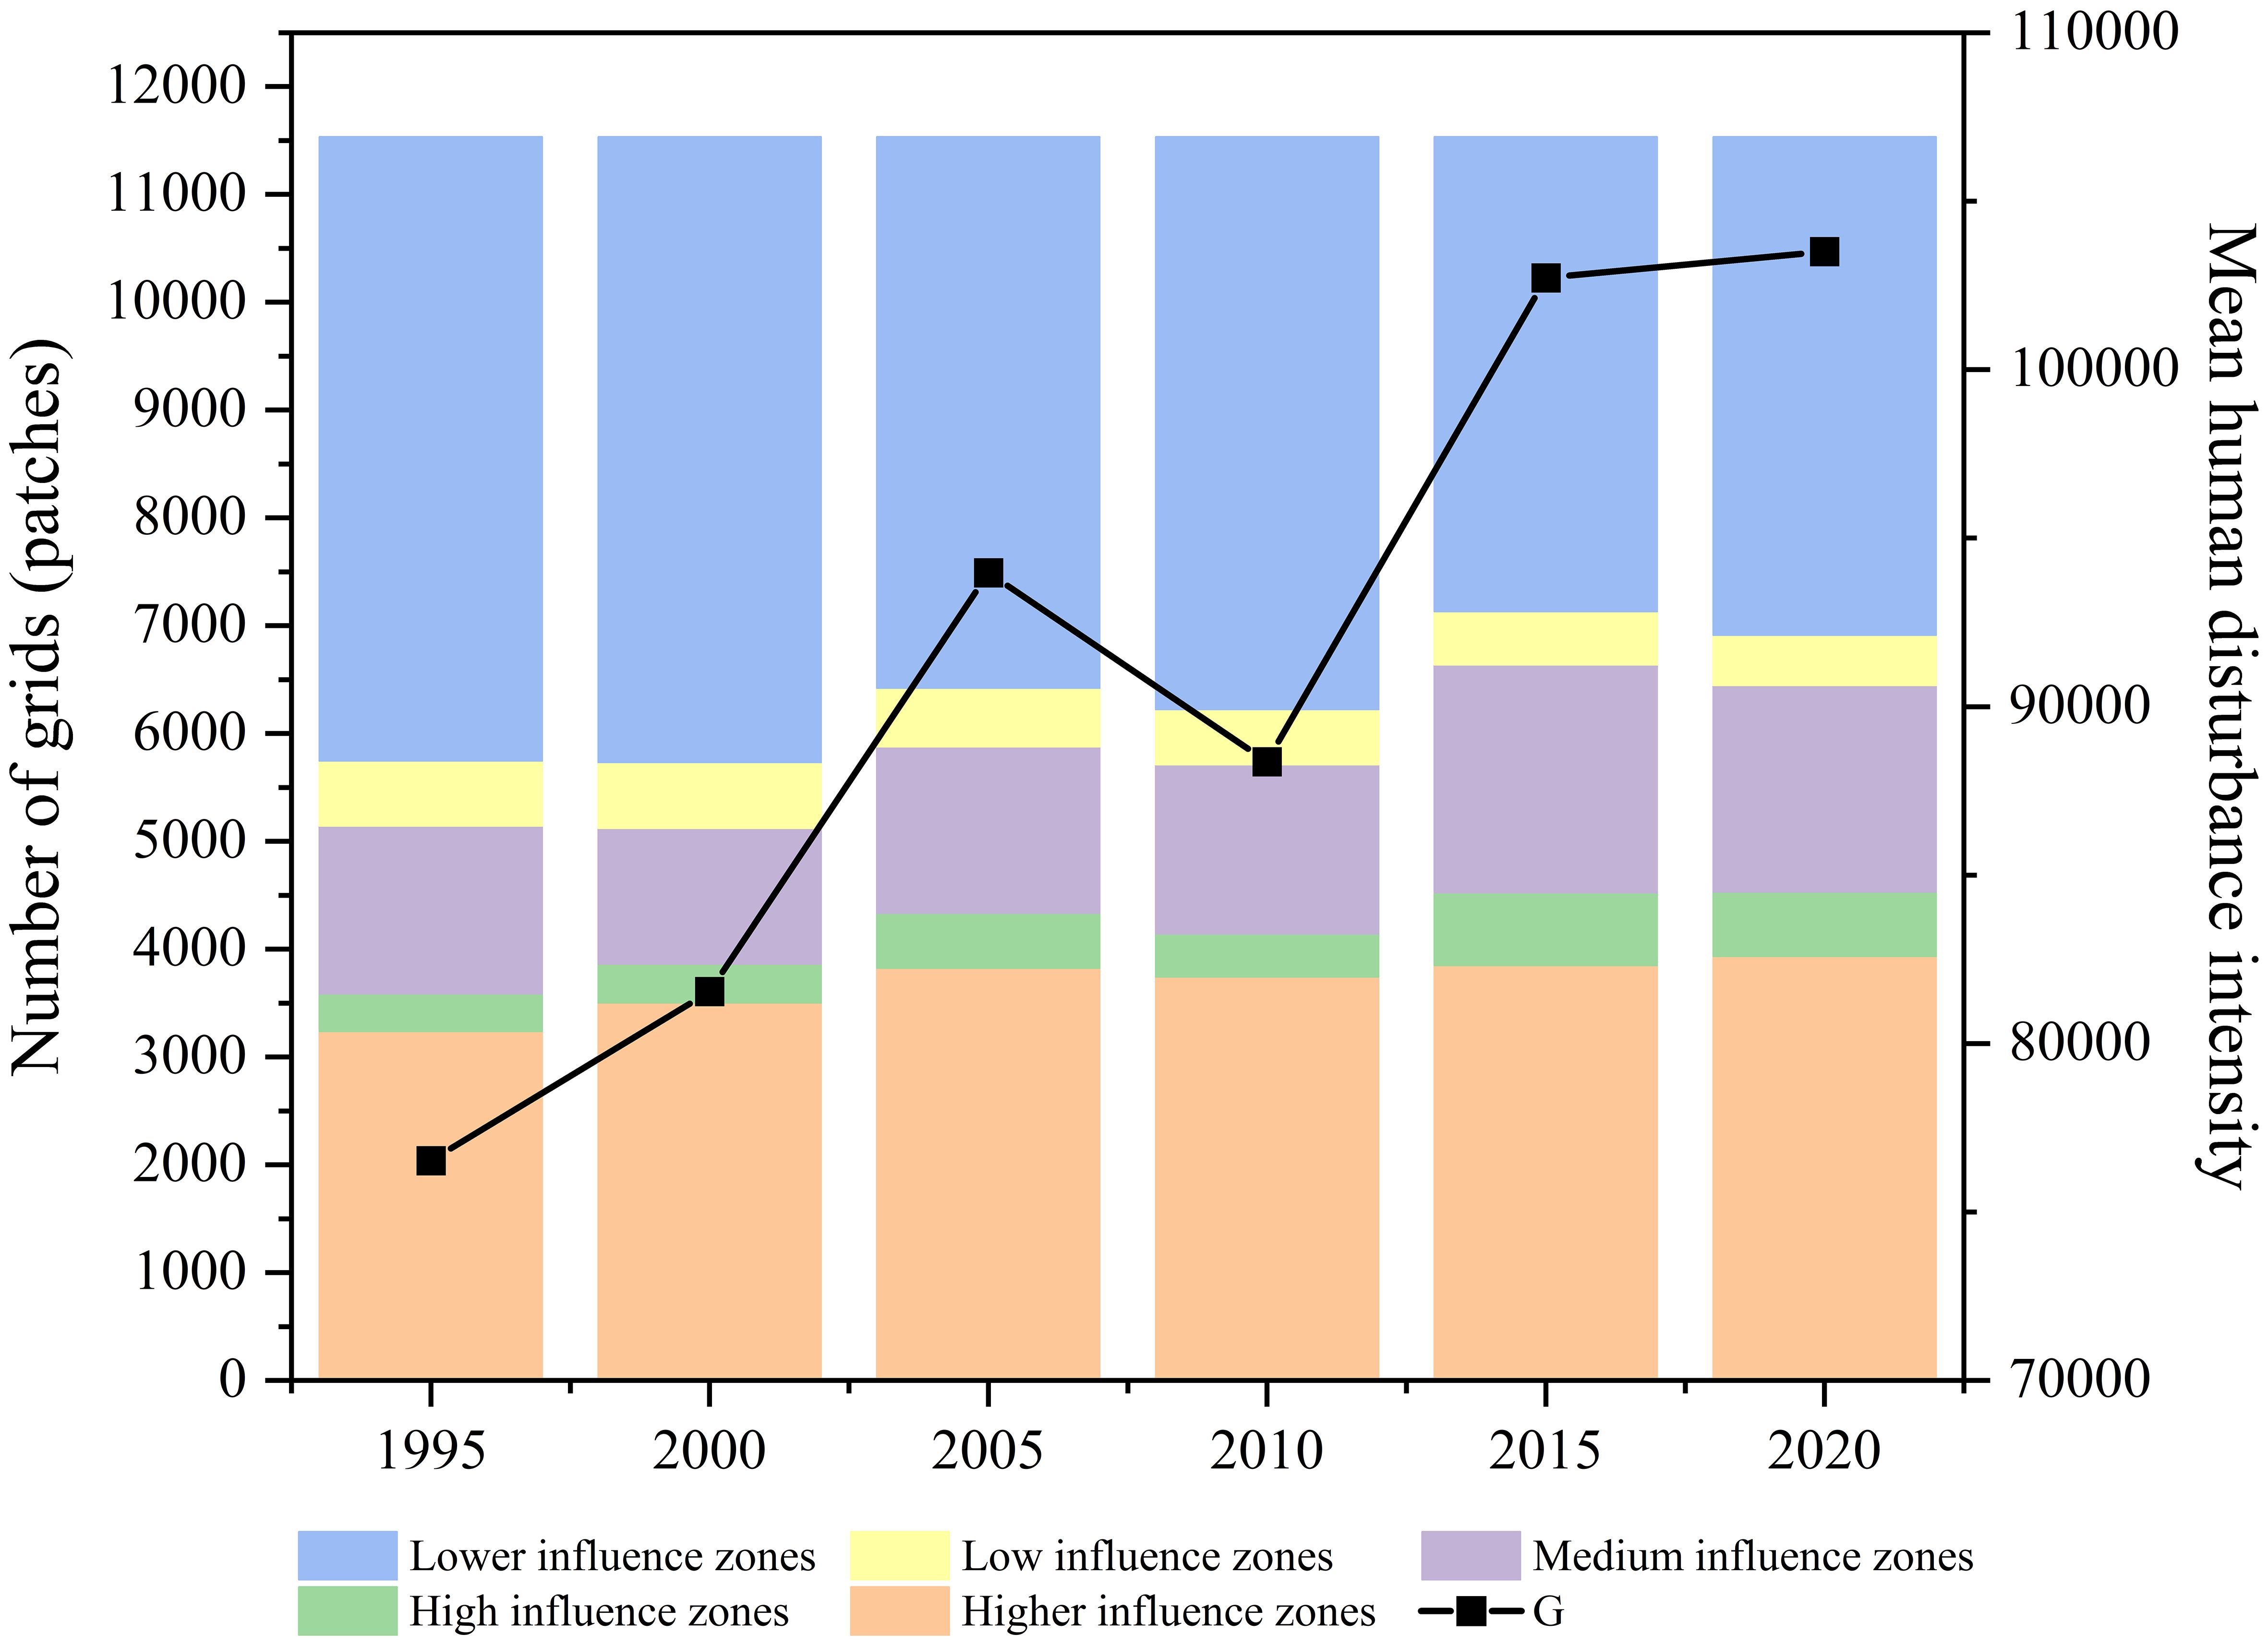
Figure 7 Number of grids and mean value of human disturbance in each disturbance area.
The mean value of human disturbance intensity, which represents the average intensity of human activities within the study area, showed an overall fluctuating upward trend, with a certain degree of decline in 2010 compared with 2005, which, in combination with the number of grids of various intensities, was mainly a large decline in the number of higher disturbance areas and a certain degree of decline in the number of lowest disturbance areas.
In terms of the number of grids, the greater number of lower disturbance zones is mainly because a large area of the study area is covered by water, which results in a greater number of lower disturbance zones in all periods. In the high disturbance area, the higher disturbance area showed a fluctuating upward trend; the lower disturbance area had a significant decrease, with enhanced human interference being the main reason for the change; and the medium disturbance area, although fluctuating more, remained generally stable.
Among the correlations between land use types and human activity hotspots, the most significant correlations were found for farm ponds, paddy fields, built-up land and reed land, which combined to exceed 90% in all periods.
Breeding ponds had the highest share but had a downward trend over time; reed land also had a downward trend but was smaller than breeding ponds and declined less; building land had the opposite trend, with different degrees of growth in all periods; and paddy land had an upward trend followed by a downward trend and declined considerably from 2010 to 2015 (Figure 8).
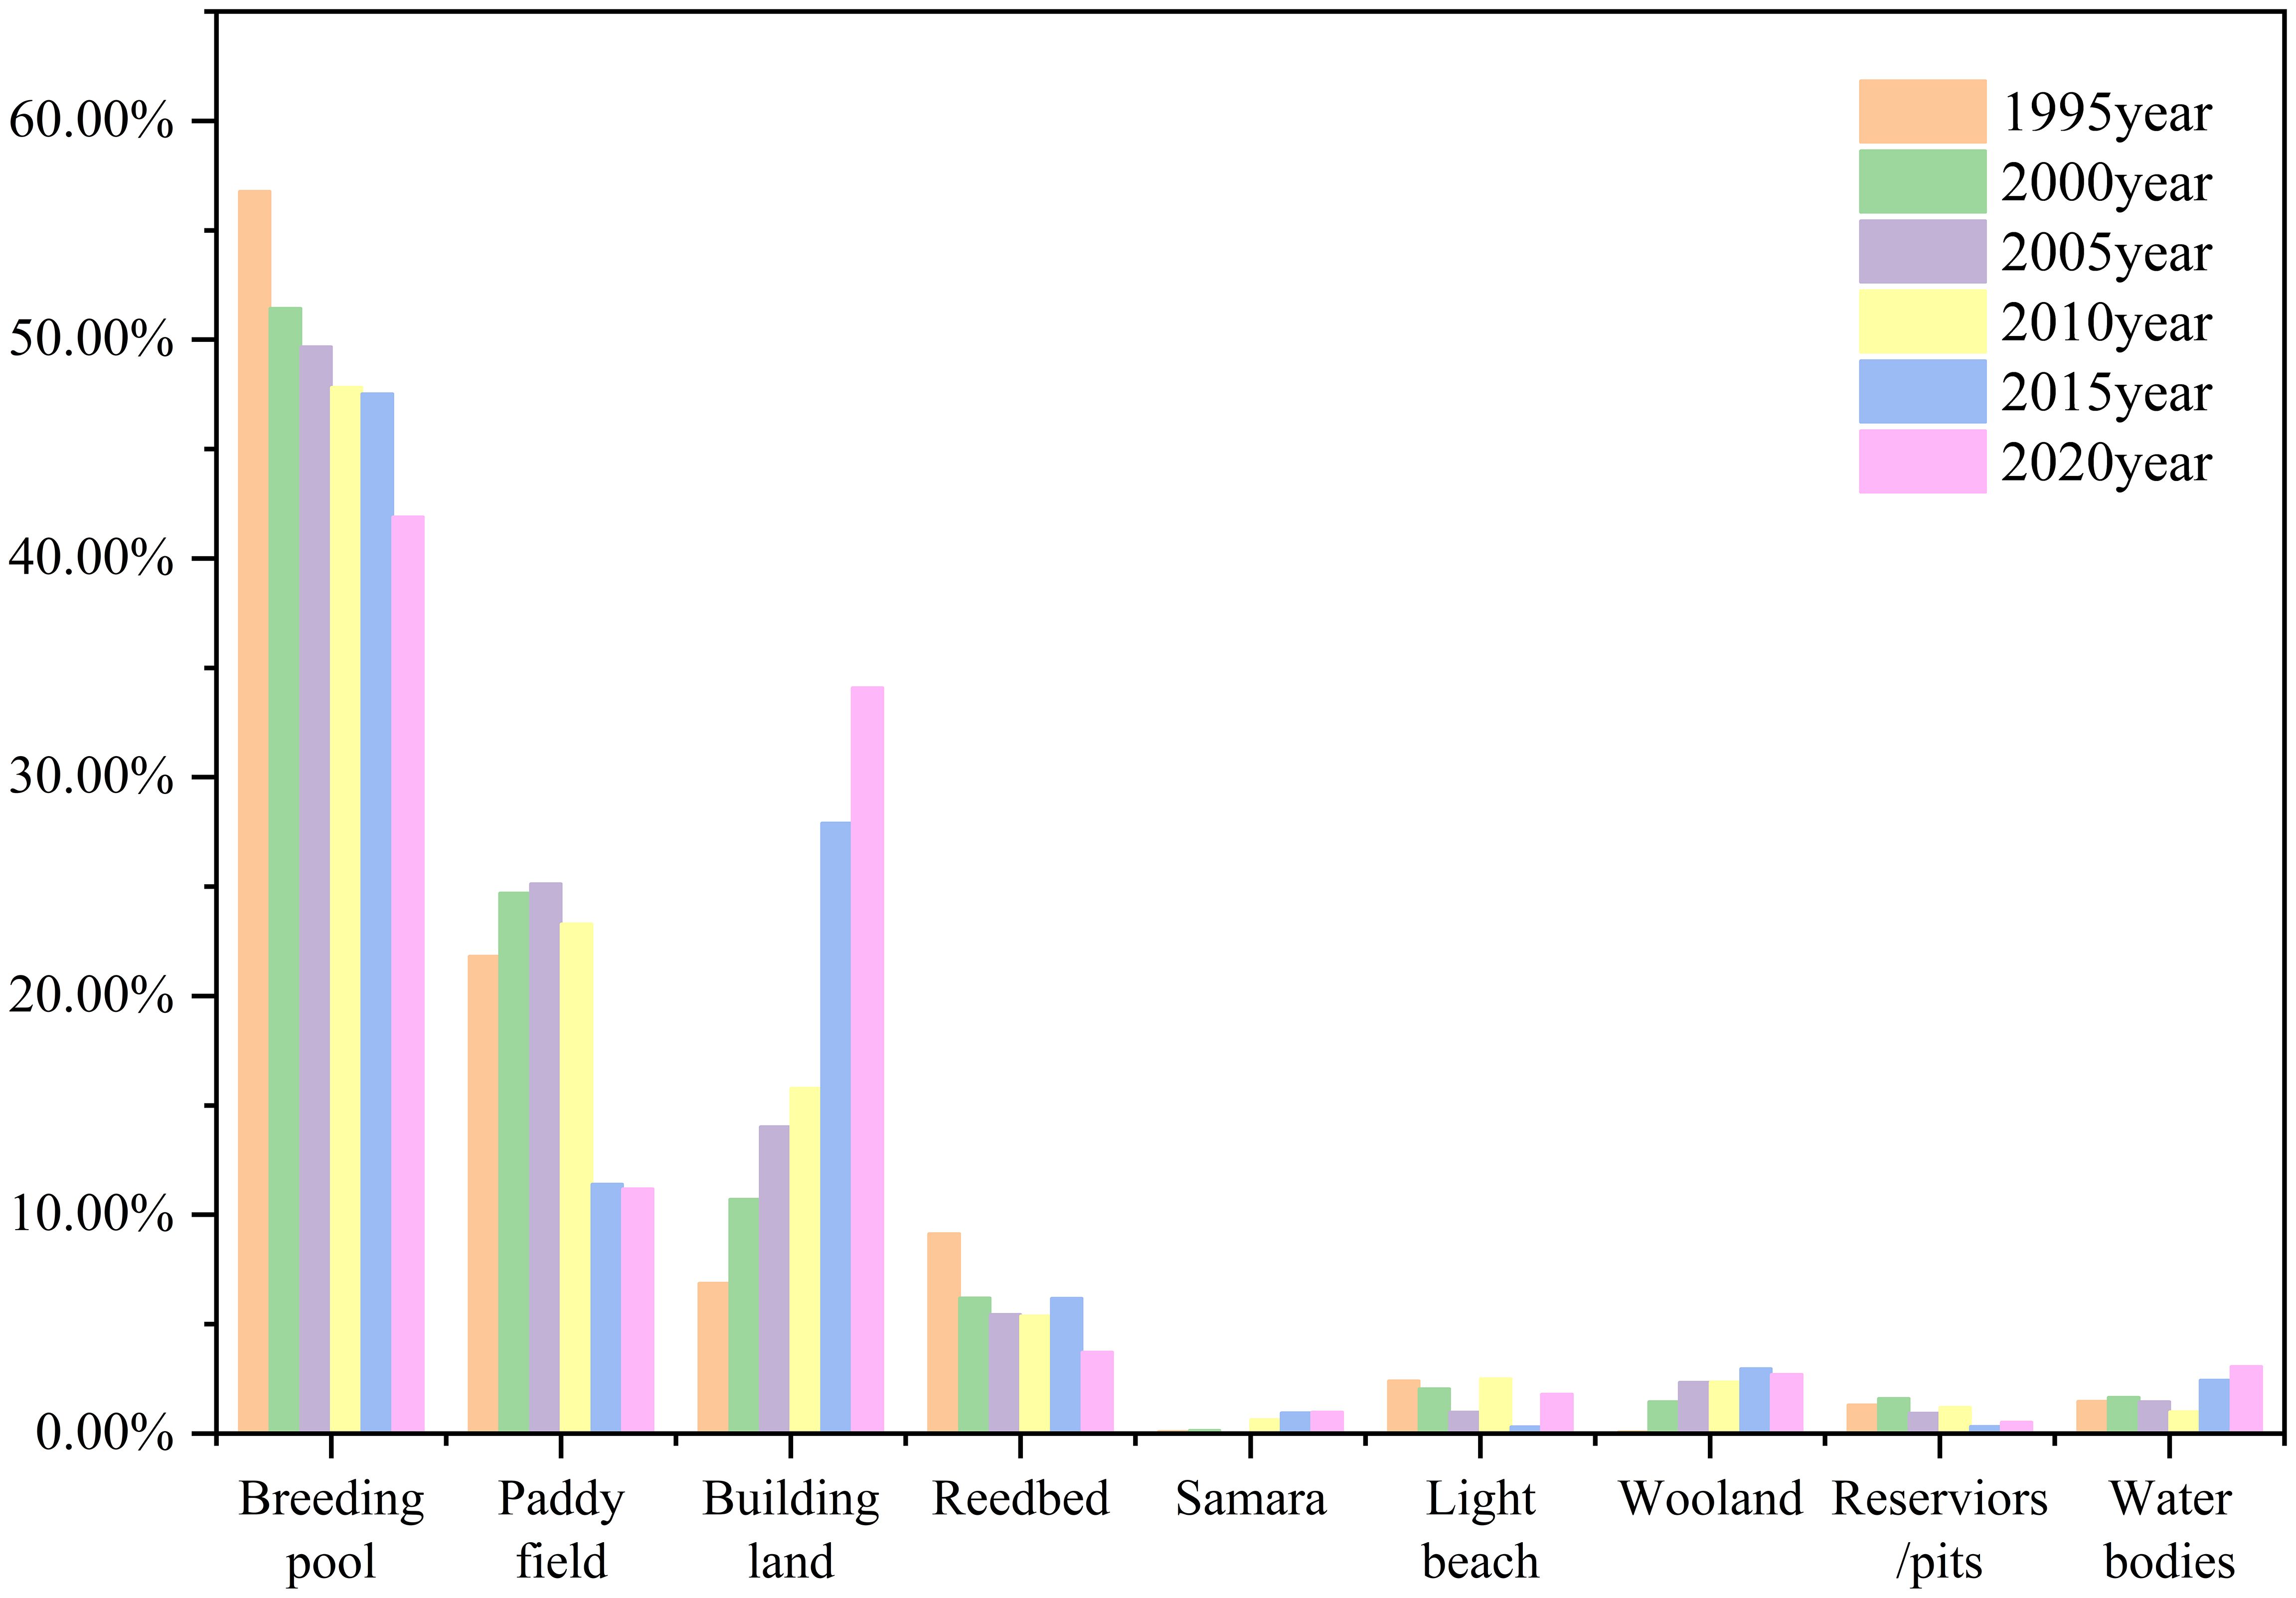
Figure 8 Correlation between land use types and anthropogenic hotspots.
At the landscape type level, the evolution of human activities on coastal wetlands is mainly manifested in the reduction in wetland area due to the expansion of nonwetlands dominated by construction land and the reduction in artificial wetland area due to the restoration of natural wetlands. Since the main focus of this study was on the impact of human activities on coastal wetlands, four landscape types that are widely distributed in the high disturbance zone and higher disturbance zone, with obvious changes and subject to greater human activities, were selected (breeding ponds, paddy fields, building land and reed land) to study the response characteristics of wetland landscapes to human activities through the landscape pattern index, and the gradient response of each wetland landscape is shown in Figure 9, taking the most representative year of 2015 as an example.
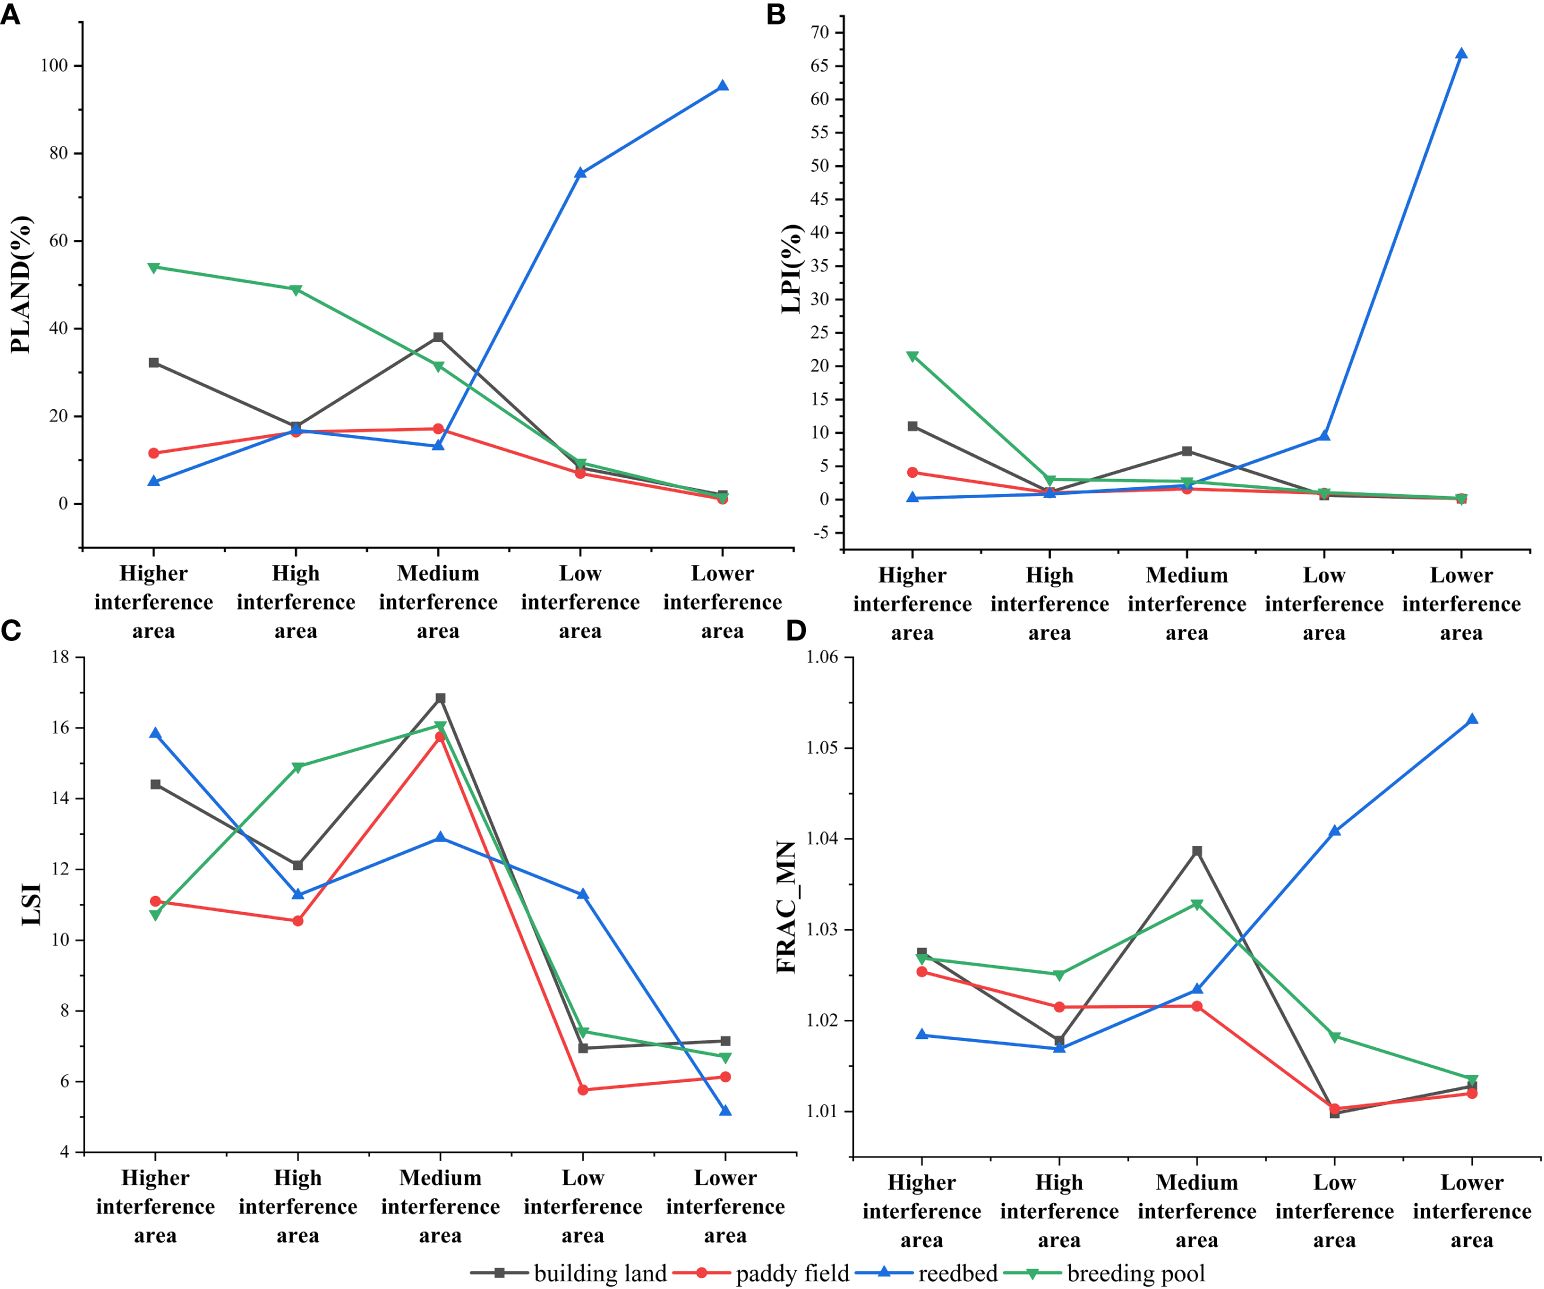
Figure 9 Response map of the wetland landscape gradient: (A) represents the response of the percentage of landscape types (PLAND) to human activities for four representative landscape types in the coastal wetlands of the Liaohe Delta: breeding ponds, paddy fields, building land and reed land in 2015; (B) represents the response of the maximum patch index (LPI) to human activities; (C) represents the response of the landscape shape index (LSI) to human activities; (D) represents the response of the average plate dimension number (FRAC_MN) in response to human activities.
The richness of the landscape can be seen from the PLAND index; specifically, in the high disturbance area, both ponds and building land have high values, while reedbeds are relatively small compared to the former two areas. This suggests that in the high disturbance zone, there are more of the two landscape types, ponds and building land, and less of the landscape type, reedbed. The opposite is true in the low-disturbance zone, where the ponds and building sites are lower and the reedbeds are greater. As the level of anthropogenic disturbance decreased, there was a downward trend in the area of breeding ponds and building land, while the area of reed land increased as the level of anthropogenic disturbance decreased. The above changes indicate that human disturbance activities cause different landscape types to show significant spatial distribution variability under different human disturbance intensities.
The LPI is often used to measure the degree of dominance, which can also reflect the direction and strength of human activities. The trends of breeding ponds, building land and paddy fields in the LPI map all decreased with decreasing human activity disturbance, which was a high response to human activities. In the high disturbance zone, the landscape indices of aquaculture ponds are greater and more strongly affected by human activities. The reason why building land is more common in the medium disturbance zone is mainly because some of the building land is distributed near land types such as reservoirs/pits and water, resulting in a greater dominance of building land in the medium disturbance zone, while reed land is a natural wetland less disturbed by human activities, so it has a greater dominance in the low disturbance zone.
By comparing the size of the LSI, the complexity and discrete degree of different landscape types can be determined. The four landscape types of building land, paddy fields, reed fields and aquaculture ponds can be roughly summarized as decreasing-increasing-decreasing-increasing trends. Since the area range of the higher and lower disturbance zones is small, the LSI is small due to the small number of these two types of disturbance zones, and the landscapes are relatively concentrated and simple. In the medium disturbance zone, there are mostly mixed areas of various landscape types, resulting in relatively fragmented and complex landscape types in the medium disturbance zone. The landscape shape index of paddy fields in each intensity sample zone in the study area is relatively low, indicating that in the areas of various types of anthropogenic disturbances, the landscape patches of paddy fields are distributed in a clustered state, and their shapes tend to be regularized.
The FRAC_MN landscape index is used to indicate the degree of peripheral complexity, to describe and compare the geometrical characteristics of patch types, and to indicate the degree of complexity of human activities on the landscape pattern. The built-up land, breeding ponds, and paddy fields all showed an increasing and then a decreasing trend, and since they are more fragmented in the medium disturbance area, the degree of peripheral complexity is higher, resulting in a greater landscape index, while the reed land showed an increasing trend. The reedbed land has a higher landscape index due to its larger area in the low disturbance zone.
The gross domestic product (GDP) has the highest correlation with wetland evolution, and the urban planning and economic development of Panjin city have led to continuous changes in human activities. The local primary industry mainly consists of agriculture and fisheries, and its development is often accompanied by changes in the area of paddy fields and aquaculture ponds, so the correlation with changes in the wetland area is greater. Tertiary industry refers to all industries other than primary and secondary industries, with many industries and a wide range, among which the development of tourism, eco-tourism and eco-agriculture are closely related to wetlands, and the reasonable development of tertiary industry can support the protection and sustainable utilization of wetlands, so its correlation with the evolution of wetland areas is greater. Therefore, the correlation with the evolution of wetland area is greater. The correlation between aquatic product production and wetland evolution is mainly reflected in the change in the breeding pond area; the area of the breeding pond in the coastal wetland is large, and fluctuations in the breeding pond cause changes in the area of the coastal wetland. Finally, in terms of population, the significance of population and wetland area change is low, although a series of urban problems caused by population growth is not the main factor affecting wetland evolution (Table 6).

Table 6 The land transfer matrix 1995–2020.
Compared to that in 1995, the landscape pattern of coastal wetlands in the study area changed significantly during all periods. This was mainly manifested in the erosion of wetlands by nonwetlands, mainly construction sites, and a large reduction in wetland area occurred. The evolution of wetlands was mainly divided into two phases, i.e., in 1995~2015, when the proportion of artificial wetlands increased and the proportion of natural wetlands decreased, and in 2015~2020, when the proportion of natural wetlands increased and the proportion of artificial wetlands decreased. Overall, each landscape type of natural wetlands is gradually fragmented, mainly in terms of reed fields and light beaches. Due to the change in precipitation conditions, the river flow is sufficient during the abundant water period, which has a strong siltation ability and leads to a decrease in the light beach area, while during the dry water period, the river flow is more scarce, and the siltation ability is relatively weakened, which results in an increase in silt deposition, thus leading to the expansion of the light beach area. As a result, the area of the light beach shows different degrees of change in all periods. The fragmentation of artificial wetlands was more obvious, mainly caused by the evolution of breeding ponds and paddy fields, which was especially obvious in the western and central parts of the Liaohe River Delta.
The intensity of human disturbance is used to evaluate the degree of influence of human activities on the ecosystem, and the high-disturbance areas are mainly distributed on the east and west sides of the Liaohe River Delta, while the low-disturbance areas are mainly distributed on the north and south sides. Combined with the landscape types, the changes in the landscape pattern characteristics of the four main types, namely, building land, aquaculture ponds, paddy fields and reed fields, were clearly regular, and the differences in the spatial distribution of different landscape types under different human disturbance intensities were significant. In the high interference area, the landscape types tend to be regularized due to human intervention; in the low interference area, there is less human interference, and most of them are monocultures of large reed fields; in the medium interference area, due to the interference of human activities and the lack of planning and management of the landscape types, the original landscape types are more fragmented, which is mainly manifested in the expansion of the buildings and the erosion of wetlands, which leads to the fragmentation of the landscape types in this interference area. The main manifestation is the erosion of the wetland by the expansion of buildings, resulting in fragmentation of the landscape type in the disturbance area. Human activities are the main cause of landscape pattern fragmentation, but excessive intervention from human activities, such as urban planning, park construction and other activities, will instead make the landscape tend to be holistic. The formation of high disturbance areas is mainly due to the increased demand for land brought about by economic and urban development, which has led to the conversion of natural wetlands into building land and other artificial landscapes; at the same time, the development of aquaculture and agricultural activities has also contributed to the use of wetlands for breeding ponds and paddy fields, and together with the direct influence of local government policies and planning on the type of land use, all these factors have combined to form a Liaohe River Delta area with a high intensity of disturbance from human activities with a high intensity of disturbance.
Combining human interference analysis with land transfer matrix not only quantifies the changes in land use types of coastal wetlands in the Liaohe River Delta, but also provides us with a deep understanding of the driving factors of changes in coastal wetlands in the Liaohe River Delta. Analysis shows that due to urbanization and economic development, especially in areas with high human activity, natural wetlands are shifting towards artificial wetlands or artificial wetlands. GDP growth and population growth respectively promote the expansion of urban construction, agriculture, and aquaculture, leading to a decrease in wetland area and changes in landscape pattern. Wetlands in highly disturbed areas tend to simplify, while wetlands in low disturbed areas retain more natural features.
The economy and policy are important factors guiding human activities. In the western and central parts of the Liaohe River Delta, due to the development of aquaculture and agriculture, large breeding ponds and paddy fields were distributed and developed rapidly for a certain period of time, which was the main reason for the high intensity of human interference in this area. However, in recent years, the impact of the Estuary Nature Reserve and wetland protection policies enacted by the local government has led to a large reduction in the number of breeding ponds and paddy fields, prompting the landscape to become more fragmented. However, in recent years, affected by estuary nature reserves and wetland protection policies issued by local governments, the number of breeding ponds and paddy fields has greatly decreased, prompting the gradual restoration of natural wetlands such as reeds. The eastern area is mainly the urban planning area of Panjin city. During the period from 2010 to 2020, the local government, to promote the economic and industrial development of the port, carried out the construction of Panjin Port Rongxing Harbor and its related facilities, which resulted in the transformation of a large area of wetlands in the southeast into construction land, thus significantly reducing the area of wetlands. With the urban planning of Panjin city, a large area of breeding ponds in the eastern part of the study area was converted into nonwetlands such as built-up land, and economic development has always been accompanied by a series of wetland changes such as urban expansion; therefore, the correlation between GDP and human activity is high.
The evolution of coastal wetlands in the Liaohe River Delta changed significantly during various periods. In the early period, due to the rapid increase in the number of people in the coastal area, anthropogenic activities were mainly manifested in land development, reclamation and urban expansion. Therefore, large-scale aquaculture ponds and related buildings were constructed in the early period of coastal wetlands to pursue economic benefits. With rapid economic development, people have begun to pursue a greater quality of life and have gradually realized the problems of water pollution and ecological damage caused by urban expansion and large-scale breeding ponds; thus, the state introduced the Wetland Protection Law and other laws and regulations, which clearly defined the scope of wetland protection, protection objectives and management measures, and emphasized the rational use of wetlands and ecological restoration. Policies prohibiting reclamation and reclamation are stipulated to curb the overexploitation of wetlands and to protect the integrity and ecological functions of wetlands. Taking the evolution of the reed land landscape as an example, between 1995 and 2020, the area of early reed land drastically decreased due to overexploitation. However, with the implementation of the “retreat to the beach” policy in Panjin city and continued support from the central financial authorities, the reedbed was planned and protected, and some man-made landscapes, such as aquaculture ponds and paddy fields, were transformed into reedbeds, resulting in a slight increase in the area of the reedbed and a stabilization of the area.
Comparing the research of Wu Wenting et al. and Wang Han et al., we can see that coastal wetlands in China are facing serious degradation and loss issues. Wu Wenting et al.’s research found that between 1989 and 2013, over 15,000 hectares of coastal wetlands in Pudong New Area, Shanghai, disappeared or were transformed into agricultural, aquaculture, industrial or residential land due to rapid urban expansion (Wu et al., 2017). Wang Han et al.’s study pointed out that the area of coastal wetlands in Jiangsu Province decreased by 23.43% from 1990 to 2020, and the tidal wetland landscape showed a phased downward trend. Among these changes, approximately 60% of losses and gains are directly related to human activities (Wang et al., 2023). This is consistent with the fact that human activities are the main factor affecting the evolution of coastal wetlands mentioned in this article. However, Wu Wenting et al.’s study also mentioned the impact of accelerated sea level rise on the continuous narrowing of coastal wetlands, as well as the indirect factors mentioned in Wang Han et al.’s study, such as natural coastal movement and climate change, which were not covered in this article. Therefore, it can be concluded that the degradation and loss of coastal wetlands are closely related to human activities, and are influenced by a combination of multiple direct and indirect factors.
(1) From 1995 to 2020, the total area of coastal wetlands in the Liaohe River Delta showed a decreasing trend, and the landscapes of each wetland tended to be fragmented in general. During 1995~2015, due to urban construction and economic development, breeding ponds and building land use increased significantly, resulting in an increasing number of natural wetlands being converted into artificial wetlands. However, during the period of 2015~2020, large areas of breeding ponds and paddy fields returned to natural wetlands, and artificial wetlands were converted to natural wetlands in large areas due to the influence of various wetland protection policies.
(2) Human activities are the main driving force for the evolution of coastal wetlands in the Liaohe River Delta, and different human activities have different impacts on the evolution of coastal wetlands. The western and northern parts of the Liaohe River Delta have obvious changes, which are mainly manifested in the fact that the erosion of natural wetlands by human activities, such as the construction of paddy fields and aquaculture ponds, under the guidance of the economy, has made the landscape pattern of the coastal landscape more fragmented and complicated. The eastern part of the Liaohe River Delta is relatively stable because human activities such as urban planning and construction under the unified scheduling and management of government policies and the construction of Liaoning port, for example, will instead make the coastal landscape pattern regularized and integrated.
(3) The four landscapes of coastal wetland landscapes most affected by human activities are aquaculture ponds, paddy fields, construction sites and reed fields, of which aquaculture ponds and paddy fields were the main directions of human activities in the early period, influenced by socioeconomic factors. However, with the increase in population, the urban expansion caused by the construction of building land gradually became the center of human activities. Reed land, on the other hand, was affected by the expansion of breeding ponds and paddy fields in the early period and tended to decrease in area and become fragmented; in the later period, under the influence of environmental protection policies, the area recovered significantly.
(4) The protection and management of coastal wetlands is a long-term and multifaceted issue that involves multiple aspects such as nature, society, and culture. Natural factors such as climate and sea level were not addressed in this study. Future research can establish a long-term wetland monitoring and evaluation system, track the effectiveness of policy implementation and the dynamic changes of wetland ecosystems, and expand to interdisciplinary cooperation, integrating knowledge and methods from different fields, to more comprehensively understand and solve problems in wetland protection. With these improvements, future research will be able to provide more accurate and in-depth information, providing stronger scientific basis for the protection and management of coastal wetlands in the Liaohe River Delta.
The original contributions presented in the study are included in the article/supplementary material. Further inquiries can be directed to the corresponding author.
QD: Writing – original draft. XZ: Software, Writing – original draft. LZ: Writing – original draft, Writing – review & editing. XS: Writing – original draft, Software. TG: Data curation, Writing – original draft.
The author(s) declare financial support was received for the research, authorship, and/or publication of this article. Natural Science Foundation of Shandong Province, (No. ZR2022MD032).
I would like to thank my colleagues who helped me a lot in the process of collecting and analyzing the experimental data. Without their help and support, I would not have been able to complete this study. Finally, I would like to thank all the scholars who have inspired and helped me in the field of academic research. I am grateful for your research results and academic contributions that have benefited me greatly.
The authors declare that the research was conducted in the absence of any commercial or financial relationships that could be construed as a potential conflict of interest.
All claims expressed in this article are solely those of the authors and do not necessarily represent those of their affiliated organizations, or those of the publisher, the editors and the reviewers. Any product that may be evaluated in this article, or claim that may be made by its manufacturer, is not guaranteed or endorsed by the publisher.
Chang M., Meng X., Sun W., Yang G., Peng J. (2021). Collaborative coupled hyperspectral unmixing based subpixel change detection for analyzing coastal wetlands. IEEE J. Select. Topics Appl. Earth Observ. Remote Sens. 14, 8208–8224. doi: 10.1109/JSTARS.2021.3104164
Chen K., Cong P., Qu L., Liang S., Sun Z., Han J. (2023a). Biological connectivity and its driving mechanisms in the Liaohe Delta wetland, China. Ecol. Inf. 76, 102028. doi: 10.1016/J.ECOINF.2023.102028
Dou X., Guo H., Zhang L., Liang D., Zhu Q., Liu X., et al. (2023). Dynamic landscapes and the influence of human activities in the Yellow River Delta wetland region. Sci. total environ. 899, 166239–166239. doi: 10.1016/j.scitotenv.2023.166239
Feng C., Ye G., Zeng J., Zeng J., Jiang Q., He L., et al. (2023). Sustainably developing global blue carbon for climate change mitigation and economic benefits through international cooperation. Nat. Commun. 14, 6144–6144. doi: 10.1038/s41467-023-41870-x
Haarstad K., Bavor H. J., Mæhlum T. (2012). Organic and metallic pollutants in water treatment and natural wetlands: a review. Water Sci. Technol. 65, 76–99. doi: 10.2166/wst.2011.831
Hu X., Zhang L., Zhou Y., He W. (2020). Current status and analysis of norms in the field of ecological restoration of coastal wetlands in China. J. Trop. Oceanogr. 39, 131–139. doi: 10.11978/2019111
Jiang T., Pan J., Pu X., Wang B., Pan J. (2015). Current status of coastal wetlands in China: Degradation, restoration, and future management. Estuarine Coast. Shelf Sci. 164, 265–275. doi: 10.1016/j.ecss.2015.07.046
Li L. (2011). Study on the evolution of chongqing regional economic development differences and chongqing’s economic development. (master's thesis). Chongqing University of Business and Technology, Chongqing, China.
Lumibao C. Y., Harris G., Birnbaum C. (2024). Global diversity and distribution of rhizosphere and root-associated fungi in coastal wetlands: A systematic review. Estuaries Coasts 47, 905–916. doi: 10.1007/s12237-024-01343-w
Ostrowski A., Connolly R. M., Sievers M. (2021). Evaluating multiple stressor research in coastal wetlands: A systematic review. Mar. Environ. Res. 164, 105239. doi: 10.1016/j.marenvres.2020.105239
Peng K., Zhang Y., Gao W., Lu Z. (2020). Evaluation of human activity intensity in geological environment problems of Ji’nan City. Eur. J. Remote Sens. 54, 541–545. doi: 10.1080/22797254.2020.1771214
Rutkowski L., Jaworski M., Pietruczuk L., Duda P. (2024). The CART decision tree for mining data streams. Inf. Sci. 266, 1–15. doi: 10.1016/j.ins.2013.12.060
Su H., Yao W., Wu Z., Zheng P., Du Q. (2021). Kernel low-rank representation with elastic net for China coastal wetland land cover classification using GF-5 hyperspectral imagery. ISPRS J. Photogram. Remote Sens. 171, 238–252. doi: 10.1016/j.isprsjprs.2020.11.018
Valeria T., Giuseppe V., Maria A. (2021). Monitoring and recording changes in natural landscapes: A case study from two coastal wetlands in SE Italy. Land 10, 50–50. doi: 10.3390/land10010050
Wan S., Mou X., Liu X. (2018). Effects of reclamation on soil carbon and nitrogen in coastal wetlands of Liaohe river delta, China. Chin. Geograph. Sci. 28, 443–455. doi: 10.1007/s11769-018-0961-7
Wang X., Xiao X., Xu X., Zou Z., Chen B., Qin Y., et al. (2021). Rebound in China’s coastal wetlands following conservation and restoration. Nat. Sustainabil. 4, 1076–1083. doi: 10.1038/s41893-021-00793-5
Wang G., Zhang F. (2024). Spatial and temporal evolution of ecosystem service value in the Liaohe River delta over the past 30 years and analysis of influencing factors. Environ. Sci. 45, 228–238. doi: 10.13227/j.hjkx.202301081
Wang Y., Zhou L., Jia Q., Yu W. (2017). Water use efficiency of a rice paddy field in Liaohe Delta, Northeast China. Agric. Water Manage. 187, 222–231. doi: 10.1016/j.agwat.2017.03.029
Wang H., Zhou Y., Wu J., Wang C., Zhang R., Xiong X., et al. (2023). Human activities dominate a staged degradation pattern of coastal tidal wetlands in Jiangsu province, China. Ecol. Indic. 154, 110579. doi: 10.1016/J.ECOLIND.2023.110579
Wei F., Han M., Han G., Wang M., Tian L., Zhu J., et al. (2022). Reclamation-oriented spatiotemporal evolution of coastal wetland along Bohai Rim, China. Acta Oceanol. Sin. 41, 192–204. doi: 10.1007/s13131-022-1987-3
Wu W., Zhou Y., Tian B. (2017). Coastal wetlands facing climate change and anthropogenic activities: A remote sensing analysis and modelling application. Ocean Coast. Manage. 138, 1–10. doi: 10.1016/j.ocecoaman.2017.01.005
Xie R., Shen Y., Lao H. (2022). Dynamic change and response of landscape pattern of coastal wetland in Yancheng based on anthropogenic disturbance. J. Ecol. 41, 351–360. doi: 10.13292/j.1000-4890.202202.007
Xu Y., Xu X., Tang Q. (2016). Human activity intensity of land surface: Concept, methods and application in China. J. Geograph. Sci. 26, 1349–1361. doi: 10.1007/s11442-016-1331-y
Yan X., Liu M., Zhong J., Guo J., Wu W. (2018). How human activities affect heavy metal contamination of soil and sediment in a long-term reclaimed area of the Liaohe river delta, North China. Sustainability 10, 338–338. doi: 10.3390/su10020338
Yang S., Gu F., Song B., Ye S., Yuan Y., He L., et al. (2021). Holocene vegetation history and responses to climate and sea-level change in the Liaohe Delta, northeast China. Catena 217, 106438. doi: 10.1016/J.CATENA.2022.106438
Yin H., Hu Y., Liu M., Li C., Lv J. (2021). Ecological and environmental effects of estuarine wetland loss using keyhole and landsat data in Liao river delta, China. Remote Sens. 13, 311–311. doi: 10.3390/rs13020311
Yu W., Ji R., Han X., Chen L., Feng R., Wu J., et al. (2020). Evaluation of the biodiversity conservation function in Liaohe delta wetland, Northeastern China. J. Meteorol. Res. 34, 798–805. doi: 10.1007/s13351-020-9186-7
Zhang T. (2021). Research on the impact mechanism of human activities on the evolution of coastal wetlands in Shandong Bohai Sea. Shandong Normal University, Jinan, Shandong Province, China.
Zhang X., Li P., Li P., Xu X. (2005). Current status and prospect of coastal wetland research in China. Adv. Mar. Sci. (01), 87–95.
Keywords: Liaohe River Delta, coastal wetlands, spatial and temporal evolution, intensity of human disturbance, landscape pattern index
Citation: Deng Q, Zhang X, Zhang L, Shao X and Gu T (2024) The impact mechanism of human activities on the evolution of coastal wetlands in the Liaohe River Delta. Front. Ecol. Evol. 12:1423234. doi: 10.3389/fevo.2024.1423234
Received: 25 April 2024; Accepted: 10 June 2024;
Published: 02 July 2024.
Edited by:
Jian Li, Jiangsu University, ChinaReviewed by:
Yazhu Wang, Chinese Academy of Sciences (CAS), ChinaCopyright © 2024 Deng, Zhang, Zhang, Shao and Gu. This is an open-access article distributed under the terms of the Creative Commons Attribution License (CC BY). The use, distribution or reproduction in other forums is permitted, provided the original author(s) and the copyright owner(s) are credited and that the original publication in this journal is cited, in accordance with accepted academic practice. No use, distribution or reproduction is permitted which does not comply with these terms.
*Correspondence: Liping Zhang, emhhbmdsaXBpbmdAc2R1c3QuZWR1LmNu
Disclaimer: All claims expressed in this article are solely those of the authors and do not necessarily represent those of their affiliated organizations, or those of the publisher, the editors and the reviewers. Any product that may be evaluated in this article or claim that may be made by its manufacturer is not guaranteed or endorsed by the publisher.
Research integrity at Frontiers
Learn more about the work of our research integrity team to safeguard the quality of each article we publish.