 Zexu Nie
 Chao Wang
 Na Zhang
- 1College of Resources and Environment, University of Chinese Academy of Sciences, Beijing, China
- 2Institute of Grassland, Flowers and Ecology, Beijing Academy of Agriculture and Forestry Sciences, Beijing, China
- 3Beijing Yanshan Earth Critical Zone National Research Station, University of Chinese Academy of Sciences, Beijing, China
Grassland vegetation phenology has undergone great changes under the influence of climate, which affects ecosystem functions and services. However, the mechanism of preseason climatic factors in driving phenological shifts is unclear. In this study, we determined the start (SOS) and peak (POS) of the growing season for Inner Mongolian grasslands using gross primary productivity data (2000–2018). We investigated the spatiotemporal changes of SOS and POS and elucidated the mechanisms behind these changes by analyzing how these phenological events were influenced by the specific preseason climatic requirements (precipitation, air temperature, and solar radiation). Our results revealed that the SOS significantly advanced at a rate of 0.65 days/a, while the POS was stable across the study area. At the pixel scale, areas with initially later SOS and POS exhibited stronger advanced trends. An earlier SOS and POS were associated with lower thermal requirements, including air temperature and solar radiation. Conversely, a delayed SOS and POS necessitated higher climatic requirements. The impact of preseason precipitation on both SOS and POS demonstrated notable spatial variability. Moreover, the effects of different climatic factors on phenology were not in sync due to regional environmental disparities. Our study provides insight into the mechanisms underlying phenological shifts in grassland ecosystems under climate change.
1 Introduction
Climate change profoundly impacts terrestrial ecosystems (Alatalo et al., 2016; Maestre et al., 2016). Plants can track environmental changes and adjust their survival and reproductive strategies to optimize resource utilization (Anderson et al., 2012). For example, vegetation green-up date in the spring has advanced with global warming across different biomes in the Northern Hemisphere over the past few decades (Shen et al., 2011; Buitenwerf et al., 2015; Izquierdo-Verdiguier et al., 2018). These phenological shifts reflect the biological responses of ecosystems to climate change (Iler et al., 2021) and could alter the interactions between ecosystems and climate systems through carbon turnover, water cycle, and energy fluxes between the land and atmosphere (Richardson et al., 2013; Buitenwerf et al., 2015; Chu et al., 2016; Gonsamo et al., 2018). For example, gross primary productivity (GPP), as the foundation of the carbon cycle of an ecosystem, is highly regulated by the phenology (Wang et al., 2020; Wu et al., 2022). Hence, understanding the variations in vegetation phenology and their driving mechanisms is vital to cope with changes in the biosphere and climate systems.
Inner Mongolian grasslands in China, which constitute a significant part of the Eurasian steppe, play a vital role in maintaining the stability of ecosystems globally and supporting regional development (Liu et al., 2022; Wang et al., 2022a). These grasslands provide various ecological functions and services such as the sustenance of livestock products and soil erosion control. Moreover, they have scarce and uneven precipitation, with extreme temperature fluctuations (Fan et al., 2020). Under harsh and volatile environmental conditions, grasses are especially vulnerable to climate change because most of them are shallow-rooted and short-lived, and in a simple community structure (Xiao et al., 1995; He, 2017). Therefore, climate-induced phenological shifts in Inner Mongolian grasslands are remarkable and deserve more attention.
Previous studies on grassland vegetation phenology in Inner Mongolia have focused on spring and autumn phenology and examined how the start and end of the growing season (SOS and EOS, respectively) respond to global climate change (Ren et al., 2017, 2019; Fan et al., 2020; Liu et al., 2022). These key growth stage indicators have been used as proxies for vegetation phenology and provide insights into the entire vegetation life cycle. However, the dynamics of summer phenology, namely the peak of the growing season (POS), have received less attention. During the early growing season (from the SOS to the POS), plants have high nutritional quality and good palatability for herbivores (Morellato et al., 2016; Robles Jimenez et al., 2021). Moreover, the POS marks the transition in vegetative photosynthetic activity from the growth phase to the decay phase (Gonsamo et al., 2018), implying that resource availability for livestock may decrease. Hence, how phenology shifts during the early growing season must be investigated to provide a basis for the management and conservation of grassland ecosystems.
Moreover, phenological shifts can be driven by various climatic factors, such as air temperature and precipitation (Liu et al., 2016; Du et al., 2019). However, research findings have been inconsistent. For instance, Ren et al. (2017) indicated that from 2000 to 2016, increased air temperature advanced the SOS in the meadow steppe but delayed it in the typical and desert steppes in Inner Mongolia. In contrast, in situ observations at eight sites in the Inner Mongolian grasslands showed that a warming climate contributed to earlier SOS for the three steppe types (Wang et al., 2019). Similar uncertainties exist regarding the effects of precipitation on phenological shifts (Miao et al., 2017; Wang et al., 2022b). Such different climatic impacts imply different mechanisms underlying the phenological shifts. Furthermore, the changing climate can influence vegetation growth through complex temporal effects and asynchronously (Anderegg et al., 2015; Zhou et al., 2022). An advance or delay in a phenological event is influenced strongly by cumulative precipitation and heat during the preseason (a specific period before the phenological event) (Guo et al., 2015; Wang et al., 2020). These cumulative climate effects may reflect inherent vegetation requirements (Wang et al., 2022a). However, the definition of the preseason and its determination lacks consensus. Mostly, a fixed day of the calendar year is set as the start of the period with a relatively long time step (e.g., one month) (Liu et al., 2016; Gusewell et al., 2017; Ma et al., 2022). However, this approach may result in mismatches between the preseason and plant lifecycles or climate cycles and conceal the intrinsic capacity of plants to adapt to changing climates (Munson and Long, 2017). Additionally, it remains unclear whether the mechanisms driving phenological changes vary depending on the plant growth stage.
The overall goal of our study was to illuminate the mechanisms underlying shifts in vegetation phenology during the early growing season (between SOS and POS) across Inner Mongolian grasslands from 2000 to 2018. To achieve it, we measured the preseason for the SOS and POS from a statistical perspective and at the day level. We investigated the spatiotemporal changes in SOS and POS and determined their climatic requirements of precipitation, air temperature, and solar radiation during the preseason. We then discussed how climate affected the SOS and POS. These findings enhanced our understanding of grassland ecosystem responses in a changing environment and informed effective management and conservation strategies.
2 Materials and methods
2.1 Study area
Inner Mongolia (37.4°–53.4°N, 97.2°–126.1°E) is located in northern China. It has long, cold winters and short, warm, wet summers. The annual precipitation varies from less than 100 mm to approximately 450 mm from west to east and is usually concentrated in June and July. The annual mean temperature ranges from -3.2°C in the north to 11.5°C in the south (Gong et al., 2015; Fan et al., 2020).
The present study focused on the Inner Mongolian grasslands that occupy 22% of China’s total grassland area and mainly comprise three types of temperate grassland steppe: typical, meadow, and desert steppes (Tong et al., 2023). We selected grassland areas unaltered from 2001 to 2018 to avoid the potential effects of land-cover changes driven by human activities on plant growth (Figure 1). In these areas, different steppes have diverse environmental conditions. For example, the desert steppe is warmer and drier than typical and meadow steppes, whereas the meadow steppe is the coldest and wettest. The multiannual averages of the climatic conditions from 2000 to 2018 are listed in Supplementary Table S1.
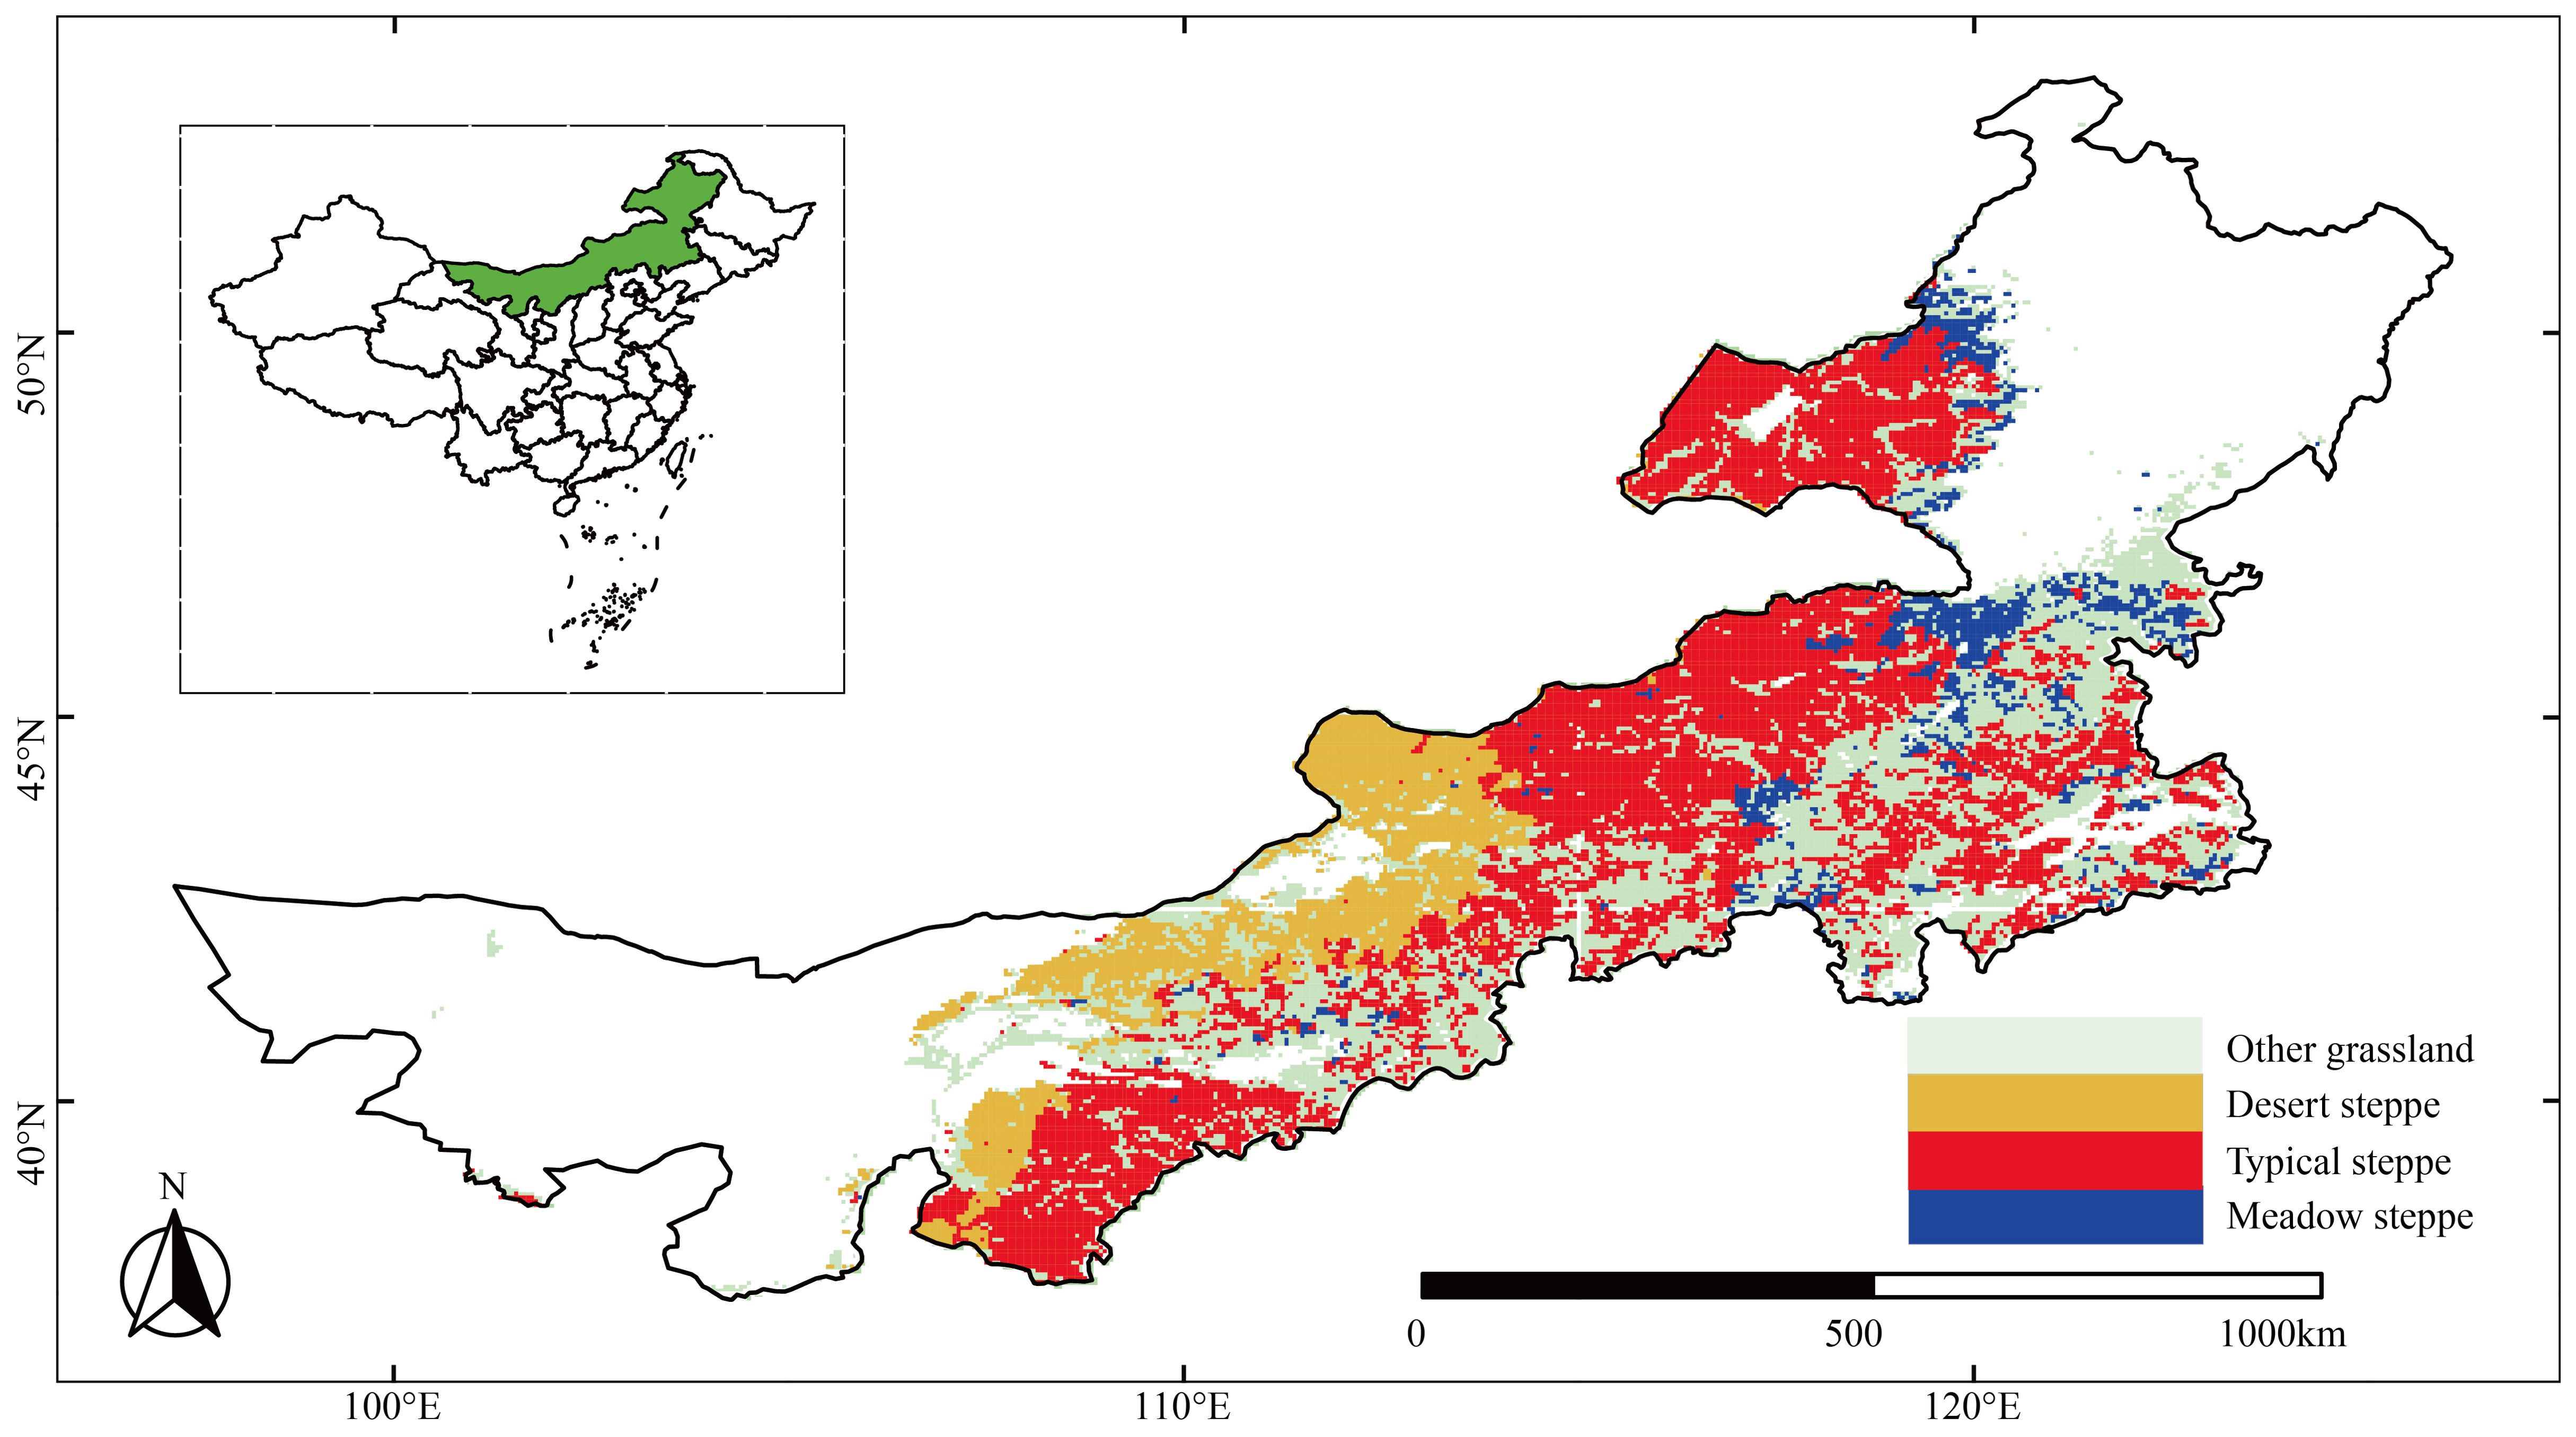
Figure 1. Distribution of grassland areas unaltered from 2000 to 2018, including three main types of steppes in Inner Mongolia. The top left inset of the panel shows the geographic location of the study area in China.
2.2 Data resources
The study utilized an 8-day 0.05° gross primary productivity (GPP) dataset (https://data.tpdc.ac.cn/zh-hans/data/582663f5-3be7-4f26-bc45-b56a3c4fc3b7) to derive the SOS and POS from 2000 to 2018. This dataset was produced using an improved vegetation photosynthesis model (VPM) and driven by satellite data from the Moderate-resolution Imaging Spectroradiometer (MODIS) and climate data from the National Centers for Environmental Prediction (Reanalysis II). It enhanced accuracy in capturing vegetation photosynthesis by controlling plant function type-specific parameters for C3 and C4 plants and eliminated possible errors due to low-quality or missing data using a novel gap-filling and smoothing algorithm (Zhang et al., 2017).
To examine the effects of climatic factors on the SOS and POS, we obtained 0.1° gridded near-surface daily meteorological data from the National Tibetan Plateau Data Center (https://data.tpdc.ac.cn/zh-hans/data/8028b944-daaa-4511-8769-965612652c49) (He et al., 2020). In the present study, the precipitation, air temperature, and solar radiation during 1999–2018 were employed.
We used the grassland data layer from the MODIS Terra/Aqua Combined Land Cover Type Yearly product with a spatial resolution of 0.05° (https://lpdaac.usgs.gov/products/mcd12c1v006). Employing the International Geosphere-Biosphere Program classification scheme, we selectively extracted the pixels identified as grassland for the period from 2001 to 2018 (data for 2000 was not available) to ensure consistency in the land cover throughout the study period. We further classified the grasslands into three types of steppe: desert, typical, and meadow. This classification was based on a 1:1,000,000 vegetation-type map of China in the 1980s (https://poles.tpdc.ac.cn/zh-hans/data/eac4f2cf-d527-4140-a35d-79992957f043/), which is a dataset compiled by the Editorial Committee for the Chinese Vegetation Map of the Chinese Academy of Sciences and organized by the Institute of Botany of the Chinese Academy of Sciences (Zhang, 2007).
2.3 Statistical analyses
2.3.1 Generalized additive model for deriving phenological metrics
We used a generalized additive model (GAM) as a smoothing approach to fit the raw 8-day GPP data to an annual cumulative growth curve for each pixel. The GAM is a nonparametric fitting method that allows various relationships (either linear or non-linear) between the response variable and explanatory variable(s). This method enabled us to reduce the potential uncertainty resulting from fluctuations in vegetation growth caused by changes in environmental conditions (Ravindra et al., 2019; Ma et al., 2022). In the present study, we treated GPP as the dependent variable and day of the year (DOY) as the independent variable. Thin plate regression splines were used as the smoothing function, and the number of base dimensions (k) was set to the default value (Chen et al., 2024). The smoothing parameter was selected using the Generalized Cross-Validation (GCV) method, which is an automated and robust approach to parameter selection (Wood, 2017). To maintain consistency across the study area and improve computational efficiency, the parameters were kept identical for all pixels. In addition, before fitting the models, we removed pixels with missing values and anomalies in the raw GPP time series. Finally, the average adjusted R squared across the study area was over 95%. Based on the fitted GPP time-series curve, we defined the SOS for each pixel as the first day on which the cumulative curve reached 10% of the maximum in the current year. The POS was determined as the day on which the curve peaked (Xu et al., 2016a; Yang et al., 2019). Moreover, we calculated the SOS and POS across different steppes by averaging the corresponding values from all pixels within each specific steppe area. Similarly, a regional-scale analysis was conducted by averaging the SOS and POS values from all pixels across the study area. Thus, we had phenological estimates at three distinct scales: pixel, steppe type, and the whole study area.
2.3.2 Temporal variations in vegetation phenology
The temporal trends of the SOS and POS over 2000–2018 were calculated by the linear regression model at pixel, steppe, and regional scales. The significance of the temporal trend was tested using a t-test.
Additionally, to investigate the magnitudes of change in the SOS and POS from 2000 to 2018, we compared these phenological metrics between the beginning and end periods at the steppe scale. To eliminate the uncertainties caused by an abnormal SOS/POS in the specific year(s), we first calculated the average multiannual SOS/POS for each pixel during 2000–2004 and 2014–2018. The selection of five-year period was chosen based on a previous study (Ren et al., 2017). We then compared the SOS/POS variations using one-way ANOVA for the desert, typical, and meadow steppes separately.
2.3.3 Climatic requirements for phenological events
To calculate the climatic requirement (i.e., precipitation, air temperature, and solar radiation) for the SOS and POS, we first determine the optimal preseason length for each climatic factor.
First, we predefined a range of preseason lengths from 1 to 240 days, increasing one day at a time, before the SOS/POS for each year from 2000 to 2018. For example, if the SOS was DOY 100 in 2001, the predefined preseasons ranged from DOY 99, DOY 98, and so on, back to DOY 225 in 2000. Next, we fitted a series of linear regression models for each pixel. In these models, the SOS/POS was the dependent variable, and the accumulated total volume of a climatic variable during the corresponding preseason was the independent variable. For each climatic factor, we constructed pixel models based on 19 paired samples (one for each year) of SOS/POS and the accumulative climatic variables during the 240 predefined preseason periods from 2000 to 2018. Thus, each pixel had 240 potential models. From these 240 models, we identified the optimal model with the highest determination coefficient (R2) (Wang et al., 2022a). Using this optimal model, we determined the overall optimal preseason for 2000–2018 and the cumulative total volume of the climatic variable during the optimal preseason. This cumulative value represents the climatic requirement for the SOS/POS (Supplementary Figure S1). Each climatic variable was processed according to the above steps.
We determined the start date of the optimal preseason for each pixel by subtracting the optimal preseason length from the average multiannual phenological dates from 2000 to 2018.
2.3.4 Relationships between vegetation phenological shifts and climatic requirements
We calculated the Pearson correlation coefficient between the SOS/POS and climatic requirements to evaluate their relationships at the pixel scale.
To ensure data consistency, we processed all spatial datasets to the same geographic extent and spatial resolution (0.05°) before the statistical analyses. The significance of all statistical analyses was tested at the 95% level. We performed all analyses and graphical outputs using R version 4.1.3 (https://www.r-project.org).
3 Results
3.1 Spatiotemporal variations in vegetation phenological changes
3.1.1 Spatial patterns of vegetation phenology
The average multiannual SOS in the Inner Mongolia grasslands occurred primarily in late April and May, with a regional mean of DOY 130 ± 13, while the average multiannual POS occurred mainly in late July and early August, with a regional mean DOY of 209 ± 7. Spatially, SOS showed a gradual delay from east to west (Figure 2A), whereas POS occurred earlier in the central region than at both the western and eastern ends (Figure 2B).
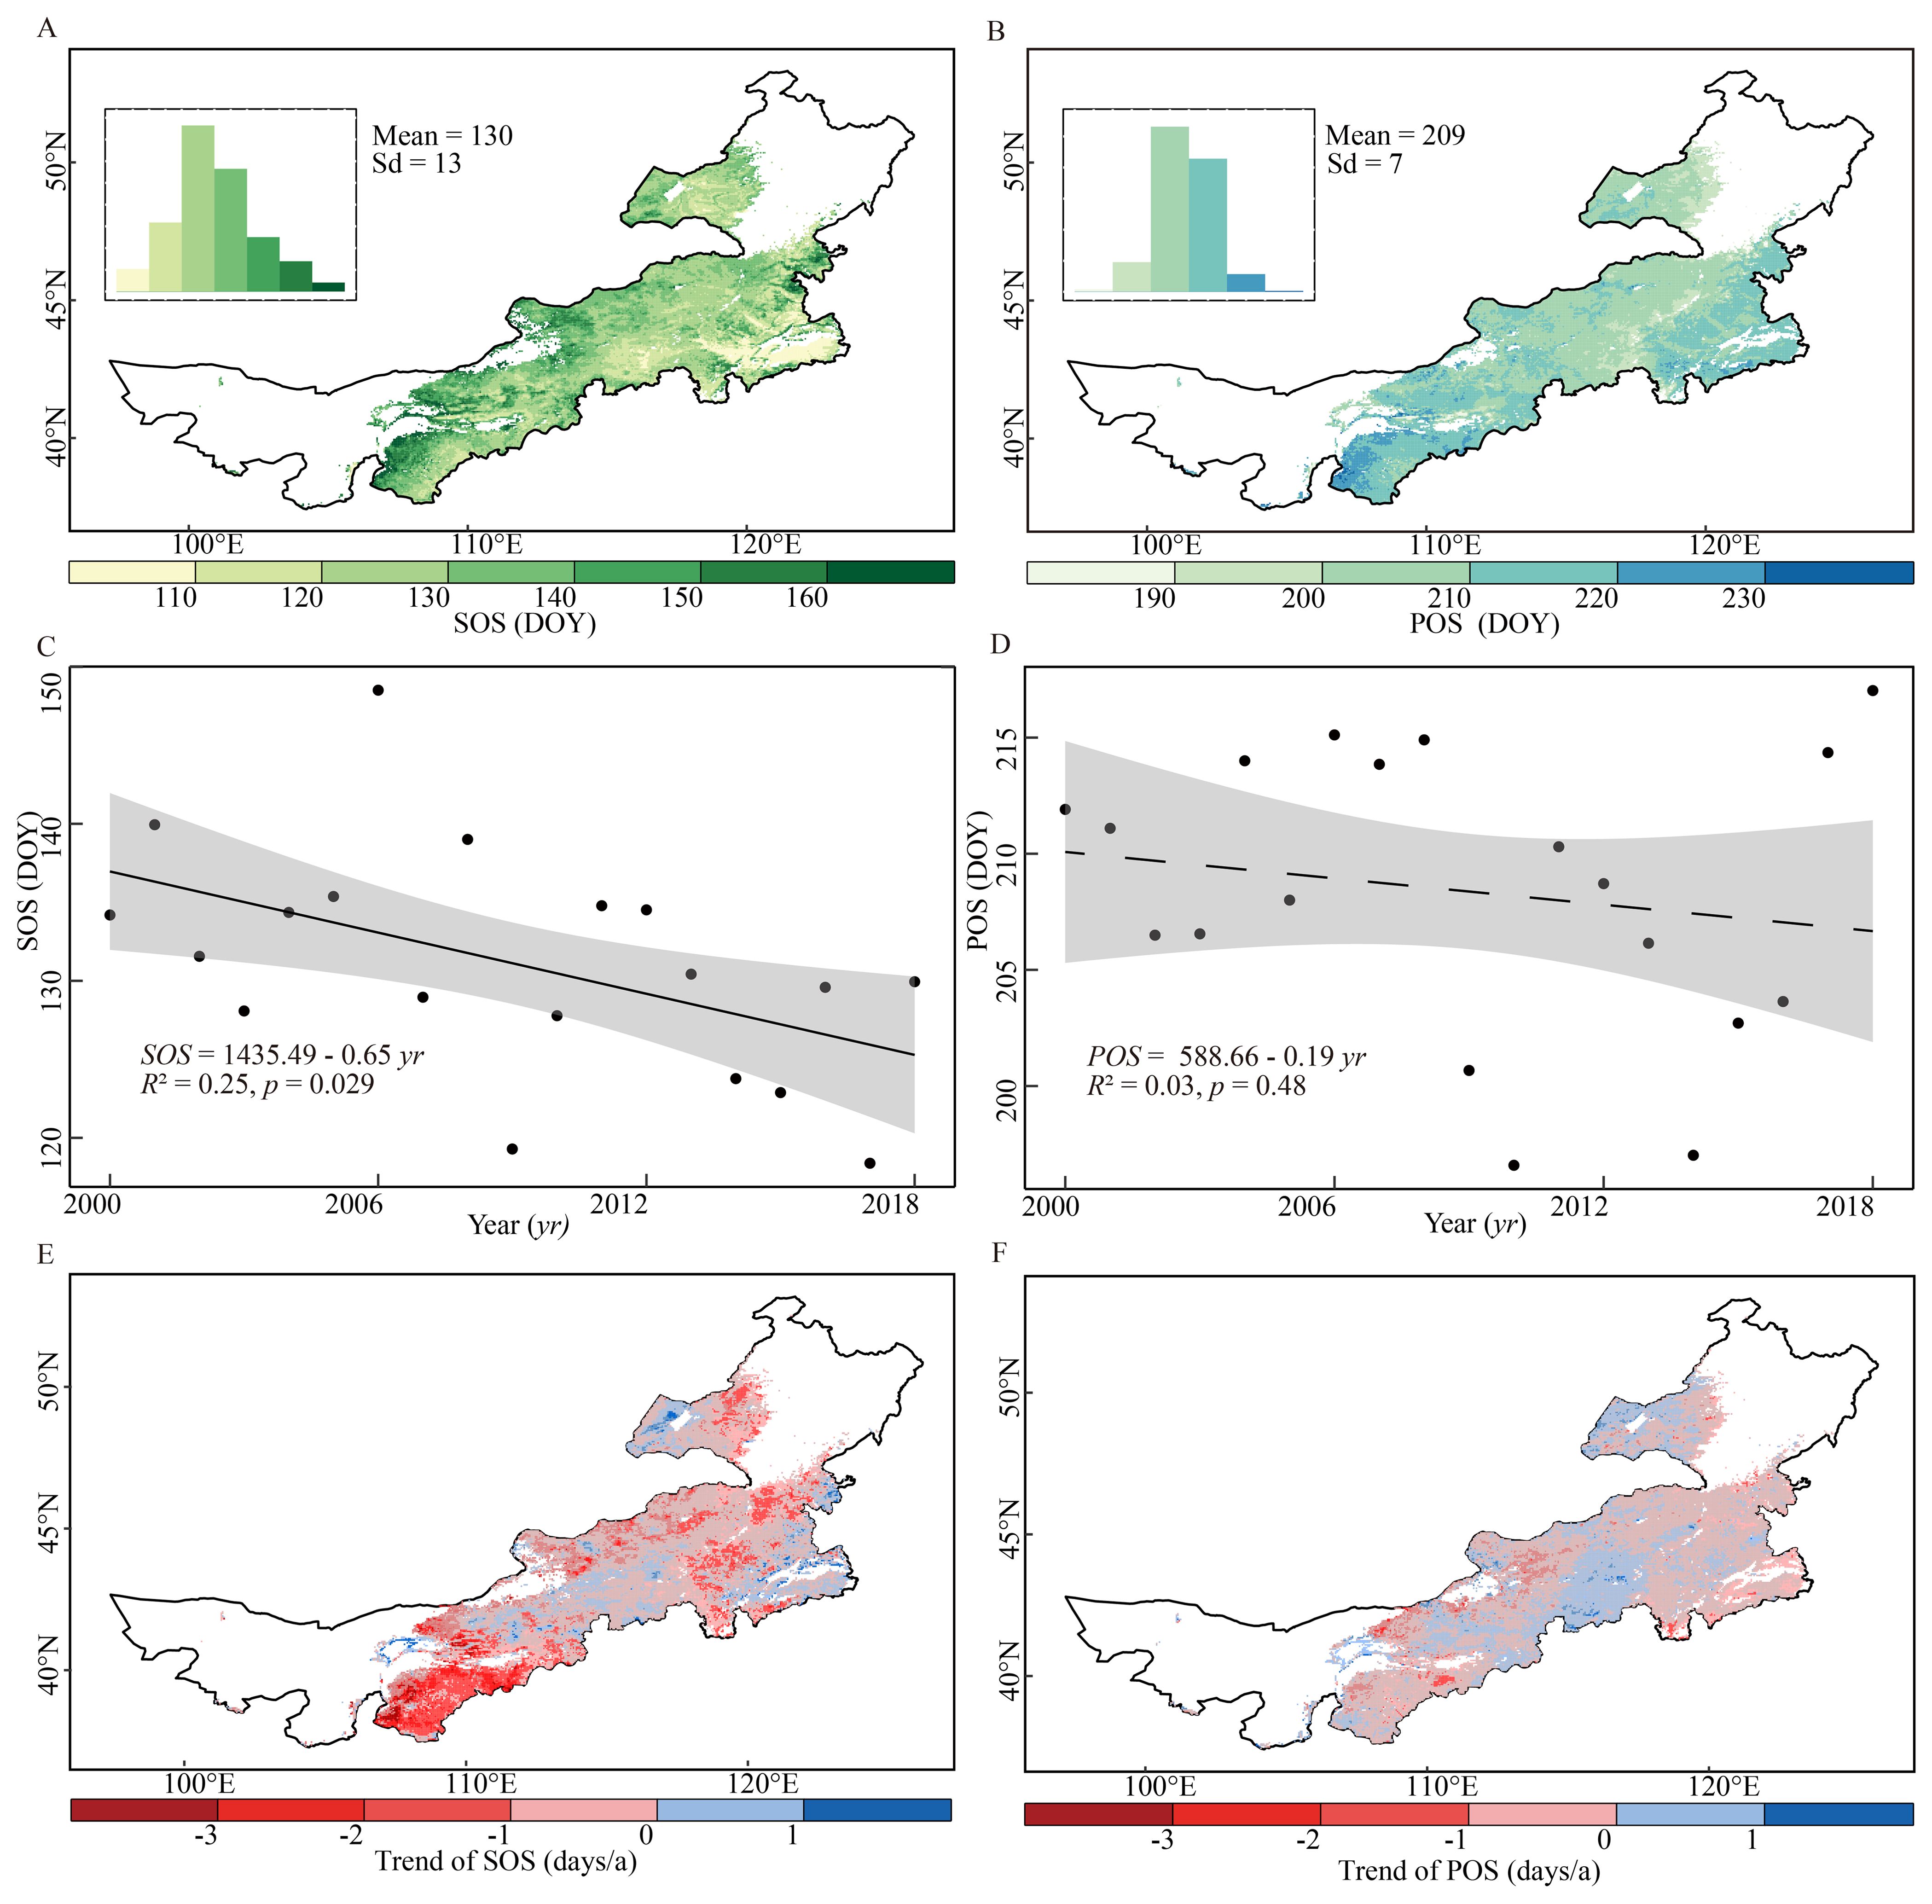
Figure 2. Spatial patterns of the multiannual averages and temporal trends of the start and peak of the growing season (SOS and POS, respectively) in the grasslands of Inner Mongolia over the 2000–2018 period. The top left insets of panels (A, B) show the frequency distributions of SOS and POS, respectively. (C, D) show the annual trends of the regional average SOS and POS, respectively. The shaded areas represent the 90% confidence interval of the estimated slope. (E, F) show the spatial patterns of the annual trends of SOS and POS, respectively. The gray masked areas indicate regions where the trends are not statistically significant. (p > 0.05).
The desert steppe had a significantly later SOS (DOY 142 ± 11) than that of the meadow (DOY 129 ± 10) and typical steppes (DOY 128 ± 11) (Figure 3A), whereas the three steppes had approximately similar (though significantly different) POS (Figure 3B); this suggested that the desert steppe had a significantly shorter early growing season (69 ± 10 days) than that of the typical (81 ± 10 days) and meadow steppes (76 ± 11 days).
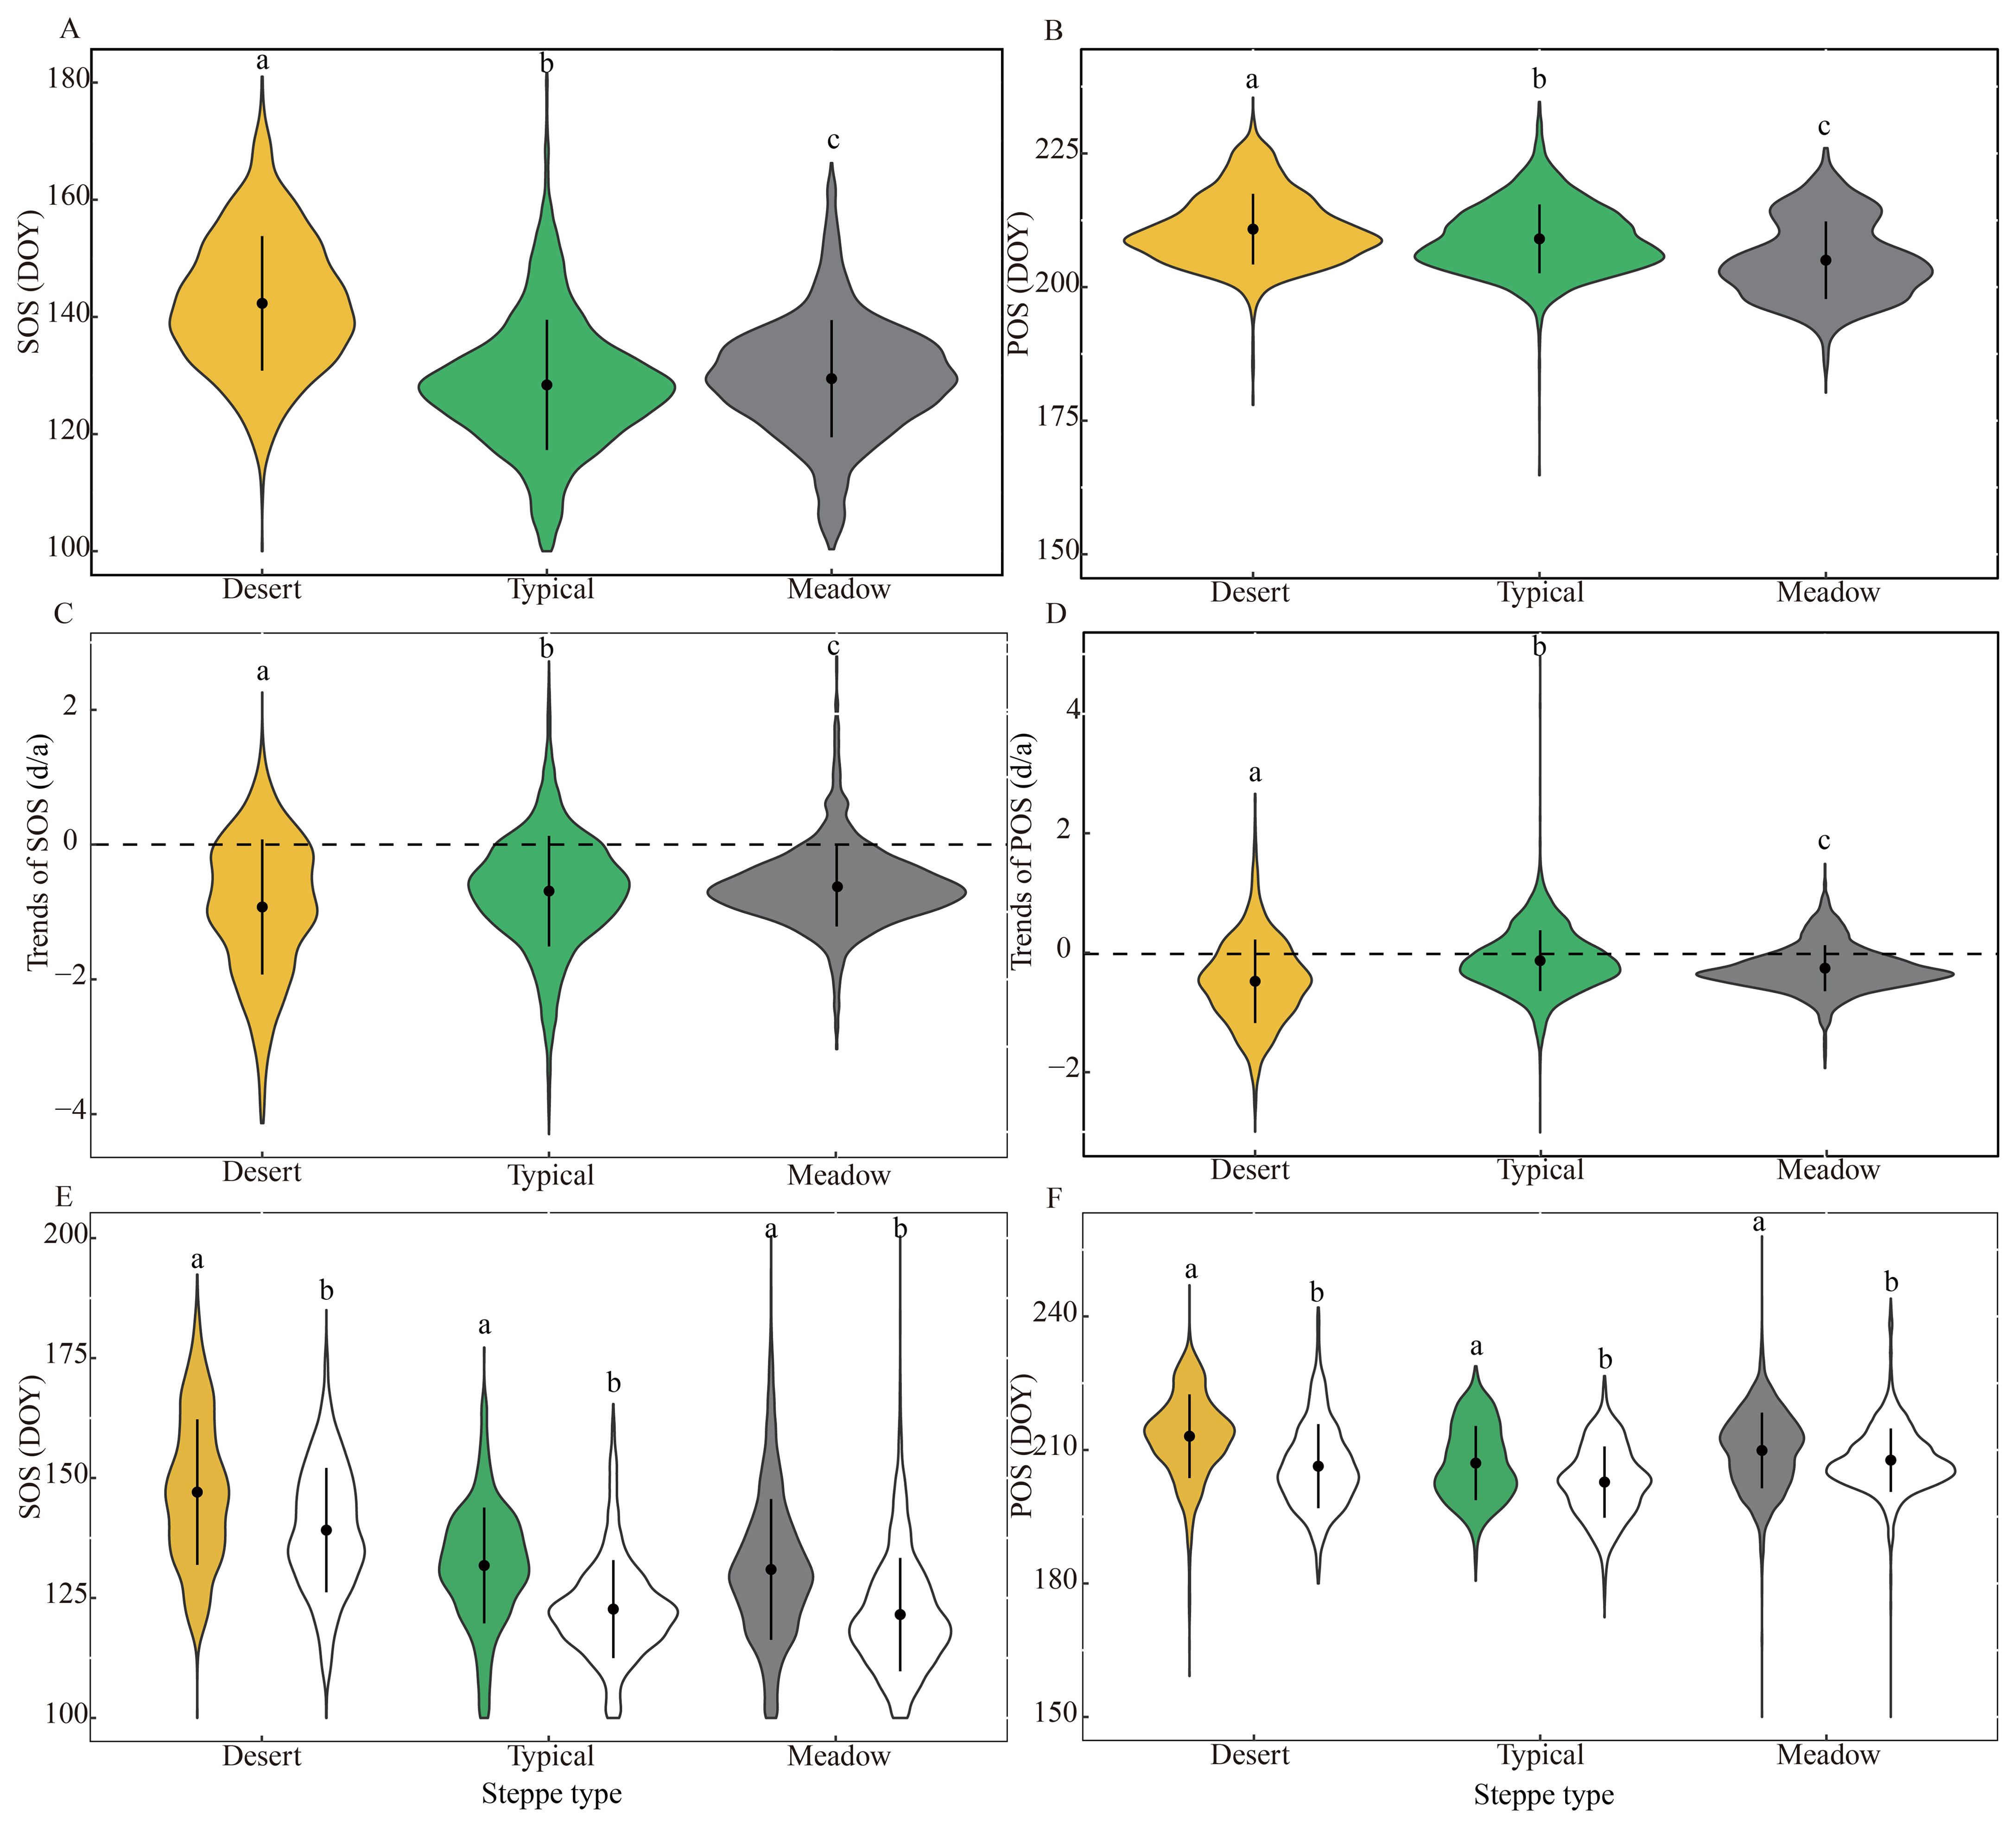
Figure 3. Comparisons of the average multiannual (A, B), frequency of changing trends (C, D), and regional average variation (E, F) of the start and peak of the growing season (SOS and POS, respectively) among desert, typical, and meadow steppes. ion (d). The different letters indicate there is a significant difference between the two variables (p < 0.05). In (E, F), the colored and blank items denote the multiannual average during 2000–2004 and 2014–2018, respectively.
3.1.2 Temporal dynamics of vegetation phenology
At the regional scale, both the SOS and POS advanced over time but at different rates. The spatially averaged SOS advanced significantly by 0.65 days/a (p < 0.05), whereas the spatially averaged POS advanced slightly and not significantly by 0.19 days/a (p = 0.48) over 2000–2018 (Figures 2C, D).
At the pixel scale, we observed spatial heterogeneity in the annual trends of SOS and POS across the Inner Mongolian grasslands. A substantial proportion (82.7%) of the grassland areas exhibited an advancing SOS trend, with 34.0% of these changes achieving statistical significance. This trend was most pronounced in the southwest and parts of eastern areas (Figure 2E). Delayed trends of SOS were observed in a few, widely dispersed areas (Figure 2E). For POS, the majority of the study area (68.0%) exhibited advanced trends, yet only 9.4% of these were statistically significant. Approximately a third of the grasslands experienced delayed POS, mainly in the central area, and most of these changes were not statistically significant (Figure 2F).
At the steppe scale, all three steppes experienced an overall advancing trend, and their trend strengths for both SOS and POS significantly differed (Figures 3C, D). The desert steppe had the strongest advancing trends for both SOS (-0.93 ± 1.00 days/a, p = 0.20) and POS (-0.48 ± 0.70 days/a, p = 0.43). The typical steppe (-0.69 ± 0.82 days/a, p < 0.05) showed a stronger advancing SOS trend than the meadow steppe (-0.62 ± 0.60 days/a, p < 0.05). In contrast, for POS, the meadow steppe (-0.24 ± 0.38 days/a, p = 0.29) had a stronger advancing trend than the typical steppe (-0.13 ± 0.51 days/a, p = 0.74). Regarding the magnitudes of phenological shifts, we found that SOS advanced significantly by an average of nine days for all three steppes (Figure 3E), and POS occurred earlier by an average of seven, four, and two days for the desert, meadow, and typical steppes, respectively, between 2000–2004 and 2014–2018 (Figure 3F).
Furthermore, we found that the areas where SOS and POS tended to advance more over time were those where they occurred later (Figures 2A, B, E, F), which could also be confirmed by the results among different steppes. The SOS trends were most correlated with SOS for the desert steppe (-0.022), followed by typical (-0.020) and meadow steppes (-0.010) (Supplementary Figure S2A). In comparison, the correlation between the POS and POS trends was stronger for the typical steppe (-0.024) and weaker for the meadow (-0.0078) and desert steppes (-0.0037) (Supplementary Figure S2B).
3.2 Changes in preseason climatic requirements
3.2.1 Start of the growing season
On estimating the average multiannual preseason precipitation requirements across the grasslands, most had a low preseason precipitation requirement (0–30 mm); some areas in the southwestern parts, however, had a high requirement (more than 120 mm) (Figure 4A). Furthermore, we detected an increased trend of preseason precipitation requirements in 61.3% of the grassland areas (28.4% of them were statistically significant) (Figure 4B).
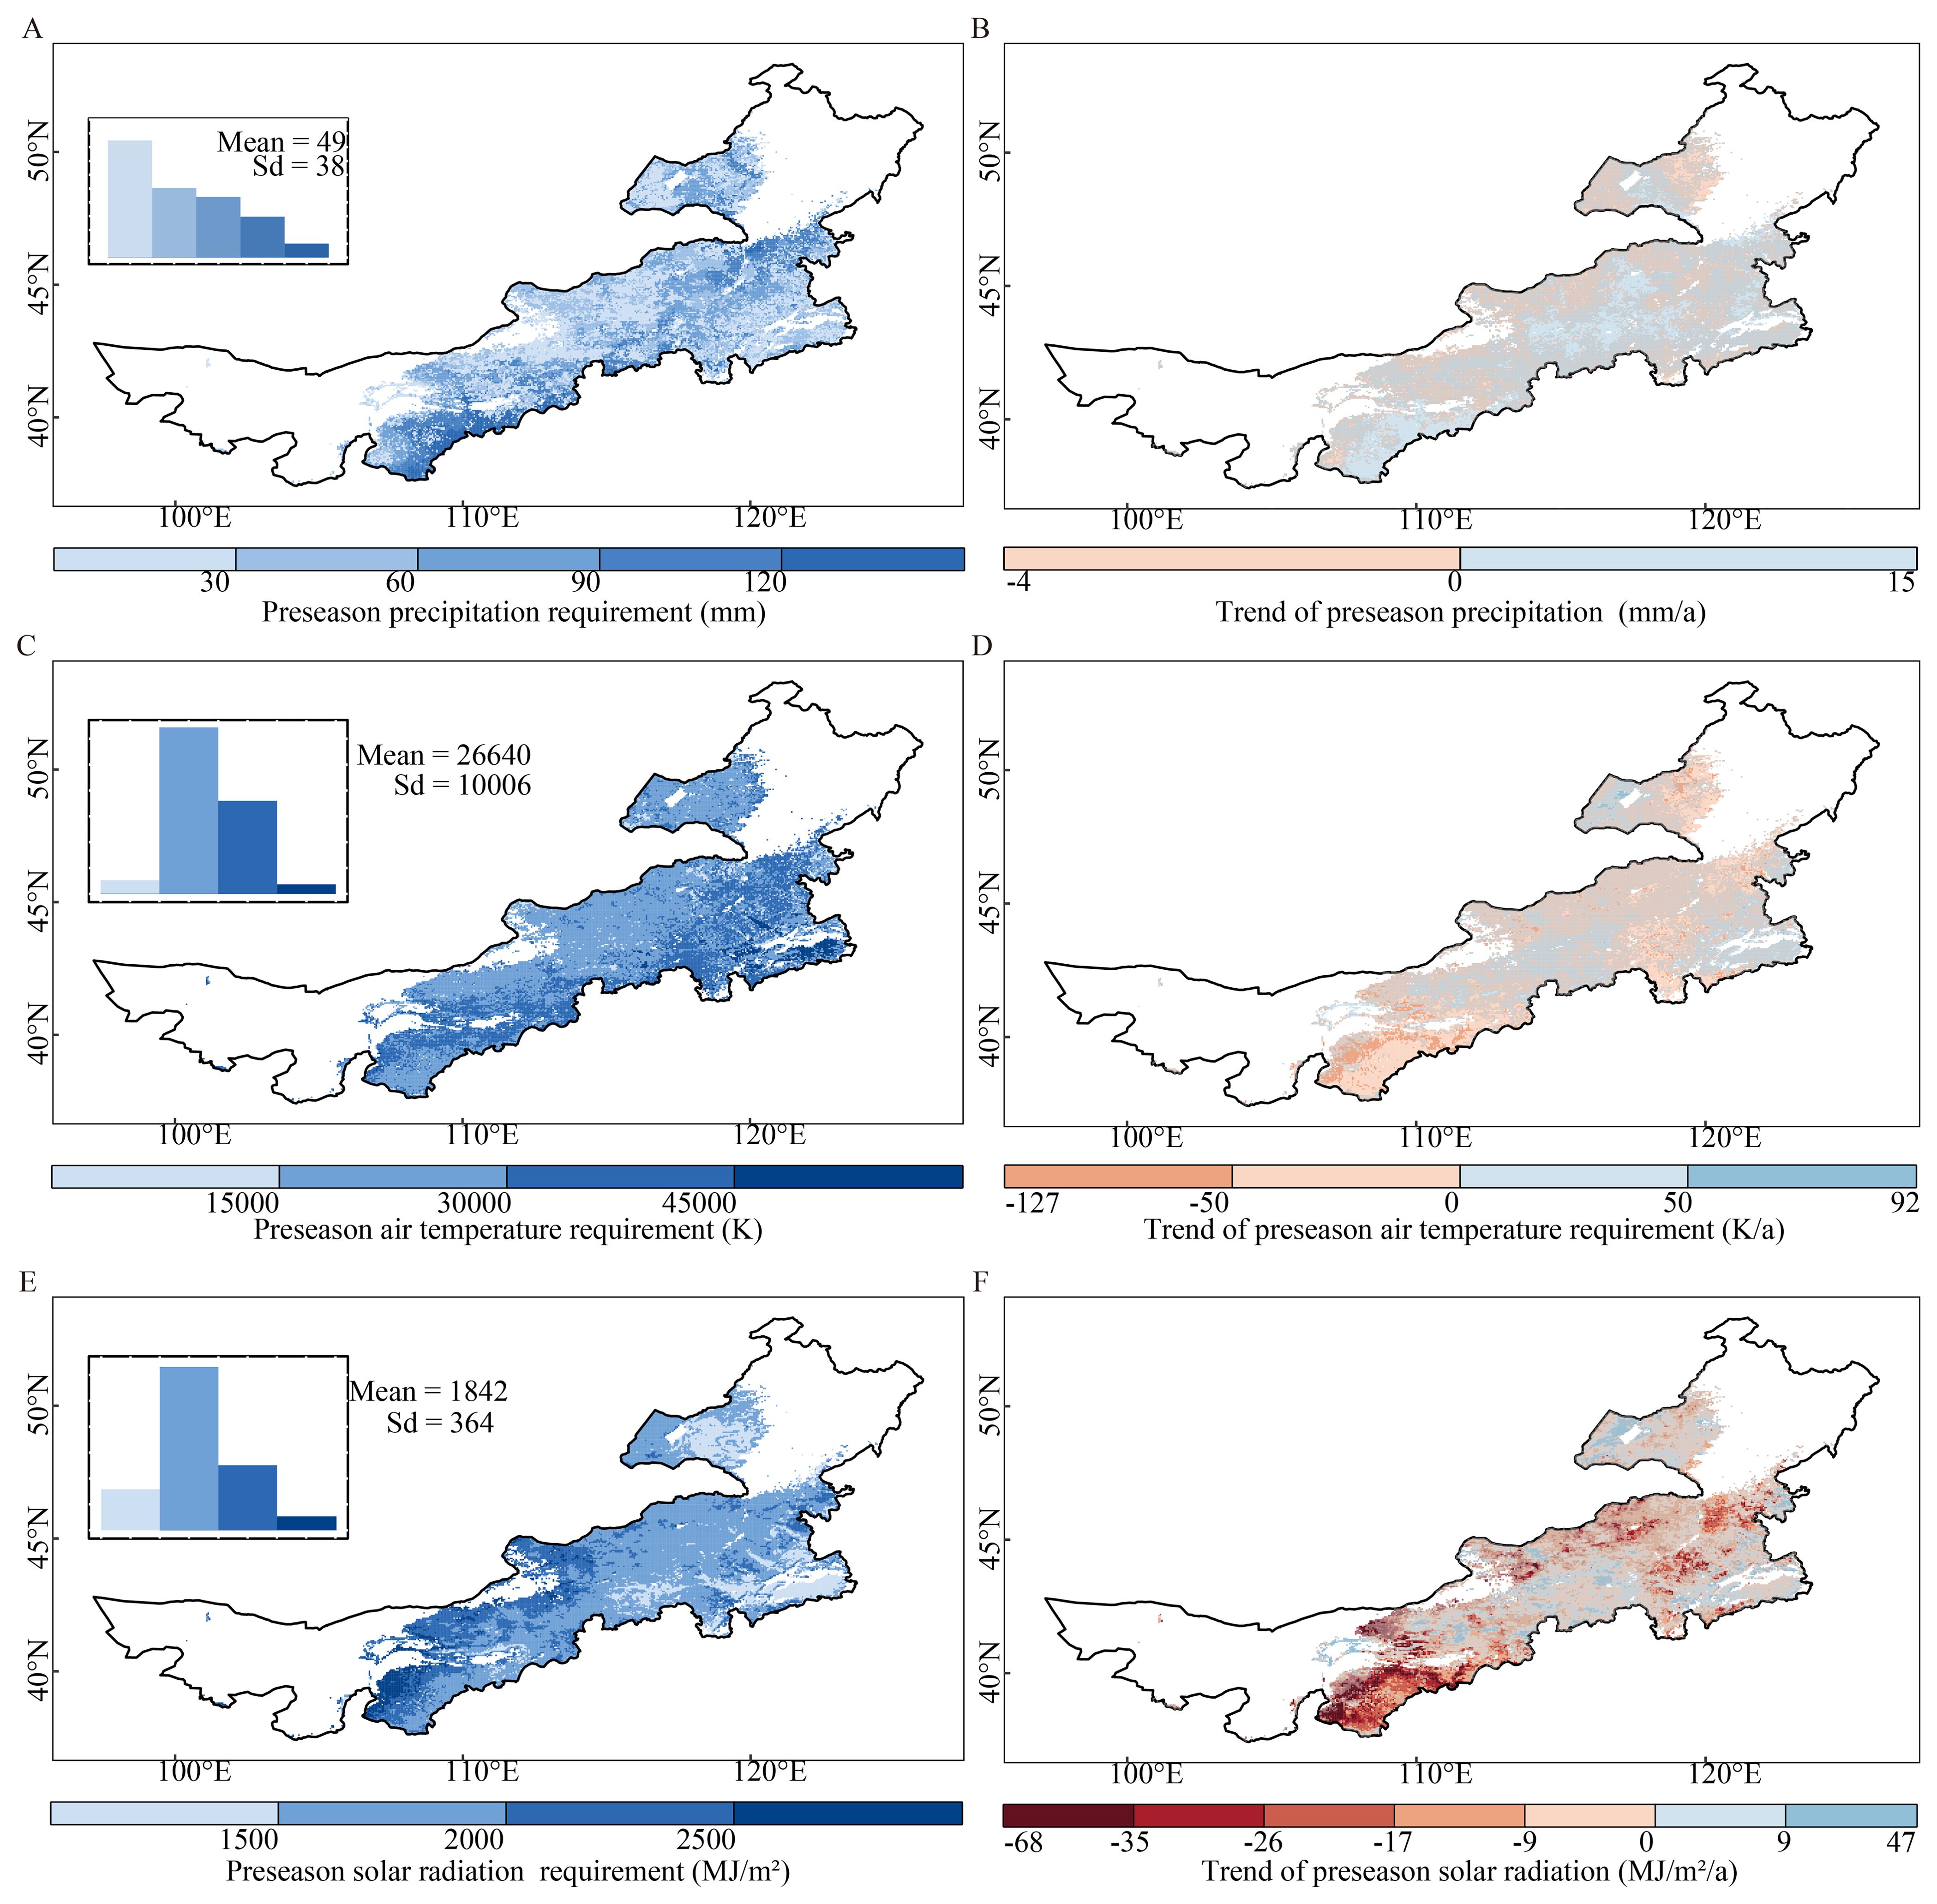
Figure 4. Spatial patterns of average multiannual preseason requirements and annual trends of precipitation (A, B), air temperature (C, D), and solar radiation (E, F) requirements for the start of the growing season during the period 2000–2018 over Inner Mongolia. The top left insets of the left panels (A, C, E) show the frequency distributions of values of each climatic factor. The gray masked areas in the right panels (B, D, F) indicate regions where the trends are not statistically significant. (p > 0.05).
Across the grasslands, the average multiannual preseason air temperature requirement was mainly distributed in the range of 15000–45000 K, with an average of 26640 K. In parts of the southeastern grasslands, the requirements were higher (> 45000 K) than those in the rest of the grasslands (Figure 4C). In addition, 74.6% of the total grassland areas experienced decreased preseason air temperature requirements. Areas with increased trends were situated in parts of the northeastern, southeastern, and central grasslands (Figure 4D).
Most of the grasslands had a moderate preseason solar radiation requirement (1500–2000 MJ/m2), except for some areas in the northeastern and southeastern grasslands that had a low requirement and some areas in the southwestern and northwestern edge of the grassland that had a high requirement (Figure 4E). In addition, the areas with decreased preseason solar radiation requirements accounted for 77.6% of the grasslands (22.3% statistically significant) (Figure 4F).
3.2.2 Peak of the growing season
The average multiannual preseason precipitation requirement for POS was 95 ± 72 mm and it exhibited high spatial variability throughout the grasslands (Figure 5A). We detected an increased trend of preseason precipitation requirements for the POS in 68.0% of the grassland areas (6.8% statistically significant) (Figure 5B). Areas with decreased requirements were mainly located on the northern edge of the grasslands, similar to those for the SOS (Figure 4B).
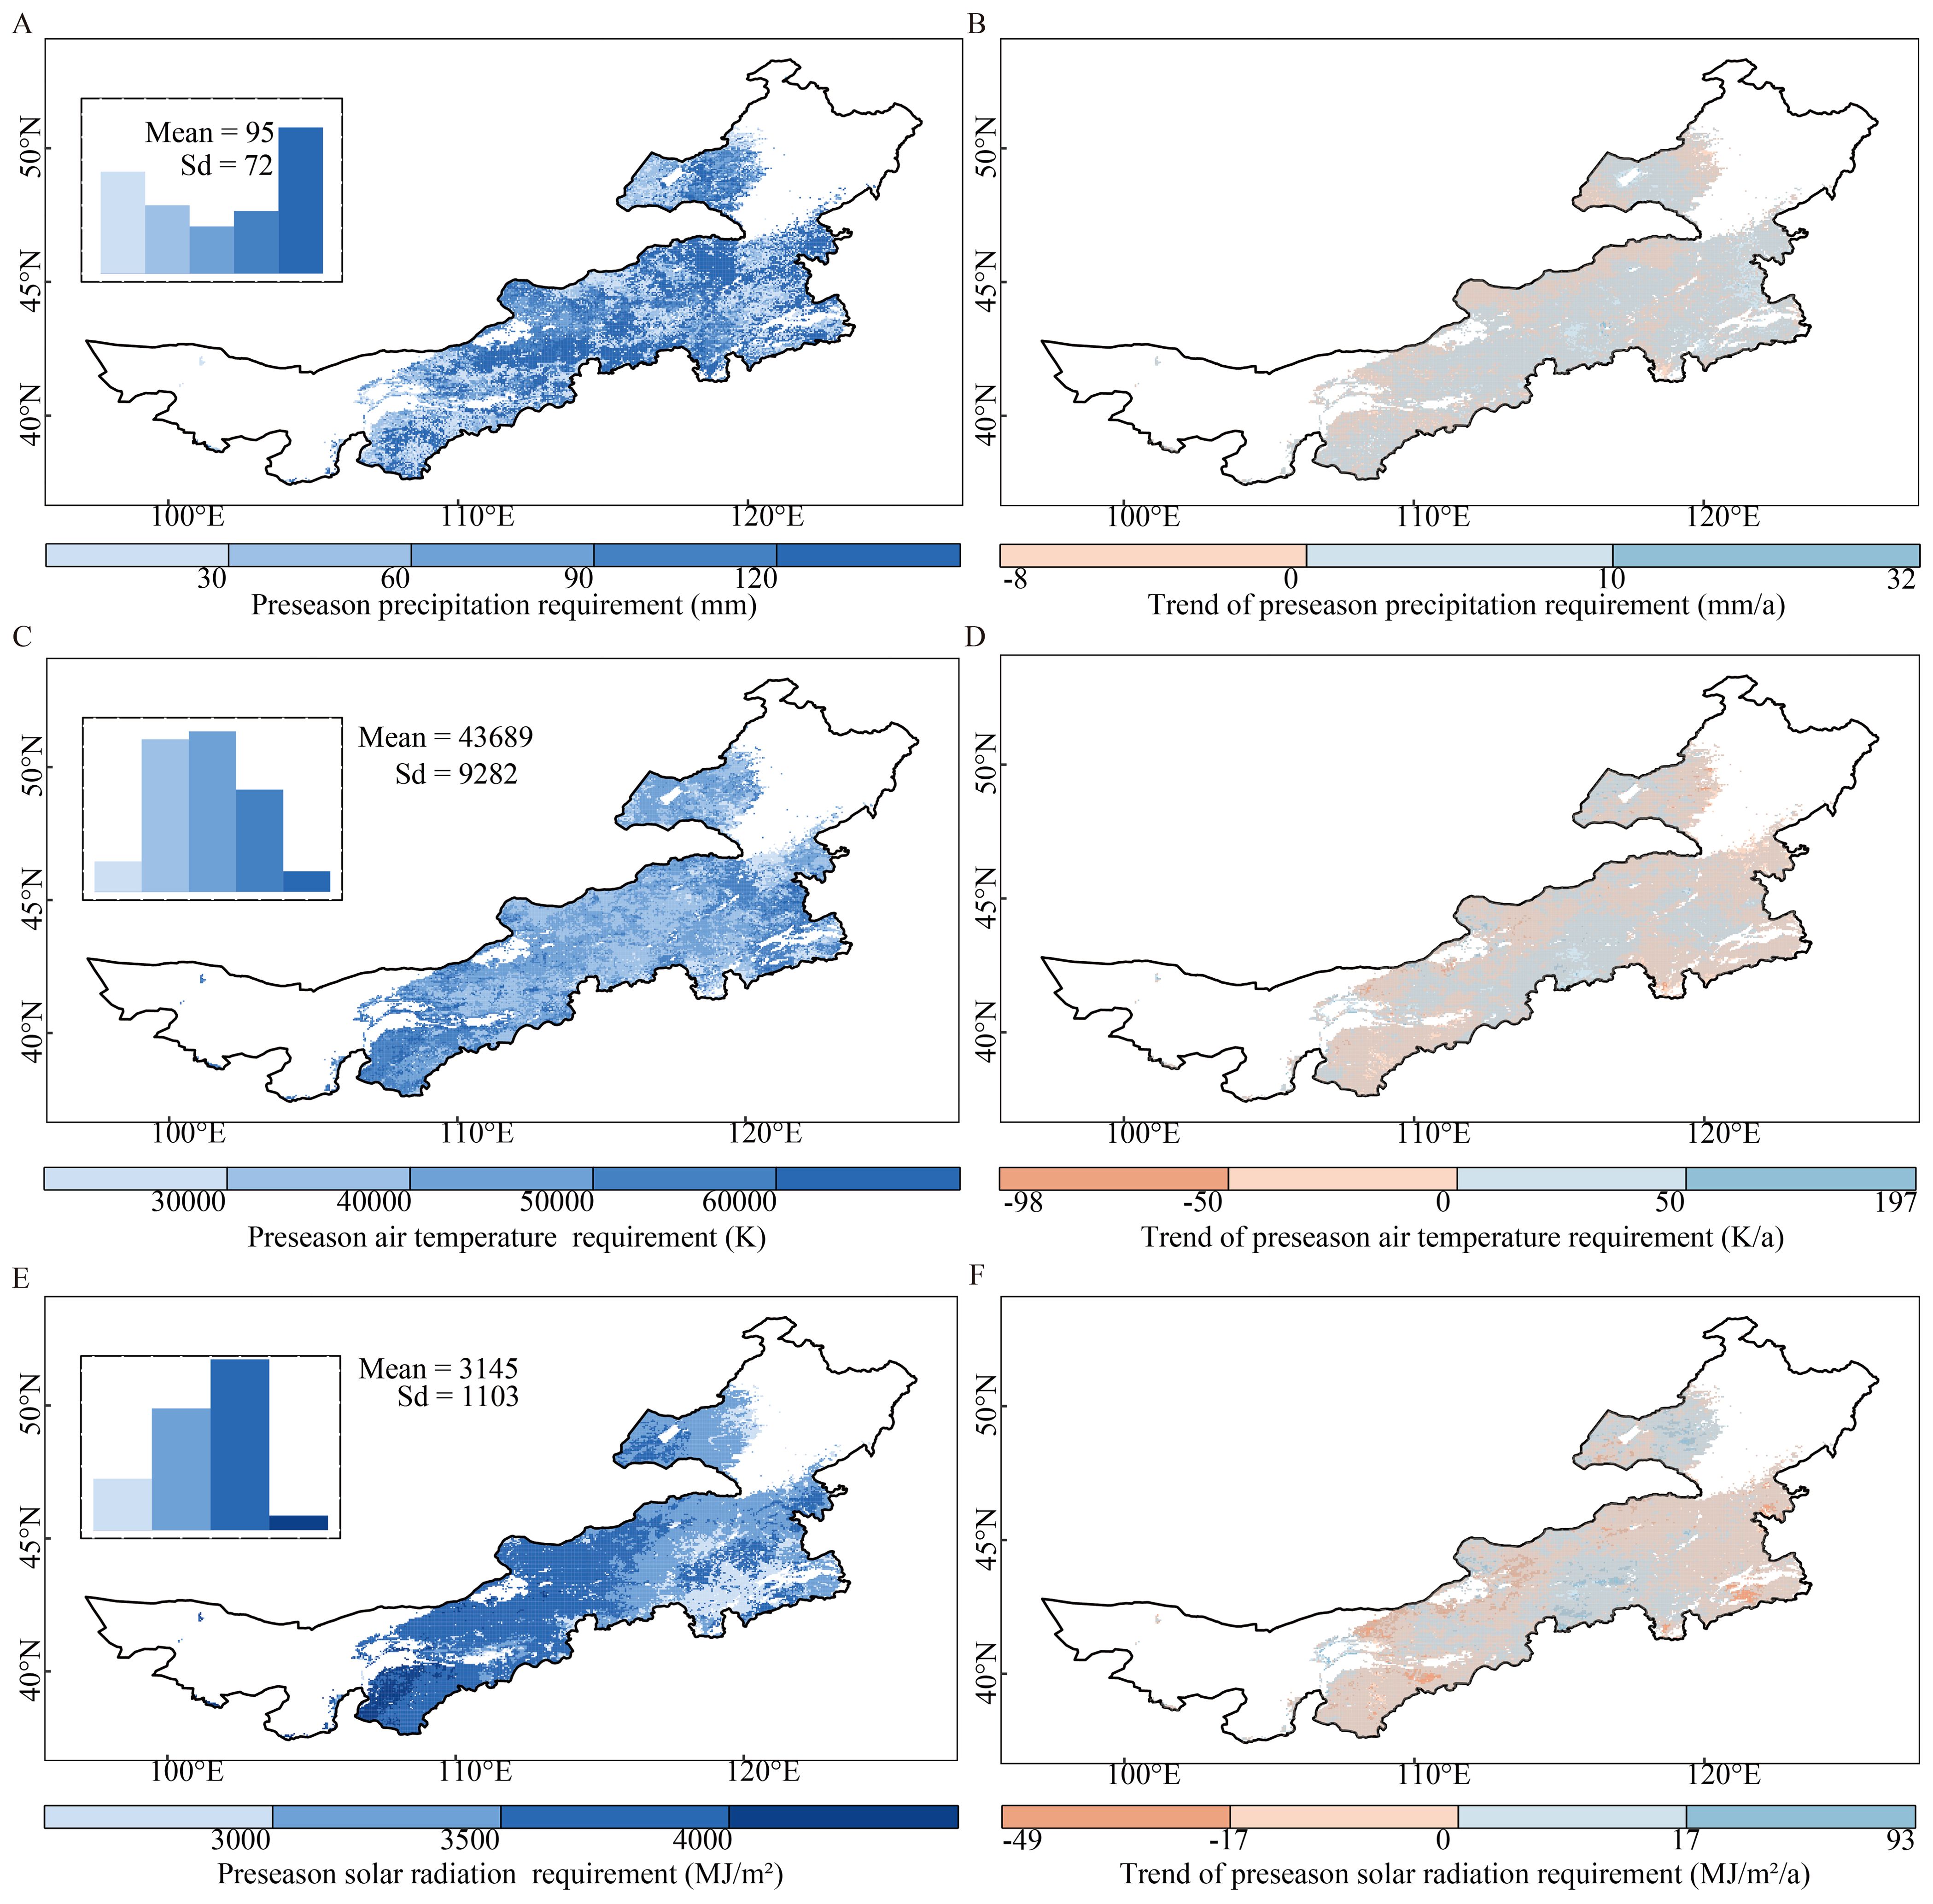
Figure 5. Spatial patterns of average multiannual preseason requirements and annual trends of precipitation (A, B), air temperature (C, D), and solar radiation (E, F) requirements for the peak of the growing season (POS) during the period 2000–2018 over Inner Mongolia. The top left insets of the left panels show the frequency distributions of values of each climatic factor. The gray masked areas in the right panels (B, D, F) indicate regions where the trends are not statistically significant. (p > 0.05).
Across the grasslands, the average multiannual preseason air temperature requirement for the POS was 43689 ± 9282 K. The preseason air temperature requirements were higher in the eastern and western areas than in the central areas (Figure 5C). Moreover, in parts of the central and eastern areas, the preseason air temperature requirements experienced an increased trend (Figure 5D), accounting for 40.3% of the grasslands (4.2% statistically significant).
The average multiannual preseason solar radiation requirement increased from east to west, with a maximum difference of > 3000 MJ/m2 (Figure 5E). We detected an increased trend of preseason solar radiation requirements for POS in 37.2% of the grassland areas (4.2% statistically significant), mainly in the northeast and central areas (Figure 5F).
3.3 Relationships between vegetation phenological shifts and climatic requirements
3.3.1 Start of the growing season
We found that the SOS was positively correlated with both air temperature and solar radiation requirements in almost all study areas. This indicated that vegetation with higher heat requirements tended to start growing later. A significant correlation between the SOS and air temperature requirement was observed in 11.3% of these areas, primarily distributed in northeastern and southeastern areas (Figure 6C). Similarly, the SOS showed a significant correlation with solar radiation requirement in 19.9% of the study area, with a notable concentration in the eastern area (Figure 6E). The regional average correlation coefficients were 0.26 ± 0.19 for air temperature and 0.34 ± 0.17 for solar radiation. The correlation between the SOS and preseason precipitation requirement was weaker at the regional scale (0.095 ± 0.27) and varied more at the pixel scale than the correlations between the SOS and heat requirements. Approximately 62.1% of the grasslands had a positive correlation (12.7% statistically significant) between the SOS and preseason precipitation requirement (Figure 6A). Interestingly, this spatial pattern was similar to that of the optimal preseason length of precipitation for the SOS (Supplementary Figure S3A).
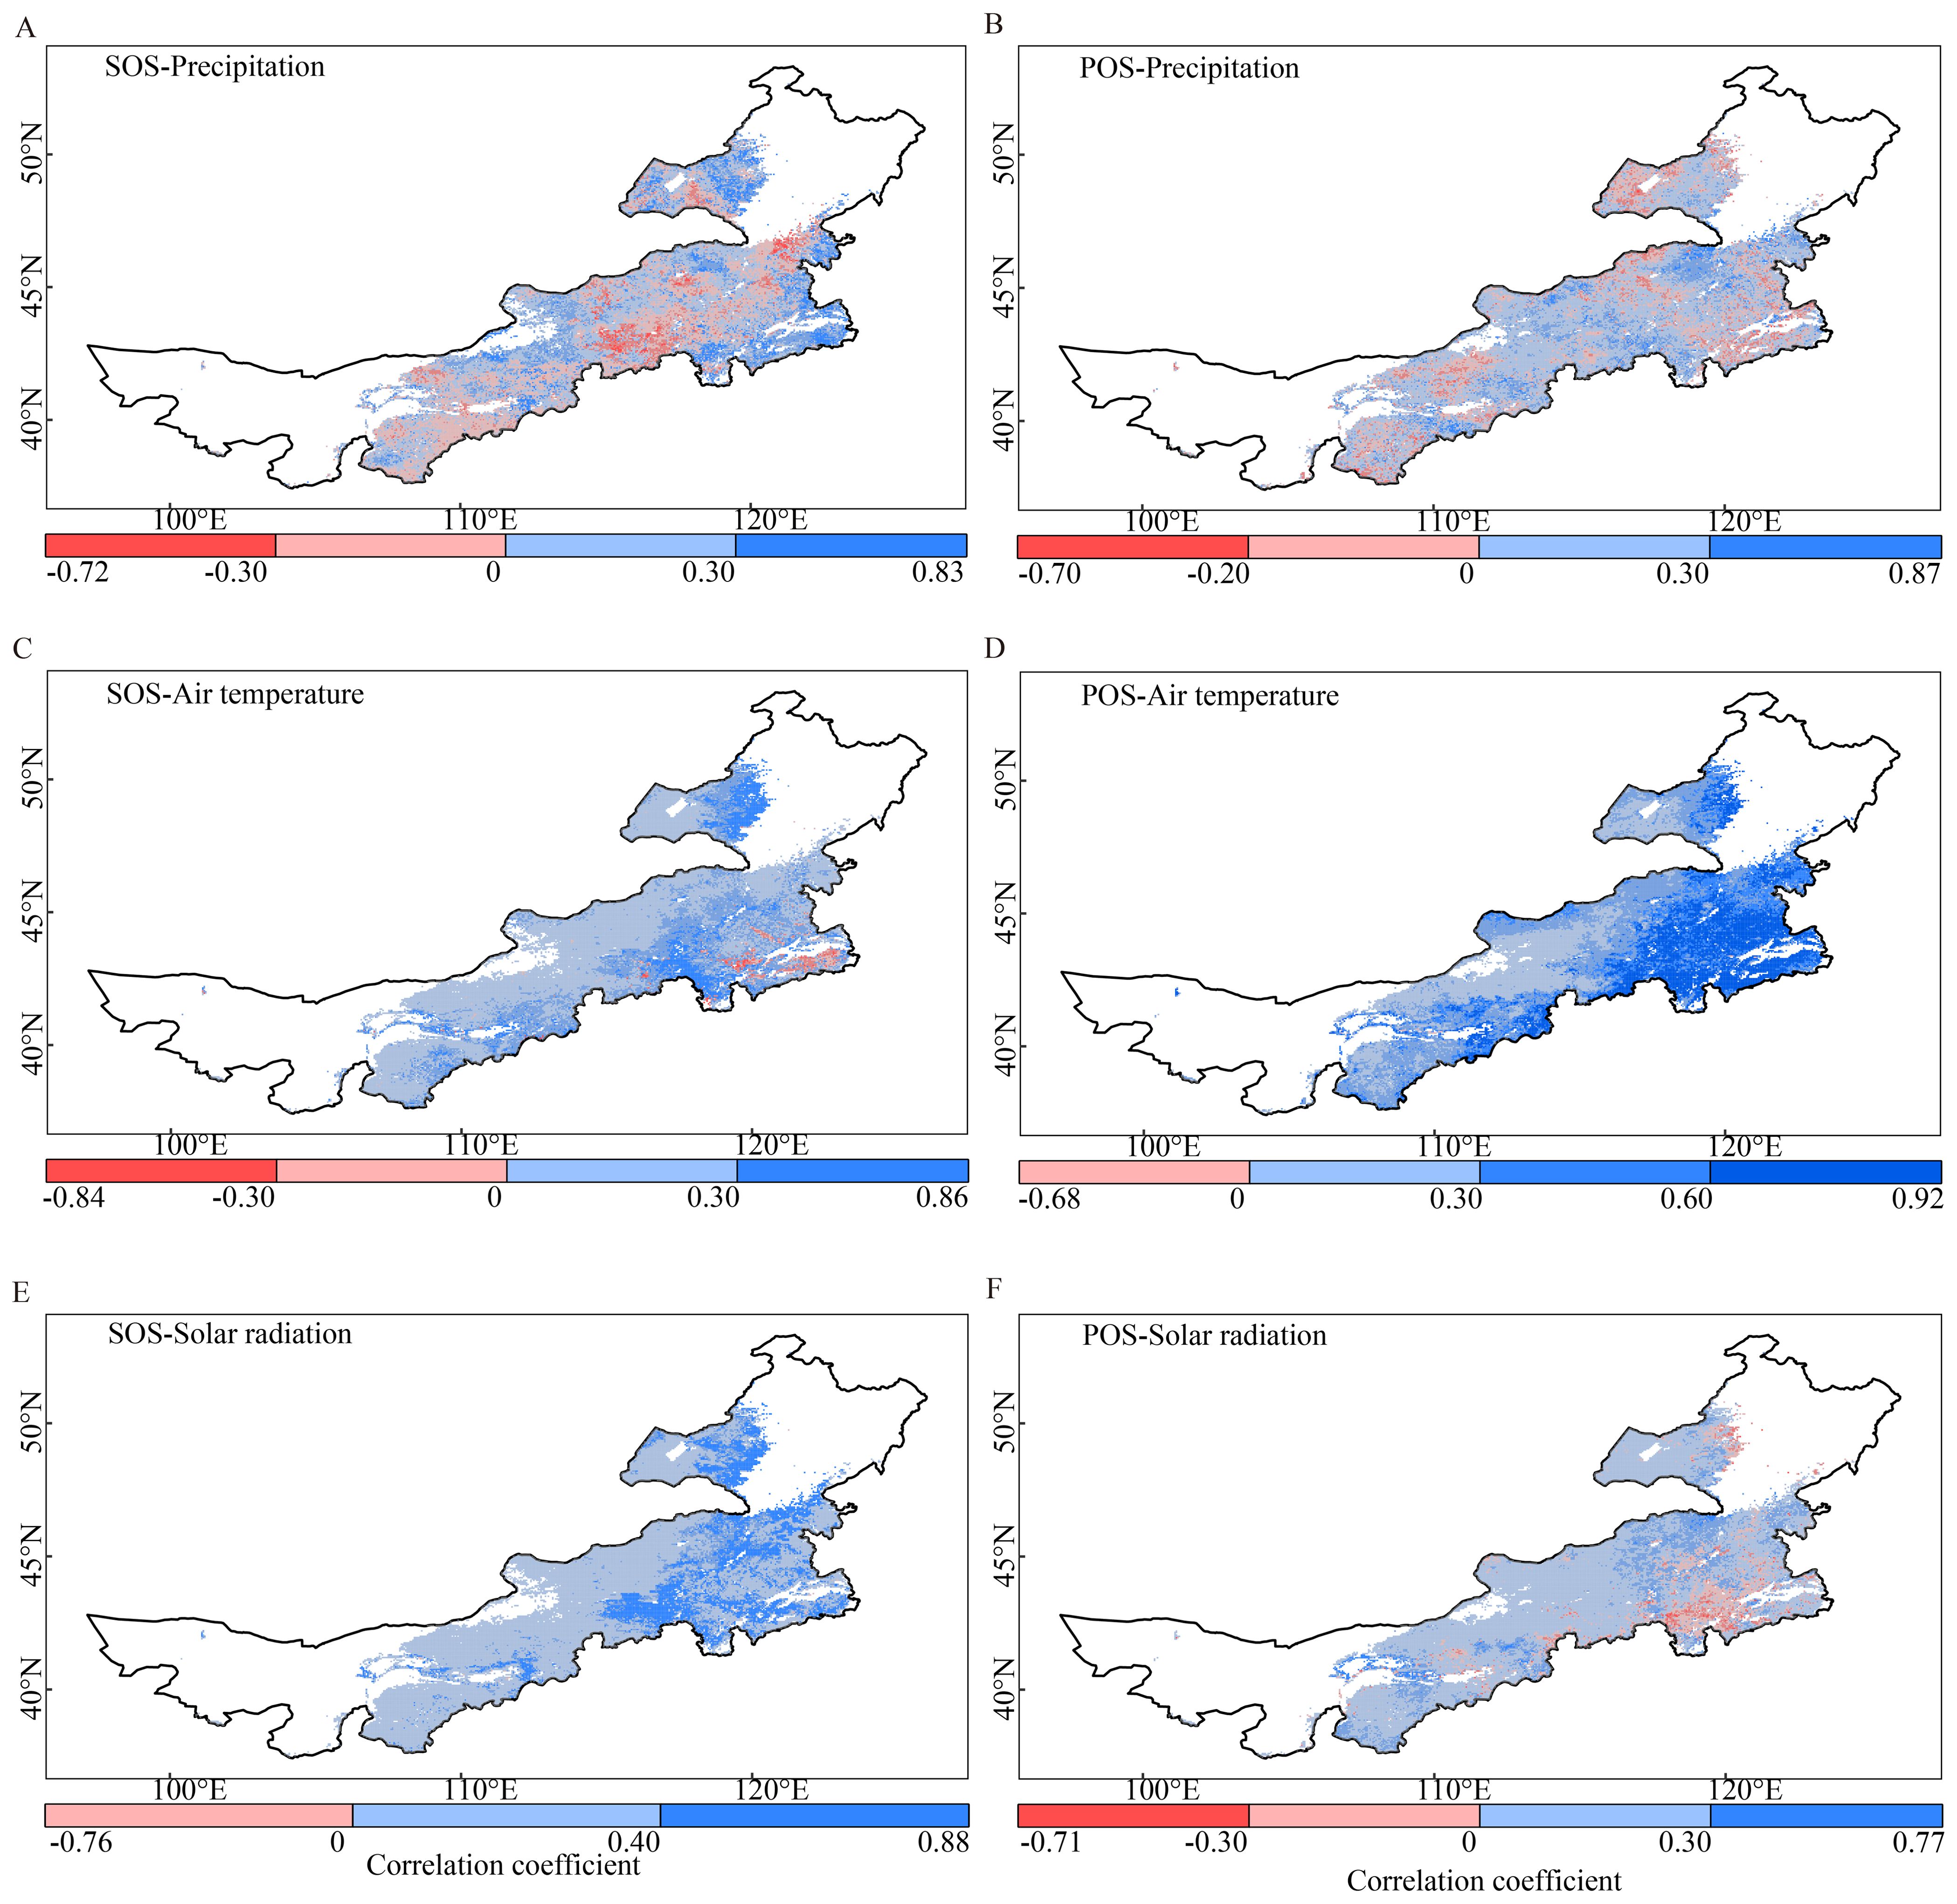
Figure 6. Spatial patterns and comparisons of the correlation coefficient between the start and peak of the growing season (SOS and POS, respectively) and preseason precipitation (A, B), air temperature (C, D), and solar radiation (E, F) requirements. The gray masked areas indicate regions where the correlations are not statistically significant (p > 0.05).
3.3.2 Peak of the growing season
We also found that the POS was positively correlated with heat requirements across the study area, with a correlation coefficient of 0.45 ± 0.18 for air temperature and 0.16 ± 0.18 for solar radiation. In nearly all areas, a positive correlation was observed between the POS and air temperature, with 43.5% of the study area showing statistically significant correlations, mainly located in the eastern areas (Figure 6D). In the case of solar radiation, a positive correlation with POS was observed in 85.9% of the study area. However, the majority of these correlations were not statistically significant (Figure 6F). The correlation coefficient between the POS and precipitation requirement showed high spatial heterogeneity, with a regional mean of 0.11 ± 0.21. Most of the grasslands (70.0%) showed a positive correlation, of which only 4.3% were statistically significant (Figure 6B).
4 Discussion
This study revealed the spatiotemporal dynamics and underlying drivers of phenological shifts in the Inner Mongolian grasslands from 2000 to 2018. We discovered distinct advancements in both the SOS and POS, characterized by varying spatial distributions and degrees of change. Our analysis highlighted the significant influence of preseason climatic conditions on vegetation phenology, noting that the climatic requirements exhibited spatial variations and were influenced by different stages of vegetation growth. The insights gained from our findings were pivotal for a deeper understanding of how grassland ecosystems respond and adapt to ongoing climate changes.
4.1 Spatiotemporal changes in vegetation phenology and their mechanisms
4.1.1 Spatial distributions in vegetation phenology
The spatial distribution of the average multiannual SOS and POS across the grasslands presented a notable pattern (Figures 2A, B), which was likely influenced by regional differences in thermal variables. Specifically, the westward delay in SOS (Figure 2A) aligned with an increasing solar radiation requirement moving from east to west (Figure 4E). On the other hand, the pattern of POS corresponded closely with air temperature requirements, exhibiting lower values in the central region and higher values in the eastern and western areas (Figures 2B, 5C). These results corroborate the hypothesis that the main factors affecting vegetation phenology vary depending on the plant growth stage (Yin et al., 2021).
At the steppe scale, the desert steppe had significantly later SOS and POS than those of the typical and meadow steppes (Figures 3A, B). This could be attributed to disparities in soil water availability and thermal conditions among these grassland types. The desert steppe had lower water supply and higher soil moisture evaporation due to higher air temperatures and solar radiation (Supplementary Table S1), which delayed the increase in environmental moisture required for the vegetation to break dormancy (Liu et al., 2022). As a result, recent precipitation before the SOS exerted a more pronounced influence on the SOS for the desert steppe than for the other two steppe types (Supplementary Figures S4A, C, E). Moreover, a higher thermal supply in the desert steppe (Supplementary Table S1) increased the optimum temperature for plant photosynthesis, thereby enhancing plant photosynthetic capacity and subsequently delaying when vegetation reached its POS (Huang et al., 2019). In contrast, the meadow steppe, with the lowest thermal input, experienced the earliest POS among the steppes.
4.1.2 Spatiotemporal trends in vegetation phenology
The regionally averaged SOS and POS advanced across the Inner Mongolian grasslands from 2000 to 2018 (Figures 3C, D). This advancement aligned with findings from other studies, though magnitudes vary due to different datasets and methodologies (Gong et al., 2015; Qiao and Wang, 2019).
We found that most areas with an advanced SOS required less heat over time, including air temperature and solar radiation (Table 1; Supplementary Figures S10D, G). We speculated that the dormancy of vegetation in these areas might be shallow because of warmer winters (Supplementary Figure S9C) (Yan and Chen, 2020). To confirm this, we defined the periods from January to March as the winter season for air temperature and from December to subsequent March as the winter for solar radiation, assessing their influence on SOS. In most areas with earlier SOS, decreased heat requirements coincided with increased winter temperatures and solar radiation (Supplementary Figures S10D, F, G, I), facilitating earlier vegetation dormancy break from 2000 to 2018, which was consistent with previous studies (Liu et al., 2022; Wang et al., 2022a). Nevertheless, in the southwestern grasslands, despite decreased winter heat (Supplementary Figures S11F, I), the SOS advanced significantly (Figure 2E). These areas were always the warmest and sunniest in the winter from 2000 to 2018 than the rest of the study area (Supplementary Figures S9C, E), indicating that heat was not a limiting factor for spring vegetation recovery. In some northeastern grasslands, there was a significant advancement in SOS despite a notable decrease in winter air temperature (Supplementary Figure S10F). A possible explanation for this was that the SOS had a stronger association with significantly increased winter solar radiation (Supplementary Figure S10I) than with the decreased winter air temperature, as evidenced by correlation coefficients of 0.47 ± 0.16 and 0.43 ± 0.18, respectively (Figures 6C, E). Therefore, increased winter solar radiation could offset the opposite influence of winter air temperature. However, in some eastern and northwestern grasslands with an insignificant reduction in winter solar radiation and an increase in temperature, SOS advanced (Supplementary Figures S10F, I). In these areas, insignificant changes in winter heat had insufficient influence on SOS variation.
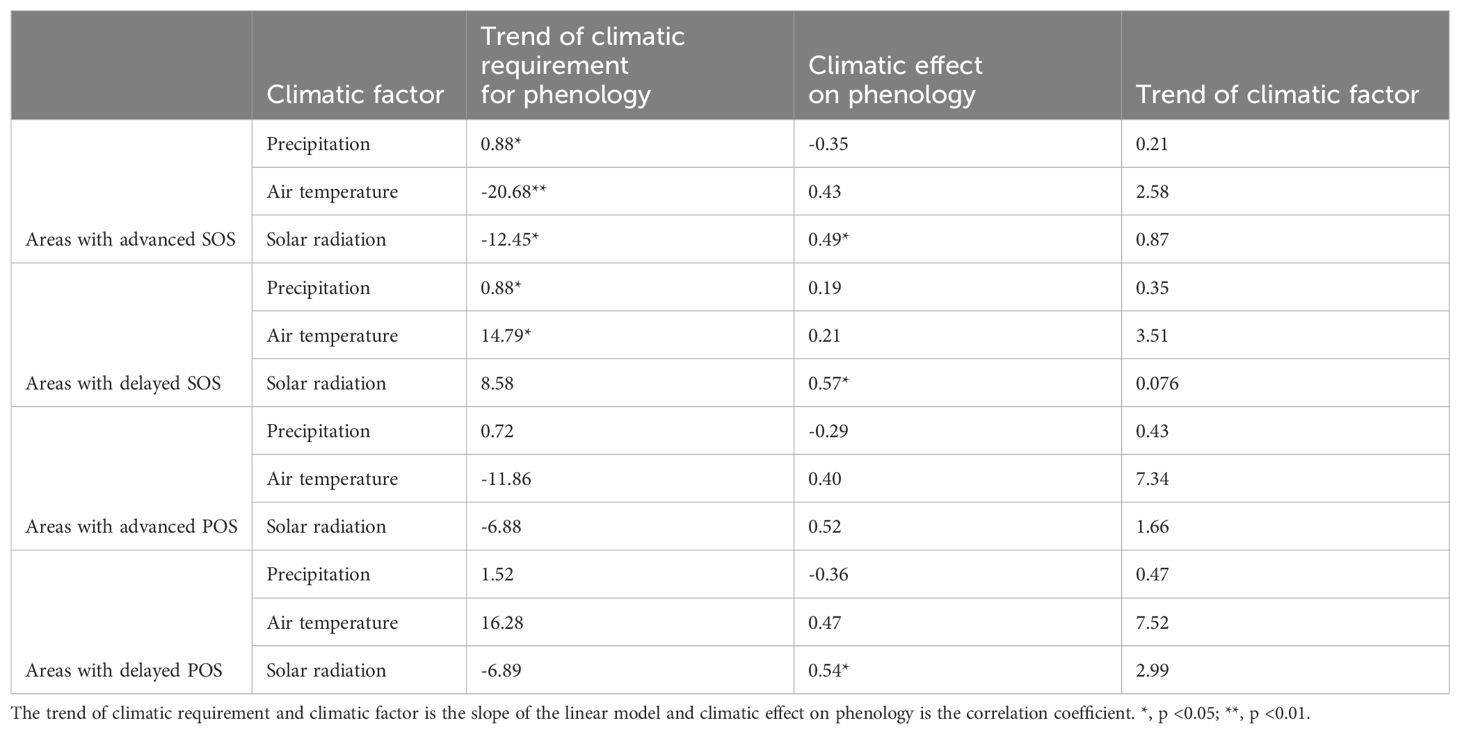
Table 1. Summary of statistical parameters of trend of climatic requirement, effect of climatic requirements on phenology, and trend of climatic factor.
The effects of precipitation on the SOS were more complex than those of thermal conditions (Figures 6A, C, E). In areas with advanced SOS (Figure 2E), the effects of precipitation varied with the optimal preseason length. In areas with short optimal preseasons (< 30 days) (Supplementary Figure S3A), the precipitation requirements decreased (Supplementary Figure S10A) and positively correlated with SOS (Figure S10B). Winter precipitation (January to March) increased from 2000 to 2018 (Supplementary Figure S11C), leading to an advanced SOS. In contrast, areas with long optimal preseasons (> 210 days) (Supplementary Figure S3A) showed negative correlations between the SOS and increased precipitation requirements (Supplementary Figures S10A, B). These areas also matched those with delayed EOS indicated by Ren et al. (2017). This suggested possible legacy effects of autumn phenological changes on spring phenology by regulating the climatic requirements during the endodormancy period, which were supported by prior studies (Fu et al., 2014; Shen et al., 2020). However, further studies are required to identify the exact mechanisms, especially in arid and semi-arid grasslands.
In areas showing delayed SOS, the requirements for all three climatic factors increased (Table 1; Supplementary Figures S11A, D, G) and were positively correlated with SOS (Supplementary Figures S11B, E, H). We found that these areas experienced more intense winter warming compared to the rest (Supplementary Figure S11F). Warmer winters can reduce chilling accumulation, disrupting normal vegetation recovery processes (Li et al., 2016), and may increase the accumulation of forcing temperature to trigger SOS in spring, leading to its delay (Fu et al., 2015). These delayed effects of intense winter warming contradicted the effects of higher winter air temperature on advanced SOS, implying that the impact of winter warming on spring phenology varies depending on warming intensity (Beil et al., 2021). Whether there is a critical threshold of winter warming that causes a shift in its impact on spring phenology warrants further investigations.
Only 7.3% of the study area showed significant POS changes at p < 0.05 (Figure 2F). This proportion increased slightly to 11.3% when considering a 90% confidence level. These observations were in line with several other studies indicating non-significant changes in the POS. For instance, Li et al. (2023) reported that only 6.38% of the boreal ecosystem showed significant POS trends at p < 0.05 from 2001 to 2019. Wang and Wu (2019) found a non-significant advanced trend in the POS for temperate grassland in China during 1982–2015. These findings suggest the relative stability and robust adaptation of vegetation to climatic conditions in this phenological stage.
Building on the observed stability and adaptability of vegetation, it was essential to explore how specific climatic factors affect POS variations. In the study, areas with delayed POS, primarily in the central region, showed a more concentrated distribution compared to those with delayed SOS (Figures 2F, E). In most of these areas, an increase in heat requirements was noted (Supplementary Figures S12D, G), indicating that the local vegetation was adapting to environments with higher air temperatures and more solar exposure (Table 1). This adaptation appeared to be a response to the rising air temperatures from January to June and solar radiation last December to June (Supplementary Figures S12F, I). Moreover, these conditions enhanced the maximum photosynthetic capacity of vegetation, leading to a delayed POS (Yang et al., 2019). Conversely, areas with advanced POS during 2000–2018 showed a decreased need for heat (Table 1; Supplementary Figures S13D, G). Meanwhile, these areas experienced either a decrease or a slight increase in air temperature and solar radiation (Supplementary Figures S13F, I). These thermal trends could hamper vegetation from maximizing its growth, thereby leading to an earlier POS. Here, in both scenarios—areas with delayed and advanced POS—we observe a coherent trend: vegetation adapted its air temperature and solar radiation requirements in line with the changes in these thermal factors. This synchronized adjustment in response to changing thermal conditions implied the ecological adaptation strategy.
In contrast to the clear relationships between POS and thermal conditions, the effect of precipitation on POS appeared to be more complex and varied greatly across different areas (Figure 6B). Changes in spring-early summer precipitation from 2000 to 2018, whether an increase or decrease, led to varying responses in POS across the grasslands (Supplementary Figures S12A–C, S13A–C). This variability was because POS was mostly affected by recent precipitation requirements in most of the grasslands (Supplementary Figure S7A), and such short-term effects varied greatly across different areas depending on the local microclimatic conditions (Chen et al., 2020). For example, moderate precipitation in areas with mild climates could provide suitable water amounts and enhance vegetation growth (Zhang et al., 2023), however, short-term heavy precipitation in similar environments could retard vegetation growth by reducing oxygen and decomposition of organic matter in the soil (Guo et al., 2015; Zhao et al., 2022). Such local variability in precipitation contributed to the observed spatial heterogeneity in POS responses. Moreover, in both the areas with earlier and later POS (Supplementary Figures S13, S14), the correlations between the POS and precipitation requirement (0.11 ± 0.21 and 0.11 ± 0.20) were weaker than those between POS and air temperature (0.45 ± 0.19 and 0.43 ± 0.17) and solar radiation requirements (0.16 ± 0.19 and 0.45 ± 0.18). This suggested that POS had stronger associations with thermal requirements than with precipitation requirements, and the impact of precipitation on the POS might be masked, which agreed with the findings of Wang and Wu (2019).
At the steppe scale, the desert steppe showed the most pronounced changes in SOS and POS (Figures 3C, D), likely due to the harsh environment with drought and low precipitation (Supplementary Table S1). In contrast, the typical steppe, with a more moderate climate (Supplementary Table S1), had a greater safety margin to climate change (Xu et al., 2016b). Meanwhile, the typical steppe had more similar climate conditions (Supplementary Table S1) and climatic requirements and their temporal changes for both SOS and POS to meadow steppe than to desert steppe (Supplementary Figures S5, S6). Accordingly, the typical and meadow steppes showed more similar advanced trends for both SOS and POS compared with desert steppe (Figures 3C, D).
In summary, in spring, the vegetation in Inner Mongolian grasslands required less preseason heat due to warming winters, leading to an earlier SOS. This indicated that the climatic requirement side of vegetation was dominant in the phenological dynamics during the early growth stage. In contrast, in summer, there was the same tendency of thermal requirements for POS and preseason air temperature and solar radiation. This suggested that as vegetation grew, climatic requirements were adjusted to match climatic conditions, and thus, the adaptation of vegetation became more effective. The different phenological responses to climatic conditions in spring and summer reflected the dynamic balance between the climatic requirements of vegetation and the available preseason climatic conditions, providing new insight into the mechanisms of phenological shifts under climate change.
4.2 Implications and limitations
The effects of preseason climatic conditions on the timing of plant life cycles are being emphasized increasingly (Gusewell et al., 2017; Ren et al., 2017; Wang and Wu, 2019). However, the relationship between vegetation phenology and climatic factors may vary depending on the preseason duration. Thus, a fixed preseason length may not capture the complexity of vegetation responses to climate change. In the present study, we found that different climatic factors had different optimal preseason lengths for different phenophases, providing an opportunity to reconsider the determination of preseason length; this also suggests that vegetation has different climatic requirements that may not be synchronized. Therefore, we argue that timing is a crucial factor to consider when studying the impacts of climate change on vegetation growth.
In the present study, we used the accumulated volume of daily climatic indicators before phenological events to assess the effects of climatic factors on vegetation phenology. While these accumulated volumes could be regarded as the drivers of vegetation phenology from a statistics perspective, further physiological and biochemical research is necessary to more precisely evaluate climatic requirements. In addition, our analysis examined the individual impacts of each climatic factor on phenology, yet it did not account for their potential synergistic effects. The non-linear and interrelated nature of climate-plant interactions was also overlooked (Papagiannopoulou et al., 2017).Future studies could concentrate on the synergistic effects of various climatic factors on phenology by developing more accurate and comprehensive indicators or algorithms, and consider the timeliness of climatic factors (Alatalo et al., 2016; Du et al., 2019). Although we chose areas that were covered with grasslands in all years from 2001 to 2018 and avoided the potential effects of human-driven land-use changes, human intervention, such as grazing and ecological conservation projects, inevitably affected our results. Changes in species composition can also alter vegetation phenology, and they can affect phenological responses to climate change in plant communities (Zografou et al., 2021). These direct and indirect effects on vegetation phenology need to be considered in follow-up research work. Finally, our study focused on long-term trends in phenology and did not account for the uncertainties caused by extreme climatic events, which should be explored in further research.
5 Conclusions
Our investigation into the SOS and POS of Inner Mongolian grasslands reveals critical insights into how these ecosystems are responding to ongoing climate changes. In this study, we analyzed the SOS and POS changes using GPP and climate data and determined the optimal preseason lengths and climatic requirements for these phenological events. Spatially, the SOS showed a westward delay, and the POS generally occurred earlier in the central region than in the western and eastern edges of Inner Mongolia. The results showed that the SOS advanced at a rate of 0.65 days/a and the POS was stable at the regional scale over the period from 2000 to 2018. Due to the harsh environment, the desert steppe exhibited the most pronounced advancements in both SOS and POS compared to meadow and typical steppes, signaling a need for ecological management in these areas. Our research emphasized the importance of considering the optimal preseason length for different climatic factors, challenging the conventional approach of using a fixed preseason duration. These findings contribute to understanding the mechanisms of climatic factors driving phenological shifts in grassland ecosystems and can inform future conservation and climate adaptation strategies.
Data availability statement
The raw data supporting the conclusions of this article will be made available by the authors, without undue reservation.
Author contributions
ZN: Conceptualization, Data curation, Formal analysis, Investigation, Methodology, Software, Visualization, Writing – original draft, Writing – review & editing. CW: Writing – review & editing. NZ: Conceptualization, Formal analysis, Investigation, Project administration, Resources, Supervision, Writing – review & editing.
Funding
The author(s) declare financial support was received for the research, authorship, and/or publication of this article. This research is supported by the Strategic Priority Research Program of the Chinese Academy of Sciences (Grant No. XDA20050103) and Science & Technology Fundamental Resources Investigation Program (Grant No. 2022FY100102).
Acknowledgments
The authors would like to acknowledge the data centers which provided data for this research, and the scholars who were engaged in relevant research. We are also grateful to the editor and reviewers for their valuable comments that helped us improve this work.
Conflict of interest
The authors declare that the research was conducted in the absence of any commercial or financial relationships that could be construed as a potential conflict of interest.
Publisher’s note
All claims expressed in this article are solely those of the authors and do not necessarily represent those of their affiliated organizations, or those of the publisher, the editors and the reviewers. Any product that may be evaluated in this article, or claim that may be made by its manufacturer, is not guaranteed or endorsed by the publisher.
Supplementary material
The Supplementary Material for this article can be found online at: https://www.frontiersin.org/articles/10.3389/fevo.2024.1423063/full#supplementary-material
References
Alatalo J. M., Jägerbrand A. K., Molau U. (2016). Impacts of different climate change regimes and extreme climatic events on an alpine meadow community. Sci. Rep. 6, 21720. doi: 10.1038/srep21720
Anderegg W. R. L., Schwalm C., Biondi F., Camarero J. J., Koch G., Litvak M., et al. (2015). Pervasive drought legacies in forest ecosystems and their implications for carbon cycle models. Science 349, 528–532. doi: 10.1126/science.aab1833
Anderson J. T., Inouye D. W., McKinney A. M., Colautti R. I., Mitchell-Olds T. (2012). Phenotypic plasticity and adaptive evolution contribute to advancing flowering phenology in response to climate change. Proc. Biol. Sci. 279, 3843–3852. doi: 10.1098/rspb.2012.1051
Beil I., Kreyling J., Meyer C., Lemcke N., Malyshev A. V. (2021). Late to bed, late to rise-Warmer autumn temperatures delay spring phenology by delaying dormancy. Glob Chang Biol. 27, 5806–5817. doi: 10.1111/gcb.15858
Buitenwerf R., Rose L., Higgins S. I. (2015). Three decades of multi-dimensional change in global leaf phenology. Nat. Climate Change 5, 364–368. doi: 10.1038/nclimate2533
Chen S., Stark S. C., Nobre A. D., Cuartas L. A., de Jesus Amore D., Restrepo-Coupe N., et al. (2024). Amazon forest biogeography predicts resilience and vulnerability to drought. Nature 631, 111-117. doi: 10.1038/s41586-024-07568-w
Chen Z., Wang W., Fu J. (2020). Vegetation response to precipitation anomalies under different climatic and biogeographical conditions in China. Sci. Rep. 10, 830. doi: 10.1038/s41598-020-57910-1
Chu C., Kleinhesselink A. R., Havstad K. M., McClaran M. P., Peters D. P., Vermeire L. T., et al. (2016). Direct effects dominate responses to climate perturbations in grassland plant communities. Nat. Commun. 7, 11766. doi: 10.1038/ncomms11766
Du J., He Z., Piatek K. B., Chen L., Lin P., Zhu X. (2019). Interacting effects of temperature and precipitation on climatic sensitivity of spring vegetation green-up in arid mountains of China. Agric. For. Meteorology 269-270, 71–77. doi: 10.1016/j.agrformet.2019.02.008
Fan D., Zhao X., Zhu W., Sun W., Qiu Y. (2020). An improved phenology model for monitoring green-up date variation in Leymus chinensis steppe in Inner Mongolia during 1962–2017. Agric. For. Meteorology 291, 108091. doi: 10.1016/j.agrformet.2020.108091
Fu Y., Piao S., Zhao H., Jeong S. J., Wang X., Vitasse Y., et al. (2014). Unexpected role of winter precipitation in determining heat requirement for spring vegetation green-up at northern middle and high latitude. Global Change Biol. 20, 3743-3755. doi: 10.1111/gcb.12610
Fu Y. S. H., Zhao H. F., Piao S. L., Peaucelle M., Peng S. S., Zhou G. Y., et al. (2015). Declining global warming effects on the phenology of spring leaf unfolding. Nature 526, 104–10+. doi: 10.1038/nature15402
Gong Z., Kawamura K., Ishikawa N., Goto M., Wulan T., Alateng D., et al. (2015). MODIS normalized difference vegetation index (NDVI) and vegetation phenology dynamics in the Inner Mongolia grassland. Solid Earth 6, 1185–1194. doi: 10.5194/se-6-1185-2015
Gonsamo A., Chen J. M., Ooi Y. W. (2018). Peak season plant activity shift towards spring is reflected by increasing carbon uptake by extratropical ecosystems. Glob Chang Biol. 24, 2117–2128. doi: 10.1111/gcb.14001
Guo Q., Li S., Hu Z., Zhao W., Yu G., Sun X., et al. (2015). Responses of gross primary productivity to different sizes of precipitation events in a temperate grassland ecosystem in Inner Mongolia, China. J. Arid Land 8, 36–46. doi: 10.1007/s40333-015-0136-7
Gusewell S., Furrer R., Gehrig R., Pietragalla B. (2017). Changes in temperature sensitivity of spring phenology with recent climate warming in Switzerland are related to shifts of the preseason. Glob Chang Biol. 23, 5189–5202. doi: 10.1111/gcb.13781
He J., Yang K., Tang W., Lu H., Qin J., Chen Y., et al. (2020). The first high-resolution meteorological forcing dataset for land process studies over China. Sci. Data 7, 25. doi: 10.1038/s41597-020-0369-y
He X. (2017). Climate change adaptation approaches with nomadic culture characteristics in Inner Mongolia grassland in China. Chin. J. Population Resour. Environ. 15, 220–225. doi: 10.1080/10042857.2017.1362869
Huang M., Piao S., Ciais P., Peñuelas J., Wang X., Keenan T. F., et al. (2019). Air temperature optima of vegetation productivity across global biomes. Nat. Ecol. Evol. 3, 772–779. doi: 10.1038/s41559-019-0838-x
Iler A. M., CaraDonna P. J., Forrest J. R. K., Post E. (2021). Demographic consequences of phenological shifts in response to climate change. Annu. Rev. Ecology Evolution Systematics 52, 221–245. doi: 10.1146/annurev-ecolsys-011921-032939
Izquierdo-Verdiguier E., Zurita-Milla R., Ault T. R., Schwartz M. D. (2018). Development and analysis of spring plant phenology products: 36 years of 1-km grids over the conterminous US. Agric. For. Meteorology 262, 34–41. doi: 10.1016/j.agrformet.2018.06.028
Li G., Wu C., Chen Y., Huang C., Zhao Y., Wang Y., et al. (2023). Increasing temperature regulates the advance of peak photosynthesis timing in the boreal ecosystem. Sci. Total Environ. 882, 163587. doi: 10.1016/j.scitotenv.2023.163587
Li Q., Xu L., Pan X., Zhang L., Li C., Yang N., et al. (2016). Modeling phenological responses of Inner Mongolia grassland species to regional climate change. Environ. Res. Lett. 11, 15002. doi: 10.1088/1748-9326/11/1/015002
Liu Z., Fu Y. H., Shi X., Lock T. R., Kallenbach R. L., Yuan Z. (2022). Soil moisture determines the effects of climate warming on spring phenology in grasslands. Agric. For. Meteorology 323, 109039. doi: 10.1016/j.agrformet.2022.109039
Liu Q., Fu Y. H., Zeng Z., Huang M., Li X., Piao S. (2016). Temperature, precipitation, and insolation effects on autumn vegetation phenology in temperate China. Glob Chang Biol. 22, 644–655. doi: 10.1111/gcb.13081
Ma X., Leng P., Liao Q., Geng Y., Zhang X., Shang G., et al. (2022). Prediction of vegetation phenology with atmospheric reanalysis over semiarid grasslands in Inner Mongolia. Sci. Total Environ. 812, 152462. doi: 10.1016/j.scitotenv.2021.152462
Maestre F., Eldridge D., Soliveres S., Kéfi S., Delgado-Baquerizo M., Bowker M., et al. (2016). Structure and functioning of dryland ecosystems in a changing world. Annu. Rev. Ecology Evolution Systematics 47, 215-237. doi: 10.1146/annurev-ecolsys-121415-032311
Miao L., Müller D., Cui X., Ma M. (2017). Changes in vegetation phenology on the Mongolian Plateau and their climatic determinants. PloS One 12, e0190313. doi: 10.1371/journal.pone.0190313
Morellato L. P. C., Alberton B., Alvarado S. T., Borges B., Buisson E., Camargo M. G. G., et al. (2016). Linking plant phenology to conservation biology. Biol. Conserv. 195, 60–72. doi: 10.1016/j.biocon.2015.12.033
Munson S. M., Long A. L. (2017). Climate drives shifts in grass reproductive phenology across the western USA. New Phytol. 213, 1945–1955. doi: 10.1111/nph.14327
Papagiannopoulou C., Miralles D. G., Decubber S., Demuzere M., Verhoest N. E. C., Dorigo W. A., et al. (2017). A non-linear Granger-causality framework to investigate climate–vegetation dynamics. Geosci. Model. Dev. 10, 1945–1960. doi: 10.5194/gmd-10-1945-2017
Qiao D. J., Wang N. Q. (2019). Relationship between winter snow cover dynamics, climate and spring grassland vegetation phenology in inner Mongolia, China. Isprs Int. J. Geo-Information 8, 42. doi: 10.3390/ijgi8010042
Ravindra K., Rattan P., Mor S., Aggarwal A. N. (2019). Generalized additive models: Building evidence of air pollution, climate change and human health. Environ. Int. 132, 104987. doi: 10.1016/j.envint.2019.104987
Ren S., Qin Q., Ren H., Sui J., Zhang Y. (2019). New model for simulating autumn phenology of herbaceous plants in the Inner Mongolian Grassland. Agric. For. Meteorology 275, 136–145. doi: 10.1016/j.agrformet.2019.05.011
Ren S., Yi S., Peichl M., Wang X. (2017). Diverse responses of vegetation phenology to climate change in different grasslands in inner Mongolia during 2000–2016. Remote Sens. 10, 17. doi: 10.3390/rs10010017
Richardson A. D., Keenan T. F., Migliavacca M., Ryu Y., Sonnentag O., Toomey M. (2013). Climate change, phenology, and phenological control of vegetation feedbacks to the climate system. Agric. For. Meteorology 169, 156–173. doi: 10.1016/j.agrformet.2012.09.012
Robles Jimenez L. E., Zetina Sánchez A., Castelán Ortega O. A., Osorio Avalos J., Estrada Flores J. G., González-Ronquillo M., et al. (2021). Effect of different growth stages of rapeseed (brassica rapa L.) on nutrient intake and digestibility, nitrogen balance, and rumen fermentation kinetics in sheep diets. Ital. J. Anim. Sci. 20, 698–706. doi: 10.1080/1828051X.2021.1906168
Shen M., Jiang N., Peng D., Rao Y., Huang Y., Fu Y. H., et al. (2020). Can changes in autumn phenology facilitate earlier green-up date of northern vegetation? Agric. For. Meteorology 291, 108077. doi: 10.1016/j.agrformet.2020.108077
Shen M. G., Tang Y. H., Chen J., Zhu X. L., Zheng Y. H. (2011). Influences of temperature and precipitation before the growing season on spring phenology in grasslands of the central and eastern Qinghai-Tibetan Plateau. Agric. For. Meteorology 151, 1711–1722. doi: 10.1016/j.agrformet.2011.07.003
Tong S., Bao G., Bao Y., Huang X. (2023). Monitoring of long-term vegetation dynamics and responses to droughts of various timescales in Inner Mongolia. Ecosphere 14, e4415. doi: 10.1002/ecs2.4415
Wang J., Fang Y., Zou X., Chai G., Wang Z. (2022b). Diverse responses of vegetation phenology to changes in temperature and precipitation in Northern China. Geocarto Int. 37, 1–19. doi: 10.1080/10106049.2022.2068677
Wang G., Huang Y., Wei Y., Zhang W., Li T., Zhang Q. (2019). Inner Mongolian grassland plant phenological changes and their climatic drivers. Sci. Total Environ. 683, 1–8. doi: 10.1016/j.scitotenv.2019.05.125
Wang H., Liu H., Cao G., Ma Z., Li Y., Zhang F., et al. (2020). Alpine grassland plants grow earlier and faster but biomass remains unchanged over 35 years of climate change. Ecol. Lett. 23, 701–710. doi: 10.1111/ele.13474
Wang G. C., Luo Z. K., Huang Y., Xia X. A., Wei Y. R., Lin X. H., et al. (2022a). Preseason heat requirement and days of precipitation jointly regulate plant phenological variations in Inner Mongolian grassland. Agric. For. Meteorology 314, 108783. doi: 10.1016/j.agrformet.2021.108783
Wang X., Wu C. (2019). Estimating the peak of growing season (POS) of China’s terrestrial ecosystems. Agric. For. Meteorology 278, 107639. doi: 10.1016/j.agrformet.2019.107639
Wood S. N. (2017). Generalized Additive Models: An Introduction with R (New York: CRC Press/Taylor & Francis Group).
Wu X., Zhang R., Bento V. A., Leng S., Qi J., Zeng J., et al. (2022). The Effect of Drought on Vegetation Gross Primary Productivity under Different Vegetation Types across China from 2001 to 2020. Remote Sens. 14, 4658. doi: 10.3390/rs14184658
Xiao X., Ojima D. S., Parton W. J., Chen Z., Chen D. (1995). Sensitivity of inner Mongolia grasslands to climate change. J. Biogeography 22, 643–648. doi: 10.2307/2845965
Xu Z., Hou Y., Zhang L., Liu T., Zhou G. (2016b). Ecosystem responses to warming and watering in typical and desert steppes. Sci. Rep. 6, 34801. doi: 10.1038/srep34801
Xu C., Liu H., Williams A. P., Yin Y., Wu X. (2016a). Trends toward an earlier peak of the growing season in Northern Hemisphere mid-latitudes. Glob Chang Biol. 22, 2852–2860. doi: 10.1111/gcb.13224
Yan A., Chen Z. (2020). The control of seed dormancy and germination by temperature, light and nitrate. Botanical Rev. 86, 39–75. doi: 10.1007/s12229-020-09220-4
Yang J. L., Dong J. W., Xiao X. M., Dai J. H., Wu C. Y., Xia J. Y., et al. (2019). Divergent shifts in peak photosynthesis timing of temperate and alpine grasslands in China. Remote Sens. Environ. 233, 111395. doi: 10.1016/j.rse.2019.111395
Yin C., Yang Y. P., Yang F., Chen X. N., Xin Y., Luo P. X. (2021). Diagnose the dominant climate factors and periods of spring phenology in Qinling Mountains, China. Ecol. Indic. 131, 108211. doi: 10.1016/j.ecolind.2021.108211
Zhang X. (2007). Vegetation map of the People’s Republic of China (1: 1000000). Beijing: Geology Press.
Zhang Y., Xiao X., Wu X., Zhou S., Zhang G., Qin Y., et al. (2017). A global moderate resolution dataset of gross primary production of vegetation for 2000–2016. Sci. Data 4, 170165. doi: 10.1038/sdata.2017.165
Zhang Z., Zhang Z., Hautier Y., Qing H., Yang J., Bao T., et al. (2023). Effects of intra-annual precipitation patterns on grassland productivity moderated by the dominant species phenology. Front. Plant Sci. 14. doi: 10.3389/fpls.2023.1142786
Zhao H., Jia G., Xu X., Zhang A. (2022). Contrasting responses of vegetation production to rainfall anomalies across the northeast China transect. J. Geophysical Research: Biogeosciences 127, e2022JG006842. doi: 10.1029/2022JG006842
Zhou R., Liu Y., Cui M., Lu J., Shi H., Ren H., et al. (2022). Global assessment of cumulative and time-lag effects of drought on land surface phenology. GIScience Remote Sens. 59, 1918–1937. doi: 10.1080/15481603.2022.2143661
Keywords: start of the growing season, peak of the growing season, preseason climatic requirement, meadow steppe, typical steppe, desert steppe
Citation: Nie Z, Wang C and Zhang N (2024) Effects of preseason climate change on spring and summer phenological shifts in Inner Mongolian grasslands. Front. Ecol. Evol. 12:1423063. doi: 10.3389/fevo.2024.1423063
Received: 25 April 2024; Accepted: 12 August 2024;
Published: 29 August 2024.
Edited by:
Mauro Fois, University of Cagliari, ItalyReviewed by:
Qianfeng Wang, Fuzhou University, ChinaSaverio Vicario, National Research Council (CNR), Italy
Copyright © 2024 Nie, Wang and Zhang. This is an open-access article distributed under the terms of the Creative Commons Attribution License (CC BY). The use, distribution or reproduction in other forums is permitted, provided the original author(s) and the copyright owner(s) are credited and that the original publication in this journal is cited, in accordance with accepted academic practice. No use, distribution or reproduction is permitted which does not comply with these terms.
*Correspondence: Na Zhang, emhhbmduYUB1Y2FzLmFjLmNu; Chao Wang, d2FuZ2NoYW9AZ3Jhc3MtZW52LmNvbQ==