 Hannah A. Miller1,2*
 Jenilee Gobin1
 Melanie R. Boudreau1,3
 Liam G. Horne4
 Lee E. Scholl1
 Jacob L. Seguin1,5
 Samuel Sonnega1,6
 Charles J. Krebs7
 Rudy Boonstra8Alice J. Kenney9
 Thomas S. Jung2,10
 Stan Boutin4
 Dennis L. Murray1
- 1Department of Biology, Trent University, Peterborough, ON, Canada
- 2Department of Environment, Government of Yukon, Whitehorse, YT, Canada
- 3Department of Wildlife, Aquaculture, and Fisheries, Mississippi State University, Mississippi State, MS, United States
- 4Department of Biological Sciences, University of Alberta, Edmonton, AB, Canada
- 5Department of Natural Resource Sciences, McGill University, Montreal, QC, Canada
- 6Department of Biology, University of Massachusetts Dartmouth, Dartmouth, MA, United States
- 7Department of Zoology, University of British Columbia, Vancouver, BC, Canada
- 8Department of Physical and Environmental Sciences, University of Toronto Scarborough, Toronto, ON, Canada
- 9Outpost Field Station, Kluane Lake, YT, Canada
- 10Department of Renewable Resources, University of Alberta, Edmonton, AB, Canada
Animals exhibit dynamic movement and activity in response to environmental variation including changes in reproductive opportunities, predation risk, or food availability. Yet, it remains unclear which factors are primary in affecting animal movement, and whether the relative importance of these factors are consistent through time. We tracked snowshoe hares (Lepus americanus) using GPS telemetry during eight summers spanning a hare population cycle (2015–2022) in southwestern Yukon, Canada, to determine associations between environmental variation and hare movement and home range size. Hare density varied 25-fold during the study and home range size increased markedly during low hare density, especially for males. Both sexes retained similar core space use and linearity of movements, but at low densities males had greater and more variable movement rates and time spent travelling. Trail cameras revealed that annual changes in hare movement were also correlated with relative abundance of lynx (Lynx canadensis) and coyotes (Canis latrans). However, hare detection rates within a season were not closely associated with seasonal variation in predator detection. Observed differences between male and female hares in some metrics highlighted that different life histories and reproductive behavior are likely the main drivers of hare movement dynamics. Therefore, fitness rewards associated with successful mate search and reproduction appear to outweigh risks associated with increased movement, even in highly variable environments where costs of prioritizing reproduction-related activities are notably high and variable.
1 Introduction
Animals exhibit dynamic movement and activity in response to changes in their surroundings and internal processes. Decisions related to space use, travel paths, and movement trajectories can be driven by variation in food, risk, intra-specific competition, and reproduction (Moorcraft and Lewis, 2006; Nathan et al., 2008; Dill, 2017; Finnerty et al., 2022). Decisions about when, where, and how much to invest in movement are determined primarily by the balance of information received from these four factors (Forsman and Kivelä, 2022; Shaw, 2020). Distribution of food resources or mating opportunities can influence movement and space use patterns (Mueller and Fagan, 2008; Owen-Smith et al., 2010; Lassis et al., 2022), but such decisions are weighted against constraints of predation risk and competition (Erlinge et al., 1990; Laundre et al., 2010; Doherty and Ruehle, 2020). Spatial memory is closely tied into movement decisions, and allows resident animals to explore surrounding habitat through short-term explorations before returning to their home range or territory (Berbert and Fagan, 2012). Movement can vary through space and time, so individuals should continuously assess environmental variation and corresponding risks and benefits to make adjustments that increase survival and fitness (Shaw, 2020; Finnerty et al., 2022). Yet, despite these straightforward principles in movement ecology, there is a lack of understanding regarding the consequences of movement and how environmental variation and corresponding changes in risks and rewards influence movement dynamics (Shaw, 2020).
Movement-related decisions should vary proximally according to individuals’ perceptions of the environment. If predation risk varies spatiotemporally (Kauffman et al., 2007; Mayer et al., 2020), risk avoidance behavior may influence movement patterns. Likewise, if animals face food limitation or limited mating opportunities, they should exhibit movements that increase access to these resources or mates, respectively (McIntyre and Wiens, 1999; Guyer et al., 2012). However, balancing risks and rewards over space and time can be challenging, especially for animals in highly dynamic environments.
Across much of their range in the boreal forest, snowshoe hares (Lepus americanus) experience cyclic population fluctuations every 9–11 years (Krebs et al., 2001), leading to 20–40-fold changes in hare density and corresponding variation in mating opportunities, food availability per capita (Krebs et al., 2001, 2018) and predator density (Boutin et al., 1995). While snowshoe hare mating structure is poorly understood, like other hares (Knipe et al., 2013), female hares produce multiple litters per year and are the sole care-givers of offspring (Burton, 2002). Thus, during the breeding season males should be mostly active in mate searching and females should focus on maternal care, and these efforts may vary year-to-year depending on changes in population density or related factors.
We studied summer movements of snowshoe hares in southwestern Yukon, Canada, during a hare population cycle (2015–2022). We tracked hares intensively to test whether changes in mating opportunities, predation risk, or food limitation are correlated with hare space use and movement patterns. We predicted that if mating and reproductive activities (i.e., search for mates by males, tending to leverets by females) drive movement dynamics; i) males will exhibit greater movement and range size than females, with ii) males especially showing greater movement and range size when hare densities are low and mating opportunities may be limited. In contrast, if predation risk drives hare movement we predicted that; iii) all hares in the population similarly reduce movements and travel when predator densities are high, and iv) hare activity should be inversely correlated to seasonal variation in predator activity. Yet, in temperate environments overwinter food limitation in herbivores may spillover to the spring–summer season (Cook et al., 2004; Majchrzak et al., 2022), meaning that if food availability drives hare movement; v) all hares should exhibit increased movement and travel during years when winter food availability per capita is low, with hares also exhibiting vi) greater travel in May–early June, before spring green-up.
2 Methods
2.1 Study site
We studied hares at six sites (6–37 ha) spanning ~20 km along the Alaska Highway in southwestern Yukon, Canada. During the study period, average summer (June–August) and winter (November–February) temperatures within the region were 12°C and −17°C, respectively, with an average of ~275 mm of precipitation (~70% rain) annually (Environment and Climate Change Canada, 2022). The forest is dominated by white spruce (Picea glauca) and includes trembling aspen (Populus tremuloides) and balsam poplar (Populus balsamifera), with understory composed of gray willow (Salix glauca), bog birch (Betula glandulosa), soapberry (Shepherdia canadensis) and other herbaceous plants (Krebs et al., 2001). The area is largely wilderness, with minimal anthropogenic disturbance.
Hare populations have been monitored at our study area since 1976 (Krebs et al., 2001, 2018), with variation in hare density typically ranging from 20–40-fold between the peak and low phases of the hare cycle (Krebs et al., 2014). Hares give birth to 2–4 litters during the May–August period, with more litters being produced during cyclic increases and mating activity being greatest at the beginning of the breeding season (Stefan and Krebs, 2001). During our study hare densities varied from 0.06–1.52 hares/ha, representing the increase, peak, decline and early low phases of the cycle in the region (Krebs et al., 2022; Figure 1). Canada lynx (Lynx canadensis) and coyotes (Canis latrans) are major predators of hares in our area (O’Donoghue et al., 2001), and their densities vary with a 1–2-year lag behind the hare cycle (Krebs et al., 2023).
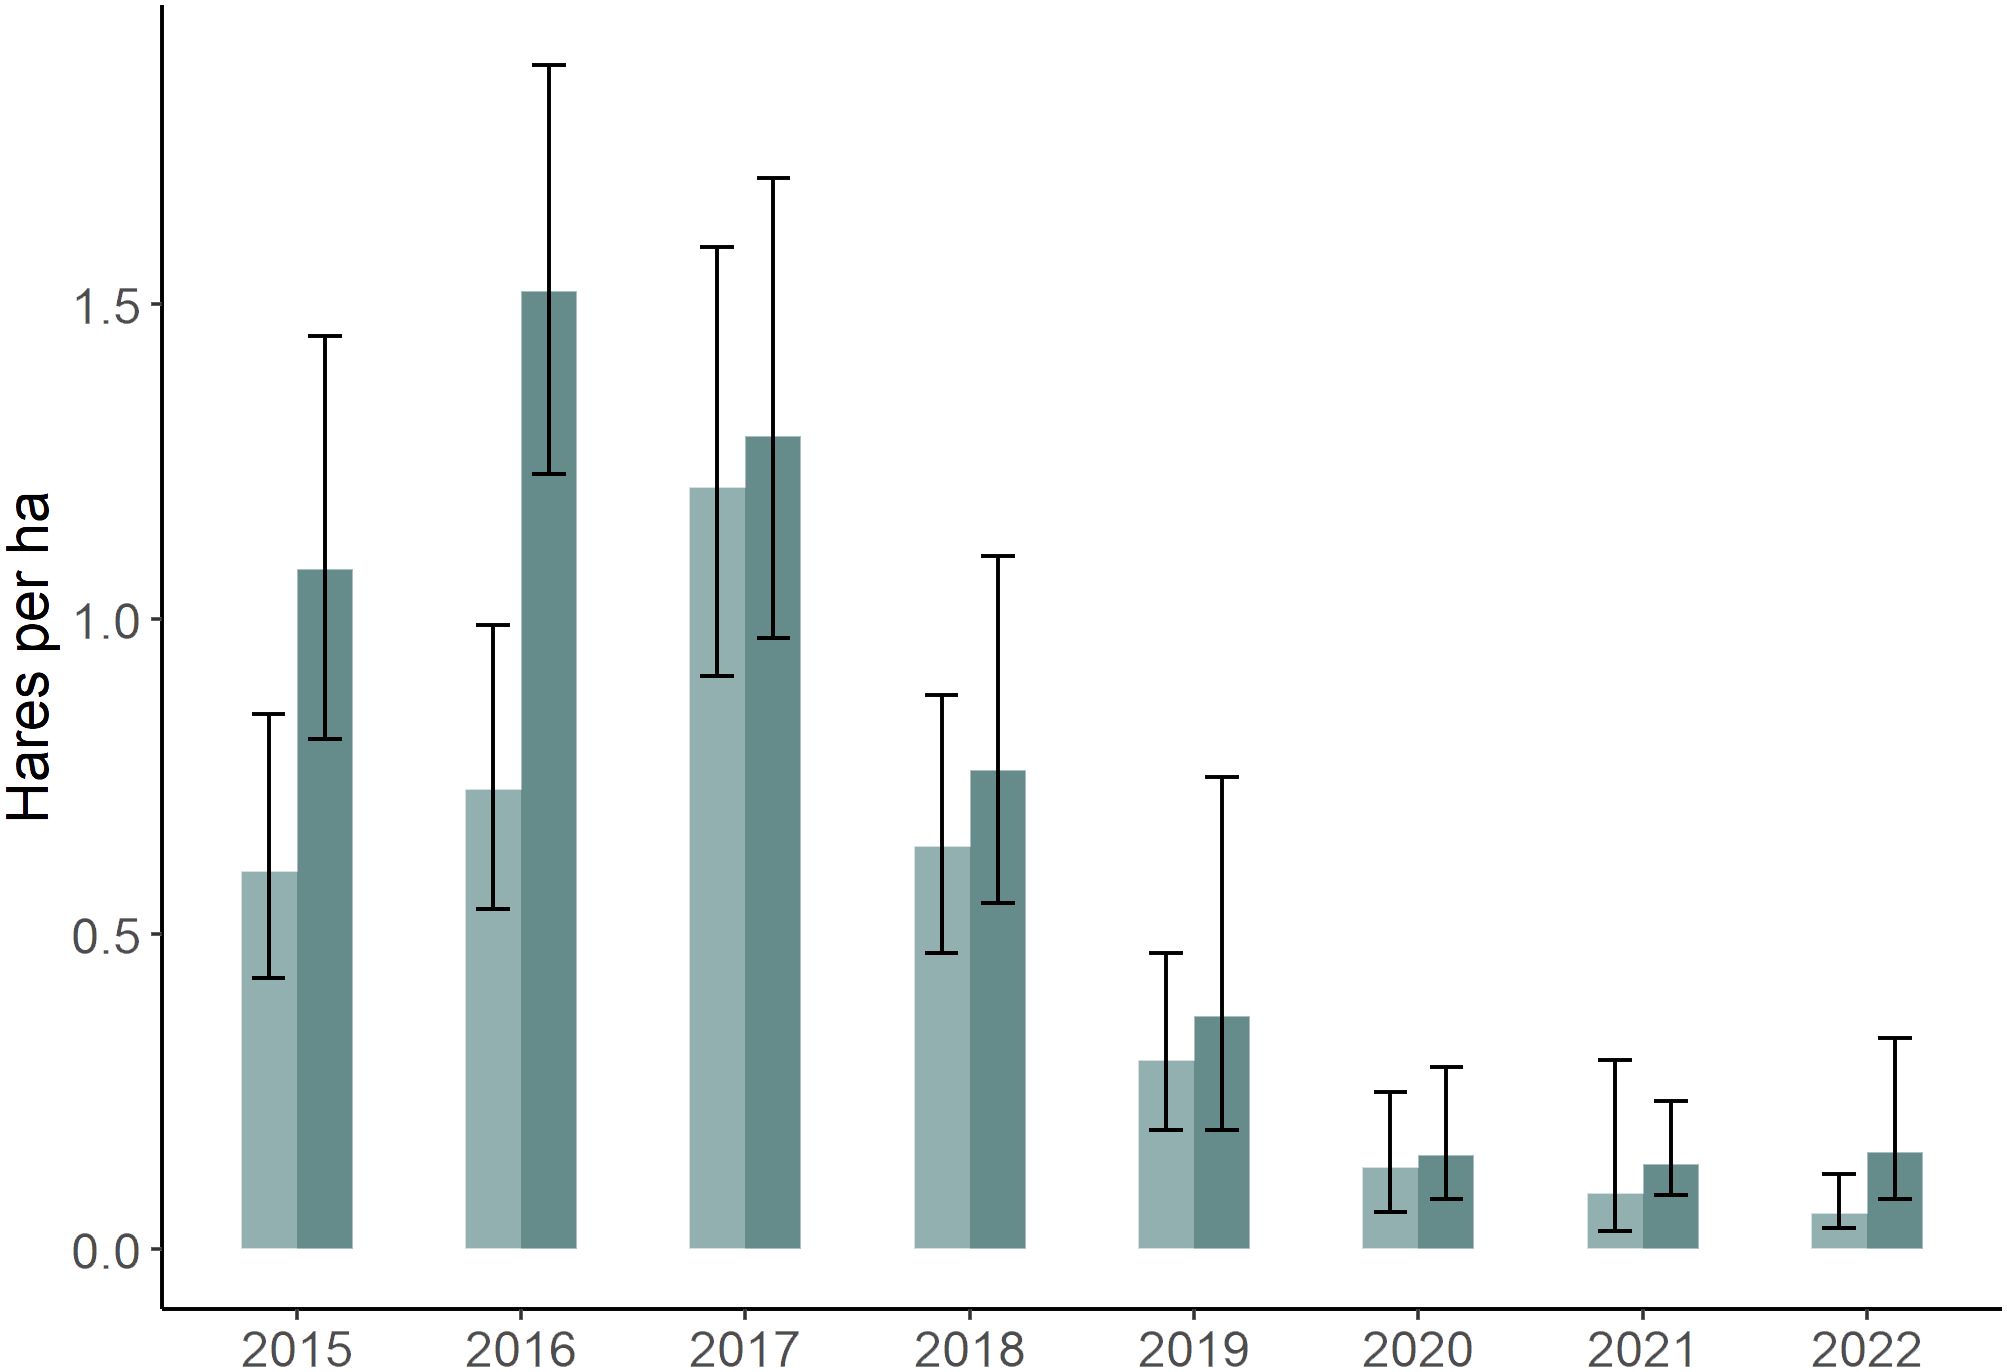
Figure 1 Snowshoe hare (Lepus americanus) densities (± 95% CI) in southwestern Yukon, Canada (2015–2022), derived from capture–mark recapture estimates on three 36 ha study areas during spring (light) and fall (dark) of each year (Krebs et al., 2023).
2.2 Live trapping and collaring
Each May-September period, we live trapped hares (Tomahawk Live Trap Co. Tomahawk, WI, USA), in baited traps and checked traps within 8–10 hours of setting. On first capture, hares were ear-tagged (National Band and Tag Co., Newport, KY, USA), weighed, and sexed. Adult hares (>1 kg) were equipped with radio-collars consisting of a VHF transmitter with mortality and activity sensors (Wildlife Materials, Murphysboro, IL, USA), a GPS unit (GiPSy 5) and an accelerometer (Axy-3; Technosmart, Guidonia, Rome, Italy). We collared only hares that were trapped >2 times, increasing the chance that they were residents. Sixty percent of all hares captured were trapped >2 times (57% of females, 65% of males). GPS units were programmed to obtain a location every hour (2015–2018) or every 15 min (2019–2022). Collars were deployed for three-week periods, after which hares were recaptured and collars were collected and redeployed. All live-trapping and handling procedures were approved by the Trent University Animal Care Committee (protocols 23373, 25243, 28019).
We assessed transmitter fix success and locational accuracy via field trials involving placing transmitters (stationary or in motion between fixes) in known locations within different land cover types. For stationary transmitters (i.e., single location for 4–8 hours) we observed negligible variation in locational accuracy (15 minute fix rate: 10.6 ± 10.0 m (SD), n = 4; hourly fix rate: 11.3 ± 11.9 m, n = 4) or transmitter location (i.e., beneath dense understory: 9.2 ± 10.8 m, n = 8; open forest: 8.4 ± 9.9 m, n = 8; open sky: 5.7 ± 9.9 m, n = 8). We filtered GPS data to remove implausible points (consecutive locations with distances moved >500 m/hr; Bjørneraas et al., 2010; Stark et al., 2017). GPS data were projected to the WGS 1984 UTM Zone 7N coordinate system.
2.3 Summer home range and core use
We estimated May-September home range size using kernel density estimation with a plug-in bandwidth (Walter et al., 2011). We determined that 50–100 locations were needed to reach an asymptote in home range size (Girard et al., 2002) and censored hares with ≤50 locations. Home range boundaries were defined as 95% isopleths (Kie et al., 2010; Walter et al., 2011; Garitano-Zavala et al., 2013). Core use areas were determined by fitting an exponential regression to utilization distribution (UD) area plotted against UD volume (isopleth value) and taking the isopleth value where the slope of the fitted line equals 1, representing the threshold where the proportional home range area increases at a rate greater than the probability of use (Vander Wal and Rodgers, 2012). Because home range and core use areas were highly correlated (r = 0.99, P = < 0.001, n = 109), we assessed core space use with isopleth values (IV) that measure the proportion of the home range that is used intensively (r = −0.16, P = 0.10, n = 109). We evaluated seasonal home range and core use isopleths using the Kernel Smoothing (ks) R package (Duong, 2022) in R 4.2.1 (R Core Team, 2022).
2.4 Movement and activity metrics
We measured hare movement patterns using hourly movement rate (m/hr), daily movement rate (net daily displacement; m/day), and daily tortuosity of movements. We excluded daily displacement rate as a metric because of its high correlation with home range size (r = 0.78, all other metrics r < 0.66). Using GPS data standardized to 1-hr relocation intervals, we calculated hourly movement rate using GPS data filtered to include only consecutive fixes. We calculated daily movement rates (m/day) as the cumulative distance moved in a 24-hr period. We calculated travel path tortuosity using a straightness index (dE/L), defined as the Euclidean distance between two points divided by total path length across a 24-hour sampling timeframe (Batschelet, 1981; Signer et al., 2011). All movement parameters were calculated using R 4.2.1 (R Core Team, 2022) and the Animal Movement Tools (amt) package (Signer et al., 2011). We calculated time spent traveling per day via accelerometry, by combining time spent hopping and sprinting (Studd et al., 2019).
2.5 Hare population estimation
We estimated hare population density via biannual surveys on three 36-ha study areas (see Krebs et al., 2018). Briefly, capture-mark-recapture surveys were conducted in spring and fall for each area, using 86 live traps deployed at fixed locations. Hare numbers were estimated via spatially explicit capture-recapture models (Efford, 2009). These surveys allowed us to calculate post-winter and post-breeding hare population density estimates for the larger study region.
2.6 Relative abundance of hares and predators
We used photos from 27 trail cameras that were deployed during May-September within a 10 km buffer area of our hare study areas to corroborate hare density estimates for our larger study area while also indexing monthly activity of hares and their main predators, Canada lynx (Lynx canadensis) and coyote (Canis latrans). Cameras were located on animal trails or other animal travel routes with ≥1 km separation to establish independence between observations (see Kenney et al., 2024). Cameras were mounted 24–70 cm above ground level to provide the largest field of view (average 18 m2, range 3–49 m2; Kenney et al., 2024). We measured the number of times a species was detected divided by number of operational camera days. One “hit” was recorded for each species with ≥2 min intervals between individual hits (Kenney et al., 2024).
2.7 Statistical analyses
We developed candidate sets of generalized linear models (GLM) and generalized linear mixed models (GLMM) to assess the role of select covariates on hare movement and activity (Murray et al., 2020). We included year, sex, and their interaction as predictors, with our response variables including home range size and core use isopleths, for which year and sex were fixed effects. Year and sex were also included as fixed effects for daily movement rate, tortuosity, and time spent traveling, while adding calendar week and hare ID as random effects to account for potential seasonal changes and repeated measures, respectively. We considered year, sex, and week as fixed effects to predict hourly movement rate, according to diel period (dawn, day, dusk, night; calculated using package ‘suncalc’; Thieurmel and Elmarhraoui, 2022) with week and hare ID included as random effects. Additionally, we used GLMMs with the camera trap data to examine temporal changes in hare and terrestrial predator detections (hits per 1,000 days); camera ID was included as a random effect. Models were fit with Student’s t-distribution (Pearson type VII distribution) using package ‘glmmTMB’ (Brooks et al., 2017) in R (ver. 4.2.1; R Core Team, 2022). When appropriate given our a priori understanding of the snowshoe hare system, we added year × sex interaction terms to candidate models. We centered and scaled response variables and all continuous predictor variables prior to model fitting (Schielzeth, 2010). To address potential multicollinearity, we calculated variance inflation factors (VIFs) in the R package ‘performance’ (Lüdecke et al., 2021) and ensured low correlation between covariates in the same model (all VIF < 2.0). We used Akaike’s information criterion corrected for small sample sizes (AICc) to select the best model from each candidate set, with models with ΔAICc ≤ 2.0 considered indistinguishable (Burnham and Anderson, 2002). We calculated model weights (wi) to aid in interpretation and evaluated effect sizes based on regression coefficients. We calculated McFadden’s Pseudo-R2 to measure model fit, with values between 0.2–0.4 indicating strong fit (package ‘piecewiseSEM’; Lefcheck, 2016). When random effects were included in models, we used Conditional Pseudo-R2 to measure model fit, to account for both fixed and random effects (Lefcheck, 2016). We used 95% confidence intervals as an index of the magnitude of effect of independent variables and deemed that confidence intervals overlapping zero indicated lack of significance. Skewness in some metrics supported use of median and 95% bias-corrected and accelerated (BCa) confidence intervals (calculated using package ‘rcompanion’; Mangiafico, 2023) as descriptive statistics.
3 Results
From May-September 2015–2022, we collected GPS and accelerometer data from 112 and 80 hares, respectively. Median GPS collar deployment per individual was 27 days (95% BCa CI: 21–32 days; n = 70 hares) for females and 25 days for males (20–30; n = 42), whereas median duration of individual accelerometer data collection was 35 days (22–36; n = 55) for females and 41 days (27–57; n = 25) for males. Nine individuals (female: n = 8, male: n = 1) were collared for more than one year (2 years) over the course of the study.
Average hare population density estimates on our three monitoring sites were intermediate at the beginning of the study (2015) and reached peak densities in fall 2016 (Figure 1). Thereafter, numbers declined 25-fold by 2020 and remained comparably low until the study ended (2022). Hare population estimates on our monitoring sites were corroborated for our larger study area from trail camera detections (n = 16,435 total hare detections, 2016–2022), which were closely correlated with capture-mark-recapture estimates (R2 = 0.93).
3.1 Summer home range and core use
Hares exhibited variable summer home range size through the 8-year study period, with median ranges of 3.9 ha (3.4–4.4 [95% BCa CI]) during 2015–2019 and increasing more than 3-fold to 13.3 ha (10.1–16.1) during 2020–2022. The best-fit model of hare home range size included the main effects of Year and Sex, with a Year × Sex interaction (Table 1). Model coefficients indicated a general increase in home range size with year and larger ranges for males than females (Table 2). Home range size was largely comparable between sexes, although during 2021–2022 male ranges were notably larger (Table 2; Figures 2A, 3).
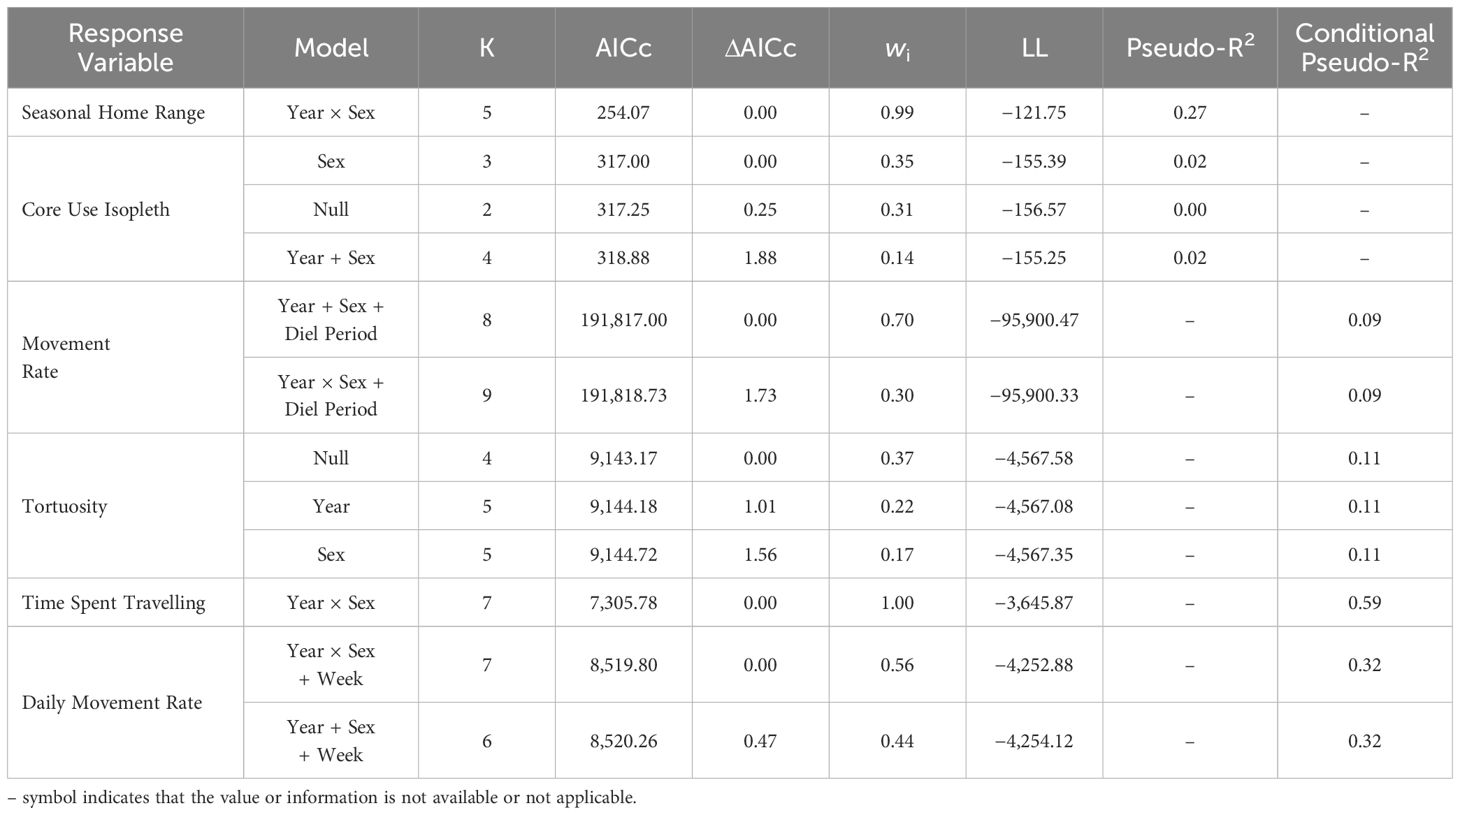
Table 1 Best-supported models (ΔAICc ≤ 2) predicting snowshoe hare (Lepus americanus) movement and activity in southwestern Yukon, Canada (2015–2022).
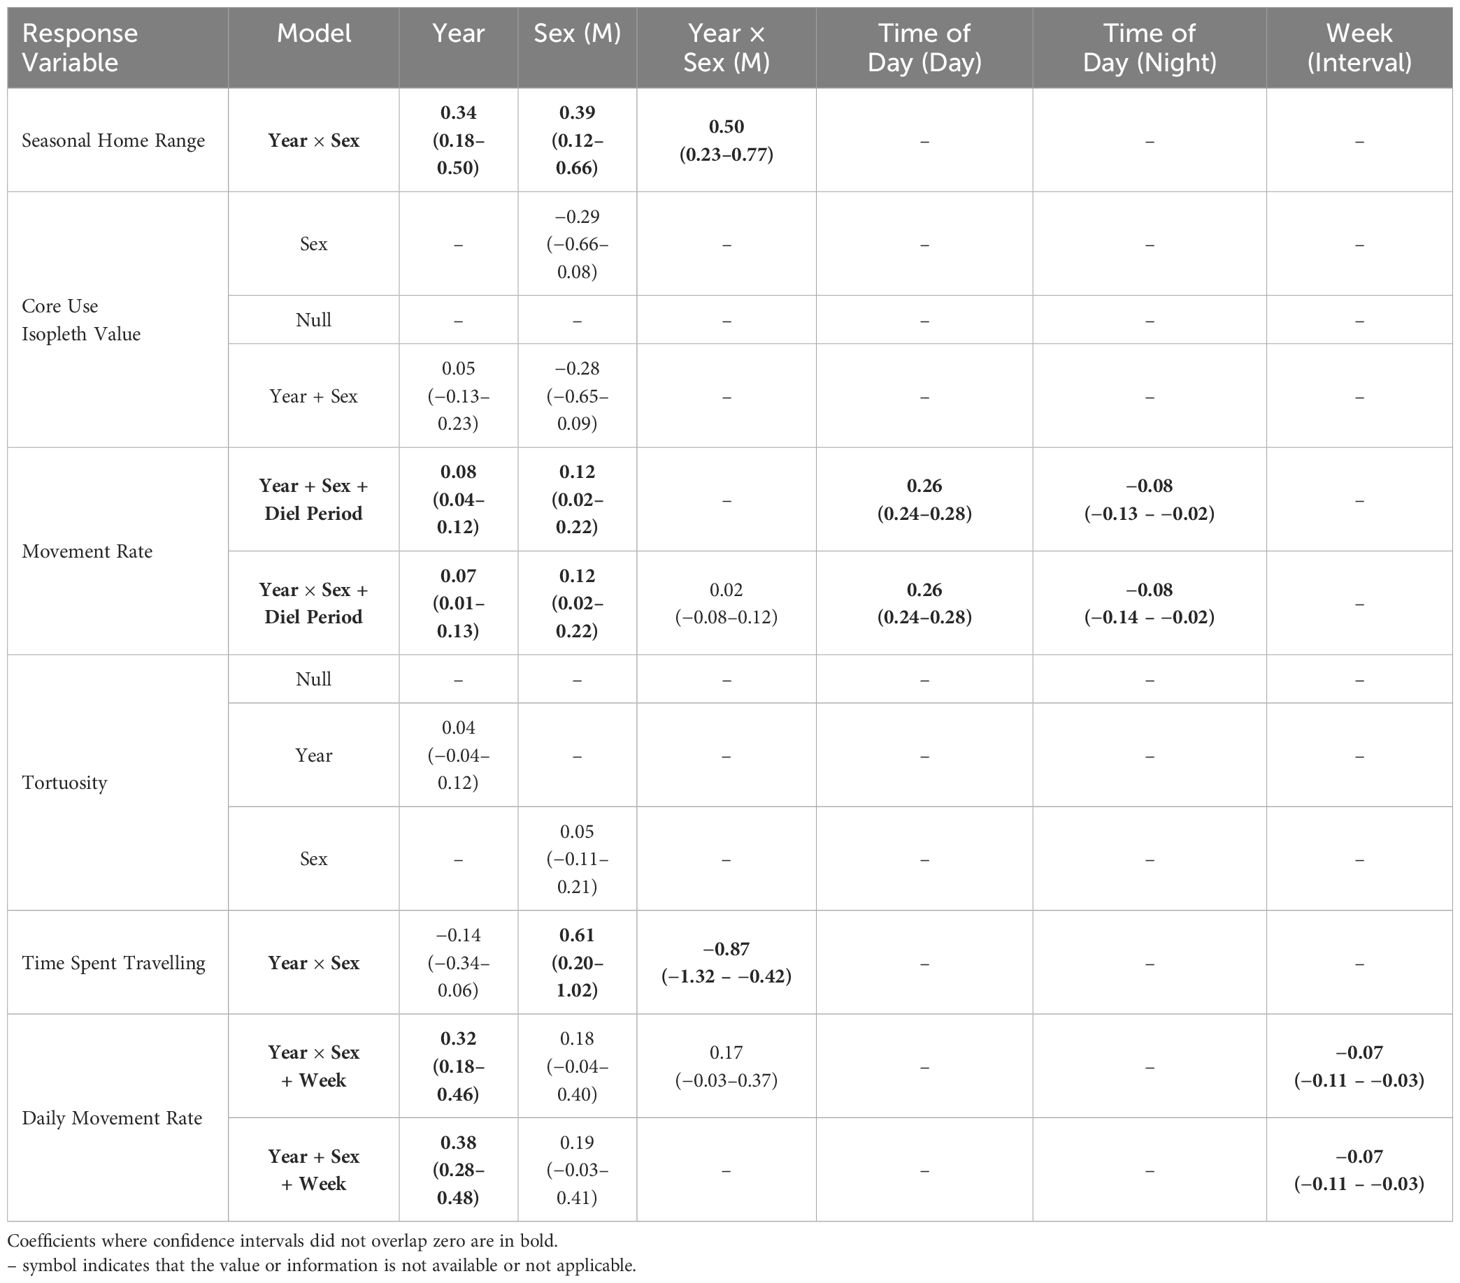
Table 2 Regression coefficients (± 95% CI) of best-supported models (ΔAICc ≤ 2) predicting snowshoe hare (Lepus americanus) movement and activity in southwestern Yukon, Canada (2015–2022).All continuous covariates were scaled prior to modelling.
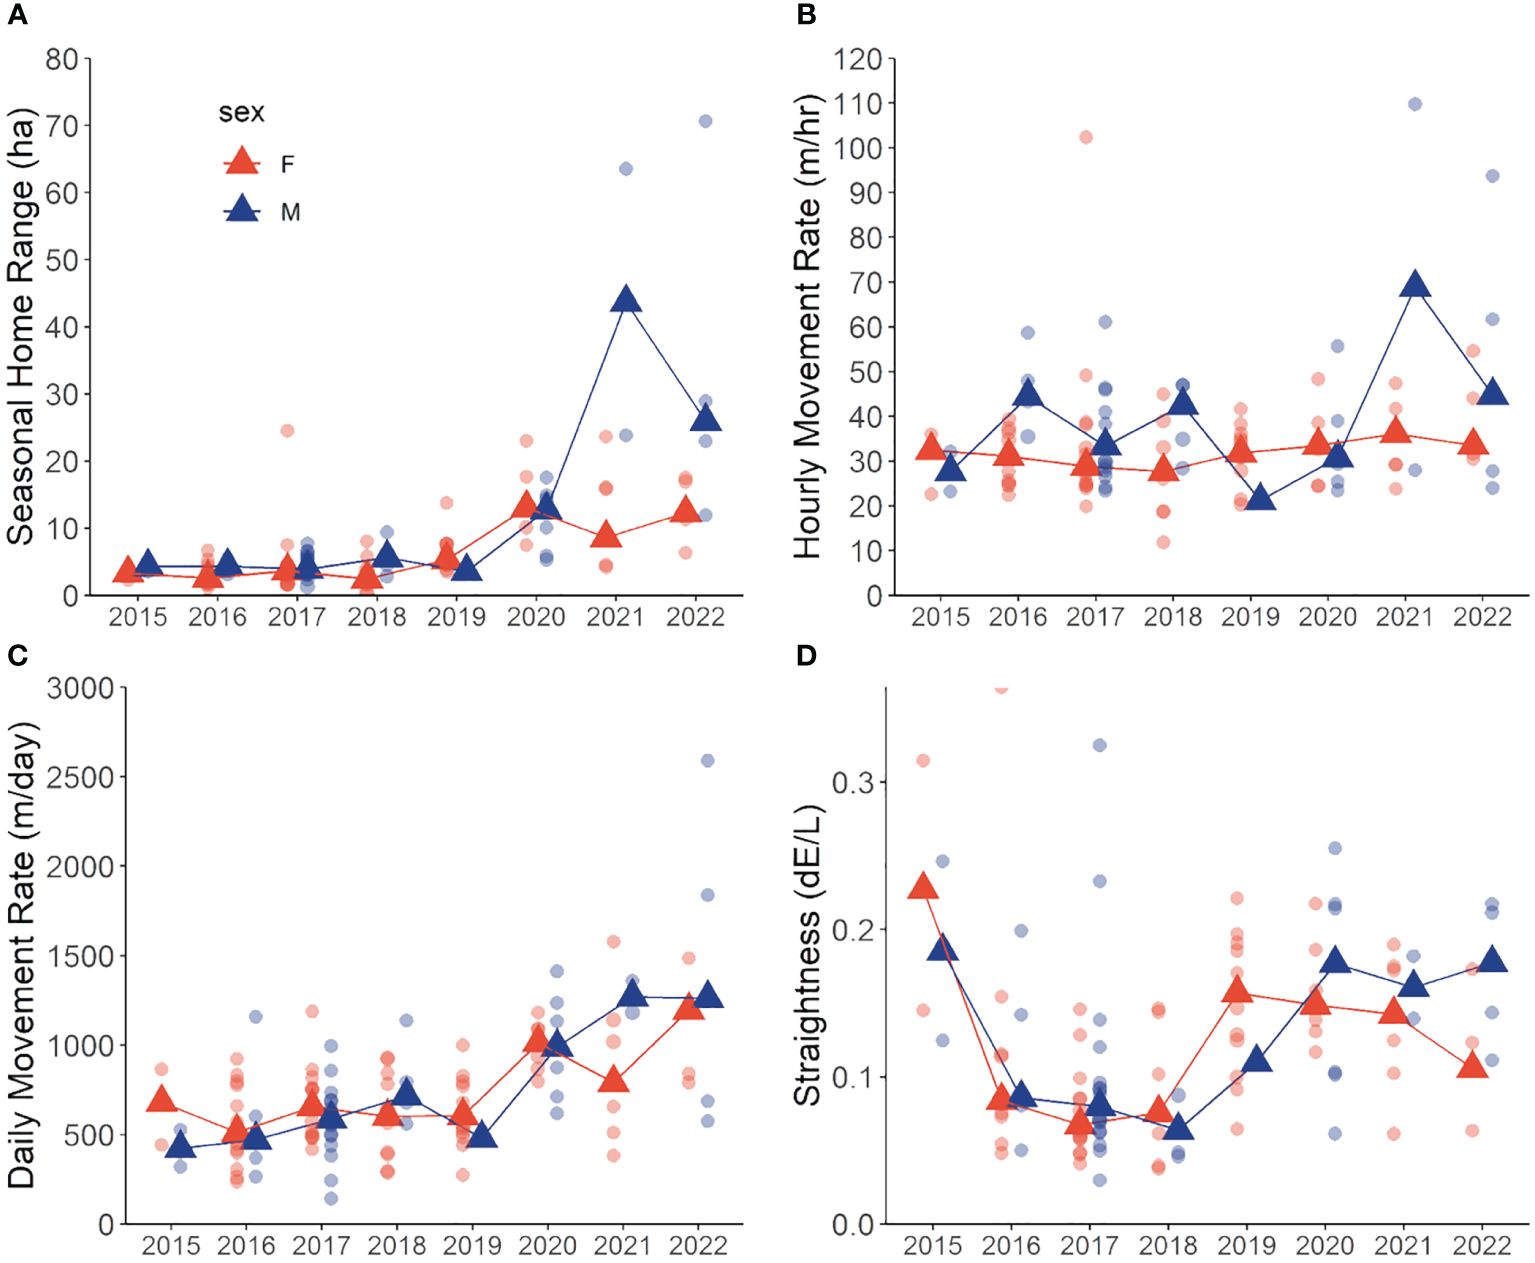
Figure 2 Annual variation in median (triangles) and individual (circles) movement metrics in snowshoe hares (Lepus americanus) during May–September in southwestern Yukon, Canada (2015–2022). (A) home range size (95% isopleth), (B) hourly movement rate (m/hr), (C) daily movement rate (m/day), (D) travel path tortuosity (dE/L). Male (blue) and female (red) hares are depicted.
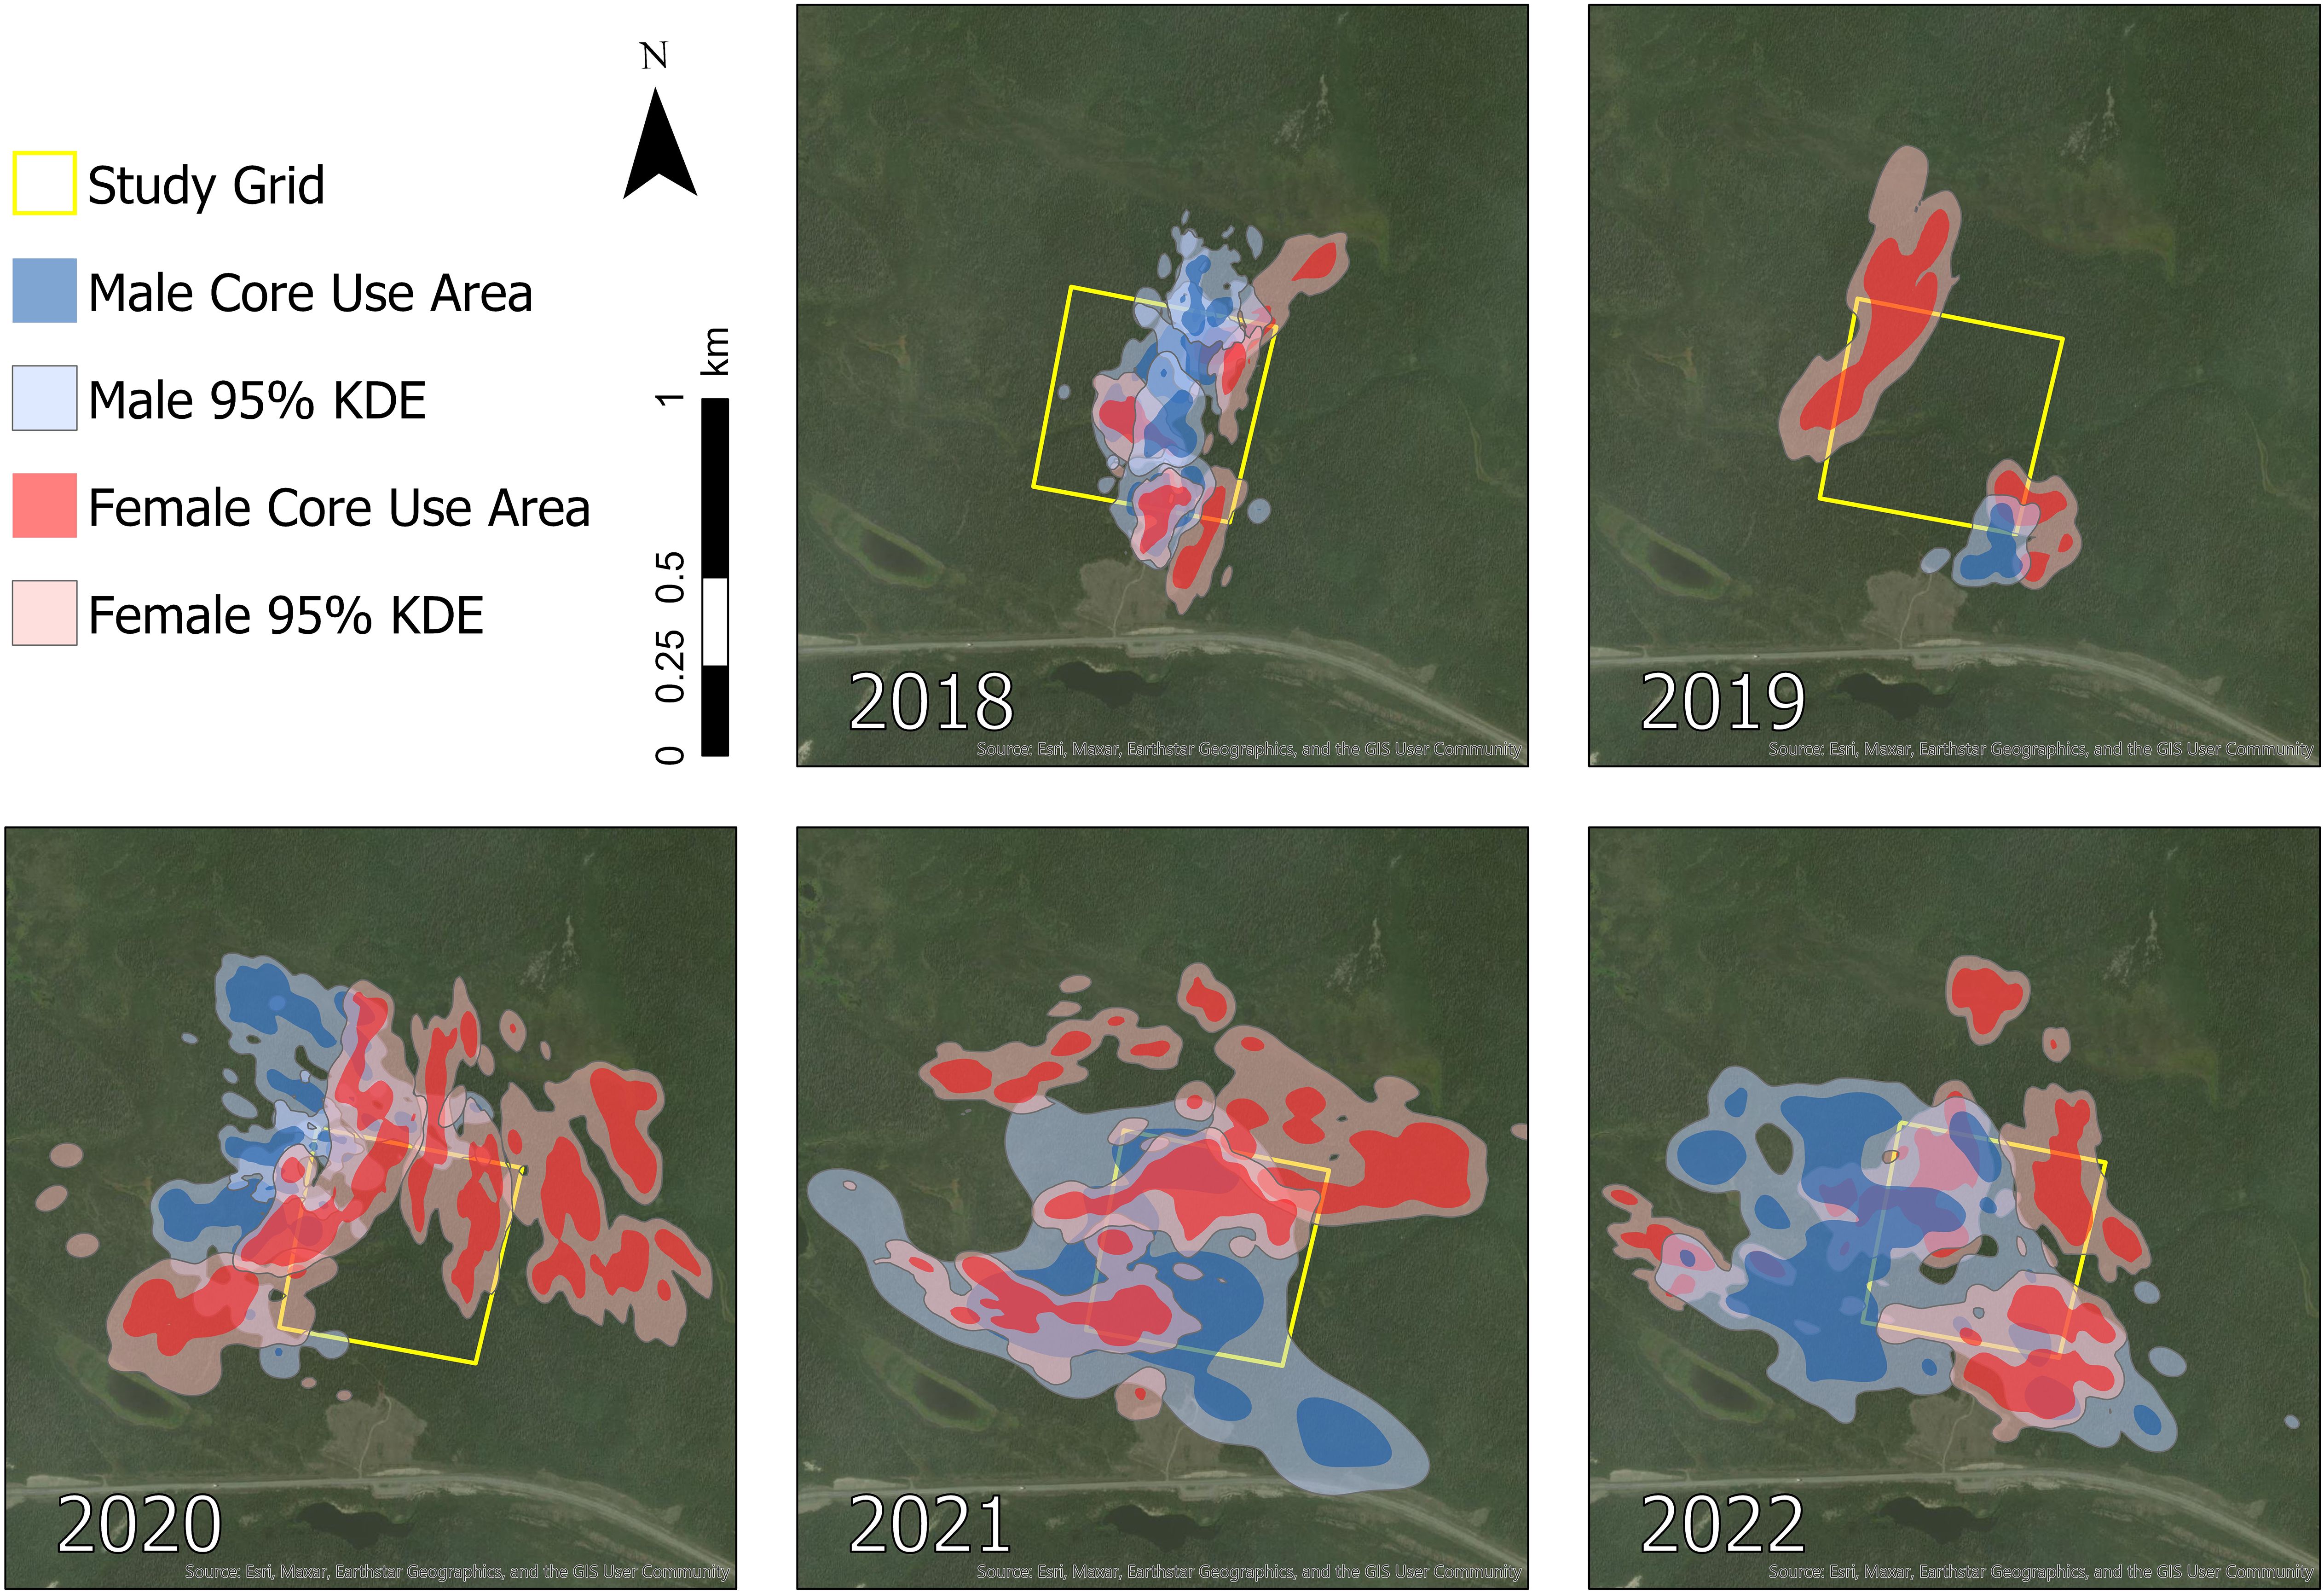
Figure 3 Seasonal home ranges (95% isopleth) and core use areas (60–88% isopleths) of a sample of snowshoe hares (Lepus americanus) monitored in southwestern Yukon, Canada (n = 11 [2018], n = 4 [2019], n = 4 [2020], n = 4 [2021], n = 5 [2022]).
Hare core use was comparably explained by three models (ΔAICc < 2.0): Sex, Null, and Year and Sex (Table 1). However, given the poor fit of all of these models and coefficients overlapping zero (Table 2), we infer that core use isopleths were not influenced by either year or sex. The proportion of hare home ranges that were used most intensively were largely consistent across years, with a median of 68% (range: 60–88%) from 2015–2022. Isopleth values were comparable between sexes throughout the study period.
3.2 Movement metrics
Best fit models for hourly movement rates included main effects of Year, Sex, and Diel Period, and Diel Period with a Year × Sex interaction (Tables 1, 2). Males exhibited higher movement rates compared to females on average and movement rates increased slightly for both sexes across years. Notably, these models didn’t explain a substantial amount of variation in hourly movement rates over the null model based on conditional pseudo-R2 values (Table 1). Males exhibited variable hourly movement rates between years, with rates increasing from a median of 27.7 m/hr (23.2–27.7) in 2015 to 68.9 m/hr (28.0–68.9) in 2021 (Figure 2B). Females, however, showed little variability in hourly movement rates with median rates of 31.4 m/hr (29.1–32.9) from 2015–2022. Similarly, daily movement rates were best explained by two models that included main effects of Week, Year and Sex, with or without an interaction term (Table 1). In both models, daily movement rate increased across the cycle but decreased slightly over the breeding season (Table 2; Figure 2C). However, in contrast to prediction v, seasonal activity varied between sexes, with male daily movement rates highest in May (median = 679 m/day; 557–800) and lowest in July (median = 587 m/day; 472–731), and female daily movement rates lowest in May (median = 578 m/day; 522–698) and highest in August (median = 737 m/day; 574–842). Tortuosity was highly variable (Figure 2D) and was not clearly influenced by the factors we considered with the Null model being among the best-fit models (Tables 1, 2).
The best-fit model for time spent travelling included main effects of Year and Sex, with a Year × Sex interaction (Tables 1, 2). Midway through the cycle, male hares spent more time travelling compared to females and the time they spent travelling decreased across the cycle, whereas that of females did not vary. Qualitatively, males exhibited more variation in travel-related behaviors between years than females.
3.3 Predation risk responses
Seasonal (May–September) detection rates for hare, lynx, and coyote via trail cameras across all years were 16,435, 2,719, and 1,340 detections, respectively. Inter-annual lynx and coyote detections followed a similar trend to hares, with peak detections in 2017 and declining steadily to few detections in 2021–2022 (Figure 4A). Within the breeding season, there was a qualitative decline in hare detections during June and a resurgence by August, whereas for lynx, detections were consistent through the spring-summer season (Figure 4B). Coyote detections declined qualitatively in June–July and increased in August–September (Figure 4B).
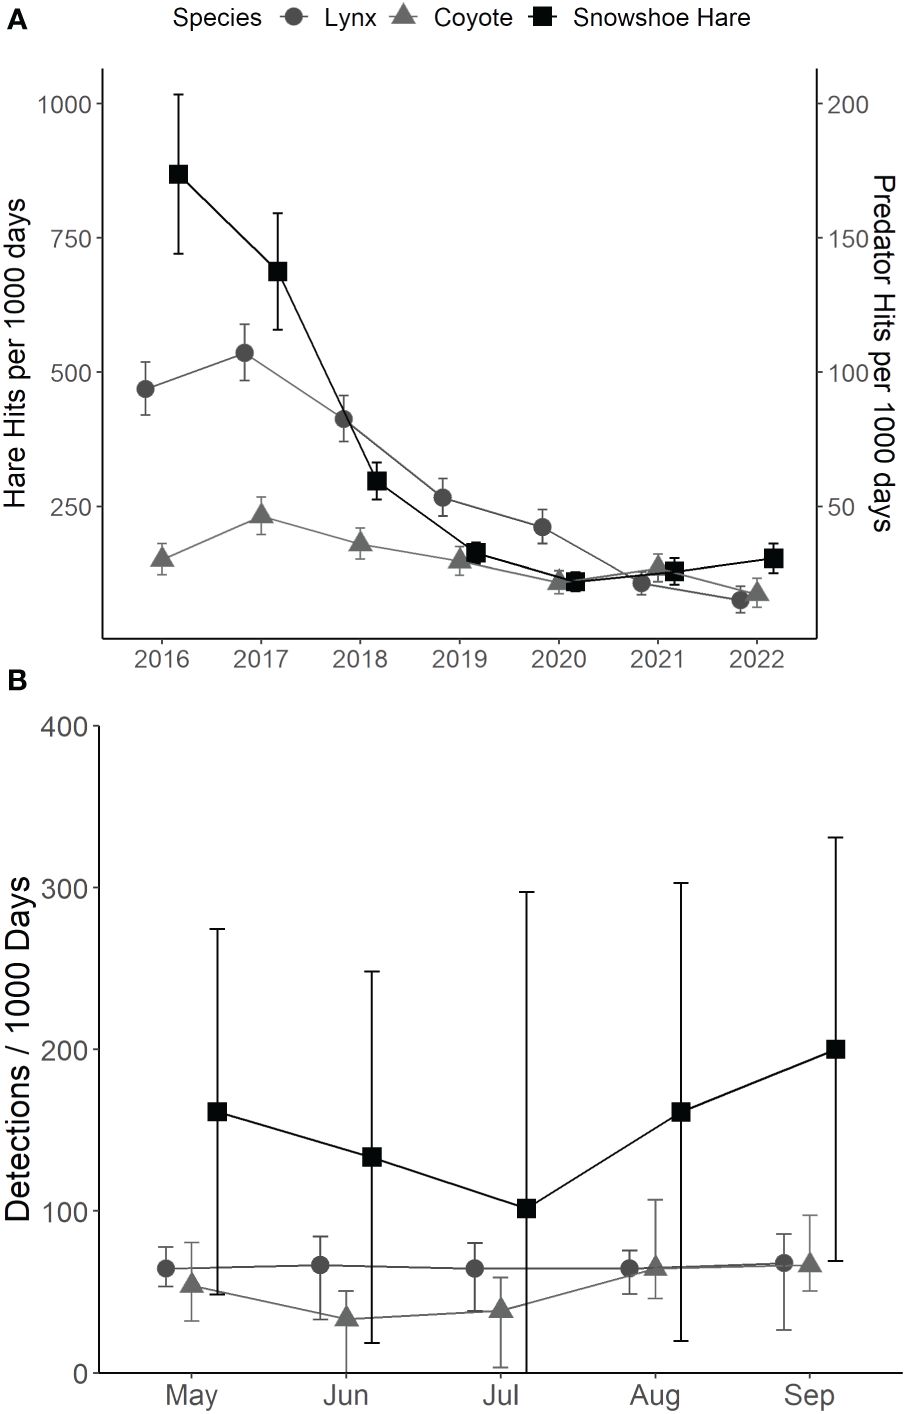
Figure 4 (A) Median detections per 1,000 days (± 95% BCa CI) of snowshoe hare (Lepus americanus; black squares), lynx (Lynx canadensis; dark grey circles), and coyote (Canis latrans; light grey triangles) in southwestern Yukon, Canada (2016–2022). (B) Median detections per 1,000 days (± 95% BCa CI) of snowshoe hare, lynx, and coyotes from May–September (2016–2022) in southwestern Yukon, Canada.
The best-fit models for hare, lynx, and coyote detections included Year and Month as predictors. Goodness-of-fit were acceptable (cond. pseudo R2 > 0.20) for hare and lynx models, but lower (cond. Pseudo R2 < 0.20) for coyote models (Supplementary Tables 1, 2). Hare and lynx detections decreased across years as expected with changes in density across the cycle. Hare detections also increased slightly across months within the breeding season. Accordingly, we infer that despite variable hare activity and movements during the hare and predator population cycles (Figure 2), seasonal changes in hare detections did not correspond to seasonal detection variability for terrestrial predators.
4 Discussion
Our study revealed that snowshoe hares exhibit variable spring–summer movement and activity during their population cycle, with both sexes (but especially males) increasing home range size in the low phase. During the cycle both sexes exhibited similar core use isopleths and movement tortuosity, but males also had greater and more variable movement rates and time spent travelling compared to females. Intra-season variation in hare movements were not closely associated with shifts in either predator activity or putative seasonal variation in food availability. Collectively, our findings support that searching for mating opportunities is the primary driver of hare movement during the breeding season, as well as explaining inter-annual movement variation during their population cycle. More broadly, this suggests that potential fitness rewards associated with successful mate search and reproduction outweigh costs and risks associated with this behavior, even in highly variable environments.
During the mating season, animals may expand their space use and take more risks in their movements and habitat selection (Keeley et al., 2017). As home range size is often negatively related to population density (e.g., Trewhella et al., 1988; Dahle and Swenson, 2003; Fateaux and Gauthier, 2022), lower numbers of conspecifics may elicit increased searching for mates, and this behavior may be sex-specific depending on species’ mating strategies (Kokko and Rankin, 2006). In systems where males are primarily responsible for mate search and acquisition, mating limitations at low densities should require more expansive male ranges and movements (Berec et al., 2018). In contrast, in some systems females do not actively search for mates and are primarily involved in maternal activities, which can restrict their movements (Chinn et al., 2023). Snowshoe hare mating strategy is likely polygynous or promiscuous (Burton, 2002; see also Knipe et al., 2013), implying that during the breeding season males should actively search for females whereas females should mostly tend to their offspring. Because hares give birth to 2–4 litters per year (Cary and Keith, 1979; Krebs et al., 2018), males should travel extensively throughout the April–August period in search of mating opportunities whereas females should be involved mostly in maternal care during this same period (O’Donoghue and Bergman, 1992; Berec et al., 2018; Chinn et al., 2023). This strategy could also explain the more expansive movements of males during the period of low hare density, when mating opportunities are more limited and females may be sparsely distributed across the landscape. Both sexes may exhibit more widespread movement dynamics at lower population densities, when hares produce fewer litters (Stefan and Krebs, 2001). Females may also engage less in maternal duties during the decline phase when predation risk is high (J. Gobin, unpubl.). This speculation is supported by the similarity between male and female home range size and daily displacement during the low and increase phases of their population cycle, and the increase in home range and movements across both sexes during the decline period. The consistency in core use isopleths between sexes and throughout the cycle likely illustrates that hares invariably meet their basic needs for food and cover at a constant, smaller spatial scale.
Predation is the primary cause of mortality in snowshoe hares and a driving force of the hare population cycle (Murray et al., 1997; Krebs et al., 2018). While declining home range sizes and movement from 2015–2019 correspond with declining hare densities, they also correlate with declining predator numbers. Therefore, we cannot conclusively distinguish whether changes in hare home range size and movement were in response to a loss of mating opportunities, lower predation risk, or a combination of these factors. Nonetheless, the lack of correspondence between seasonal hare and predator activity patterns (as determined by trail cameras) suggests that predation risk is not a primary driver of summer hare movements. This inference is reinforced by observed differences in home range size between male and female hares, which should not be observed if predation risk is a primary driver of movement. As reported mortality rates in hares tend to be similar between sexes (Murray et al., 1997), it seems unlikely that predation risk underlies observed differences in their movement dynamics. Note that prey may sometimes increase movement and home range size when under high predation risk as a means of diluting olfactory cues that predators use to detect prey (Frair et al., 2005; Finnerty et al., 2022). While there is also evidence that prey may increase activity in response to predation pressure (Kauffman et al., 2007; Mayer et al., 2020), in our system hare activity does not appear to influence predation rates by lynx (Shiratsuru et al., 2023). Thus, based on the differences in movement patterns occurring primarily between sexes and weak correspondence between seasonal movements and predator activity, we infer that predation risk is not likely a major driving force behind hare movement during the summer.
We predicted that if overwinter food limitation affects summer movements in hares, they would be most active and wide-ranging early in the season before leafy vegetation becomes widely available. However, observed differences between male and female activity during this period does not support this prediction given that both sexes should be comparably impacted by overwinter food shortage. In fact, the higher activity of males early in the season also coincides with the timing of most intensive mating activity in hares, making it unlikely that food limitation is a strong predictor of early-season movement dynamics. Regardless, if overwinter food limitation was a primary influence on summer hare movements, we would also expect hares would travel more during the peak in hare density, when lower per capita food availability should have more strongly affected their early summer feeding requirements.
We conclude that mating and reproductive behaviors associated with changing population density are the primary factors driving summer hare movement dynamics in cyclic snowshoe hare populations. Nevertheless, movement dynamics can be shaped by multiple factors acting either alone or in tandem (Ganz et al., 2022), and correlated factors such as hare and predator population densities may have effects that are inherently difficult to distinguish in natural systems. It follows that low goodness-of-fit for some of our predictive models and small sample sizes during low hare densities are important reminders that other influences should not be ruled out as potentially influencing movement dynamics. For example, population density and mate searching may play a lesser role in movement dynamics of high-density, non-cyclic hare populations. Alternatively, for other cyclic species with different reproductive strategies, factors like predation risk or food availability may play a more dominant, time-varying role. We defined cyclic changes by year rather than cyclic phase as there is uncertainty around phase designation. However, for some metrics (e.g., home range size) the response consistently spans several years, suggesting cyclic phase as the driver rather than annual variation. Observations outside the breeding season could further assist in testing competing hypotheses explaining movement dynamics. Accordingly, a remaining challenge will be to develop a generalized understanding of factors affecting movement dynamics in species across a range of ecological conditions, and to identify the circumstances where mating opportunities play an over-riding role in driving variation.
Data availability statement
The original contributions presented in the study are included in the article/Supplementary Material. Further inquiries can be directed to the corresponding author.
Ethics statement
The animal study was approved by Trent University Animal Care Committee. The study was conducted in accordance with the local legislation and institutional requirements.
Author contributions
HM: Conceptualization, Data curation, Formal analysis, Investigation, Resources, Visualization, Writing – original draft, Writing – review & editing. JG: Formal analysis, Writing – review & editing. MB: Resources, Validation, Writing – review & editing. LH: Resources, Writing – review & editing. LS: Resources, Writing – review & editing. JS: Resources, Writing – review & editing. SS: Resources, Writing – review & editing. CK: Writing – review & editing. RB: Writing – review & editing. AK: Data curation, Resources, Writing – review & editing. TJ: Writing – review & editing. SB: Writing – review & editing. DM: Conceptualization, Funding acquisition, Investigation, Supervision, Writing – original draft, Writing – review & editing.
Funding
The author(s) declare financial support was received for the research, authorship, and/or publication of this article. The author(s) declare financial support was received for the research, authorship, and/or publication of this article by the NSERC Discovery Grant program. The publication of this article was supported by the Canada Research Chairs program.
Acknowledgments
We are grateful to Will Richmond, Francis Quinby, Zana Everett, and Juliana Balluffi-Fry for their assistance in the field.
Conflict of interest
The authors declare that the research was conducted in the absence of any commercial or financial relationships that could be construed as a potential conflict of interest.
The author(s) declared that they were an editorial board member of Frontiers at the time of submission. This had no impact on the peer review process and the final decision.
Publisher’s note
All claims expressed in this article are solely those of the authors and do not necessarily represent those of their affiliated organizations, or those of the publisher, the editors and the reviewers. Any product that may be evaluated in this article, or claim that may be made by its manufacturer, is not guaranteed or endorsed by the publisher.
Supplementary material
The Supplementary Material for this article can be found online at: https://www.frontiersin.org/articles/10.3389/fevo.2024.1419245/full#supplementary-material
References
Berbert J. M., Fagan W. F. (2012). How the interplay between individual spatial memory and landscape persistence can generate population distribution patterns. Ecol. Complex. 12, 1–12. doi: 10.1016/j.ecocom.2012.07.001
Berec L., Kramer A. M., Bernhauerová V., Drake J. M. (2018). Density-dependent selection on mate search and evolution of Allee effects. J. Anim. Ecol. 87, 24–35. doi: 10.1111/1365-2656.12662
Bjørneraas K., Van Moorter B., Rolandsen C. M., Herfindal I. (2010). Screening global positioning system location data for errors using animal movement characteristics. J. Wildl. Manage. 74, 1361–1366. doi: 10.1016/j.ecoinf.2015.02.001
Boutin S., Krebs C. J., Boonstra R., Dale M. R. T., Hannon S. J., Martin K., et al. (1995). Population changes of the vertebrate community during a snowshoe hare cycle in Canada’s boreal forest. Oikos 74, 69–80. doi: 10.2307/3545676
Brooks M. E., Kristensen K., Benthem K. J., Magnusson A., Berg C. W., Nielsen A., et al. (2017). glmmTMB balances speed and flexibility among packages for zero-inflated generalized linear mixed modeling. R J. 9, 378–400. doi: 10.32614/RJ-2017-066
Burnham K. P., Anderson D. R. (2002). Model selection and inference: a practical information-theoretic approach. 2nd edition (New York: Springer-Verlag).
Burton C. (2002). Microsatellite analysis of multiple paternity and male reproductive success in the promiscuous snowshoe hare. Can. J. Zool. 80, 1948–1956. doi: 10.1139/z02-187
Cary J. R., Keith L. B. (1979). Reproductive change in the 10-year cycle of snowshoe hares. Can. J. Zool. 57, 375–390. doi: 10.1139/z79-044
Chinn S. M., Hepinstall-Cymerman J., Beasley J. C. (2023). Reproduction drives changes in space use and habitat selection in a highly adaptable invasive mammal. J. Mammal. 104, 479–495. doi: 10.1093/jmammal/gyad010
Cook R. C., Cook J. G., Mech D. (2004). Nutritional condition of northern Yellowstone elk. J. Mammal. 4, 714–722. doi: 10.1644/BRG-131
Dahle B., Swenson J. E. (2003). Home ranges in adult Scandinavian brown bears (Ursus arctos): effect of mass, sex, reproductive category, population density and habitat type. J. Zool. 260, 329–335. doi: 10.1017/S0952836903003753
Dill L. M. (2017). Behavioural ecology and marine conservation: a bridge over troubled water? ICES J. Mar. Sci. 74, 1514–1521. doi: 10.1093/icesjms/fsx034
Doherty J.-F., Ruehle B. (2020). An integrated landscape of fear and disgust: The evolution of avoidance behaviours amidst a myriad of natural enemies. Front. Ecol. Evol. 8. doi: 10.3389/fevo.2020.564343
Duong T. (2022). ks: kernel smoothing (R package version 1.13.5). Available online at: https://CRAN.R-project.org/package=ks.
Efford M. G. (2009). DENSITY 4.4: Software for spatially explicit capture-recapture (Dunedin, New Zealand: Department of Zoology, University of Otago).
Environment and Climate Change Canada (2022). Canadian monthly climate data and 1981-2010 normals (Yukon Territory. Ottawa, Ontario). Available online at: http://climate.weather.gc.ca/climate_normals/index_e.html (Accessed February 2023).
Erlinge S., Hoogenboom I., Agrell J., Nelson J., Sandell M. (1990). Density-related home-range size and overlap in adult Field Voles (Microtus agrestis) in Southern Sweden. J. Mammal. 71, 597–603. doi: 10.2307/1381799
Fateaux D., Gauthier G. (2022). Density-dependent demography and movements in a cyclic brown lemming population. Ecol. Evol. 12, e9055. doi: 10.1002/ece3.9055
Finnerty P. B., McArthur C., Banks P., Price C., Shrader A. M. (2022). The olfactory landscape concept: A key source of past, present, and future information driving animal movement and decision-making. Bioscience 72, 745–752. doi: 10.1093/biosci/biac039
Forsman J. T., Kivelä S. M. (2022). Evolution of searching effort for resources: a missing piece of the puzzle in the ideal free distribution paradigm. Oikos 2022, e08202. doi: 10.1111/oik.08202
Frair J. L., Merrill E. H., Visscher D. R., Fortin D., Beyer H. L., Morales J. M. (2005). Scales of movement by elk (Cervus elaphus) in response to heterogeneity in forage resources and predation risk. Landsc. Ecol. 20, 273–287. doi: 10.1007/s10980-005-2075-8
Ganz T. R., DeVivo M. T., Kertson B. N., Roussin T., Satterfield L., Wirsing A. J., et al. (2022). Interactive effects of wildfires, season and predator activity shape mule deer movements. J. Anim. Ecol. 91, 2273–2288. doi: 10.1111/1365-2656.13810
Garitano-Zavala A., Chura Z., Cotín J., Ferrer X., Nadal J. (2013). Home range extension and overlap of the Ornate Tinamou (Nothoprocta ornate) in an Andean agro-ecosystem. Wilson J. Ornithol. 125, 491–501. doi: 10.1676/12-151.1
Girard I., Ouellet J. P., Courtois R., Dussault C., Breton L. (2002). Effects of sampling effort based on GPS telemetry on home-range size estimations. J. Wildl. Ecol. 66, 1290–1300. doi: 10.2307/3802962
Guyer C., Johnson V. M., Hermann S. M. (2012). Effects of population density on patterns of movement and behaviour of gopher tortoises (Gopherus polyphemus). Herpetol. Monogr. 26, 122–134. doi: 10.1655/HERPMONOGRAPHS-D-10-00004.1
Kauffman M. J., Varley N., Smith D. W., Stahler D. R., MacNulty D. R., Boyce M. S. (2007). Landscape heterogeneity shapes predation in a newly restored predator-prey system. Ecol. Lett. 10, 690–700. doi: 10.1111/j.1461-0248.2007.01059.x
Keeley A. T. H., Beier P., Keeley B. W., Fagan M. E. (2017). Habitat suitability is a poor proxy for landscape connectivity during dispersal and mating movements. Landsc. Urban Plan. 161, 90–102. doi: 10.1016/j.landurbplan.2017.01.007
Kenney A. J., Boutin S., Jung T. S., Murray D. L., Johnson N., Krebs C. J. (2024). Motion-sensitive cameras track population abundance changes in a boreal mammal community in southwestern Yukon, Canada. J. Wildl. Manage. 88, e22564. doi: 10.1002/jwmg.22564
Kie J. G., Matthiopoulos J., Fieberg J., Powell R. A., Cagnacci F., Mitchell M. S., et al. (2010). The home range concept: are traditional estimators still relevant with modern telemetry technology? Philos. Trans. R. Soc Lond. B. Biol. Sci. 365, 2221–2231. doi: 10.1098/rstb.2010.0093
Knipe A., Fowler P. A., Ramsay S., Haydon D. T., McNeilly A. S., Thirgood S., et al. (2013). The effects of population density on the breeding performance of mountain hare (Lepus timidus). Wildl. Biol. 19, 473–482. doi: 10.2981/12-109
Kokko H., Rankin D. J. (2006). Lonely hearts or sex in the city? Density-dependent effects in mating systems. Phil. Trans. R. Soc B. 361, 319–334. doi: 10.1098/rstb.2005.1784
Krebs C., Boonstra R., Boutin S. (2018). Using experimentation to understand the 10-year snowshoe hare cycle in the boreal forest of North America. J. Anim. Ecol. 87, 87–100. doi: 10.1111/1365-2656.12720
Krebs C., Boutin S., Boonstra R. (2001). Ecosystem dynamics of the boreal forest: the kluane project (New York: Oxford University Press), 510. doi: 10.1093/oso/9780195133936.001.0001
Krebs C. J., Boutin S., Boonstra R., Murray D. L., Jung T., O’Donoghue M., et al. (2023). Long-term monitoring in the boreal forest reveals high spatio-temporal variability among primary ecosystem constituents. Front. Ecol. Evol. 11, 1187222. doi: 10.3389/fevo.2023.1187222
Krebs C. J., Bryant J., Kielland K., O’Donoghue M., Doyle F., Carriere S., et al. (2014). What factors determine cyclic amplitude in the snowshoe hare (Lepus americanus) cycle? Can. J. Zool. 92, 1039–1048. doi: 10.1139/cjz-2014-0159
Krebs C. J., Jung T., O’Donoghue M., Gilbert S., Taylor S., Drummond R., et al. (2022). The community ecological monitoring program annual data report. Available online at: https://www.zoology.ubc.ca/~krebs/kluane.html.
Lassis R., Festa-Bianchet M., Pelletier F. (2022). Breeding migrations of bighorn sheep males are driven by mating opportunities. Ecol. Evol. 12, e8692. doi: 10.1002/ece3.8692
Laundre J. W., Hernàndez L., Ripple W. J. (2010). The landscape of fear: ecological implications of being afraid. Open J. Ecol. 3, 1–7. doi: 10.2174/1874213001003030001
Lefcheck J. S. (2016). piecewiseSEM: Piecewise structural equation modeling in R for ecology, evolution, and systematics. Methods Ecol. Evol. 7, 573–579. doi: 10.1111/2041-210X.12512
Lüdecke D., Ben-Shachar M., Patil I., Waggoner P., Makowski D. (2021). Performance: an R package for assessment, comparison and testing of statistical models. J. Open Source Software 6, 3139. doi: 10.21105/joss.03139
Majchrzak Y. N., Peers M. J. L., Studd E. K., Menzies A. K., Walker P. D., Shiratsuru S., et al. (2022). Balancing food acquisition and predation risk drives demographic changes in snowshoe hare population cycles. Ecol. Lett. 25, 709–1045. doi: 10.1111/ele.13975
Mangiafico S. S. (2023). rcompanion: Functions to support extension education program evaluation (New Brunswick, New Jersey: Rutgers Cooperative Extension). Version 2.4.34.
Mayer M., Bjerre D. H. F., Sunde P. (2020). Better safe than sorry: The response to a simulated predator and unfamiliar scent by the European hare. Ethology 126, 704–715. doi: 10.1111/eth.13019
McIntyre N., Wiens J. (1999). Interactions between landscape structure and animal behavior: The roles of heterogeneously distributed resources and food deprivation on movement patterns. Landsc. Ecol. 14, 437–447. doi: 10.1023/A:1008074407036
Moorcraft P. R., Lewis M. A. (2006). Mechanistic home range analysis (New Jersey: Princeton University Press), 172.
Mueller T., Fagan W. F. (2008). Search and navigation in dynamic environments – from individual behaviors to population distributions. Oikos 117, 654–664. doi: 10.1111/j.0030-1299.2008.16291.x
Murray D. L., Bastille-Rousseau G., Beaty L. E., Hornseth M. L., Row J. R., Thornton D. H. (2020). “From research hypothesis to model selection: A strategy for robust inference in population ecology,” in Population ecology in practice, eds. Murray D. L., Sandercook B. K. (New Jersey, USA: John Wiley & Sons), 17–102.
Murray D. L., Cary J. R., Keith L. B. (1997). Interactive effects of sublethal nematodes and nutritional status on snowshoe hare vulnerability to predation. J. Anim. Ecol. 66, 265–278. doi: 10.2307/6026
Nathan R., Getz W. M., Revilla E., Holyoak M., Kadmon R., Saltz D., et al. (2008). A movement ecology paradigm for unifying organismal movement research. PNAS 105, 19052–19059. doi: 10.1073/pnas.0800375105
O’Donoghue M., Bergman C. M. (1992). Early movements and dispersal of juvenile snowshoe hares. Can. J. Zool. 70, 1787–1791. doi: 10.1139/z92-246
O’Donoghue M., Boutin S., Murray D. L., Krebs C. J., Hofer E. J., Breitenmoser U., et al. (2001). “Coyotes and lynx,” in Ecosystem dynamics of the boreal forest: the kluane project (Oxford University Press, New York), 276–323.
Owen-Smith N., Fryxell J. M., Merrill E. H. (2010). Foraging theory upscaled: the behavioural ecology of herbivore movement. Phil. Trans. R. Soc B. 365, 2267–2278. doi: 10.1098/rstb.2010.0095
R Core Team (2022). R: A language and environment for statistical computing (Vienna, Austria: R Foundation for Statistical Computing).
Schielzeth H. (2010). Simple means to improve the interpretability of regression coefficients. Methods Ecol. Evol. 1, 103–113. doi: 10.1111/j.2041-210X.2010.00012.x
Shaw A. K. (2020). Causes and consequences of individual variation in animal movement. Mov. Ecol. 8, 12. doi: 10.1186/s40462-020-0197-x
Shiratsuru S., Studd E. K., Boutin S., Peers M. J. L., Majchrzak Y. N., Menzies A. K., et al. (2023). When death comes: Linking predator-prey activity patterns to timing of mortality to understand predation risk. Proc. R. Soc B. 290, 20230661. doi: 10.1098/rspb.2023.0661
Signer J., Fieberg J., Avgar T. (2011). Animal movement tools (amt): R package for managing tracking data and conducting habitat selection analyses. Ecol. Evol. 2019, 880–890. doi: 10.1002/ece3.4823
Stark D. J., Vaughan I. P., Ramirez Saldivar D. A., Nathan S. K. S. S., Goossens B. (2017). Evaluating methods for estimating home ranges using GPS collars: A comparison using proboscis monkeys (Nasalis larvatus). PloS One 12, e0174891. doi: 10.1371/journal.pone.0174891
Stefan C. I., Krebs C. J. (2001). Reproductive changes in a cyclic population of snowshoe hares. Can. J. Zool. 79, 2101–2108. doi: 10.1139/z01-177
Studd E. K., Boudreau M. R., Majchrzak Y. N., Menzies A. K., Peers M. J. L., Seguin J. L., et al. (2019). Use of acceleration and acoustics to classify behavior, generate time budgets, and evaluate responses to moonlight in free-ranging snowshoe hares. Front. Ecol. Evol. 7. doi: 10.3389/fevo.2019.00154
Thieurmel B., Elmarhraoui A. (2022). _suncalc: Compute sun position, sunlight phases, moon position and lunar phase_ (R package version 0.5.1). Available online at: https://CRAN.R-project.org/package=suncalc.
Trewhella W. J., Harris S., McAllister F. E. (1988). Dispersal distance, home-range size and population density in the Red Fox (Vulpes vulpes): A quantitative analysis. J. Appl. Ecol. 25, 423–434. doi: 10.2307/2403834
Vander Wal E., Rodgers A. R. (2012). An individual-based quantitative approach for delineating core areas of animal space use. Ecol. Modell. 224, 48–53. doi: 10.1016/j.ecolmodel.2011.10.006
Keywords: breeding season, home range, movement ecology, behavior, predation risk, boreal forest, GPS collars
Citation: Miller HA, Gobin J, Boudreau MR, Horne LG, Scholl LE, Seguin JL, Sonnega S, Krebs CJ, Boonstra R, Kenney AJ, Jung TS, Boutin S and Murray DL (2024) Cyclic dynamics drive summer movement ecology of snowshoe hares (Lepus americanus). Front. Ecol. Evol. 12:1419245. doi: 10.3389/fevo.2024.1419245
Received: 17 April 2024; Accepted: 17 June 2024;
Published: 02 July 2024.
Edited by:
Franz Bairlein, Heligoland Bird Observatory, GermanyReviewed by:
Francesco Bisi, University of Insubria, ItalyJuliana M. Berbert, Federal University of ABC, Brazil
Copyright © 2024 Miller, Gobin, Boudreau, Horne, Scholl, Seguin, Sonnega, Krebs, Boonstra, Kenney, Jung, Boutin and Murray. This is an open-access article distributed under the terms of the Creative Commons Attribution License (CC BY). The use, distribution or reproduction in other forums is permitted, provided the original author(s) and the copyright owner(s) are credited and that the original publication in this journal is cited, in accordance with accepted academic practice. No use, distribution or reproduction is permitted which does not comply with these terms.
*Correspondence: Hannah A. Miller, aG1pbGxlckB0cmVudHUuY2E=