 Kristin M. Robinson
 Kaitlin M. Baudier
- School of Biological, Environmental and Earth Sciences, The University of Southern Mississippi, Hattiesburg, MS, United States
Introduction: The current state of anthropogenic climate change is particularly concerning for tropical insects, species predicted to be the most negatively affected. Researching climatic tolerance in social insects is challenging because adaptations exist at both individual and societal levels. Division of labor research helps to bridge the gap between our understanding of these adaptations at different scales, which is important because social insects comprise a tremendous portion of global animal biomass, biodiversity, and ecosystem services. Considering how individual physiologies construct group-level adaptations can improve climate change impact assessments for social species. Tetragonisca angustula is a neotropical stingless bee species that exhibits high worker subcaste specialization with a morphologically distinct soldier caste.
Methods: We used this species to investigate 1) whether age- and size-differentiated subcastes differ in thermal tolerance, 2) which worker subcaste operates closest to their thermal limits, and 3) the extent to which this species selects active foraging times to offset thermal stress. We measured the thermal tolerance (CTmax and CTmin) of small-bodied foragers and two soldier subcastes (hovering guards and standing guards) in T. angustula.
Results and discussion: Despite body size differences between foragers and guards, no differences in the upper or lower thermal limits were observed. However, the average thermal tolerance breadth of foragers was significantly larger than that of guards, and foraging sites were more thermally variable than nest sites, supporting the Climatic Variability Hypothesis at a microclimate scale and in the context of division of labor. Warming tolerance was significantly lower among small-bodied foragers compared to hovering and standing guards. The magnitude of warming tolerances indicated low risk of imminent climate change impacts in this environment but suggests that increasing temperatures and heatwave prevalence may cause foragers to meet their upper thermal limits before other subcastes. Foraging occurred at a narrower range of temperatures than would challenge critical temperatures, with higher morning activity. Directionally increasing temperatures will likely confine these preferred foraging temperatures to a narrower time window. Further study is needed to elucidate how foragers may shift times of activity in response to anthropogenic warming, but changing climates may impact plant pollination rates in natural and agricultural systems.
Introduction
While there are a wide range of abiotic threats currently faced by insects, anthropogenic climate change is of particular concern, especially in the tropics where increasingly variable temperature and precipitation patterns are predicted to be most intense (Deutsch et al., 2008; Diamond et al., 2012; Gonzalez et al., 2021; IPCC, 2022). Because the tropics have less seasonal variation in temperature, species adapted to tropical environments have narrower ranges of climatic tolerance, as stated by the Climatic Variability Hypothesis (CVH) or Janzen’s rule (Janzen, 1967; Addo-Bediako et al., 2000; Gaston et al., 2009; Sunday et al., 2019). The performance of ectothermic animals are highly subject to changes in climate because they either match their body temperature to the environment or they behaviorally thermoregulate to change their internal temperature (Clusella-Trullas et al., 2011; Sunday et al., 2019). Small ectothermic animals, like insects, are even more highly subject to variations in temperature and humidity due to their lower surface area to volume ratio, less lipid storage, and high metabolic rates (Gibbs et al., 2003; Bujan et al., 2016). Tropical insects with narrow ranges of thermal tolerance, as predicted by the CVH, are particularly at risk of thermal stress due to anthropogenic climate change (Deutsch et al., 2008; Diamond et al., 2012).
Eusocial insects are particularly in need of further climate change studies because of their contribution to the planet’s biomass, biodiversity, and proficiency at implementing ecosystem services such as biological control, seed dispersal, and pollination (Elizalde et al., 2020). It is predicted that climate change will reduce social insect species-level and colony-level ranges, having major implications for agriculture and natural ecosystems (Friedman et al., 2019; Souza-Junior et al., 2020; Gonzalez et al., 2021; Maia-Silva et al., 2021). When studying eusocial insects, it is essential to account for both individual-level and colony-level variation to understand how species respond to climatic stressors (Baudier and O’Donnell, 2017). Overlooking intracolony variation in thermal performance may lead to improperly estimating climatic risk and conservation needs. Because eusocial insects have different castes that are all essential to the functioning of the colony, it is important to assess whether one caste may operate closer to its functional limits, acting as a limiting factor for colony-level (Baudier and O’Donnell, 2017; Menzel and Feldmeyer, 2021).
In many eusocial insects, such as in stingless bees (Tribe: Meliponini), previous studies have used estimates of thermal tolerance to predict responses to climate change (Torres et al., 2007; Macías-Macías et al., 2011; da Silva et al., 2017; Hrncir et al., 2019; Souza-Junior et al., 2020; Maia-Silva et al., 2021; Gonzalez et al., 2022c), but division of labor is rarely taken into account. The threat of increasing climate variability to stingless bees is high and these insects are among the most diverse and abundant pollinators in the tropics (Hrncir et al., 2016; Quezada-Euán et al., 2018). Due to its high degree of worker sub-caste specialization (Grüter et al., 2012, Grüter et al., 2017; Baudier et al., 2019), the stingless bee Tetragonisca angustula is a species of particular interest for researching how division of labor may mitigate or exacerbate the effects of climate variation on a bee colony. Tetragonisca angustula is one of very few bee species known to exhibit a morphologically distinct soldier subcaste (Grüter et al., 2012), a characteristic most commonly found and studied in termites and ants (Abbot, 2022). Colonies of T. angustula have two types of guards within the soldier subcaste: hovering guards that hover outside the nest entrance and standing guards that patrol the nest entrance on foot (Wittmann, 1985; Bowden et al., 1994; Kärcher & Ratnieks, 2009; Grüter et al., 2012). These guards exhibit discrete division of labor and do not repeatedly switch back and forth between hovering and standing guarding (Grüter et al., 2011), and they exhibit age polyethism with their task allocations shifting as they age from adult forager to hovering guard and finally to the role of standing guard (Baudier et al., 2019). In addition to this species’ conservation value as a widespread native neotropical pollinator, understanding the thermal adaptations of T. angustula also has applied value in agriculture. This species is one of the most common stingless bees used in farming operations across Latin America from Southern Mexico to Southern Brazil (Jaffé et al., 2015; Quezada-Euán et al., 2018).
The high degree of division of labor in T. angustula makes them a good model species in which to compare how different worker subcastes respond to temperature stressors. Here we address the following questions: 1) Do age- and size-differentiated task groups differ in thermal tolerance? 2) which worker subcaste operates closest to its thermal limits in its respective functional microclimate? 3) Do foragers use behavioral thermoregulation, in the form of shifting their times of foraging activity, to offset the thermal stress of these functional microclimates?
Thermal performance variation across morphologically distinct worker-subcastes within colonies is poorly studied in stingless bees, likely because bee species that exhibit these polymorphic worker subcastes are less common. However, in ant species with polymorphic workers, higher heat tolerance and lower cold tolerance typically correspond to a larger body size trend (Cerdá and Retana, 1997; Baudier et al., 2018; Roeder et al., 2021) that is more often observed in the tropics than in temperate regions (Roeder et al., 2021). When looking at a microclimate level, this size-thermal tolerance relationship seems to be stronger in more stable environments where the species are adapted to less climatic variation (Baudier et al., 2018). Based on this, we would predict that the larger-bodied guards would be able to withstand higher temperatures than smaller workers. Cold tolerance appears to be more complex and less related to size (Baudier et al., 2018; Roeder et al., 2021). However, even in tropical systems, measuring cold tolerance is important as it can be more geographically limiting (Bishop et al., 2017), and it allows for the calculation of thermal tolerance breadth which indicates how much thermal variability each individual can tolerate (Sánchez-Echeverría et al., 2019).
Few studies have assessed this size-tolerance relationship within colonies of individual bee species. Studies have been conducted comparing across individuals within the same species, but not necessarily within the same colony, which report no effect of body size on upper or lower thermal tolerance within three subspecies (Maebe et al., 2021), and an effect of larger body size decreasing lower thermal tolerance and increasing upper thermal tolerance only in one of three species assessed (Oyen et al., 2016). Many studies have been conducted regarding the size-thermal tolerance relationship between species of bees, or between populations of a single bee species, with conflicting results. A study by da Silva et al. (2021) in Fiji indicated no effect of body size on upper or lower thermal tolerance across several bee species except one species that had higher thermal tolerance among larger-bodied bees, and further studies have also found no effect of body size on CTmax across several species in temperate climates (Hamblin et al., 2017; Burdine and McCluney, 2019), across lab-reared Bombus subspecies (Maebe et al., 2021), and across populations of Apis mellifera in Mexico (Sánchez-Echeverría et al., 2019; Barreiro et al., 2024). Other studies in temperate climates have found that increasing body size is correlated with decreasing cold tolerance across and within several species (Peters et al., 2016), and a significant effect of increasing body size on increasing heat tolerance and decreasing cold tolerance across three Bombus species (Oyen et al., 2016). In a few examples of tropical bee species, one study reports larger body sizes across four Bombus species were correlated to lowered CTmin (when looking within species, this trend was only maintained in one species) while there was no effect on CTmax across species (Gonzalez et al., 2022a), and another study reports no strong relationship between size and thermal tolerance across stingless bee species (Gonzalez et al., 2022c). It is not yet clear whether there is a reliable size-tolerance relationship trend in bee species, and it is especially unclear whether any trends exist between polymorphic castes within genetically similar colonies of a single species.
Age may also affect thermal tolerance, but its role is currently unclear. A review by Bowler and Terblanche (2008) indicated that there is a general trend across insect taxa of decreasing upper thermal tolerance as an individual advances through life stages which would lead us to predict that the age transition of hovering guards to standing guards would follow this trend. However, when just looking at adult stages, tolerance is highest at eclosion and decreases during early adulthood to a stable level with age, but the effect of age on thermal tolerance is complex and species-dependent (Bowler and Terblanche, 2008). Some studies on social insects find no effect of age on thermal tolerance (Oyen and Dillon, 2018; Baudier et al., 2022), and some results are more complex, showing freshly eclosed ants with higher CTmin but no effect of age on CTmax (Baudier and O’Donnell, 2016). Many of these studies that examine how thermal tolerance changes with age in social insects usually compare young, freshly eclosed adults to all other adults (Baudier and O’Donnell, 2016; Oyen and Dillon, 2018; Roeder et al., 2021; Baudier et al., 2022), or compare life stages such as larvae to adults (Mitchell et al., 1993; Kingsolver and Buckley, 2020). There is not as much work comparing middle-aged adults to older adults (Bowler and Terblanche, 2008), especially for social insects, as would be the case for the comparison between hovering guards to standing guards in T. angustula.
In addition to the possible effects of size and age, the foragers have to spend more time compared to the guards in thermally variable environments away from the nest, which is thermally regulated via worker behavior and nest site selection (Jones and Oldroyd, 2006; Torres et al., 2007; Hrncir et al., 2019; Perez and Aron, 2020; Maia-Silva et al., 2021). Under the CVH, we predict that the foragers would have a wider range of thermal tolerance. Most tests of the CVH focus on large-scale adaptations to biogeographic contrasts in climate or species-level differences in tolerance (Bishop et al., 2017; Sunday et al., 2019; Sklenář et al., 2023) rather than assessing differences in microclimates across microhabitats experienced within colonies of eusocial insects (e.g. Kaspari et al., 2015; Baudier et al., 2018; Villalta et al., 2020). In fact, not evaluating microclimate effects can lead to inaccurately assessing climate change risk (Pincebourde and Casas, 2015). Applying the CVH to a microclimate scale, improves our understanding of how individual physiologies function in the context of the colony as a superorganism (Johnson and Linksvayer, 2010). Not only are foragers likely experiencing more variable environments, but they are likely also facing more extreme high temperatures when foraging compared to the guards performing their tasks at the nest. This leads us to predict that the foragers might be operating closer to their thermal limits than the guards. If this is the case, we also predict that foragers may employ behavioral strategies to adjust the times at which the forage to reduce their exposure, such as was found by Maia-Silva et al. (2021).
Methods
Field site
All field and lab work were conducted on-site at La Selva Research Station (10.43°N, 84.00°W), a lowland tropical rainforest in Heredia province, Costa Rica from May to June of 2022 and 2023.
Testing for differences in thermal tolerance across subcaste
To assess the differences in thermal tolerance across subcastes of T. angustula, we estimated the critical thermal maximum (CTmax) and critical thermal minimum (CTmin) of the most abundant worker subcastes that spend the most time outside of the nest: foragers, hovering guards, and standing guards, using the dynamic method (Lutterschmidt and Hutchison, 1997). We subjected 5 foragers, 5 hovering guards, and 5 standing guards from each of the 10 colonies to each thermal tolerance assay (CTmax and CTmin) in 2022, for a total of 150 bees for the CTmax assay and 150 bees for CTmin. All bees only underwent one of the two assays. One additional forager, hovering guard, and standing guard were collected from each colony to act as controls (bees placed in the assay apparatus, but not exposed to thermal ramping). Similar to Baudier et al. (2019), foragers were identified as bees that immediately flew away upon exiting the nest and were not carrying detritus which would indicate a waste-removal worker. Guards were bees observed engaging in guarding tasks at the nest entrance for at least 20 seconds each. Standing guards were identified as those guards standing in place on the nest entrance tube while facing the entrance during those 20 seconds. Hovering guards were identified as those flying or hovering in place while facing towards the nest entrance.
We collected bees via a combination of aerial net, forceps, and aspirator from their nests into 33 mL (9 dram) vials each with a paper towel moistened with DI water. Each vial was transported inside of an insulated bag which contained an ice pack at the bottom wrapped with a towel to keep the bees from experiencing heat or cold stress during transportation. A Thermochron iButton data logger (Maxim Integrated, San Jose, California) was placed in the bag with the vials to measure the temperature during transport. Transport temperature averaged 22.9°C which was not much cooler than the lab environment (averaging 24.3°C) where the assays were conducted. The time from when bees were collected until the assay began was less than 2 hours. We placed each bee individually into 1.5 mL microcentrifuge tubes with a drop of approximately 1.7 mg commercially processed Apis mellifera honey per tube. Preliminary data collection showed that supplying honey reduced starvation-associated mortality over the course of the assay, as evidenced by improved (100%) control survival. Providing a source of food and hydration also minimized variation in starvation and hydration statuses among subject bees before the assay began. The caps of the tubes were filled with cotton and closed to prevent the bees from seeking thermal refuge in the tops of the tubes.
Tubes were haphazardly placed within the dry heating or cooling block depending on their respective assignment. The assay began with the blocks set at 30°C for both cooling and heating. We ramped the temperature up for CTmax or down for CTmin by 2°C every 10 minutes (averaging 0.2°C min-1). Slower ramping rates offer finer resolution, enabling detection of small differences among individuals. This was the slowest ramping rate that was comparable to other bee thermal tolerance studies but was not so slow as to elicit signs of starvation or desiccation (as evidenced by control performance) (Gonzalez et al., 2022b).
Mobility was checked every 10 minutes after each 2°C change. Mobility loss was defined as a lack of movement aside from the onset of spasms after tapping or flipping the tube to elicit a movement response (Lutterschmidt and Hutchison, 1997; Terblanche et al., 2011), representing the loss of the ability of an animal to escape its thermal environment or perform functions necessary for survival (Mitchell et al., 1993; Kovac et al., 2014; da Silva et al., 2017). The most extreme temperature at which a bee retained mobility was considered its CTmax or CTmin, respectively. The controls were placed in the same type of microcentrifuge tube under the same conditions for the same duration as the assays, except they were held at room temperature which averaged 24.3°C. At the end of the assay, all bees were frozen at -15°C for a minimum of 24 hours before being placed in a drying oven at 50°C for 3 days. Preliminary tests showed no change in mass after 48 hours at this temperature, and previous studies on much larger bee species have found similar temperatures between 50 - 60°C to be sufficient for obtaining dry mass (Hagen and Dupont, 2013; Ostwald et al., 2022). Dry weights were then measured to the nearest 0.1 mg.
For the statistical analysis, we first checked whether the dry mass differed among subcastes as previous studies indicated using a generalized linear mixed effect analysis with colony as the random variable (Table 1). We used separate generalized linear mixed effect analyses with colony as a random variable to assess whether CTmax or CTmin differs among subcaste (Table 1). Because CTmax and CTmin are count-like integer data, the Poisson statistical family was used for these analyses. For these models, only subcaste was used as a predictor variable rather than including both subcaste and dry mass since dry mass and subcaste are highly correlated. Thermal tolerance breadth was calculated as the difference between the average CTmax and the average CTmin per subcaste per colony. We analyzed the difference in thermal tolerance breadth across subcaste with a linear mixed effect model that included colony as a random variable (Table 1).

Table 1 Summary of mixed effect statistical models.
Comparing warming tolerance across subcastes
To assess how close each worker subcaste is to their thermal limit while performing daily tasks in their respective microclimates, we calculated warming tolerance for each individual bee. An animal’s warming tolerance represents how much an organism’s environment can warm before it affects the organism’s critical functioning (Deutsch et al., 2008; Diamond et al., 2012). Warming tolerance was calculated as the difference between each bee’s CTmax and the average highest daily temperature they experienced in their respective microclimate outside the nest. For foragers, these microclimate sites were areas where T. angustula was observed foraging on flowers or resin during haphazard searches for these resources throughout the forest, and natural and human-made clearings. Three floral foraging sites were found in 2023 (a palm inflorescence, Clibadium sp., and Stachytarpheta sp.). Resin foraging sites were located with other bee species present, but none with T. angustula.
To record these temperatures, Hygrochron iButton data loggers (Maxim Integrated, San Jose, California) were placed for approximately three days outside each nest, recoding data every 15 minutes. We placed each iButton within a 3D-printed white plastic housing that prevented direct sunlight and rainfall from encountering the probe while allowing for free airflow around it (The University of Southern Mississippi Eagle Maker Hub; Supplementary Figure S1). Each iButton was placed within 15 cm laterally at each nest entrance. This distance was chosen to be as close as possible to the nest entrance while not disturbing the activity of the bees, indicated by foragers approaching but withdrawing, and guards turning away from the nest entrance to face the data logger. The iButtons at each foraging site were placed within approximately 30 cm of a resource being foraged by T. angustula. We estimated warming tolerance as the difference between the average warmest daily temperature recorded by these iButtons and each bee’s CTmax. The warmest average daily temperature was calculated for the guards by averaging the highest temperature experienced outside their respective nest for each day. Because the foragers were collected directly from their colonies, they could not be associated directly with one foraging site over another. The warmest average daily temperature for foragers was averaged across foraging sites across days to be used as the environmental temperature for all foragers. Both foraging site and nest entrance temperature data were collected in 2023. We compared the difference in warming tolerance between subcastes by using a weighted linear mixed effect model with colony as a random variable (Table 1). The weights were included to account for the heteroscedasticity caused by outliers in the otherwise normally distributed data.
Comparing foraging and nest site microclimates
To understand whether the daily temperatures of foraging sites differ from nest sites during the day (0600 - 1800), the temperature data collected by the iButtons (as described in the previous section) were also used to calculate the average hourly temperatures at each foraging site and nest site. Daytime temperatures (0600 - 1800) were subset from one full day (0000 - 2359) recorded from each foraging and nest site in 2023. The temperatures were averaged for every hour at each site. Levene’s Test was used to assess whether foraging sites were more variable than nesting sites. A Mann Whitney U test was used to assess whether the medians differed significantly between foraging sites and nesting sites.
Influence of temperature on forager activity
The daily activity of foragers was recorded at the nest sites and the foraging sites. In 2023, each nest and foraging site were visited once during two-hour intervals from 0530 to 1730, approximately sunrise to sunset. These visits did not always occur within the same day for each colony because data was not collected during rainy weather when the bees were not active. At the foraging sites, the times that foragers were present or absent were recorded while an iButton was recording temperature data. At the nesting sites, the forager activity data was recorded as the number of foragers leaving the nest per minute which was recorded at 8 nests. The temperature data at the nests was not recorded concurrently with the activity data, but the nest temperature was compiled from 13 nests. From these data, we compared the average hourly temperatures throughout the day to the times when the bees were active to see if there were differences between the available temperatures and the selected temperatures at each foraging site and nest site.
In 2022, we also concurrently recorded forager activity while recording nest temperatures data using iButtons. Forager activity was still measured as the number of foragers leaving per minute which was able to be directly correlated to temperature data at each nest to provide a comparison between the peak forager activity and the peak temperature throughout the day.
Results
Differences in thermal tolerance across subcaste
Despite the morphological, age, and task differences, standing guards, hovering guards, and foragers did not differ in CTmax (n = 150; χ2 = 0.099, df = 2, p = 0.952; Figure 1A) or CTmin (n = 151; χ2 = 0.363, df = 2, p = 0.834; Figure 1B). Dry mass was significantly different among the subcastes (χ2 = 22.596, df = 2, p < 0.001; Supplementary Figure S2). Foragers were significantly smaller than the hovering guards (Tukey HSD; p < 0.001) and standing guards (Tukey HSD; p < 0.001) by an average of 10%. Even when testing whether just body size is a predictor variable of CTmax or CTmin, no significant effect was found (generalized linear mixed effect model with Poisson distribution: CTmax χ2 = 0.093, df = 1, p = 0.761; CTmin χ2 = 0.078, df = 1, p = 0.781; Supplementary Figure S3).
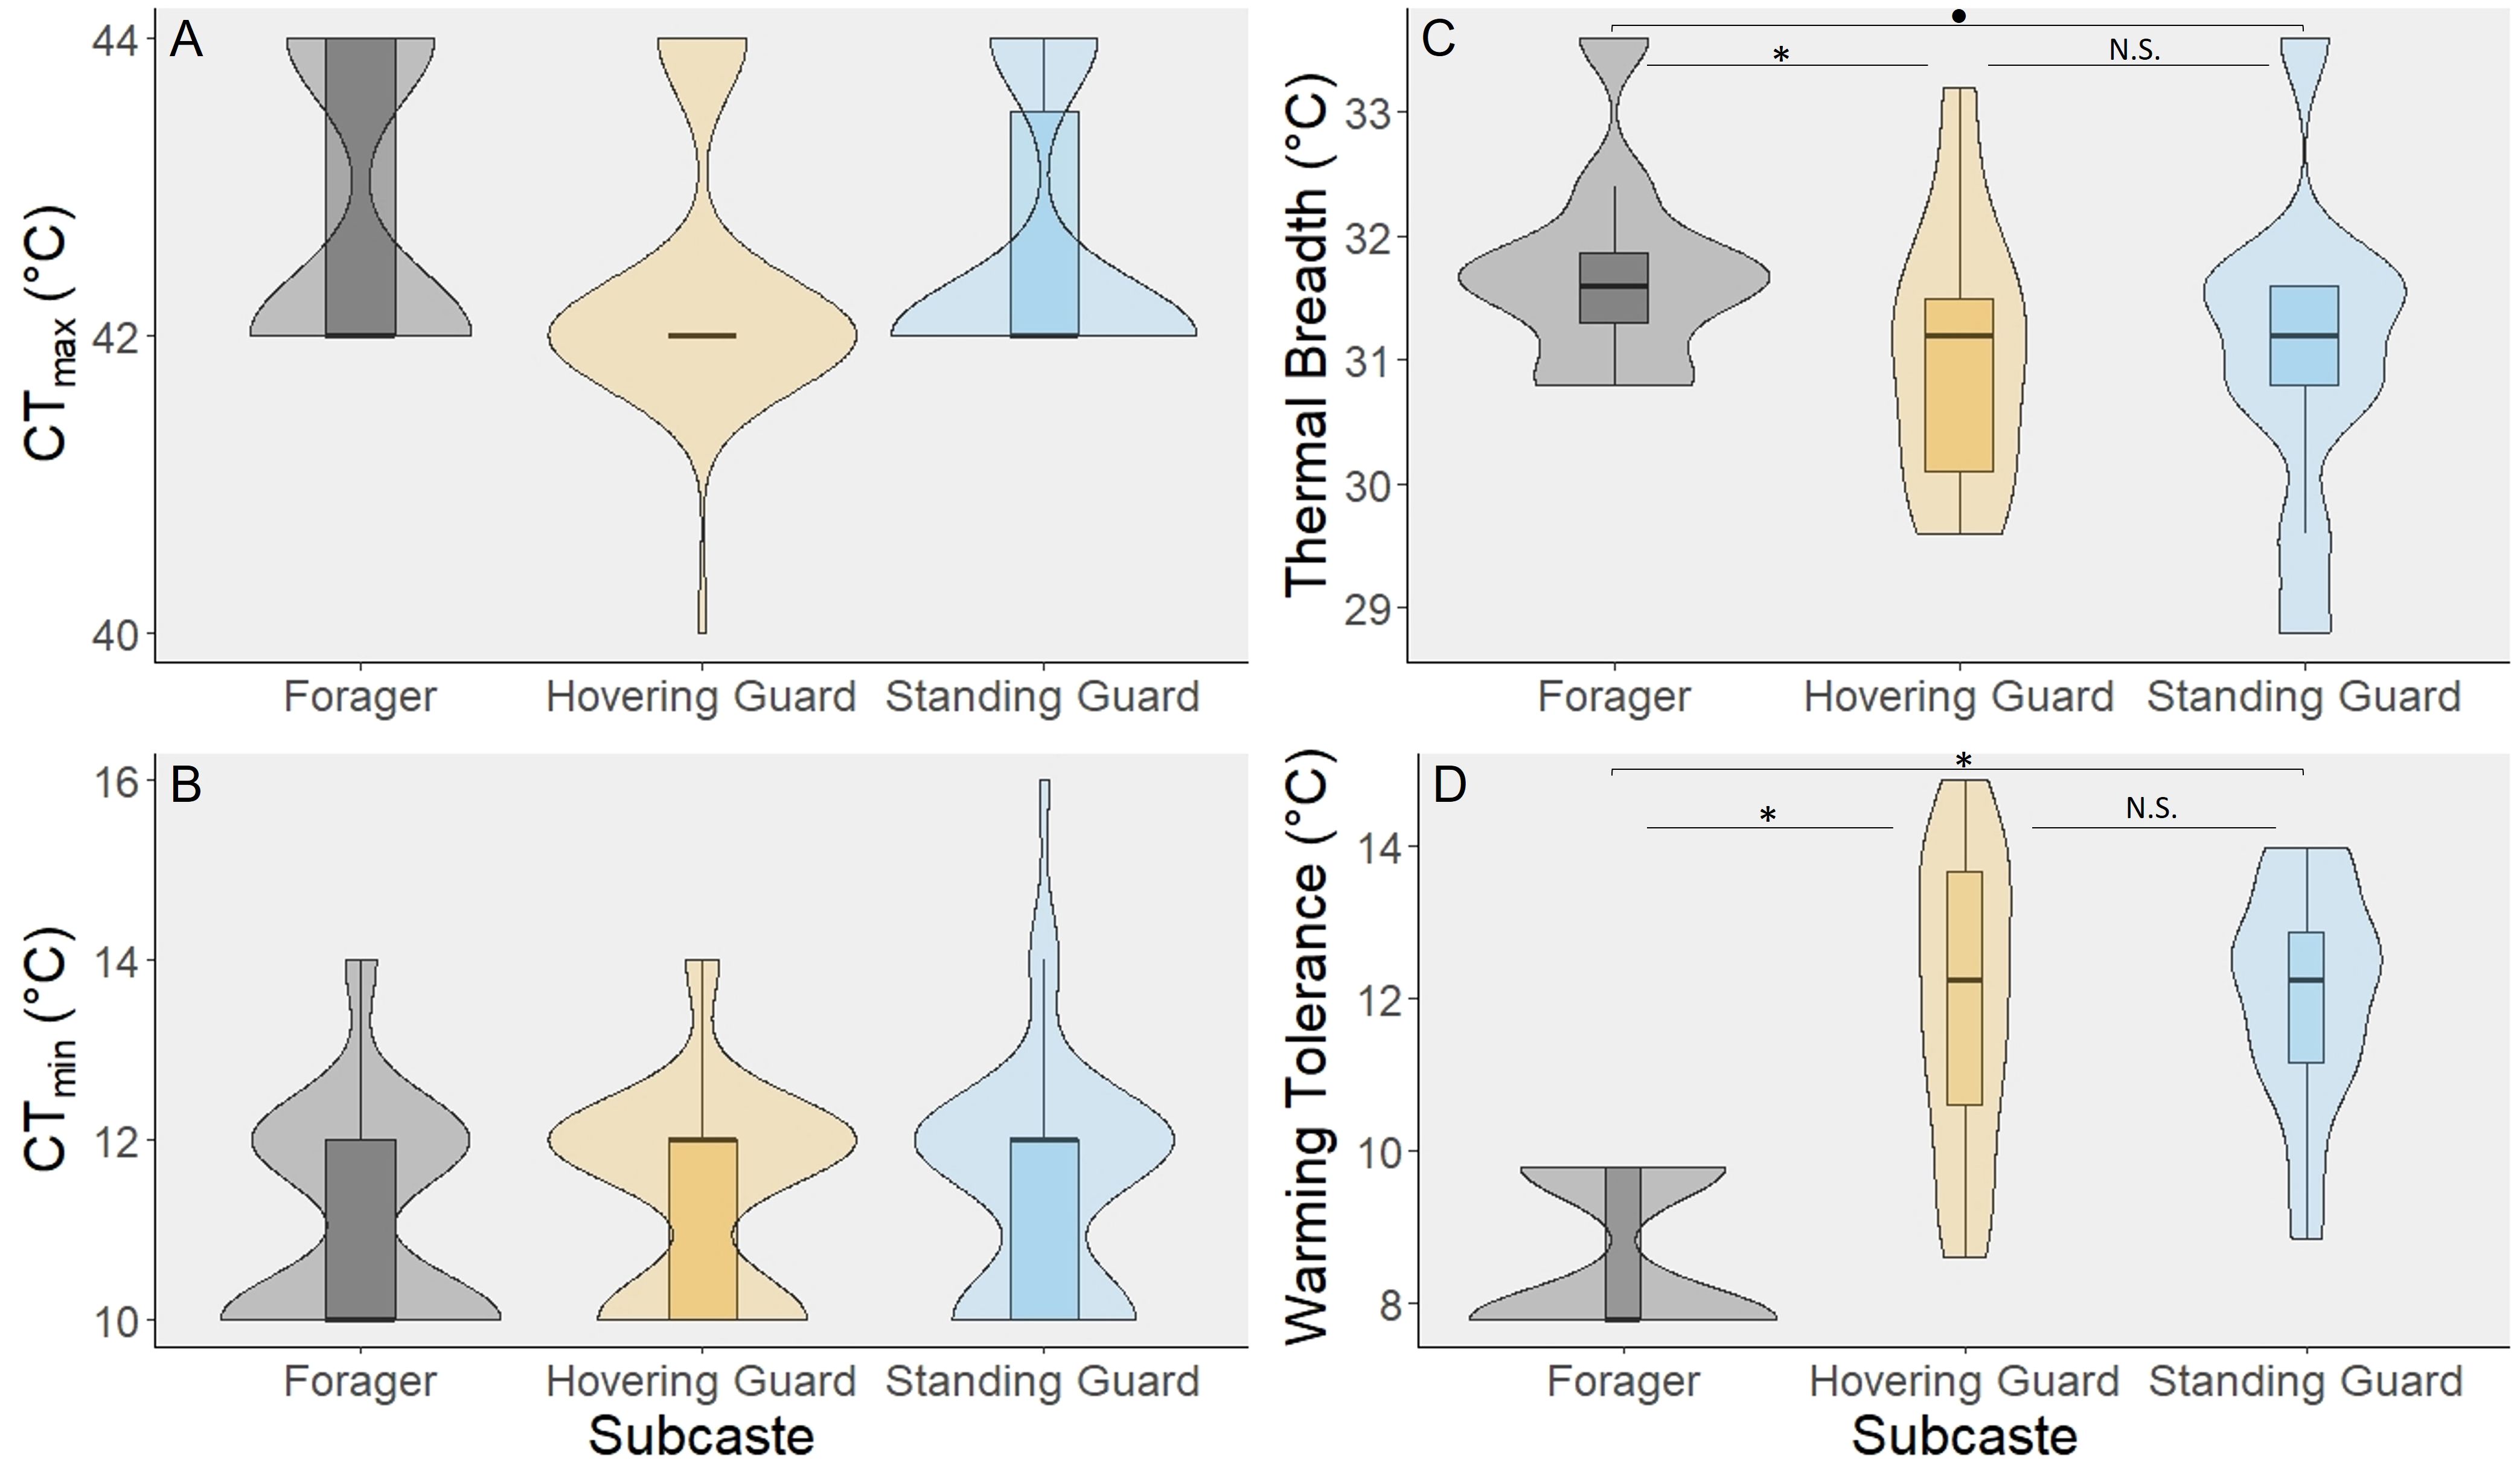
Figure 1 Tetragonisca angustula worker subcastes did not differ in critical thermal tolerance limits (A, B) but differ in thermal tolerance breadth and warming tolerance (C, D). Violin plots layered over each box plot represent the distribution of data as a shape. Results of post-hoc Tukey HSD tests are shown graphically as follows: *indicates p < 0.05, • indicates 0.05 < p < 0.10, and N.S. indicates p > 0.1. For both CTmax [(A), n=150] and CTmin [(B), n=151], the spread of the data is strongly hourglass-shaped and concentrated at every 2°C due to the ramping rate of the assay and how often the bees were checked for mobility loss. (C) Because thermal tolerance breadth shows the difference between CTmax and CTmin for each subcaste, the values for CTmax and CTmin were averaged for each subcaste for each colony (n = 30). (D) Warming tolerance (n=150) is calculated as the average daily high temperature subtracted from CTmax. This number represents how close an organism is regularly operating to their upper thermal limit.
When assessing thermal tolerance breadth, the difference between the upper and lower thermal tolerances, there was a significant difference among the subcastes (χ2 = 7.412, df = 2, p = 0.025; Figure 1C). The foragers exhibited a significantly larger thermal tolerance breadth compared to the hovering guards (Tukey HSD; p = 0.041) and a marginally significantly larger thermal tolerance breadth than standing guards (Tukey HSD; p = 0.058). On average, the foragers have a thermal tolerance breadth that is 0.67 ± 0.02°C larger than the guards.
Warming tolerance across subcaste
To assess how close each worker subcaste is operating to its upper thermal tolerance, warming tolerance was compared across subcastes and a significant difference was found (χ2 = 918.06, df = 2, p < 0.001; Figure 1D). Foragers had the smallest warming tolerance in comparison to the hovering guards (Tukey HSD; p < 0.001) and standing guards (Tukey HSD; p < 0.001). On average, the warming tolerance of the foragers was 3.38 ± 0.06°C lower than the guards. Body size was not included as a predictor of warming tolerance in this model because it was colinear with subcaste, and because dry mass did not have a significant effect on CTmax (Supplementary Figure S4).
Foraging versus nest site microclimates
Foraging sites had significantly more variable temperatures than the nesting sites (Levene’s Test: F1,190 = 10.317, p = 0.002; Figure 2). The median temperature of the foraging sites (29.22°C) was also significantly greater than the median temperature of the nesting sites (27.85°C) (Mann-Whitney U: W = 3507.5, p = 0.020; Figure 2). The median of the foraging sites was 1.37°C greater than the nesting sites.
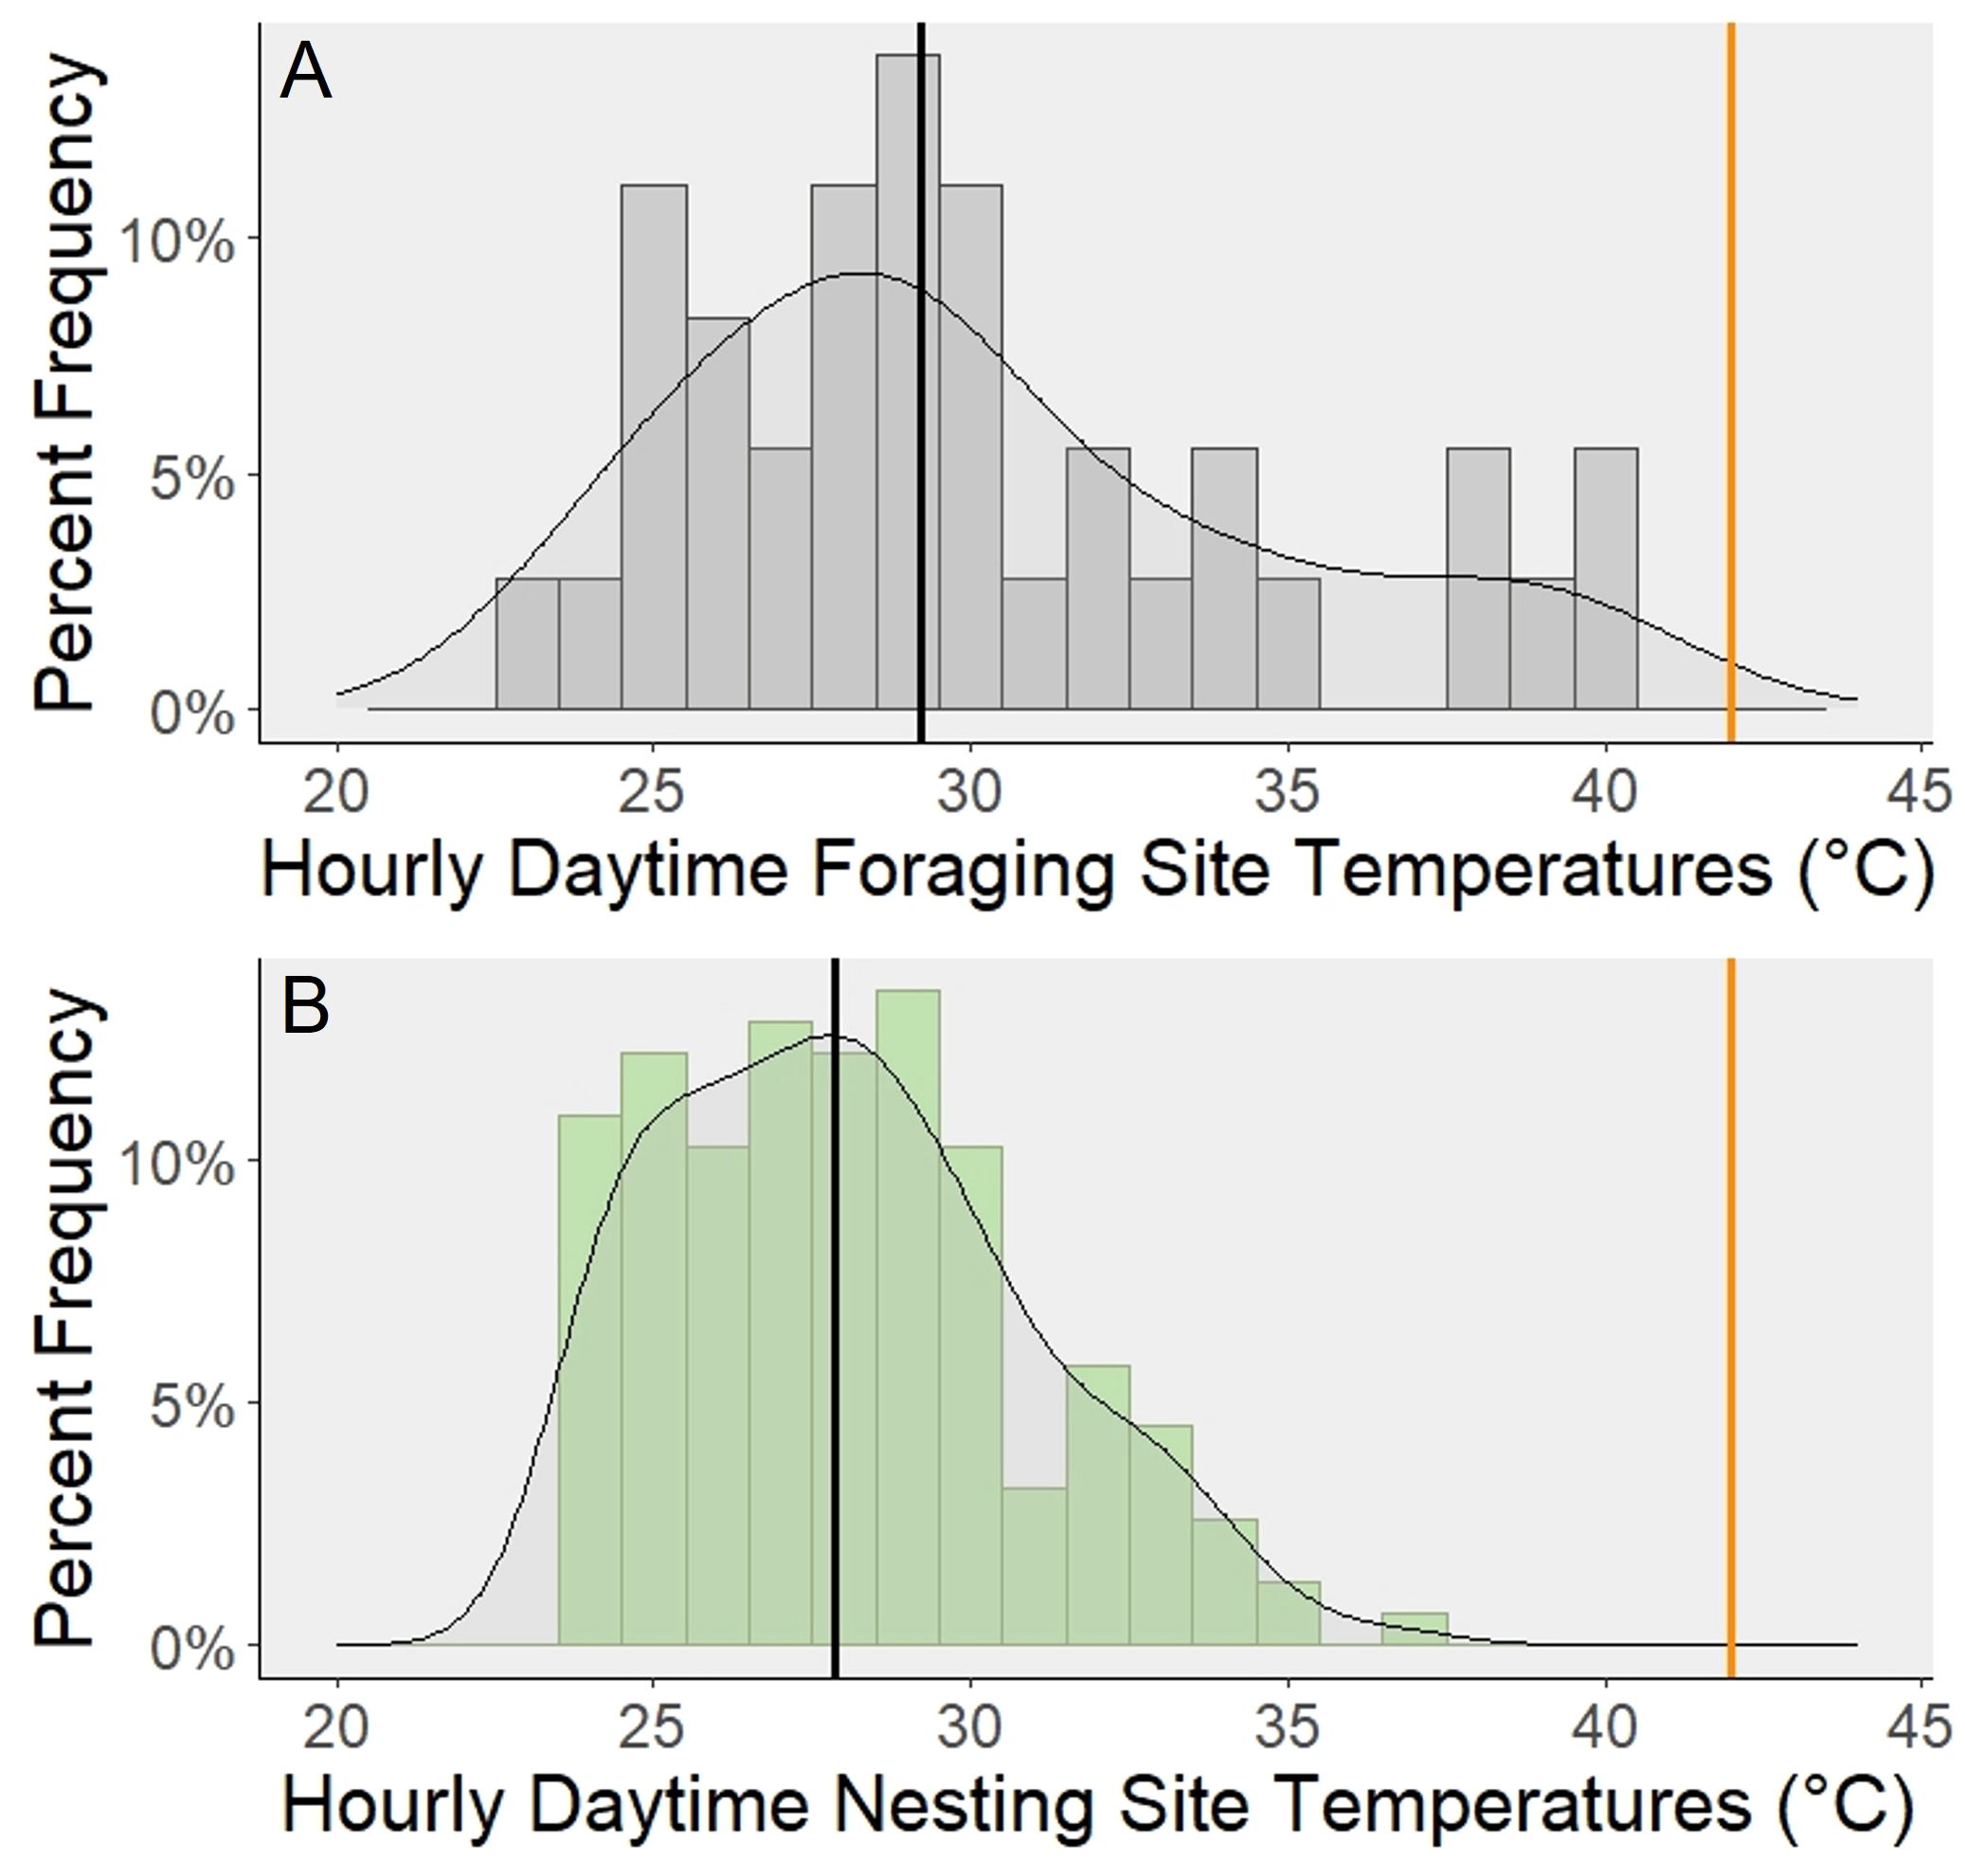
Figure 2 Comparison of daytime (0600 - 1800) temperatures between two microclimates experienced by different worker subcastes. These histograms show the percentage of temperatures that fall within each range of temperatures throughout the day. These daytime temperatures (0600 - 1800 were subset from one full day (0000 - 2359) recorded at each site. The curve fitted to each plot is a density curve. The bold vertical orange line on the righthand side represents the median upper thermal tolerance (CTmax) of all subcastes. The bold vertical black line represents the median temperature for each site type. (A) The daytime temperatures across 3 floral foraging sites are shown on the top panel. (B) The daytime temperatures across 13 nest sites are shown in the bottom panel.
Temperature and forager activity
The time at which all three foraging sites had foragers present was between 0900 to 1100 which ranged in hourly temperature across sites between 28.00 - 39.78°C with an overall average temperature of 32.92°C. For each foraging site, the respective range of times and temperatures at which there were foragers present was as follows 0900 to 1100: 28.00 - 29.40°C; 0700 to 1100: 26.36 - 34.39°C; 0700 to 1300: 26.52 - 40.42°C. Foraging site temperatures peaked between 1100 to 1200 with the sites ranging from 28.05 - 40.42°C with an overall average of 33.46°C (Figure 3A). The times when the foragers were most active at the nests was between 0800 and 1400 which ranged in temperature across sites from 24.26 - 36.75°C with an overall average temperature of 29.38°C, and the peak activity was between 1000 and 1200 when the temperature ranged between 26.63 - 36.75°C and averaged 30.56°C (Figure 3B). The peak temperature at the nest sites, while lower in magnitude than at the foraging sites, was still within the same time range from 1100 to 1200 with the sites ranging from 27.11 - 36.75°C and averaging 31.01°C.
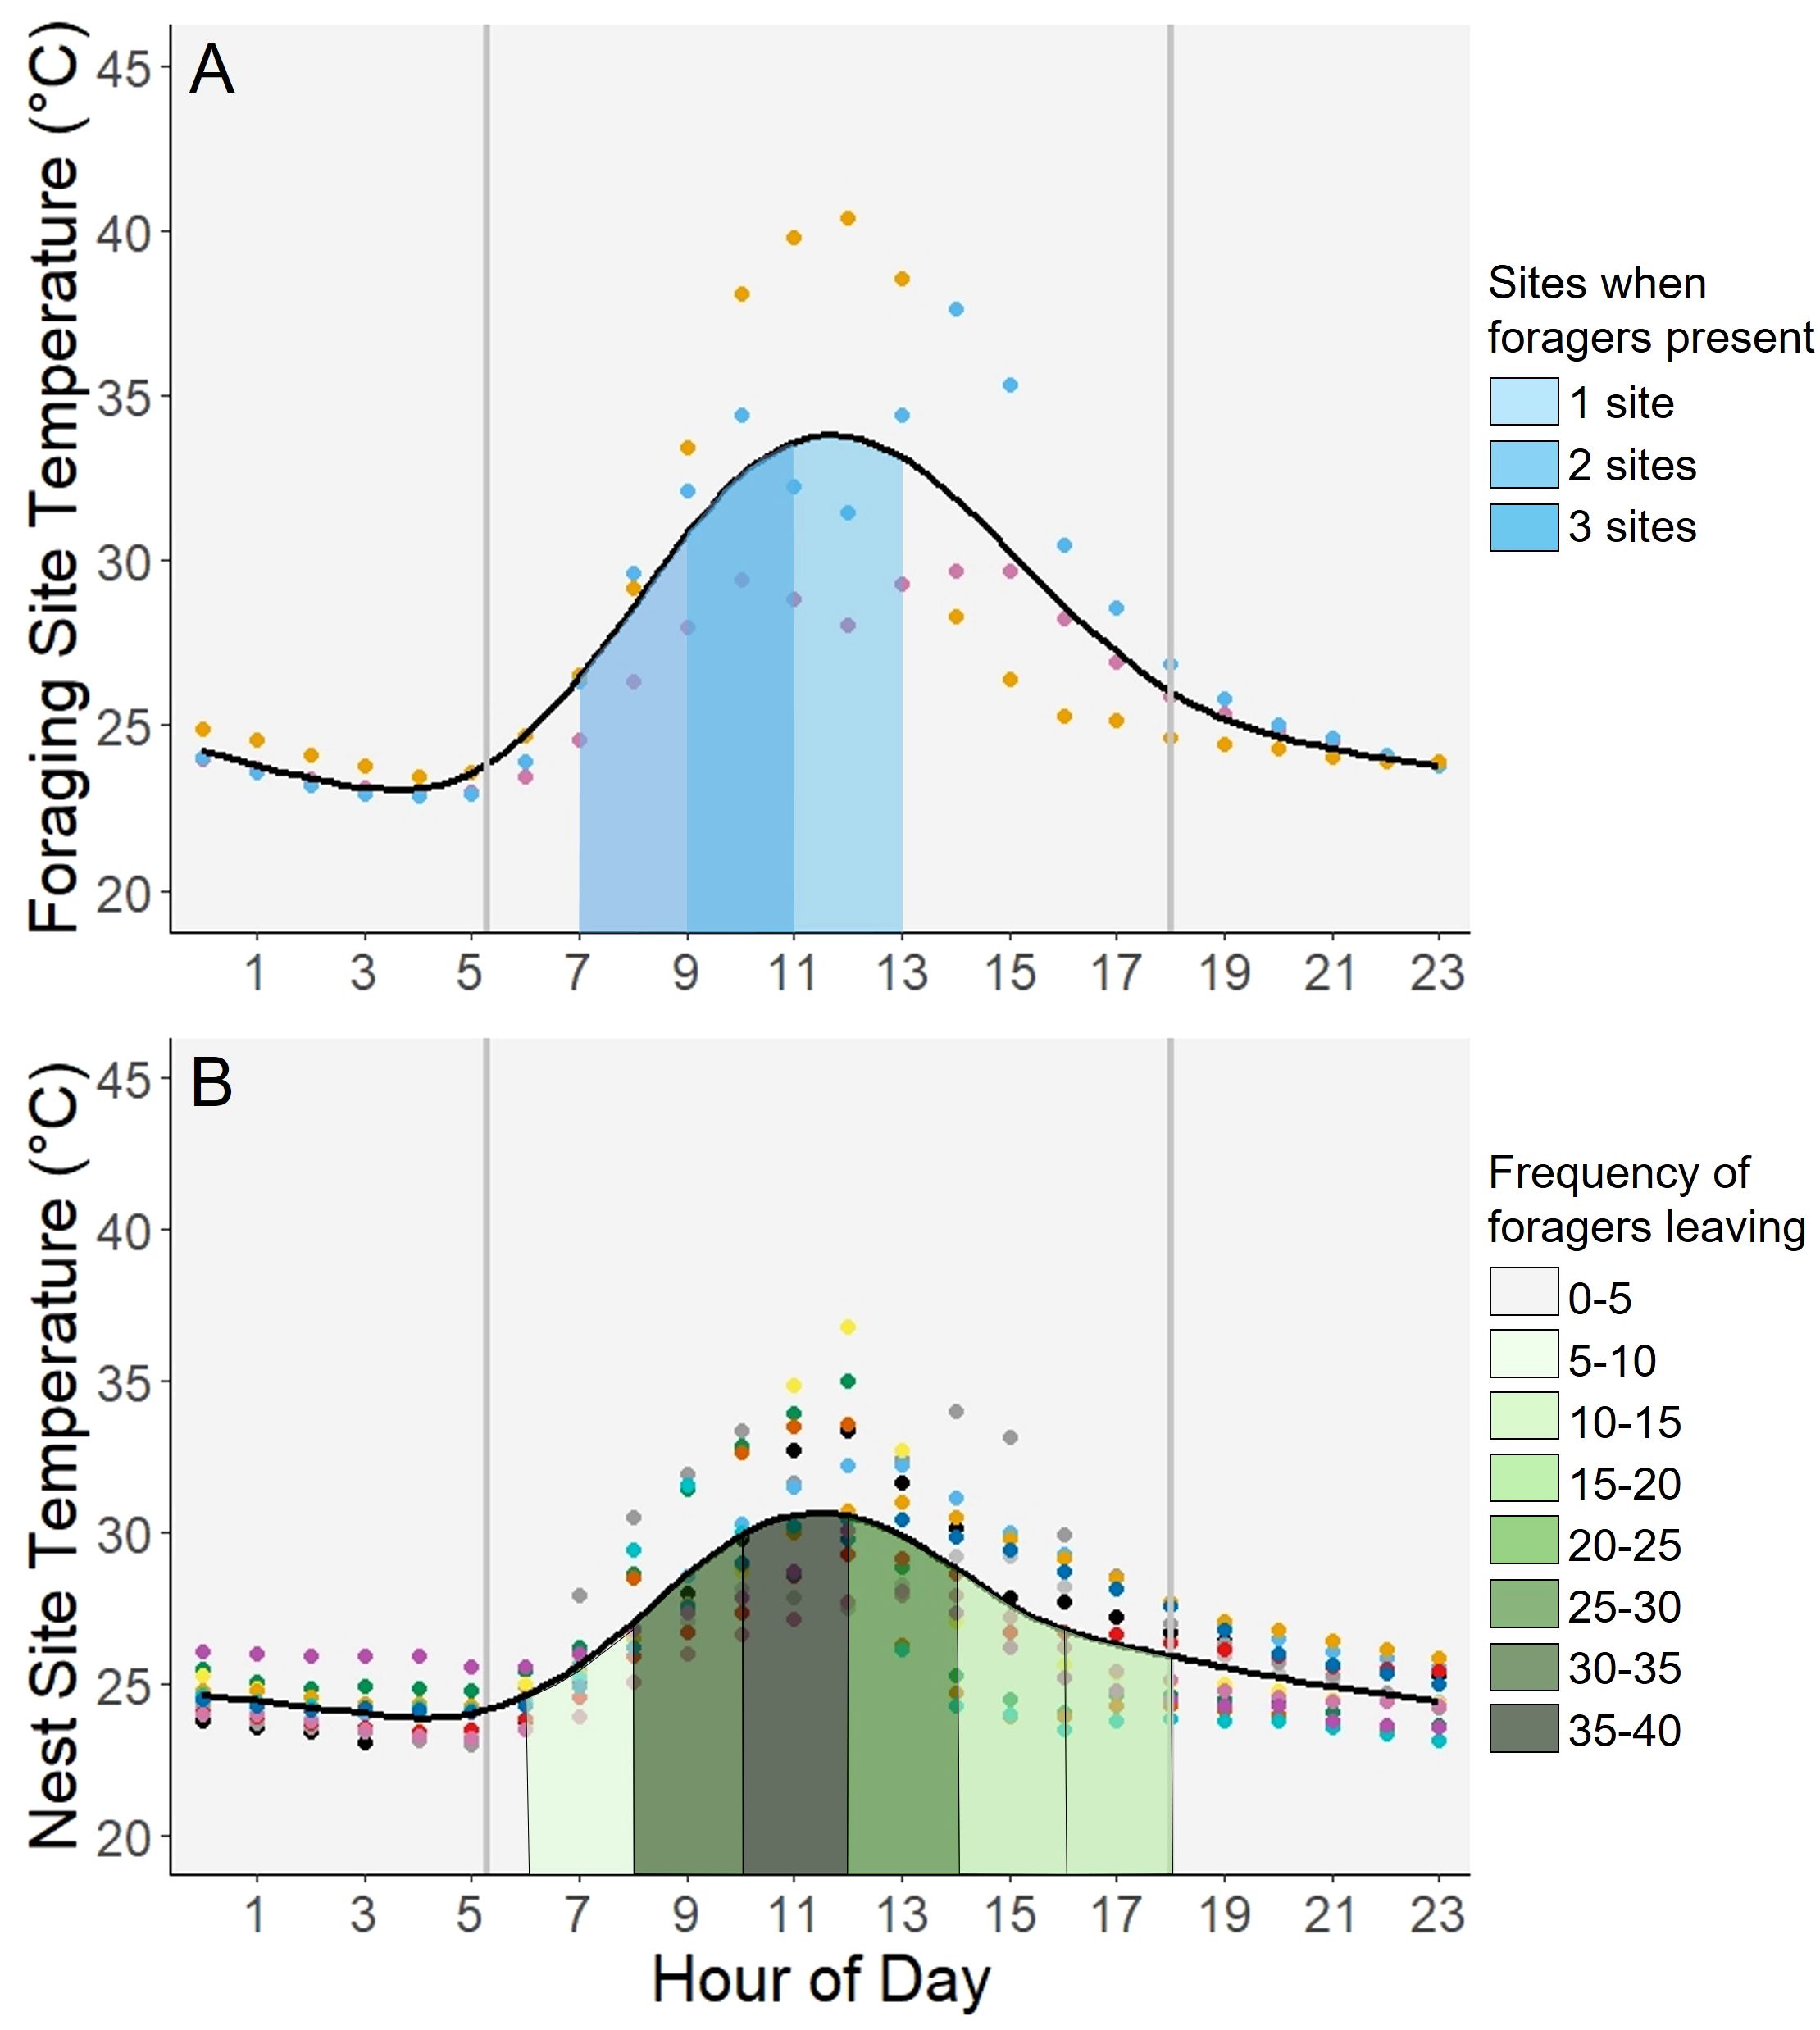
Figure 3 Comparison of presence at foraging sites and activity at nest sites. The above graphs show the change in temperature throughout the day at foraging sites (n=3) and nesting sites (n=13). Each color of dot corresponds to a specific foraging or nest site. The vertical gray lines represent sunrise and sunset. The curved line fit to the graphs was added using a Generalized Additive Model to produce a smoothed line representing the average. (A) Forager activity at the foraging sites was measured as presence or absence of T. angustula foragers. For each foraging site, the space under the curve was shaded when foragers were present. The overlap of these shaded portions, where the color is darkest, represents the time periods when all sites had active foragers. (B) The number of foragers leaving each nest per minute was averaged and binned so that darker shaded areas on the graph would indicate a higher average number of foragers leaving the nest. The temperature data was recorded from 13 nests. Activity data was recorded and averaged from 8 nests.
When comparing forager activity at the nest site to temperature intensity, the peak of temperature intensity was between 1200 and 1400 which ranged from 29.8 - 31.6°C with an average of 30.6°C (Figure 4A), while the peak of forager activity between 1000 and 1200 ranged in temperature from 26.8 - 30.6°C and averaged 28.53°C (Figure 4B).
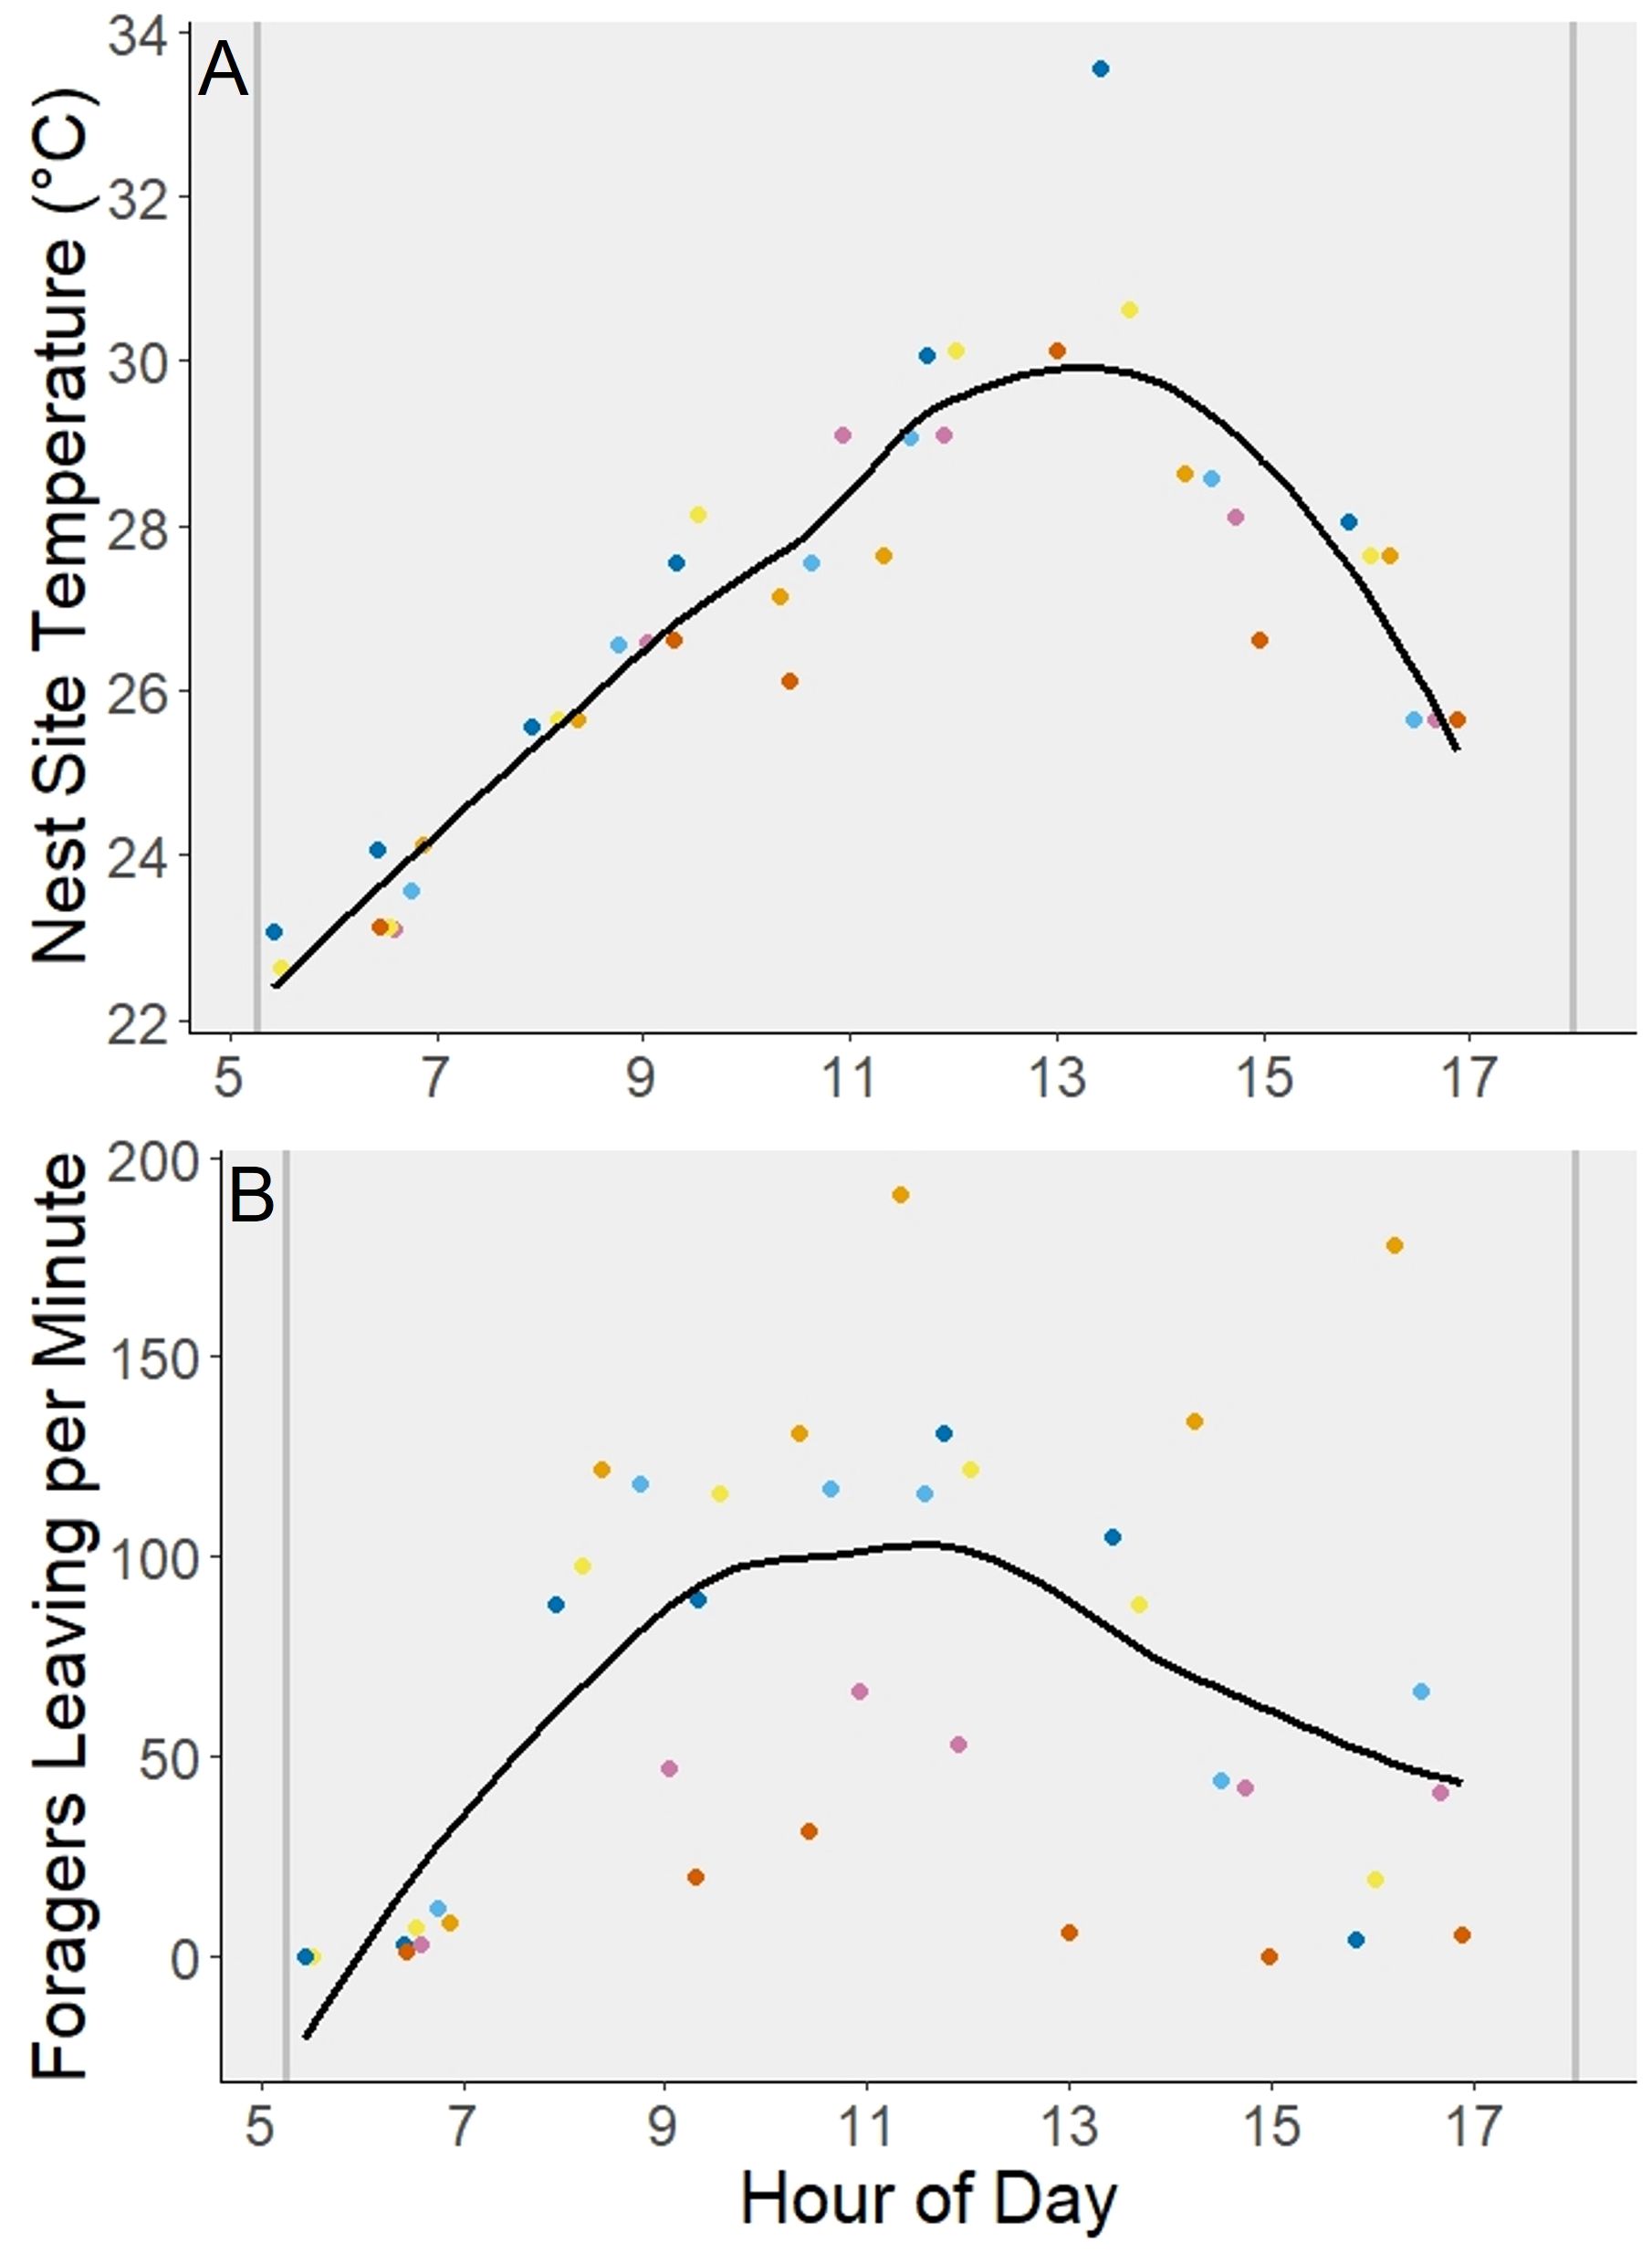
Figure 4 Comparison of daytime nest temperatures to forager activity data. Each color of dot corresponds to a specific nest site (n = 6). At each time point, the temperature (A) and the number of foragers leaving per minute (B) were recorded such that the data directly correspond. The vertical gray lines represent sunrise and sunset. The curved line fit to the graphs was added using the Locally Weighted Scatterplot Smoothing method to produce a smoothed line representing the average.
Discussion
Despite the differences in body size, age, and task group, no difference was found between the upper and lower tolerances among foragers, hovering guards, or standing guards. This does not follow the trend within colonies of tropical ants for larger-bodied workers to have higher heat tolerance and lower cold tolerance (Cerdá and Retana, 1997; Baudier et al., 2018; Roeder et al., 2021). Our results more closely follow the lack of relationship between intraspecific size variation and thermal tolerance in bumblebees (Maebe et al., 2021) and honeybees (Sánchez-Echeverría et al., 2019; Barreiro et al., 2024), and are in-line with cross-species comparisons of tropical stingless bees that found no relationship between body size and either upper or lower thermal tolerance (Gonzalez et al., 2022c). However, we report that foragers did have a larger thermal tolerance breadth than hovering guards or standing guards. Finding significant differences with thermal tolerance breadth but no difference when individually assessing CTmax and CTmin, suggests that the effect of body size on thermal tolerance may be small, only appearing when calculating the average breadth for each subcaste in each colony perhaps due to the resolution of our CTmax and CTmin assays being 2°C. We also found that foraging sites were more thermally variable during the day than nest sites. Although this effect of subcaste on thermal tolerance breadth was small, it supports the Climatic Variability Hypothesis at a microclimate scale within social insect colonies: workers that experience more variable microclimates while performing their tasks have a larger thermal tolerance breadth.
We found that foragers had significantly lower warming tolerances at foraging sites than the guards at their most common patrolling site just outside of nest entrances. This is consistent with previous studies reporting that stingless bee foragers experience greater thermal risk than any other workers (Perez and Aron, 2020; Maia-Silva et al., 2021). The warming tolerance values for the foragers are still well above zero which does not indicate an imminent risk of approaching upper thermal tolerance limits while performing daily tasks. However, with predicted global temperature increases (IPCC, 2022), foragers will likely be the subcaste most at risk. By the end of the 21st century, the average annual temperature in Costa Rica is predicted to increase by approximately 4°C (Hidalgo et al., 2013; Almazroui et al., 2021). However, this predicted increase is an estimated average value, meaning that the daily high temperatures experienced by the foragers during different times of the year could be well above that 4°C, especially because heatwaves are also increasing in intensity and frequency (Wu et al., 2023). Therefore, not only might the foragers reach their upper critical temperature in their functional environments sooner than predicted, but foragers likely experience sub-lethal thermal stress long before reaching their upper critical temperature.
For the thermal tolerance assays, we provided honey to reduce control mortality even though some studies suggest that providing sugar sources increases the thermal tolerance of individuals in some eusocial species (Macías-Macías et al., 2011; Bujan and Kaspari, 2017; Maia-Silva et al., 2021; but see: Oyen and Dillon, 2018; Gonzalez et al., 2022b). Aside from being a necessary step to reduce mortality in our assay, we believe that this methodology may mimic a more realistic scenario in which bees are able to seek out food and hydration to reduce the effects of extreme temperatures. Providing honey in these assays may result in overestimates of thermal tolerance (and, in turn, warming tolerance), however this still allows us to compare between worker subcastes within each colony. Additionally, the choice of ramping rate for this study was selected to be slow enough to detect intracolony differences and to mimic the rate of similar studies on bees while not being so slow to cause desiccation or starvation (Gonzalez et al., 2022b). Comparing thermal tolerance studies with different ramping rates and starting temperatures should be done with caution because a faster ramping rate has the potential to estimate a lower CTmin by 1.1 - 2.6°C and a higher CTmax by 5.3 - 6.9°C (Gonzalez et al., 2022b). Again, this may limit comparisons between this study and other studies but does not hinder our ability to compare subcastes within the colony.
The thermal stress experienced by foragers during peak temperatures at foraging sites may be driving other trends in forager activity. The foraging sites sampled, while few, showed forager activity to be shifted slightly earlier in the day when temperatures were less intense compared to the activity of the foragers leaving the nest (Figure 3). More specifically, when comparing the times of forager activity at the nest and temperature intensity, it also seems to indicate that the activity does not necessarily correspond and peak at the same time as the temperature (Figure 4). Activity at foraging sites peaked earlier in the day, with bees not as likely to return to foraging sites at similar temperatures in the afternoon. Based on these coupled time and temperature preferences, warming temperatures may cause foragers to continue shifting their times of activity to narrower windows of time earlier in the morning.
Future studies should be conducted investigating whether the driving factor of peak foraging activity is due to thermal preferences, flowering time, or interspecific dominance at the sites. This is often done by setting up forager bait traps on a gradient of thermal environments, however, attempts to attract T. angustula to honey bait traps at this site were previously unsuccessful (Breed et al., 1999). We only sampled three foraging sites in this study because although nests were dense, T. angustula foragers were sparsely observed across surveyed foraging sites. The lack of T. angustula at many surveyed foraging sites may be explained by foraging dominance of other bee species present at the dense patches of understory floral resources which are easier for researchers to find (Johnson and Hubbell, 1974; Nagamitsu and Inoue, 1997; Lichtenberg et al., 2011). Smaller bees, like T. angustula, are also known to more commonly forage on smaller, dispersed flowers (Johnson and Hubbell, 1974; Nagamitsu and Inoue, 1997; Lichtenberg et al., 2011). We were also not able to survey upper canopy foraging sites which, according to some studies in the Brazilian Atlantic forests, T. angustula more frequently visits than the understory (Ramalho, 2004; Bastos et al., 2020). However, research would need to be conducted to be certain about whether T. angustula also forages more often in the upper canopy in Costa Rica because this type of behavior could be dependent on seasonal resource availability and community composition affecting foraging dominance. If T. angustula foragers were more prevalent in the upper canopy than the understory at the site of this study, we would be underestimating the thermal risk experienced by the foragers because the canopy is warmer on average than the understory (Bujan et al., 2016).
Lastly, we acknowledge the limitations of some of the microclimate data recorded by the iButtons as we were limited in the number of days sampled at each site. However, this tropical region does not experience major climate fluctuations beyond the transition of the dry to the rainy season. This research occurred during the rainy season, so the microclimate data is more representative of that season. During the rainy season, the activity of bees can fluctuate more based on the amount of precipitation because they avoid flying when there is heavy rain. Because of this, sampling of activity and temperature data was restricted to days of regular activity with less precipitation. Also, the nest temperatures reported in this study recorded via iButton were used for both guard subcastes, however, it is worth noting that standing guards may also experience slight differences in their thermal environment from hovering guards due to conduction with the directly contacted resinous nest tube entrance. Similarly, the foragers experience temperatures that are warmer than ambient air when they make contact with superheated boundary layers of plants in sun patches (Kaspari et al., 2015).
The results of this study suggest that the predominantly small-bodied foragers of T. angustula are more physiologically adapted than soldiers to life in variable environments. However, while foraging, foragers also operate closer to their physiological limits. As such, it is likely that increasing environmental temperatures will affect the foragers before affecting the other worker subcastes that also spend time outside of the nest. We also report that foragers show signs of behavioral thermoregulation to buffer extreme thermal conditions by selecting amenable times of day to search for resources (Figures 3, 4). Foragers may also reduce how far they travel to forage when experiencing hotter temperatures, as shown in other stingless bee species (Souza-Junior et al., 2020). It is likely that many ectothermic animals will need to resort to behavioral adaptations in response to climate change rather than physiological adaptations because temperatures are changing faster than an organism could evolutionarily adapt (Sunday et al., 2014; Wong and Candolin, 2015). Among social insects, nest site selection is an important first step for passive nest thermoregulation (Jones and Oldroyd, 2006; Perez and Aron, 2020), but, in the case of rapidly changing temperatures, stingless bees are not capable of easily moving their nests nor can they move them great distances (Cronin et al., 2013). Therefore, most of the behavioral mitigation of thermal stress will likely come from changes in thermoregulatory behaviors.
Behavioral adaptations to mitigate thermal stress in anthropogenically warmed climates can reduce pollination efficiency which is of both conservation and agricultural concern (Wong and Candolin, 2015). Foragers shifting the times that they forage may also affect which flowers receive the most pollination which could affect composition of plant communities in the long-term (Scaven and Rafferty, 2013; Descamps et al., 2021). Here we used physiological data to assess which essential task was the most thermally limited, then focused in-depth on thermally relevant behaviors of that task group. We estimated the average tolerable window of foragers to be from 11.06°C to 42.80°C based on thermal tolerance data, however, behavioral data at foraging sites indicated a narrower preferred foraging range of 28.00°C to 39.78°C, with a bias towards foraging at these temperatures in the morning. The upper range of preferred foraging temperatures is much closer to the average forager’s CTmax than suggested by the warming tolerances. Were behavioral data to be excluded from this study, the result would be an underestimate of future sub-lethal effects of climate change. In this respect, when studying climate-change effects on populations, especially in social species, behavioral data should be interpreted together with physiological and microclimate data. Research lacking this information could inaccurately estimate species’ responses to change.
Data availability statement
The datasets presented in this study can be found in Dryad online digital repository: https://doi.org/10.5061/dryad.0k6djhb7s. Printable 3D designs of the iButton housings used in this study are available via Zenodo: https://doi.org/10.5281/zenodo.10850673. Additional figures and analyses can be found in the Supplementary Material.
Ethics statement
No ethical approval was required to conduct this study as research on insects is not currently subject to IACUC ethical regulations. An effort was made to reduce the number of individuals by only collecting non-reproductive bees from 10 colonies. While a power analysis would be ideal to determine the minimum number of individuals needed, current power analyses available are not well suited to accounting for the replication of social insects at both the individual and the colony level simultaneously. We could not anesthetize individuals before undergoing thermal tolerance assays because common anesthetic methods would have affected the results. The fast ramping rate reduced time spent in the assay as well as minimized the potential of other stressors such as starvation, which providing honey also helped to mitigate. All individuals were euthanized in the freezer as stated in the methods because that was the most feasible method of euthanasia at our field site. While the status of freezing as a humane method to kill insects is currently being debated (Fischer et al., 2023), these bees, aside from the controls, were already dead or close to dying by the end of these assays before being placed in the freezer. The preliminary thermal tolerance assays resulted in the deaths of 71 bees evenly distributed across 6 colonies before our methods were refined to improve transport methods and prevent starvation. Subsequent testing to refine the methodology resulted in 21 deaths. All bees that survived during preliminary tests were released back to their colonies. Approximately half of the bees that died during this study, were also used for an unrelated project that required dead bees to dissect which minimized the number of deaths for that project. We recommend that future studies run an initial small-scale test to ensure the survival of the controls and verify the methods. Even if a species has previously undergone similar assays, as was the case with T. angustula, different populations may exhibit differences in their sensitivity.
Author contributions
KR: Conceptualization, Data curation, Formal analysis, Investigation, Methodology, Visualization, Writing – original draft, Writing – review & editing. KB: Conceptualization, Funding acquisition, Methodology, Supervision, Writing – review & editing.
Funding
The author(s) declare financial support was received for the research, authorship, and/or publication of this article. Funding for this work was provided by the University of Southern Mississippi to KB, and additional travel funding was provided to KR by the International Union for the Study of Social Insects North American Section via the Charles Michener Bee Research Grant.
Acknowledgments
We thank the staff at La Selva Research Station and the Organization for Tropical Studies for access to the forests in which this study was conducted. We thank Enrique Castro, Orlando Vargas, Danilo Brenes, Benjamin Sadd, and Karen Robles López for permit assistance, onsite field support, and useful discussion that led to the improvement of this manuscript. We thank the University of Southern Mississippi Eagle Maker Hub for assisting with the design and printing of the iButton housings. Research was conducted with permission from the Costa Rican government (SINAC), permit numbers ACC-PI-re-62-2022 and ACC-PI-LC-169-2023.
Conflict of interest
The authors declare that the research was conducted in the absence of any commercial or financial relationships that could be construed as a potential conflict of interest.
Publisher’s note
All claims expressed in this article are solely those of the authors and do not necessarily represent those of their affiliated organizations, or those of the publisher, the editors and the reviewers. Any product that may be evaluated in this article, or claim that may be made by its manufacturer, is not guaranteed or endorsed by the publisher.
Supplementary material
The Supplementary Material for this article can be found online at: https://www.frontiersin.org/articles/10.3389/fevo.2024.1405459/full#supplementary-material
References
Abbot P. (2022). Defense in social insects: Diversity, division of labor, and evolution. Annu. Rev. Entomol. 67, 407–436. doi: 10.1146/annurev-ento-082521-072638
Addo-Bediako A., Chown S. L., Gaston K. J. (2000). Thermal tolerance, climatic variability and latitude. Proc. R. Soc Lond. B 267, 739–745. doi: 10.1098/rspb.2000.1065
Almazroui M., Islam M. N., Saeed F., Saeed S., Ismail M., Ehsan M. A., et al. (2021). Projected changes in temperature and precipitation over the United States, Central America, and the Caribbean in CMIP6 GCMs. Earth Syst. Environ. 5, 1–24. doi: 10.1007/s41748-021-00199-5
Barreiro J. B., Ratoni B., Baena-Díaz F., González-Tokman D., Dáttilo W. (2024). Thermal tolerance of honeybees (Apis mellifera L.) changes across an elevation gradient in the Mexican transition zone. Sociobiology 71, e10155–e10155. doi: 10.13102/sociobiology.v71i1.10155
Bastos B. P., Lima L. C. L., Da Costa Dórea M. (2020). Pollen sources used by Tetragonisca angustula (Latreille 1811) (Apidae, meliponini) in the atlantic forest, Northern Coast of Bahia. Sociobiology 67, 535–544. doi: 10.13102/sociobiology.v67i4.5596
Baudier K. M., D’Amelio C. L., Malhotra R., O’Connor M. P., O’Donnell S. (2018). Extreme insolation: Climatic variation shapes the evolution of thermal tolerance at multiple scales. Am. Nat. 192, 347–359. doi: 10.1086/698656
Baudier K. M., O’Donnell S. (2016). Structure and thermal biology of subterranean army ant bivouacs in tropical montane forests. Insect. Soc 63, 467–476. doi: 10.1007/s00040-016-0490-2
Baudier K. M., O’Donnell S. (2017). Weak links: How colonies counter the social costs of individual variation in thermal physiology. Curr. Opin. Insect Sci. 22, 85–91. doi: 10.1016/j.cois.2017.06.004
Baudier K. M., Ostwald M. M., Grüter C., Segers F. H. I. D., Roubik D. W., Pavlic T. P., et al. (2019). Changing of the guard: mixed specialization and flexibility in nest defense (Tetragonisca angustula). Behav. Ecol. 30, 1041–1049. doi: 10.1093/beheco/arz047
Baudier K. M., Ostwald M. M., Haney B. R., Calixto J. M., Cossio F. J., Fewell J. H. (2022). Social factors in heat survival: Multiqueen desert ant colonies have higher and more uniform heat tolerance. Physiol. Biochem. Zoology 95, 379–389. doi: 10.1086/721251
Bishop T. R., Robertson M. P., Van Rensburg B. J., Parr C. L. (2017). Coping with the cold: minimum temperatures and thermal tolerances dominate the ecology of mountain ants. Ecol. Entomology 42, 105–114. doi: 10.1111/een.12364
Bowden R. M., Garry M. F., Breed M. D. (1994). Discrimination of con- and heterospecific bees by trigona (Tetragonisca) angustula guards. J. Kansas Entomological Soc. 67, 137–139. Available at: http://www.jstor.org/stable/25085499.
Bowler K., Terblanche J. S. (2008). Insect thermal tolerance: what is the role of ontogeny, ageing and senescence? Biol. Rev. 83, 339–355. doi: 10.1111/j.1469-185X.2008.00046.x
Breed M. D., McGlynn T. P., Sanctuary M. D., Stocker E. M., Cruz R. (1999). Distribution and abundance of colonies of selected meliponine species in a Costa Rican tropical wet forest. J. Trop. Ecol. 15, 765–777. doi: 10.1017/S0266467499001169
Bujan J., Kaspari M. (2017). Nutrition modifies critical thermal maximum of a dominant canopy ant. J. Insect Physiol. 102, 1–6. doi: 10.1016/j.jinsphys.2017.08.007
Bujan J., Yanoviak S. P., Kaspari M. (2016). Desiccation resistance in tropical insects: causes and mechanisms underlying variability in a Panama ant community. Ecol. Evol. 6, 6282–6291. doi: 10.1002/ece3.2355
Burdine J. D., McCluney K. E. (2019). Differential sensitivity of bees to urbanization-driven changes in body temperature and water content. Sci. Rep. 9 1643. doi: 10.1038/s41598-018-38338-0
Cerdá X., Retana J. (1997). Links between worker polymorphism and thermal biology in a thermophilic ant species. Oikos 78, 467–474. doi: 10.2307/3545608
Clusella-Trullas S., Blackburn T. M., Chown S. L. (2011). Climatic predictors of temperature performance curve parameters in ectotherms imply complex responses to climate change. Am. Nat. 177, 738–751. doi: 10.1086/660021
Cronin A. L., Molet M., Doums C., Monnin T., Peeters C. (2013). Recurrent evolution of dependent colony foundation across eusocial insects. Annu. Rev. Entomol. 58, 37–55. doi: 10.1146/annurev-ento-120811-153643
da Silva C. R. B., Beaman J. E., Dorey J. B., Barker S. J., Congedi N. C., Elmer M. C., et al. (2021). Climate change and invasive species: A physiological performance comparison of invasive and endemic bees in Fiji. J. Exp. Biol. 224, jeb230326. doi: 10.1242/jeb.230326
da Silva M. A., Ferreira N., da S., da Silva Teixeira-Souza V. H., Maia-Silva C., de Assis de Oliveira F., et al. (2017). On the thermal limits for the use of stingless bees as pollinators in commercial greenhouses. Journal of Apicultural Research 56, 81–90. doi: 10.1080/00218839.2016.1260380
Descamps C., Jambrek A., Quinet M., Jacquemart A.-L. (2021). Warm temperatures reduce flower attractiveness and bumblebee foraging. Insects 12, 493. doi: 10.3390/insects12060493
Deutsch C. A., Tewksbury J. J., Huey R. B., Sheldon K. S., Ghalambor C. K., Haak D. C., et al. (2008). Impacts of climate warming on terrestrial ectotherms across latitude. Proc. Natl. Acad. Sci. U.S.A. 105, 6668–6672. doi: 10.1073/pnas.0709472105
Diamond S. E., Sorger D. M., Hulcr J., Pelini S. L., Toro I. D., Hirsch C., et al. (2012). Who likes it hot? A global analysis of the climatic, ecological, and evolutionary determinants of warming tolerance in ants. Glob Change Biol. 18, 448–456. doi: 10.1111/j.1365-2486.2011.02542.x
Elizalde L., Arbetman M., Arnan X., Eggleton P., Leal I. R., Lescano M. N., et al. (2020). The ecosystem services provided by social insects: traits, management tools and knowledge gaps. Biol. Rev. 95, 1418–1441. doi: 10.1111/brv.12616
Fischer B., Barrett M., Adcock S., Barron A., Browning H., Chittka L., et al. (2023). Guidelines for Protecting and Promoting Insect Welfare in Research. Insect Welfare Research Society. doi: 10.13140/RG.2.2.19325.64484
Friedman D. A., Greene M. J., Gordon D. M. (2019). The physiology of forager hydration and variation among harvester ant (Pogonomyrmex barbatus) colonies in collective foraging behavior. Sci. Rep. 9, 5126. doi: 10.1038/s41598-019-41586-3
Gaston K. J., Chown S. L., Calosi P., Bernardo J., Bilton D. T., Clarke A., et al. (2009). Macrophysiology: A conceptual reunification. Am. Nat. 174, 595–612. doi: 10.1086/605982
Gibbs A. G., Fukuzato F., Matzkin L. M. (2003). Evolution of water conservation mechanisms in Drosophila. J. Exp. Biol. 206, 1183–1192. doi: 10.1242/jeb.00233
Gonzalez V. H., Cobos M. E., Jaramillo J., Ospina R. (2021). Climate change will reduce the potential distribution ranges of Colombia’s most valuable pollinators. Perspect. Ecol. Conserv. 19, 195–206. doi: 10.1016/j.pecon.2021.02.010
Gonzalez V. H., Oyen K., Aguilar M. L., Herrera A., Martin R. D., Ospina R. (2022a). High thermal tolerance in high-elevation species and laboratory-reared colonies of tropical bumble bees. Ecol. Evol. 12, e9560. doi: 10.1002/ece3.9560
Gonzalez V. H., Oyen K., Ávila O., Ospina R. (2022b). Thermal limits of Africanized honey bees are influenced by temperature ramping rate but not by other experimental conditions. J. Thermal Biol. 110, 103369. doi: 10.1016/j.jtherbio.2022.103369
Gonzalez V. H., Oyen K., Vitale N., Ospina R. (2022c). Neotropical stingless bees display a strong response in cold tolerance with changes in elevation. Conserv. Physiol. 10, coac073. doi: 10.1093/conphys/coac073
Grüter C., Kärcher M., Ratnieks F. L. W. (2011). The natural history of nest defence in a stingless bee, Tetragonisca angustula (Latreille) (Hymenoptera: Apidae), with two distinct types of entrance guards. Neotropical Entomology 40, 55–61. doi: 10.1590/S1519-566X2011000100008
Grüter C., Menezes C., Imperatriz-Fonseca V. L., Ratnieks F. L. W. (2012). A morphologically specialized soldier caste improves colony defense in a neotropical eusocial bee. Proc. Natl. Acad. Sci. U.S.A. 109, 1182–1186. doi: 10.1073/pnas.1113398109
Grüter C., Segers F. H. I. D., Menezes C., Vollet-Neto A., Falcón T., von Zuben L., et al. (2017). Repeated evolution of soldier sub-castes suggests parasitism drives social complexity in stingless bees. Nat. Commun. 8, 1–7. doi: 10.1038/s41467-016-0012-y
Hagen M., Dupont Y. L. (2013). Inter-tegular span and head width as estimators of fresh and dry body mass in bumblebees (Bombus spp.). Insect. Soc 60, 251–257. doi: 10.1007/s00040-013-0290-x
Hamblin A. L., Youngsteadt E., López-Uribe M. M., Frank S. D. (2017). Physiological thermal limits predict differential responses of bees to urban heat-island effects. Biol. Lett. 13, 20170125. doi: 10.1098/rsbl.2017.0125
Hidalgo H. G., Amador J. A., Alfaro E. J., Quesada B. (2013). Hydrological climate change projections for Central America. J. Hydrology 495, 94–112. doi: 10.1016/j.jhydrol.2013.05.004
Hrncir M., Jarau S., Barth F. G. (2016). Stingless bees (Meliponini): senses and behavior. J. Comp. Physiol. A 202, 597–601. doi: 10.1007/s00359-016-1117-9
Hrncir M., Maia-Silva C., Teixeira-Souza V. H., da S., Imperatriz-Fonseca V. (2019). Stingless bees and their adaptations to extreme environments. J. Comp. Physiol. A 205, 415–426. doi: 10.1007/s00359-019-01327-3
IPCC. (2022). Climate change 2022: Impacts, Adaptation and Vulnerability. Contribution of Working Group II to the Sixth Assessment Report of the Intergovernmental Panel on Climate Change. (New York, USA: Cambridge University Press). doi: 10.1017/9781009325844
Jaffé R., Pope N., Carvalho A. T., Maia U. M., Blochtein B., Carvalho C. A. L., et al. (2015). Bees for development: Brazilian survey reveals how to optimize stingless beekeeping. PLoS One 10, e0121157. doi: 10.1371/journal.pone.0121157
Janzen D. H. (1967). Why mountain passes are higher in the tropics. Am. Nat. 101, 233–249. doi: 10.1086/282487
Johnson L. K., Hubbell S. P. (1974). Aggression and competition among stingless bees: Field studies. Ecology 55, 120–127. doi: 10.2307/1934624
Johnson B. R., Linksvayer T. A. (2010). Deconstructing the superorganism: Social physiology, groundplans, and sociogenomics. Q. Rev. Biol. 85, 57–79. doi: 10.1086/650290
Jones J. C., Oldroyd B. P. (2006). Nest thermoregulation in social insects. Adv. Insect Physiol. 33, 153–191. doi: 10.1016/S0065-2806(06)33003-2
Kärcher M. H., Ratnieks F. L. W. (2009). Standing and hovering guards of the stingless bee Tetragonisca angustula complement each other in entrance guarding and intruder recognition. J. Apicultural Res. 48, 209–214. doi: 10.3896/IBRA.1.48.3.10
Kaspari M., Clay N. A., Lucas J., Yanoviak S. P., Kay A. (2015). Thermal adaptation generates a diversity of thermal limits in a rainforest ant community. Global Change Biol. 21, 1092–1102. doi: 10.1111/gcb.12750
Kingsolver J. G., Buckley L. B. (2020). Ontogenetic variation in thermal sensitivity shapes insect ecological responses to climate change. Curr. Opin. Insect Sci. 41, 17–24. doi: 10.1016/j.cois.2020.05.005
Kovac H., Käfer H., Stabentheiner A., Costa C. (2014). Metabolism and upper thermal limits of Apis mellifera carnica and A. m. ligustica. Apidologie 45, 664–677. doi: 10.1007/s13592-014-0284-3
Lichtenberg E. M., Hrncir M., Turatti I. C., Nieh J. C. (2011). Olfactory eavesdropping between two competing stingless bee species. Behav. Ecol. Sociobiol 65, 763–774. doi: 10.1007/s00265-010-1080-3
Lutterschmidt W. I., Hutchison V. H. (1997). The critical thermal maximum: data to support the onset of spasms as the definitive end point. Can. J. Zool. 75, 1553–1560. doi: 10.1139/z97-782
Macías-Macías J. O., Quezada-Euán J. J. G., Contreras-Escareño F., Tapia-Gonzalez J. M., Moo-Valle H., Ayala R. (2011). Comparative temperature tolerance in stingless bee species from tropical highlands and lowlands of Mexico and implications for their conservation (Hymenoptera: Apidae: Meliponini). Apidologie 42, 679–689. doi: 10.1007/s13592-011-0074-0
Maebe K., De Baets A., Vandamme P., Vereecken N. J., Michez D., Smagghe G. (2021). Impact of intraspecific variation on measurements of thermal tolerance in bumble bees. J. Thermal Biol. 99, 103002. doi: 10.1016/j.jtherbio.2021.103002
Maia-Silva C., Silva Pereira J., Freitas B. M., Hrncir M. (2021). Don’t stay out too long! Thermal tolerance of the stingless bees Melipona subnitida decreases with increasing exposure time to elevated temperatures. Apidologie 52, 218–229. doi: 10.1007/s13592-020-00811-z
Menzel F., Feldmeyer B. (2021). How does climate change affect social insects? Curr. Opin. Insect Sci. 46, 10–15. doi: 10.1016/j.cois.2021.01.005
Mitchell J. D., Hewitt P. H., van der Linde T. C. D. K. (1993). Critical thermal limits and temperature tolerance in the harvester termite Hodotermes mossambicus (Hagen). J. Insect Physiol. 39, 523–528. doi: 10.1016/0022-1910(93)90085-6
Nagamitsu T., Inoue T. (1997). Aggressive foraging of social bees as a mechanism of floral resource partitioning in an Asian tropical rainforest. Oecologia 110, 432–439. doi: 10.1007/s004420050178
Ostwald M. M., Fox T. P., Hillery W. S., Shaffer Z., Harrison J. F., Fewell J. H. (2022). Group-living carpenter bees conserve heat and body mass better than solitary individuals in winter. Anim. Behav. 189, 59–67. doi: 10.1016/j.anbehav.2022.04.012
Oyen K. J., Dillon M. E. (2018). Critical thermal limits of bumble bees (Bombus impatiens) are marked by stereotypical behaviors and are unchanged by acclimation, age, or feeding status. J. Exp. Biol. 221, jeb.165589. doi: 10.1242/jeb.165589
Oyen K. J., Giri S., Dillon M. E. (2016). Altitudinal variation in bumble bee (Bombus) critical thermal limits. J. Thermal Biol. 59, 52–57. doi: 10.1016/j.jtherbio.2016.04.015
Perez R., Aron S. (2020). Adaptations to thermal stress in social insects: recent advances and future directions. Biol. Rev. 95, 1535–1553. doi: 10.1111/brv.12628
Peters M. K., Peisker J., Steffan-Dewenter I., Hoiss B. (2016). Morphological traits are linked to the cold performance and distribution of bees along elevational gradients. J. Biogeography 43, 2040–2049. doi: 10.1111/jbi.12768
Pincebourde S., Casas J. (2015). Warming tolerance across insect ontogeny: influence of joint shifts in microclimates and thermal limits. Ecology 96, 986–997. doi: 10.1890/14-0744.1
Quezada-Euán J. J. G., Nates-Parra G., Maués M. M., Imperatriz-Fonseca V. L., Roubik D. W. (2018). Economic and cultural values of stingless bees (Hymenoptera: Meliponini) among ethnic groups of tropical America. Sociobiology 65, 534–557. doi: 10.13102/sociobiology.v65i4.3447
Ramalho M. (2004). Stingless bees and mass flowering trees in the canopy of Atlantic Forest: a tight relationship. Acta Bot. Bras. 18, 37–47. doi: 10.1590/S0102-33062004000100005
Roeder K. A., Roeder D. V., Bujan J. (2021). Ant thermal tolerance: A review of methods, hypotheses, and sources of variation. Ann. Entomological Soc. America 114, 459–469. doi: 10.1093/aesa/saab018
Sánchez-Echeverría K., Castellanos I., Mendoza-Cuenca L., Zuria I., Sánchez-Rojas G. (2019). Reduced thermal variability in cities and its impact on honey bee thermal tolerance. PeerJ 7, e7060. doi: 10.7717/peerj.7060
Scaven V. L., Rafferty N. E. (2013). Physiological effects of climate warming on flowering plants and insect pollinators and potential consequences for their interactions. Curr. Zoology 59, 418–426. doi: 10.1093/czoolo/59.3.418
Sklenář P., Jaramillo R., Wojtasiak S. S., Meneses R. I., Muriel P., Klimeš A. (2023). Thermal tolerance of tropical and temperate alpine plants suggests that ‘mountain passes are not higher in the tropics.’. Global Ecol. Biogeogr 32, 1073–1086. doi: 10.1111/geb.13678
Souza-Junior J. B. F., Teixeira-Souza V. H., da S., Oliveira-Souza A., de Oliveira P. F., de Queiroz J. P. A. F., et al. (2020). Increasing thermal stress with flight distance in stingless bees (Melipona subnitida) in the Brazilian tropical dry forest: Implications for constraint on foraging range. J. Insect Physiol. 123, 104056. doi: 10.1016/j.jinsphys.2020.104056
Sunday J. M., Bates A. E., Kearney M. R., Colwell R. K., Dulvy N. K., Longino J. T., et al. (2014). Thermal-safety margins and the necessity of thermoregulatory behavior across latitude and elevation. Proc. Natl. Acad. Sci. 111, 5610–5615. doi: 10.1073/pnas.1316145111
Sunday J., Bennett J. M., Calosi P., Clusella-Trullas S., Gravel S., Hargreaves A. L., et al. (2019). Thermal tolerance patterns across latitude and elevation. Philos. Trans. R. Soc. B: Biol. Sci. 374, 20190036. doi: 10.1098/rstb.2019.0036
Terblanche J. S., Hoffmann A. A., Mitchell K. A., Rako L., le Roux P. C., Chown S. L. (2011). Ecologically relevant measures of tolerance to potentially lethal temperatures. J. Exp. Biol. 214, 3713–3725. doi: 10.1242/jeb.061283
Torres A., Hoffmann W., Lamprecht I. (2007). Thermal investigations of a nest of the stingless bee Tetragonisca angustula Illiger in Colombia. Thermochimica Acta 458, 118–123. doi: 10.1016/j.tca.2007.01.024
Villalta I., Oms C. S., Angulo E., Molinas-González C. R., Devers S., Cerdá X., et al. (2020). Does social thermal regulation constrain individual thermal tolerance in an ant species? J. Anim. Ecol. 89, 2063–2076. doi: 10.1111/1365-2656.13268
Wittmann D. (1985). Aerial defense of the nest by workers of the stingless bee Trigona (Tetragonisca) angustula (Latreille) (Hymenoptera: apidae). Behav. Ecol. Sociobiology 16, 111–114. doi: 10.1007/BF00295143
Wong B. B. M., Candolin U. (2015). Behavioral responses to changing environments. Behav. Ecol. 26, 665–673. doi: 10.1093/beheco/aru183
Keywords: climate change, Jataí, Meliponini, Microclimates, social insects, Tetragonisca angustula, thermal tolerance, warming tolerance
Citation: Robinson KM and Baudier KM (2024) Stingless bee foragers experience more thermally stressful microclimates and have wider thermal tolerance breadths than other worker subcastes. Front. Ecol. Evol. 12:1405459. doi: 10.3389/fevo.2024.1405459
Received: 22 March 2024; Accepted: 22 April 2024;
Published: 08 May 2024.
Edited by:
Helen McCreery, Tufts University, United StatesReviewed by:
Michał Filipiak, Jagiellonian University, PolandMadeleine Ostwald, University of California, Santa Barbara, United States
Copyright © 2024 Robinson and Baudier. This is an open-access article distributed under the terms of the Creative Commons Attribution License (CC BY). The use, distribution or reproduction in other forums is permitted, provided the original author(s) and the copyright owner(s) are credited and that the original publication in this journal is cited, in accordance with accepted academic practice. No use, distribution or reproduction is permitted which does not comply with these terms.
*Correspondence: Kristin M. Robinson, Um9iaW5zb24uS3Jpc3RpbkBvdXRsb29rLmNvbQ==
†ORCID: Kristin M. Robinson, orcid.org/0009-0004-1696-6202
Kaitlin M. Baudier, orcid.org/0000-0001-8450-3788