- 1College of Pratacultural Science, Gansu Agricultural University/Key Laboratory of Grassland Ecosystem, Ministry of Education, Lanzhou, China
- 2School of Management, Gansu Agricultural University, Lanzhou, China
Introduction: This study focuses on the Ganqing section of the Yellow River Basin, exploring four land use scenarios: natural development, cropland protection, ecological protection, and rapid development. Given the ecological importance of this area, the research aims to evaluate how each scenario impacts habitat quality and land use sustainability by 2030.
Methods: The Future Land Use Simulation (FLUS) model and the Integrated Valuation of Environmental Services and Tradeoffs (InVEST) model were applied to simulate land use for each scenario. A habitat quality pattern and coupling coordination degree model was used to assess the interactions between land use and land cover change (LULCC) and habitat quality under different scenarios.
Results: Findings show that over 70% of the Ganqing section of the Yellow River Basin is primarily grassland. By 2030, the ecological protection scenario is predicted to have the highest habitat quality, followed by the natural development, rapid development, and cropland protection scenarios. Between 1990 and 2030, the area demonstrates predominantly high or moderate coordination between land use and habitat quality. Spatial analysis reveals lower coordination values in the southeast and higher values in the northwest, with imbalanced recession zones distributed around valley basins.
Discussion: This study highlights the value of strategic scenario planning in enhancing habitat quality and promoting sustainable land management in the Ganqing section of the Yellow River Basin. The ecological protection scenario shows the most promise for balancing development with habitat preservation, underscoring the importance of adopting land use policies that support ecological sustainability in vulnerable areas.
1 Introduction
Habitat quality is a critical element in the objective existence of an ecosystem. It signifies the ecosystem’s capability to maintain sustainable conditions for the development and survival of individuals and populations within specific timeframes and spatial limits. This capacity can be evaluated using qualitative and quantitative techniques (Hillard et al., 2017). Habitat quality plays an important role in formulating ecological environmental protection measures and implementing sustainable developmental plans. However, in the last few years, as urbanization has progressed, the surge in population and the expansion of construction land have heightened conflicts with the natural environment. These clashes, coupled with the increasing frequency of extreme weather due to global climate change, have led to a host of ecological issues including habitat degradation and soil erosion (Zhang et al., 2020a). Human activities and climate change affect land use changes, which affects habitat quality. One of the most basic influencing factors is land use change (Aneseyee et al., 2020; Nematollahi et al., 2020). The continuous expansion of cities has changed land use patterns. Urbanization exerts significant strain on ecosystems and natural resources while simultaneously hindering its own progress due to habitat degradation and the scarcity of resources caused by this rapid expansion (Xing et al., 2019). Therefore, studying the relationship between land use and habitat quality is of great importance for policy formulation to facilitate the coordinated development of the ecological environment and human society.
Early research on habitat quality mainly focused on field survey data, which statically assesses regional habitat quality (Kempton, 1979). Owing to the extensive duration and elevated labor expenses, maintaining continuous dynamic monitoring becomes problematic and hinders replication efforts (Tang et al., 2020). The International Geosphere-Biosphere Programme (IGBP), International Human Dimensions Programme on Global Environmental Change (IHDP), and World Climate Research Programme (WCRP) projects regard land use change as one of the core issues when studying global change. Simultaneously, as computer and geospatial information science and technology have progressed, numerous mathematical models have been utilized to quantitatively evaluate habitat quality and its spatiotemporal variations. Thus, the exploration of habitat quality has gained significant attention, resulting in the development of diverse assessment methods in this field of research. Presently, two methods exist for evaluating habitat quality: the index evaluation and the model approach. The former, known as the indicator evaluation method, demands hands-on field investigation. However, its high cost limits its applicability to small-scale ecological environments. For example, Fu (1992) focused on four aspects: natural resources, social economy, ecological damage, and environmental pollution, and innovatively established a system to evaluate habitat quality on a regional scale. At the same time, they measured habitat levels in different regions of China. Based on the land use data of the fourth period in Henan Province, Zhang and Lang (2022) selected five single factors that closely reflected soil, water resources, atmosphere, and biological conditions, and discussed the evolution trend of habitat quality in the area under investigation over the past 14 years. Franklin et al. (2000) used owls in 95 forests in northwestern United States as research subjects to evaluate owl survival adaptability, and Balasooriya et al. (2009) evaluated habitat quality based on plant samples. The second method for evaluating habitat quality is the model method. There are many commonly used models, such as the Integrated Valuation of Environmental Services and Tradeoffs (InVEST), the Social Value for Ecosystem Service (SolVES) (Wang et al., 2016), Artificial Intelligence for Ecosystem Services (ARIES) (Vigerstol and Aukema, 2011), and Multi-scale Integrated Models of Ecosystem Services (MIMES) (Boumans et al., 2015).
The correlation between alterations in land use and shifts in habitat quality is a focal point in current research assessing and predicting habitat quality (Tang et al., 2020; Zhang et al., 2020b). Research content has gradually moved from the traditional method of constructing an evaluation index system to coupling land use change prediction and ecological models to conduct quantitative simulation and prediction analysis of spatial and temporal change characteristics of habitat quality (Wu et al., 2020). The primary focus of most studies is the impact of land use changes on habitat quality. However, these studies are predominantly conducted on a smaller scale, with few being conducted on a broader scale. This paper couples land use based on comprehensive factors such as socioeconomic development, physical geography, and environment. Through ecological models, we aim to identify how changes in land use impact habitat quality.
The Ganqing region within the Yellow River Basin holds a unique geographical position, situated in the upper and middle reaches of the basin. Comprising several ecological functional zones including Sanjiangyuan, the Qilian Mountains, and the Gannan Plateau, it is predominantly mountainous with significant terrain fluctuations and delicate ecosystems. Highly responsive to global climate shifts, it serves vital ecological roles, including water source preservation and biodiversity safeguarding. This area is a crucial ecological barrier, serving as the central zone for ecological protection and restoration within the Yellow River Basin. Due to the interference of natural and human factors, soil erosion has led to significant ecological issues, such as diversity loss, wetland area reduction, and grassland degradation, placing immense pressure on the habitat. This paper uses a model to simulate the evolution process of the habitat and land use change, thereby predicting the coupling and coordination relationship between habitat quality and land use change. Understanding this relationship holds immense importance for the rational allocation of land use, ecological environment protection, and sustainable development in the Ganqing section. This paper establishes four scenarios, employing the FLUS and InVEST models to simulate land usage and habitat quality in the Ganqing section up until 2030. Additionally, it employs a coupling coordination model to uncover the relationship between land use alterations and habitat quality across diverse scenarios. The aim is to offer a foundational guide for ecological preservation and land planning.
2 Study area overview and data
2.1 Overview of the study area
The Ganqing section of the Yellow River Basin is located in the upper reaches of the Yellow River (Figure 1), covering a total area of 293,100 km2 and accounts for 39.0% of the total area of the Yellow River Basin. This section is a crucial water conservation area in the upper Yellow River and holds a vital ecological status. The Gansu segment, spanning an area of 143,000 km2, includes ten cities (prefectures), namely, Lanzhou, Baiyin, Wuwei, Dingxi, Longnan, Linxia, Gannan, Tianshui, Qingyang, and Pingliang. The Qinghai segment covers an area of 150,100 km2, including eight cities (prefectures), namely, Xining, Haidong, and the Tibetan Autonomous Prefectures of Haibei, Huangnan, Hainan, Golog, Yushu, and Haixi Mongol. The altitude of the Ganqing section of the Yellow River Basin ranges from a minimum of 812 ms to a maximum of 6,115 m, with an average altitude of 3,059 m. The terrain slopes from high in the west to low in the east, spanning from the plateau climate zone to the warm temperate zone longitudinally, and traverses from semi-humid to semi-arid regions from north to south.
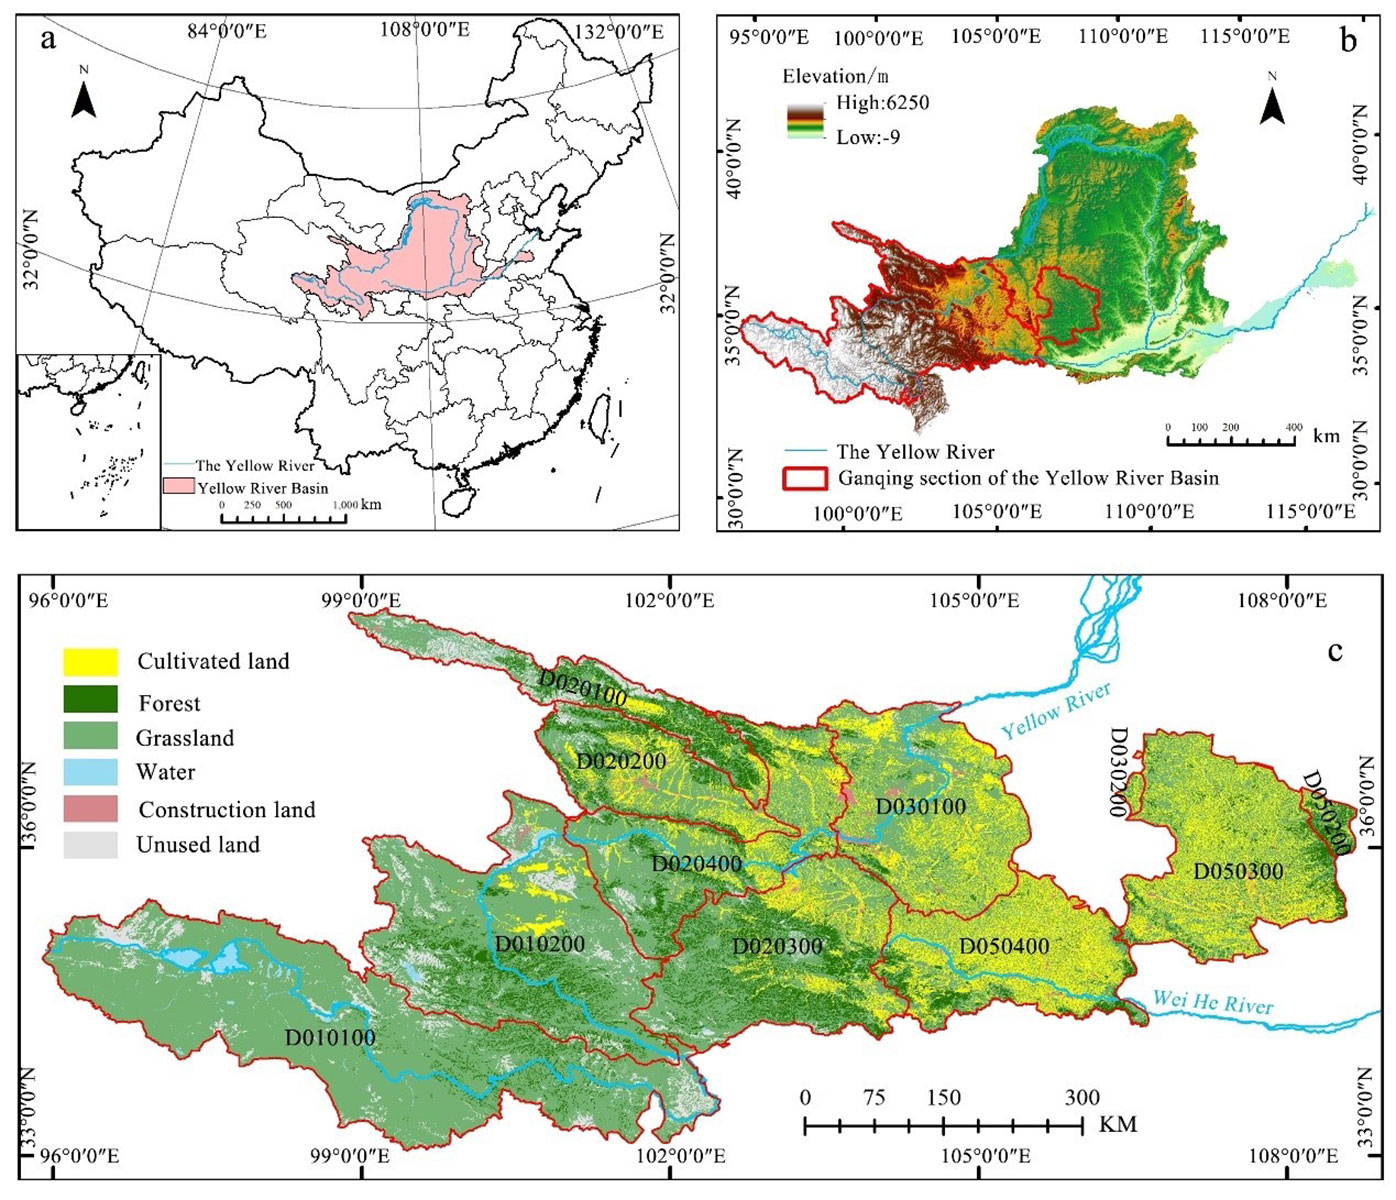
Figure 1. The location of the research area. (A Map showing the location of the Yellow River Basin in China; B Map showing the location of the study area within the Yellow River Basin; C Land use type map of the study area).
2.2 Data sources and processing
The land use data was sourced from Professors Yang and Huang of Wuhan University, who developed the first annual China Land Cover Dataset (CLCD) derived from Landsat on the Google Earth Engine (GEE) platform. The dataset spans 30 consecutive years with a spatial resolution of 30m × 30m.
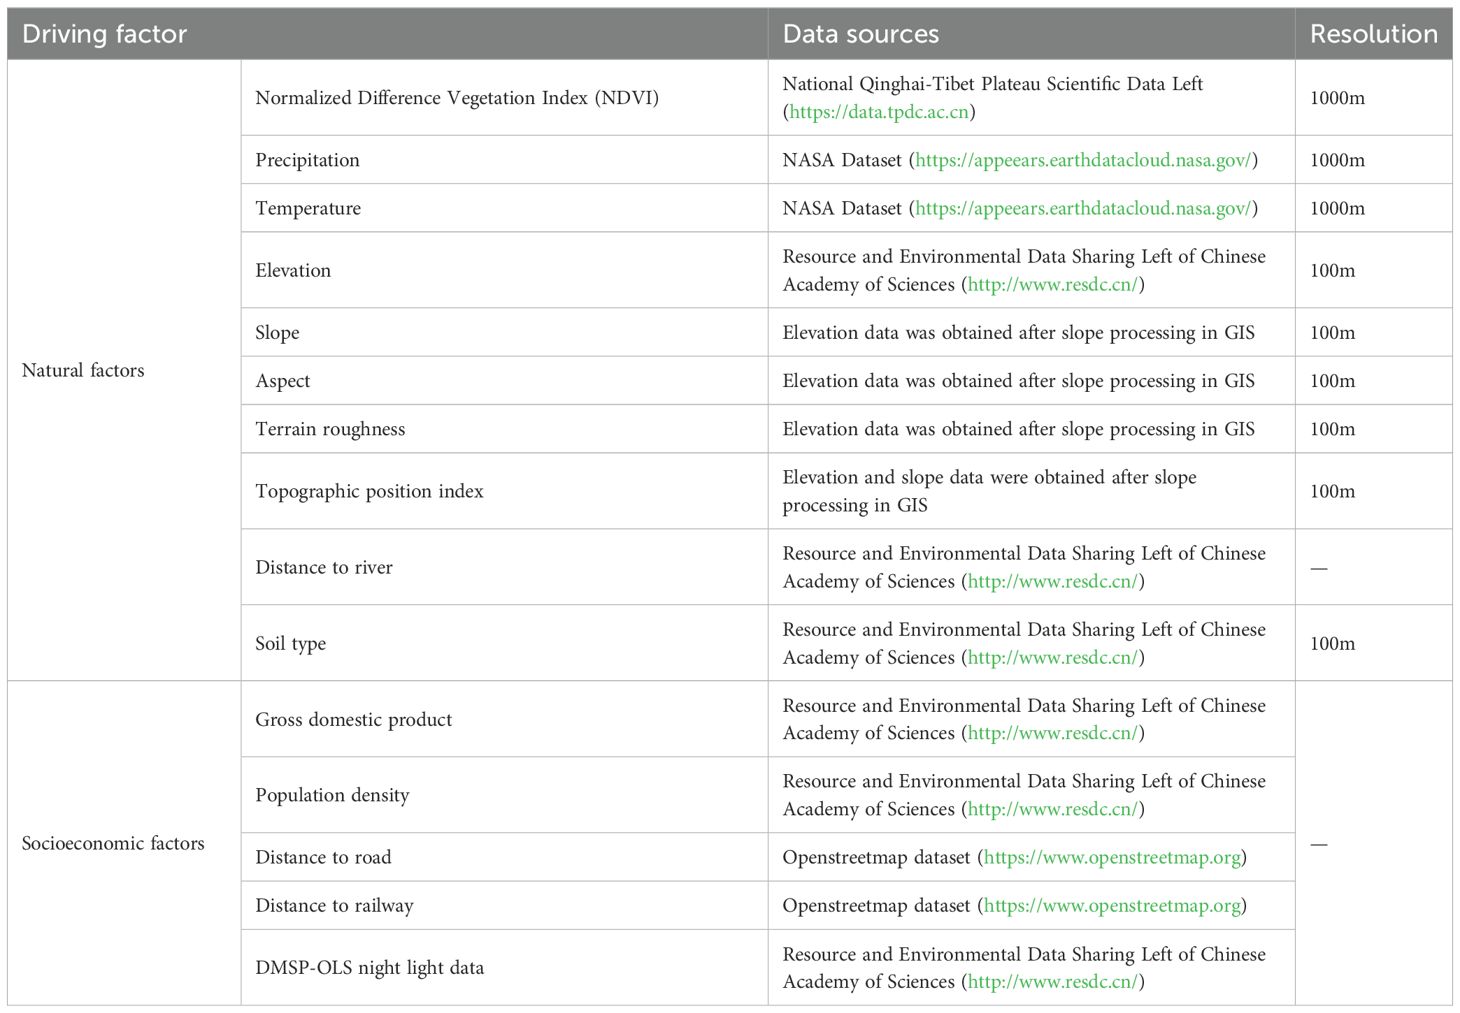
The selected driving factors for habitat quality and model simulation included 10 natural factors and 6 socioeconomic factors: the Normalized Difference Vegetation Index (NDVI), precipitation, temperature, elevation, slope, aspect, terrain roughness, topographic position index, distance to rivers, soil type, gross domestic product (GDP), population density, distance to roads, distance to railways, distance to government centers, and nighttime light index. The data sources for these specific factors are listed in Table 1.
3 Research methods
3.1 Scenario simulation
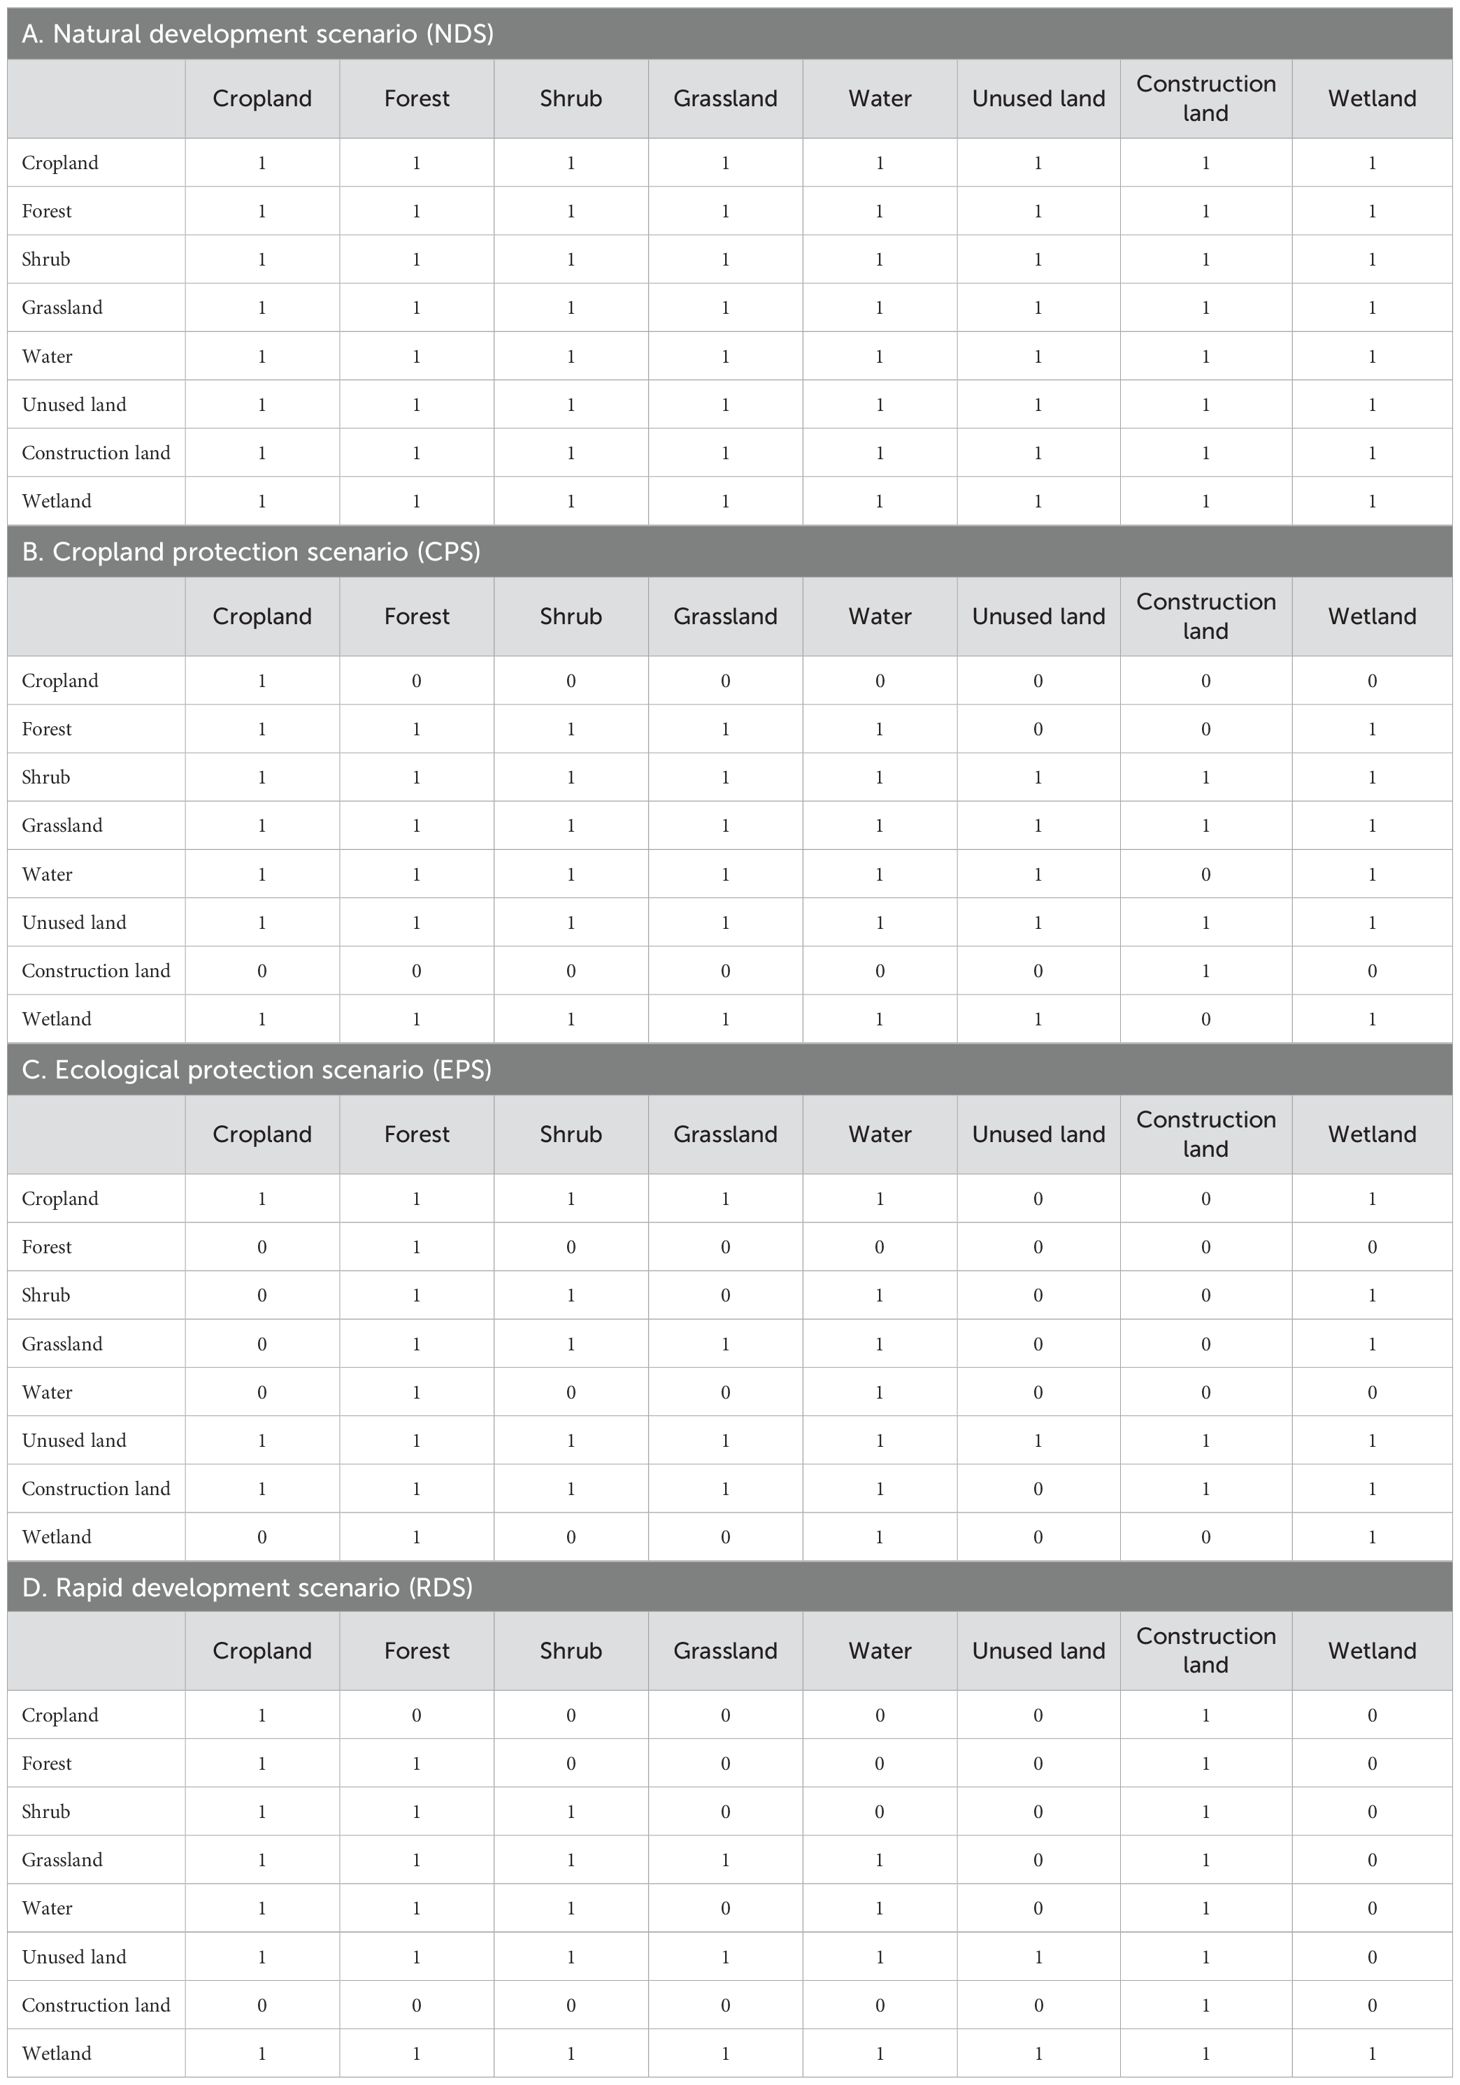
Due to the differing natural conditions and socio-economic development in the Gansu and Qinghai sections of the Yellow River Basin, the regulatory models for different types of development and utilization varied. Therefore, based on the current social development trends, we adopted the scenario analysis method to simulate future land use changes in different scenarios according to the characteristics of each scenario model. Based on varied development goals and potential disturbance scenarios within the basin, this study established four land use change simulation scenarios: the natural development scenario (NDS), cropland protection scenario (CPS), ecological protection scenario (EPS), and rapid development scenario (RDS). The aim was to provide a reference for policymakers to find a reasonable balance in land use. The conversion rules between different land types are shown in Table 2 (Note: 1 indicates that conversion is possible, 0 indicates that conversion is not possible). The scenarios are defined as follows:
Natural Development Scenario: The NDS assumes a continuation in the land change rates observed between 2000 and 2015 while maintaining consistent natural and economic development conditions within the area under investigation. The Markov model simulates land demand without imposing limitations on inter-category transfers, omitting considerations of government policies concerning farmland and ecological protection.
Cropland protection scenario: With the protection of basic farmland as the key point, the transfer of cropland is strictly prohibited, and all except construction land can be converted into cropland.
Ecological Protection Scenario: Sorted according to the ecological benefits of various types of land: forestland, water, wetland, shrubland, grassland, cropland, construction land, and unused land. The conversion principle is that the conversion of land types from high to low is not allowed.
Rapid Development Scenario: In the pursuit of swift progress, the RDS foresees urbanization expanding into agricultural land, forests, grasslands, and water sources. However, the unique irreversible traits of construction land prohibit its conversion into other types, emphasizing the need to preserve its designated purpose.
3.2 FLUS model
The FLUS model, as described by Liu et al. (2017b), is a tool utilized for projecting changes in land use, considering both human activities and natural factors. This model draws upon cellular automata principles but advances significantly beyond traditional approaches. Initially, it employs a neural network algorithm (ANN) to gauge the likelihood of different land use types within a specific area, using data from an initial period and various influencing factors such as human activities and natural forces. Moreover, it refines its accuracy by incorporating a sampling technique from the initial land use data, preventing error propagation (Liang et al., 2018). During the simulation, the FLUS model introduces an adaptive inertial competition mechanism, employing roulette selection. This mechanism efficiently handles the complexities of changing various land use types under the combined impacts of natural processes and human interventions. Its precision allows the FLUS model to produce highly accurate simulations that closely mirror real-world land use distributions, as observed by Liu et al. (2021). The driving factors selected in this study include the NDVI, precipitation, temperature, elevation, slope, aspect, terrain roughness, distance from rivers, soil type, GDP, population density, distance from roads, distance from railways, distance from governmental seats, and the nighttime light index, totaling 15 natural and economic factors. The simulation process primarily involves the calculation of suitability probability, setting of neighborhood factors and model verification, calculation of adaptive inertia coefficients, scenario setting, and comprehensive probability calculation.
3.3 InVEST model habitat quality module
The InVEST model assists in gauging habitat quality by utilizing the habitat quality index (Zheng et al., 2018). As the index increases, so does the habitat quality, biodiversity levels, and the effectiveness of ecological services, which can be considered as the ecological foundation of the land. This is determined through the following calculation:
In the formula, is j the habitat quality index of the raster unit of the landscape type; x is j the habitat suitability score of the landscape type. In the value paradigm, the range is 0–1; z is the scale constant, generally taking the value 2.5; k is half. The saturation constant can be customized by the user according to the resolution of the data used; it is the habitat degradation index, which indicates the degree of degradation of the habitat after being subjected to stress. The formula is as follows:
In the formula, R is the number of stress factors; Yr is the total number of grid cells of stress factors; ωr is the weight; ry is the number of stress factors on the raster unit; is the accessibility level of the raster x (level of legal protection, for strict protection zones the value is 1; if it is a harvest protected area, the value is 0; an intermediate protection level can be assigned a value between 0 and 1); in which j represents the sensitivity of the landscape to stress factors, and the value range is 0–1; is the influence distance of the stress factor, and can be divided into current and exponential decline calculations.
In the formula, is the linear distance x between the grids y and; , r is the maximum action distance of the threat factor.
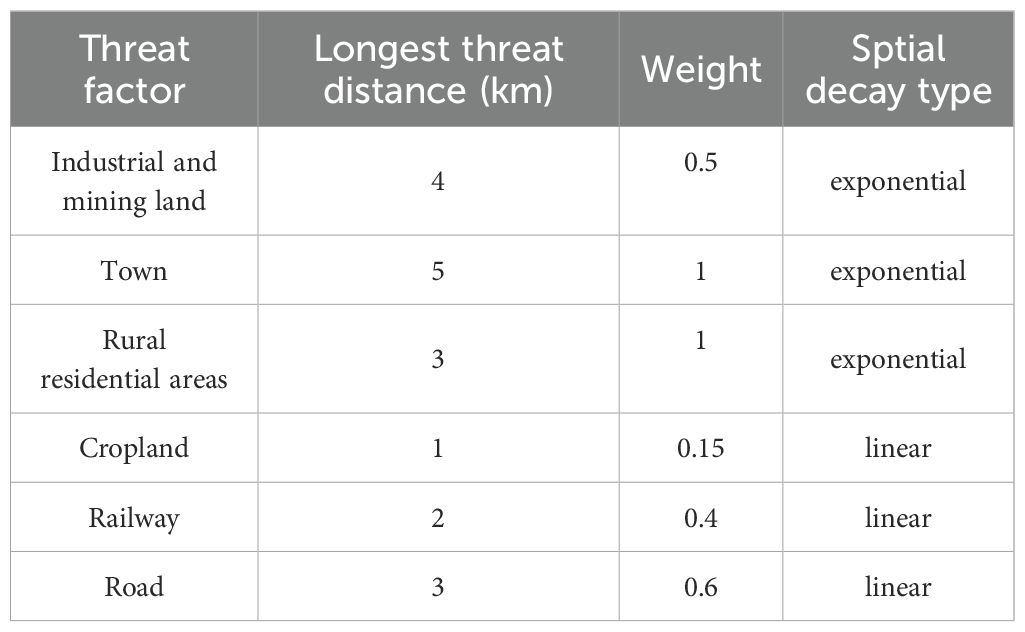
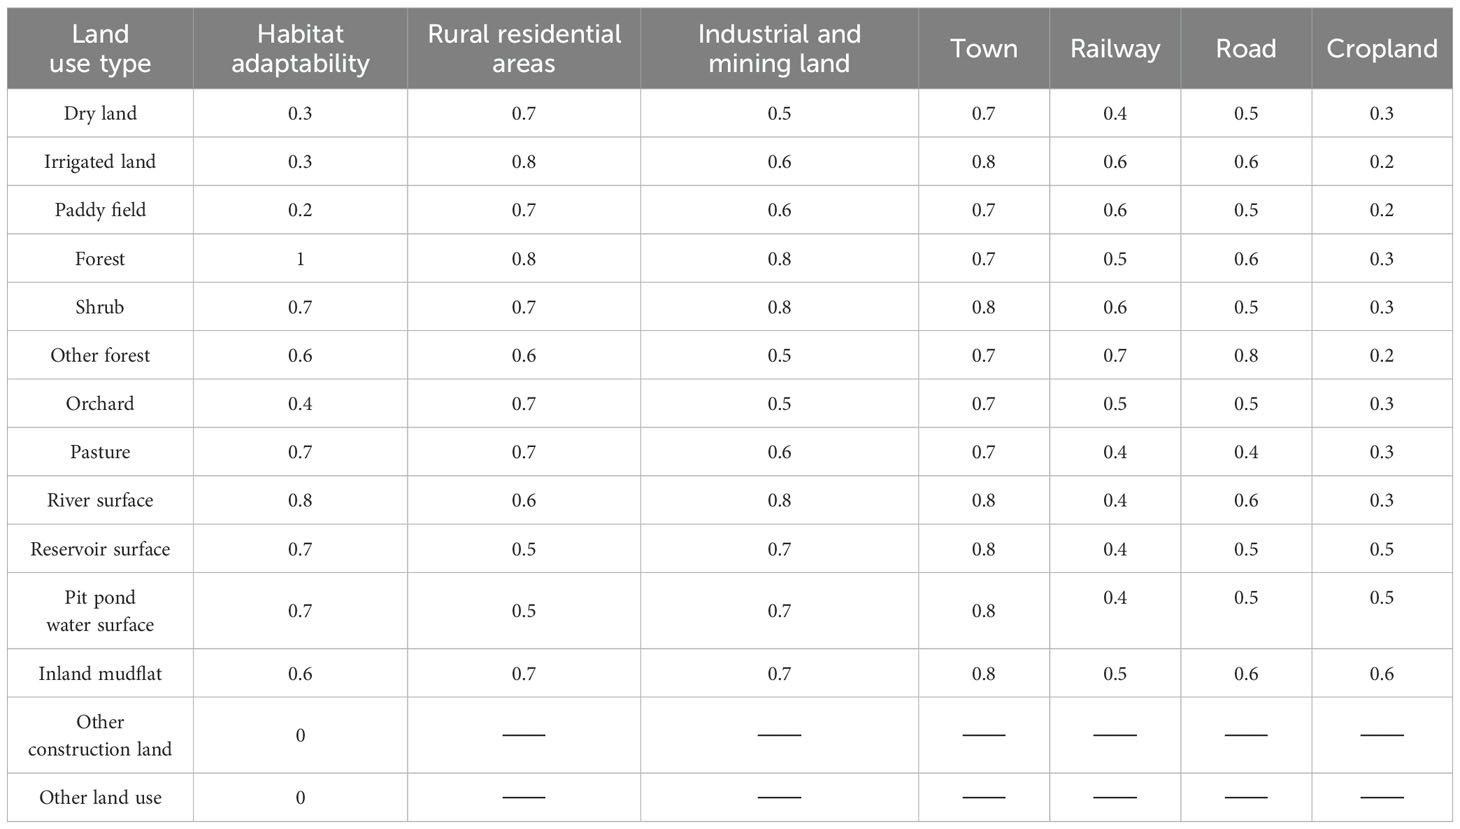
The essential inputs required for this model encompass the current land use cover map, significant regional stress factors affecting habitats, weights and ranges of influence for these stress factors, and various parameters like landscape sensitivity to different threat sources. Land use is divided into seven first-level categories and 21 second-level categories. The first-level land categories include cropland, forest land, garden land, grassland, water area, construction land, and other land, as shown in Table 1. The sensitivity of habitat types to stress factors is primarily understood through references such as the InVEST model manual (InVest 3.4.4, 2018) and similar literature (Avon and Bergès, 2016; Xie Y. et al., 2018; Huang et al., 2020). Values are then assigned using an expert scoring method in conjunction with these resources. Detailed data are shown in Tables 3 and 4.
3.4 Coupling coordination model
This article presents a model called the coupling coordination degree model, aiming to depict how land use and land cover (LULCC) relates to habitat quality in the Ganqing section of the Yellow River Basin (Zhang et al., 2020a; Sun B. et al., 2021). Di is the coupling coordination degree of the i-th sample point, and its expression is as follows (Yang L. J. et al., 2021):
In the formula: Ci and Hi are the coupling degree and coordinated development index between LULCC and habitat quality of the i-th sample point respectively; HQi and LCIi are the habitat quality index and land use index of the i-th sample point respectively; β1 and β2 are undetermined coefficients, generally β1 = β2 = 0.5. Referring to the research of Shao et al. (2010), this paper defines the land use index (LCIi) as the percentage of the sum of the area of four land use types with good ecological services: woodland, shrubland, grassland,and water, in the basin. It is used to measure and reflect the land use status and comprehensive ecosystem functions of the area under investigation. Its specific formula is:
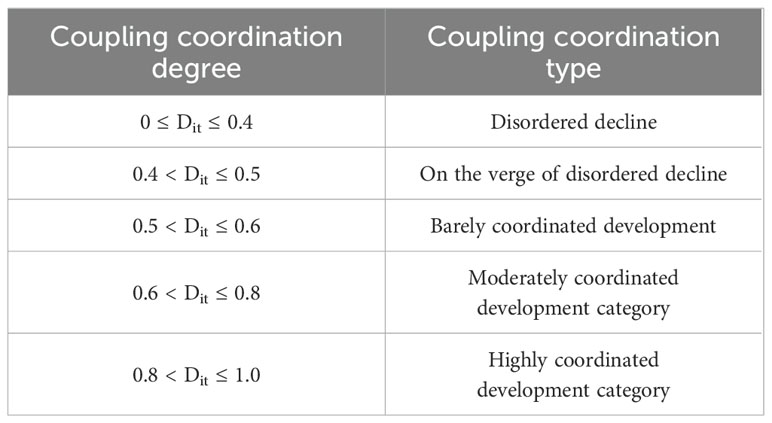
In the formula, Area hi is the area of the h-th land cover type at sample point i, h = 1,…, 4 respectively, representing the four land cover types of woodland, shrubland, grassland, and water and AREAi is the area of sample point i of the total area. As per studies conducted by scholars concerning the correlation between urbanization and the ecological environment’s coupling coordination level (Yang L. J. et al., 2021), this document categorizes the level of coupling coordination between habitat quality and land use change in the Ganqing section of the Yellow River Basin into five distinct tiers, outlined in Table 5.
4 Results
4.1 Spatio-temporal variation in habitat quality
Using the InVEST model, the habitat quality of the Ganqing section of the Yellow River Basin in 1990, 2000, 2010, and 2020 was 0.7468, 0.7401, 0.7475, and 0.7469 respectively, showing a trend of first decreasing and then increasing, though the change was relatively subtle. According to previous research, the habitat quality in the Ganqing section of the Yellow River Basin can be divided into five levels, namely high (0.8–1), higher (0.6–0.8), medium (0.4–0.6), lower (0.2–0.4), and low (0–0.2). Figure 2 illustrates that the habitat quality of the 11 third-level watersheds in the Ganqing section of the Yellow River Basin is notably at a high level. Among them, the habitat quality of the watershed above the head of the Beiluo River is at a high level, boasting an average annual habitat quality of approximately 0.9. The watershed with the lowest habitat quality is the watershed above Baoji Gorge of the Wei River, with an average annual habitat quality of approximately 0.6. Between 1990 and 2020, there was a gradual increase in habitat quality changes along various rivers including the Daxia and Tao Rivers, Weihe River above Baoji Gorge, Jinghe River above Zhangjiashan, Huangshui River, Beiluo River above Zhuantou, Qingshui River, Lanzhou to Xiaheyan, and the Kushui River Basin. These changes tended to show improvement, with the most significant enhancements observed in the Jinghe River basin above Zhangjiashan. The degree of change in habitat quality in the watersheds from Heyuan to Maqu, Maqu to Longyang Gorge, Longyang Gorge to the main Lanzhou stream, and the Datong River Xiangtang has continued to diminish. These habitats have suffered some level of damage. Among them, the most severe habitat degradation occurred in the watershed from Maqu to Longyang Gorge.
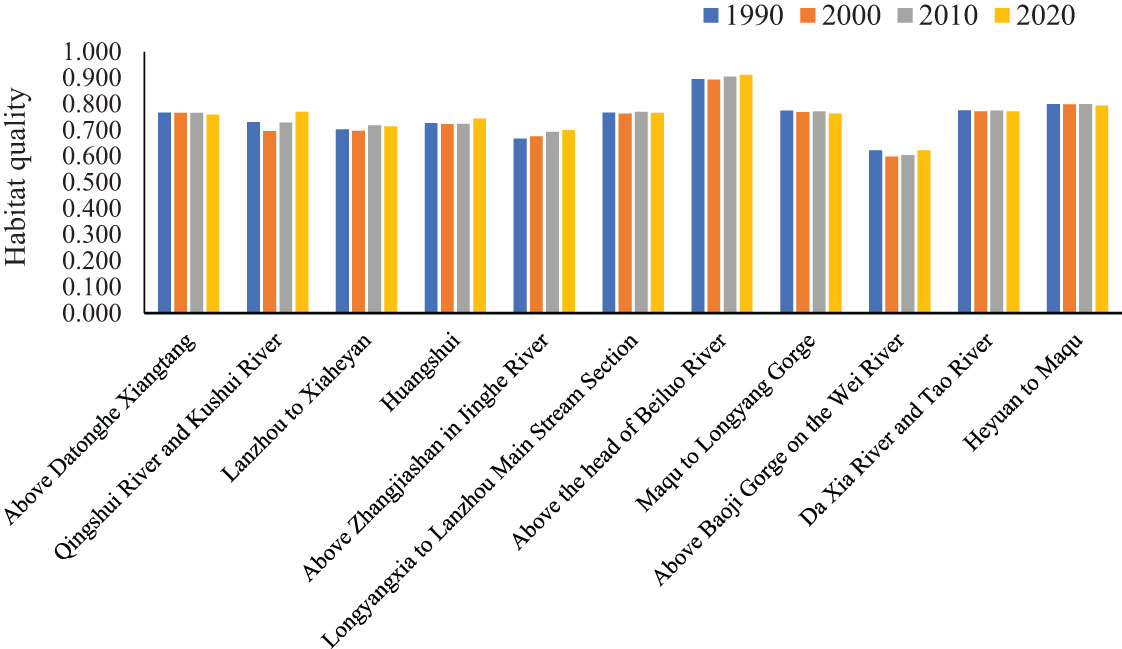
Figure 2. Habitat quality of 11 third-level watersheds in the Ganqing section of the Yellow River Basin.
From 1990 to 2000 (Figure 3), the habitat quality in the Jinghe River basin above Zhangjiashan increased, while the remaining 10 basins showed a downward trend. Between 2000 and 2010, the habitat quality within the Ganqingduan sub-watershed in the Yellow River Basin consistently improved; this was notably evident in the Lanzhou to Xiaheyan watershed area. Between 2010 and 2020, the majority of the basins improved in habitat quality rather than declined. Notably, the basins located upstream of the Baoji Gorge along the Wei River showed the most significant gains, while the basins stretching from Maqu to Longyang Gorge had the most substantial losses during this period.
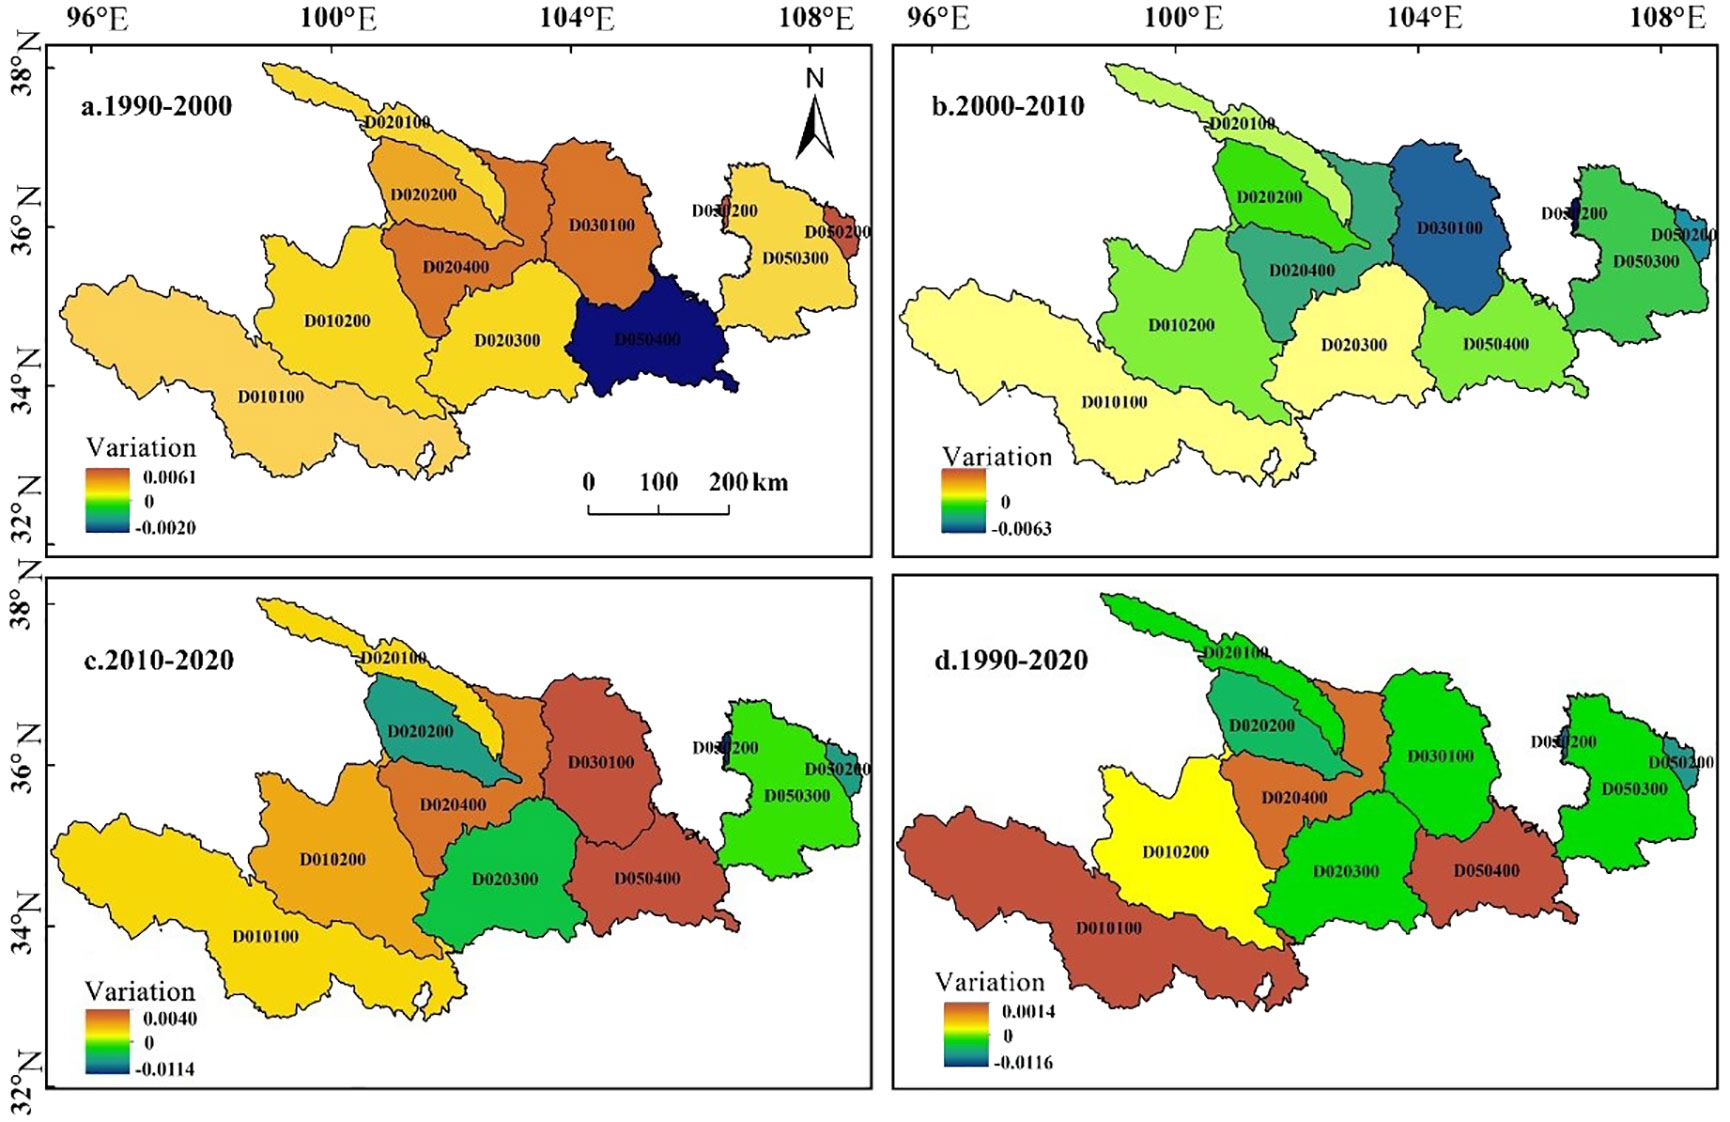
Figure 3. Spatial distribution of habitat quality change in the Ganqing section of the Yellow River Basin from 1990 to 2020. (A: 1990–2000; B: 2000–2010; C: 2010–2020; D: 1990–2020).
4.2 Multi-scenario prediction of land use changes in the Ganqing section of the Yellow River Basin in 2030
This paper employed land use data from 2010 to simulate the spatial pattern of land use in the Ganqing section of the Yellow River Basin in 2020. Compared with the actual land use data in 2020, the Kappa coefficient was 0.8488 and the FOM index was 0.10665. The root mean square error (RMSE) of this model training was 0.162763. The obtained adaptability probability results are shown in Figure 4. The adaptability probability distribution map is consistent with the natural conditions of the Ganqing section of the Yellow River Basin, and the results are reasonable. The FLUS model demonstrated superior effectiveness in simulating land use changes within the Ganqing section of the Yellow River Basin when considering the specified driving factors. This proficiency ensured reliable simulation accuracy that fulfills the prediction criteria.
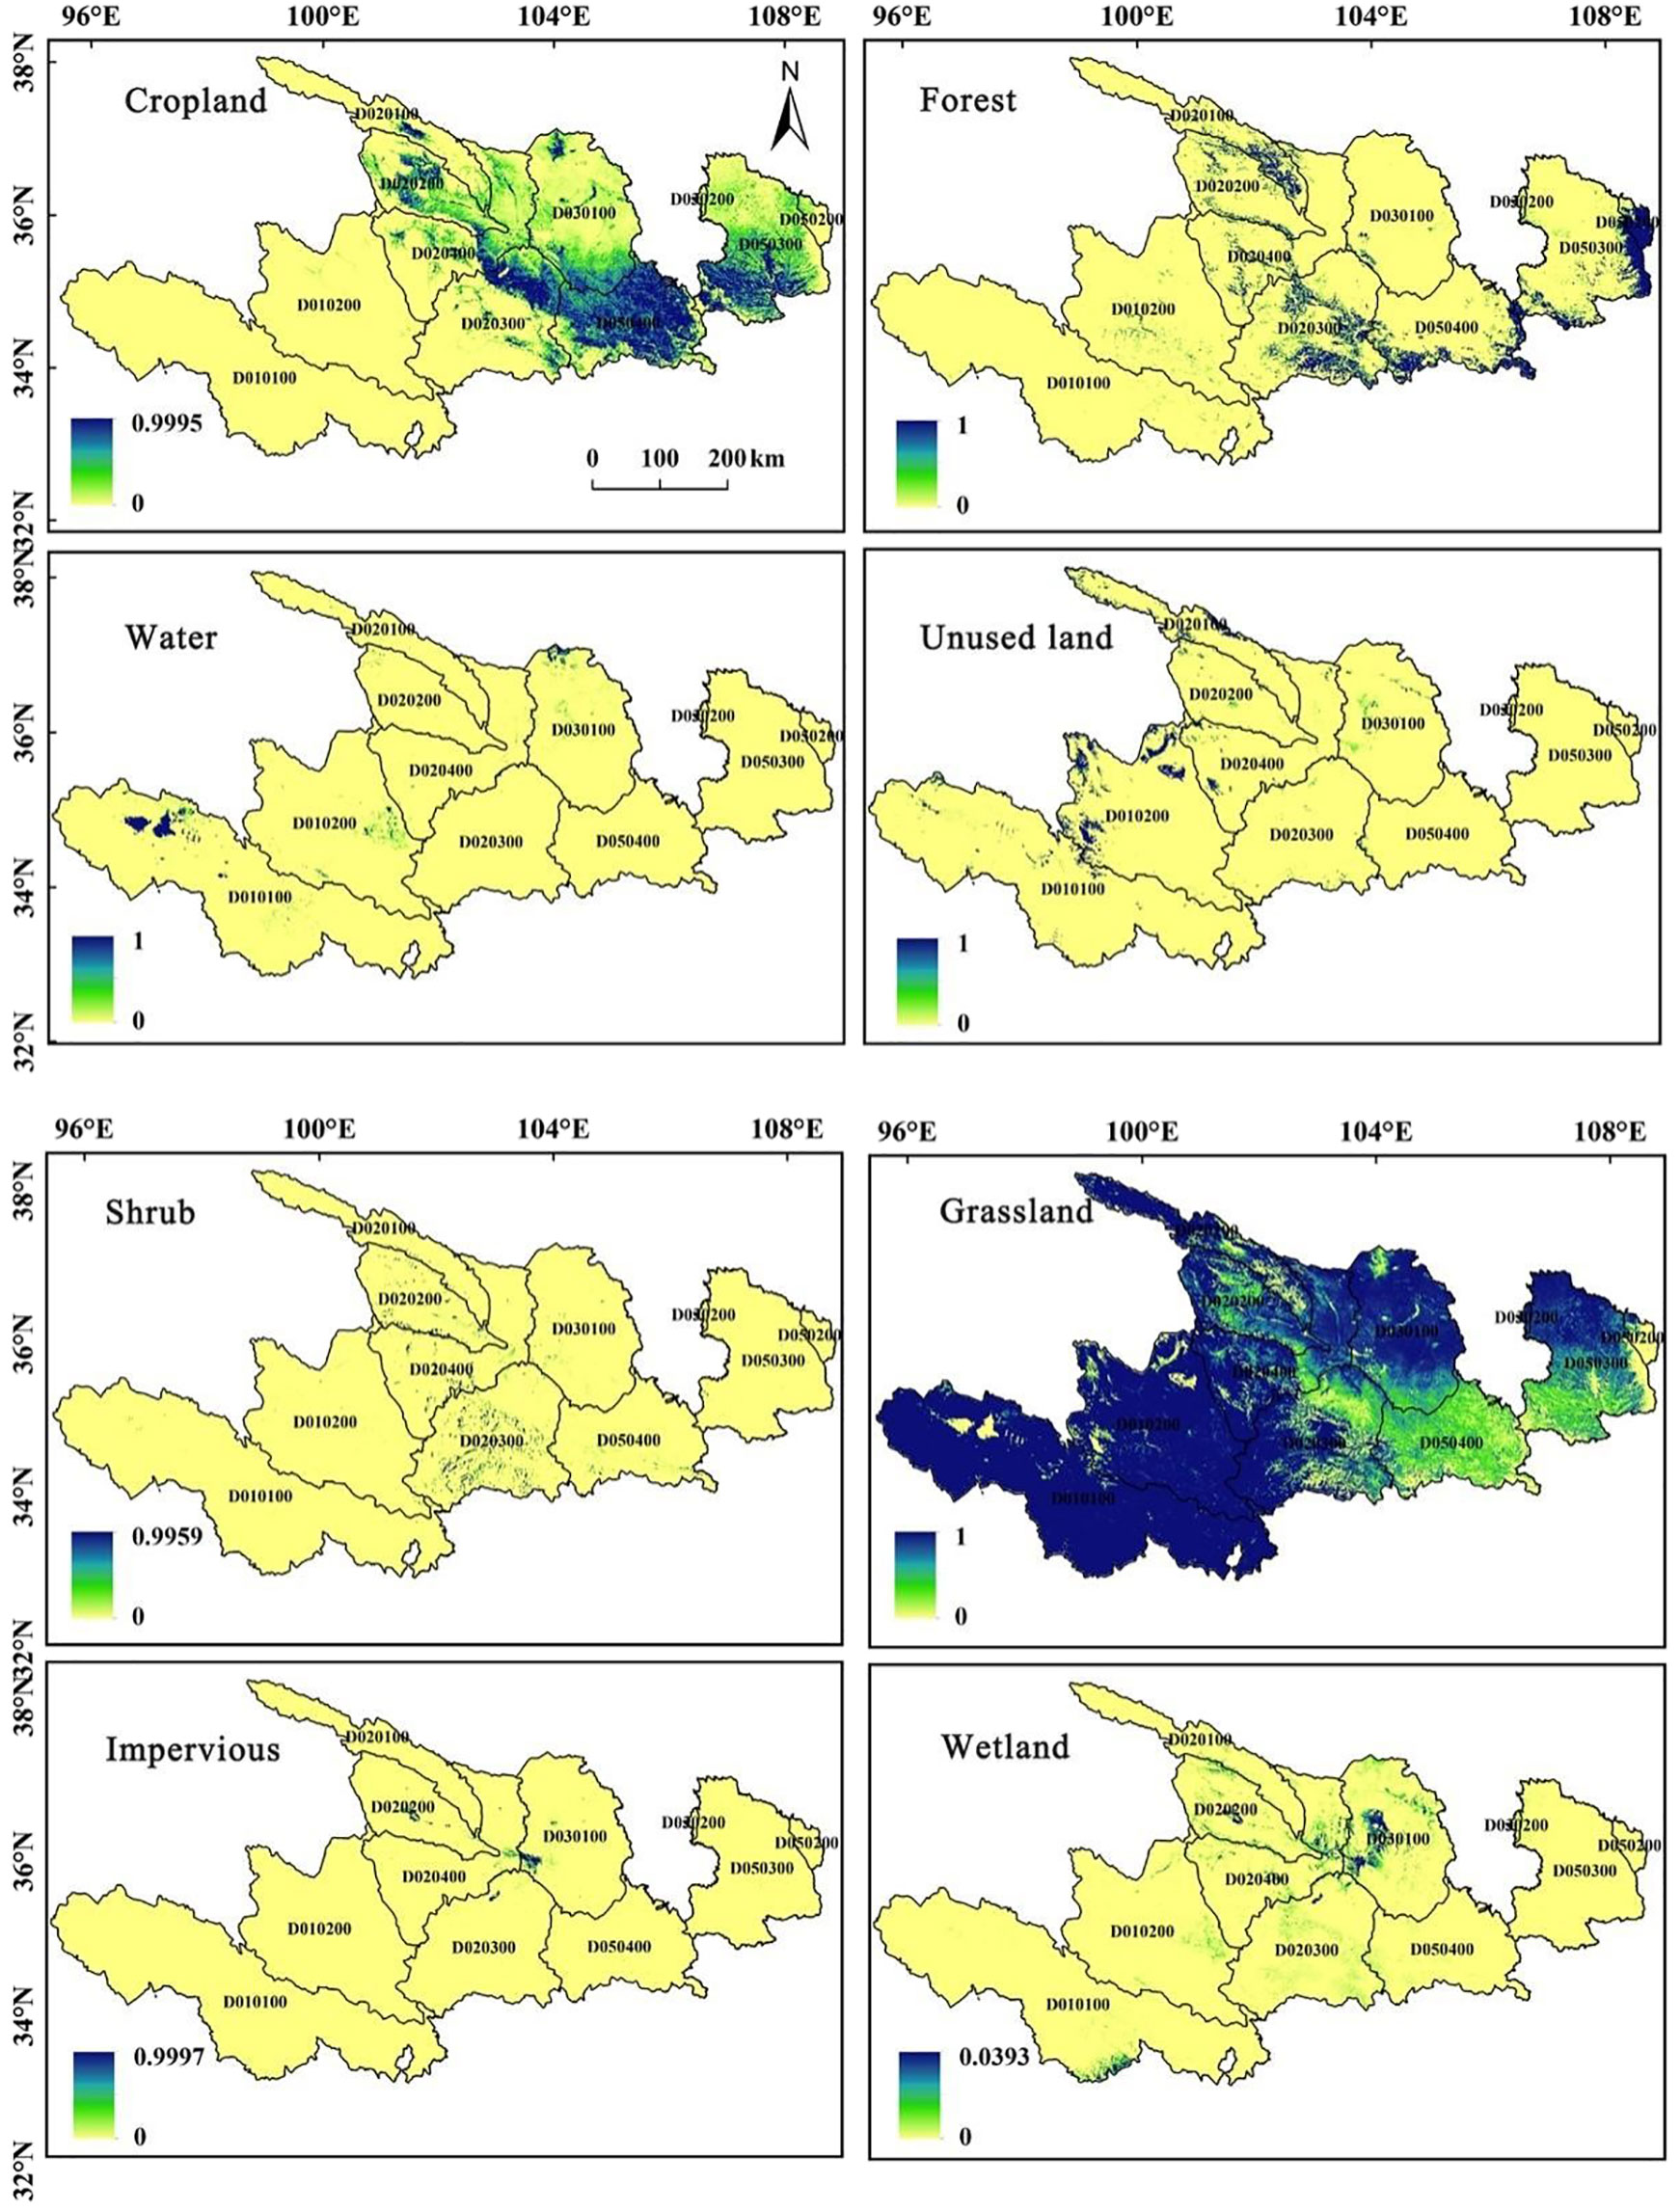
Figure 4. Probability map of the suitability of land use type in the Ganqing section of the Yellow River Basin in 2030.
There are many ways to use land in the Ganqing section of the Yellow River Basin in the future. Considering the socio-economic development, land utilization, and associated policies in the Yellow River Basin, four scenarios were established: NDS, CPS, EPS, and RDS. These scenarios form the basis for distinct transfer matrices. By employing these matrices and conducting automated cell analysis using the land use data from the Gansu and Qingdao sections of the Yellow River Basin in 2020, this study aimed to forecast the spatial distribution pattern of land use in the Gansu and Qingdao sections of the basin for 2030 (Figure 5). The simulated grassland in 2030 is still scattered throughout the area under investigation, and is the largest land use type in the Gansu and Qinghai sections of the Yellow River Basin. Woodland is primarily situated in the northern, eastern, and southeastern regions of the basin, exemplified by Beishan National Geological Forest Park and Shaanxi Huangling National Forest Park. Specifically, it covers the Qingyang area, Gannan Tibetan Autonomous Prefecture in Gansu Province, and the hills in the southern part of Longnan City, such as the Laga Mountain Scenic Area. Additionally, it encompasses the Xinglong Mountain Scenic Area in Lanzhou City, Gansu Province. Forest land expands notably across the four projected scenarios, with the ecological protection scenario showing the most prominent increase in forested land. Using Lanzhou City and Xining City as representative provincial capitals within the basin, future projections suggest that land use changes across four scenarios will likely lead to a notable increase in constructed land areas. In 2030, the increase in constructed land in Lanzhou City’s primary urban region, as opposed to its 1990 status, primarily stems from the transformation of land categories such as farmland and idle land within the city boundaries. In the context of rapid development, the most evident change is the transformation of construction land, which occurs quite naturally. In the development scenario, the Yellow River water area in Lanzhou City increases significantly. In 1990, the allocation of construction land in the primary urban zone of Xining City was not centralized. By 2030, the construction land has increased significantly. Cropland in the region has been converted to construction land on a large scale to promote urban construction, especially in the rapid development scenario.
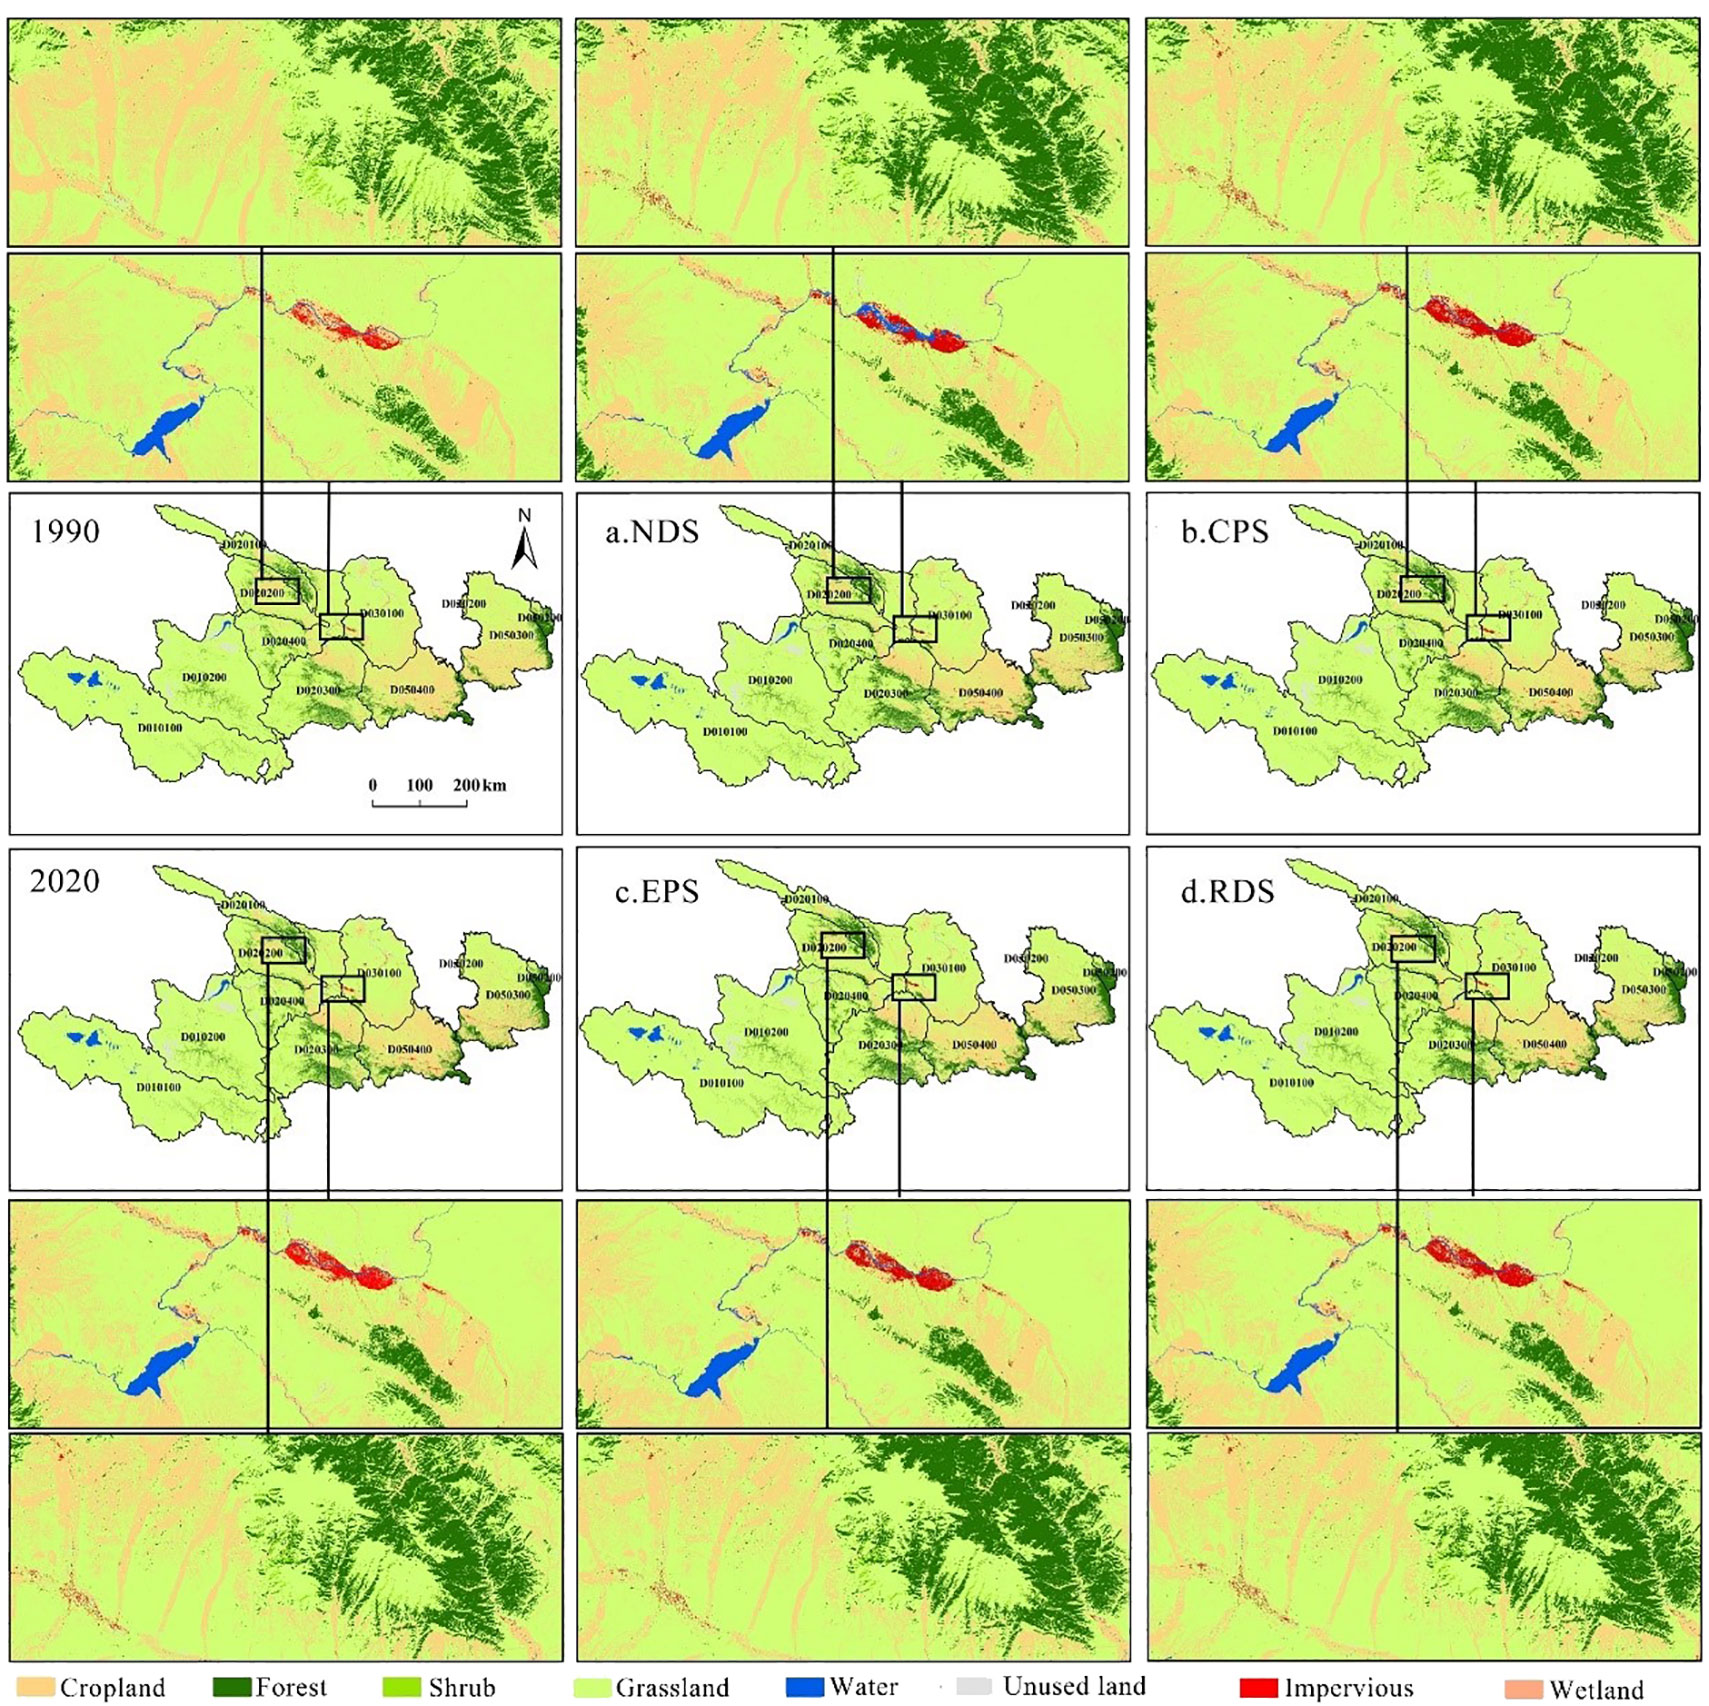
Figure 5. Simulation map of land use change in the Ganqing section of the Yellow River Basin in 2030 in four scenarios. (A: NDS; B: CPS; C: EPS; D: RDS).
We compared the LULCC in 2030 in the four scenarios with those in 1990 and 2020 (Table 6). The wetland area in the natural development scenario is the smallest. Compared with the land use in 1990, woodland, water areas, the area of unused land, and construction land shows an increasing trend. Compared with 2020, the area of woodland and water areas has increased, and other land types have shown a decreasing trend. In the ecological protection scenario, the areas of woodland and grassland are the largest. Compared with 1990, the land use type with the largest increase in area is forestland, with an increase of 5050 km2. The most obvious decrease in area is cropland, with a decrease of 5250 km2. Compared with 2020, the grassland area has the most obvious increase, with an increase of 2740 km2. In the rapid development scenario, the grassland area is the smallest and the construction land area is the largest. Compared with 2019 and 2020, construction land, forest land and water areas have increased to varying degrees. The construction land area has expanded rapidly, with an increase of 142.22% in 40 years. In the cropland protection scenario, compared with the other three scenarios, the cropland area is the largest. In contrast to the periods between 1990 and 2020, the area of cropland has continued to shrink, albeit at a slower rate than in the other three scenarios. Conversely, both forestland and water areas have shown consistent growth. Notably, the forestland area has seen the most rapid expansion, increasing by 4480 km². The simulations for land use in the Ganqing area of the Yellow River Basin for 2030 in the four scenarios demonstrate a consistent trend: the expansion of ecologically beneficial lands such as forests, water bodies, and wetlands, accompanied by a reduction in economically productive areas such as cultivated and unused lands. In general, these changes signify a positive shift toward a healthier ecological environment within the river basin.

Table 6. Land use area (× 103 km2) under four scenarios in the Ganqing section of the Yellow River Basin in 2030 and the difference between it and land use area in 1990 and 2020.
4.3 Change characteristics of habitat quality in the Ganqing section of the Yellow River Basin in 2030 in the multi-scenario prediction
In 2030, the habitat quality of the Ganqing section of the Yellow River Basin in the NDS, EPS, RDS, and CPS scenarios is 0.7483, 0.7529, 0.7482, and 0.7480, respectively. Of these, EPS boasts the highest average habitat quality value, with the lowest proportion of low and lower grades across the area under investigation. The ratio is not high (Table 7), accounting for only 9.01% of the total area of the basin, and high grade land accounts for 39.53% of the entire basin area. The habitat of the basin is good in the ecological protection scenario. Habitat quality is low in both the RDS and CPS. The development demand for cropland in the rapid development scenario is second only to construction land and the construction land area in the area under investigation is small. Consequently, the average habitat quality scores for both the cropland protection scenario and the rapid development scenario are nearly identical. Under the NDS scenario, from 2020 onwards, the proportions of areas with low, low-to-medium, and medium-to-high habitat quality in the Gansu and Qinghai sections of the Yellow River Basin steadily decline, with respective increases of 0.27%, 0.10%, and 2.00% observed over a 10-year period. The rates of high-grade grades see a continuous rise, increasing by 0.49% and 2.56% correspondingly. Simultaneously, the expansion of low-quality habitat areas suggests an overall improvement in habitats across most regions within the watershed. This trend indicates promising outcomes for the country’s diverse ecological restoration initiatives within the area under investigation.

Table 7. Ratio of habitat quality levels in Ganqing section of the Yellow River Basin in the four scenarios (%).
Compared with 1990, the overall habitat quality of Gansu and Qinghai sections of the Yellow River Basin in the NDS is in a state of impairment (Figure 6). The area of impairment accounts for 52.86% of the total area, and the proportion of impairment is 5.72% greater than the gain. The overall habitat quality in the RDS is in a state of gain, with the gain area accounting for 50.81% of the total area, and the gain accounting for 1.63% more than the loss. Furthermore, the overall habitat quality of the Yellow River Basin in the EPS is in a state of gain, with the gain area accounting for 55.16% of the total area, and the gain ratio accounting for 10.32% more than the loss ratio. The overall habitat quality in the RDS is in a state of gain, with the gain area accounting for 53.36% of the total area, and the gain accounting for 6.72% more than the loss. The changes in habitat quality in the four scenarios are consistent in spatial distribution, and the gain areas are concentrated in the east and north of the basin, such as Xining City in Qinghai Province; Jingtai County and Huining County in Baiyin City, Gansu Province; Qingshui County in Tianshui City; and Qingyang City. Many regions are affected, notably Maqin County in the Goluo Tibetan Autonomous Prefecture, the southern part of the Linxia Hui Autonomous Prefecture, Jingning County in Pingliang City, and the northwest area of Dingxi City experiencing more conspicuous losses.
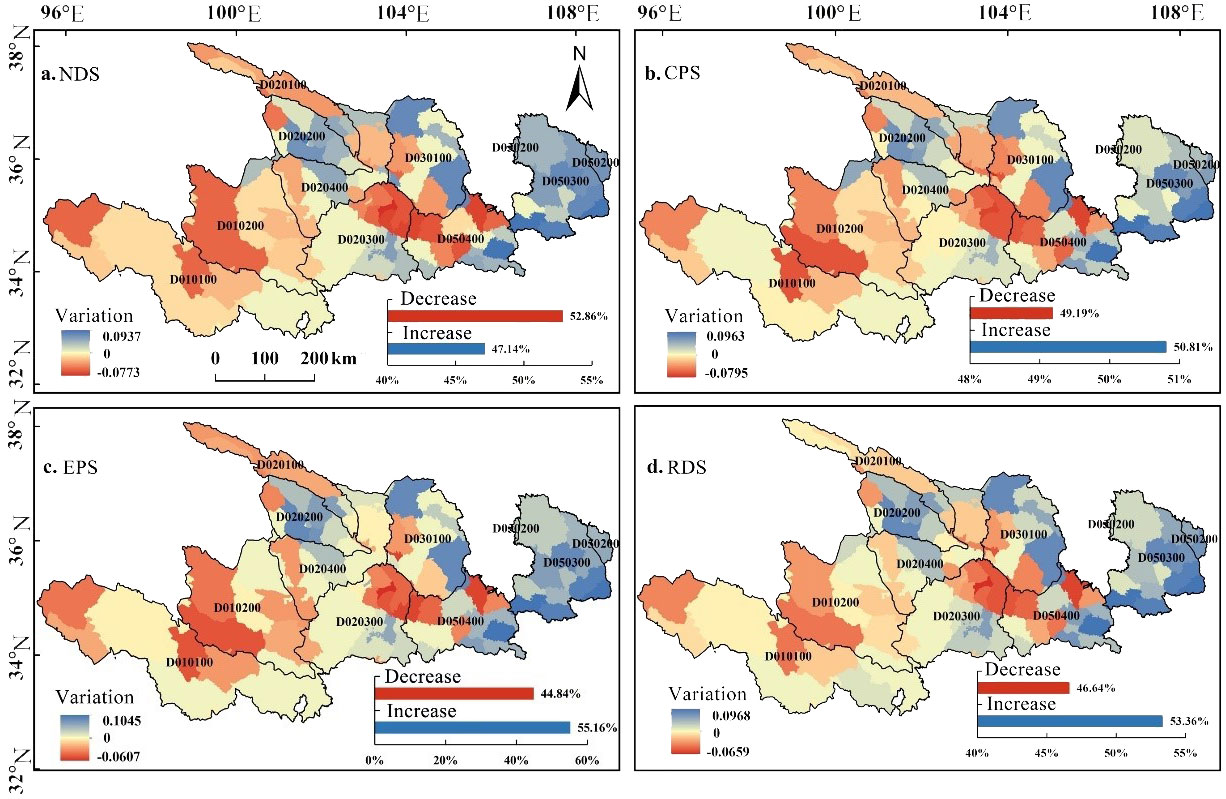
Figure 6. Changes in habitat quality in the Ganqing section of the Yellow River Basin from 1990 to 2030.
4.4 Scenario simulation of coupled evolution of land use change and habitat quality in the Ganqing section of the Yellow River Basin
This paper used the equal-spaced sampling method to divide the area under investigation into grid units of 1,000 m × 1,000 m, with a total of 293,104 sample points. According to the coupling coordination degree model, the coupling coordination degree between land use type and habitat quality of each grid unit was obtained, and the coupling coordination types of habitat quality and land use change in the area under investigation were divided according to the classification standard of coupling coordination degree (Table 5). Highly coordinated development and moderately coordinated development were the main types of coupled coordinated development of land use and habitat quality in the area under investigation from 1990 to 2030, with the former accounting for more than 80% and the latter accounting for approximately 10% (Table 8).

Table 8. Area of coupling (×104 km2) and coordination types of habitat quality and land use change in the Ganqing section of the Yellow River Basin in different scenarios.
Between 1990 and 2030, it was quite apparent that there was a significant variation in how habitat quality and land use change were connected in the Ganqing area of the Yellow River Basin (Figures 7A, B). Generally, the spatial pattern was low in the southeast and high in the northwest, and some of the imbalanced decline areas were distributed in patches. In the western reaches of the basin, such as Guinan County and Gonghe County within the Hainan Tibetan Autonomous Prefecture of Qinghai Province, and Maqin County in the Goluo Tibetan Autonomous Prefecture, there is a growing trend of imbalanced decline in certain areas over time. The remaining areas experiencing imbalanced decline are spread out in linear or patchy formations, often found near the valley basin regions.
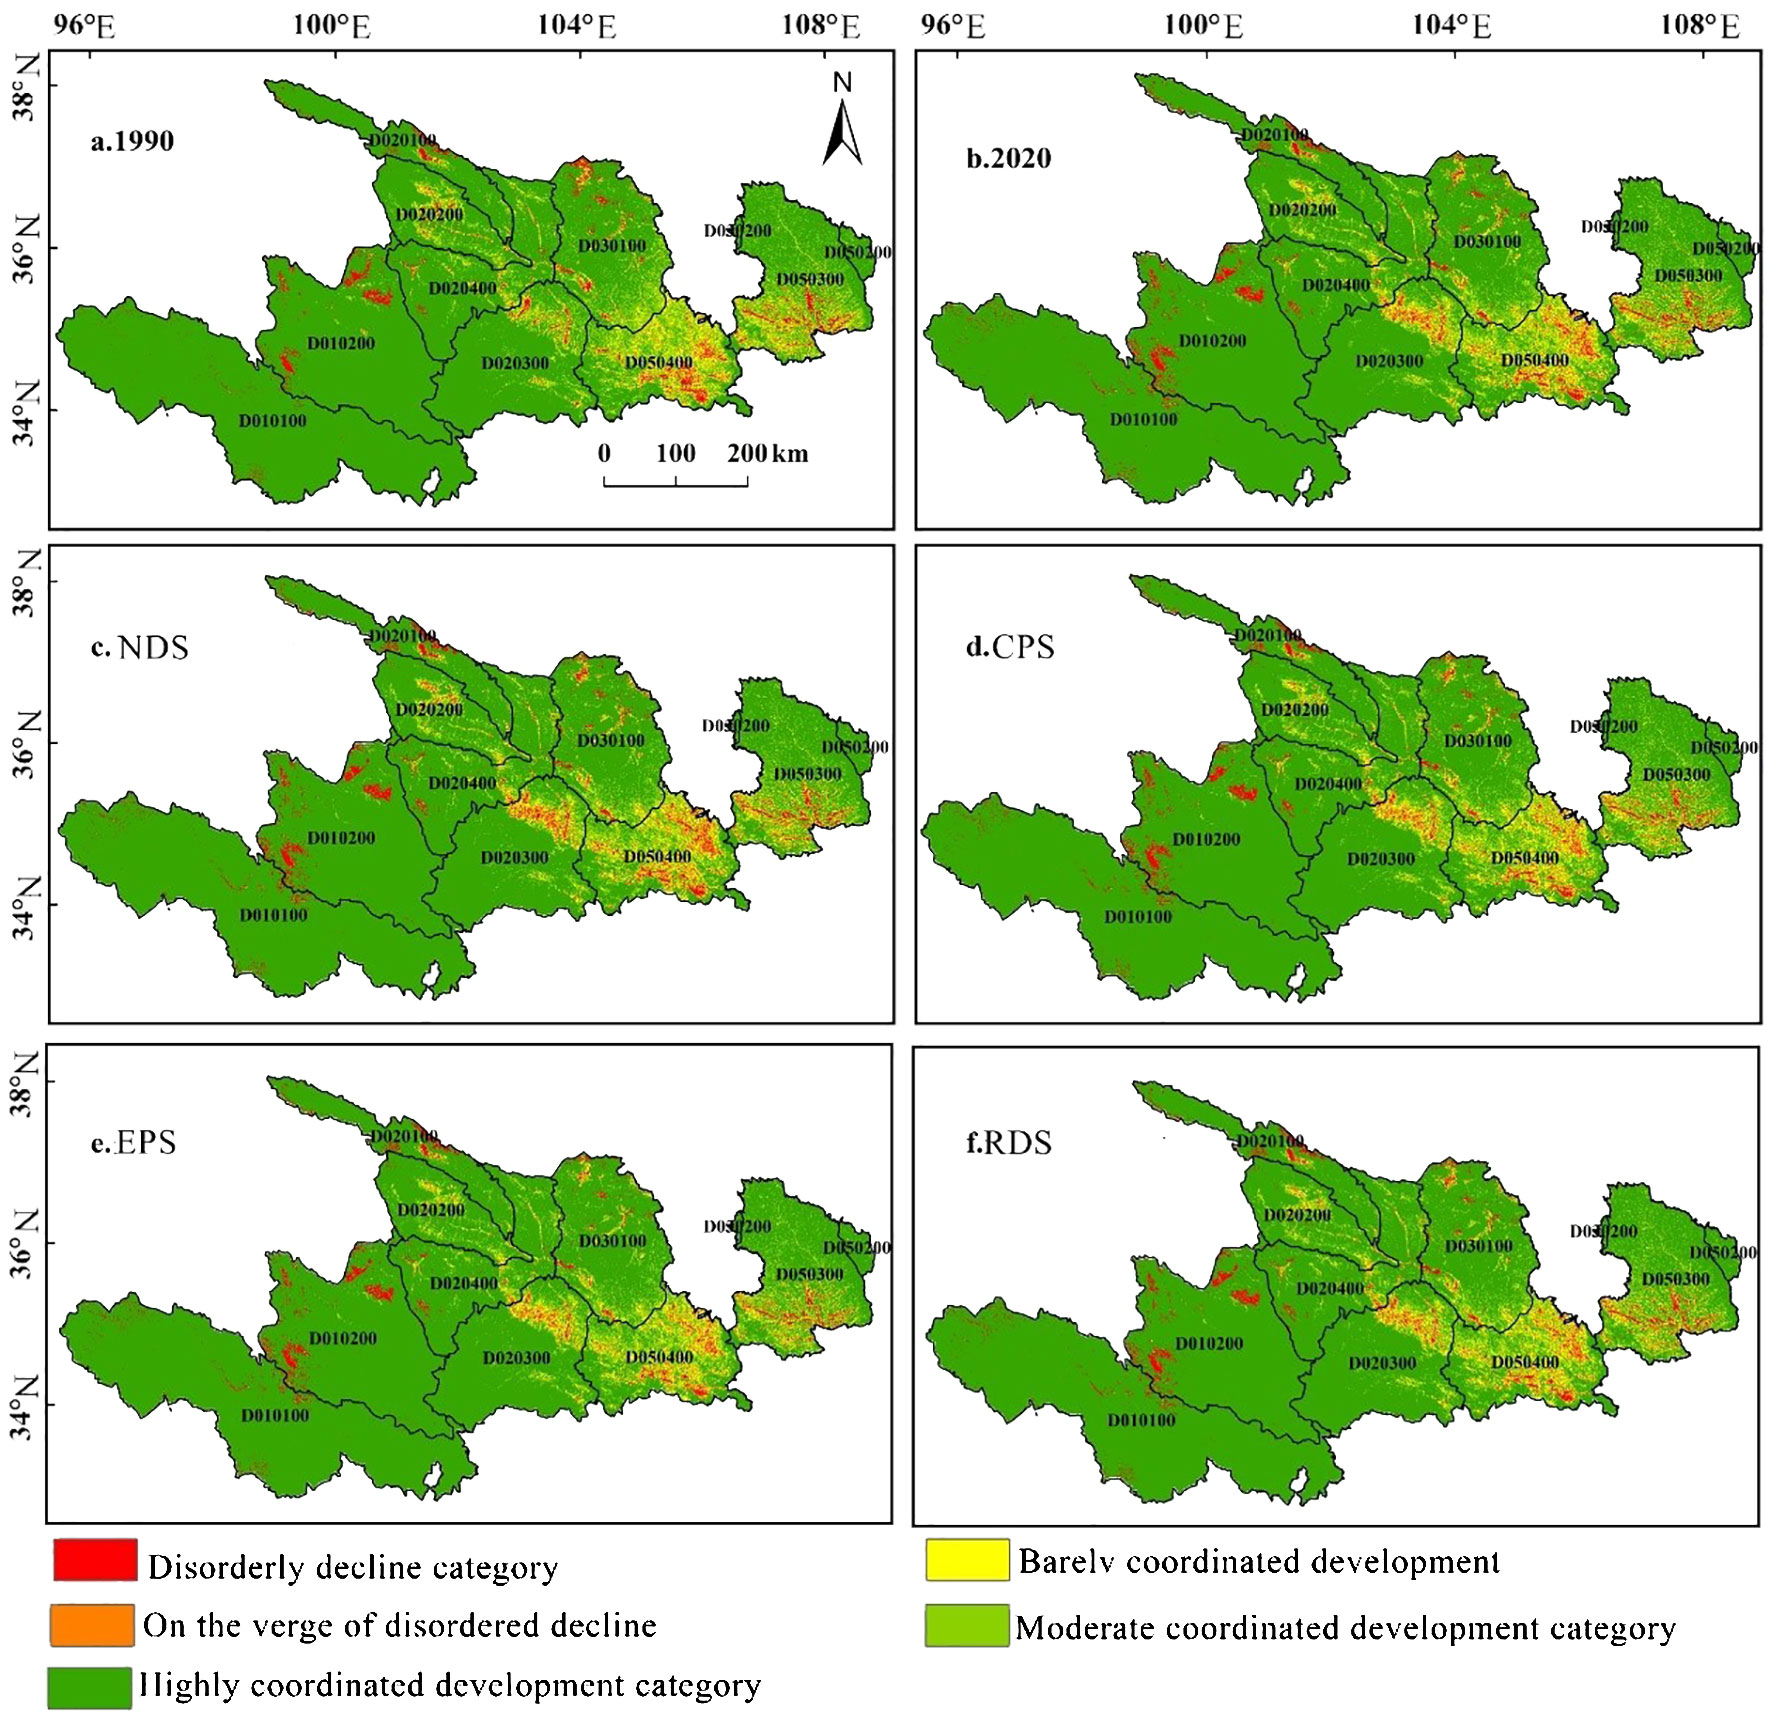
Figure 7. Spatial distribution of coupling types of habitat quality and land use change in Ganqing section of the Yellow River Basin in different scenarios. (A: 1990; B: 2020; C: NDS; D: CPS; E: EPS; F: RDS).
Regions teetering on disorderly decline and those poised for coordinated development show a concentrated pattern, gradually extending from the Weihe and Yellow River basins in both directions. Areas moderately aligned with development are predominantly situated on the outskirts of the declining regions, as well as within these declining areas and the ones progressing toward coordinated development. Notably, they encompass extensive spaces in the Longdong region of Gansu Province, including cities such as Tianshui and Qingyang. The highly coordinated development zone boasts the most extensive area and widest coverage, sprawling across the entire river basin.
In the NDS, the coupling and coordinated development level of the area under investigation showed a slight upward trend from 2020 to 2030, rising from 0.8496 in 2020 to 0.8697 in 2030. The disordered decline area and the area on the verge of disordered decline showed an expansion trend, and the highly coordinated development area slightly increased (Figure 7C), increasing by 0.0368 × 10⁴ km2, 0.0318 × 10⁴ km2, and 0.2463 × 10⁴ km2, respectively. The area on the verge of disordered decline and the area barely coordinated development showed a shrinking trend, with a decrease of 0.0762 × 10⁴ km2 and 0.2388 × 10⁴ km2, respectively.
The coupling coordination level of the area under investigation increased from 0.8496 in 2020 to 0.8700 in 2030. The highly coordinated development area gradually expanded (Figure 7D), increasing by 0.2463 × 10⁴ km2, while the imbalanced decline area and the area on the verge of imbalanced decline, the barely coordinated development area and the moderately coordinated development area gradually shrank, reducing by 0.0496 × 10⁴ km2, 0.0374 × 10⁴ km2, 0.0670 × 10⁴ km2, and 0.0504 × 10⁴ km2, respectively. In the CPS, the dissonance recession zone and the near-dislocation recession zone shifted from expansion to contraction when compared to the NDS. Between 2020 and 2030 in the Ganqing region of the Yellow River Basin, the joint progress of land use alterations and habitat enhancement, propelled by the CPS approach, consistently increased. This upward trajectory gains even more momentum when compared to the natural development scenario.
In the EPS from 2020 to 2030, the basin coupling coordination level increased from 0.8496 to 0.8751, a total increase of 0.0255. Same as the CPS, the highly coordinated development area of the watershed gradually expanded, increasing by 0.5161 × 10⁴ km2; the imbalanced decline area, the verge of imbalanced decline area, the barely coordinated development area, and the moderately coordinated development area all gradually shrank, with a decrease of 0.1377 × 10⁴km2, 0.0972 × 10⁴ km2, 0.1336 × 10⁴ km2, and 0.1476 × 10⁴ km2, respectively (Figure 7E). Compared with the NDS and CPS, the EPS area on the verge of imbalanced decline and the barely coordinated development area have significantly shrunk, while the highly coordinated development area has significantly expanded. Between 2020 and 2030, within the Ganqing section of the Yellow River Basin, there is a noticeable upward trend in the simultaneous progression of land use alterations and the enhancement of habitat quality in the EPS.
In Figure 7F, the trend in the evolution of coupling coordination for the RDS closely aligns with that of the CPS. The highly coordinated development area increases by 0.2360 × 10⁴ km2, and the disordered decline area, the verge of disordered decline area, the barely coordinated development area, and the moderately coordinated development area decrease by 0.0709 × 10⁴ km2, 0.0380 × 10⁴ km2, 0.1336 × 10⁴ km2, and 0.1476 × 10⁴ km2, respectively. When contrasted with the CPS, the reduction in amplitude within the disorderly decline zone and minimally coordinated development zone in the RDS is notable. This suggests that while the alignment and synchronization between land use protection and habitat quality in the RDS are on the rise, they remain moderate in comparison to the NDS and experience a substantial decrease compared to the EPS.
5 Discussion
This paper employs a FLUS-InVEST coupling model to estimate habitat quality. The FLUS model was used to simulate land use patterns in the area under investigation in 2030. This innovative land use change simulation model differs significantly from traditional prediction models. Instead of relying on conventional methods, it utilizes a neural network algorithm, integrating land use data from a single phase along with relationships between multiple driving factors (Wen Q. et al., 2017). This approach calculates the likelihood of suitability for different land types within the designated area under investigation. When projecting land use patterns, conventional prediction models such as CA (Liu et al., 2017a) and CLUE (Wen Y. et al., 2017) rely on computing transition matrix probabilities from past data across different land categories (Ge Q. et al., 2020). These models then forecast future land use layouts by assuming that these trends will remain unchanged over equally spaced intervals in upcoming years. Since the FLUS model simulates future distributions based on appropriate probability of certain land types appearing in space, the closer the time of baseline land use and driving factors during prediction, the better the prediction model. To ensure the accuracy of the model results, this study opted to utilize 1990 land use data and its determining factors to project land use distribution in 2020 (He Q. et al., 2020). This involves overlaying projected outcomes with 2020 land use map to verify accuracy (Li P., 2020). Following this, adjustments were made to the model parameters until they met the required level of accuracy. After analyzing land use data from 2020 alongside GDP and climate-related factors from comparable years, a forecast was made for the spatial distribution of land use in 2030 (Yang Z. et al., 2021).
InVEST’s habitat module assumes that habitat quality depends on a habitat’s accessibility for human land use and the intensity of this land use. In modeling, certain land use types are presumed to pose threats to habitat quality. The layers representing threats are utilized to assess how much habitat quality is affected by various land use types, ultimately allowing for an estimation of overall habitat quality. As a result, the limits of the area under investigation are determined by artificially set administrative boundaries, meaning that threats to habitats beyond these boundaries can still impact the habitats within the area under investigation (Xiao et al., 2023). The habitat quality estimated by the FLUS-InVEST coupling model is relatively consistent with the actual situation. Owing to the extensive grassland coverage in the Ganqing area of the Yellow River Basin, coupled with the rising aspirations for a better life following a certain level of economic development, and considering China’s efforts in ecological and environmental protection over the past two decades, the overall habitat quality in the studied area does not show a declining trend (Tang et al., 2020). Nevertheless, it is important to take heed of declining habitat quality in specific localities and the clustering of these degraded areas. This conclusion affirms the reliability of the employed coupling model and the resulting calculations in this article (Cord et al., 2017).
The habitat quality level in 2030 of the four scenarios in the Ganqing section of the Yellow River Basin can be ranked as ecological protection scenario > natural development scenario > rapid development scenario > cropland protection scenario. This is consistent with Yang Z. et al. (2021)’s multi-scenario analysis of habitat quality in the Dongting Lake Basin. The land use structure found in the area under investigation could be a contributing factor as to why the rapid development scenario shows slightly higher average habitat quality compared to the cropland protection scenario. In the Ganqing section of the Yellow River Basin, the area allocated for construction makes up a mere 0.22% of the total basin area, while cropland covers approximately 13%. Consequently, the potential for substantial expansion in the face of rapid development seems quite limited. Based on the outcomes of the pairing of habitat quality and land use change in each simulation scenario, the ecological protection scenario has the best coupling coordination and improvement effect. This is consistent with other scholars’ research on the upper reaches of the Yangtze River, the upper reaches of the Han River (Li Y., 2020), and the source of the Fen River (He J. et al., 2020). Therefore, to promote the coupled development of LULCC and habitat quality, based on the laws of economic and social development and natural laws in the Ganqing section of the Yellow River Basin, it is imperative to adhere to the ecological protection concept and incorporate it into land use spatial planning to further compare and analyze scenarios. The simulation results and foundational principles indicate that the sustainable development scenario, which considers economic growth, preservation of farmland, and ecological protection, is both more practical and viable (Geng et al., 2022).
The human–land system is an open system. The coupling of LULCC and habitat quality must not only consider the profound impact of short-range elements within the system, but also pay close attention to the impact of long-range elements outside the system (Ge Y. et al., 2020). This article explores the contemporary idea of process coupling, utilizing the coupling coordination degree model to gauge the synchronized advancement of LULCC and habitat quality. The long-range and near-remote coupling relationships between LULCC and habitat quality have not yet been considered. At the same time, this article considered the relationship between economic development, food security, and ecological security. The scenarios in this article outline the key issues to be resolved, but they lack clear identification of the driving factors behind the trade-offs among the three. Subsequently, it is essential to establish a correlation between the driving forces and habitat quality, creating a framework to delineate how these factors influence the economic development, food security, and ecological stability of the Yellow River Basin. This involves mapping out the trade-off relationships among these elements.
6 Conclusion
The study focuses on the Ganqing section of the Yellow River Basin, investigating the characteristics of land use changes and spatial-temporal patterns of habitat quality over a long-term series in ecologically vulnerable areas. It examines future habitat quality changes in four scenarios, i.e., natural development, cropland protection, ecological protection, and rapid development, exploring the coupling relationship of habitat quality with land use practices to provide a reference for ecological restoration and policy revision in the region. The main findings are as follows. (1) Grassland is the predominant land use type in the Ganqing section of the Yellow River Basin, accounting for over 70% of the total area. Spatially, the region is roughly divided along the line of Hainan-Huangnan-Gannan Tibetan Autonomous Prefecture, with forests and grasslands to the west of this line and cultivated and constructed lands to the east. (2) Compared to 2020, the areas of cropland, forest, and water bodies significantly increase in all four scenarios by 2030, while grassland and unused land decrease, particularly in cropland protection and rapid development scenarios which show a noticeable increase in constructed areas. In all scenarios, habitat quality in the Ganqing section of the Yellow River Basin continuously improves, evidenced by a decrease in areas of low value and a significant increase in areas of high value, with the ecological protection scenario showing the highest average habitat quality. (3) Highly coordinated and moderately coordinated development are the main types of coupled development between land use and habitat quality in the Ganqing section of the Yellow River Basin from 1990 to 2030. Spatially, this pattern is characterized as low in the southeast and high in the northwest, while imbalanced decline zones appear as patches or lines around the valley basin in the study area.
Data availability statement
The original contributions presented in the study are included in the article/supplementary material. Further inquiries can be directed to the corresponding author.
Author contributions
JY: Conceptualization, Supervision, Writing – original draft, Writing – review & editing. BX: Investigation, Visualization, Writing – review & editing. JZ: Data curation, Methodology, Writing – original draft.
Funding
The author(s) declare financial support was received for the research, authorship, and/or publication of this article. This research was funded by the Gansu Agricultural University Youth Mentor Support Fund (GAU-QDFC-2024-01).
Conflict of interest
The authors declare that the research was conducted in the absence of any commercial or financial relationships that could be construed as a potential conflict of interest.
Publisher’s note
All claims expressed in this article are solely those of the authors and do not necessarily represent those of their affiliated organizations, or those of the publisher, the editors and the reviewers. Any product that may be evaluated in this article, or claim that may be made by its manufacturer, is not guaranteed or endorsed by the publisher.
References
Aneseyee A. B., Noszczyk T., Soromessa T., Elias E. (2020). The InVEST habitat quality model associated with land use/cover changes: A qualitative case study of the Winike Watershed in the Omo-Gibe Basin, Southwest Ethiopia. Remote Sens. 12, 1103. doi: 10.3390/rs12071103
Avon C., Bergès L. (2016). Prioritization of habitat patches for landscape connectivity conservation differs between least-cost and resistance distances. Landsc. Ecol. 31, 1551–1565. doi: 10.1007/s10980-015-0336-8
Balasooriya B. L. W. K., Samson R., Mbikwa F., Vitharana U. W. A., Boeckx P., Van Meirvenne M. (2009). Biomonitoring of urban habitat quality by anatomical and chemical leaf characteristics. Environ. Exp. Bot. 65, 386–394. doi: 10.1016/j.envexpbot.2008.11.009
Boumans R., Roman J., Altman I., Kaufman L. (2015). The multiscale integrated model of ecosystem services (MIMES): Simulating the interactions of coupled human and natural systems. Ecosyst. Serv. 12, 30–41. doi: 10.1016/j.ecoser.2015.01.004
Cord A. F., Bartkowski B., Beckmann M., Dittrich A., Hermans-Neumann K., Kaim A., et al. (2017). Towards systematic analyses of ecosystem service trade-offs and synergies: Main concepts, methods, and the road ahead. Ecosystem Services 28, 264–272.
Franklin A. B., Anderson D. R., Gutiérrez R. J., Burnham K. P. (2000). Climate, habitat quality, and fitness in Northern Spotted Owl populations in northwestern California. Ecol. Monogr. 70 (4), 539–590. doi: 10.1890/0012-9615(2000)070[0539:CHQAFI]2.0.CO;2
Fu B. (1992). The evaluation of eco-environmental qualities in China. Chin. Population Resour. Environ. 1992, 48–54.
Ge Q., Fang C., Jiang D. (2020). Geographical missions and coupling ways between human and nature for the Beautiful China Initiative. Dili Xuebao/Acta Geogr. Sin. 75, 1109–1119. doi: 10.11821/dlxb202006001
Ge Y., Chang H., Stone B. (2020). Coupling urban land use planning and management with ecosystem services. Cities 99, 102601. doi: 10.1016/j.cities.2020.102601
Geng Y., Cheng G., Wang L., Xu W. (2022). Ecological protection and sustainable development: Exploring trade-offs in land use planning. Environ. Sci. Policy 125, 1–12. doi: 10.1016/j.envsci.2021.08.016
He J., Shi X. Y., Fu Y. J., Zhang Y. (2020). Multi-Scenario simulation of spatiotemporal evolution of land use and habitat quality in the source are of Fenhe River Basin. Res. Soil Water Conserv. 27, 250–258. doi: 10.13869/j.cnki.rswc.2020.05.033
He Q., Wong M., Lai D. (2020). Land use and habitat quality: A multidimensional analysis in the Fen River Basin. Landscape Urban Plann. 204, 103917. doi: 10.1016/j.landurbplan.2020.103917
Hillard E. M., Nielsen C. K., Groninger J. W. (2017). Swamp rabbits as indicators of wildlife habitat quality in bottomland hardwood forest ecosystems. Ecol. Indic. 79, 47–53. doi: 10.1016/j.ecolind.2017.03.024
Huang M. Y., Yue W. Z., Feng S. R., Zhang J. H. (2020). Spatial-temporal evolution of habitat quality and analysis of landscape patterns in Dabie Mountain area of west Anhui province based on In VEST model. Acta Ecologica Sin. 40, 2895–2906. doi: 10.5846/stxb201904260858
InVest 3.4.4. (2018). User’s Guide: Integrated Valuation of Environmental Services and Tradeoffs [M]. Stanford: The Natural Capital Project.
Kempton R. A. (1979). The structure of species abundance and measurement of diversity. Biometrics 35, 307. doi: 10.2307/2529952.=
Li P. (2020). Spatial and temporal dynamics of habitat quality in the upper reaches of the Han River under different land use scenarios. Ecol. Indic. 110, 105963. doi: 10.1016/j.ecolind.2019.105963
Li Y. (2020). Study on the trade-off and synergy relationship of ecosystem services in the upper reaches of Hanjiang River Basin based on multi-scenario simulation (Shanxi: Shaanxi Normal University).
Liang X., Liu X., Li X., Chen Y., Tian H., Yao Y. (2018). Delineating multi-scenario urban growth boundaries with a CA-based FLUS model and morphological method. Landsc. Urban Plan. 177, 47–63. doi: 10.1016/j.landurbplan.2018.04.016
Liu J., Zhang L., Zhang Q., Zhang G., Teng J. (2021). Predicting the surface urban heat island intensity of future urban green space development using a multi-scenario simulation. Sustain. Cities Soc 66, 102698. doi: 10.1016/j.scs.2020.102698
Liu X., Liang X., Li X., Xu X., Ou J., Chen Y., et al. (2017a). A future land use simulation model (FLUS) for simulating multiple land use scenarios by coupling human and natural effects. Landsc. Urban Plann. 168, 94–116. doi: 10.1016/j.landurbplan.2017.09.019
Liu X., Zhang Y., Wang L. (2017b). Application of CA models in urban land use simulation: a new approach for planning and management. J. Urban Manage. 16, 112–130. doi: 10.1016/j.jum.2017.01.002
Nematollahi S., Fakheran S., Kienast F., Jafari A. (2020). Application of InVEST habitat quality module in spatially vulnerability assessment of natural habitats (case study: Chaharmahal and Bakhtiari province, Iran). Environ. Monit. Assess. 192, 1–17. doi: 10.1007/s10661-020-08460-6
Shao Q., Zhao Z., Liu J., Fan J. (2010). “The characteristics of land cover and macroscopical ecology changes in the source region of three rivers in Qinghai-Tibet plateau during last 30 years,” in International Geoscience and Remote Sensing Symposium (IGARSS), Institute of Electrical and Electronics Engineers Inc., 363–366.
Sun B., Xu W., Xue J. C. (2021). Prediction of coupling and coordination between urbanization and eco-environment of urban agglomerations in Yellow River Basin, China. J. Earth Sci. Environ. 43, 887–896. doi: 10.19814/j.jese.2021.05033
Tang F., Fu M., Wang L., Zhang P. (2020). Land-use change in Changli County, China: Predicting its spatio-temporal evolution in habitat quality. Ecol. Indic. 117, 106719. doi: 10.1016/j.ecolind.2020.106719
Vigerstol K. L., Aukema J. E. (2011). A comparison of tools for modeling freshwater ecosystem services. J. Environ. Manage. 92, 2403–2409. doi: 10.1016/j.jenvman.2011.06.040
Wang Y., Fu B. T., Lyu Y. P., Yang K., Che Y. (2016). Assessment of the social values of ecosystem services based on SolVES model: A case study of Wusong PaoTaiwan Wetland Forest Park, Shanghai, China. Chin. J. Appl. Ecol. 27, 1767–1774. doi: 10.13287/j.1001-9332.201606.011
Wen Q., Lee J., Song X. (2017). Evaluating the effectiveness of urban growth boundaries using the CLUE-S model. Environ. Manage. 59, 418–434. doi: 10.1007/s00267-016-0797-y
Wen Y., Gong J. Z., Hu Y. Y., Hu Z. R. (2017). Simulation and analysis of urban land expansionconducted by ecological security. Geographical Res. 36, 11. doi: 10.11821/dlyj201703010
Wu D., Li H., Ai N., Huang T., Gu J. (2020). Predicting spatiotemporal changes in land use and habitat quality based on CA-Markov: A case study in central Ningxia, China. Chin. J. Eco-Agriculture 28, 1969–1978. doi: 10.13930/j.cnki.cjea.200221
Xiao P., Zhou Y., Li M., Xu J. (2023). Spatiotemporal patterns of habitat quality and its topographic gradient effects of Hubei Province based on the InVEST model. Environment, Development and Sustainability 25(7), 6419–6448.
Xie Y. C., Gong F., Zhang S. X., Ma X. C., Hu B. Q. (2018). Spatiotemporal change of landscape biodiversity based on inVEST model and remote sensing technology in the Bailong riverwatershed. Scientia Geographica Sin. 38, 979–986. doi: 10.13249/j.cnki.sgs.2018.06.018
Xing L., Xue M., Hu M. (2019). Dynamic simulation and assessment of the coupling coordination degree of the economy–resource–environment system: Case of Wuhan City in China. J. Environ. Manage. 230, 474–487. doi: 10.1016/j.jenvman.2018.09.065
Yang L. J., Zhang X. H., Pan J. H., Yang Y. C. (2021). Coupling coordination and interaction between urbanization and eco-environment in Cheng-Yu urban agglomeration, China. Chin. J. Appl. Ecol. 32, 993–1004. doi: 10.13287/j.1001-9332.202103.012
Yang Z., Kumar P., Zhang H., Li Z. (2021). Multi-scenario simulation of habitat quality in the Dongting Lake Basin: implications for sustainable land use planning. J. Environ. Manage. 277, 111367. doi: 10.1016/j.jenvman.2020.111367
Zhang X., Song W., Zhou L., Yang S., Liu L., Chen H. (2020a). Land use changes in the coastal zone of China’s Hebei Province and the corresponding impacts on habitat quality. Land Use Policy 99, 104957. doi: 10.1016/j.landusepol.2020.104957
Zhang X., Zhou J., Li G., Chen C., Li M., Luo J. (2020b). Spatial pattern reconstruction of regional habitat quality based on the simulation of land use changes from 1975 to 2010. J. Geogr. Sci. 30, 601–620. doi: 10.1007/s11442-020-1745-4
Zhang H., Lang Y. (2022). Quantifying and analyzing the responses of habitat quality to land use change in Guangdong province, China over the past 40 years. Land. 11(6):817. doi: 10.3390/land11060817
Keywords: coupled evolution, Ganqing section of the Yellow River Basin, habitat quality, land use change (LUCC) modeling, ecological protection
Citation: Yang J, Xie B and Zhou J (2024) Research on the coupled evolution of LULCC and habitat quality in the Ganqing section of the Yellow River Basin based on multi-scenario simulations. Front. Ecol. Evol. 12:1401291. doi: 10.3389/fevo.2024.1401291
Received: 15 March 2024; Accepted: 10 October 2024;
Published: 13 November 2024.
Edited by:
Luís Borda-de-Água, Centro de Investigacao em Biodiversidade e Recursos Geneticos (CIBIO-InBIO), PortugalReviewed by:
Shahid Ahmad Dar, University of Kashmir, IndiaSvitlana Delehan, Uzhhorod National University, Ukraine
Copyright © 2024 Yang, Xie and Zhou. This is an open-access article distributed under the terms of the Creative Commons Attribution License (CC BY). The use, distribution or reproduction in other forums is permitted, provided the original author(s) and the copyright owner(s) are credited and that the original publication in this journal is cited, in accordance with accepted academic practice. No use, distribution or reproduction is permitted which does not comply with these terms.
*Correspondence: Jie Yang, eWFuZ19qaWVAZ3NhdS5lZHUuY24=
 Jie Yang
 Baopeng Xie2