 Taylor Shaw
 Michael Scherer-Lorenzen
 Sandra Müller
95% of researchers rate our articles as excellent or good
Learn more about the work of our research integrity team to safeguard the quality of each article we publish.
Find out more
ORIGINAL RESEARCH article
Front. Ecol. Evol. , 20 August 2024
Sec. Population, Community, and Ecosystem Dynamics
Volume 12 - 2024 | https://doi.org/10.3389/fevo.2024.1387879
This article is part of the Research Topic Advances in Ecoacoustics - Volume II View all 7 articles
Introduction: Forests managed for timber production can also be managed for biodiversity conservation by retaining structures typical of old-growth forests, which provide heterogenous structures for forest-dwelling species, including birds. Ecoacoustic monitoring of forest birds is now a well-studied field, however the extent to which acoustic indices can reflect bird assemblage responses to stands of lower or higher structural heterogeneity is disputed.
Method: In this study, we acoustically surveyed 75 plots over two years in mature, previously managed forests and computed acoustic indices from the recordings. We first identified an acoustic index that significantly correlated with bird richness over more than one spring season. Next, we tested the response of bird richness to individual forest structural elements using linear regressions. We then repeated this analysis but combined the individual structural elements into one structural composition variable using an NMDS and gam smooth overlay, to compare the effect of individual forest structures versus overall forest heterogeneity on bird richness. We then repeated this analysis using our selected acoustic index, the Normalized Difference Soundscape Index (NDSI), to see if it followed the same patterns as bird richness in response to individual and collective forest structural elements.
Results: Our results showed that plots with high bird richness were also associated with high NDSI values, and high values of both variables occurred in plots with high structural heterogeneity (tree species richness, tree size variability, and snag height variability) and low amounts of standing and lying deadwood.
Discussion: Our findings suggest that once an acoustic index can be identified as a robust correlate of bird richness, it can serve as a proxy for the response of birds to differences in forest structural heterogeneity within a managed forest context. It is therefore possible for forest managers interested in conserving or increasing bird richness in their production forests to identify a robust acoustic index to track the response of bird richness to management decisions over time.
Forest structural heterogeneity is an important consideration for biodiversity conservation in forests managed for timber production (Bauhus et al., 2009; Gustafsson et al., 2012). Compared to old-growth forests, managed forests are typically more homogenous in structural elements, with low tree species richness, simplified understory complexity, homogenous tree age and a scarcity of old, large and dead trees (Fedrowitz et al., 2014). Although exceptions exist where managed forests can be rich in forest structures, across Europe managed forests are trending towards simplification and therefore approaches such as close-to-nature, continuous cover and retention forestry have been developed to promote structural complexity, and therefore biodiversity within managed forests (Franklin et al., 2002; Bürgi, 2015; Gustafsson et al., 2020). These approaches aim to provide structural components typically present in forests of late successional stages, such as large habitat trees, standing and lying dead wood, a complex understory and canopy gaps, combinations of which provide a continuity of niches and microhabitats in harvested stands that are important for forest-dwelling species at one or more stages in their life cycles (Blasi et al., 2010; Müller and Bütler, 2010; Paillet et al., 2010; Basile et al., 2020; Spînu et al., 2022).
In central European forests there is an increasing interest in evaluating how forest management decisions affect forest birds (Storch et al., 2020; Thorn et al., 2020; Basile et al., 2021a), particularly because birds are used as environmental and biodiversity indicators (Gregory et al., 2005; Devictor et al., 2008; Gregory et al., 2008). Forest birds have suffered mild continent-wide decline over the last 40 years (Burns et al., 2021) and consequently there is an ongoing effort to transition towards silvicultural approaches that benefit birds (e.g. Gutzat and Dormann, 2018; Vítková et al., 2018; Basile et al., 2019; Schulze et al., 2019; Gustafsson et al., 2020; Basile et al., 2021a). Links between forest structural elements and forest birds are also well-studied. Many species are sensitive to forestry-induced changes in forest structure and habitat loss (Helle and Järvinen, 1986; Shimelis et al., 2013; Versluijs et al., 2017). Structurally rich residual forest habitats are important refuges for bird diversity (Blake and Karr, 1987) and bird species richness has been found to increase with high structural diversity typical of mature forests (MacArthur and MacArthur, 1961; James and Wamer, 1982; Ishii et al., 2004; Díaz et al., 2005; Díaz, 2006; Kati et al., 2009; Culbert et al., 2013; Storch et al., 2023; Zeller et al., 2023).
In the last fifteen years, passive acoustic monitoring has been increasingly adopted as a bird monitoring tool, in part due to its ease of use and falling costs of equipment (Sueur et al., 2008; Sugai et al., 2019; Alcocer et al., 2022). This entails the use of automated recorders that do not require an operator to be present to make recordings. Traditional monitoring approaches such as point counts or line transects provide a visual cue for bird identification, but they also are subject to observer bias (Alldredge et al., 2006) and can cause flushing/avoidance effects through the presence of human observers (Darras et al., 2018). Automated recorders, on the other hand, can be in the field for much longer than human observers, monitoring multiple sites simultaneously without disturbing birds, producing standardised, permanent datasets across a wider frequency range than what humans can hear (Shaw et al., 2021b). Despite limitations in estimating abundance from recordings (Pérez-Granados and Traba, 2021), acoustic data has shown to provide valuable bird monitoring data and as such is being increasingly used, particularly for monitoring cryptic species of high conservation value such as capercaillie, which are sensitive to disturbance and otherwise difficult to survey (Abrahams and Denny, 2018; Abrahams, 2019).
Acoustic data is also one of a suite of solutions to the demand for more modernised, standardised monitoring data at large spatial scales (Muys et al., 2022). The processing of acoustic data is becoming more efficient, and therefore more scalable, making it a useful complement to traditional monitoring approaches (Shaw et al., 2022; Metcalf et al., 2023; Schwarzkopf et al., 2023). Efficiencies have been demonstrated through automatic species identification using machine learning (Kahl et al., 2021) and the computation of ecoacoustic indices, which capture the temporal- and frequency-related dynamics of acoustic energy that has been demonstrated to relate to the dynamics of bird vocal activity patterns (Bateman and Uzal, 2022). Ecoacoustic indices (hereafter acoustic indices), enable the efficient description of mass quantities of acoustic data that could not be processed manually and do not rely on identifying individual species from recordings. Acoustic indices have been found to correlate with multiple aspects of bird assemblages: they have been positively associated with diversity and abundance of biological sounds (Buxton et al., 2018; Pérez-Granados et al., 2019), forest island patch size (Müller et al., 2020), phylogenetic and functional diversity (Gasc et al., 2013), species composition (Müller et al., 2022), seasonal phenology (Buxton et al., 2016) and differences between land-use types (Dröge et al., 2021). Although these links have been demonstrated, they are not consistent across all studies; however, a meta-analysis by Alcocer et al. (2022) demonstrated that three indices, the Acoustic Complexity Index (ACI), Normalized Difference Soundscape Index (NDSI) and Entropy (H), are most robust across studies to significantly reflect biological diversity.
Ecoacoustic studies have not only investigated the relationship between acoustic indices and forest birds, but also forest structure, to better understand how acoustic monitoring can be used to assess habitat quality for birds. For example, the Bioacoustic Index (BIO) has been positively linked to higher canopy cover, canopy height and avian abundance (Boelman et al., 2007). Müller et al. (2020) found a positive relationship between ADI, bird richness, and vertical heterogeneity. Shaw et al. (2021a) reported that BIO and ACI reflected a composite index of forest structural complexity, as well as bird activity and richness. Burivalova et al. (2018; 2019) found that logging and reductions in forest cover indirectly affect acoustic indices by shaping the vocalising community. Other structural parameters that are known to significantly affect acoustic diversity via bird vocalisations include forest vegetation density and structure (Farina et al., 2015), stand age, canopy height (Turner et al., 2018), vegetation diversity (Dröge et al., 2021), canopy density, tree density and vegetation height (Bateman and Uzal, 2022).
As with bird richness, acoustic indices do not consistently reflect forest structural parameters across studies. Eldridge et al. (2018) reported that acoustic indices reflect bird richness in temperate but not tropical forests. In other cases, links between acoustic indices, birds and forest structure have been weak, negative, or altogether absent (Fuller et al., 2015; Turner et al., 2018; Atemasov and Atemasova, 2019; Doser et al., 2020; Bateman and Uzal, 2022). A review of all studies using one index (the Acoustic Complexity Index) published until 2020 showed that it significantly reflected bird diversity in 40% of forest-related studies and was significantly positively associated with at least one structural diversity metric in 78% of studies reported (Bateman and Uzal, 2022).
These inconsistencies between ecoacoustic studies have been attributed to site-specific differences of soundscapes in study areas, the loss of information when collapsing complex three-dimensional processes (frequency, time and amplitude) into one index, the presence of confounding sounds (e.g. wind, rain, traffic) that distort or mask signals of interest, as well as the lack of replication and methodological standardisation between studies (Ross et al., 2021; Alcocer et al., 2022; Bateman and Uzal, 2022). Across studies, this combination of confounds leads to differences in the strength of relationship between acoustic indices, local bird species richness and forest structural elements. As such, the suitability and sensitivity of acoustic indices to reflect local bird assemblages must first be assessed in each study area before being used as a bird monitoring tool. Thus, our study first sought to identify the best-performing acoustic index for our study area and validated its ability to monitor forest birds over more than one spring season (Step 1). This was done in a beech-spruce dominated mountainous central European forest with a longstanding history of conventional management practices. Next, we investigated if acoustic index values were indirectly related to forest structures via bird vocalisations. We did this by testing the relationship of bird richness to individual forest structures in separate models (Step 2). Next, we also tested the response of bird richness to a composite index of all the forest structures (Step 3), to learn if overall forest heterogeneity explains more variance in our independent variables than individual forest structures, which each alone contribute just one component of forest heterogeneity. Lastly, we repeated Steps 2 and 3 using our selected acoustic index, rather than bird richness, as the independent variable, to assess how well our acoustic index reflects the response of bird richness to individual forest elements (Step 4) and overall forest heterogeneity (Step 5).
This approach would provide insights into how forest managers could use the ecoacoustic approach to monitor the response of birds to the targeted retention of individual structural elements and the promotion of forest heterogeneity more broadly. For forest managers that are interested in adopting new, scalable monitoring techniques, this study presents the ecoacoustic monitoring approach in an applied context. Consistent with existing literature described above, we expected that an increase in bird richness would lead to increased acoustic index values (Step 1), and that bird richness would be positively related to individual and overall forest structural heterogeneity (Steps 2 and 3). Following the confirmation of those prerequisite assumptions, we hypothesised that acoustic index values would be indirectly, positively linked to forest structural heterogeneity (Steps 4 and 5), following similar patterns as the bird richness variable.
Our study area is located within the southern Black Forest, in the south-west of Germany. The Black Forest is characterised by large elevation gradients (120 – 1,493 m) and corresponding variation in mean annual temperature ranging from 4 °C to 10.4 °C (Gauer and Aldinger, 2005). It covers about 5,000 km², of which 75% are forested.
The study plots are part of the ConFoBi (Conservation of Forest Biodiversity in Multiple-Use Landscapes of Central Europe) research network, comprised of 135 one-hectare forest plots in a mix of even- and uneven-aged, selectively harvested continuous cover forests (Storch et al., 2020). These plots were selected to assess relationships between forest biodiversity and the retention of forest structural elements in a managed forest context. Among public state forests, including the study area, a retention program was launched (ForstBW, 2015) that obliges the retention of approximately 15 habitat trees per 3 ha in state forests. In addition, efforts to support forest biodiversity on private land include contractual nature conservation, advisory services, and subsidies (Storch et al., 2020).
All plots are in temperate mixed low montane forest dominated by Norway spruce (Picea abies (L.) H.Karst.), European beech (Fagus sylvatica L.) and silver fir (Abies alba MIll). The plots have mostly closed canopies and are comprised of mature stands > 70 yrs. In 2018, a subset of 39 plots were randomly selected for acoustic recording to identify the acoustic index that best represented bird diversity within the study area. In 2019, a larger random subset of plots was selected (n = 80) and the survey was repeated (Figure 1). Twenty-nine percent of the surveyed plots overlapped between the recording years (27 out of 92 plots).

Figure 1 Location of the sites surveyed during spring 2018 and 2019 in the southern Black Forest, Germany. White triangles indicate sites surveyed only in 2018 (n=12), black dots indicate sites surveyed only in 2019 (n=53), and grey diamonds indicate sites surveyed over both years (n=27). Plots have a minimum distance of 750 m to another plot.
We selected forest structural variables of known importance to forest bird diversity, and that also were collected in a 2017 live and dead wood tree species inventory (see Storch et al., 2020 for details). Our aim was to test our hypothesis with structural variables that are important to birds and also commonly quantified in national forest inventories, both in Germany (Kändler, 2006; Reise et al., 2019) and more widely across Europe (Motta, 2010; Gschwantner et al., 2016), to maintain relevancy for forest managers. Table 1 describes the final twelve variables selected to collectively describe plot-level forest structural heterogeneity, through diameter at breast height (DBH) and its standard deviation (DBH SD), tree species richness, ratio of coniferous to broadleaved species, tree density via basal area (BA) and number of living trees as well as standing and lying deadwood amount, size, height, and volume. We acknowledge that including a tree height variable would have provided a more complete picture of structural heterogeneity within our plots, but we were unable to do so due to lack of data available for this variable).

Table 1 Description of the twelve variables used in this study to describe plot-level structural heterogeneity and the scale at which they were computed.
Acoustic surveys took place in the spring of 2018 and 2019 using LUNILETTRONIK Soundscape Explorer Terrestrial prototypes (Lunilettronik Cooperativa, Fivizzano, Italy). The recorders were equipped with one external microphone (EMY-63 M/P), with a sensitivity of −38 ± 3 dB and a SNR > 60 dB (EMY-63 M/P, sensitivity (0 dB = 1 V Pa-1. 1 kHz), input voltage of the ADC: 0.75 Vrms (personal communication with Lunilettronik Coop.) Recorders were installed 1.5 m high on trees, with the microphone facing perpendicular to the slope, when slope was present (Shaw et al., 2021b). Recordings were taken one minute every ten minutes from 4:30 - 9:00, gain of 25 db and a 24 kHz sampling rate. Recordings were saved in 16-bit WAV format on SanDisk 32 GB SD cards.
Recorders were in the field from 18.05.2018 - 10.06.2018 and 12.04.2019 - 04.06.2019 for each campaign. Bad weather days (presence of high wind or rain) were identified and removed from the dataset (5 days in 2018 and 29 days in 2019; details in Appendix 1). Given that sunrise timing shifts over the course of spring, we calculated each recording’s time in relation to sunrise. We used the coordinates of each plot centre to generate the exact sunrise time (defined as when the top edge of the sun appears on the horizon) for each plot-day-year using the ‘suncalc’ package (Thieurmel and Elmarhraoui, 2019) in R statistical computing environment (R Core Team, 2022).
A sub-selection of the one-minute acoustic files were manually reviewed by one expert observer to identify all recorded bird vocalisations to species level. To increase the probability of capturing birds whose vocal activity peaks at different points in spring, we selected one day from early-, mid- and late-spring per plot for bioacoustic identification. The campaign in 2018 was shorter than in 2019, spanning 25 compared to 55 days, respectively. Therefore, two days were randomly selected for bioacoustic identification from the 2018 campaign (one day from the first and last week of recording period), corresponding with mid- and late-spring. Three days (one from the first, middle and last week of the recording period) were randomly selected from the 2019 campaign, corresponding to early-, mid- and late-spring.
For each selected day, we sub-selected eight files per day for bioacoustic identification. Using time in relation to sunrise, we selected files to cover pre-dawn (n = 4) and late morning (n = 4) periods. We selected one minute every 20 minutes for the pre-dawn and late morning hours (minutes since sunrise = -60, -40, -20, 0, 160, 180, 200, 220). This selection method increased our probability of detecting the widest range of species across one morning (Shaw et al., 2022), in addition to species most vocally active at different times throughout spring, due to their migratory (residents, short- and long-distance migrants) or breeding phenology. The total number of files (n = 2,544) resulted in 42.4 hours of identification in the lab. The expert reviewer identified all vocalisations to species level (n = 10,660 observations) with her corresponding certainty (0 - 100%). All identifications under 100% certainty were removed (n = 77), mostly due to vocalisations being too faint or masked by other sounds. The final variable of bird species richness was computed, defined as all the unique bird species identified per plot per spring year.
We calculated acoustic indices on for each 1-minute audio file and only on good weather days (n = 71,229 data points across both years; identification of good weather days provided in Appendix 1). We selected the full suite of acoustic indices commonly used in ecoacoustic studies and available in the ‘soundecology’ package (Villanueva-Rivera and Pijanowski, 2018); these included the Acoustic Complexity Index (Pieretti et al., 2011), Acoustic Diversity Index (Villanueva-Rivera et al., 2011), Bioacoustic Index (Boelman et al., 2007), Evenness Index (Villanueva-Rivera et al., 2011) and Normalized Difference Soundscape Index (Kasten et al., 2012). All default settings were used for index computation, except for the ACI, for which we set the minimum frequency at 2 kHz, to automatically filter low-frequency noise that was observed in our files. We then filtered the dataset by retaining index values from recordings within 60 minutes before sunset and 220 minutes after sunset, corresponding with the shift in sunrise and the timeframe from which bioacoustic identifications were made. Lastly, we calculated the mean acoustic index values per plot, to eliminate the temporal autocorrelation in the dataset, as suggested in best practice guidelines for the suite of acoustic indices (Bradfer-Lawrence et al., 2019; 2023). Our final set of ecoacoustic variables was the mean acoustic index value per plot, per spring year, for the five acoustic indices.
All analyses were made in R statistical computing environment. Because the strength of the relationship between acoustic indices and bird richness varies across studies (Alcocer et al., 2022), we first conducted a Pearson’s correlation analysis between each acoustic index and bird richness in the 2018 dataset to identify the acoustic index that was most strongly correlated with bird richness in our study area (Step 1), using the ‘stats’ and ‘corrplot’ packages (Wei and Simko, 2021; R Core Team, 2022). Once that index was identified, we repeated the process on the 2019 dataset, to ensure the index’s reliability over a second year of monitoring. Interannual reliability is important because bird assemblages and their activity can vary; in our study area these years were notably different in terms of rainfall and temperature (2018 was a drought year). Only indices that were significantly correlated with bird abundance in both years were selected for further analysis.
Once we identified the most suitable index to reflect bird species richness in our study environment (Step 1), we used the 2019 data for our main investigation of how structural complexity affects bird richness (Step 2-3) and acoustic index values (Steps 4-5). We first aimed to assess which individual structures, if any, were significantly linked to bird richness (Step 2). To test the relative effects of each structural variable separately, we built twelve linear regression models with the ‘stats’ package and evaluated their relative effects on bird richness using an information-theoretic approach (Burnham and Anderson, 1998) using the ‘AICcmodavg’ package (Mazerolle, 2020). This approach allows for the identification of the ‘best’ model in the set of candidate models, which has highest predictive value, with the lowest corrected Akaike information criterion (AICc) score (Akaike, 1998; Burnham and Anderson, 1998). The Akaike weight (wi) describes what percentage of the time, if this study were repeated many times, a given model would be the optimal model (lowest AICc), given the available data (Garamszegi, 2011). Model diagnostics were performed with the ‘DHARMa’ package and model residuals were checked for spatial autocorrelation using the ‘testSpatialAutocorrelation’ function (Hartig, 2022). Any models showing significant autocorrelation via the Moran’s I test were further investigated (see Appendix 2).
The values of each structural variable were scaled between 0 and 1, to facilitate the comparison of effect size between models. Nine out of twelve variables were log- or square root-transformed, to meet assumptions of normality for linear regressions. Complete structural data was available for 75 of the 80 research plots from 2019; only these data points were used in our models. We assessed spatial autocorrelation in our models using the ‘DHARMa’ package (Hartig, 2022), given that the plots were not evenly distributed throughout the study area (Figure 1). We conducted a Pearson’s correlation using the ‘corrplot and ‘qgraph’ packages (Epskamp et al., 2012; Wei and Simko, 2021) to assess the correlation coefficients of our structural variables, to aid in our interpretation of model results.
Next, we evaluated the combined effect of structural variables on bird richness (Step 3). We conducted a non-metric multidimensional scaling (NMDS) analysis based on Euclidean distance, which can coerce the data into two ordination axes. We then assessed the relationship between the combined structural variables and bird richness by fitting and plotting a generalised additive model (GAM) using a 2D surface smooth of bird richness values onto the ordination plot. This analysis was done with the ‘vegan’ package (Oksanen et al., 2022), using the ‘ordisurf’ command and a Gaussian distribution.
Lastly, we repeated Steps 2 and 3 using the selected acoustic index as the independent variable, in response to individual forest structural elements (Step 4) and overall structural heterogeneity (Step 5), which enabled us to evaluate potential similarities or differences in both dependent variables’ respective responses to forest structural elements.
Across 39 plots in 2018, bird richness ranged from 10-19. The NDSI showed the highest and only significant correlation to bird richness, with a correlation coefficient of 0.316 and p-value of 0.049 (Figure 2). We found non-significant correlation coefficients for ACI, ADI, AEI and BIO, being 0.032, -0.024, 0.060 and 0.267, respectively. The NDSI, therefore, was selected for further analysis with the second year of data (Step 1). Across 80 plots in 2019, bird richness ranged from 4-25, and NDSI values for the same year ranged from -0.02 to 0.82. The significant positive correlation between the NDSI and bird richness held for the 2019 dataset: the correlation coefficient was 0.510, p-value < 0.001, a stronger relationship than the previous year. The first step in this study was to confirm the assumption that our hypothesis is built upon, that bird richness is significantly positively related to acoustic diversity (quantified by a robust acoustic index), which we confirmed with the NDSI.
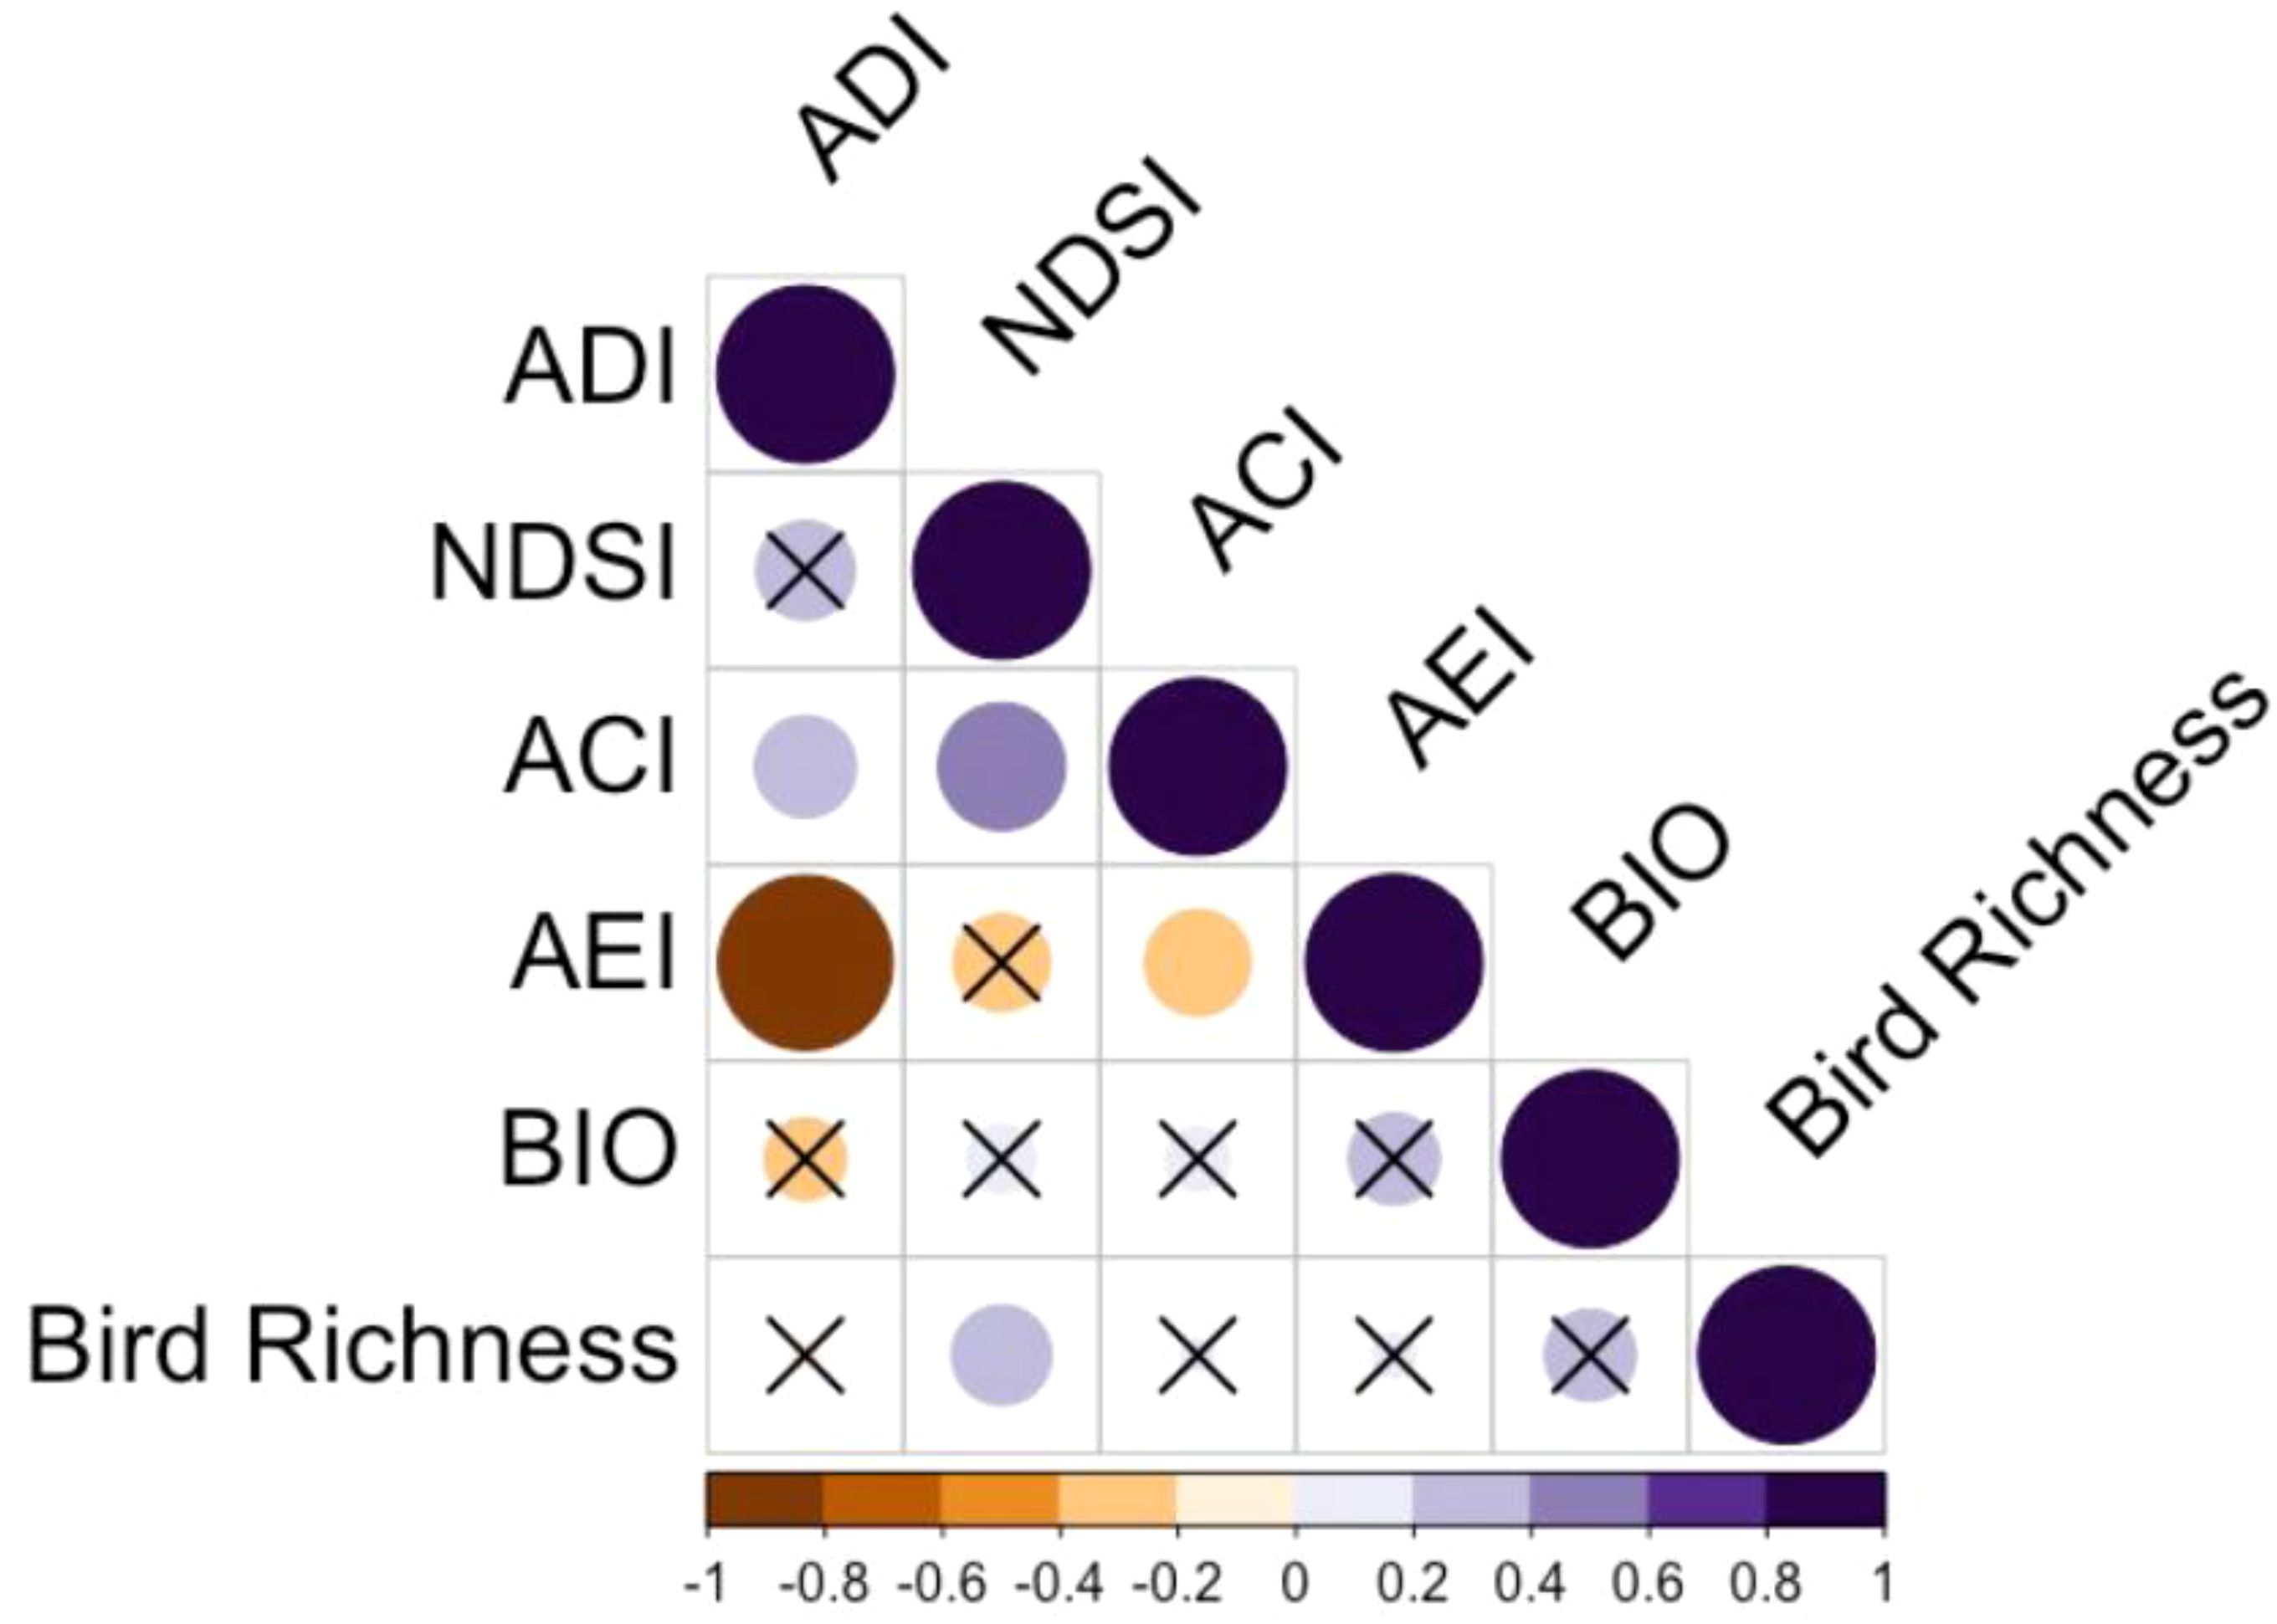
Figure 2 Pearson correlation plot of five acoustic indices and bird species richness for the 2018 spring season. The size and darkness of each cell represent correlation strength. Orange cells represent a negative correlation, purple cells represent a positive correlation, and darker orange and purple colours indicate stronger negative and positive correlations, respectively. Cells containing an ‘X’ represent non-significant correlations at the 95% confidence level.
Next, we sought to identify which individual structures, if any, were significantly linked to bird richness (Step 2). Our information theoretic approach used mean bird richness values per plot as the dependent variable and one structural variable at a time as the independent variable, resulting in twelve models (Table 2). Tree species richness was the best performing model and the only variable that significantly affected bird richness, although variance explained was relatively low (adjusted R2 = 0.08; Figure 3). We found evidence of spatial autocorrelation (Moran’s I test < 0.05) in no models except in the tree richness model, which showed a mild effect (estimate versus expected: -0.07, -0.01, p-value = 0.02). We did not alter this model’s structure, however, to enable its comparison with other models in Table 2 (see Appendix 2 for details and justification).

Table 2 Summary of candidate bird richness models ranked by lowest AICc value.

Figure 3 Linear regression of the effect of tree species richness on bird richness, the only individual forest structure model that significantly affected bird richness. Grey band indicates the 95% confidence interval.
The NMDS of the twelve structural variables (Step 3) successfully converged with a stress value of 0.177, which is considered a satisfactory representation of the plots relative to each other when reduced to two dimensions (Clarke, 1993). The gam smooth of bird richness values onto the NMDS ordination revealed a significant effect of aggregate structural heterogeneity on bird richness (p-value 0.001, adjusted R2 0.20. Highest bird richness values were associated with high tree richness, tree age variability (DBH SD) and snag height variability, all which describe stand-level structural heterogeneity. Moderately high bird richness was observed in plots with larger trees (mean DBH), taller standing dead trees (snag height) and plots that were generally denser (BA). Bird richness was lowest in plots with high conifer share, snag DBH mean and SD and lying deadwood volume (Figure 4).
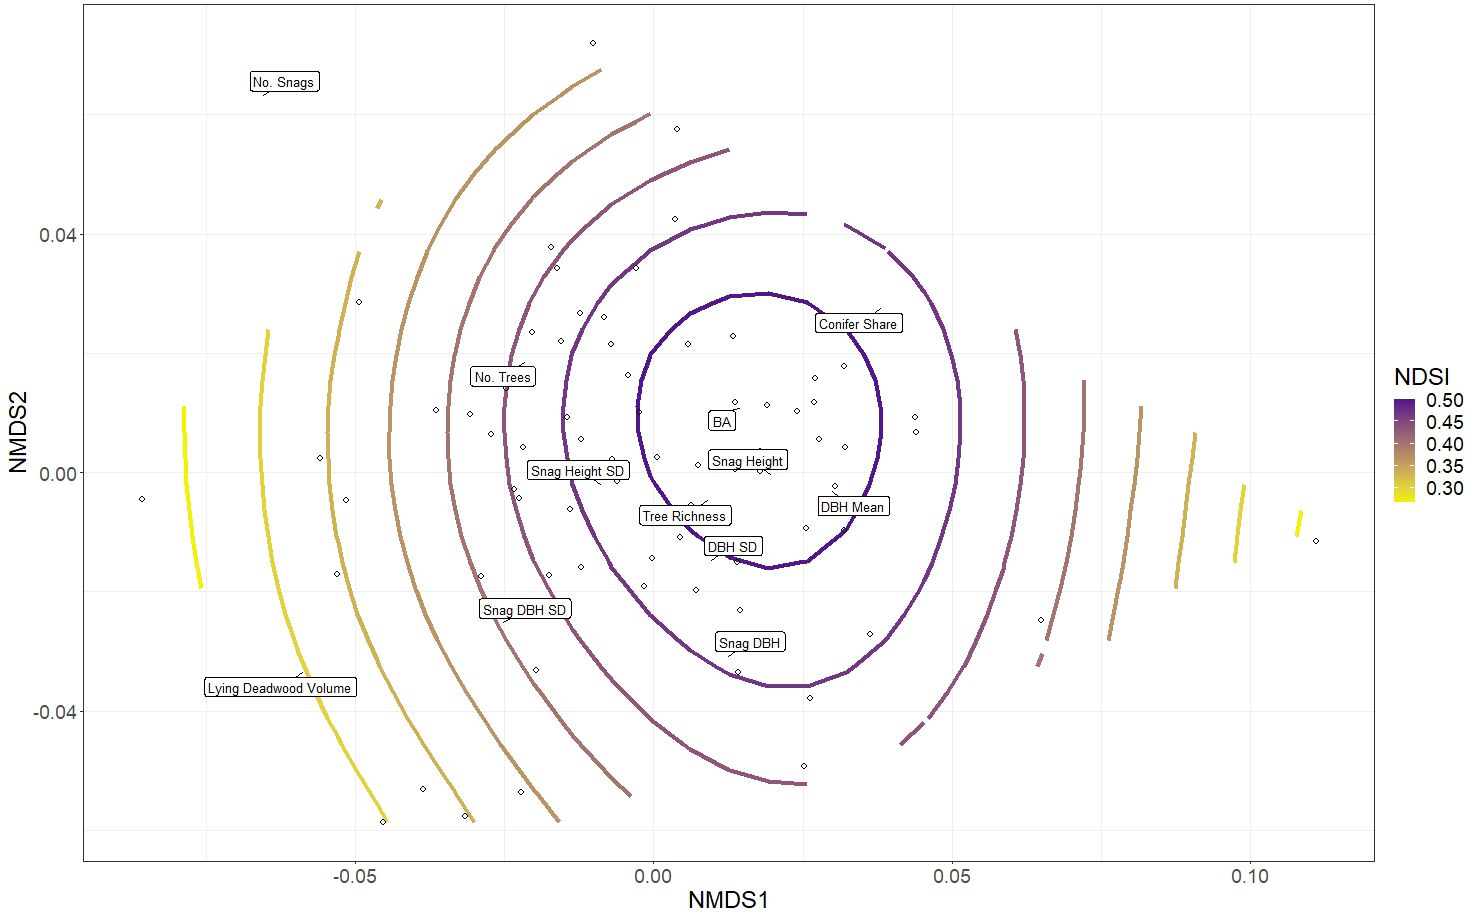
Figure 4 Non-metric multidimensional scaling (NMDS) of forest structural elements listed in Table 1, together which describe aspects of stand structural heterogeneity. The open circles depict the distribution of the 75 research plots in ordination space grouped according to their similarity to one another; each plot’s proximity to a forest structure’s label (exact location denoted by black lines) indicates its relative value associated with that structure (plots closer to a particular label have higher values of that structural parameter). The colour ramp indicates the general additive model (gam) smooth overlay, modelling the distribution of bird richness values across the plots.
When we repeated the individual models with the NDSI as the dependent variable (Step 4), the best-performing models were the standard deviation of DBH, standard deviation of snag DBH, snag DBH and lying deadwood volume, in decreasing order (Figure 5), which all showed significant negative effects on the NDSI (Table 3). These models, however, also explained little variance (adjusted R2 = 0.08, 0.08, 0.06 and 0.04, respectively). No other structural variables significantly affected the NDSI, and we found no evidence of spatial autocorrelation in these models.
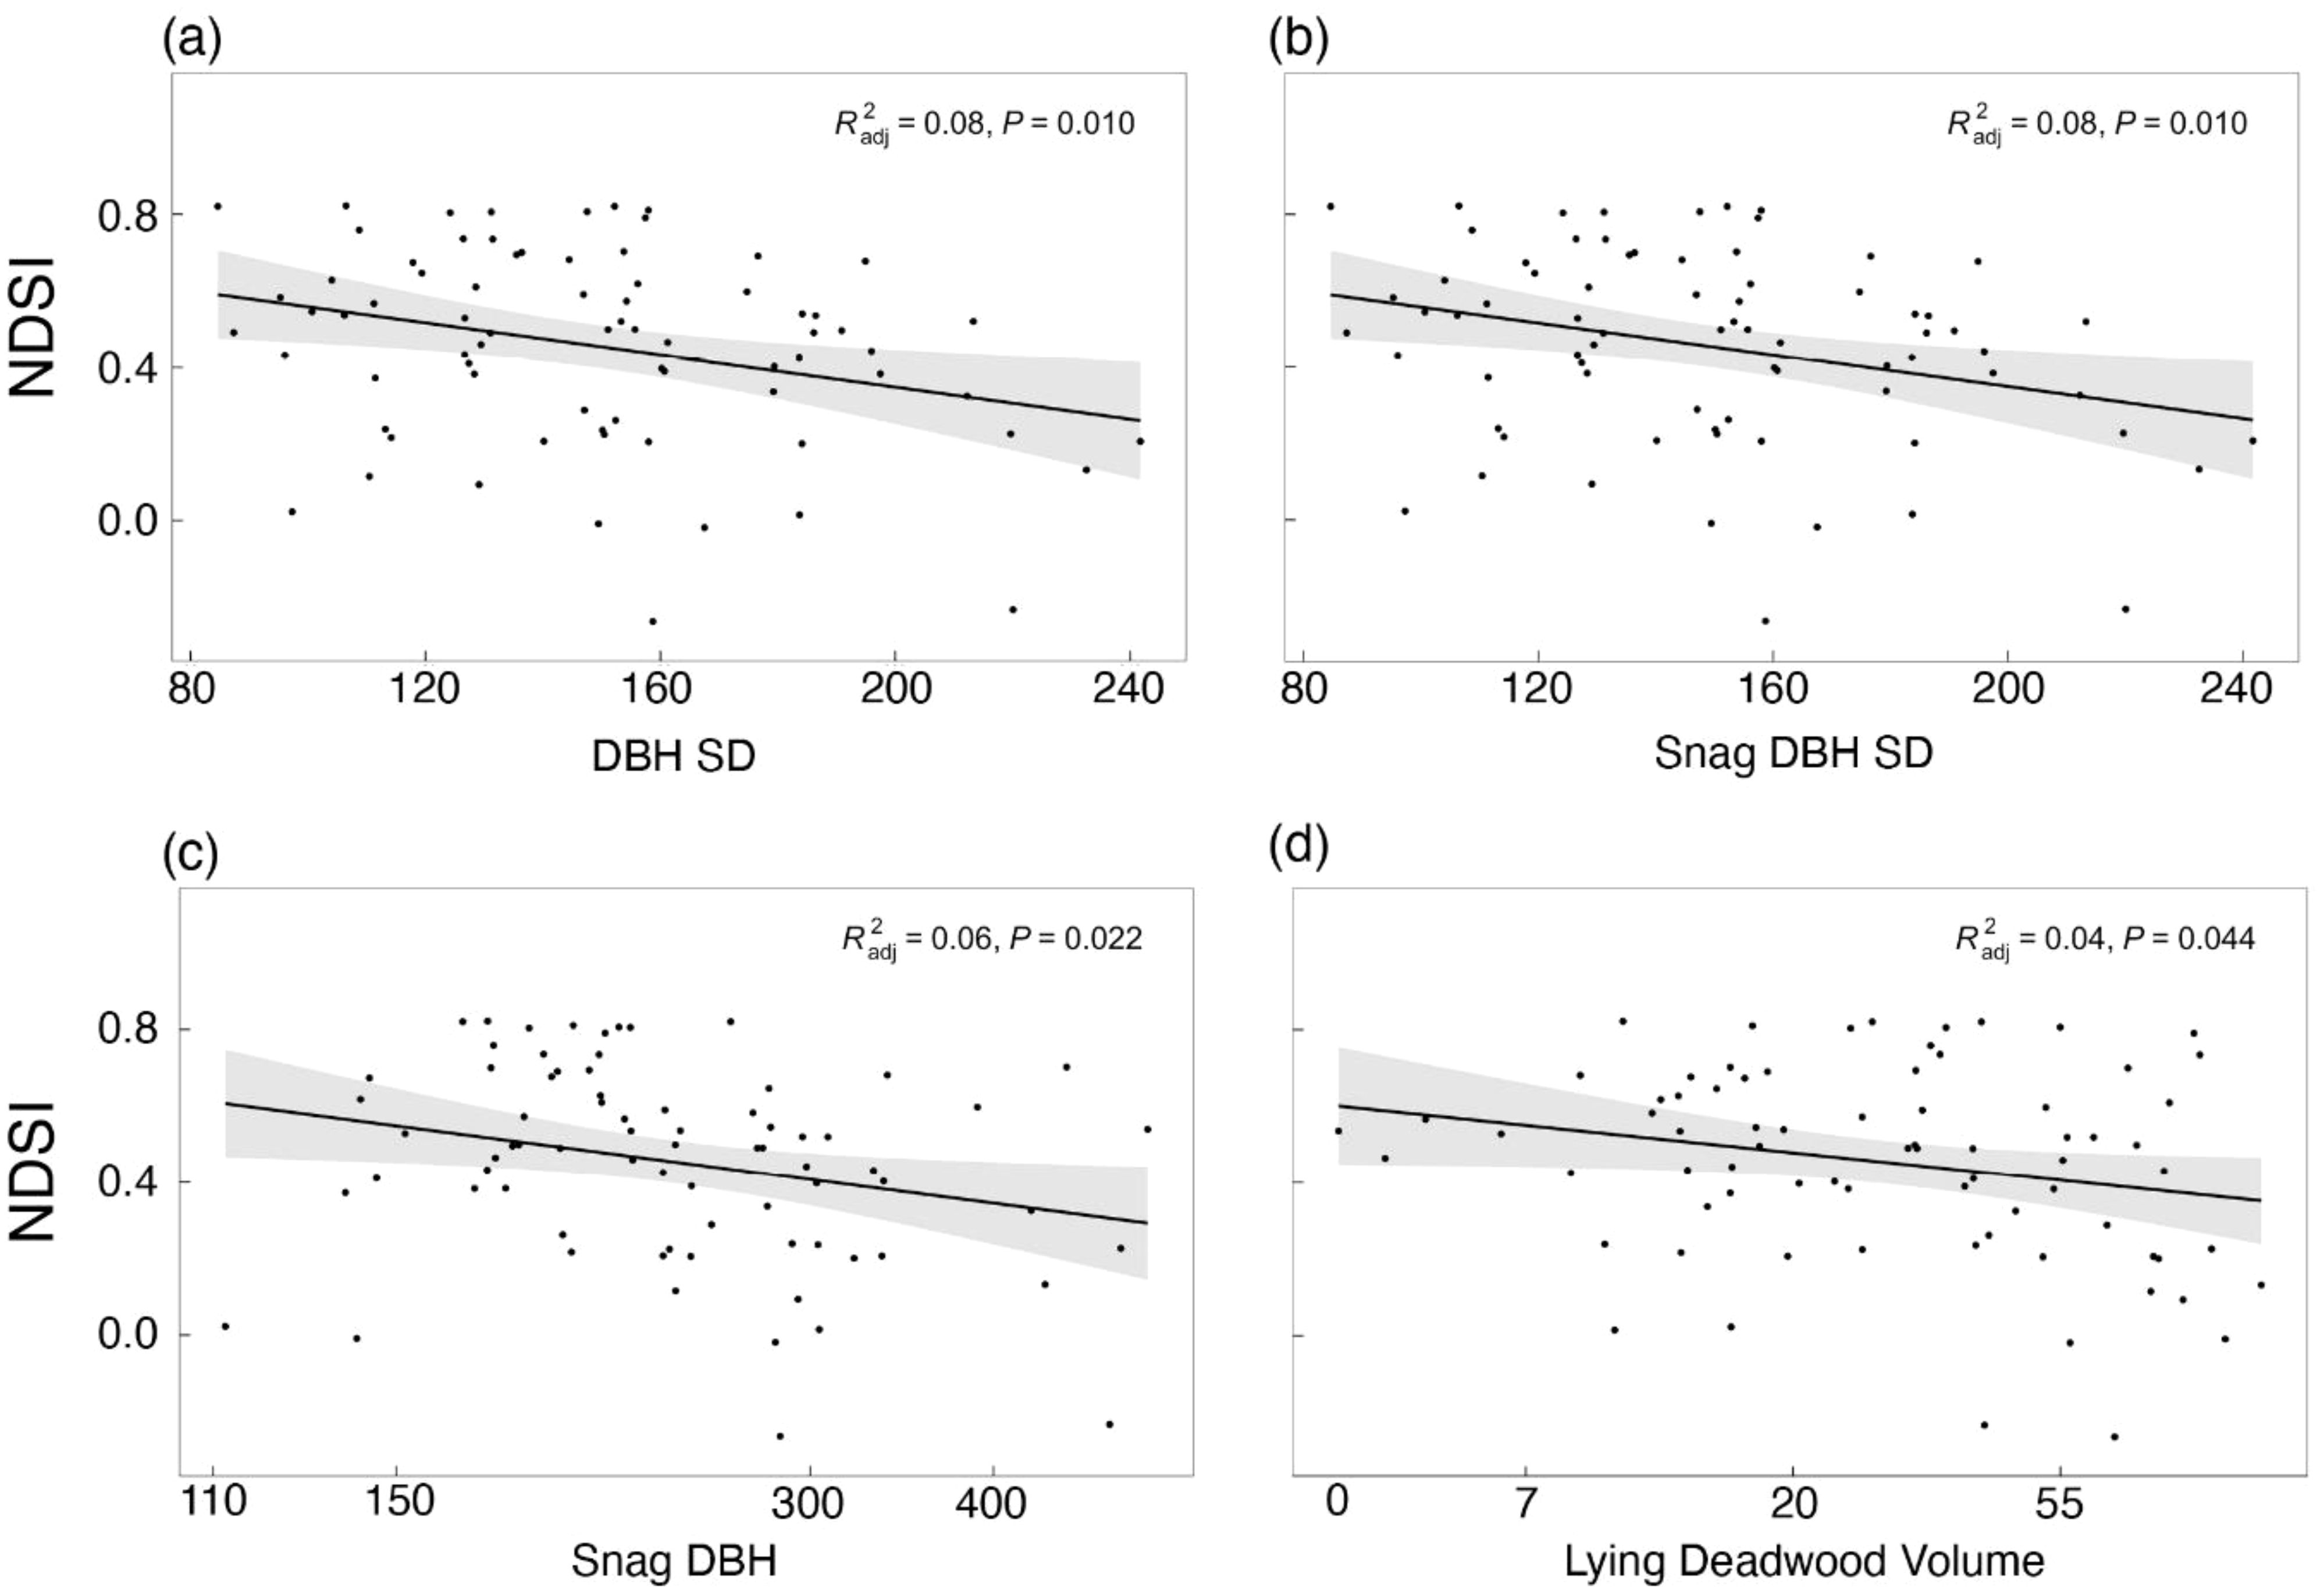
Figure 5 Linear regression of the NDSI in response to (A) diameter at breast height standard deviation (DBH SD), (B) snag DBH, (C) lying deadwood volume and (D) snag DBH SD. Grey bands indicate the 95% confidence interval.
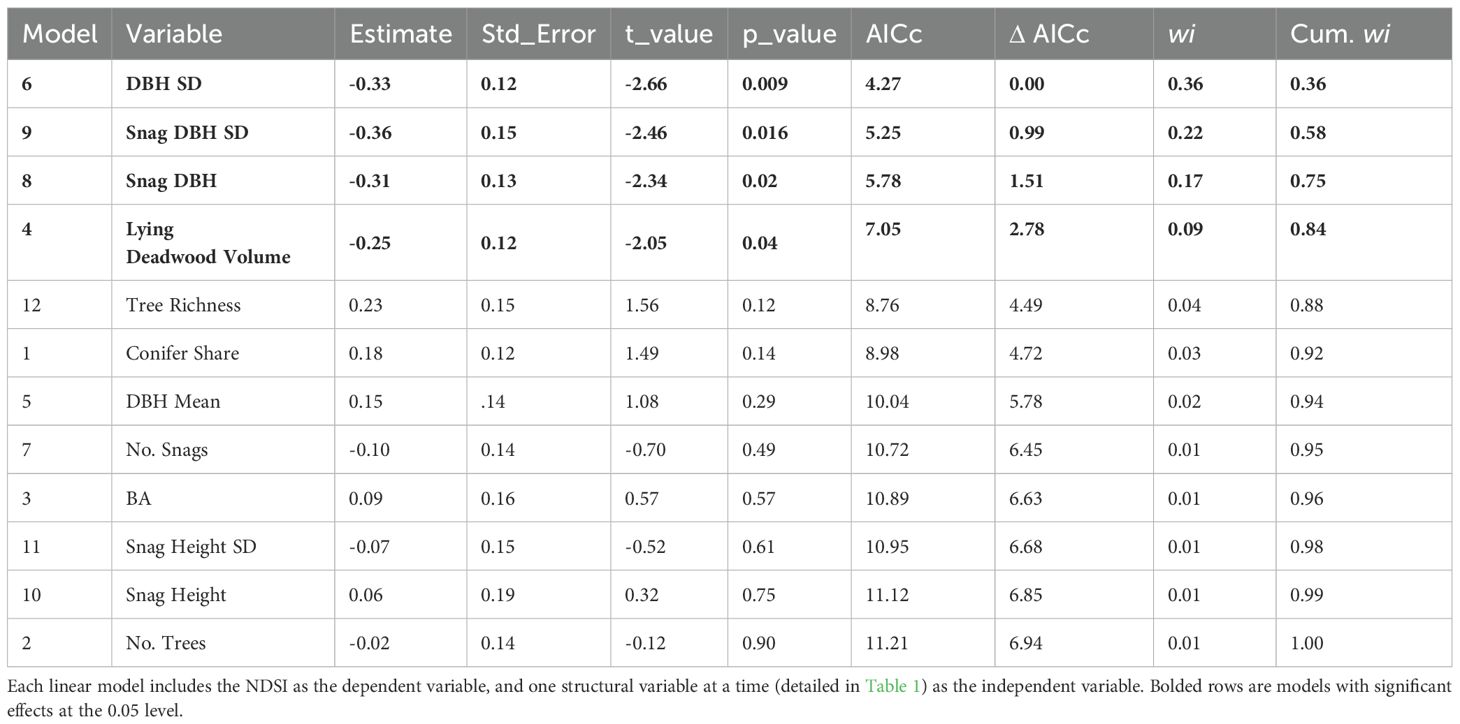
Table 3 Summary of candidate NDSI models ranked by lowest AICc value.
Compared to the bird richness models (Step 2), we observed a clear divergence between the structures that significantly affected NDSI values (Figure 5) versus those that affected bird richness (Figure 3). Additionally, the valence of the variables differed by dependent variable: the best-performing bird richness model showed a positive effect on bird richness, while the best-performing NDSI models showed a negative effect on NDSI values.
The Pearson correlation analysis between all structural variables described a complex web of correlations (Figure 6), which allowed us to interpret model results between bird richness and the NDSI. Tree species richness, the significant variable positively affecting bird richness, was negatively correlated with DBH SD, the variable with the strongest negative affect on NDSI values. All four variables that negatively affected NDSI values (snag DBH SD, DBH SD, snag DBH and lying deadwood volume) were positively correlated with one another.
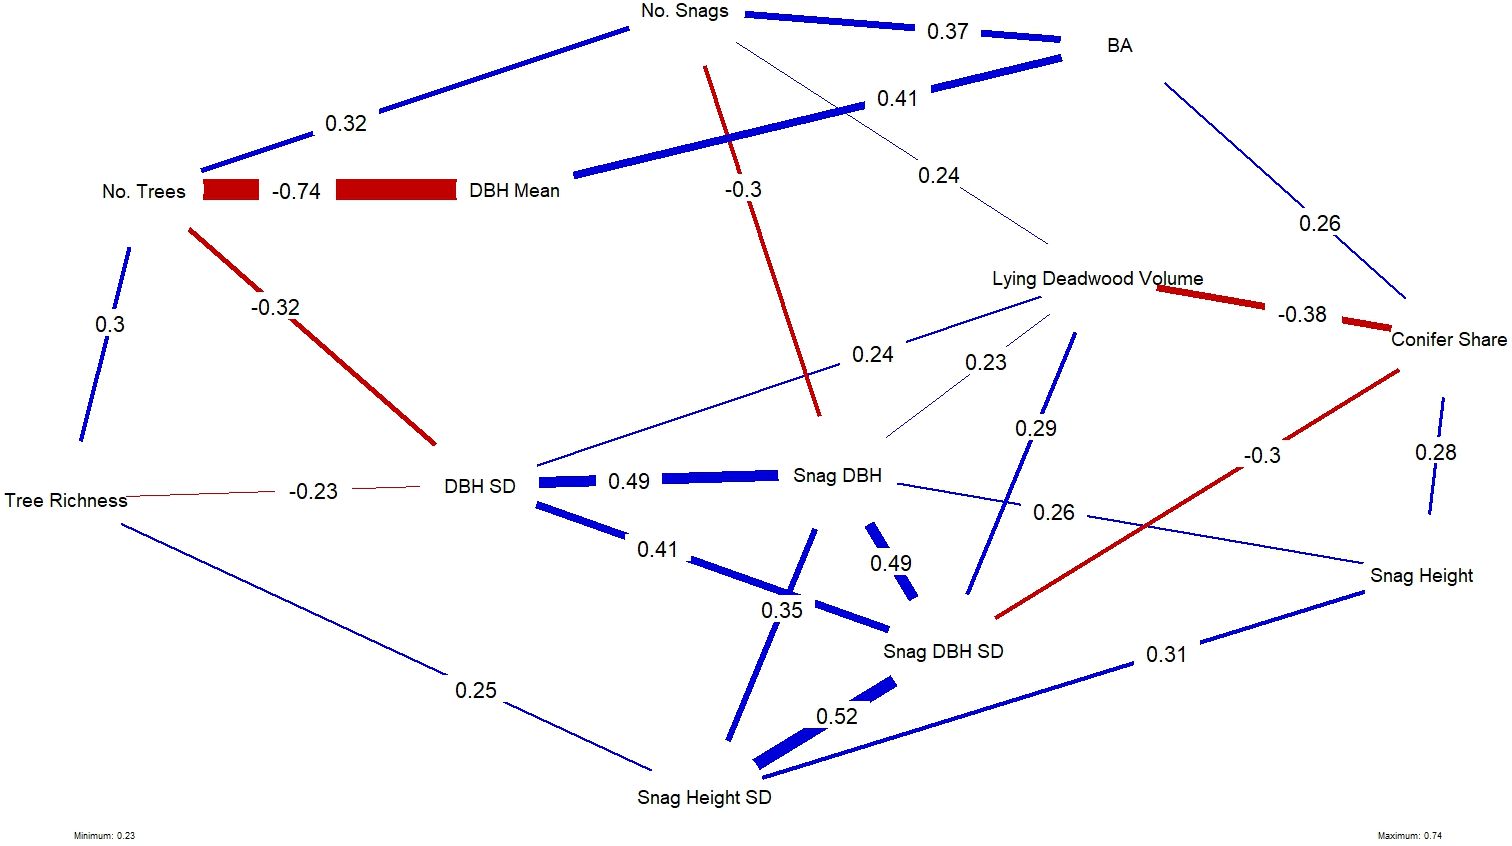
Figure 6 Plotted network of the statistically significant correlations, where significance is denoted at the p < 0.05 threshold, between all forest structural variables used in this study. Line thickness and their associated numbers indicate the strength of the correlation; blue lines and red lines indicate positive and negative correlations, respectively.
Average tree size (mean DBH) and number of trees were strongly negatively correlated, which is intuitive, as younger forests tend to be denser. Other notable relationships were between deadwood variables: snag height SD was positively correlated with snag height, snag DBH and DBH SD. Plots with high deadwood volume were negatively correlated with conifer share, meaning that high deadwood volume occurred in plots with more broadleaved trees species, while taller standing deadwood (snag height) was more likely to occur on plots with more conifers.
When repeating the NMDS analysis with NDSI (Step 5), we observed a very similar pattern to the bird richness GAM overlay, with high NDSI values significantly associated with the same plots as high bird richness (p-value 0.01, adjusted R2 0.11; Figure 7). Comparing the bird richness model to the NDSI model (Figures 4 vs 7), the smooths diverged in two minor ways: plots with higher lying deadwood volume and number of snags had relatively moderate bird richness, while in those plots NDSI values continued a decreasing trend, skewing the otherwise similar shapes of both NMDS plots (Figure 7). Secondly, highest NDSI values were predicted to occur in similar plots as for bird richness, although they were less associated with snag height SD and shifted slightly to the right of the plot, centring instead around plots with high basal area, snag height and mean DBH.
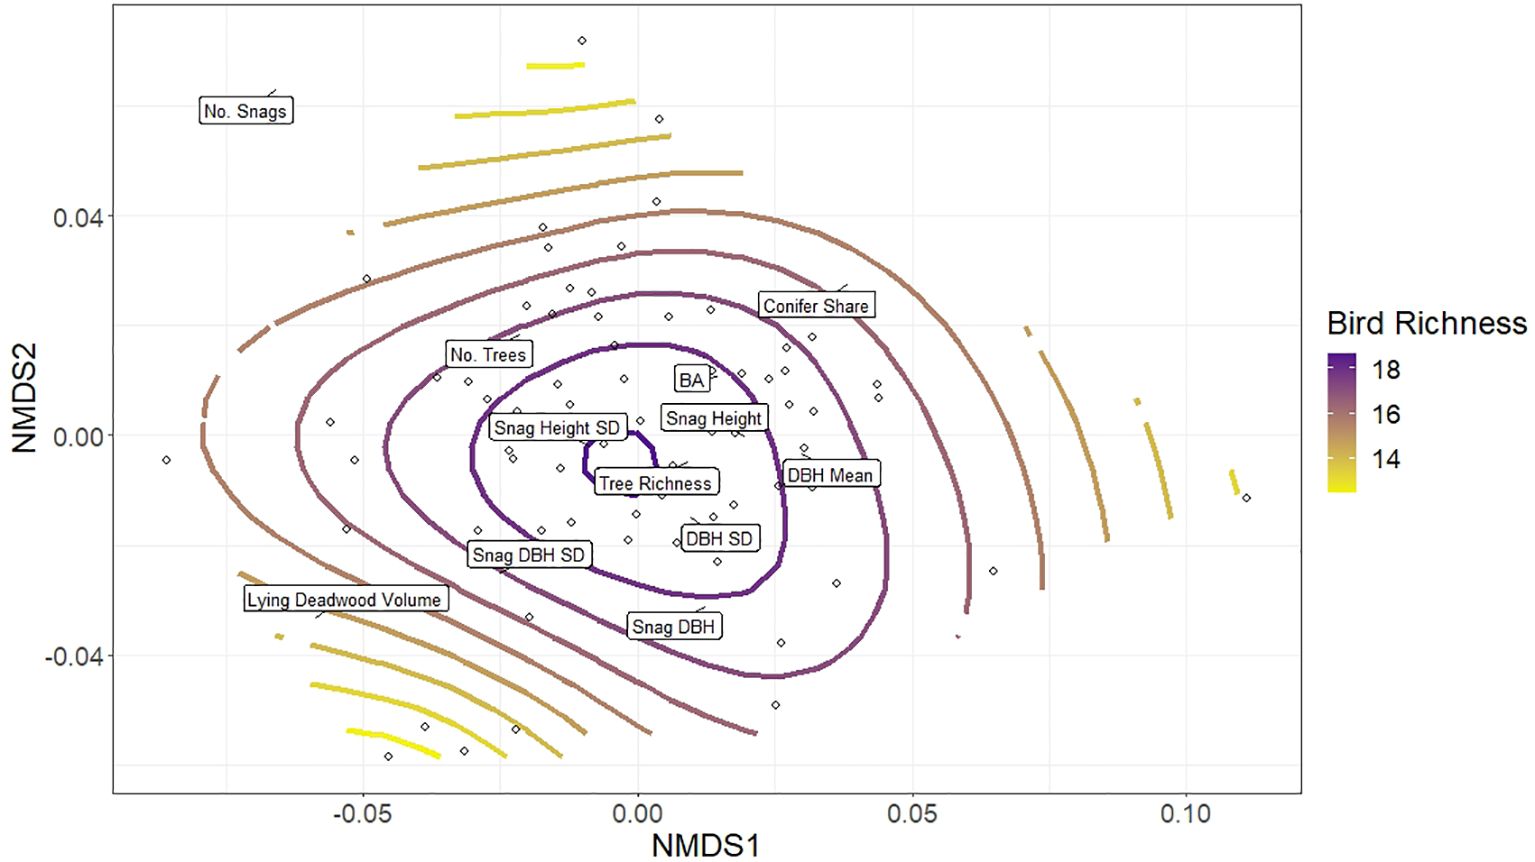
Figure 7 Non-metric multidimensional scaling (NMDS) of forest structural elements listed in Table 1, together which describe aspects of stand structural heterogeneity. The open circles depict the distribution of the 75 research plots in ordination space grouped according to their similarity to one another; each plot’s proximity to a forest structure’s label (exact location denoted by black lines) indicates its relative value associated with that structure (plots closer to a particular label have higher values of that structural parameter). The colour ramp indicates the general additive model (gam) smooth overlay, modelling the distribution of NDSI values across the plots.
In our study area, we identified the NDSI as the acoustic index that most strongly and significantly correlated with bird richness across two years (Step 1). The median NDSI value was 0.49, with a range from -0.02 to 0.82, indicating that they were derived from recordings comprised primarily of biological, rather than anthropogenic noise, further substantiating the link between observed bird richness and acoustic indices (see full elaboration of this point in Appendix 4). This correlation was stronger in the second year, when data was collected across larger spatial and temporal scales, there was a larger gradient of bird richness and there was no drought.
Among all forest structural variables, tree species richness had a significant positive effect and was the strongest and only variable explaining bird richness (Step 2). When repeating the analysis with the NDSI as the dependent variable (Step 4), variations in NDSI values were significantly yet slightly explained by DBH SD, snag DBH SD, snag DBH and lying deadwood volume, in a negative relationship. These variables were all significantly positively correlated with one another (Figure 6; full correlation matrix can be found in Appendix 3). Tree richness and DBH SD were negatively correlated in our study area, suggesting that bird richness and NDSI follow similar patterns across the surveyed plots, but responded to different individual structures.
We observed a consistent pattern, however, between both bird richness and the NDSI to the overall structural composition of plots (Steps 3 and 5), which was associated primarily with high tree richness, snag height SD, mean DBH and DBH SD. The structural composition models explained slightly more variance than any individual structural model, for both bird richness and NDSI datasets (bird richness adjusted R² = 0.21 using the NMDS, compared to 0.08 in best individual model; NDSI adjusted R² = 0.11 using the NMDS, compared to 0.08 in best individual model). Our results, therefore, provide supporting evidence that once an acoustic index is a priori identified as a robust correlate for bird richness (in our case, the NDSI), it can reflect the response of bird richness to a forest stand’s general structural composition in a managed temperate forest context. However, as acoustic indices and bird richness are only proxies to each other, they do not respond to each individual forest structure in precisely the same way, on which we elaborate below.
Confirming our assumption, bird richness showed a significant positive response to tree species richness (linear regression, Figure 2) and structural heterogeneity generally (NMDS gam smooth, Figure 4). Tree species richness had the strongest and only significant effect on bird richness in our set of candidate models, consistent with previous findings from other temperate (Fuller, 2000; Poulsen, 2002; Hanle et al., 2020) and boreal European forests (Versluijs et al., 2019). Other studies have shown that stands with higher tree species richness generally show higher canopy packing due to larger crowns of trees growing in mixed stands than in pure stands (Jucker et al., 2015), which increases stand structural complexity (Pretzsch, 2014). Previous research in our study area confirmed that tree richness is significantly positively correlated with understory and shrub layer species richness (data made available by Helbach et al., 2022). A diversity of vegetation in these lower strata provide a higher diversity of resources and leaf architecture at the stand level. This structural complexity increases opportunities for concealment and nesting on the ground or in shrubs and increase food supply from invertebrates, seeds or fruits, which have been linked to higher bird richness (Robinson and Holmes, 1982; Holmes and Schultz, 1988; Whelan, 2001; Muiruri et al., 2016; Shutt et al., 2018; Adams and Matthews, 2019; Hanle et al., 2020). Species-specific preferences for tree and shrub species have been observed in birds (Holmes and Robinson, 1981; Gabbe et al., 2002), thus it is likely that the increase in diversity of tree species richness and its associated understory plants would result in a greater diversity of birds in our plots (“diversity-begets-diversity”; San Roman and Wagner, 2021).
According to the NMDS model, bird richness was predicted to decrease in plots with increasing share of conifers. This is consistent with other research in managed European forests (Czeszczewik et al., 2015; Kebrle et al., 2021; Basile et al., 2021b; Zeller et al., 2023). Forests with higher percentage of broadleaved species host greater abundances of lepidoptera larvae (Summerville and Crist, 2003), an important source of protein for birds and their chicks in the breeding season. Indeed, an increase of broadleaved species in an otherwise conifer-dominated landscape—as is the case in our study area—generally benefits the entire bird assemblage via its provisioning of diversified food sources, most notably defoliating larvae (Vélová et al., 2021). This does not apply to all species, however, such as the goldcrest (Regulus regulus), crested tit (Lophophanes cristatus) or seedeaters like the Eurasian bullfinch (Pyrrhula pyrrhula), whose nesting or food preferences are specialised to conifers (Mikusiński et al., 2018; Basile et al., 2021b).
Contrary to our expectations, bird richness did not increase with deadwood variables. Rather, variables representing deadwood amount and variability (lying deadwood volume, number of snags and snag DBH SD) were non-significant as single predictors of bird diversity. These features were also associated with lower bird richness in the NMDS model, likely because plots associated with higher deadwood were different from the plots that otherwise had higher structural heterogeneity (tree species richness, DBH mean and SD, snag height, etc. in Figure 4) Deadwood is not an essential component for all forest birds, but rather for the guild of primary and secondary cavity nesters, such as woodpeckers, tits, owls, nuthatches and treecreepers (Mikusiński et al., 2018). In natural forests, high amounts of deadwood are often associated with other structural features contributing to structural heterogeneity (Bobiec, 2002; Hedwall and Mikusiński, 2015), but in our study area that has a history of forest management, the plots with high amounts of standing and lying deadwood were not the same plots that have a higher diversity of tree species and age classes, each which provision different microhabitats (Spînu et al., 2022). In our area, plots with high amounts of deadwood would not necessarily provide a sufficient diversity of additional niches for species from other nesting and foraging guilds to affect the richness of the entire bird assemblage (i.e. bird richness values), but more likely increase abundances of species that are reliant on deadwood.
Basile et al. (2021b) found in our study area that local structures were insufficient for predicting bird diversity, and that landscape-scale metrics such as broadleaf cover in the surrounding 5 – 25 km² and distance between forest patches also partially predict stand-level bird richness. Indeed, patterns of spatial autocorrelation indicate slight landscape-scale patterning in bird richness values, albeit mostly non-statistically significant (Appendix 2). Both of our analytic approaches support this conclusion, that in this region, bird richness cannot be strongly predicted by stand-level structures alone. Additional metrics such as landscape-level variables would better predict bird richness (above 8 or 20% variance explained). Further, the more intensively managed a stand, the more it undergoes habitat simplification, which deprives birds of important resources such as suitable nest sites or food supply. They are then forced to exploit a broader range of environmental conditions, or increase their niche breadth (Mahon et al., 2016), which has been observed in our study area (Basile et al., 2021a). The degree to which bird richness will respond to individual forest structures is therefore additionally dependent on the intensity of management that stand is subject to, and the shift in generalist/specialist behaviours of the birds using that habitat (e.g. shifting their foraging or nesting locations, Basile et al., 2021a). The relationship between bird richness and local forest structures will therefore be modified by the surrounding landscape-level context, including the percentage of broadleaved forested area in an otherwise coniferous landscape (Basile et al., 2021a), a dearth of unmanaged forest patches (Storch et al., 2020) and the general homogeneity of the landscape matrix, which in our study area is comprised primarily of even-aged stands of low tree diversity.
Our results suggest, however, that one variable (tree richness) is sufficient to predict bird richness (Figures 2, 4). This is a notable finding, as tree richness is a variable that can both be easily measured and altered in a managed forest context to promote bird diversity. Tree species admixtures can also positively influence forest multifunctionality and resilience, as well as other forest-dwelling taxa (Ampoorter et al., 2020; Messier et al., 2021). Managing forests for higher tree diversity, and the associated diversity of canopy (Pretzsch, 2014) and understory structures (Helbach et al., 2022) that it begets, can improve bird diversity at the local assemblage level. Thus, our results support the recommendation of increasing tree species diversity in managed forests (Messier et al., 2021) to deliver more biodiversity-oriented forest management outcomes. Indeed, our results also support using tree species richness as a proxy for promoting bird richness, however acoustic index variation also provides within-season and interannual variations in the bird assemblage, which tree species richness cannot.
As outlined in the introduction, previous soundscape studies have examined the link between acoustic indices and habitat structural heterogeneity, the goal being that from increasing acoustic index values one can infer increasing habitat quality as it pertains to provisioning of habitats for birds. Acoustic indices have successfully distinguished between structural differences in ecosystems, although this is mainly differences between coarse habitat type classifications such as forests, pastures, plantations, or urban to rural gradients (Joo et al., 2011; Bobryk et al., 2016; Buxton et al., 2018; Turner et al., 2018; Bradfer-Lawrence et al., 2020; Do Nascimento et al., 2020; Hayashi et al., 2020; Dröge et al., 2021). There are fewer studies that identified differences in acoustic diversity within the same habitat type, as finer differences are more difficult to capture (Dröge et al., 2021). However, Shaw et al. (2021a) did so in a winter boreal forest, Chen et al. (2021) in nature reserves in southern China, Atemasov and Atemasova (2019) in oak forests in Ukraine and Farina and Pieretti (2014) in a Mediterranean shrubland. Our results support the latter studies that it is possible to distinguish between forests of lower or higher structural complexity within the same habitat classification, which in our case were low montane temperate managed forest stands.
At the assemblage level, we hypothesised that higher structural heterogeneity would provide a greater niche volume for more bird species, and that this richness will be reflected in acoustic index values. However, this is not a strictly linear relationship. Studies have found that bird species that prefer dense vegetation (e.g. blackbirds (Turdus merula) (Linnaeus, 1758) or robins (Erithacus rubecula)) (Linnaeus, 1758) can disproportionately contribute to the soundscape (Farina et al., 2015). This may explain why the highest NDSI values on the NMDS plots occur around plots with high basal area (Figure 7), compared to bird richness (Figure 4). Denser plots (high basal area) may thus in some cases yield higher acoustic index values without necessarily supporting higher bird richness, a limitation of this monitoring method.
Moreover, our study was not able to estimate bird abundance, which is also known to affect acoustic index values (Alcocer et al., 2022) and the NDSI specifically (Bradfer-Lawrence et al., 2020). Although we could not estimate abundance from our recordings, this explanation is consistent with findings from other work conducted in our study area showing that bird abundance, more than richness, was positively associated with local habitat quality (Basile et al., 2020, 2021b). Further, point count data collected during the same two-month period confirms an extremely high correlation between bird richness and abundance in this study area (Pearson’s correlation = 0.92, p-value = 2.2e-16; data made available by Basile et al., 2021a).
The NMDS model explained similarly low variance as with single forest structures (adjusted R² = 0.11 versus 0.08, 0.08, 0.06 and 0.04), while the variance explained by the bird richness NMDS more than doubled (adjusted R² = 0.20 versus 0.08). This suggests that the NDSI is subject to additional influences outside of forest structural heterogeneity and that it is not as sensitive as bird richness to one individual structure, but rather the overall structural heterogeneity within the plots. This is supported by the similar Akaike weights assigned to significant NDSI regressions (wi = 0.36, 0.22, 0.17, 0.09), while the wi was not as evenly distributed across bird richness models. The NDSI may differ from bird richness because it reflects dynamic components of a bird assemblage that the bird richness metric does not quantify. Species abundance, stage of breeding cycle, territory establishment and defence, predator alarms and chick begging are all conveyed by type, frequency and amplitude of vocalisations (Gil and Llusia, 2020) and would thus be reflected in NDSI, but not bird richness, values. These unknown species-specific factors highlight the NDSI as not just a proxy for bird richness but also a representation of a wider range of breeding season dynamics that are reflected through bird vocalisations.
Further, the NDSI was designed to measures the ratio of biophony to anthrophony, with biophony defined as any sound above 2 kHz, the typical range of biological sounds, including bird vocalisations. Anthrophony is defined as sounds below 2 kHz, which is the range at which low-frequency sounds from human machinery, such as road and air traffic or agricultural activity often occur (Kasten et al., 2012). The presence of faint background noise from roads and forestry operations varied per plot, and insofar as birds continue to use those plots despite this background noise, the NDSI would reflect this additional plot feature, while bird richness would not. Limitations, therefore, exist to this method, specifically that there is not a consistent, linear relationship between the NDSI, or any acoustic index, to bird richness; the strength of this relationship between the acoustic index and bird richness can be subject to changing environmental conditions, such as ambient anthropogenic noise. Appendix 4 investigates the effect of anthropogenic noise on the dataset, and indeed the plots with high bird richness and NDSI values were the plots with the lowest amount of anthropogenic noise. Our recordings were comprised almost exclusively of biophony (bird vocalisations), so the index’s ability to reflect bird richness was not drastically impeded by a preponderance of geophonic (Appendix 1) or anthropogenic (Appendix 4) noise, but rather occurring where there was a lack of it. There was greater structural heterogeneity where there was also less anthropogenic noise in our study area, the relative effects of which we cannot disentangle, but nonetheless which the NDSI values accurately reflect. Other study areas containing more anthropogenic sound sources, or anthropogenic noise near higher structurally heterogenous forest stands, might observe different results with this particular index. Overall, in our study area, the NDSI, successfully reflected not just bird richness (through positive significant correlations over two years), but also the response of birds to forest structural heterogeneity (Figure 7).
Our study is embedded within a larger research programme that, to our knowledge, is the first to investigate how the retention of forest structures affects forest biodiversity in uneven-aged and selectively harvested continuous-cover European temperate forests. Our NDMS results suggest that overall structural heterogeneity positively affects bird species richness, which was also reflected in our selected acoustic index, the NDSI. This is one of the few studies demonstrating an acoustic index’s ability to distinguish between fine structural differences within forest stands of the same habitat classification. It is therefore possible for forest managers interested in conserving or increasing bird richness in their production forests to identify a robust acoustic index to track the response of bird richness to management decisions over time. Future research should address temporal robustness; our study was limited to two years; thus, it would be useful to understand correlation variations between bird richness and well-performing acoustic indices over longer timeframes. More generally, future research should also focus on the continual reporting of ecoacoustic studies in forest habitats that test a suite of acoustic indices and their relationships to commonly inventoried forest structures. With this, meta-analyses can in future identify which acoustic indices are repeatedly found to be temporally robust at the site level, and assess how spatially generalisable these links are, to better understand the scalable utility of this approach and its application for biodiversity-oriented forest management.
The author(s) declare financial support was received for the research, authorship, and/or publication of this article. This study was part of the Research Training Group ConFoBi (GRK 2123/2), which is funded by the German Research Foundation (DFG). This work was also funded by State Graduate Funding of Baden-Württemberg, through the University of Freiburg’s International Graduate Academy (IGA), with a grant to TS. SM receives financial support via the Akwamo project (2221NR050C): “Feasibility study - integration of (bio)acoustic methods for quantifying biological diversity in forest monitoring”, which is supported on the basis of a resolution of the German Bundestag with funds of the Federal Ministry of Food and Agriculture (BMEL) via the Agency of Renewable Resources (FNR) as project management agency of the BMEL for the funding program Renewable resources. SM’s contribution further benefitted from the support of the Centre de Synthèse et d’Analyse sur la Biodiversité (CESAB) at the Fondation pour la Recherche sur la Biodiversité and the inspirational discussions among the Acoucene consortium.
We are grateful to Forst Baden-Württemberg (ForstBW) for enabling and facilitating fieldwork. We thank Sina Schönamsgruber for her bioacoustic identifications, Jörg Memmert and Stephanie Pietsch for their assistance with recorder installation and retrieval, and Johannes Penner for his support early in this project.
The authors declare that the research was conducted in the absence of any commercial or financial relationships that could be construed as a potential conflict of interest.
All claims expressed in this article are solely those of the authors and do not necessarily represent those of their affiliated organizations, or those of the publisher, the editors and the reviewers. Any product that may be evaluated in this article, or claim that may be made by its manufacturer, is not guaranteed or endorsed by the publisher.
The Supplementary Material for this article can be found online at: https://www.frontiersin.org/articles/10.3389/fevo.2024.1387879/full#supplementary-material
Abrahams C. (2019). Comparison between lek counts and bioacoustic recording for monitoring Western Capercaillie (Tetrao urogallus L.). J. Ornithol. 160, 685–697. doi: 10.1007/s10336-019-01649-8
Abrahams C., Denny M. J. H. (2018). A first test of unattended, acoustic recorders for monitoring Capercaillie Tetrao urogallus lekking activity. Bird Study 65, 197–207. doi: 10.1080/00063657.2018.1446904
Adams B. T., Matthews S. N. (2019). Diverse temperate forest bird assemblages demonstrate closer correspondence to plant species composition than vegetation structure. Ecography 42, 1752–1764. doi: 10.1111/ecog.04487
Akaike H. (1998). “Information theory and an extension of the maximum likelihood principle,” in Selected Papers of Hirotugu Akaike. In: Parzen E., Tanabe K., Kitagawa G. (eds) Springer Series in Statistics. Springer, New York, NY. doi: 10.1007/978-1-4612-1694-0_15
Alcocer I., Lima H., Sugai L. S. M., Llusia D. (2022). Acoustic indices as proxies for biodiversity: A meta-analysis. Biol. Rev. 97, 2209–2236. doi: 10.1111/brv.12890
Alldredge M. W., Pollock K. H., Simons T. R. (2006). Estimating detection probabilities from multiple-observer point counts. Auk 123, 1172–1182. doi: 10.1093/auk/123.4.1172
Ampoorter E., Barbaro L., Jactel H., Baeten L., Boberg J., Carnol M., et al. (2020). Tree diversity is key for promoting the diversity and abundance of forest-associated taxa in Europe. Oikos 129, 133–146. doi: 10.1111/oik.06290
Atemasov A., Atemasova T. (2019). Impact of stand variables on characteristics of avian soundscape in common oak (Quercus robur L.) forests. Forestry Stud. 70, 68–79. doi: 10.2478/fsmu-2019-0006
Basile M., Asbeck T., Cordeiro Pereira J. M., Mikusiński G., Storch I. (2021a). Species co-occurrence and management intensity modulate habitat preferences of forest birds. BMC Biol. 19, 210. doi: 10.1186/s12915-021-01136-8
Basile M., Asbeck T., Jonker M., Knuff A. K., Bauhus J., Braunisch V., et al. (2020). What do tree-related microhabitats tell us about the abundance of forest-dwelling bats, birds, and insects? J. Environ. Manage. 264, 110401. doi: 10.1016/j.jenvman.2020.110401
Basile M., Mikusiński G., Storch I. (2019). Bird guilds show different responses to tree retention levels: A meta-analysis. Global Ecol. Conserv. 18, e00615. doi: 10.1016/j.gecco.2019.e00615
Basile M., Storch I., Mikusiński G. (2021b). Abundance, species richness and diversity of forest bird assemblages – The relative importance of habitat structures and landscape context. Ecol. Indic. 133, 108402. doi: 10.1016/j.ecolind.2021.108402
Bateman J., Uzal A. (2022). The relationship between the Acoustic Complexity Index and avian species richness and diversity: A review. Bioacoustics 31, 614–627. doi: 10.1080/09524622.2021.2010598
Bauhus J., Puettmann K., Messier C. (2009). Silviculture for old-growth attributes. For. Ecol. Manage. 258, 525–537. doi: 10.1016/j.foreco.2009.01.053
Blake J. G., Karr J. R. (1987). Breeding birds of isolated woodlots: area and habitat relationships. Ecology 68, 1724–1734. doi: 10.2307/1939864
Blasi C., Marchetti M., Chiavetta U., Aleffi M., Audisio P., Azzella M. M., et al. (2010). Multi-taxon and forest structure sampling for identification of indicators and monitoring of old-growth forest. Plant Biosyst. - Int. J. Dealing All Aspects Plant Biol. 144, 160–170. doi: 10.1080/11263500903560538
Bobiec A. (2002). Living stands and dead wood in the Białowieża forest: Suggestions for restoration management. For. Ecol. Manage. 165, 125–140. doi: 10.1016/S0378-1127(01)00655-7
Bobryk C. W., Rega-Brodsky C. C., Bardhan S., Farina A., He H. S., Jose S. (2016). A rapid soundscape analysis to quantify conservation benefits of temperate agroforestry systems using low-cost technology. Agroforestry Syst. 90, 997–1008. doi: 10.1007/s10457-015-9879-6
Boelman N. T., Asner G. P., Hart P. J., Martin R. E. (2007). Multi-trophic invasion resistance in Hawaii: bioacoustics, field surveys, and airborne remote sensing. Ecol. Appl. 17, 2137–2144. doi: 10.1890/07-0004.1
Bradfer-Lawrence T., Bunnefeld N., Gardner N., Willis S. G., Dent D. H. (2020). Rapid assessment of avian species richness and abundance using acoustic indices. Ecol. Indic. 115, 106400. doi: 10.1016/j.ecolind.2020.106400
Bradfer-Lawrence T., Desjonqueres C., Eldridge A., Johnston A., Metcalf O. (2023). Using acoustic indices in ecology: Guidance on study design, analyses and interpretation. Methods Ecol. Evol. 14, 2192–2204. doi: 10.1111/2041-210X.14194
Bradfer-Lawrence T., Gardner N., Bunnefeld L., Bunnefeld N., Willis S. G., Dent D. H. (2019). Guidelines for the use of acoustic indices in environmental research. Methods Ecol. Evol. 10, 1796–1807. doi: 10.1111/2041-210X.13254
Bürgi M. (2015). “Close-to-nature forestry,” in Europe’s Changing Woods and Forests: From Wildwood to Managed Landscapes. Eds. Kirby K., Watkins C. (CABI, Oxford).
Burivalova Z., Purnomo, Wahyudi B., Boucher T. M., Ellis P., Truskinger A., et al. (2019). Using soundscapes to investigate homogenization of tropical forest diversity in selectively logged forests. J. Appl. Ecol. 56, 2493–2504. doi: 10.1111/1365-2664.13481
Burivalova Z., Towsey M., Boucher T., Truskinger A., Apelis C., Roe P., et al. (2018). Using soundscapes to detect variable degrees of human influence on tropical forests in Papua New Guinea: Tropical-Forest Soundscapes. Conserv. Biol. 32, 205–215. doi: 10.1111/cobi.12968
Burnham K. P., Anderson D. R. (1998). “Practical use of the information-theoretic approach,” in Model Selection and Inference: A Practical Information-Theoretic Approach. Eds. Burnham K. P., Anderson D. R. (New York, NY: Springer), 75–117. doi: 10.1007/978-1-4757-2917-7_3
Burns F., Eaton M. A., Burfield I. J., Klvaňová A., Šilarová E., Staneva A., et al. (2021). Abundance decline in the avifauna of the European Union reveals cross-continental similarities in biodiversity change. Ecol. Evol. 11, 16647–16660. doi: 10.1002/ece3.8282
Buxton R. T., Agnihotri S., Robin V. V., Goel A., Balakrishnan R. (2018). Acoustic indices as rapid indicators of avian diversity in different land-use types in an Indian biodiversity hotspot. J. Ecoacoustics 2, 1–1. doi: 10.22261/jea.gwpzvd
Buxton R. T., Brown E., Sharman L., Gabriele C. M., McKenna M. F. (2016). Using bioacoustics to examine shifts in songbird phenology. Ecol. Evol. 6, 4697–4710. doi: 10.1002/ece3.2242
Chen Y.-F., Luo Y., Mammides C., Cao K.-F., Zhu S., Goodale E. (2021). The relationship between acoustic indices, elevation, and vegetation, in a forest plot network of southern China. Ecol. Indic. 129, 107942. doi: 10.1016/j.ecolind.2021.107942
Clarke K. R. (1993). Non-parametric multivariate analyses of changes in community structure. Aust. J. Ecol. 18, 117–143. doi: 10.1111/j.1442-9993.1993.tb00438.x
Culbert P. D., Radeloff V. C., Flather C. H., Kellndorfer J. M., Rittenhouse C. D., Pidgeon A. M. (2013). The influence of vertical and horizontal habitat structure on nationwide patterns of avian biodiversity. Auk 130, 656–665. doi: 10.1525/auk.2013.13007
Czeszczewik D., Zub K., Stanski T., Sahel M., Kapusta A., Walankiewicz W. (2015). Effects of forest management on bird assemblages in the Bialowieza Forest, Poland. IForest - Biogeosciences Forestry 8, 377. doi: 10.3832/ifor1212-007
Darras K., Batáry P., Furnas B., Celis- Murillo A., Van Wilgenburg S. L., Mulyani Y. A., et al. (2018). Comparing the sampling performance of sound recorders versus point counts in bird surveys: A meta-analysis. J. Appl. Ecol. 55, 2575–2586. doi: 10.1111/1365-2664.13229
Devictor V., Julliard R., Clavel J., Jiguet F., Lee A., Couvet D. (2008). Functional biotic homogenization of bird communities in disturbed landscapes. Global Ecol. Biogeogr. 17, 252–261. doi: 10.1111/j.1466-8238.2007.00364.x
Díaz L. (2006). Influences of forest type and forest structure on bird communities in oak and pine woodlands in Spain. For. Ecol. Manage. 223, 54–65. doi: 10.1016/j.foreco.2005.10.061
Díaz I. A., Armesto J. J., Reid S., Sieving K. E., Willson M. F. (2005). Linking forest structure and composition: Avian diversity in successional forests of Chiloé Island, Chile. Biol. Conserv. 123, 91–101. doi: 10.1016/j.biocon.2004.10.011
Do Nascimento L. A., Campos-Cerqueira M., Beard K. H. (2020). Acoustic metrics predict habitat type and vegetation structure in the Amazon. Ecol. Indic. 117, 106679. doi: 10.1016/j.ecolind.2020.106679
Doser J. W., Finley A. O., Kasten E. P., Gage S. H. (2020). Assessing soundscape disturbance through hierarchical models and acoustic indices: A case study on a shelterwood logged northern Michigan forest. Ecol. Indic. 113, 106244. doi: 10.1016/j.ecolind.2020.106244
Dröge S., Martin D. A., Andriafanomezantsoa R., Burivalova Z., Fulgence T. R., Osen K., et al. (2021). Listening to a changing landscape: Acoustic indices reflect bird species richness and plot-scale vegetation structure across different land-use types in north-eastern Madagascar. Ecol. Indic. 120, 106929. doi: 10.1016/j.ecolind.2020.106929
Eldridge A., Guyot P., Moscoso P., Johnston A., Eyre-Walker Y., Peck M. (2018). Sounding out ecoacoustic metrics: Avian species richness is predicted by acoustic indices in temperate but not tropical habitats. Ecol. Indic. 95, 939–952. doi: 10.1016/j.ecolind.2018.06.012
Epskamp S., Cramer A. O. J., Waldorp L. J., Schmittmann V. D., Borsboom D. (2012). qgraph: network visualizations of relationships in psychometric data. J. Stat. Software 48, 1–18. Available at: http://www.jstatsoft.org/v48/i04/.
Farina A., Ceraulo M., Bobryk C., Pieretti N., Quinci E., Lattanzi E. (2015). Spatial and temporal variation of bird dawn chorus and successive acoustic morning activity in a Mediterranean landscape. Bioacoustics 24, 269–288. doi: 10.1080/09524622.2015.1070282
Farina A., Pieretti N. (2014). Sonic environment and vegetation structure: A methodological approach for a soundscape analysis of a Mediterranean maqui. Ecol. Inf. 21, 120–132. doi: 10.1016/j.ecoinf.2013.10.008
Fedrowitz K., Koricheva J., Baker S. C., Lindenmayer D. B., Palik B., Rosenvald R., et al. (2014). REVIEW: Can retention forestry help conserve biodiversity? A meta-analysis. J. Appl. Ecol. 51, 1669–1679. doi: 10.1111/1365-2664.12289
ForstBW. (2015). Die Gesamtkonzeption Waldnaturschutz ForstBW, mit den Waldnaturschutzzielen 2020. Stuttgart, Germany: Landesbetrieb ForstBW.
Franklin J. F., Spies T. A., Pelt R. V., Carey A. B., Thornburgh D. A., Berg D. R., et al. (2002). Disturbances and structural development of natural forest ecosystems with silvicultural implications, using Douglas-fir forests as an example. For. Ecol. Manage. 155, 399–423. doi: 10.1016/S0378-1127(01)00575-8
Fuller R. (2000). Influence of treefall gaps on distributions of breeding birds within interior old-growth stands in białowieża forest, Poland. Condor 102)2, 267–274. doi: 10.1093/condor/102.2.267
Fuller S., Axel A. C., Tucker D., Gage S. H. (2015). Connecting soundscape to landscape: Which acoustic index best describes landscape configuration? Ecol. Indic. 58, 207–215. doi: 10.1016/j.ecolind.2015.05.057
Gabbe A. P., Robinson S. K., Brawn J. D. (2002). Tree-species preferences of foraging insectivorous birds: implications for floodplain forest restoration. Conserv. Biol. 16, 462–470. doi: 10.1046/j.1523-1739.2002.00460.x
Garamszegi L. Z. (2011). Information-theoretic approaches to statistical analysis in behavioural ecology: An introduction. Behav. Ecol. Sociobiol. 65, 1–11. doi: 10.1007/s00265-010-1028-7
Gasc A., Sueur J., Jiguet F., Devictor V., Grandcolas P., Burrow C., et al. (2013). Assessing biodiversity with sound: Do acoustic diversity indices reflect phylogenetic and functional diversities of bird communities? Ecol. Indic. 25, 279–287. doi: 10.1016/j.ecolind.2012.10.009
Gauer J., Aldinger E. (2005). Waldökologische Naturräume Deutschlands – Forstliche Wuchsgebiete und Wuchsbezirke mit Karte im Maßstab 1:1000.000 (Freiburg, Germany: Verein für Forstliche Standortkunde und Forstpflanzenzüchtung).
Gil D., Llusia D. (2020). “The Bird Dawn Chorus Revisited,” in Coding Strategies in Vertebrate Acoustic Communication. Eds. Aubin T., Mathevon N. (Cham: Springer International Publishing), 45–90. doi: 10.1007/978-3-030-39200-0_3
Gregory R. D., van Strien A., Vorisek P., Gmelig Meyling A. W., Noble D. G., Foppen R. P. B., et al. (2005). Developing indicators for European birds. Philos. Trans. R. Soc. B: Biol. Sci. 360, 269–288. doi: 10.1098/rstb.2004.1602
Gregory R. D., Vořišek P., Noble D. G., Strien A. V., Klvaňová A., Eaton M., et al. (2008). The generation and use of bird population indicators in Europe. Bird Conserv. Int. 18, S223–S244. doi: 10.1017/S0959270908000312
Gschwantner T., Lanz A., Vidal C., Bosela M., Di Cosmo L., Fridman J., et al. (2016). Comparison of methods used in European National Forest Inventories for the estimation of volume increment: Towards harmonisation. Ann. For. Sci. 73, Article 4. doi: 10.1007/s13595-016-0554-5
Gustafsson L., Baker S. C., Bauhus J., Beese W. J., Brodie A., Kouki J., et al. (2012). Retention forestry to maintain multifunctional forests: A world perspective. BioScience 62, 633–645. doi: 10.1525/bio.2012.62.7.6
Gustafsson L., Bauhus J., Asbeck T., Augustynczik A. L. D., Basile M., Frey J., et al. (2020). Retention as an integrated biodiversity conservation approach for continuous-cover forestry in Europe. Ambio 49, 85–97. doi: 10.1007/s13280-019-01190-1
Gutzat F., Dormann C. F. (2018). Decaying trees improve nesting opportunities for cavity-nesting birds in temperate and boreal forests: A meta-analysis and implications for retention forestry. Ecol. Evol. 8, 8616–8626. doi: 10.1002/ece3.4245
Hanle J., Duguid M. C., Ashton M. S. (2020). Legacy forest structure increases bird diversity and abundance in aging young forests. Ecol. Evol. 10, 1193–1208. doi: 10.1002/ece3.5967
Hartig F. (2022). DHARMa: residual diagnostics for hierarchical (Multi-level/mixed) regression models (R package version 0.4.6). Available at: https://CRAN.R-project.org/package=DHARMa.
Hayashi K., Erwinsyah, Lelyana V. D., Yamamura K. (2020). Acoustic dissimilarities between an oil palm plantation and surrounding forests: Analysis of index time series for beta-diversity in South Sumatra, Indonesia. Ecol. Indic. 112, 106086. doi: 10.1016/j.ecolind.2020.106086
Hedwall P.-O., Mikusiński G. (2015). Structural changes in protected forests in Sweden: Implications for conservation functionality. Can. J. For. Res. 45, 1215–1224. doi: 10.1139/cjfr-2014-0470
Helbach J., Frey J., Messier C., Mörsdorf M., Scherer-Lorenzen M. (2022). Light heterogeneity affects understory plant species richness in temperate forests supporting the heterogeneity–diversity hypothesis. Ecol. Evol. 12, e8534. doi: 10.1002/ece3.8534
Helle P., Järvinen O. (1986). Population trends of north finnish land birds in relation to their habitat selection and changes in forest structure. Oikos 46, 107–115. doi: 10.2307/3565386
Holmes R. T., Robinson S. K. (1981). Tree species preferences of foraging insectivorous birds in a northern hardwoods forest. Oecologia 48, 31–35. doi: 10.1007/BF00346985
Holmes R. T., Schultz J. C. (1988). Food availability for forest birds: Effects of prey distribution and abundance on bird foraging. Can. J. Zool. 66, 720–728. doi: 10.1139/z88-107
Ishii H. T., Tanabe S., Hiura T. (2004). Exploring the relationships among canopy structure, stand productivity, and biodiversity of temperate forest ecosystems. For. Sci. 50, 342–355. doi: 10.1093/forestscience/50.3.342
James F. C., Wamer N. O. (1982). Relationships between temperate forest bird communities and vegetation structure. Ecology 63, 159–171. doi: 10.2307/1937041
Joo W., Gage S. H., Kasten E. P. (2011). Analysis and interpretation of variability in soundscapes along an urban–rural gradient. Landscape Urban Plann. 103, 259–276. doi: 10.1016/j.landurbplan.2011.08.001
Jucker T., Bouriaud O., Coomes D. A. (2015). Crown plasticity enables trees to optimize canopy packing in mixed-species forests. Funct. Ecol. 29, 1078–1086. doi: 10.1111/1365-2435.12428
Kahl S., Wood C. M., Eibl M., Klinck H. (2021). BirdNET: A deep learning solution for avian diversity monitoring. Ecol. Inf. 61, 101236. doi: 10.1016/j.ecoinf.2021.101236
Kändler G. (2006). “The design of the second German national forest inventory,” in Proceedings of the Eighth Annual Forest Inventory and Analysis Symposium.
Kasten E. P., Gage S. H., Fox J., Joo W. (2012). The remote environmental assessment laboratory’s acoustic library: An archive for studying soundscape ecology. Ecol. Inf. 12, 50–67. doi: 10.1016/j.ecoinf.2012.08.001
Kati V., Dimopoulos P., Papaioannou H., Poirazidis K. (2009). Ecological management of a Mediterranean mountainous reserve (Pindos National Park, Greece) using the bird community as an indicator. J. Nat. Conserv. 17, 47–59. doi: 10.1016/j.jnc.2008.12.002
Kebrle D., Zasadil P., Hošek J., Barták V., Šťastný K. (2021). Large trees as a key factor for bird diversity in spruce-dominated production forests: Implications for conservation management. For. Ecol. Manage. 496, 119460. doi: 10.1016/j.foreco.2021.119460
MacArthur R. H., MacArthur J. W. (1961). On bird species diversity. Ecology 42, 594–598. doi: 10.2307/1932254
Mahon C. L., Holloway G., Sólymos P., Cumming S. G., Bayne E. M., Schmiegelow F. K. A., et al. (2016). Community structure and niche characteristics of upland and lowland western boreal birds at multiple spatial scales. For. Ecol. Manage. 361, 99–116. doi: 10.1016/j.foreco.2015.11.007
Mazerolle M. J. (2020). AICcmodavg: Model selection and multimodel inference based on (Q)AIC(c) (R package version 2.3-1). Available at: https://cran.r-project.org/package=AICcmodavg.
Messier C., Bauhus J., Sousa-Silva R., Auge H., Baeten L., Barsoum N., et al. (2021). For the sake of resilience and multifunctionality, let’s diversify planted forests! Conserv. Lett. 15, e12829. doi: 10.1111/conl.12829
Metcalf O., Abrahams C., Ashington B., Baker E., Bradfer-Lawrence T., Browning E., et al. (2023). Good practice guidelines for long-term ecoacoustic monitoring in the UK (The UK Acoustics Network). Available online at: https://acoustics.ac.uk/ (Accessed April 17, 2023).
Mikusiński G., Roberge J.-M., Fuller R. J. (2018). Ecology and Conservation of Forest Birds (Cambridge: Cambridge University Press).
Motta R. (2010). National forest inventories: Contributions to forest biodiversity assessments, (2010). IForest - Biogeosciences Forestry 4, 250. doi: 10.3832/ifor0577-004
Muiruri E. W., Rainio K., Koricheva J. (2016). Do birds see the forest for the trees? Scale-dependent effects of tree diversity on avian predation of artificial larvae. Oecologia 180, 619–630. doi: 10.1007/s00442-015-3391-6
Müller J., Bütler R. (2010). A review of habitat thresholds for dead wood: A baseline for management recommendations in European forests. Eur. J. For. Res. 129, 981–992. doi: 10.1007/s10342-010-0400-5
Müller S., Gossner M. M., Penone C., Jung K., Renner S. C., Farina A., et al. (2022). Land-use intensity and landscape structure drive the acoustic composition of grasslands. Agriculture Ecosyst. Environ. 328, 107845. doi: 10.1016/j.agee.2021.107845
Müller S., Shaw T., Güntert D., Helmbold L., Schütz N., Thomas L., et al. (2020). Ecoacoustics of small forest patches in agricultural landscapes: Acoustic diversity and bird richness increase with patch size. Biodiversity 21, 48–60. doi: 10.1080/14888386.2020.1733086
Muys B., Angelstam P., Bauhus J., Bouriaud L., Jactel H., Kraigher H., et al. (2022). Forest Biodiversity in Europe (From Science to Policy) (European Forest Institute). doi: 10.36333/fs13
Oksanen J., Simpson G., Blanchet F., Kindt R., Legendre P., Minchink P., et al. (2022). vegan: community ecology package (R package version 2.6-2). Available at: https://CRAN.R-project.org/package=vegan.
Paillet Y., Bergès L., Hjältén J., Ódor P., Avon C., Bernhardt-Römermann M., et al. (2010). Biodiversity differences between managed and unmanaged forests: meta-analysis of species richness in Europe. Conserv. Biol. 24, 101–112. doi: 10.1111/j.1523-1739.2009.01399.x
Pérez-Granados C., Bota G., Giralt D., Barrero A., Gómez-Catasús J., Bustillo-De La Rosa D., et al. (2019). Vocal activity rate index: A useful method to infer terrestrial bird abundance with acoustic monitoring. Ibis 161, 901–907. doi: 10.1111/ibi.12728
Pérez-Granados C., Traba J. (2021). Estimating bird density using passive acoustic monitoring: A review of methods and suggestions for further research. Ibis 163, 765–783. doi: 10.1111/ibi.12944
Pieretti N., Farina A., Morri D. (2011). A new methodology to infer the singing activity of an avian community: The Acoustic Complexity Index (ACI). Ecol. Indic. 11, 868–873. doi: 10.1016/j.ecolind.2010.11.005
Poulsen B. O. (2002). Avian richness and abundance in temperate Danish forests: Tree variables important to birds and their conservation. Biodiversity Conserv. 11, 1551–1566. doi: 10.1023/A:1016839518172
Pretzsch H. (2014). Canopy space filling and tree crown morphology in mixed-species stands compared with monocultures. For. Ecol. Manage. 327, 251–264. doi: 10.1016/j.foreco.2014.04.027
R Core Team (2022). R: A language and environment for statistical computing (Vienna, Austria: R Foundation for Statistical Computing). Available at: https://www.R-project.org/.
Reise J., Kukulka F., Flade M., Winter S. (2019). Characterising the richness and diversity of forest bird species using National Forest Inventory data in Germany. For. Ecol. Manage. 432, 799–811. doi: 10.1016/j.foreco.2018.10.012
Robinson S. K., Holmes R. T. (1982). Foraging behavior of forest birds: the relationships among search tactics, diet, and habitat structure. Ecology 63, 1918–1931. doi: 10.2307/1940130
Ross S. R. P.-J., Friedman N. R., Yoshimura M., Yoshida T., Donohue I., Economo E. P. (2021). Utility of acoustic indices for ecological monitoring in complex sonic environments. Ecol. Indic. 121, 107114. doi: 10.1016/j.ecolind.2020.107114
San Roman M., Wagner A. (2021). Diversity begets diversity during community assembly until ecological limits impose a diversity ceiling. Mol. Ecol. 30, 5874–5887. doi: 10.1111/mec.16161
Schulze E. D., Craven D., Durso A. M., Reif J., Guderle M., Kroiher F., et al. (2019). Positive association between forest management, environmental change, and forest bird abundance. For. Ecosyst. 6, 3. doi: 10.1186/s40663-019-0160-8
Schwarzkopf L., Roe P., Mcdonald P. G., Watson D. M., Fuller R. A., Allen-Ankins S. (2023). Can an acoustic observatory contribute to the conservation of threatened species? Austral Ecol. 48, 1230–1237. doi: 10.1111/aec.13398
Shaw T., Hedes R., Sandstrom A., Ruete A., Hiron M., Hedblom M., et al. (2021a). Hybrid bioacoustic and ecoacoustic analyses provide new links between bird assemblages and habitat quality in a winter boreal forest. Environ. Sustainability Indic. 11, 100141. doi: 10.1016/j.indic.2021.100141
Shaw T., Müller S., Scherer-Lorenzen M. (2021b). Slope does not affect autonomous recorder detection shape: Considerations for acoustic monitoring in forested landscapes. Bioacoustics, 31, 216-282. doi: 10.1080/09524622.2021.1925590
Shaw T., Schönamsgruber S.-R., Cordeiro Pereira J. M., Mikusiński G. (2022). Refining manual annotation effort of acoustic data to estimate bird species richness and composition: The role of duration, intensity, and time. Ecol. Evol. 12, e9491. doi: 10.1002/ece3.9491
Shimelis A., Pinard M., Asefa A. (2013). Impact of forest structure simplification on bird species richness in the Harena forest of the bale mountains national park (BMNP), South Eastern Ethiopia. Nat. Environ. pollut. Technol. 12, 4.
Shutt J. D., Bolton M., Cabello I. B., Burgess M. D., Phillimore A. B. (2018). The effects of woodland habitat and biogeography on blue tit Cyanistes caeruleus territory occupancy and productivity along a 220 km transect. Ecography 41, 1967–1978. doi: 10.1111/ecog.03573
Spînu A. P., Asbeck T., Bauhus J. (2022). Combined retention of large living and dead trees can improve provision of tree-related microhabitats in Central European montane forests. Eur. J. For. Res. 141, 1105–1120. doi: 10.1007/s10342-022-01493-1
Storch F., Boch S., Gossner M., Feldhaar H., Ammer C., Schall P., et al. (2023). Linking structure and species richness to support forest biodiversity monitoring at large scales. Ann. For. Sci. 80, 3. doi: 10.1186/s13595-022-01169-1
Storch I., Penner J., Asbeck T., Basile M., Bauhus J., Braunisch V., et al. (2020). Evaluating the effectiveness of retention forestry to enhance biodiversity in production forests of Central Europe using an interdisciplinary, multi-scale approach. Ecol. Evol. 10, 1489–1509. doi: 10.1002/ece3.6003
Sueur J., Pavoine S., Hamerlynck O., Duvail S. (2008). Rapid acoustic survey for biodiversity appraisal. PloS One 3, e4065. doi: 10.1371/journal.pone.0004065
Sugai L. S. M., Silva T. S. F., Ribeiro J. W. Jr., Llusia D. (2019). Terrestrial passive acoustic monitoring: review and perspectives. BioScience 69, 15–25. doi: 10.1093/biosci/biy147
Summerville K. S., Crist T. O. (2003). Determinants of lepidopteran community composition and species diversity in eastern deciduous forests: Roles of season, eco-region and patch size. Oikos 100, 134–148. doi: 10.1034/j.1600-0706.2003.11992.x
Thieurmel B., Elmarhraoui A. (2019). suncalc: compute sun position, sunlight phases, moon position and lunar phase (R package version 0.5.0). Available at: https://CRAN.R-project.org/package=suncalc.
Thorn S., Chao A., Georgiev K. B., Müller J., Bässler C., Campbell J. L., et al. (2020). Estimating retention benchmarks for salvage logging to protect biodiversity. Nat. Commun. 11, Article 1. doi: 10.1038/s41467-020-18612-4
Turner A., Fischer M., Tzanopoulos J. (2018). Sound-mapping a coniferous forest—Perspectives for biodiversity monitoring and noise mitigation. PloS One 13, e0189843. doi: 10.1371/journal.pone.0189843
Vélová L., Véle A., Horák J. (2021). Land use diversity and prey availability structure the bird communities in Norway spruce plantation forests. For. Ecol. Manage. 480, 118657. doi: 10.1016/j.foreco.2020.118657
Versluijs M., Eggers S., Hjältén J., Löfroth T., Roberge J.-M. (2017). Ecological restoration in boreal forest modifies the structure of bird assemblages. For. Ecol. Manage. 401, 75–88. doi: 10.1016/j.foreco.2017.06.055
Versluijs M., Hjältén J., Roberge J.-M. (2019). Ecological restoration modifies the value of biodiversity indicators in resident boreal forest birds. Ecol. Indic. 98, 104–111. doi: 10.1016/j.ecolind.2018.10.020
Villanueva-Rivera L. J., Pijanowski B. C. (2018). Soundecology: soundscape ecology (R package version, 1.3.3). Available at: https://CRAN.R-project.org/package=soundecology.
Villanueva-Rivera L. J., Pijanowski B. C., Doucette J., Pekin B. (2011). A primer of acoustic analysis for landscape ecologists. Landscape Ecol. 26, 1233–1246. doi: 10.1007/s10980-011-9636-9
Vítková L., Bače R., Kjučukov P., Svoboda M. (2018). Deadwood management in Central European forests: Key considerations for practical implementation. For. Ecol. Manage. 429, 394–405. doi: 10.1016/j.foreco.2018.07.034
Wei T., Simko V. (2021). R package ‘corrplot’: Visualization of a Correlation Matrix (Version 0.92). Available online at: https://github.com/taiyun/corrplot. 03.02.2023
Whelan C. J. (2001). Foliage structure influences foraging of insectivorous forest birds: an experimental study. Ecology 82, 219–231. doi: 10.1890/0012-9658(2001)082[0219:FSIFOI]2.0.CO;2
Keywords: acoustic indices, ecoacoustics, normalized difference soundscape index, structural complexity, forest management
Citation: Shaw T, Scherer-Lorenzen M and Müller S (2024) Forest structural heterogeneity positively affects bird richness and acoustic diversity in a temperate, central European forest. Front. Ecol. Evol. 12:1387879. doi: 10.3389/fevo.2024.1387879
Received: 18 February 2024; Accepted: 31 July 2024;
Published: 20 August 2024.
Edited by:
Susan Fuller, Queensland University of Technology, AustraliaReviewed by:
Justin Bastow, Eastern Washington University, United StatesCopyright © 2024 Shaw, Scherer-Lorenzen and Müller. This is an open-access article distributed under the terms of the Creative Commons Attribution License (CC BY). The use, distribution or reproduction in other forums is permitted, provided the original author(s) and the copyright owner(s) are credited and that the original publication in this journal is cited, in accordance with accepted academic practice. No use, distribution or reproduction is permitted which does not comply with these terms.
*Correspondence: Taylor Shaw, dC5zaGF3QGpicy5jYW0uYWMudWs=
†ORCID: Taylor Shaw, orcid.org/0000-0003-4117-4552
Michael Scherer-Lorenzen, orcid.org/0000-0001-9566-590X
Sandra Müller, orcid.org/0000-0003-4289-755X
Disclaimer: All claims expressed in this article are solely those of the authors and do not necessarily represent those of their affiliated organizations, or those of the publisher, the editors and the reviewers. Any product that may be evaluated in this article or claim that may be made by its manufacturer is not guaranteed or endorsed by the publisher.
Research integrity at Frontiers
Learn more about the work of our research integrity team to safeguard the quality of each article we publish.