 Codey L. Mathis
 Darin J. McNeil Jr.2
 Melanie Kammerer
- 1Department of Entomology, Penn State University, University Park, PA, United States
- 2Department of Forestry and Natural Resources, University of Kentucky, Lexington, KY, United States
- 3United States Department of Agriculture – Agricultural Research Service, Pasture Systems and Watershed Management Research Unit, University Park, PA, United States
- 4Department of Biology, Indiana University of Pennsylvania, Indiana, PA, United States
Introduction: There is overwhelming evidence of declines in native bee populations and therefore a need for increased monitoring to track these declines and assist in conservation and restoration efforts. Bees can be sampled non-lethally through visual surveys (e.g., distance transects) or lethally through active (e.g., hand netting) or passive (e.g., traps that lure insects from afar) methods. These lethal methods suffer from imperfect detection that is difficult to account for and can confound inferences about habitat characteristics. Additionally, evidence suggests that lethal sampling methods can even invert habitat quality patterns such that high-quality sites yield fewer individuals and low-quality sites yield more individuals.
Methods: To study potential biases associated with imperfect detection, we used hierarchical density estimation with visual surveys to estimate density of bees within 40 young forest patches across Pennsylvania, USA. We surveyed bee communities non-lethally using visual surveys and lethally using blue-vane traps and bee bowls every two weeks between May and September 2019. We collected data on blooming flowers, vegetation structure, and weather during times of survey.
Results: We found that bee densities estimated from distance transects had a positive relationship with floral resource availability. In contrast, abundance measured via bee bowls and blue-vane traps had no relationship, or sometimes even negative trends with habitat quality, including floral resource availability. Raw bee counts within 2-m of the transect always correlated with modeled densities, showing that some methods do not share the biases of attractive traps.
Discussion: Our study demonstrates that failing to account for imperfect detection can impact the interpretation of pollinator surveys and adds to a growing body of literature that acknowledges the value of distance sampling for insects like bees to better understand species’ habitat needs and to monitor populations for conservation.
Introduction
Overwhelming evidence of declines in global native bee populations (Cameron et al., 2011; Koh et al., 2016; Jacobson et al., 2018) have spurred calls for biodiversity monitoring efforts to track these declines to inform their conservation and habitat restoration (Tepedino et al., 2015; Brown et al., 2016; Woodard et al., 2020). A critical aspect of bee population monitoring are those efforts that assess abundance and diversity; however, researchers employ a wide range of methods for quantifying abundance which makes direct comparisons across space and time difficult (Portman et al., 2020). Moreover, given that each method varies in its efficacy for producing meaningful data about bee abundance and diversity, there exists strong potential for inefficient use of limited monitoring resources (Tepedino et al., 2015; Tepedino and Portman, 2021). Even as entomologists coalesce around the development of standard monitoring practices (Woodard et al., 2020), there is a growing discourse around the ethics of some common methods (Montero-Castaño et al., 2022; Barrett et al., 2023; Klaus et al., 2024; Lövei & Ferrante, 2024). Thus, for researchers to ethically and effectively monitor the abundance and diversity of native bee populations, the relative value of common survey methods needs to be assessed and carefully weighed.
Among the most popular sampling methodologies used to generate metrics of bee abundance and diversity are: 1. pan traps or “bee bowls” (Wilson et al., 2008; Portman et al., 2020; Prendergast et al., 2020), 2. blue vane traps (BVT: Stephen and Rao, 2007), and 3. visual or netting surveys (Portman et al., 2020; Onufrieva and Onufriev, 2021). However, all three methods have biases and flaws. For example, capture rates from bee bowls can be impacted by the surrounding floral resource abundance at the time of deployment (Baum and Wallen, 2011; O'Connor et al., 2019; Kuhlman et al., 2021; Westerberg et al., 2021). Moreover, bee bowls only capture a small percentage of bees that are attracted to them (~19%; Hudson et al., 2020) and are ineffective at capturing large-bodied bees (Roulston et al., 2007; Joshi et al., 2015). In contrast, BVTs may over-sample insect communities (Gibbs et al., 2017) and unequally sample specific bee taxa (Halictidae and Apidae, Stephen and Rao, 2007; Portman et al., 2020). Furthermore, we know of no studies that have investigated what the area of effect around attractive traps is. Both bee bowls and BVT lure bees from an unknown distance, thus, the area “sampled” is highly ambiguous and may be context specific. Finally, visual or netting surveys are dependent on the skill of the observer (Portman et al., 2020; Onufrieva and Onufriev, 2021) and can introduce uncertainty by not accounting for the very low detection probability of bees (McNeil et al., 2019) which likely favors large-bodied and colorful species (Nielsen et al., 2011).
Detection probability is commonly defined as the probability of detecting an organism given that it is present at a given location (Mackenzie, 2006). Although some species may have detection probability near 1.0, most species exhibit imperfect detection variation in which can be explained by a wide variety of factors (Kellner and Swihart, 2014). For example, poor weather conditions (e.g., cold, rain) may preclude flight/foraging activity for ectotherms like bees (Ward et al., 2014), thus reducing their availability for detection (Gu and Swihart, 2004). Similarly, even when bees are active and available for detection, methodological issues may reduce detection probability including observer inexperience or secretive nature of some bee species (including small body size; Nielsen et al., 2011). However, among the most troubling detection issues facing bee researchers is that habitat characteristics can affect both abundance (i.e., the state variable of interest) and detection probability (MacKenzie et al., 2005; Zipkin et al., 2010). For example, vegetative dense cover may provide quality habitat for some bee species but also reduce observers’ capacity to detect that species (McNeil et al., 2019). Thus, assessing habitat associations of wildlife without considering detection probability can lead to inaccurate inferences, which can be detrimental to our understanding of how animals distribute themselves across space and time (as in Mata et al., 2014). Current bee monitoring methods account for detection probability during the design phase but generally fail to consider it in the modeling phase. For example, it is assumed that placing traps or observing bees during optimal weather (e.g., only sample from 10a-5p in “good weather”: Ward et al., 2014) is sufficient to overcome any effect of weather on bee behavior but weather parameters are then not included during modeling as covariates. Similarly, any inherent biases of trapping methodologies (e.g., related to floral bloom) and issues observing a very small organism flying quickly by an observer are also ignored.
One method that can account for low detection probability of insects while providing a density estimate is distance sampling (Buckland et al., 2015). Distance models are frequently employed to understand habitat associations and densities of vertebrate communities (Amundson et al., 2014), but recently have been used for bumble bees (Bombus spp.; McNeil et al., 2019; Keele et al., 2023) and whole bee communities (Mathis et al., 2021). They work by pairing animal counts with data on detection distances to generate a “detection function” that allows model-based accounts of imperfect detection by modeling the detection (p) and density (λ) processes separately (Buckland et al., 2015; Kéry and Royle, 2015). Importantly, covariates can be added to either component of the model (p or λ, or both) to assess important sources of variation in bee counts on surveys (Kéry and Royle, 2015; McNeil et al., 2019). The comparison of the resulting density estimate to raw counts from visual and trapping methodologies across the floral bloom spectrum can illuminate biases associated with these methods.
Herein, we monitored forested sites to compare density estimates derived from: 1) distance analyses from visual survey data, 2) counts of bees captured in BVTs, and 3) counts of bees captured with bee bowls. Building on the work of McNeil et al. (2019), we use hierarchical distance models (HDMs) to assess the biases of existing methodologies (BVT + bowl + visual) and investigate a known bias of floral resources against attractive traps (i.e., BVT + bowl; Kuhlman et al., 2021). It has been hypothesized that attractive trapping methods may be less effective when floral resources are rich (Joshi et al., 2015; O'Connor et al., 2019; Kuhlman et al., 2021; Westerberg et al., 2021), so we predicted that models fit with each kind of data would yield similar trends but dampened effect sizes for BVT and bee bowl data. We use the results of these analyses to inform bee monitoring methods that may improve conservation efficacy for this imperiled insect group.
Methods
Site selection
Site selection methods are already described by Mathis (2020) and Mathis et al. (2021). Sites were distributed across heavily forested portions of Pennsylvania and separated into three distinct ecoregions based on physiographic regions described by the Pennsylvania Geological Survey (Sevon, 2000): “Pennsylvania Wilds” (PAW), “Poconos” (POC), and “Ridge and Valley” (RV). We surveyed bees and associated vegetation communities on both private and public lands across all three study regions. Private lands consisted of those enrolled in the NRCS: Working Lands for Wildlife Golden-winged Warbler Partnership that aims to create and manage young forests for the golden-winged warbler (Vermivora chrysoptera; McNeil et al., 2020; Litvaitis et al., 2021). Golden-winged warblers are an early successional associate that benefits from a diverse forest landscape consisting of recent harvests adjacent to older forests to rear their young (Confer et al., 2020; Fiss et al., 2020). We also surveyed nearby public forest lands managed by the Pennsylvania Game Commission (State Game Lands) or Pennsylvania Department of Conservation and Natural Resources (DCNR; State Forests [SF]). Because native bees are abundant in young forests that regenerate after harvest (Mathis et al., 2021), this system provided an excellent context within which to study bee sampling methods.
In 2019, we monitored 40 timber harvests that experienced overstory removal in the stand initiation stage post-harvest (< 6 years post-harvest; 20 publicly owned, 20 privately owned). Using ArcMap 10.2 (ESRI, 2011), a random point was generated within the boundary for chosen harvests using the Create Random Points tool and a 66-m transect oriented N-S was centered on this point. The center of the sampling transects were at least 80m from the harvest edge to avoid potential edge effects; when this was not possible due to harvest size/geometry, the center of the transect was placed at the geometric center of the harvest. Our point placement protocol was identical to McNeil et al. (2019); McNeil et al. (2020) and additional details can be found therein.
Bee surveys
Bee survey methods were originally published by Mathis et al. (2021). We visited 40 young forest sites every two weeks in 2019 (n = 9 visits; 15 May – 15 September). On each survey, a single observer walked a 66-m North-South transect for 30 minutes counting all bees detected and estimating the perpendicular distance of each bee from the transect upon initial detection (Buckland et al., 2015; McNeil et al., 2019). We categorized bees to 6 morphogroups, but due to insufficient numbers in each group, they are pooled into one dataset for the analyses herein. At the time of each survey, we also recorded the following visit-specific variables that might impact detection probability: wind (Beaufort Wind Index, World Meteorological Organization, 1970), cloud cover (percent), and temperature. We did not conduct surveys in high winds (Beaufort Wind Index > 4), during rain, or when the temperature was< 15 degrees Celsius, as these conditions are not favorable to insect activity (Ward et al., 2014; Dibble et al., 2018) and would severely impact detection probability. In addition to our non-lethal transect surveys, we collected bees using bee bowls and blue-vane traps. All traps had approximately 2cm of water mixed with Dawn™ Ultra blue dishwashing soap (Procter & Gamble, Cincinnati, Ohio, U.S.) and were collected after 24-h. Because traps were not placed under consistent weather conditions, we used weather data collected from the Weather Underground (www.wunderground.com) to characterize conditions for each trap’s active period, including average temperature (C), average humidity (%), average windspeed (mph), average atmospheric pressure, and total accumulated precipitation (cm). Note that we did not use netting in our bee surveys for several reasons. In addition to being explicitly compared to distance sampling by McNeil et al. (2019) already, many of our sites contained thick vegetation including brambles that were likely to damage nets and reduce the likelihood that we could swing nets in a systematic way across our sites. Species-level identifications are published in Mathis et al. (2021) and are available upon request.
Floral survey and vegetation surveys
Immediately following the visual bee surveys, we walked the same 66-m transect to estimate the floral resources available at the time of survey. We recorded all actively blooming flowering stems 1-m on either side of the transect to species and counted or estimated the number of individual flowers per stem within a 66x2m swath of habitat. We also measured structural vegetation at each location, once, in July. Briefly, we collected vegetation data along 3 radial transects (0 degrees, 120 degrees, and 240 degrees) that were 50-m in length. We used an ocular tube (James and Shugart, 1970) to record the presence of various plant strata, where only the strata that were within the “crosshairs” of the ocular tube were considered present. We collected presence data of plant strata every 10 m (for a total of 15 sampling locations per harvest). The vegetation strata included canopy cover, tall (>1m) saplings, short (<1m) shrubs, ferns, forbs, and grass. Distinctions between different vegetation classes were chosen as per McNeil et al. (2019). Full floral species list is available in Mathis et al. (2022) and is available upon request.
Statistical analyses
Prior to statistical analyses, we assessed pairwise correlations among all pairs of explanatory variables to confirm that they were not too highly correlated (Spearman’s ρ ≥ 0.70; Sokal and Rohlf, 1981). Additionally, we scaled all quantitative variables to have a mean of 0 and a standard deviation of 1 using the scale function in program R (R Core Team, 2020). Due to data-skew, we log-transformed floral density prior to analyses. We calculated floral diversity as the effective species unit variation of the Shannon-Weiner Diversity Index (eH’; Jost, 2006).
Hierarchical distance models for density estimation
To model bee distance data, we fit HDMs using the package “unmarked” in R (Fiske and Chandler, 2011; McNeil et al., 2019). These models have several important assumptions. We assume that all individuals are identified correctly (e.g., other insects are not incorrectly identified as bees), are detected at their initial location from the transect with an accurate distance estimated, and that detections are independent (Thomas et al., 2010). We modeled each sampling bout independently of the others (n=9) to investigate if floral characteristics varied within the year. For analysis, distances from the transect were binned into 5 bins: 0–1m, 1–2m, 2–3m, 3–4m, 4–5m. All observations beyond 5m were excluded from analysis (McNeil et al., 2019). We modeled both “site covariates” (characteristics describing the site such as floral abundance and floral diversity, fit to λ) and “survey covariates” (characteristics that varied among visits such as time of observation and wind index, fit to p). Specifically, we modeled the following site covariates: stand age (years since timber harvest), vegetation (% cover metrics), and floral resources (log-transformed floral abundance and diversity) and the following survey covariates: wind index, temperature, cloud cover, time of day, and ordinal date. We selected the key-function (hazard rate, half-normal, uniform, or exponential) and statistical distribution (Poisson or negative binomial) that best fit the data using the methodology explained by Kéry and Royle (2015). For more information on using HDMs for density estimation of insects, see McNeil et al. (2019).
We used a two-step model building protocol: step 1 assessed the most predictive detection covariates and step 2 assessed the most predictive density covariates. In step 1, we created univariate models for each observation covariate while holding λ constant (e.g., “p[wind], λ [.]” or “p[date], λ [.]”) and ranked them in descending order of Akaike’s Information Criterion adjusted for small sample size (AICc; Burnham and Anderson, 2004). We also ranked a null (intercept-only) detection model (“p[.], λ [.]”). Models were considered biologically meaningful if they had an ΔAICc > 2.00 compared to the null model, and β parameter 95% confidence intervals not overlapping zero. All variables within univariate biologically meaningful models were placed into a multivariate “global” model and backwards stepwise selection was used to determine the model with the lowest AICc value. For step 2, survey covariates within the top model from step 1 were used as covariates on the detection (p) component of all following models. For both steps, we created univariate and multivariate models for each habitat covariate and covariate pairs and applied the same information theoretic approach to assessing models. We ran a goodness-of-fit test using the function fitstats (Kéry and Royle, 2015) on the top candidate model to make sure that the final model was not over-dispersed (~1).
Generalized linear models
To investigate how structural vegetation, patch characteristics, and floral resources affected annual pollinator abundance across three methodologies (visual survey within 2-m of transect line, BVT, and bee bowl), we used linear mixed-effects models in R (lme4 package: Bates et al., 2015). To account for non-independence among visits to the same point location, site ID was included as a random effect, and all other variables (floral abundance [natural-log of count], floral diversity [effective species unit: eH’: Jost, 2006], stand age [#growing seasons post-harvest], tall (>1m) saplings [% cover], short (<1m) shrubs [% cover], ferns [% cover], grass [% cover]) were treated as fixed effects. Additionally, we used negative binomial generalized linear models in R (glm.nb function: Venables and Ripley, 2002) to assess how associations with floral abundance and floral diversity varied by each sampling bout. For all linear modeling, every possible univariate- and bivariate combination of models was created and compared to a null model. Models were assessed using the same information theoretic approach mentioned above (see Hierarchical Distance Models for Density Estimation).
Results
Bee counts + weather effects on detection probability
We collected 1,253 total bees (n=544 bee bowls; n=709 blue-vane traps). During the 30-minute observational surveys, we observed 1,565 total bees within 2-m on either side of the transect line (considered visual survey “raw counts”), and 2,186 individuals up to 5-m away from the transect line (used in HDMs). Our models indicated that bee detection probability was impacted by all observation covariates (time of day, percent cloud cover, wind speed, temperature, date) at various times across our study. In our HDMs, wind and temperature were significant predictors of detection probability in 22% of all models, with higher wind speeds resulting in fewer bees observed and higher temperatures resulting in more bees observed. Additionally, 22% of models had detection probabilities that were affected by time of survey (positively), cloud cover (negatively), and ordinal date (positively). Bee detection was constant in only one model (sampling bout 4; late June-early July).
Predictions from different methodologies
When bee abundance values from each of our three alternative methods were compared to those derived from HDMs, the 2-m visual transect had the highest similarity to HDM estimates (adjusted R2 = 0.48; Figure 1). In contrast, both trapping methods yielded bee counts that were very dissimilar to HDM-estimated densities (both adjusted R2 ~ 0.01; Figure 1). Hierarchical distance models indicated a positive association between “% forb cover” and “% grass cover” and bee density, a result that was shared with the analysis of raw visual transect counts (Table 1). In contrast, while both BVT and bee bowl analyses had a covariate for “% forb cover” competing, they also had “% fern cover” with a positive beta parameter, a result that contradicts previous studies in our focal region (Mathis et al., 2021).
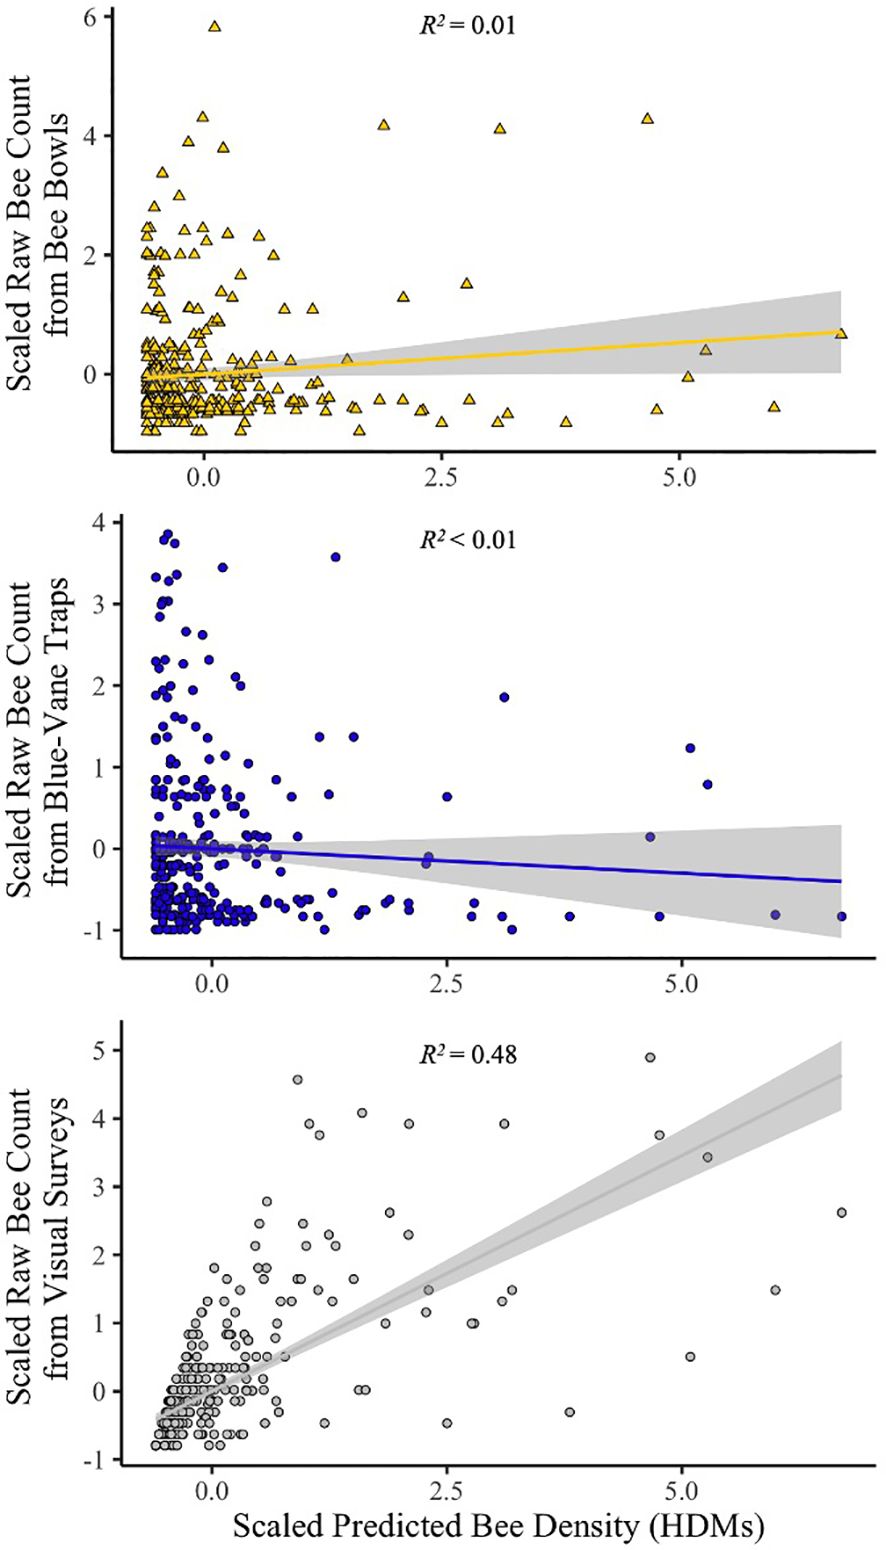
Figure 1 Regression lines for raw bee counts against predicted bee densities from HDMs with associated adjusted r-squared values. Gray areas surrounding regression lines are 95% confidence intervals.
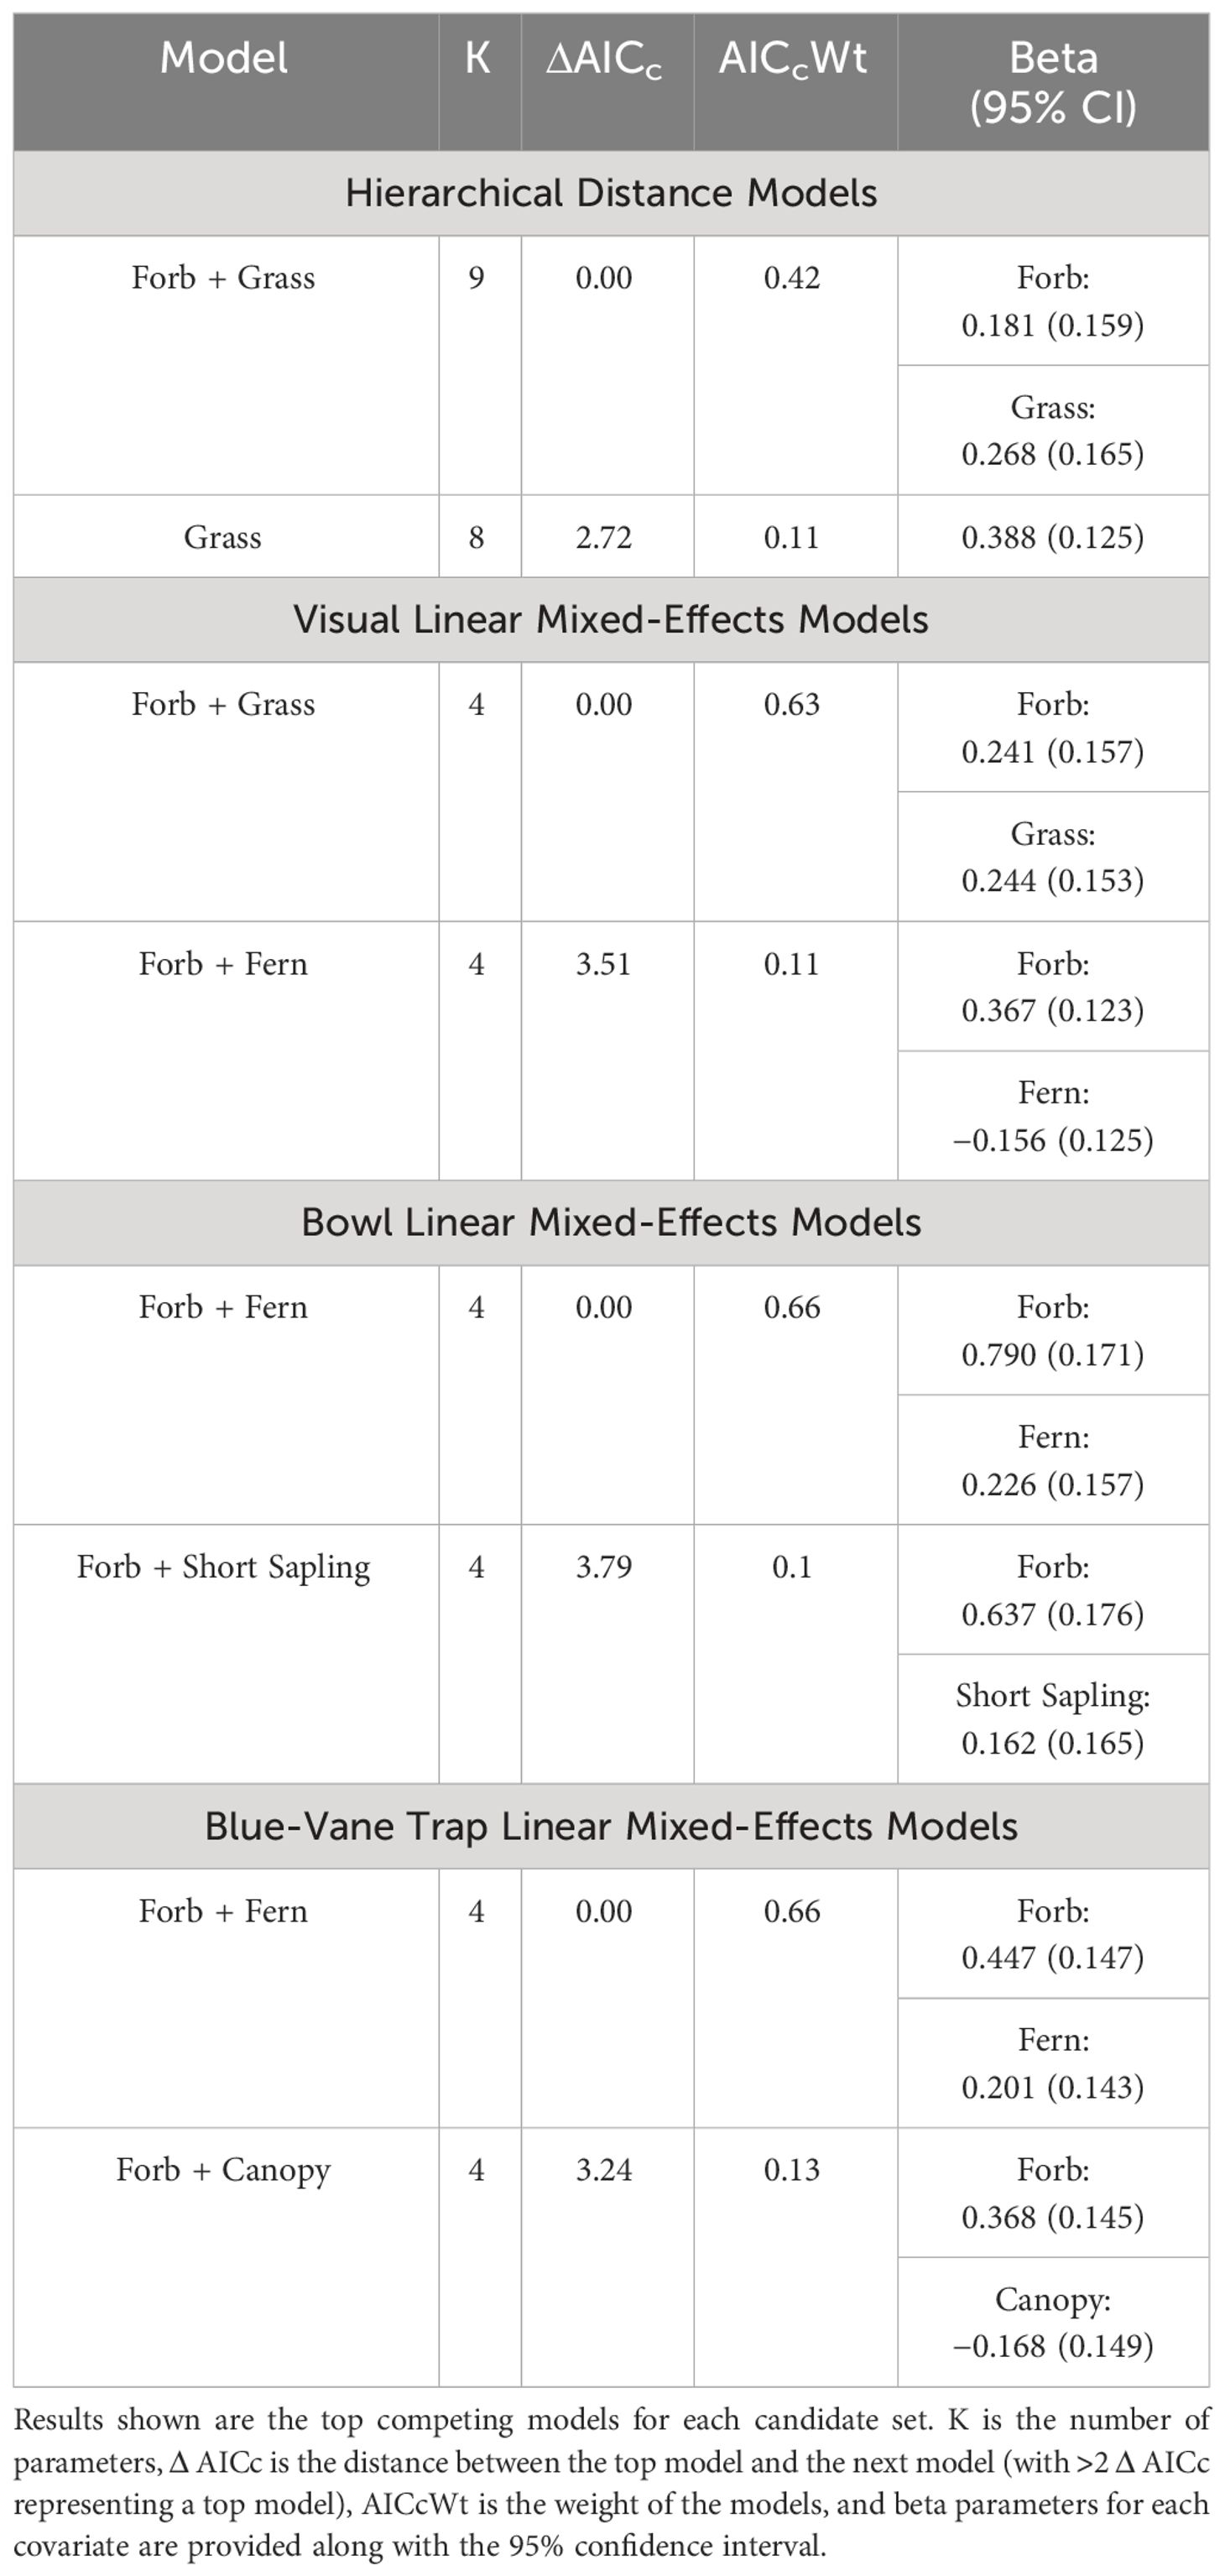
Table 1 Results from models for habitat associations between HDMs and linear mixed-effects models for visual surveys, bee bowls, and blue-vane traps.
HDMs indicated that bee density was positively associated with both floral abundance and diversity, as commonly observed in many bee communities (Potts et al., 2003; Mallinger et al., 2016; Kuhlman et al., 2021; Table 2). Our analysis of visual transect data aligned with the HDM predictions in that a positive relationship with both floral abundance and diversity was revealed (Table 2). In contrast, both trapping methods predicted a negative association between bee abundance and floral abundance. When we regressed the residuals of the regression lines against estimates of density derived from HDMs (Figure 2), we find that in times of low floral abundance, the trapping methods catch more bees than are observed in visual surveys and predicted in our models. Conversely, in times of high floral abundance, there are fewer bees captured in trapping methods than are observed and predicted in density estimates.
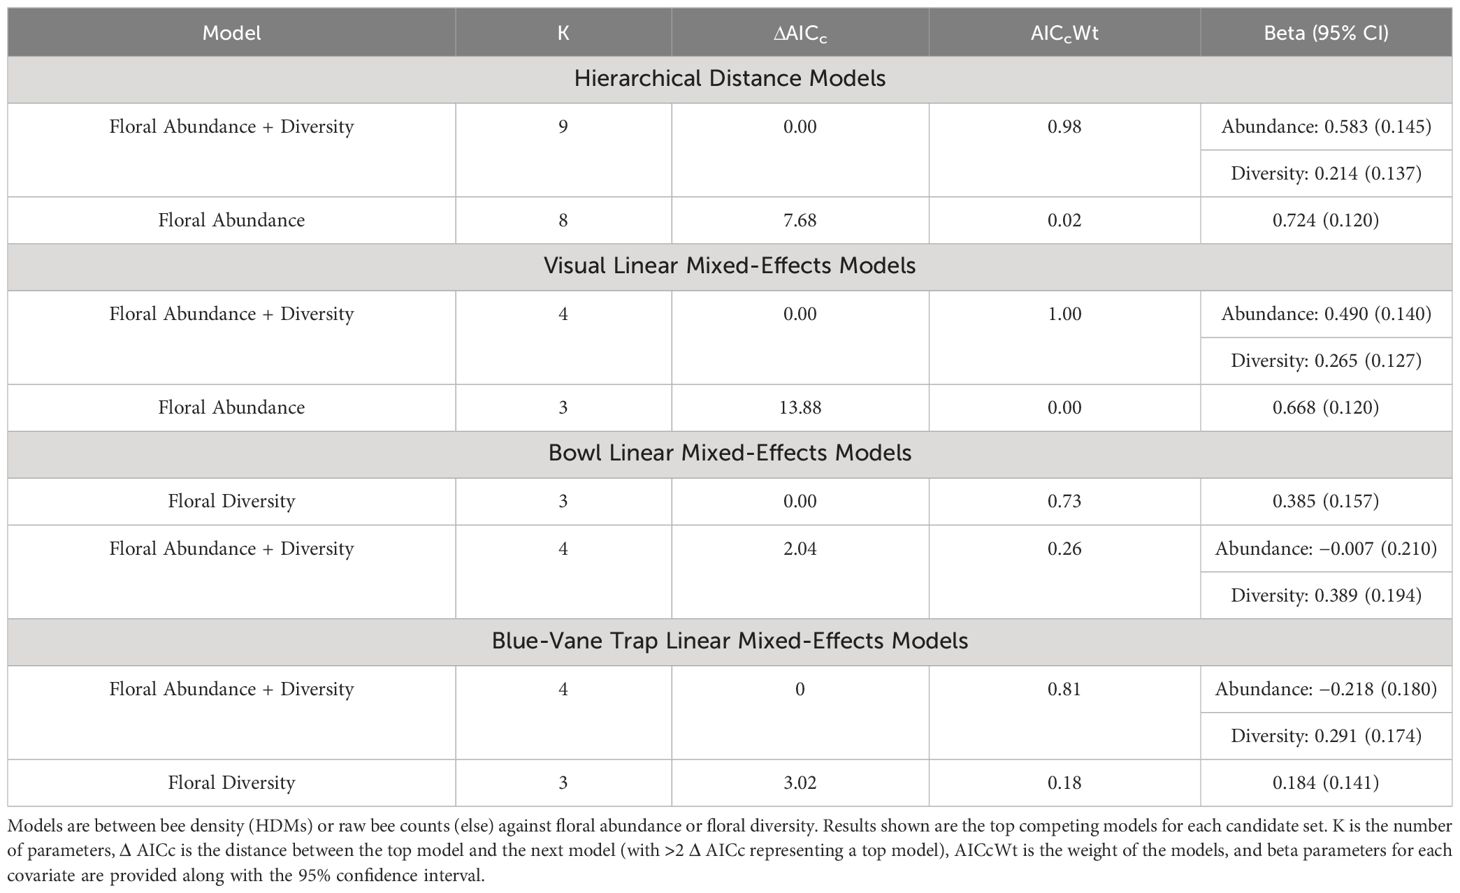
Table 2 Results from models for HDMs and linear mixed-effects models for visual surveys, bee bowls, and blue-vane traps.
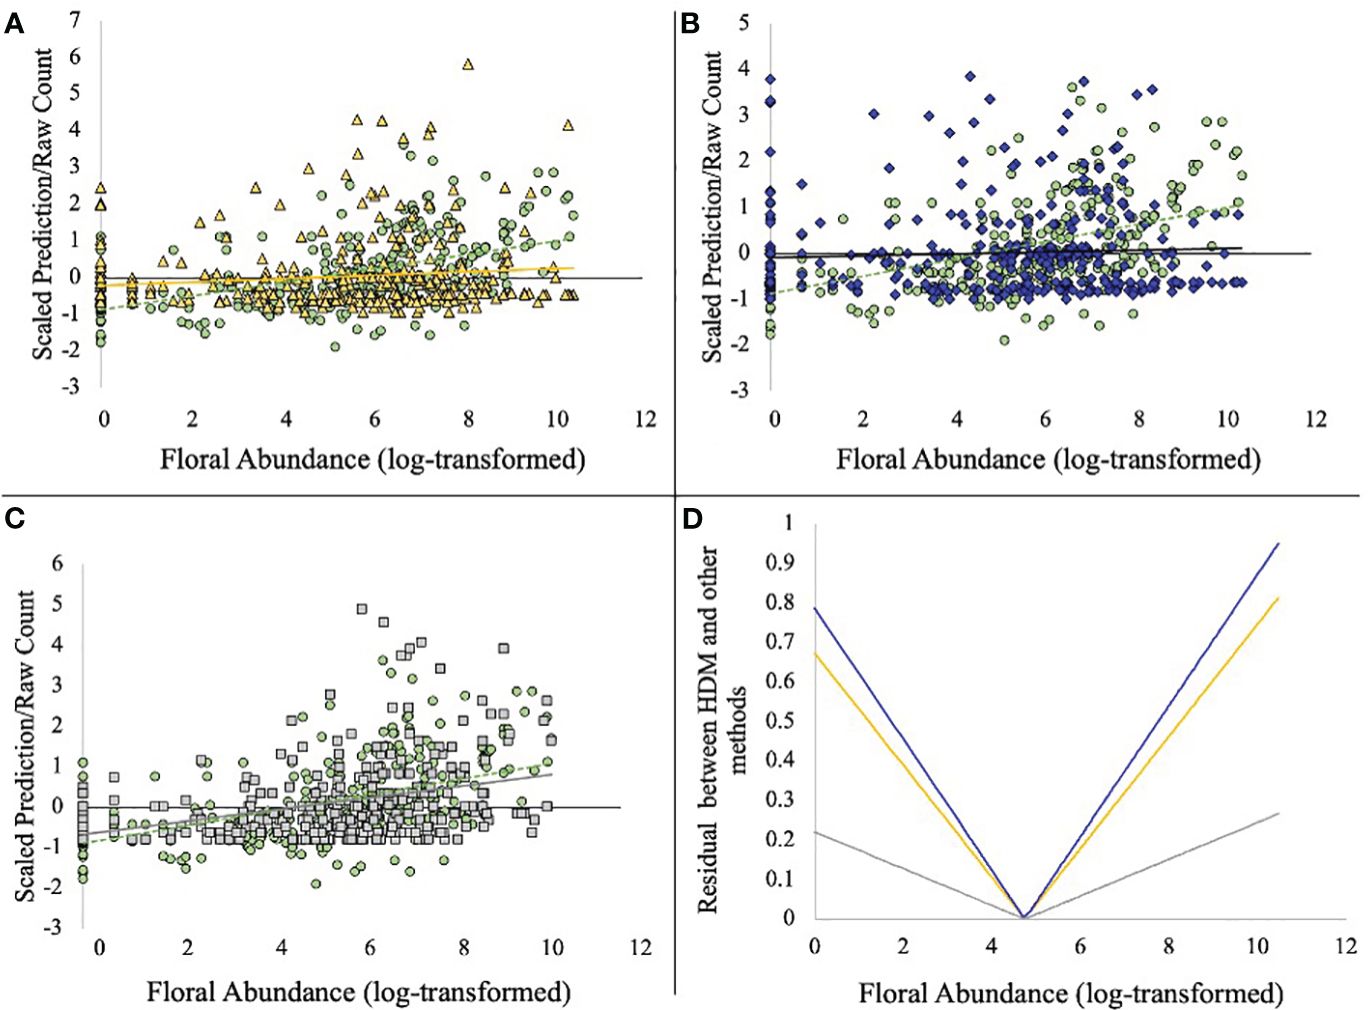
Figure 2 The residual between model predictions of bee density or raw counts along the floral abundance spectrum. In (A–C), HDM prediction models are shown as green circles and the dashed regression line. (A) (top left): HDM prediction points and raw counts from bee bowls (yellow triangles) plotted simultaneously along a gradient of floral abundance (log-transformed). (B) (top right): HDM prediction points and raw counts from blue-vane traps (dark blue diamonds) plotted simultaneously along a gradient of floral abundance. (C) (bottom left): HDM prediction points and raw counts from visual survey (gray squares) are plotted simultaneously along a gradient of floral abundance. (D) (bottom right): The absolute residual between the regression lines in (A–C) when compared to the HDM prediction line, highlighting the magnitude of bias as a factor of floral abundance. Dark blue (top line) represents blue-vane traps; yellow (middle line) represent bee bowls; gray (bottom line) represents visual surveys.
Within-season floral variation
Results from linear mixed-effects models using visual raw counts always aligned with the results of HDMs and exhibit a consistent positive association between bee abundance and floral abundance across the growing season (Figures 1–3). In contrast, models of blue-vane traps and bee bowls only indicated positive associations between floral abundance and bee abundance during the known floral dearth in late June + July (Mathis et al., 2022) and otherwise had no association (Figure 3).
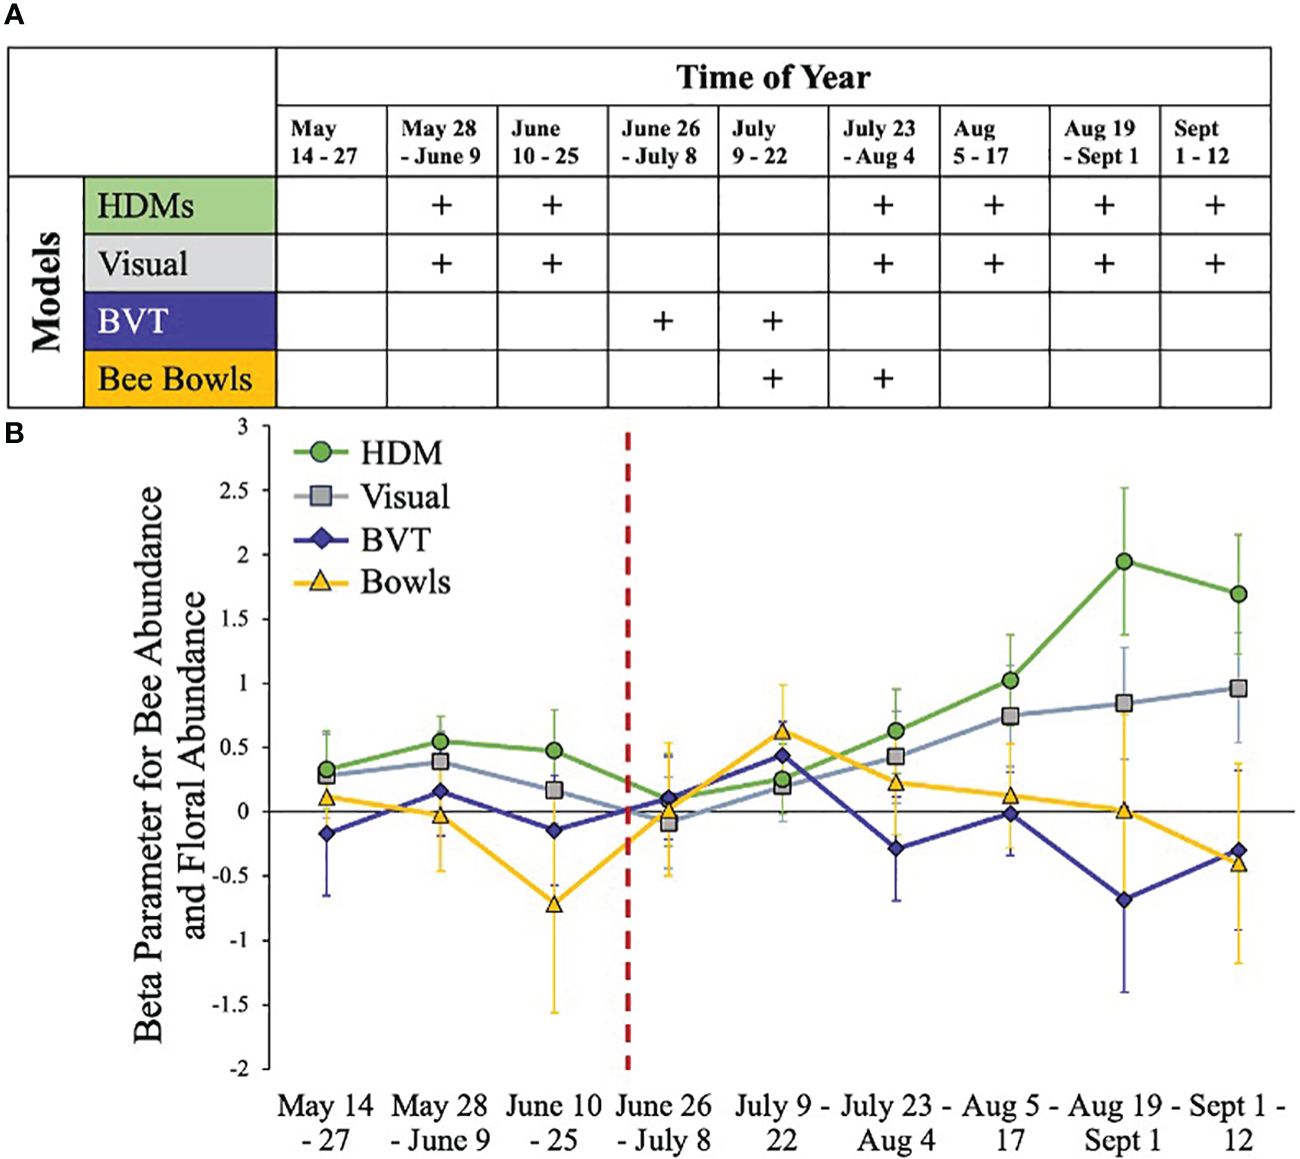
Figure 3 Associations between floral abundance and model type across survey methods. Here, we consider HDMs to be a relatively unbiased assessment of habitat associations as they account for detection probability. (A) Graphic showing the sign of the associations between floral abundance and model type across the growing season. A plus sign is a positive association and a blank space is no association. (B) The beta parameters from the different models across time with standard error bars. The dashed red line indicates when leaf-out occurred on our sites.
Discussion
To our knowledge, our study is the first to critically analyze trapping methodologies commonly used to assess whole-community bee abundance against methods that account for imperfect detection (though see Briggs et al., 2022 for group-specific investigations). Given the growing need to develop consistent and rigorous methods for monitoring bee abundance (Tepedino et al., 2015; Brown et al., 2016; Klaus et al., 2024), it is imperative to assess candidate approaches for biases and adjust monitoring efforts accordingly. Our results demonstrate that two of the most frequently used survey methods, blue-vane traps and bee bowls, have critical biases in collection patterns that may make their data unsuitable for many applications. Moreover, the sampling biases, themselves, varied across the growing season such that trapping data provided a reasonable index of bee abundance at some time points (i.e., when floral abundance was “moderate”) but, at other points in the growing season, data were unreliable. Indeed, during times of low floral abundance, indices of bee abundance from trapping were over-inflated, while the reverse was true when floral abundance was high. Past studies have either acknowledged a potential bias (Baum and Wallen, 2011) or begun the work of understanding the biases (Kuhlman et al., 2021). Cane et al., 2000 suggested that flowers are more attractive than are the traps which may explain this pattern: when there are few flowers, traps are more visible and draw in more bees. Taken together, our results support the findings of Kuhlman et al. (2021), who asserted that attractive traps should be used cautiously and in conjunction with other survey methods like visual surveys or netting.
Beyond relationships with floral characteristics, our results suggest that structural vegetation may impact counts of trapped bees in ways that relate more to trap performance or visibility than bee ecology or abundance. Our models indicated that traps were more effective at capturing bees when forb density is high (though not when those forbs are in bloom), and when fern density was high. Previous research has shown that ferns negatively impact bee densities by outcompeting floral resources (Mathis et al., 2021, Mathis et al., 2022) and therefore result in a landscape with few understory flowers. This lack of flowers likely increases the attractiveness of traps (Baum and Wallen, 2011; Kuhlman et al., 2021), which could lead to an erroneous assumption that bees prefer sites with dense fern coverage (Mackenzie, 2006). Thus, while we believe our results support the use of attractive traps to study bee richness or presence/absence, they provide an ineffective – and, at times, misleading – index of bee abundance (Droege et al., 2010; Portman et al., 2020; Kuhlman et al., 2021). Given this, we stress that researchers should critically consider the use of attractive trapping methods (like blue-vane traps and bee bowls) and incorporate non-attractive methods (like visual transects) if density/abundance is of primary interest (as reviewed in Montero-Castaño et al., 2022).
Our results further highlight the value of using distance data to understand bee densities while accounting for detection probabilities within a site. While we used HDMs to investigate the bee community as a whole, these models can also be used for lower taxa (e.g., single genera/groups; Loffland et al., 2017; McNeil et al., 2019) or other arthropod orders (Lepidoptera: Mathis et al., 2021). Whether using HDMs or other statistical models, our results show the importance of accounting for variables that affect detection probability in the modeling stage, such as weather, vegetation density, or distance from observer. Even after only conducting surveys in “optimal weather” (as defined by the Xerces Bee Monitoring Protocol: Ward et al., 2014), we showed that weather was still a significant covariate that impacted detection in most sampling rounds. Finally, we acknowledge that HDMs provide our best approximation of bee density, but it is still not possible to know the true density of bees on a landscape and compare that to number of individuals in the traps. We used HDMs to understand trap biases, but there are promising equations on the horizon that may approximate insect abundance or density to trap catch (Onufrieva and Onufriev, 2021). The authors suggest a universal mathematical relationship that bridges absolute population density and trap catches. This is the first step towards being able to use statistical equations to approximate density from traps, which circumvents the need to account for detection probability. However, this research is still in its nascent stages and needs further testing, so we still believe that accounting for detection probability through modeling frameworks is an important consideration for studies seeking to understand bee abundance.
Future directions
Future studies could investigate the effectiveness of using HDM transects in conjunction with netting to obtain detection-adjusted density estimates (from HDMs) and species richness data (through netting). It is important to emphasize that some studies will still need to use passive trapping methodologies to provide species-level identification (as described in Westphal et al., 2008). One limitation of our sampling schema was the placement of bee bowls on the ground rather than elevating them; ground level traps are likely to under-represent bees that are foraging in the shrub or high forb cover (Cane et al., 2000). An investigation into whether elevating bee bowls to the height of surrounding blooming vegetation could alleviate some of the biases our data show is warranted, though further examination of other trapping methods that are not based on attraction would be more prudent. Future studies could investigate flight-intercept traps (as used in Ulyshen et al., 2010), which do not operate based on luring bees with an attractant but, instead, by intercepting the flight trajectory of flying insects (Hill & Cermak, 1997). A study using flight-intercept traps in conjunction with blue-vane traps and bee bowls could compare their efficacy and determine if captures vary taxonomically and seasonally. Moreover, it would be interesting to compare counts derived from flight-intercept traps to estimates from detection-adjusted methods. Finally, it is worth mentioning that the bycatch obtained when sampling bees with attractive traps (average of 63% of pan trap collections, Gonzalez et al., 2020) often goes unexamined (i.e., is wasted). A further consideration for increased use of trapping methods for bee monitoring would be to collaborate with experts of other taxa to most efficiently use non-target specimens. An investigation into what non-target specimens are captured in common bee trapping methods (blue-vane traps and bee bowls) is warranted.
Conclusion
As bee conservation is becoming a global priority, our need to increase monitoring efforts while assessing the biases of our current monitoring methods is paramount. By using hierarchical distance models, we were able to compare trap captures of bees to modeled densities and highlight the inherent biases of attractive traps. Our results illuminate the inconsistencies of trap efficacy depending on surrounding vegetation characteristics and floral resources, which could lead to erroneous understandings of bee abundance and habitat associations if taken at face value. We recommend that all bee surveys, even if they are conducted in optimal weather conditions, include model covariates of weather values (cloud cover, temperature, precipitation) and surrounding floral resource availability (floral abundance and richness) as proxies for detection probability. We caution against the use of attractive traps as an index for bee abundance and instead suggest alternative methods (netting, visual surveys, non-lethal surveys).
Data availability statement
The raw data supporting the conclusions of this article will be made available by the authors, without undue reservation.
Ethics statement
The manuscript presents research on animals that do not require ethical approval for their study.
Author contributions
CM: Conceptualization, Data curation, Formal analysis, Investigation, Methodology, Visualization, Writing – original draft, Writing – review & editing. DM: Conceptualization, Investigation, Methodology, Visualization, Writing – review & editing. MK: Conceptualization, Methodology, Visualization, Writing – review & editing. JL: Funding acquisition, Writing – review & editing. MS: Funding acquisition, Visualization, Writing – review & editing.
Funding
The author(s) declare financial support was received for the research, authorship, and/or publication of this article. The collection of these data was funded through USDA Natural Resource Conservation Service’s Conservation Effects Assessment Project (#68-7482-12-502) and Indiana University of Pennsylvania’s School of Graduate Studies and Research. The publication of this article was funded by the IUP Research Institute at the Indiana University of Pennsylvania and the Department of Entomology at Penn State University.
Acknowledgments
We thank the Pennsylvania Game Commission’s and DCNR Bureau of Forestry for allowing access to study sites and assisting with project logistics (PGC Permit 36850; DCNR Permit: SFRA-0803). We are grateful to the many private forest landowners who granted us access to their properties. We thank our field technicians: Katie Gray, Justin O’Neill, Josh Stevens, and Sara Trio. We thank Drs. C. Mahan, C. Sclar, M. Kersch-Becker and J. Urban for courtesy reviews. We thank two reviewers for comments that enhanced the quality of this manuscript.
Conflict of interest
The authors declare that the research was conducted in the absence of any commercial or financial relationships that could be construed as a potential conflict of interest.
Publisher’s note
All claims expressed in this article are solely those of the authors and do not necessarily represent those of their affiliated organizations, or those of the publisher, the editors and the reviewers. Any product that may be evaluated in this article, or claim that may be made by its manufacturer, is not guaranteed or endorsed by the publisher.
References
Amundson C. L., Royle J. A., Handel C. M. (2014). A hierarchical model combining distance sampling and time removal to estimate detection probability during avian point counts. Auk: Ornithological Adv. 131, 476–494. doi: 10.1642/AUK-14-11.1
Barrett M., Fischer B., Buchmann S. (2023). Informing policy and practice on insect pollinator declines: Tensions between conservation and animal welfare. Front. Ecol. Evol. 10, 1071251. doi: 10.3389/fevo.2022.1071251
Bates D., Maechler M., Bolker B., Walker S. (2015). Fitting linear mixed-effects models using lme4. J. Stat. Software 67, 1–48. doi: 10.18637/jss.v067.i01
Baum K. A., Wallen K. E. (2011). Potential bias in pan trapping as a function of floral abundance. J. Kansas Entomological Soc. 84, 155–159. doi: 10.2317/JKES100629.1
Briggs E. L., Baranski C., Münzer Schaetz O., Garrison G., Collazo J. A., Youngsteadt E. (2022). Estimating bee abundance: can mark-recapture methods validate common sampling protocols?. Apidologie 53 (1), 10.
Brown M. J., Dicks L. V., Paxton R. J., Baldock K. C., Barron A. B., Chauzat M. P., et al. (2016). A horizon scan of future threats and opportunities for pollinators and pollination. PeerJ 4, e2249. doi: 10.7717/peerj.2249
Buckland S. T., Rexstad E. A., Marques T. A., Oedekoven C. S. (2015). Distance sampling: methods and applications Vol. 431 (New York: Springer). doi: 10.1007/978-3-319-19219-2
Burnham K. P., Anderson D. R. (2004). Multimodel inference: understanding AIC and BIC in model selection. Sociological Methods Res. 33, 261–304. doi: 10.1177/0049124104268644
Cameron S. A., Lozier J. D., Strange J. P., Koch J. B., Cordes N., Solter L. F., et al. (2011). Patterns of widespread decline in North American bumble bees. Proc. Natl. Acad. Sci. 108, 662–667. doi: 10.1073/pnas.1014743108
Cane J. H., Minckley R. L., Kervin L. J. (2000). Sampling bees (Hymenoptera: Apiformes) for pollinator community studies: pitfalls of pan-trapping. J. Kansas entomological Soc. 73(4):225–231.
Confer J. L., Hartman P., Roth A. (2020). “Golden-winged Warbler (Vermivora chrysoptera), version 1.0,” in Birds of the world. Ed. Poole A. F. (Cornell Lab of Ornithology, Ithaca, NY, USA). doi: 10.2173/bow.gowwar.01
Dibble A. C., Drummond F. A., Averill A. L., Bickerman-Martens K., Bosworth S. C., Bushmann S. L., et al. (2018). Bees and Their Habitats in Four New England States (Orono, Maine, USA: The University of Maine), 58. Misc. Report No. 448; Maine Agricultural and Forest Experiment Station.
Droege S., Tepedino V. J., LeBuhn G., Link W., Minckley R. L., Chen Q., et al. (2010). Spatial patterns of bee captures in North American bowl trapping surveys. Insect Conserv. Diversity 3, 15–23. doi: 10.1111/j.1752-4598.2009.00074.x
ESRI (2011). ArcGIS Desktop: Release 10.2 Vol. 2 (Redlands, CA: Environmental Systems Research Institute).
Fiske I., Chandler R. (2011). Unmarked: an R package for fitting hierarchical models of wildlife occurrence and abundance. J. Stat. Software 43, 1–23. doi: 10.18637/jss.v043.i10
Fiss C. J., McNeil D. J., Rodewald A. D., Duchamp J. E., Larkin J. L. (2020). Post-fledging Golden-winged Warblers require forests with multiple stand developmental stages. Condor 122, duaa052. doi: 10.1093/condor/duaa052
Gibbs J., Joshi N. K., Wilson J. K., Rothwell N. L., Powers K., Haas M., et al. (2017). Does passive sampling accurately reflect the bee (Apoidea: Anthophila) communities pollinating apple and sour cherry orchards? Environ. Entomology 46, 579–588. doi: 10.1093/ee/nvx069
Gonzalez V. H., Osborn A. L., Brown E. R., Pavlick C. R., Enríquez E., Tscheulin T., et al. (2020). Effect of pan trap size on the diversity of sampled bees and abundance of bycatch. J. Insect Conserv. 24, 409–420. doi: 10.1007/s10841-020-00224-4
Gu W., Swihart R. K. (2004). Absent or undetected? Effects of non-detection of species occurrence on wildlife–habitat models. Biol. Conserv. 116, 195–203. doi: 10.1016/S0006-3207(03)00190-3
Hill C. J., Cermak M. (1997). A new design and some preliminary results for a flight intercept trap to sample forest canopy arthropods. Aust. J. Entomology 36, 51–55. doi: 10.1111/j.1440-6055.1997.tb01431.x
Hudson J., Horn S., Hanula J. L. (2020). Assessing the efficiency of pan traps for collecting bees (Hymenoptera: Apoidea). J. Entomological Sci. 55, 321–328. doi: 10.18474/0749-8004-55.3.321
Jacobson M. M., Tucker E. M., Mathiasson M. E., Rehan S. M. (2018). Decline of bumble bees in northeastern North America, with special focus on Bombus terricola. Biol. Conserv. 217, 437–445. doi: 10.1016/j.biocon.2017.11.026
James F. C., Shugart H. H. Jr (1970). A quantitative method of habitat description. Audubon Field Notes 24, 727–736.
Joshi N. K., Leslie T., Rajotte E. G., Kammerer M. A., Otieno M., Biddinger D. J. (2015). Comparative trapping efficiency to characterize bee abundance, diversity, and community composition in apple orchards. Ann. Entomological Soc. America 108, 785–799. doi: 10.1093/aesa/sav057
Keele E. C., McNeil D. J., Duchamp J. E., Larkin J. L. (2023). Factors driving bumble bee (Hymenoptera: Apidae: Bombus) and butterfly (Lepidoptera: Rhopalocera) use of sheared shrubland and young forest communities of the western Great Lakes. Environ. Entomology 52, 1095–1107. doi: 10.1093/ee/nvad101
Kellner K. F., Swihart R. K. (2014). Accounting for imperfect detection in ecology: a quantitative review. PLoS One 9, e111436. doi: 10.1371/journal.pone.0111436
Kéry M., Royle A. J. (2015). Applied Hierarchical Modeling in Ecology: Analysis of Distribution, Abundance and Species Richness in R and BUGS: Volume 1: Prelude and Static Models (Cambridge, Massachussetts: Academic Press).
Klaus F., Ayasse M., Classen A., Dauber J., Diekötter T., Everaars J., et al. (2024). Improving wild bee monitoring, sampling methods, and conservation. Basic Appl. Ecology. 75:2-11. doi: 10.1016/j.baae.2024.01.003
Koh I., Lonsdorf E. V., Williams N. M., Brittain C., Isaacs R., Gibbs J., et al. (2016). Modeling the status, trends, and impacts of wild bee abundance in the United States. Proc. Natl. Acad. Sci. 113, 140–145. doi: 10.1073/pnas.1517685113
Kuhlman M. P., Burrows S., Mummey D. L., Ramsey P. W., Hahn P. G. (2021). Relative bee abundance varies by collection method and flowering richness: Implications for understanding patterns in bee community data. Ecol. Solutions Evidence 2, e12071. doi: 10.1002/2688-8319.12071
Litvaitis J. A., Larkin J. L., McNeil D. J., Keirstead D., Costanzo B. (2021). Addressing the early-successional habitat needs of at-risk species on privately owned lands in the eastern United States. Land 10, 1116. doi: 10.3390/land10111116
Loffland H. L., Polasik J. S., Tingley M. W., Elsey E. A., Loffland C., Lebuhn G., et al. (2017). Bumble bee use of post-fire chaparral in the central Sierra Nevada. J. Wildlife Manage. 81, 1084–1097. doi: 10.1002/jwmg.21280
Lövei G. L., Ferrante M. (2024). The use and prospects of nonlethal methods in entomology. Annu. Rev. Entomology 69:183-198. doi: 10.1146/annurev-ento-120220-024402
Mackenzie D. I. (2006). Modeling the probability of resource use: the effect of, and dealing with, detecting a species imperfectly. J. Wildlife Manage. 70, 367–374. doi: 10.2193/0022-541X(2006)70[367:MTPORU]2.0.CO;2
MacKenzie D. I., Nichols J. D., Sutton N., Kawanishi K., Bailey L. L. (2005). Improving inferences in population studies of rare species that are detected imperfectly. Ecology 86, 1101–1113. doi: 10.1890/04-1060
Mallinger R. E., Gibbs J., Gratton C. (2016). Diverse landscapes have a higher abundance and species richness of spring wild bees by providing complementary floral resources over bees’ foraging periods. Landscape Ecol. 31, 1523–1535. doi: 10.1007/s10980-015-0332-z
Mata L., Goula M., Hahs A. K. (2014). Conserving insect assemblages in urban landscapes: accounting for species-specific responses and imperfect detection. J. Insect Conserv. 18, 885–894. doi: 10.1007/s10841-014-9696-7
Mathis C. L. (2020). Habitat ecology of native pollinator communities Within Early Successional Deciduous Forests of the Central Appalachian Mountains of Pennsylvania. Indiana, PA, USA: Indiana University of Pennsylvania.
Mathis C. L., McNeil D. J. Jr., Lee M. R., Grozinger C. M., King D. I., Otto C. R., et al. (2021). Pollinator communities vary with vegetation structure and time since management within regenerating timber harvests of the Central Appalachian Mountains. For. Ecol. Manage. 496, 119373. doi: 10.1016/j.foreco.2021.119373
Mathis C. L., McNeil D. J. Jr., Lee M. R., Grozinger C. M., Otto C. R., Larkin J. L. (2022). Can’t see the flowers for the trees: factors driving floral abundance within early successional forests in the central Appalachian Mountains. Can. J. For. Res. 52, 1002–1013. doi: 10.1139/cjfr-2022-0014
McNeil D. J., Otto C. R., Moser E. L., Urban-Mead K. R., King D. E., Rodewald A. D., et al. (2019). Distance models as a tool for modelling detection probability and density of native bumblebees. J. Appl. Entomology 143, 225–235. doi: 10.1111/jen.12583
McNeil D. J., Rodewald A. D., Ruiz-Gutierrez V., Johnson K. E., Strimas-Mackey M., Petzinger S., et al. (2020). Multiscale drivers of restoration outcomes for an imperiled songbird. Restor. Ecol. 28, 880–891. doi: 10.1111/rec.13147
Montero-Castaño A., Koch J. B. U., Lindsay T. T. T., Love B., Mola J. M., Newman K., et al. (2022). Pursuing best practices for minimizing wild bee captures to support biological research. Conserv. Sci. Pract. 4, e12734. doi: 10.1111/csp2.12734
Nielsen A., Steffan-Dewenter I., Westphal C., Messinger O., Potts S. G., Roberts S. P., et al. (2011). Assessing bee species richness in two Mediterranean communities: importance of habitat type and sampling techniques. Ecol. Res. 26, 969–983. doi: 10.1007/s11284-011-0852-1
O'Connor R. S., Kunin W. E., Garratt M. P., Potts S. G., Roy H. E., Andrews C., et al. (2019). Monitoring insect pollinators and flower visitation: The effectiveness and feasibility of different survey methods. Methods Ecol. Evol. 10, 2129–2140. doi: 10.1111/2041-210X.13292
Onufrieva K. S., Onufriev A. V. (2021). How to count bugs: A method to estimate the most probable absolute population density and its statistical bounds from a single trap catch. Insects 12, 932. doi: 10.3390/insects12100932
Portman Z. M., Bruninga-Socolar B., Cariveau D. P. (2020). The state of bee monitoring in the United States: A call to refocus away from bowl traps and towards more effective methods. Ann. Entomological Soc. America 113, 337–342. doi: 10.1093/aesa/saaa010
Potts S. G., Vulliamy B., Dafni A., Ne'eman G., Willmer P. (2003). Linking bees and flowers: how do floral communities structure pollinator communities? Ecology 84, 2628–2642. doi: 10.1890/02-0136
Prendergast K. S., Menz M. H., Dixon K. W., Bateman P. W. (2020). The relative performance of sampling methods for native bees: an empirical test and review of the literature. Ecosphere 11, e03076. doi: 10.1002/ecs2.3076
R Core Team (2020). R: a language and environment for statistical computing (Vienna, Austria: R Foundation for Statistical Computing). Available at: https://www.R-project.org/.
Roulston T. A. H., Smith S. A., Brewster A. L. (2007). A comparison of pan trap and intensive net sampling techniques for documenting a bee (Hymenoptera: Apiformes) fauna. J. Kansas Entomological Soc. 80, 179–181. doi: 10.2317/0022-8567(2007)80[179:ACOPTA]2.0.CO;2
Sevon W. D. (2000). Physiographic Provinces of Pennsylvania (Harrisburg, PA: Map 13. Pennsylvania Geologic Survey).
Sokal R. R., Rohlf F. J. (1981). Biometry: the principles and practice of statistics in biological research (San Francisco: W. H. Freeman & Company).
Stephen W. P., Rao S. (2007). Sampling native bees in proximity to a highly competitive food resource (Hymenoptera: apiformes). J. Kansas Entomological Soc. 80, 369–376. doi: 10.2317/0022-8567(2007)80[369:SNBIPT]2.0.CO;2
Tepedino V. J., Durham S., Cameron S. A., Goodell K. (2015). Documenting bee decline or squandering scarce resources. Conserv. Biol. 29, 280–282. doi: 10.1111/cobi.12439
Tepedino V. J., Portman Z. M. (2021). Intensive monitoring for bees in North America: indispensable or improvident? Insect Conserv. Diversity 14, 535–542. doi: 10.1111/icad.12509
Thomas L., Buckland S. T., Rexstad E. A., Laake J. L., Strindberg S., Hedley S. L., et al. (2010). Distance software: Design and analysis of distance sampling surveys for estimating population size. J. Appl. Ecol. 47, 5–14. doi: 10.1111/j.1365-2664.2009.01737.x
Ulyshen M. D., Soon V., Hanula J. L. (2010). On the vertical distribution of bees in a temperate deciduous forest. Insect Conserv. Diversity 3, 222–228. doi: 10.1111/j.1752-4598.2010.00092.x
Venables W. N., Ripley B. D. (2002). Modern Applied Statistics with S. 4th ed. (New York: Springer), ISBN: 0-387-95457-0.
Ward K., Cariveau D., May E., Roswell M., Vaughan M., Williams N., et al. (2014). Streamlined Bee Monitoring Protocol for Assessing Pollinator Habitat. (Portland, OR: The Xerces Society for Invertebrate Conservation). 16 pp.
Westerberg L., Berglund H. L., Jonason D., Milberg P. (2021). Color pan traps often catch less when there are more flowers around. Ecol. Evol. 11, 3830–3840. doi: 10.1002/ece3.7252
Westphal C., Bommarco R., Carré G., Lamborn E., Morison N., Petanidou T., et al (2008). Measuring bee diversity in different European habitats and biogeographical regions. Ecological monographs 78 (4), 653–671.
Wilson J. S., Griswold T., Messinger O. J. (2008). Sampling bee communities (Hymenoptera: Apiformes) in a desert landscape: are pan traps sufficient? J. Kansas Entomological Soc. 81, 288–300. doi: 10.2317/JKES-802.06.1
Woodard S. H., Federman S., James R. R., Danforth B. N., Griswold T. L., Inouye D., et al. (2020). Towards a US national program for monitoring native bees. Biol. Conserv. 252, 108821. doi: 10.1016/j.biocon.2020.108821
World Meteorological Organization (1970). Commission for Maritime Meteorology. The Beaufort scale of wind force: technical and operational aspects. Geneva: WMO.
Keywords: bee, abundance, distance models, trapping methods, bias
Citation: Mathis CL, McNeil DJ Jr., Kammerer M, Larkin JL and Skvarla MJ (2024) Distance models reveal biases associated with passive trapping methods for measuring wild bee abundance. Front. Ecol. Evol. 12:1380622. doi: 10.3389/fevo.2024.1380622
Received: 01 February 2024; Accepted: 24 April 2024;
Published: 21 May 2024.
Edited by:
Kris Braman, University of Georgia, United StatesReviewed by:
Elsa Youngsteadt, North Carolina State University, United StatesMichał Filipiak, Jagiellonian University, Poland
Copyright © 2024 Mathis, McNeil, Kammerer, Larkin and Skvarla. This is an open-access article distributed under the terms of the Creative Commons Attribution License (CC BY). The use, distribution or reproduction in other forums is permitted, provided the original author(s) and the copyright owner(s) are credited and that the original publication in this journal is cited, in accordance with accepted academic practice. No use, distribution or reproduction is permitted which does not comply with these terms.
*Correspondence: Codey L. Mathis, Y2xtNjUwN0Bwc3UuZWR1