 Yan Wang1†
 Qian Ke
- 1School of Economic and Management, Xi’an University of Technology, Xi’an, China
- 2School of Business and Circulation, Shaanxi Polytechnic Institute, Xian Yang, China
The digital economy has the characteristics of resource conservation, which can solve China’s high carbon emissions problems. The digital economy can quickly integrate with the real economy, forming an integrated economy. However, it is still unclear whether an integrated economy can effectively reduce carbon emissions and achieve China’s ‘dual carbon goals’. Therefore, this study takes 30 provinces in China as the research object, constructs the integration economy index system through the statistical data from 2011-2021, and explores the spatial effect of the impact of the integration economy on carbon emissions by using principal component analysis, coupled coordination model and spatial econometric model. The research results are as follows. (1) From 2011 to 2021, the comprehensive economy showed a trend of increasing yearly (from 0.667 to 0.828), and carbon emissions showed a slow decrease (from 0.026 to 0.017). (2) Due to the infiltration of China’s economic development from the eastern to the western, the spatial distribution of the integrated economy shows a decreasing trend from east to west. The spatial distribution of carbon emissions may be related to China’s industrial layout of heavy industry in the northern, and light industry in the southern, showing a trend of low in the south and high in the north. (3) The integrated economy can significantly reduce carbon emissions (the coefficients of influence, -0.146), and the reduction effect will be more obvious if spatial spillover effects are taken into account (-0.305). (4) The eastern coast, the middle reaches of the Yangtze River, and the middle reaches of the Yellow River economic zones all increase carbon emissions at a certain level of significance (0.065, 0.148, and 3.890). The Northeast, South Coastal and Southwest economic zones significantly reduce carbon emissions (-0.220, -0.092, and -0.308). The results of the Northern Coast and Northwest are not significant (-0.022 and 0.095). (5) China should tailor regional economic development policies, such as strengthening investment in digital infrastructure in the Northwest Economic Zone and fully leveraging the spatial spillover effects of integrated economy in the Northeast, Southern Coastal, and Southwest Economic Zones to reduce carbon emissions.
1 Introduction
In recent years, climate issues have become increasingly severe (Yuan et al., 2024), with frequent occurrences of extreme weather phenomena such as air pollution, haze pollution, and rising temperatures (Tian et al., 2022). According to the International Energy Agency (IEA), China has had the highest global carbon emissions since 2007 (Cheng et al., 2018).In response to concerns from the international community about China’s willingness to contribute and share obligations towards global climate change goals, China and the United States signed the Sino-US Joint Declaration on Climate Change in 2014 (Gao et al., 2021; Xu et al., 2024).In 2021, the Central Committee of the Communist Party of China and the State Council issued the Action Plan for Carbon Peak before 2030, incorporating ‘carbon peak and carbon neutrality’ into the overall economic and social development, advocating for accelerating the green transformation of production and lifestyle, and ensuring the timely achievement of the ‘carbon peak’ goal before 2030 (Zhao et al., 2022; Feng et al., 2024).
In the era of big data, the integrated economy is the focus point for countries to seize the leading position in global strategy and has become an inevitable choice to solve the problem of carbon emissions (Shi and Sun, 2023; Sun et al., 2024). Integrated economy refers to the integration of the digital economy and real economy. The digital economy is the leading force in the current world technological revolution and industrial transformation, and many countries regard it as the new driving force for restructuring national core competitiveness (Wang et al., 2023). The real economy is the foundation of a country, the source of wealth, and the soul of industry, and is the strategic core of economic development for all countries (Cheng et al., 2023). With the vigorous development of digital technology, ‘integrated economy’ has become a new development model and concept (Liu et al., 2024).
In 2020, the Global Climate Action Summit released the Index Climate Action Road map, which proposed implementing ‘digital’ solutions in physical industries that can help reduce global carbon emissions by up to 15% (Feng et al., 2023a; Feng et al., 2023b). It can be seen that the integration of ‘digital technology’ and physical industries, namely the integrated economy, plays a sustained and powerful role in the process of carbon reduction (Lopes de Sousa Jabbour et al., 2022; Sun et al., 2024). To achieve economic leadership and reduce pollution, countries have issued strategic plans to promote the development of integrated economies (Granados and Gupta, 2013; Xu et al., 2018), such as the United States issuing the National Strategic Plan for Advanced Manufacturing (Fatima et al., 2020), Germany issuing The High Technology Strategy 2025 (Klippert et al., 2020), and the United Kingdom implementing the Extraordinary Export Plan. Made in China 2025 (Xu et al., 2017) also proposes carbon reduction measures to promote China’s green and low-carbon development through intelligent manufacturing and an integrated economy (Wang et al., 2020). However, China is a vast country, and the status of the integrated economy and carbon emission is different in different regions. Studying the spatial effect of an integrated economy on carbon emission is of great theoretical and practical significance for realizing the coordinated development of the economy.
Based on this, this paper takes 30 provinces in China (excluding Hong Kong Special Administrative Region, Macao Special Administrative Region, Taiwan, and Tibet Autonomous Region due to difficulties in data acquisition) as the research object, uses panel data from 2011 to 2021 to construct a measurement system for the development level of the digital economy and the real economy, and applies the empirical method to analyze the spatial effect of the integrated economy on carbon emissions. We attempt to explore the following issues: (1) What is the current situation of China’s integrated economy and carbon emissions? (2) What is the impact of an integrated economy on carbon emissions? (3) What is the spatial effect of the impact of an integrated economy on carbon emissions? (4) What policies should be increased to promote green and coordinated development across China’s regions to jointly achieve the dual-carbon goal? So, the research content of this article mainly includes the following aspects. Firstly, this article uses Principal Component Analysis (PCA) to separately measure the results of the subsystems of the digital economy and the real economy. Based on the results of the digital economy and the real economy, a coupled coordination model is used to integrate the results of the two subsystems to calculate the integrated economy. Secondly, based on comprehensive economic and carbon emission data, the Natural Breaks Classification method using software such as QGIS is used to analyze its time evolution and spatial distribution trend. Thirdly, we use Moran’s index to analyze the spatial autocorrelation of integrated economy and carbon emission levels. Fourthly, we use spatial econometric models to examine the impact of an integrated economy on carbon emissions and decompose its spatial effects. Fifthly, we classify the Chinese region into eight major economic zones and once again use spatial econometric models to analyze the heterogeneity of the impact of the integrated economy on carbon emissions in each region. Finally, based on the results, targeted policy recommendations are proposed to lay the foundation for achieving the ‘dual carbon goals’.
The main contributions of this article are reflected in the following aspects. Firstly, the existing research gap lies in the fact that few scholars have measured the integrated economy. However, as an important form of economy, the integrated economy is different from the traditional real economy and digital economy. This article constructs a coupled coordination model based on the two subsystems of the integrated economy, the digital economy and the real economy, to accurately measure the level of China’s integrated economy, filling the gap in existing research that lacks measurement of the integrated economy. Secondly, existing studies rarely mention the impact of an integrated economy on carbon emissions, and more tend to discuss the impact of a digital economy on carbon emissions. As a new form of economy, an integrated economy requires the penetration and unification of the digital economy and the real economy. This article incorporates the integration economy and carbon emissions into the same theoretical framework, analyzes the relationship between the two, and fills the gap in research on the relationship between the integration economy and carbon emissions. Finally, few scholars have considered the spatial heterogeneity of the impact of an integrated economy on carbon emissions. China, the subject of the study, is a vast country with a wide range of landmasses, and inter-regional development is bound to have differences. Our study of the spatial heterogeneity of the impact of the integrated economy on carbon emissions from the perspective of the eight economic zones has certain policy implications for the development of the integrated economy in China’s provinces according to local conditions.
2 Literature review and analysis of theoretical mechanisms
2.1 Literature review
This paper divides the previous studies into three parts, integration economy-related studies, carbon emission-related studies, and studies on the relationship between integration economy and carbon emission.
Firstly, there are fewer studies on the converging economy, mainly focusing on exploring the intrinsic coordination mechanism between the subsystems of the converging economy, i.e., the digital economy and the real economy, as well as the current development situation (Sun et al., 2024). The digital economy promotes the development of China’s real economy through industrial digitization and digital industrialization, with industrial structure optimization and upgrading as the intermediary (Hong and Ren, 2023). The impact of the digital economy on the real economy presents an inverted U-shaped feature, with a crowding-out effect in the eastern part of China and a promoting effect in the western part and the real economy (Jiang and Sun, 2020; Xu et al., 2021). At present, the integrated economy is showing a decreasing trend in the east, middle, and west, with problems such as insufficient integration depth, lack of key technologies, and lax market supervision (Zhang et al., 2022b). It is urgent to strengthen investment in technological innovation and digital infrastructure construction, create high-level manufacturing industries, and improve and strengthen digital governance to promote the deep integration of the digital economy and the real economy (Liu et al., 2022a).
Secondly, the research direction of carbon emissions mainly focuses on three aspects: the current status of carbon emissions (Xu et al., 2019), carbon peak prediction (Wang and Feng, 2024), and the influencing factors of carbon emissions (Tong, 2020; Xu, 2023). Firstly, the analysis of the current status of carbon emissions focuses on industries with high carbon concentration, regions with high carbon emissions, the carbon emissions of a certain region under China’s 2030 carbon peak target, and the carbon emissions tracking of a specific location or factory (Li et al., 2016; Ahmadi et al., 2019). Secondly, regarding the research on carbon peak prediction, most of the previous researchers used big data models and scenario analysis methods to predict the future growth of carbon emissions. And the results show that most of the provinces and cities in China can achieve the goal of a carbon peak by 2030, and only individual regions, such as Hubao, Eyu and Elm, have difficulties in achieving a carbon peak (Zhang et al., 2022b; Dai et al., 2022). Finally, according to existing research, public policy factors such as carbon emission trading pilot programs and low-carbon city pilot policies (Zhao et al., 2022), industrial structure factors such as energy structure and industrial robots (Meng et al., 2018; Li and Zhou, 2021; Jiang et al., 2023), and macro technological factors such as outward direct investment, population aggregation, digital economy development (Zhao and Zhu, 2022; Liu et al., 2023), and technological innovation will all have an impact on carbon emissions, carbon intensity, or efficiency (Chen et al., 2023; Zha et al., 2023).
Thirdly, there is currently limited research on the relationship between integrated economy and carbon emissions. Most of the related research focuses on the impact of the digital economy, a subsystem of the integrated economy, on carbon emissions (Wu et al., 2022). Most studies suggest that the digital economy can improve carbon emission efficiency by reducing energy consumption (Jiang et al., 2023). The rationalization (advanced) of the industrial structure undermines (enhances) to some extent the carbon-emission efficiency-enhancing effect of the digital economy (Zhang et al., 2022a; Chang et al., 2023). The carbon reduction effect of the digital economy varies in different regions of China (Zhang et al., 2022a). The paths for the digital economy to reduce regional carbon emission intensity or enhance carbon emission efficiency mainly include increasing digital infrastructure and formulating policy guidance based on regional characteristics (Feng et al., 2023a; Feng et al., 2023b; Tang and Yang, 2023).
In summary, existing studies focus on the role of the digital economy or industrial development in reducing carbon emissions, but few scholars have scientifically measured the level of development of the convergence economy, and fewer studies consider its carbon reduction effect from the perspective of the integrated economy. Therefore, the main contributions of this article are reflected in the following aspects. Firstly, using reasonable methods and indicator systems to measure the integrated economy can fill the gap in the measurement of the integrated economy in the existing literature. Secondly, the innovative incorporation of integrated economy and carbon emissions into the same theoretical framework has deepened the theoretical research on low-carbon economy. Finally, analyze the current situation and inherent relationship between integrated economy and carbon emissions from a spatial perspective, and deepen relevant research in spatial economics.
2.2 Theoretical mechanisms
The integrated economy is a large economic system constructed by the digital economy subsystem and the real economy subsystem (Jiang et al., 2023). The process of integrating internal subsystems is essentially a process of mutual influence and mutual promotion, in which industrial digitization and digital industrialization are achieved (Hong and Ren, 2023). Therefore, industrial digitization and digital industrialization are external manifestations of an integrated economy. Digital industrialization refers to the continuous expansion of digital technology industries such as the Internet, big data, and cloud computing to form an industrial scale, manifested as the materialization of the digital economy (Peng et al., 2023). Industrial digitization refers to the application of digital technology to achieve intelligent manufacturing in the process of physical industry development, manifested as the digitization of the real economy (Yi et al., 2023). The integrated economy can effectively reduce carbon emissions, mainly through the multiplier effect of the digital economy and the efficiency effect of the real economy.
On the one hand, the digital economy has natural green and energy-saving characteristics, with a virtual and networked nature, which can realize low-carbon growth (Sun et al., 2024). The development of the digital economy has expanded the industrial cornerstone of the real economy, changed traditional business models, and injected green and low-carbon elements into the development of the real economy (Jiang and Sun, 2020). Firstly, the development of the digital economy has promoted the growth of digital industries such as the Internet and cloud platforms that rely on data elements. These digital industries are based on new digital facilities, driven by innovation, and have natural high-tech attributes. Knowledge and innovation spillovers together constitute the multiplier effect of numbers. In the development of the digital industry, through digital diffusion, green creation can be achieved and regional industrial carbon emissions can be reduced. Secondly, in the era of big data, people’s product needs have completely changed. Through mining and analyzing data elements, some green and low-carbon needs have been deeply explored, guiding green innovation in enterprises. Modern enterprises have begun to be guided by consumer green demands, breaking away from the traditional value creation model of product research and development as the core.
On the other hand, using digital technology in the real economy can fully leverage the efficiency effect of innovative technology, accelerating the transformation and upgrading of the real industrial structure towards low-carbon and environmentally friendly green industries (Liu et al., 2023). The real economy provides a source of data elements for the digital economy, increasing the demand for digital technology in the real industry, driving digital technology innovation, improving innovation efficiency, and achieving regional carbon emissions reduction (Shi and Sun, 2023). Firstly, the major industries of the real economy involve various aspects of social life and are the main sources of carbon emissions. User characteristics, individual needs, unknown risks, etc. can be accurately analyzed and predicted through digital technology, reducing unnecessary carbon pollution and waste. Secondly, the integration of the physical industry and the digital economy can improve enterprise productivity, reduce unnecessary carbon emissions in the product manufacturing process, bring more value to the physical industry, and force enterprises to continuously engage in green innovation and achieve low-carbon development.
According to the theory of unbalanced growth, the path of economic development is full of obstacles and bottlenecks, such as shortages of technology, equipment, and products, and factor endowments (Qi et al., 2013). The current state and path of development, and policy orientations are not the same in different regions, so the phenomenon of imbalance is presented regionally, and therefore imbalance is the norm (Liu et al., 2022b). At the current stage of development in China, there are still some policies, resources, and factors that are biased, resulting in spatial differences in the integration economy and carbon emission levels. According to the theory of spatial economics, the integrated economy has both multiplier effects and efficiency effects. From a spatial perspective, there must be spatial spillover effects, that is, the integrated economy in the local area can affect the development of the integrated economy and other economic variables in the surrounding areas. According to the theory of externalities, carbon emissions are an important pollutant in the climate environment, and environmental pollution is bound to accumulate maliciously in the region, affecting the ecology and economy of the local and surrounding areas. In summary, the spatial performance of the integrated economy and carbon emissions will inevitably exhibit spatial agglomeration effects, and the impact of the integrated economy on carbon emissions has a certain spatial spillover effect.
3 Methods and data
3.1 Variable selection and data sources
3.1.1 Variable selection
3.1.1.1 Integrated economy
Referring to relevant research, this paper uses the coupling coordination model to measure the level of Integrated economy (IE) (Zhang et al., 2022). We divide IE into digital economy (DE) and real economy (RE) subsystems, establish index systems, and use principal component analysis (PCA) to independently calculate the comprehensive values of the two subsystems. Considering the availability of data, we refer to (Zhao et al., 2020) and measure the development level of the digital economy from the aspects of internet development and digital finance development. We measure the level of development of the real economy from three aspects: the scale and structure of the real economy and its future development. The specific indicators and attributes are shown in Table 1.
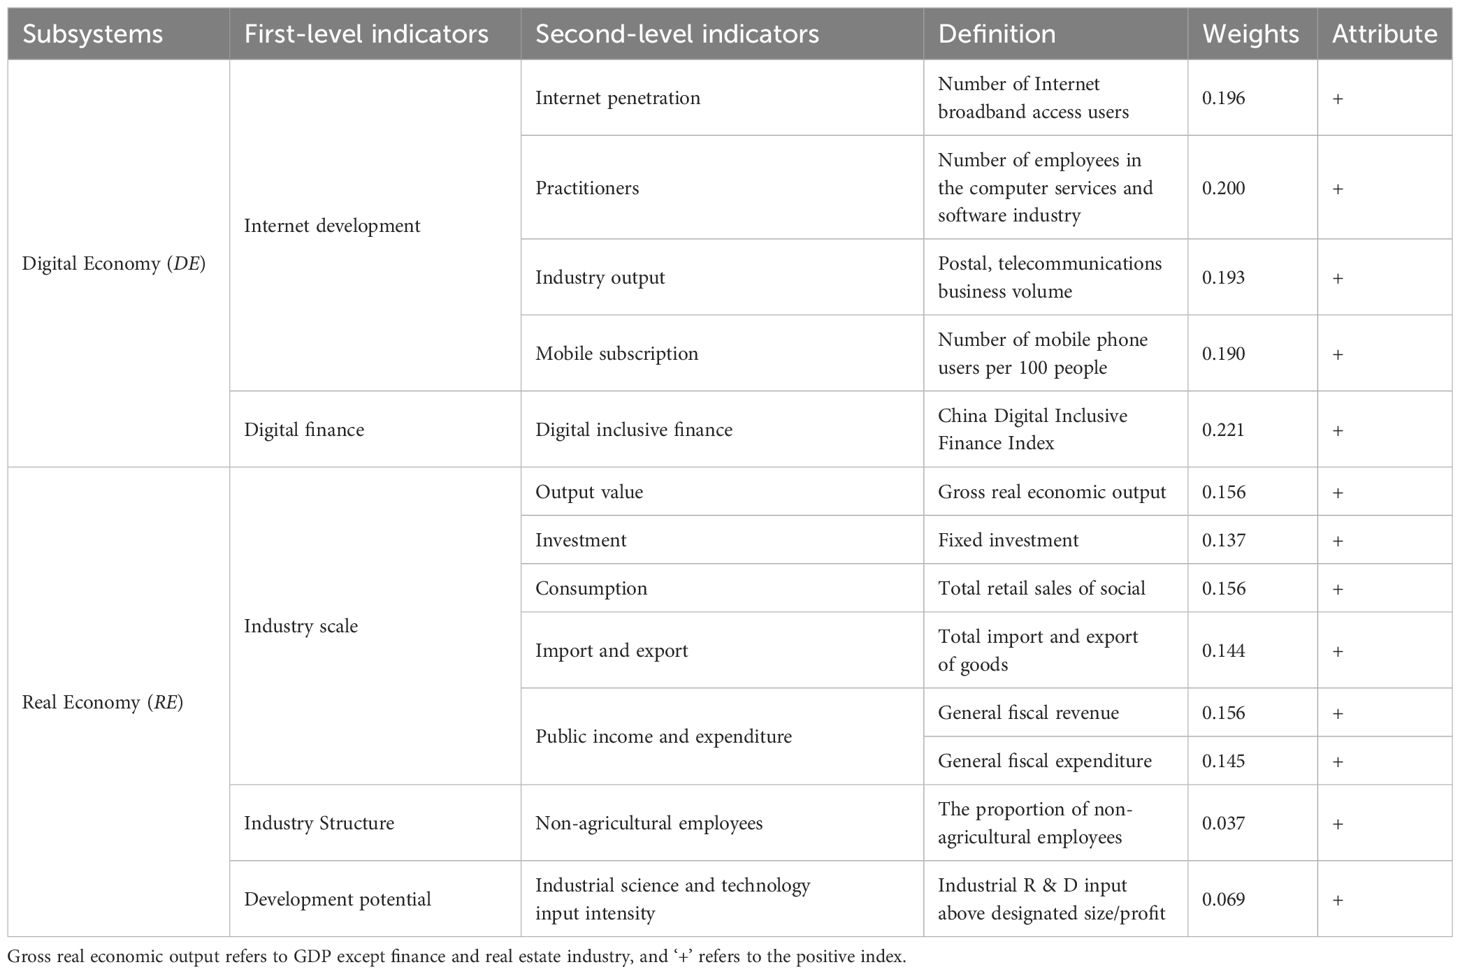
Table 1 Index measurement system of the digital economy and the real economy.
3.1.1.2 Carbon emissions
In this paper, carbon intensity (The Amount of carbon emissions/GDP) is used as a proxy variable for carbon emissions respectively. This paper uses apparent carbon emissions to measure the amount of regional carbon emissions. Data on carbon emission quantities are from China Emission Accounts and Datasets (CEADs) (Shan et al., 2016, 2018, 2020; Guan et al., 2021).
3.1.1.3 Other variables
According to the requirements of China’s high-quality development: innovation, coordination, green, openness, and sharing, this paper selects eight control variables, as shown in Table 2. (1) Innovation. Scientific and technological innovation to guide industrial innovation and accelerate the realization of green transformation. Talent is the fundamental source of realizing green innovation. So, technology innovation intensity (TI) and innovative talents (IT) are the control variables associated with innovation. (2) Coordination. Regional coordination will accelerate the rate of inter-regional capital, technology, and talent flow, injecting capital vitality into the research and development of industrial carbon reduction technology. So, regional coordination (RC) and industry coordination (IH) are the control variables associated with coordination. (3) Green. The increase in green governance capacity will accelerate the research and development of digital green technology and solve the problem of high pollution and high energy consumption of heavy physical industry. So, green governance capability (GG) is the control variable associated with green. (4) Open. The diversification of capital can stimulate the vitality of enterprises to learn and introduce advanced carbon reduction technologies from abroad, and foreign investment will also inject new momentum into the development of domestic industries. So, foreign investment intensity (FI) and traffic-developed degree (TD) are the control variables associated with openness. (5) Sharing. Well-developed transportation is the basis for realizing the rapid circulation of physical industries. The Internet is the link of modern industrial connection and the basis for the development of the digital economy, which is of great significance to the green manufacturing of enterprises. Social consumption capacity is the embodiment of the purchasing power of the society, which pushes the industry to elaborate research and development of a more green and low-carbon, in order to provide green products and services. So, internet development level (ID) is the control variable associated with sharing. Among them, TI, FI, TD, and ID indicators are calculated by the entropy method, and the other indicators are logarithmically processed on the original data.
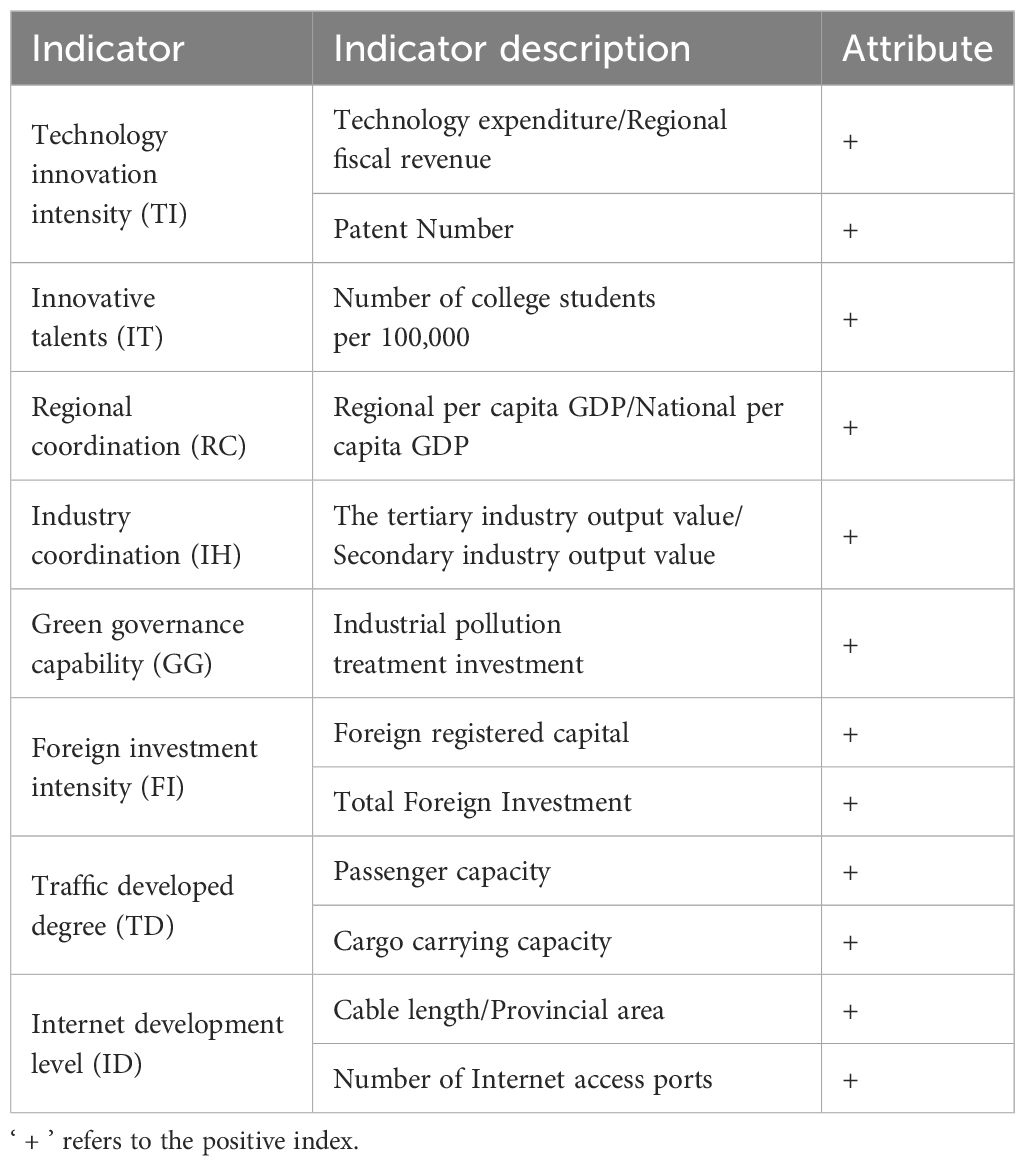
Table 2 Control variable description table.
3.1.2 Data sources
This paper uses a sample of 30 provincial administrative units in China (excluding China’s Hong Kong Special Administrative Region, Macao Special Administrative Region, Taiwan, and Tibet Autonomous Region, which has a lot of missing values) to conduct empirical analysis for the years 2011-2021. Data from the Chinese Research Data Services Platform (CNRDS) data service platform, Easy Professional Superior (EPS) database, China Carbon Accounting Database (CEADs), China Statistical Yearbook (2012-2022), China Energy Statistics Yearbook (2012-2022), China Information Industry Yearbook (2012-2022), Peking University Digital Inclusive Finance Index (2011-2021) Index Report, China E-Commerce Report (2011-2021), provincial statistical yearbooks and government work reports, etc., where missing values are filled in using linear interpolation.
3.2 Research method
The steps to use the method in this article are as follows: (1) Firstly, this article uses Principal Component Analysis (PCA) to separately measure the results of the subsystems of the digital economy and the real economy. (2) Secondly, based on the results of the digital economy and the real economy, a coupled coordination model is used to integrate the results of the two subsystems to calculate the integrated economy. (3) Thirdly, based on comprehensive economic and carbon emission data, the Natural Breaks Classification method using software such as QGIS is used to analyze its spatial distribution trend. (4) Fourthly, use Moran’s index to analyze the spatial autocorrelation of integrated economy and carbon emission levels. (5) Fifthly, use spatial econometric models to examine the impact of an integrated economy on carbon emissions and decompose its spatial effects. (6) Sixth, classify the Chinese region into eight major economic zones and once again use spatial econometric models to analyze the heterogeneity of the impact of the integrated economy on carbon emissions in each region. PCA and Coupled Coordination Model are used to measure the integrated economy in section 3.2.1. The Natural Breaks Classification is used to classify integrated economies and carbon emissions in section 3.2.2. Moran’s index is used to test spatial correlation in section 3.2.3. The determination of spatial econometric models is in section 3.2.4. The classification of the eight major economic zones is in section 3.3.5.
3.2.1 Measurement models of the core indicator
3.2.1.1 PCA
Using the principal component analysis method to measure the development level of DE and RE subsystems can avoid the subjectivity of human empowerment and has certain reliability. The specific steps are as follows.
a. Construct the matrix according to the selection of each subsystem index. If there are n samples and p indices, then the original matrix x of size n × p can be formed as shown in Equation 1.
b. The original matrix is standardized to obtain a standardized matrix X as shown in Equations 2–4.
c. Calculate the covariance matrix of the normalized sample as shown in Equations 5, 6.
d. Calculate the eigenvalue and eigenvalue vector a of R where R is a positive semidefinite matrix, eigenvalue as shown in Equation 7.
e. The principal component contribution rate c and the cumulative contribution rate s are calculated shown in Equation 8, and the i-th principal component corresponding to the eigenvalues with a cumulative contribution rate of more than 80% is extracted. The index calculation result is shown in Equation 9.
3.2.1.2 The coupling coordination model
The coupling coordination degree model can measure the dependence and correlation between multiple subsystems to analyze the coordinated development level between subsystems, not only considering the overall coordination but also paying attention to the development of subsystems (Shao et al., 2016). This paper uses the coupling coordination model to calculate IE. The steps are as follows:
a. The maximum and minimum normalization processing is performed on the principal component calculation results of DE and RE subsystem (the 0 value in the calculation result is translated, and the translation unit is 0.1). Both DE and RE system indicators are positive indicators, so the formula is as shown in Equation 10.
where i,t,j refer to the region, year and index, respectively, j=1 refers to DE, j=2 refers to RE, refers to the value of the normalized t year j index in region i, refers to the value of the t year j index in region i, and and refer to the maximum and minimum values of the j index, respectively.
b. According to the calculation results, the comprehensive coordination index Tti is calculated. is and is . The calculation formula is as shown in Equation 11.
α and β are coefficients of development and take 0.5 here.
c. Calculate the coupling level of the digital economy and real economy Cti. The calculation formula is as shown in Equation 12.
d. Calculate the coupling coordination degree, that is, IE. The calculation formula is as shown in Equation 13.
e. According to the value range of the coupling coordination degree, it is divided into 10 grades by referring to, as shown in Table 3:
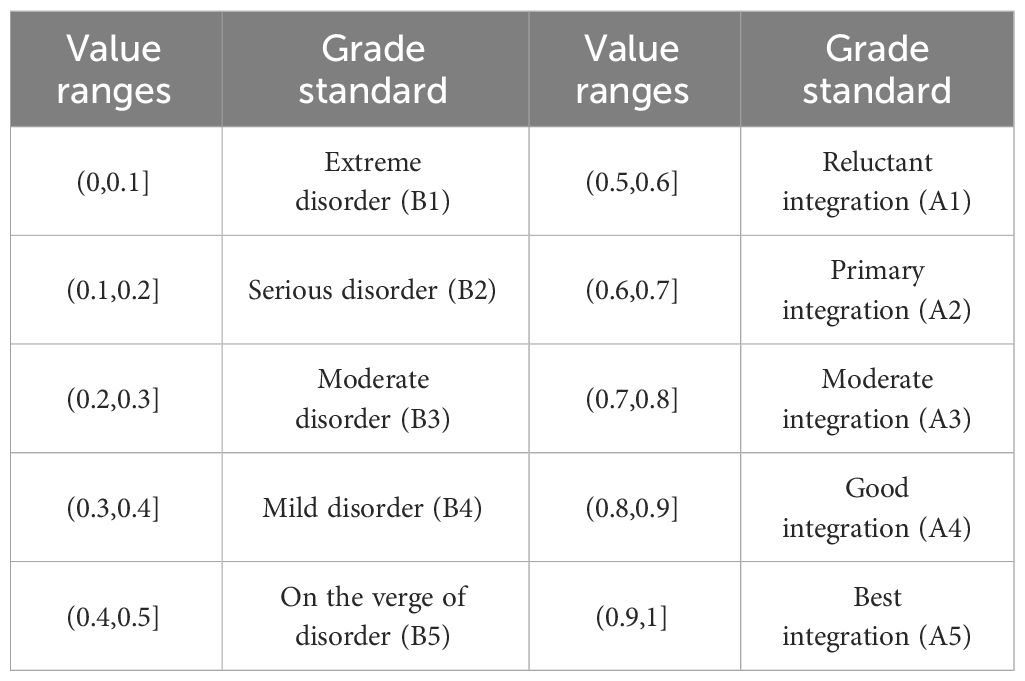
Table 3 IE grade division.
3.2.2 Natural breaks classification
This article uses QGIS software to draw a spatial distribution map of IE and CE in China, and the classification principle of the map is based on natural breaks classification. The natural breaks classification refers to a method of determining the segmentation structure based on the characteristics of the data itself. This method is commonly used for segmented analysis of time series or signal data, to identify turning points or structural changes in the data, thereby dividing it into different paragraphs or categories. The basic idea of natural breakpoint classification is to use the inherent properties of data to determine the optimal segmentation structure by detecting inflection or mutation points in the data. These inflection points or mutation points are called ‘natural breaks’, at which the properties of the data may undergo significant changes. By identifying these natural breakpoints, data can be divided into different paragraphs and further analyzed or processed for each paragraph. The natural breaks classification method can avoid the subjectivity of manual classification and classify data reasonably through machine clustering algorithms. This can reduce human bias and improve the objectivity and accuracy of classification results. This also helps to reveal the potential structure and patterns of data and improve the depth and accuracy of data analysis. To clarify the spatial distribution status of IE and CE in the 30 provinces studied in this article, the natural classification algorithm configured in QGIS software was used to divide the research data into three categories.
3.2.3 Spatial autocorrelation test method
We intend to use a spatial econometric model for regression analysis. Considering the possible spatial dependence and autocorrelation of IE and CE, we use Global Moran’s I to test the spatial autocorrelation of IE as shown in Equation 14 and CE as shown in Equation 15. The calculation formula is as follows:
where n represents the number of research objects, I is Moran’s I,
is the variance, , , is the mean of IE, is the mean of CE and is the spatial weight matrix.
To increase the accuracy of the analysis, this paper adopts a nested weights matrix by an inverse-distance-based spatial weights matrix and an economic-based weights matrix (Case et al., 1993).
,
,
.
Refer to Zhang et al. (2022c), =0.5,
is the sum of all spatial weights. The value range of I is [-1,1], I>0 represents spatial positive correlation, I<0 represents spatial negative correlation, The closer |I| is to 1, the stronger the spatial autocorrelation is.
3.2.4 Spatial econometric model
The spatial econometric model is different from the traditional econometric model, as it can consider spatial factors and reduce the estimation error. Traditional spatial econometric models include the spatial autoregressive model (SAR) as shown in Equation 16, spatial error model (SEM) as shown in Equation 17, and spatial Durbin model (SDM) as shown in Equation 18. The specific expressions are as follows:
where i is area, t is time, k is the influencing factor(IE and 8 control variables are included), is a constant term, is the regression coefficient of the k-th influencing factor, is the k-th influencing factor at time t in region i, and are the spatial autoregressive coefficients, W is the n -order spatial weight matrix, and , and are random error terms.
To determine which spatial econometric model to use, the Lagrange Multiplier Test (LM test) is carried out in this paper. The test results show that the statistic of Robust-LM in the two columns of Spatial error and Spatial lag rejects the null hypothesis at the significance level of 0.01, indicating that there are both error and lag effects, and the SDM model is selected. Subsequently, the Hausman test was used to determine whether the random effect model or the fixed effect model was used. The results show that the null hypothesis is rejected at the significance level of 0.01, that is, the fixed effect model is adopted. All test results are shown in Table 4.
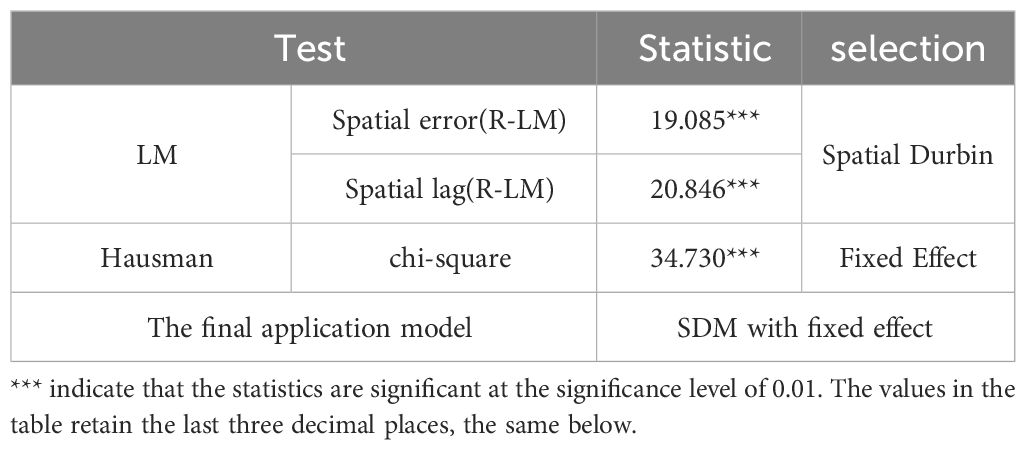
Table 4 Model test process and results.
3.2.5 The division of the eight major economic zones
To further analyze the regional heterogeneity of the carbon emission reduction effect of the integrated economy, we divide China (mainly refers to China’s inland areas excluding Hong Kong, Macao, Taiwan, and other places) into eight groups according to the eight economic zones in the Strategy and Policy for Coordinated Regional Development of the Development Research Center of the State Council. Figure 1 shows the distribution of China’s eight economic zones.
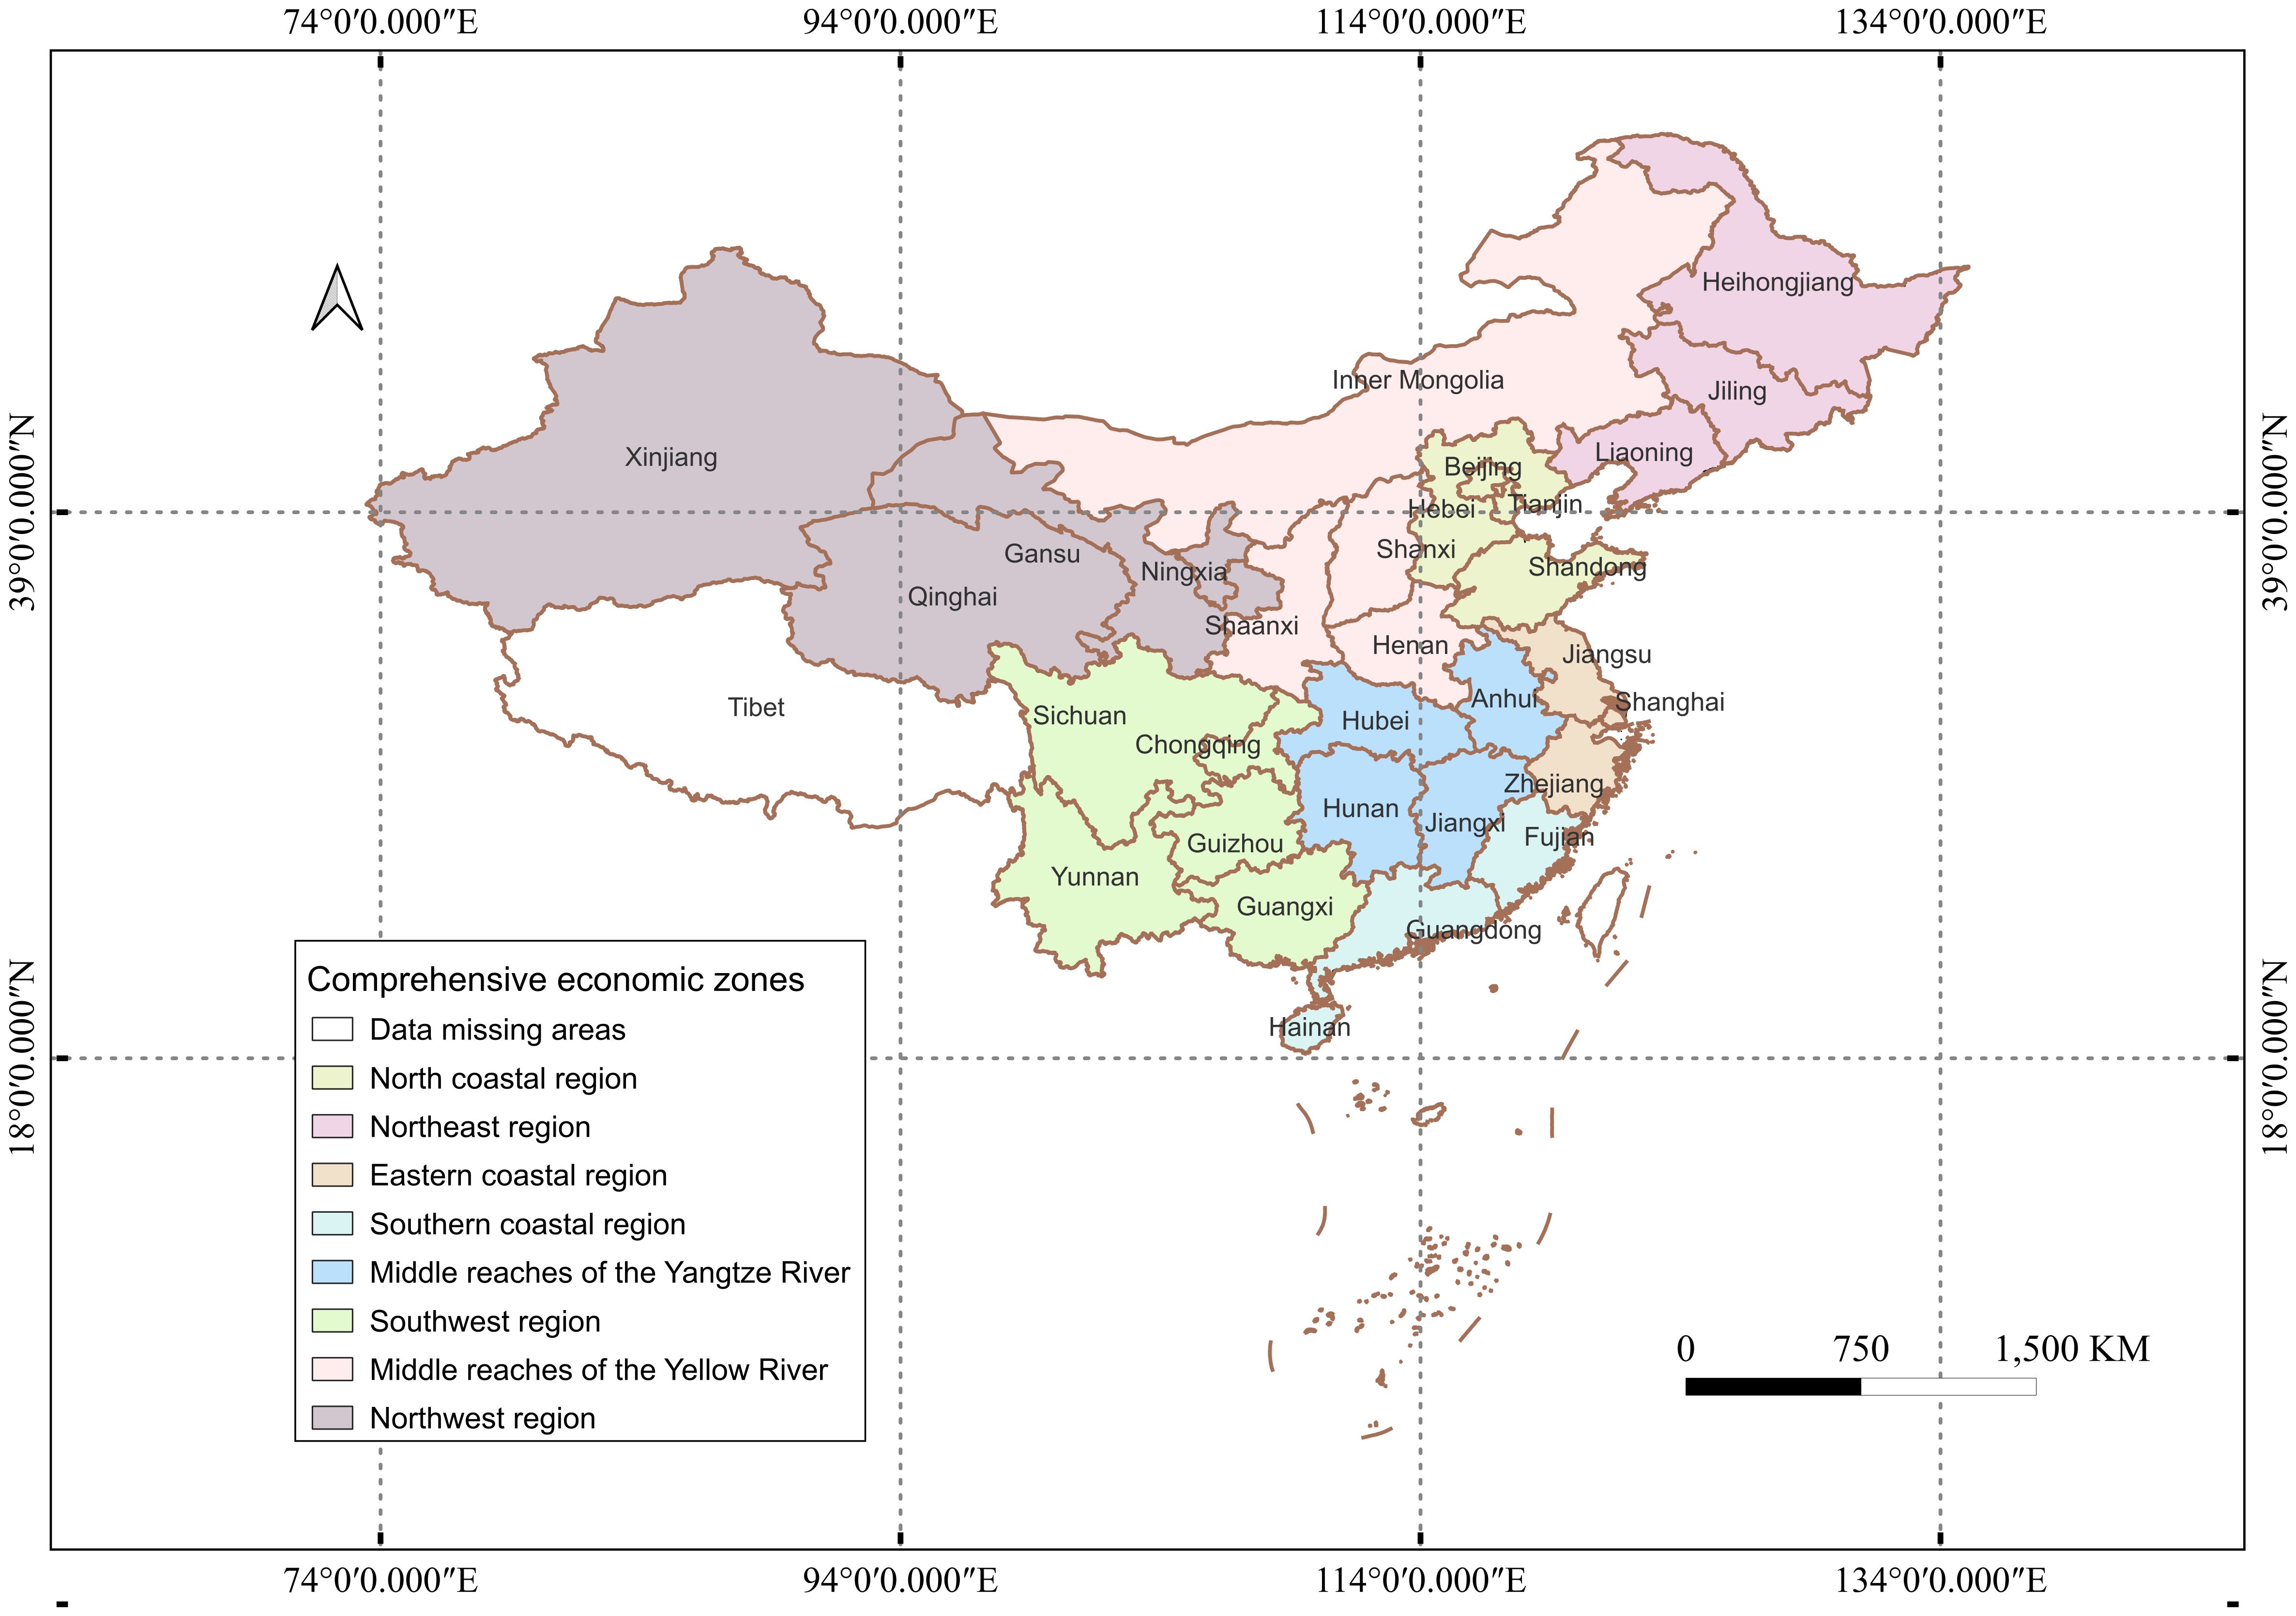
Figure 1 Distribution of China’s eight economic zones.
According to Figure 1, the northern coastal comprehensive economic zone includes Beijing, Tianjin, Hebei and Shandong provinces. The Northeast Comprehensive Economic Zone includes Liaoning, Jilin and Heilongjiang provinces. The eastern coastal comprehensive economic zone includes Shanghai, Jiangsu and Zhejiang provinces. The southern coastal economic zone includes Fujian, Guangdong and Hainan provinces. The comprehensive economic zone in the middle reaches of the Yangtze River includes Hubei, Hunan, Jiangxi, and Anhui provinces. The southwest comprehensive economic zone includes Yunnan, Guizhou, Sichuan, Chongqing, and Guangxi provinces. The comprehensive economic zone of the middle reaches of the Yellow River includes Shaanxi, Shanxi, Henan, and Inner Mongolia provinces. The Northwest Comprehensive Economic Zone includes Gansu, Qinghai, Ningxia, Tibet, and Xinjiang provinces. It is worth noting that when dividing the region, Tibet belongs to the Northwest Comprehensive Economic Zone. However, due to the difficulty of counting data for Tibet, only the other four provinces in the Northwest Comprehensive Economic Zone are counted in this paper.
4 Results
4.1 Measurement results of the integrated economy
According to the coupling coordination model, the results of the IE in China from 2011 to 2021 are shown in Table 5.
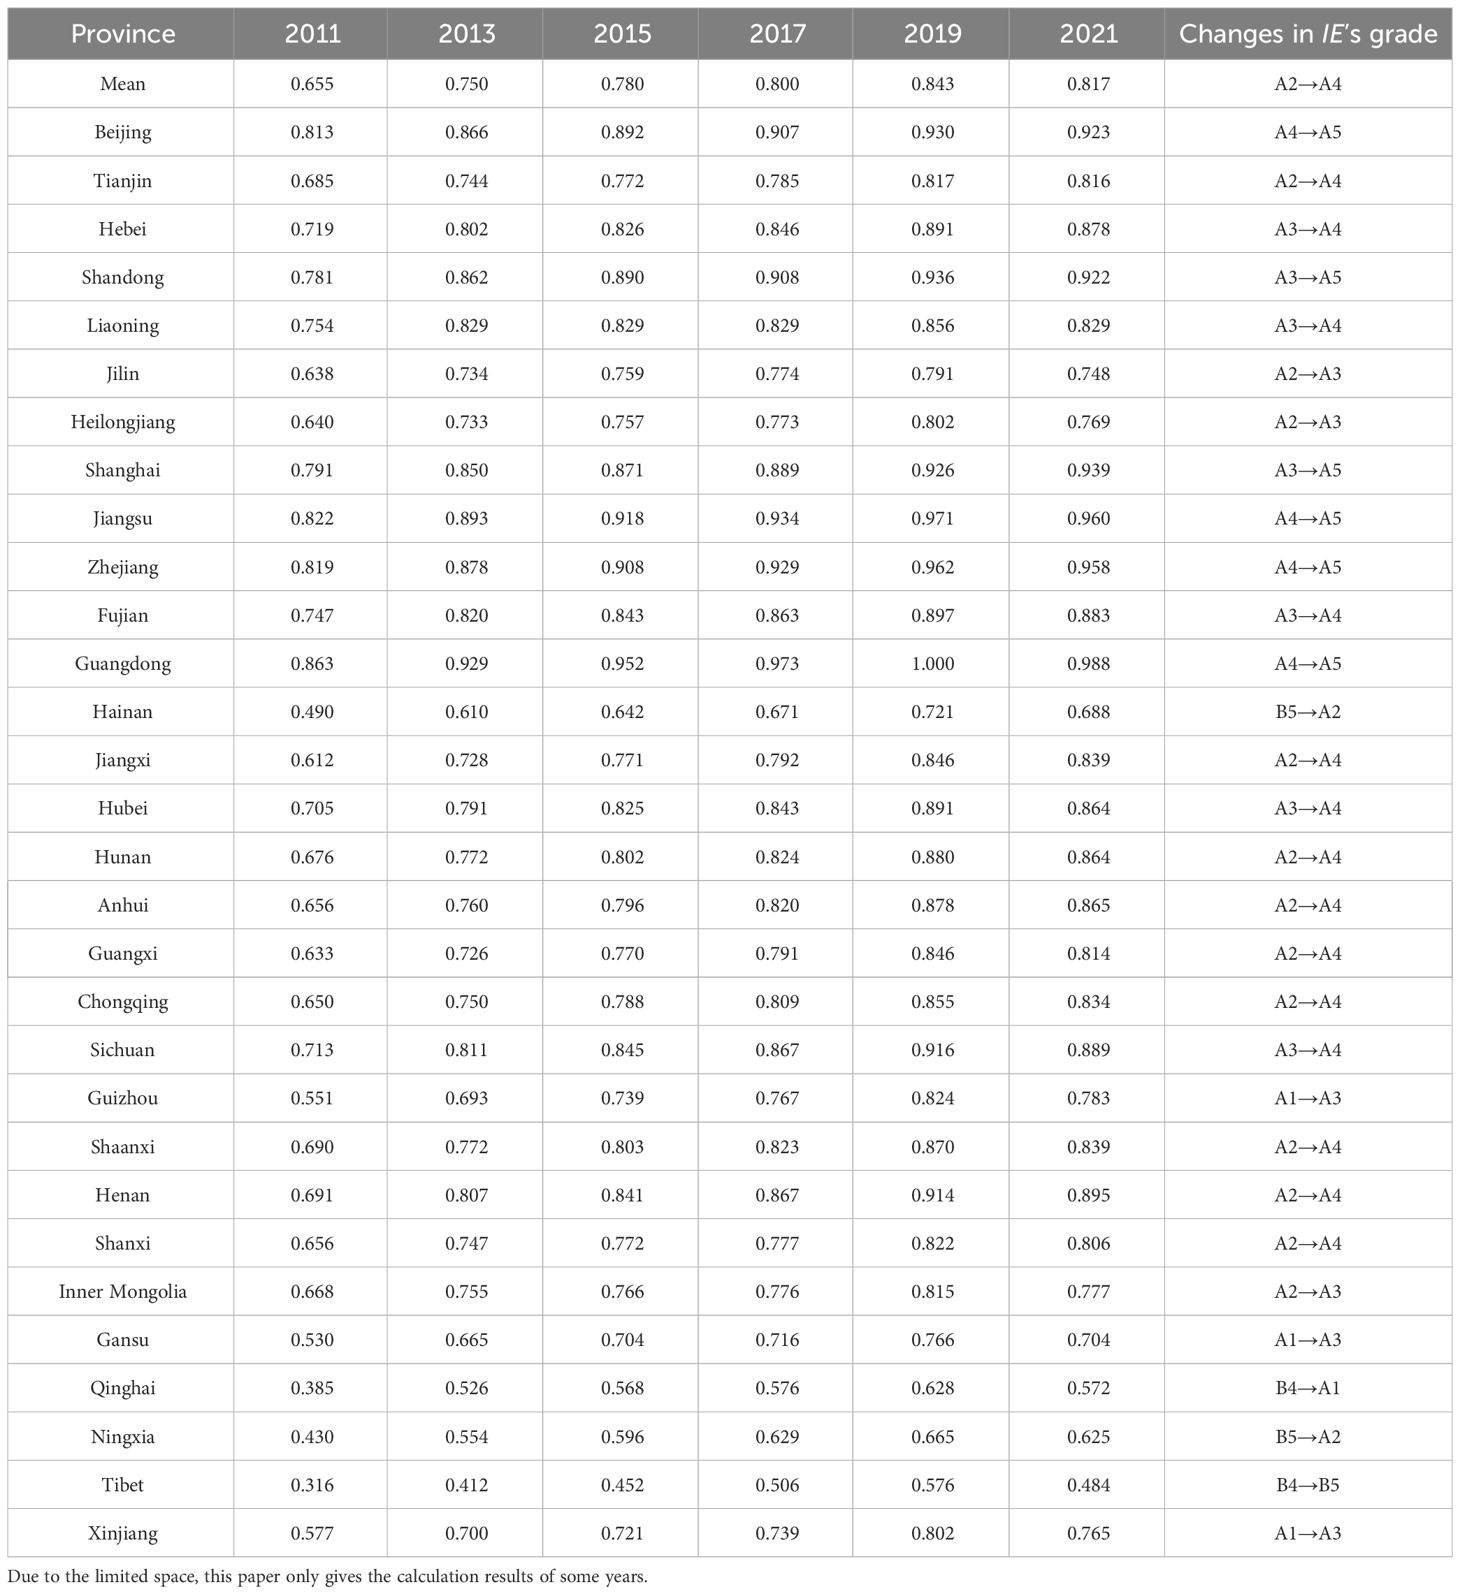
Table 5 The level of IE in China from 2011 to 2021.
The grade of IE in the 30 provinces of China continued to rise from 2011 to 2021, and the overall transformation from primary integration (A2) to good integration (A4) and the integration status was good in recent years. In 2011, most provinces were in a state of primary integration (A2, 41.9%) and moderate integration (A3, 22.6%). In 2021, most provinces were in a state of moderate integration (22.6%) and good integration (45.2%). Guangdong has been at a high level of integration for a long time. Beijing, Jiangsu, Zhejiang, and other head provinces are second only to Guangdong. It is worth noting that the DRID in Hainan, Qinghai, Ningxia, and Tibet has been in a state of imbalance or low integration, showing a significant gap with the integration of other provinces.
4.2 The time evolution and spatial distribution of IE and CE
4.2.1 Trends in time evolution
The national average time evolution of IE and CE from 2011 to 2021 is shown in Figure 2. It can be seen from Figure 2 that IE shows a growth trend, and CE shows a general downward trend. It can be seen that China has a significant implementation effect on the integration of the digital economy and real economy and the promotion of low-carbon emission reduction policies. With the development of digital technology, physical industry manufacturing began to shift to the intelligent trend, and the development of the integrated economy is bound to show an upward trend. However, after 2019, due to the impact of the epidemic, the overall pace of economic development has slowed down, which has caused a certain impact on both the physical industry and the digital industry. Therefore, the development of an integrated economy has a little downward trend. In recent years, President Xi Jinping has put forward the green development concept of ‘green mountains are golden mountains’ and the dual-carbon goal of ‘achieving carbon peak by 2030 and carbon neutrality by 2060’, which has made people more concerned about green development and reducing carbon emissions. Carbon emissions have begun to show a downward trend year by year. However, due to China’s large population and industrial base, energy consumption is still high all year round, and the downward trend is not obvious.
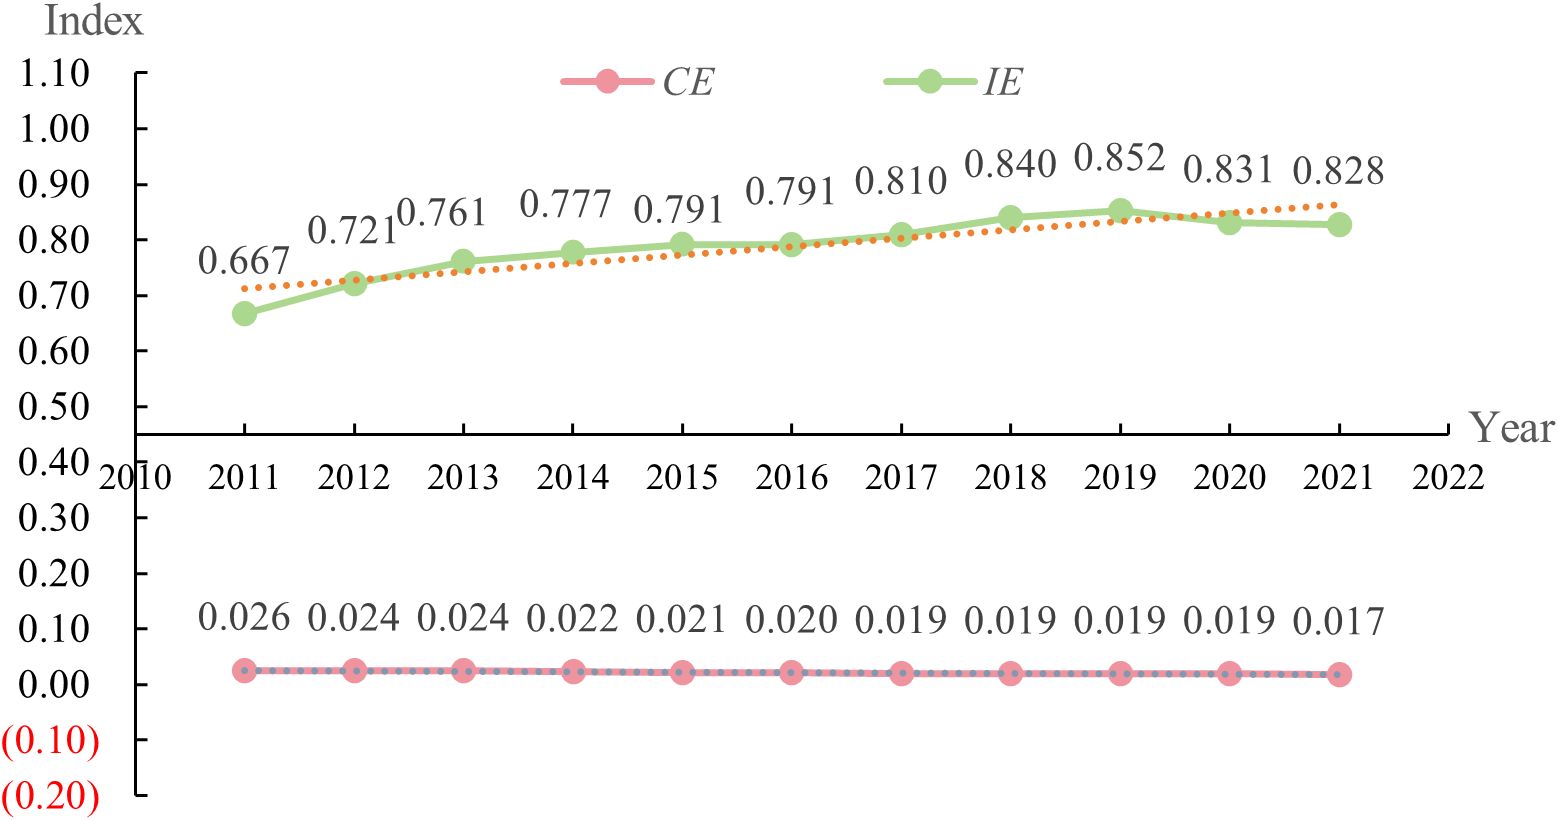
Figure 2 Time evolution trend of IE and CE from 2011 to 2021. The red font is a negative value.
4.2.2 Spatial distribution and evolutionary trends
In order to clarify the evolution trend of the spatial distribution of IE and CE, the spatial distribution maps of IE and CE in 2011 and 2021 are drawn respectively, as shown in Figures 3–6. In this paper, the relevant maps are drawn by QGIS software, and the classification principle of drawing is based on Python’s natural breaks classification.
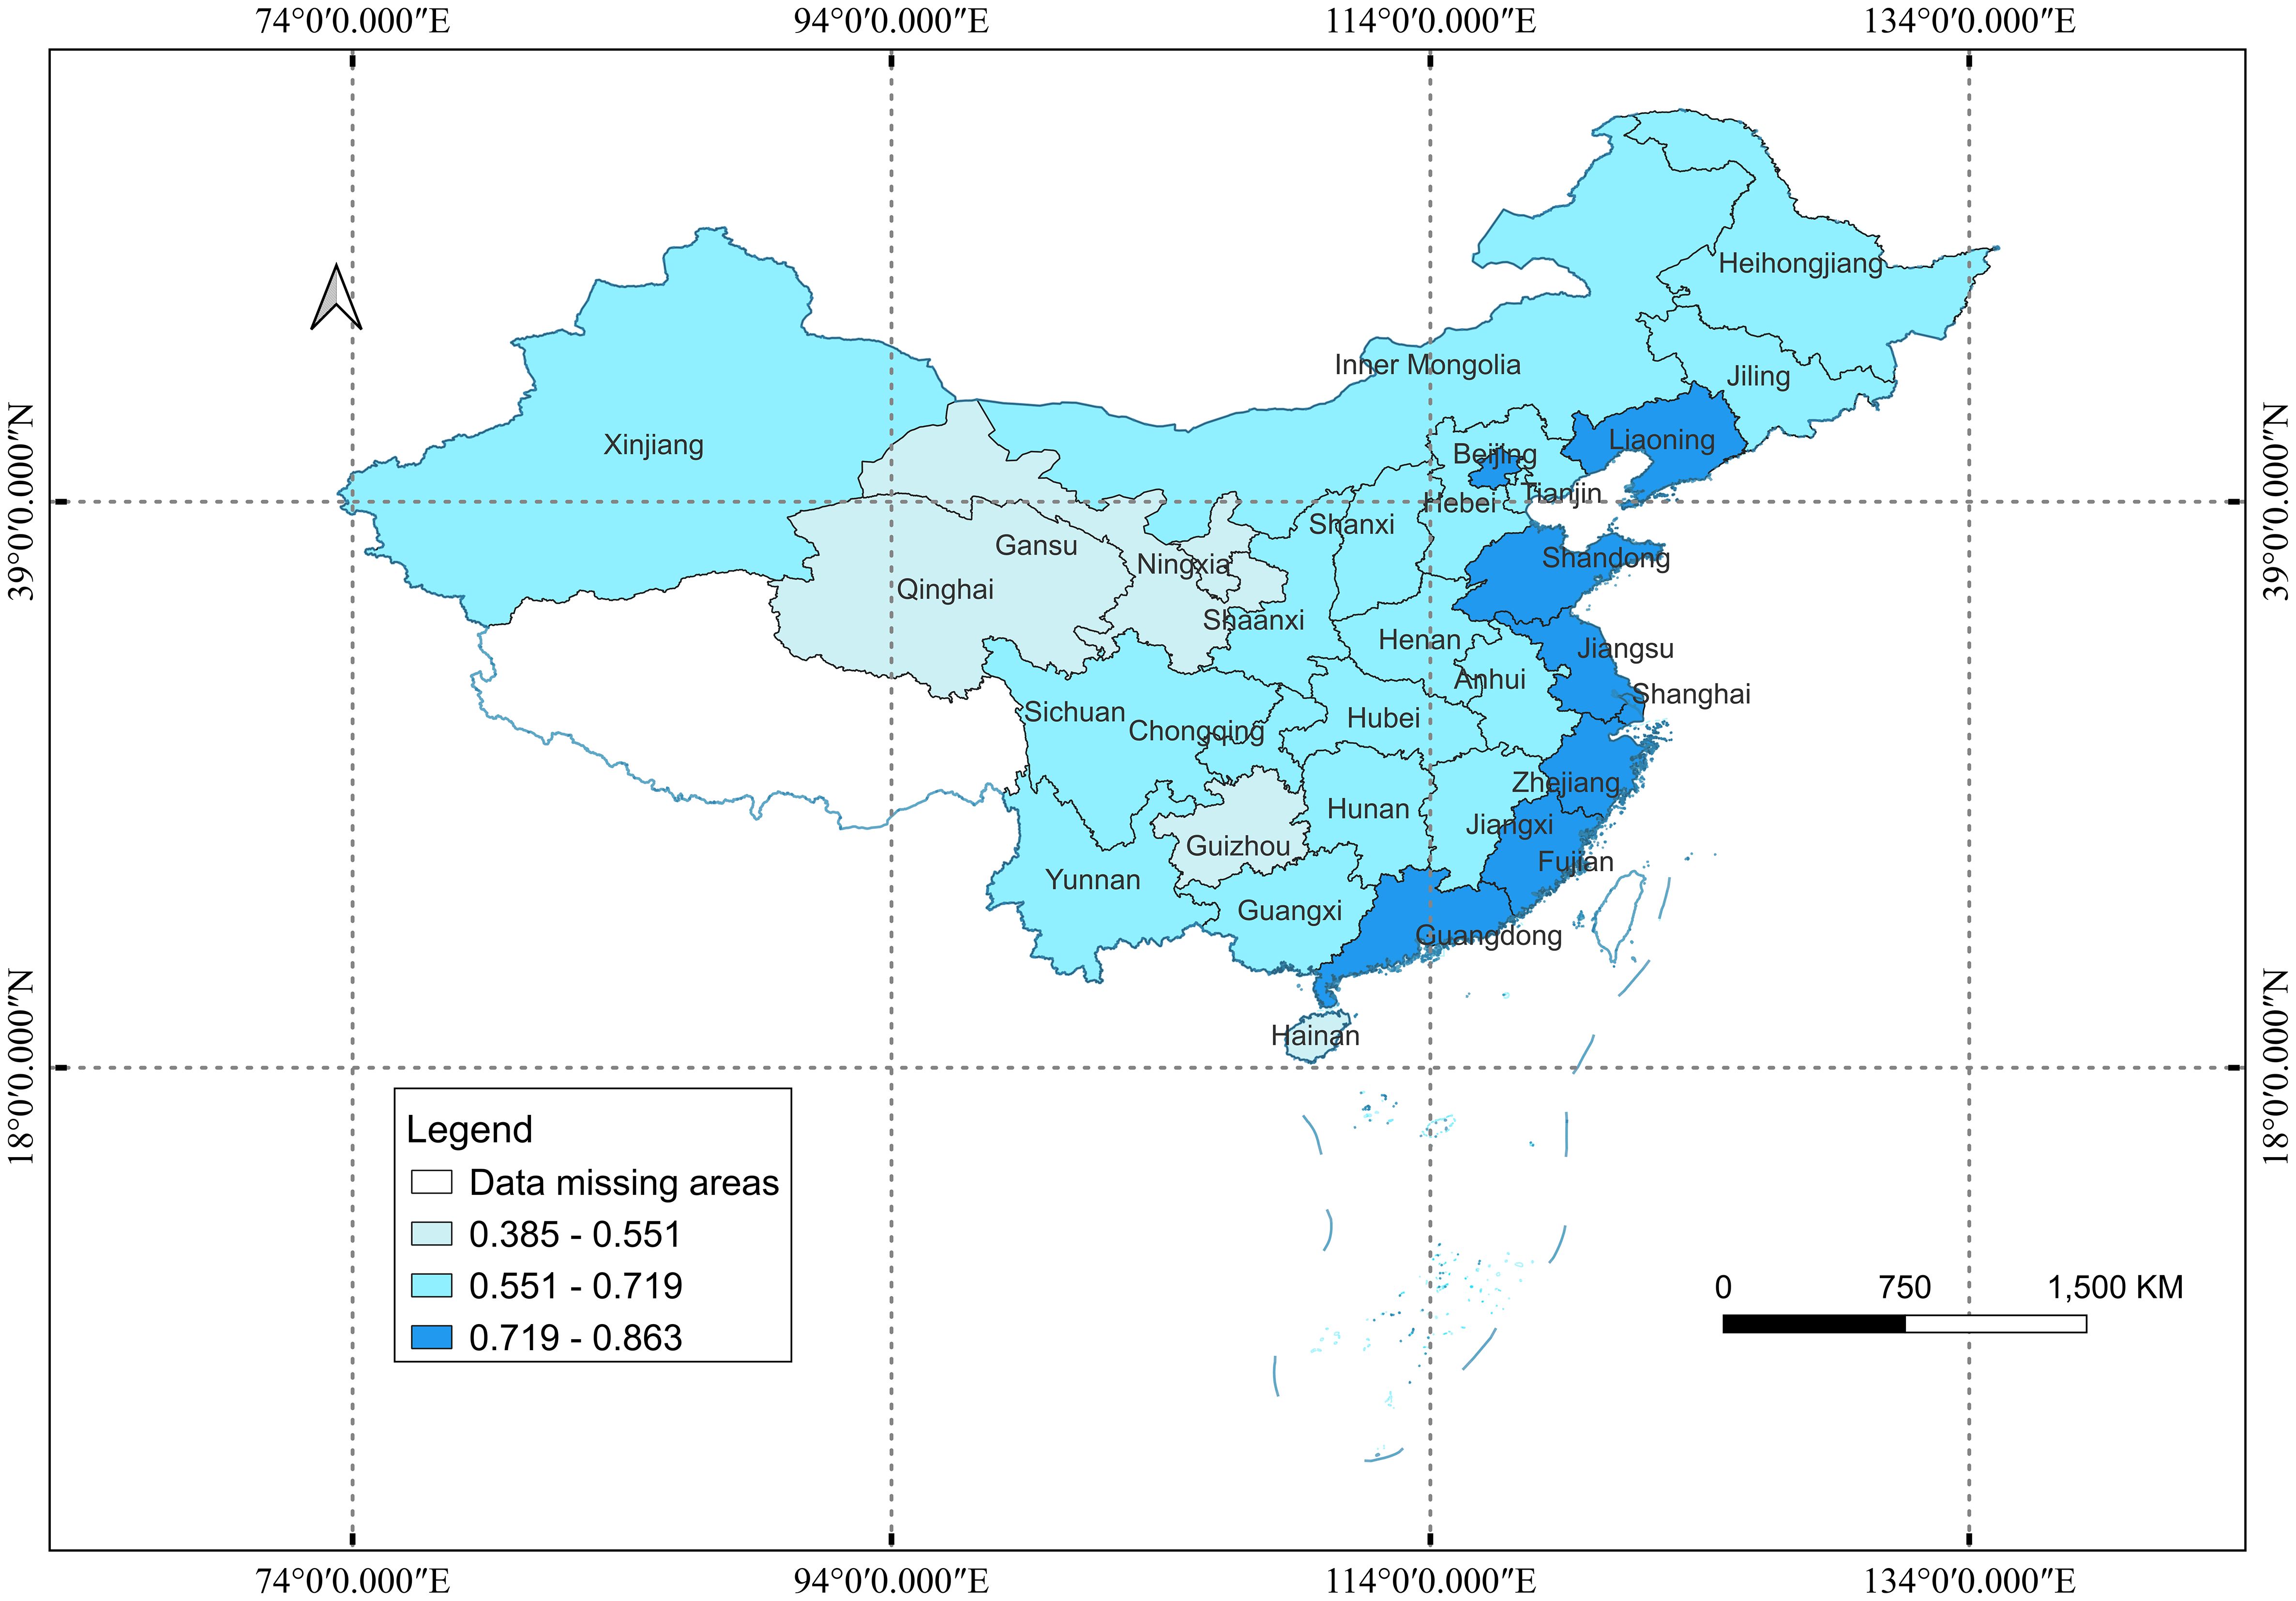
Figure 3 The spatial distribution of IE in 2011.
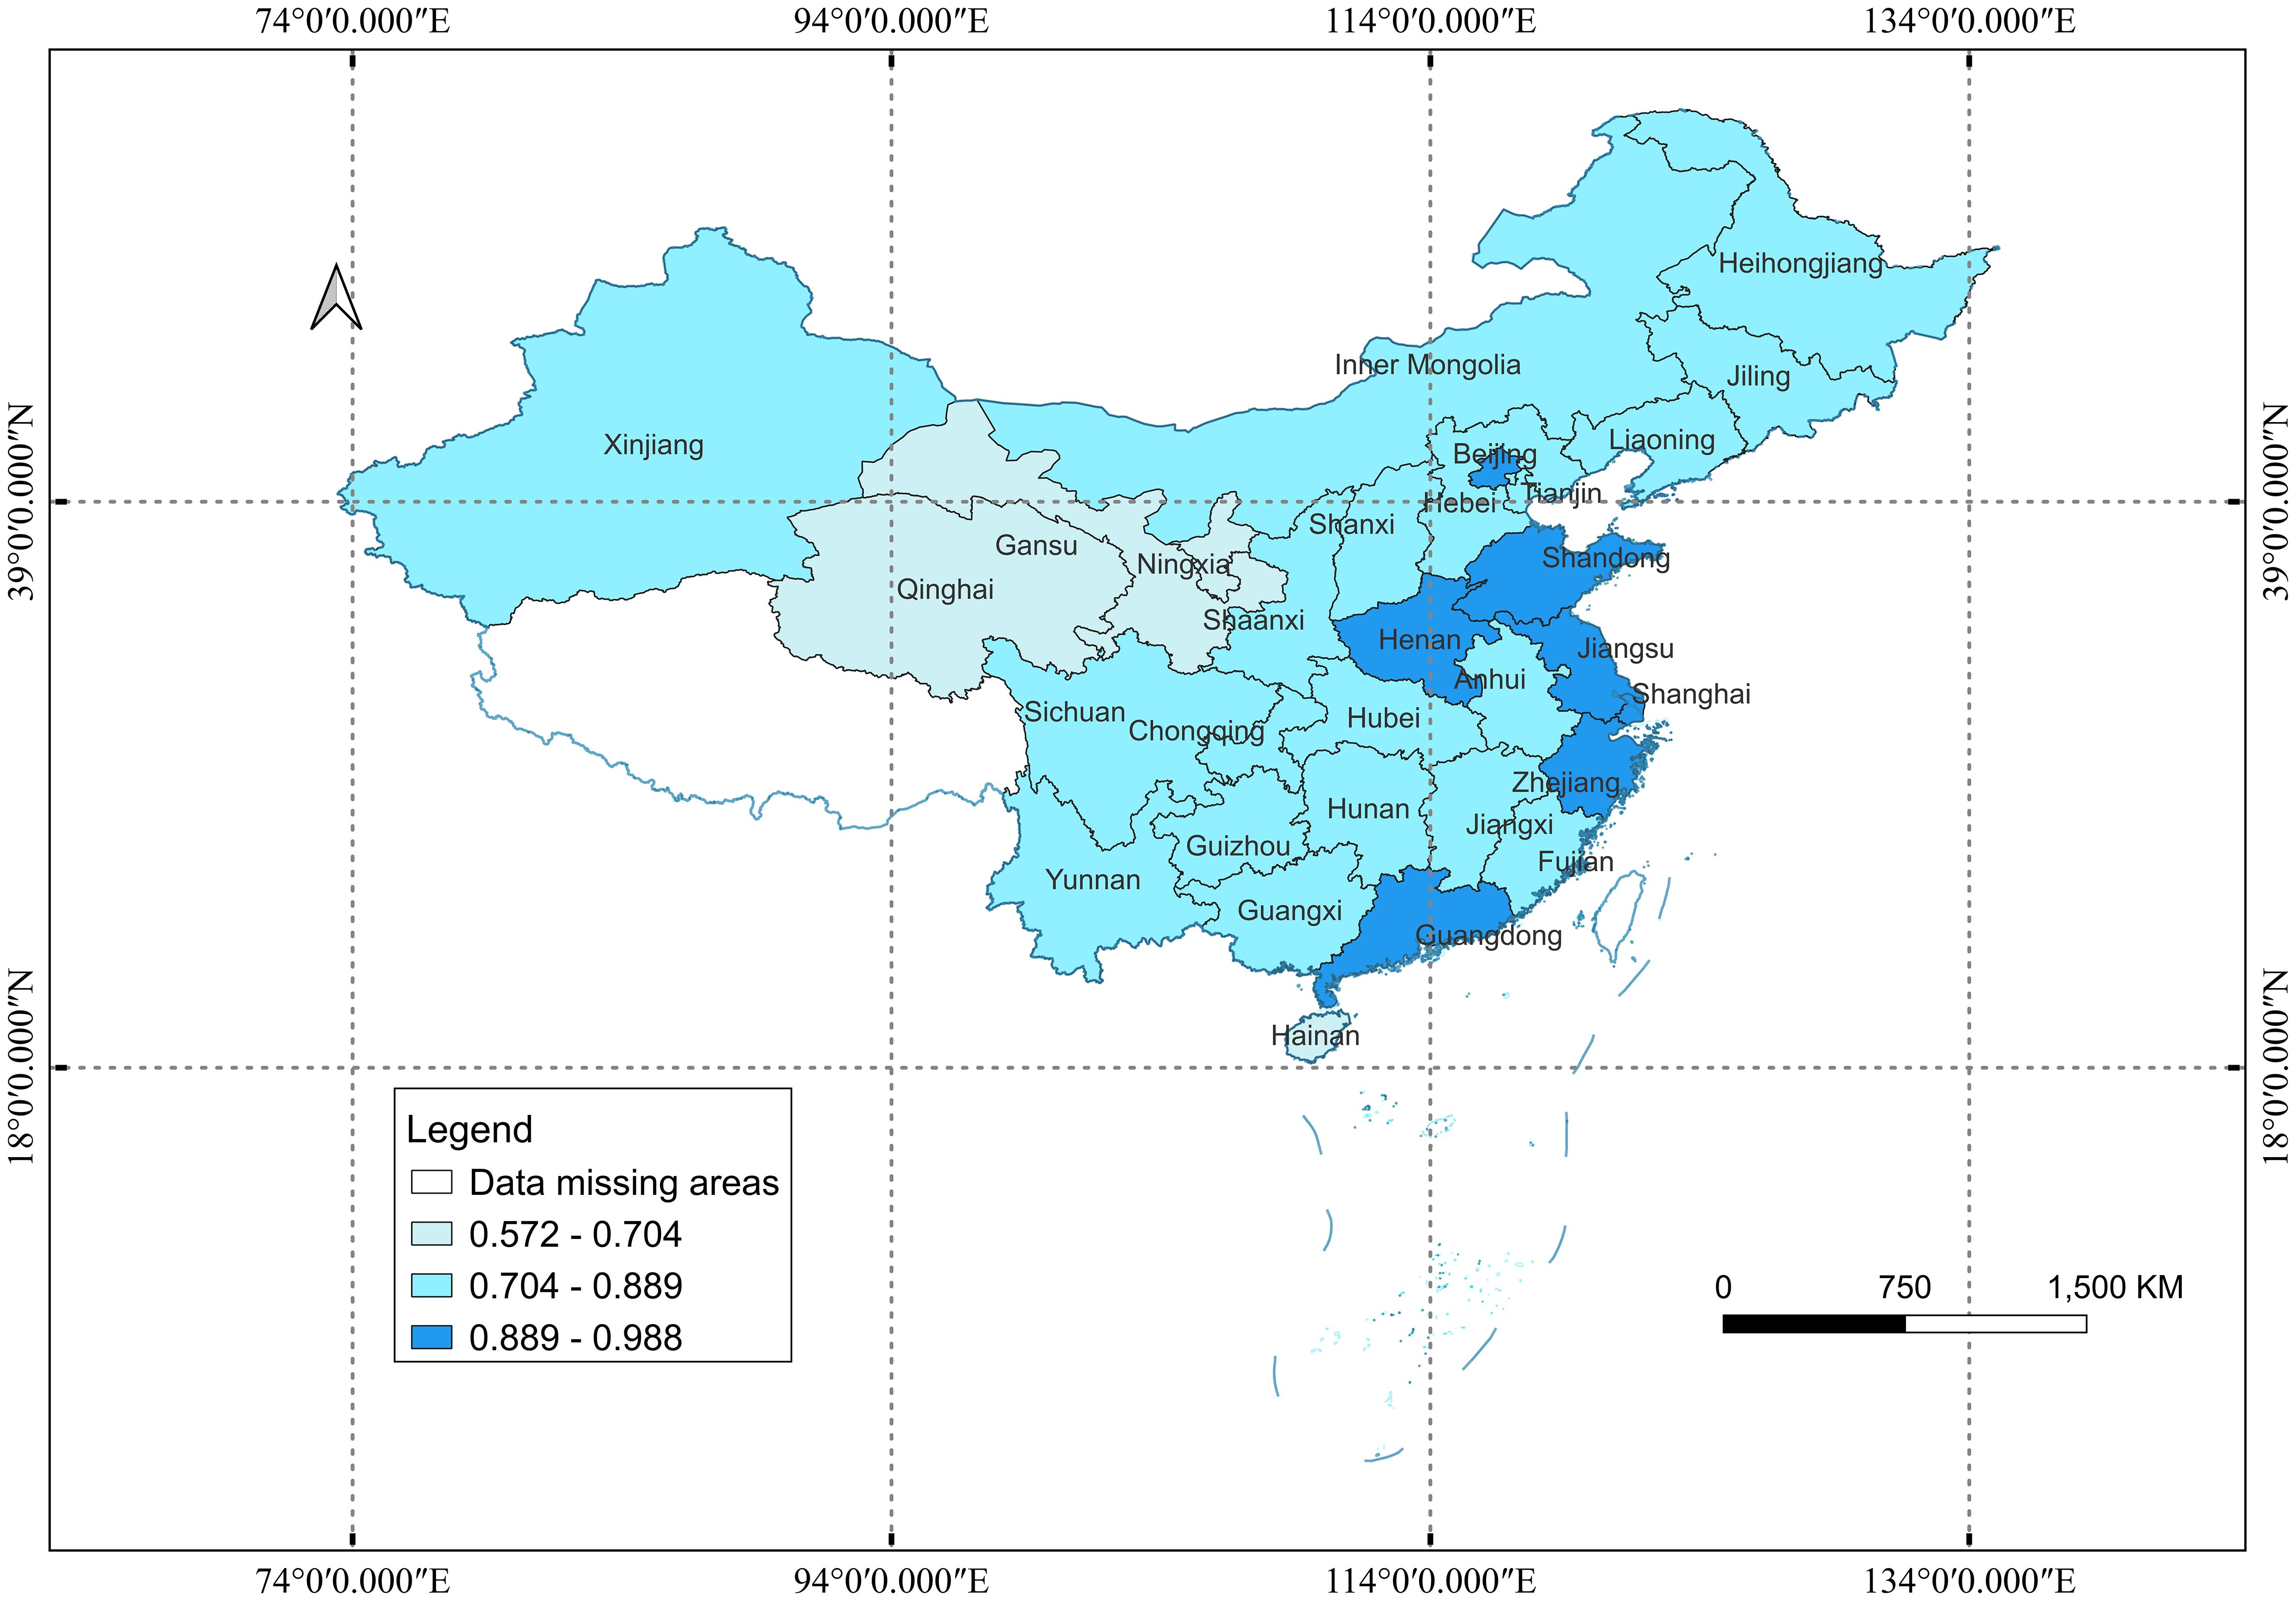
Figure 4 The spatial distribution of IE in 2021.
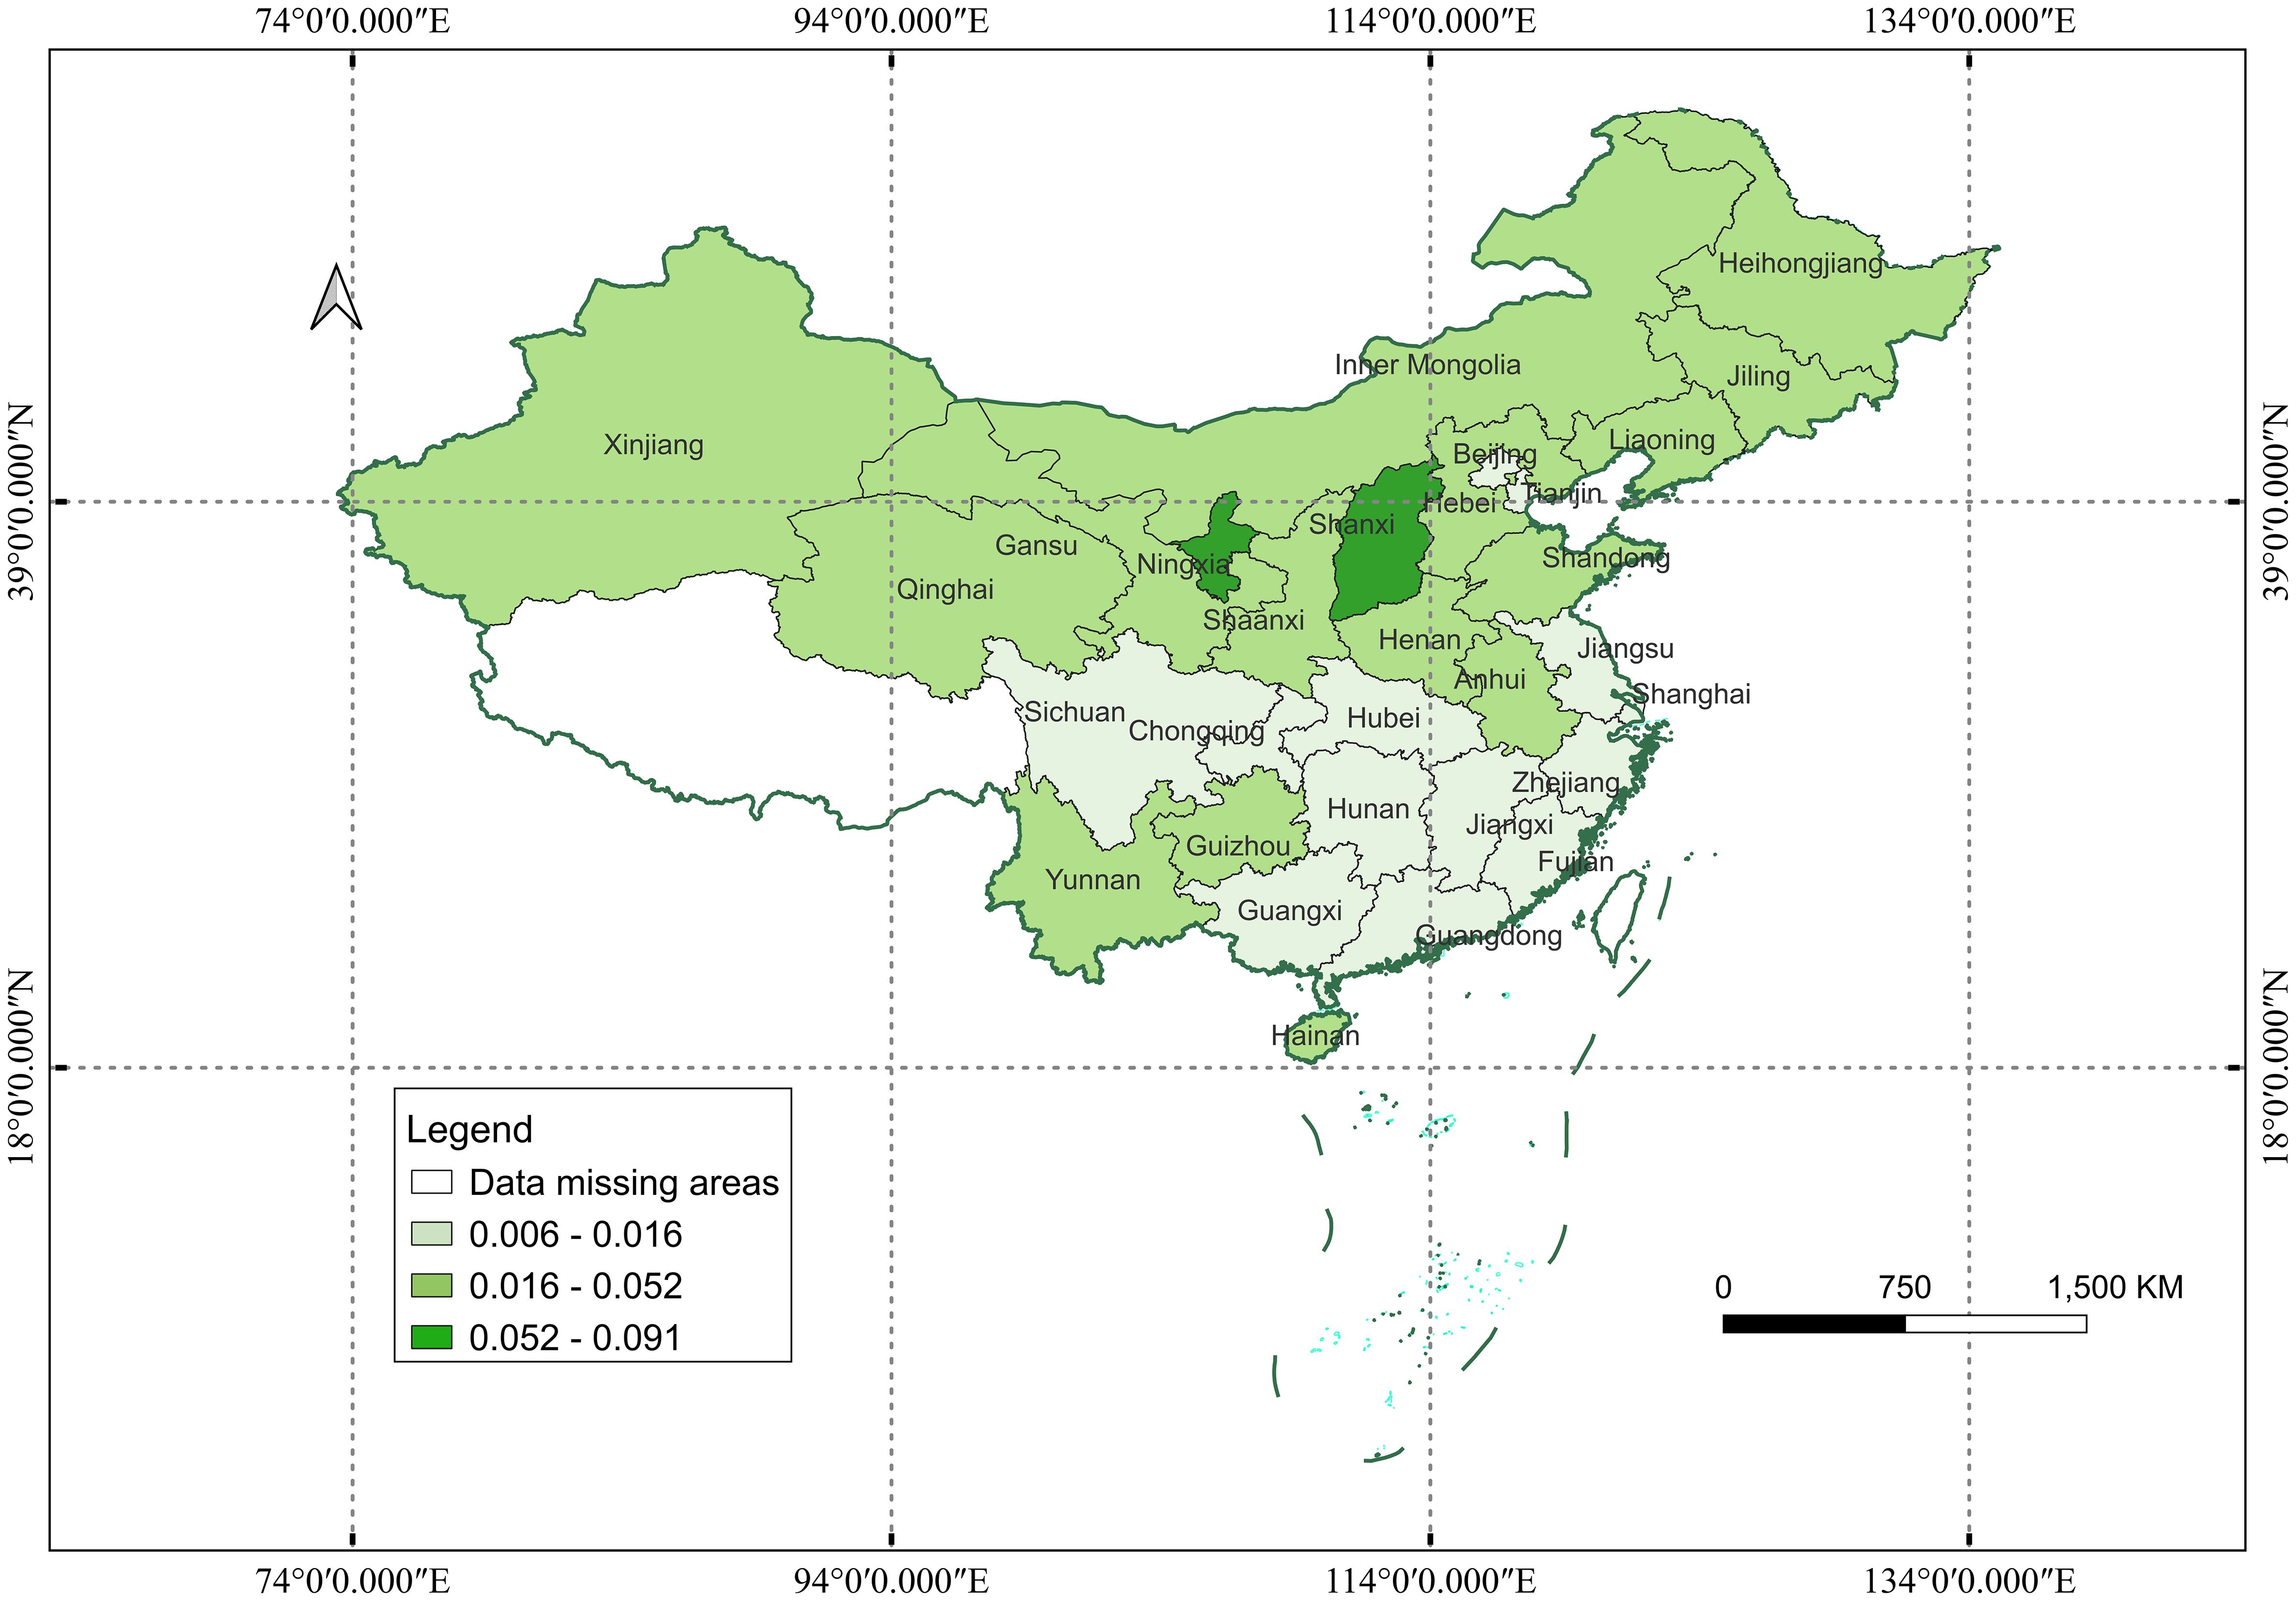
Figure 5 The spatial distribution of CE in 2011.
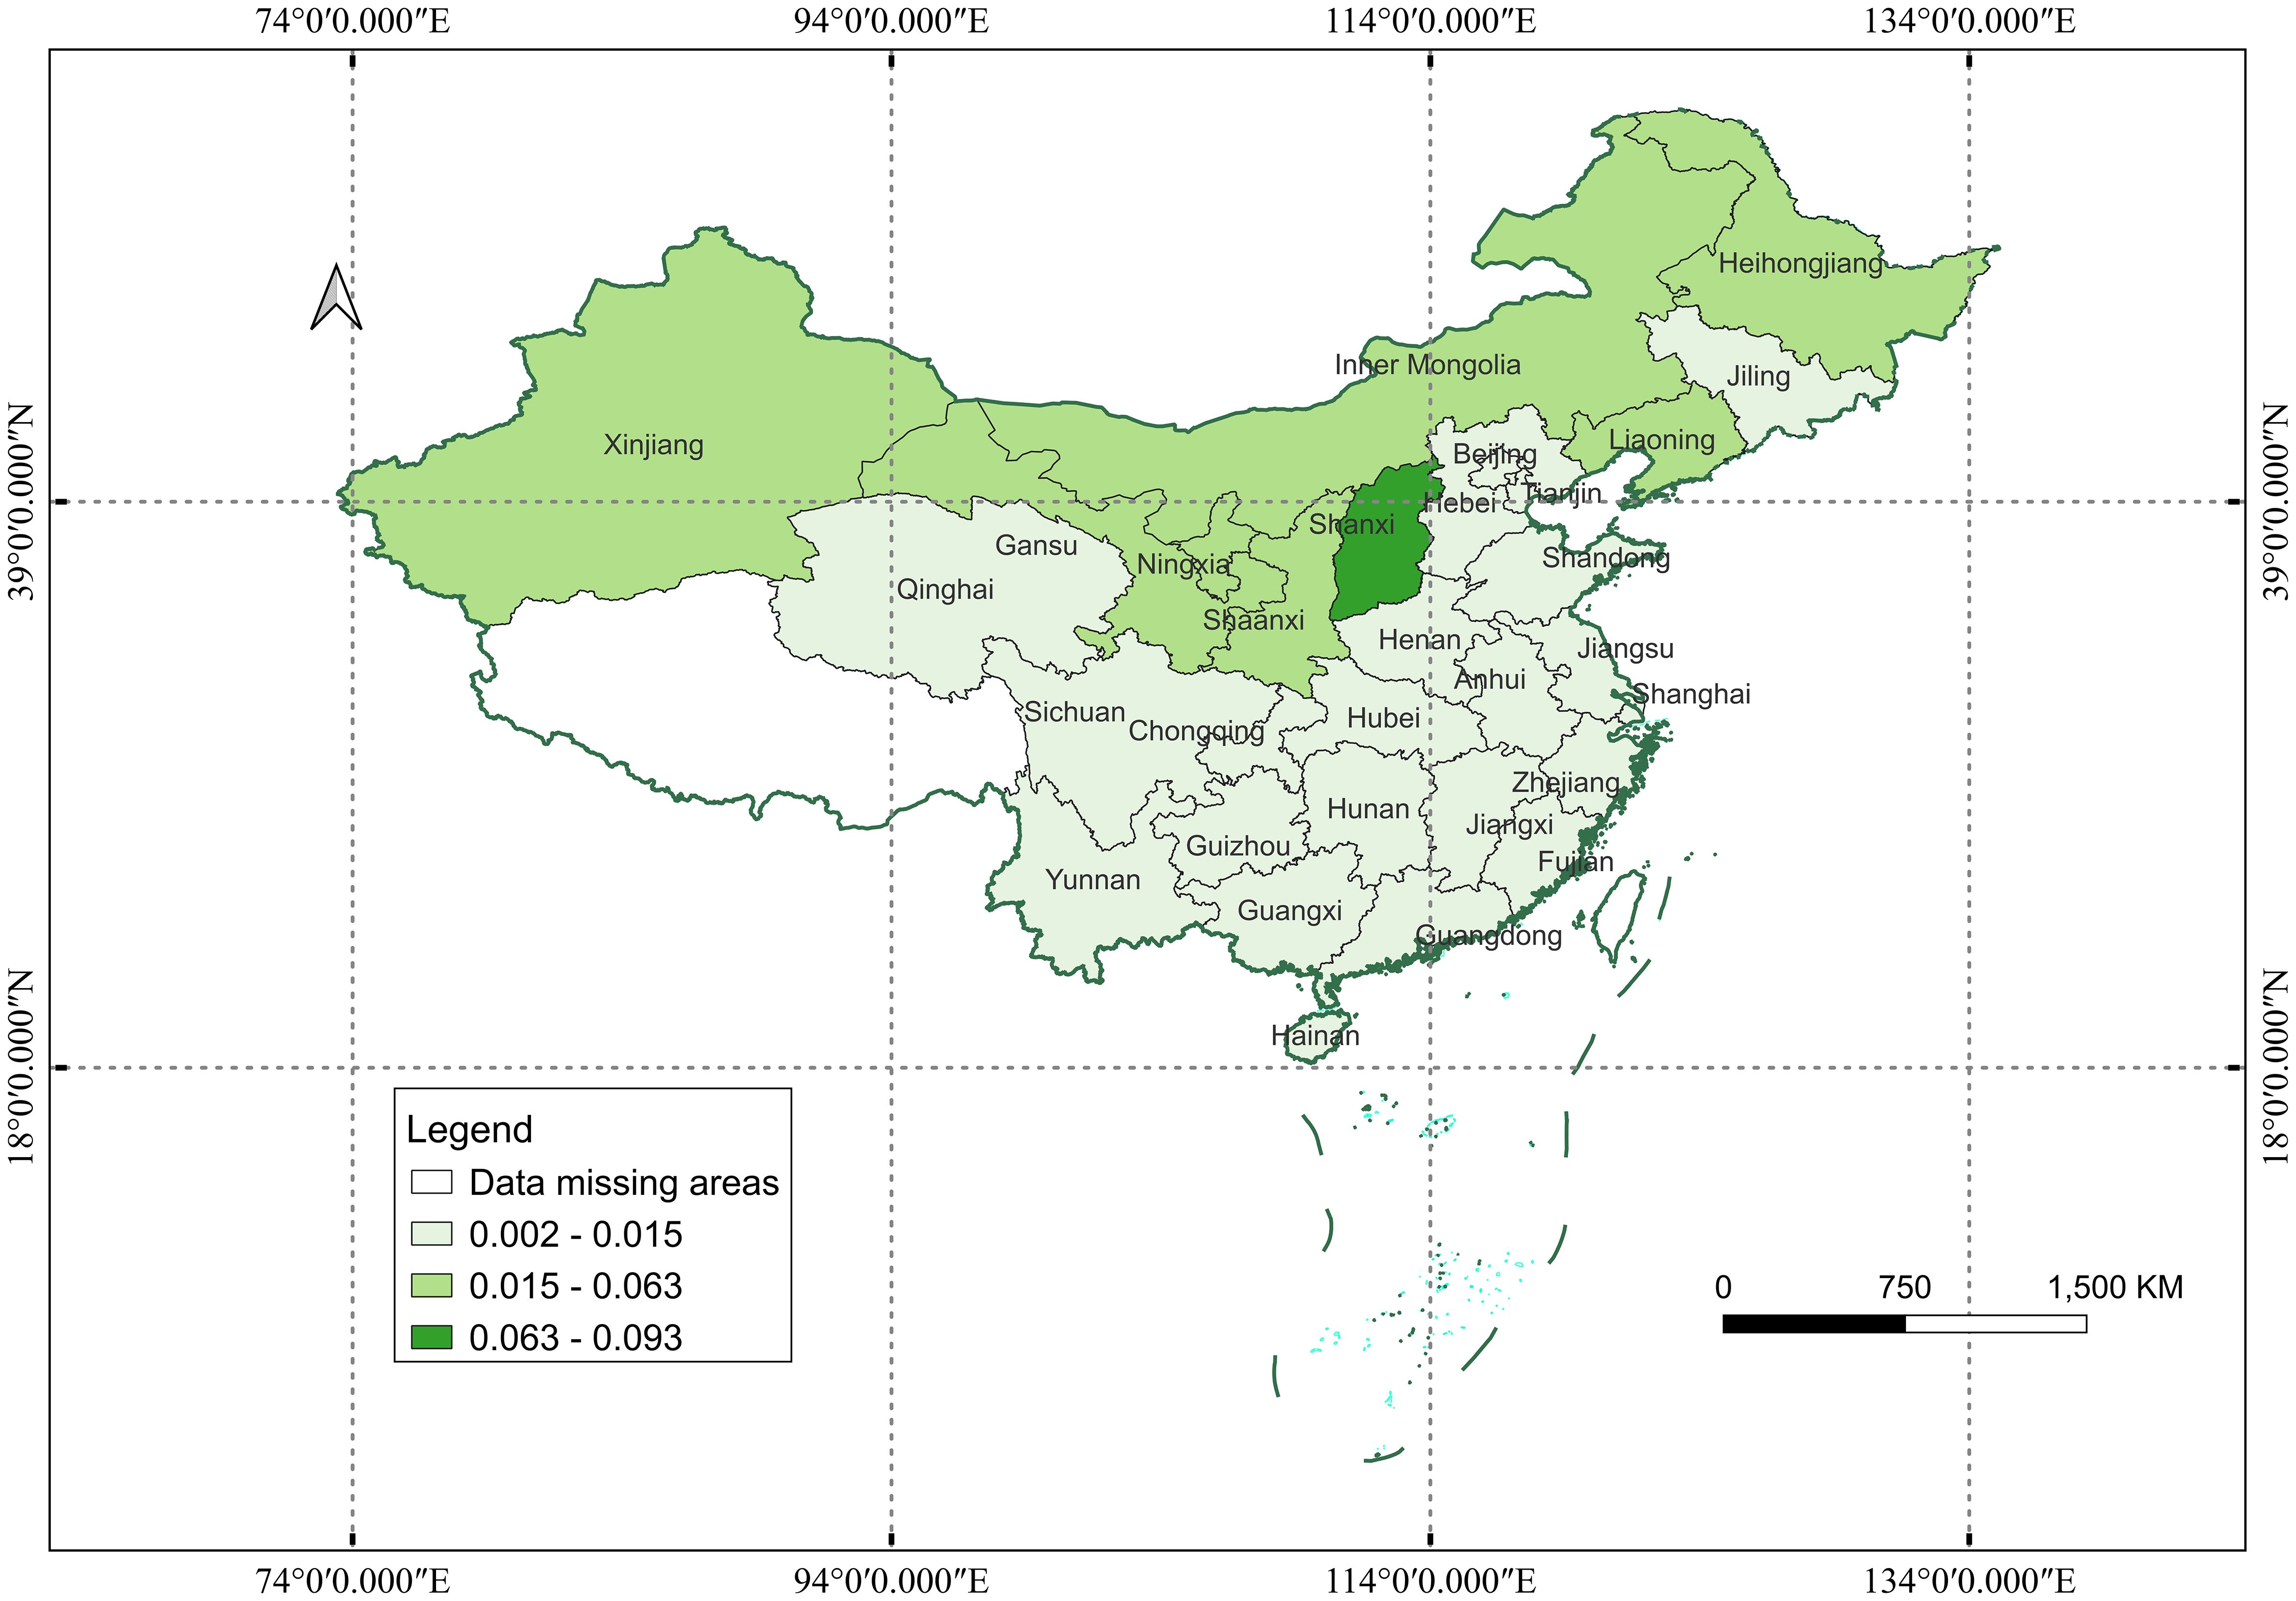
Figure 6 The spatial distribution of CE in 2021.
Figures 3 and 4 show the spatial distribution of IE in 2011 and 2021. From Figures 3 and 4, it can be seen that, firstly, the regions with high IE values in 2011 are mainly concentrated in the eastern coastal provinces, while Qinghai, Gansu, Ningxia, Guizhou, and Hainan have low IE values, and most of the central regions have medium IE values. It can be seen that in 2011, IE had just started and had not yet been popularized nationwide, and the eastern region had been ahead of other regions in realizing the integration of the digital economy with the real economy. Second, in 2021, the IE dominant regions started to penetrate the interior, and Henan, like many coastal cities, had a high level of IE. The three western poor regions of Qinghai, Gansu, and Ningxia have relatively low IE, and most central provinces still have medium IE levels. Finally, according to the categorized data in the legend, it can be seen that from 2011 to 2021, the level of IE in each province has been increasing and the inter-provincial gap has been narrowing. In short, the spatial distribution of IE shows a trend of ‘decreasing from east to west’, with regional differences decreasing with the evolution of time.
Figures 5 and 6 show the spatial distribution of CE from 2011 to 2021. According to Figures 5 and 6, firstly, the CE in 2011 shows a polarization trend of low in the south and high in the north, and regions with high CE account for the majority of the country. Ningxia and Shanxi may have a higher CE than the rest of the country because of the development of heavy-polluting industries such as coal, iron, and steel. Secondly, by 2021, the CE low-level areas in 30 provinces will be far more than the medium-level areas, and only Shanxi Province has a long-term high CE due to the development of coal and mineral resources. Finally, from 2011 to 2021, CE decreased to a certain extent, and the low-emission area expanded significantly, indicating that the carbon emission reduction policy has achieved some success. Overall, China’s CE shows a distribution of ‘low in the south and high in the north’, with low-carbon areas continuing to spread from south to north.
4.3 Spatial autocorrelation of IE and CE
4.3.1 Global spatial autocorrelation
Figure 7 shows the evolution of spatial correlation between IE and CE from 2011 to 2021.
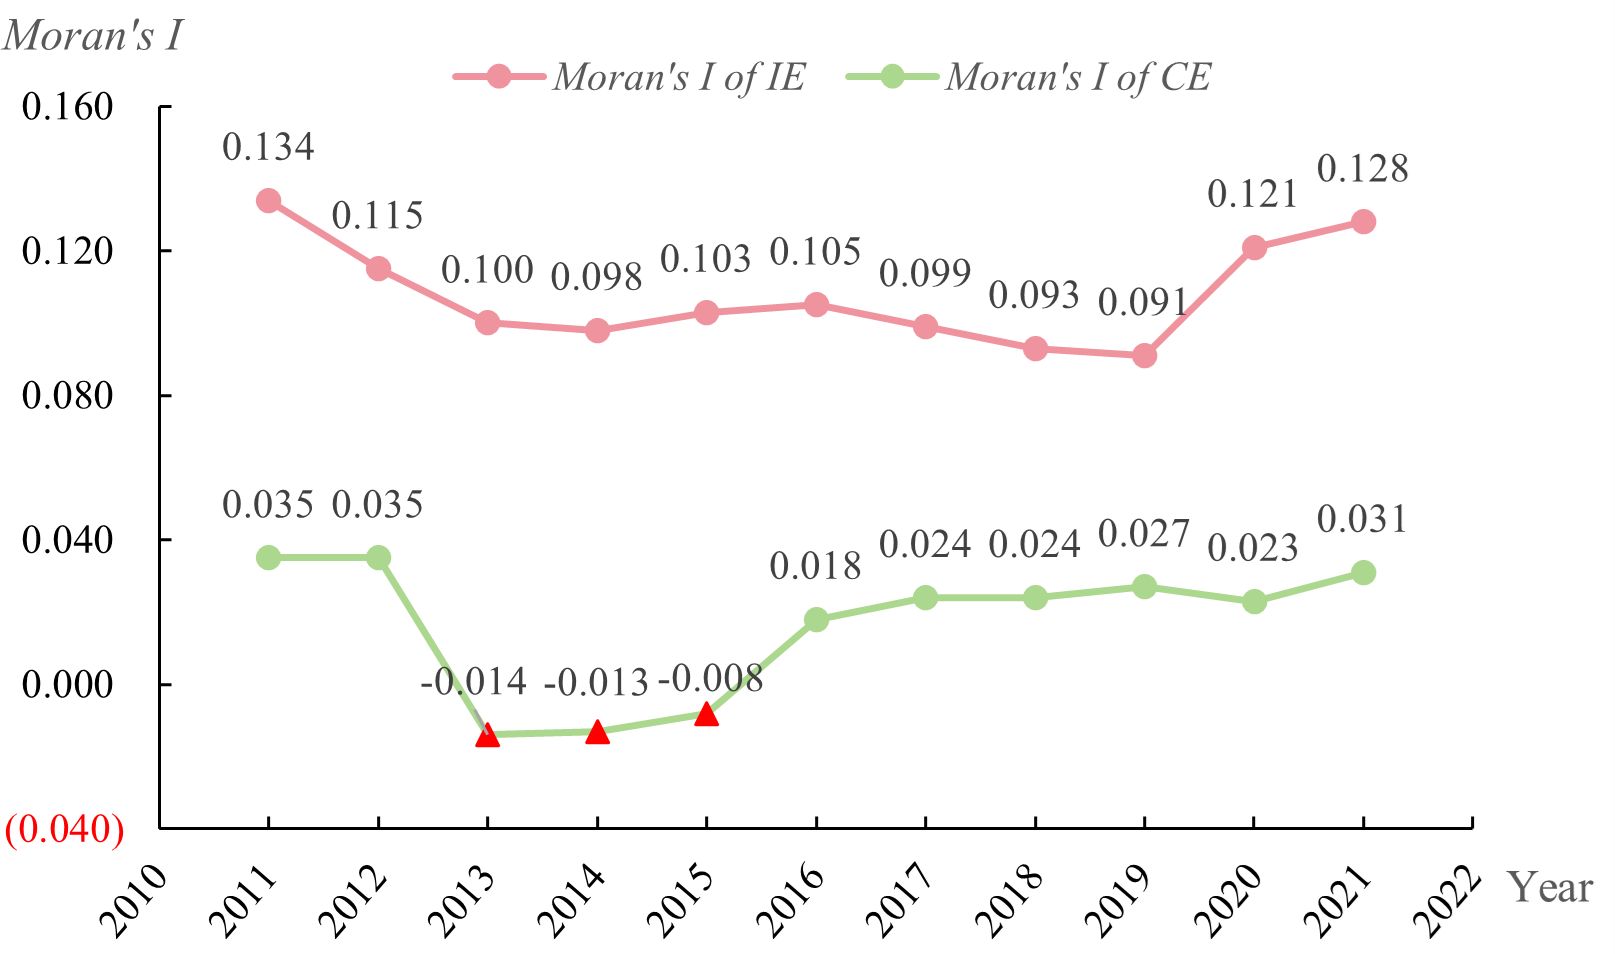
Figure 7 Moran‘s I of IE and CE from 2011 to 2021. The red triangles in the figure are marked as insignificant results, and the others are significant at the significance level of 0.01 or 0.1. The red font is a negative value.
First of all, it can be seen from Figure 7 that IE has strong spatial autocorrelation, that is, places with strong IE tend to gather positively, and vice versa. Secondly, except for 2013 to 2015 (in 2013-2015, CE was negatively correlated but the results were not significant and not statistically significant), CE has a positive and significant spatial correlation, which indicates that CE has ‘good neighbors’ or ‘beggar neighbors’. Finally, the spatial correlation of IE is much higher than that of CE, indicating that the economic effect is more likely to form spatial agglomeration than the environmental effect.
4.3.2 Local spatial correlation
The local Moran’s I index is the key to accurately capturing the heterogeneity of local spatial elements, reflecting the correlation between the value of an attribute in a region and neighboring regions (He et al., 2023). In this paper, the Moran index scatter plots of IE and CE from 2011 to 2021 are drawn to describe the local spatial correlation. Due to space limitations, only the Moran scatter plots of 2011 and 2021 are shown, as shown in Figures 8, 9.
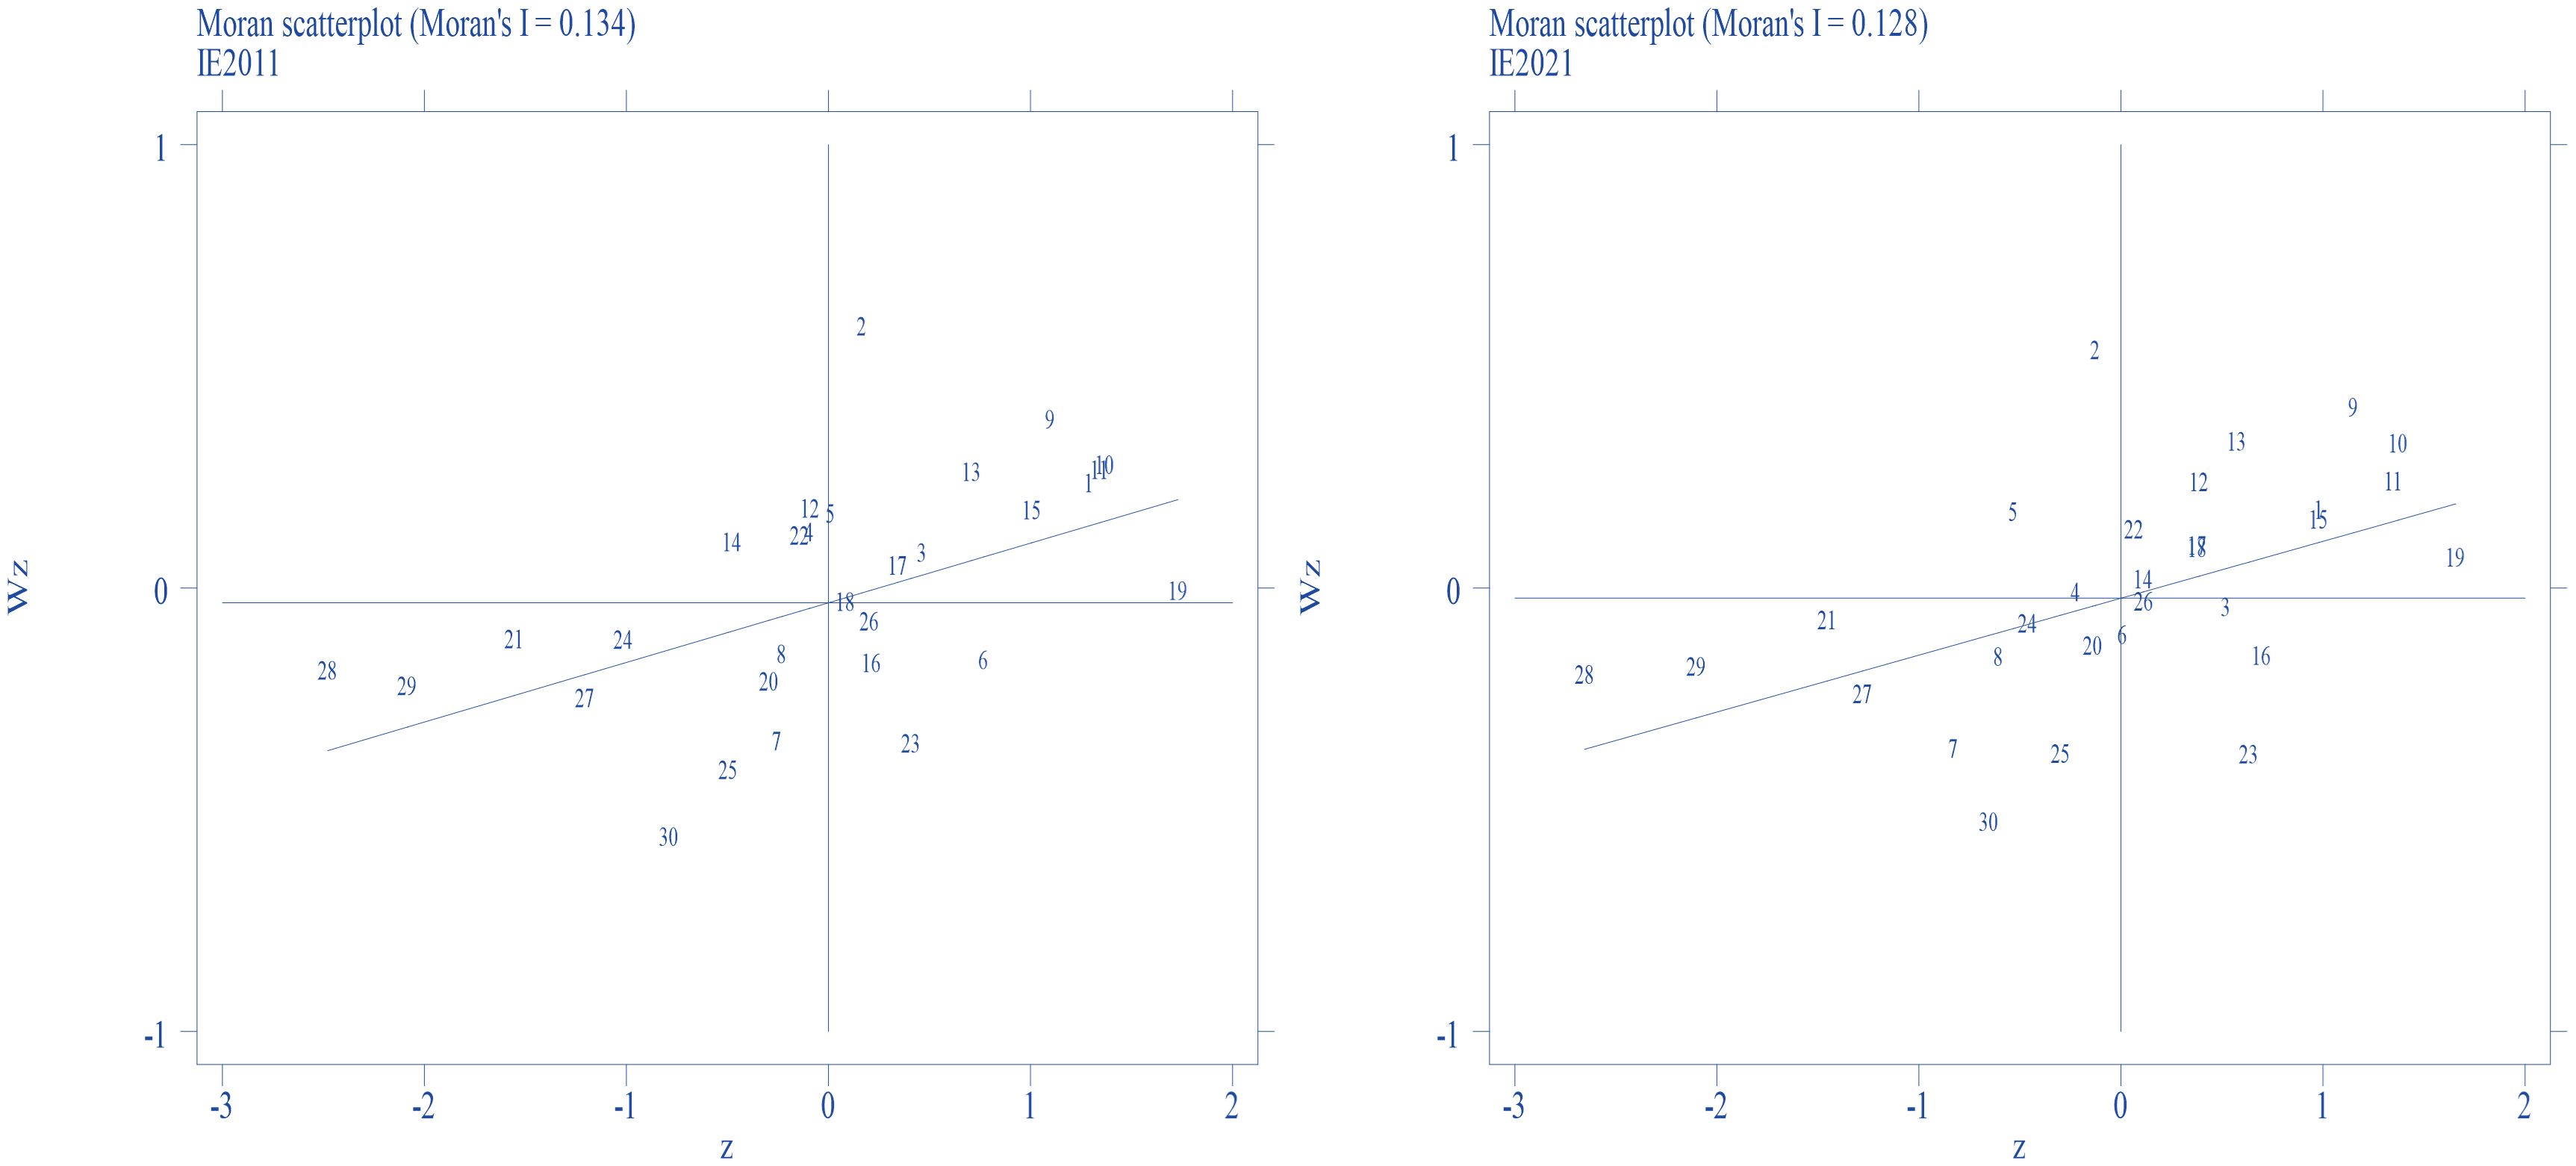
Figure 8 Moran scatterplot of IE in 2011 and 2021.
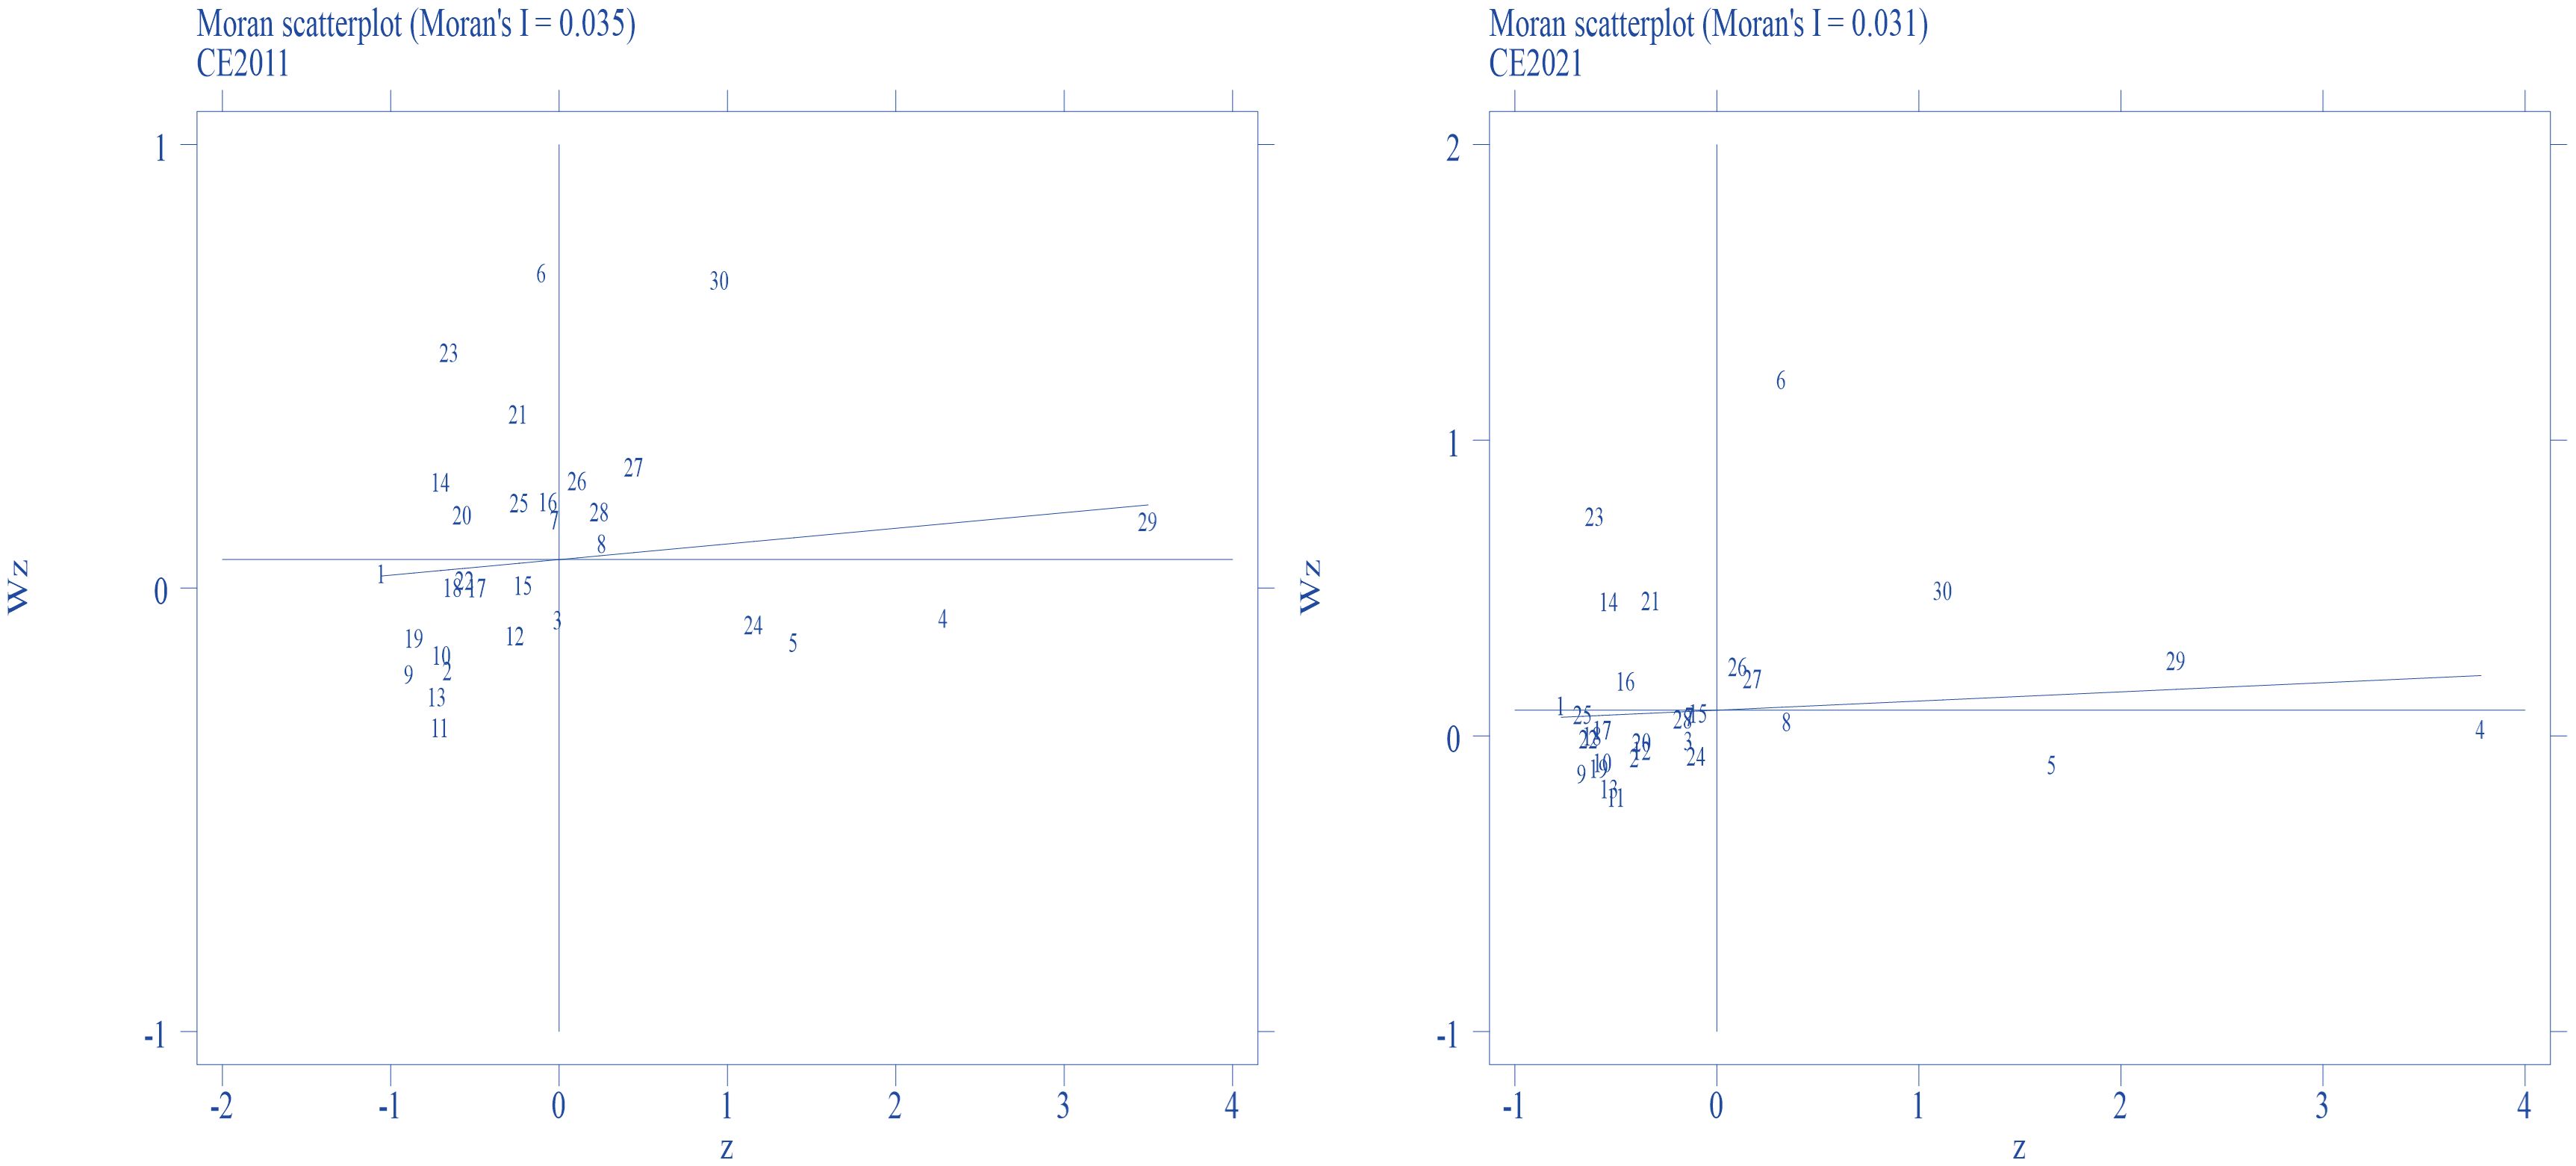
Figure 9 Moran scatterplot of CE in 2011 and 2021.
According to Figure 8, we can see that the IE of 30 provinces is mainly concentrated in the first and third quadrants from 2011 to 2021, indicating that ‘good neighbors’ and ‘beggar neighbors’ coexist. This two-way agglomeration may lead to the emergence of a gap. It can be seen from Figure 9 that the Moran scatter plot of 30 provinces in China in 2011 is mainly concentrated in the second and third quadrants, and the third quadrant is more, indicating that mixed agglomeration and ‘low-low agglomeration’ coexist, and the agglomeration of places with lower carbon emissions is more obvious. The Moran scatterplot of China’s 30 provinces in 2021 is mainly concentrated in the third quadrant, significantly more than in 2011, indicating that the carbon emission situation has eased in the past 10 years, and the low-carbon emission areas have increased and continued to gather.
4.4 The spatial effect of IE on CE
4.4.1 Spatial econometric model results
4.4.1.1 Spatial modeling regression results
The measurement results of SDM with fixed time are shown in Table 6. According to Table 6, first of all, the spatial autoregressive coefficient is -0.383, which is significant at the significance level of 0.05, indicating that the more concentrated the regions with large carbon emissions, the more conducive to centralized governance and the easier it is to reduce carbon emission intensity. Secondly, IE can significantly inhibit CE, and the coefficients are -0.146 and -0.305 without considering and considering the spatial effect of the spatial matrix, respectively. It can be seen that IE has a stronger inhibitory effect on CE when considering spatial spillover. Finally, under the consideration of the spatial matrix, the control variables such as TI, RC, GG, etc. have a significant reduction effect on CE.
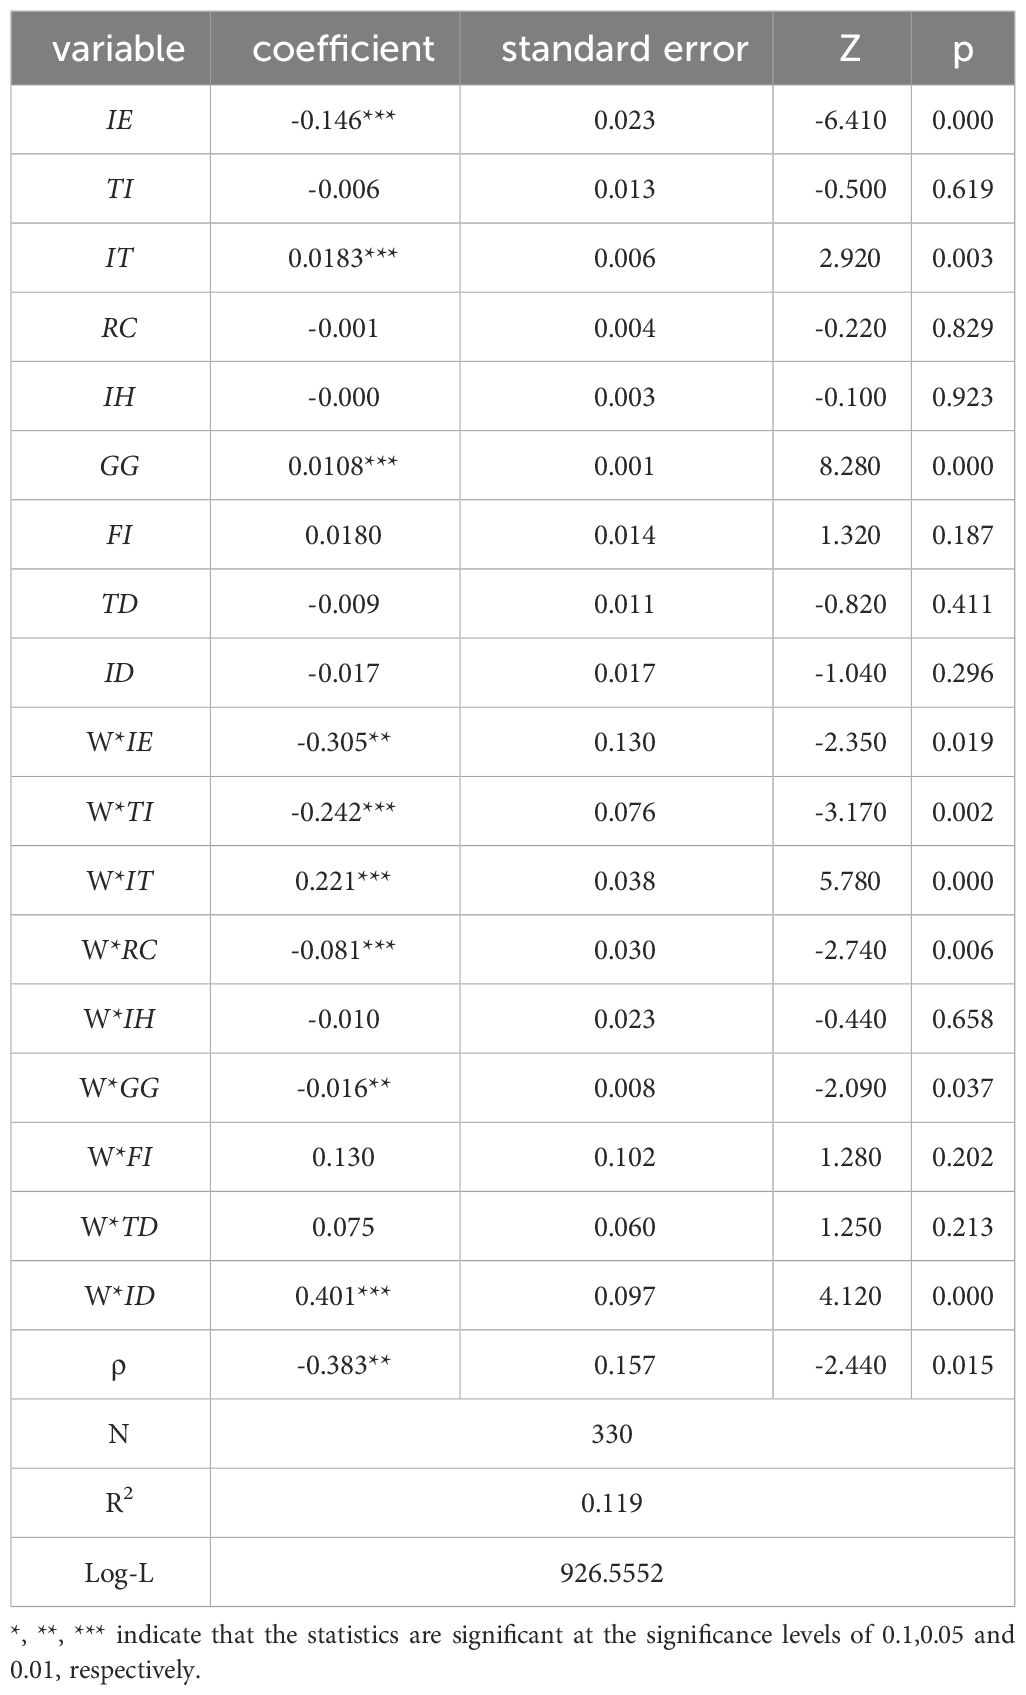
Table 6 Model measurement results.
4.4.1.2 Spatial Spillover Effect Decomposition
To further analyze the spatial effect of IE on CE, the spatial spillover effect is decomposed, and the results are shown in Table 7. It can be seen from Table 7 that the direct and spatial effects of IE on CE are significant, and the indirect inhibitory effect on CE is stronger than the direct effect.
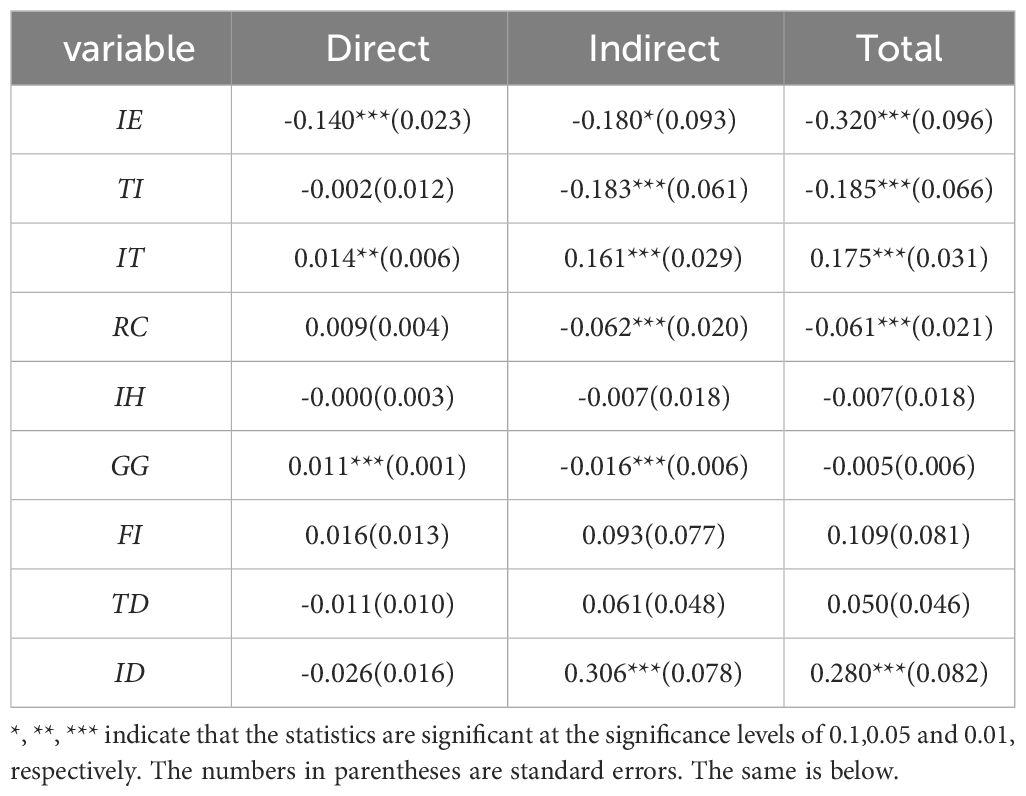
Table 7 Spatial spillover effect decomposition results.
4.4.2 Robustness test
The robustness test of this paper is divided into two categories: First, the robustness test of the model. On the one hand, according to the model selection process in Table 4 in section 3.2.4, it can be determined that the model selected in this paper is appropriate. On the other hand, to further determine the credibility of the conclusions, the SDM model with both OLS and individual time fixed is selected for testing in this paper. Second, the robustness test of the spatial matrix. In this paper, the economic distance matrix is used for the test. The above test results are shown in Table 8. According to Table 6, it can be seen that IE has a significant reduction effect on CE (all at the 0.01 level of significance), indicating that the previous test results are robust.
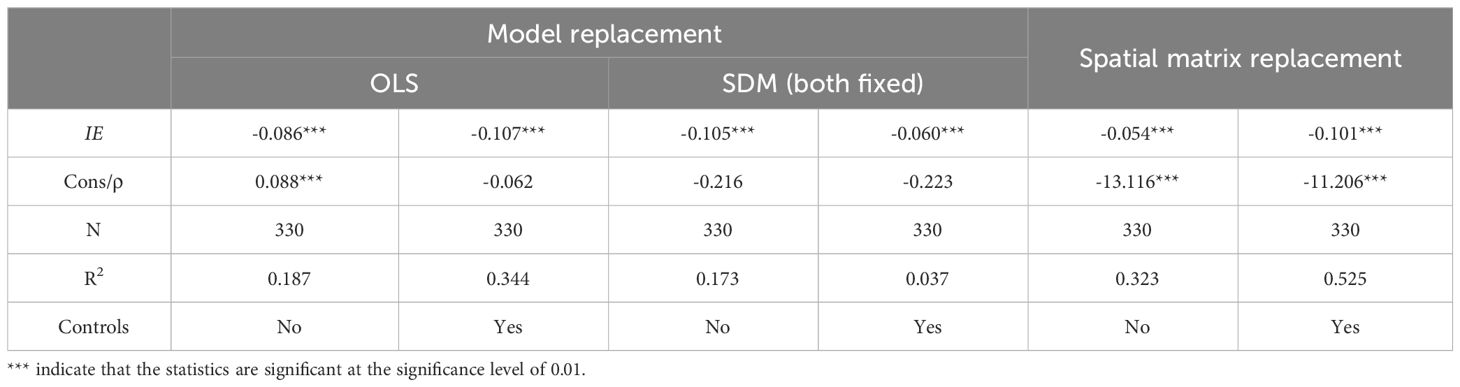
Table 8 Results of the robustness test.
4.5 Regional heterogeneity analysis
Spatial econometric regression of the data for the eight integrated economic zones based on the selected time-fixed SDM model described above is shown in Table 9. IE in the North Coastal Economic Zone all had a reducing effect on CE, but the results were not significant. The Northeast Economic Zone, the Southern Coastal Economic Zone, and the Southwest Economic Zone IE have significant decreasing effects on CE (coefficients of -0.220, -0.092, and -0.308), and the decreasing effects are even stronger when spatial effects are taken into account (-0.344, -0.118, and -0.724). The Eastern Coastal Economic Zone and the Middle Yangtze River Economic Zone IE have a significant contributing effect on CE. However, it is not significant when spatial effects are considered. The middle reaches of the Yellow River economic zone IE have a significant contribution to CE (3.890), which is stronger when spatial effects are considered (11.668). The Northwest Economic Zone IE has a facilitating effect on CE when spatial effects are considered (1.947). In addition, different control variables have different effects in different regions.
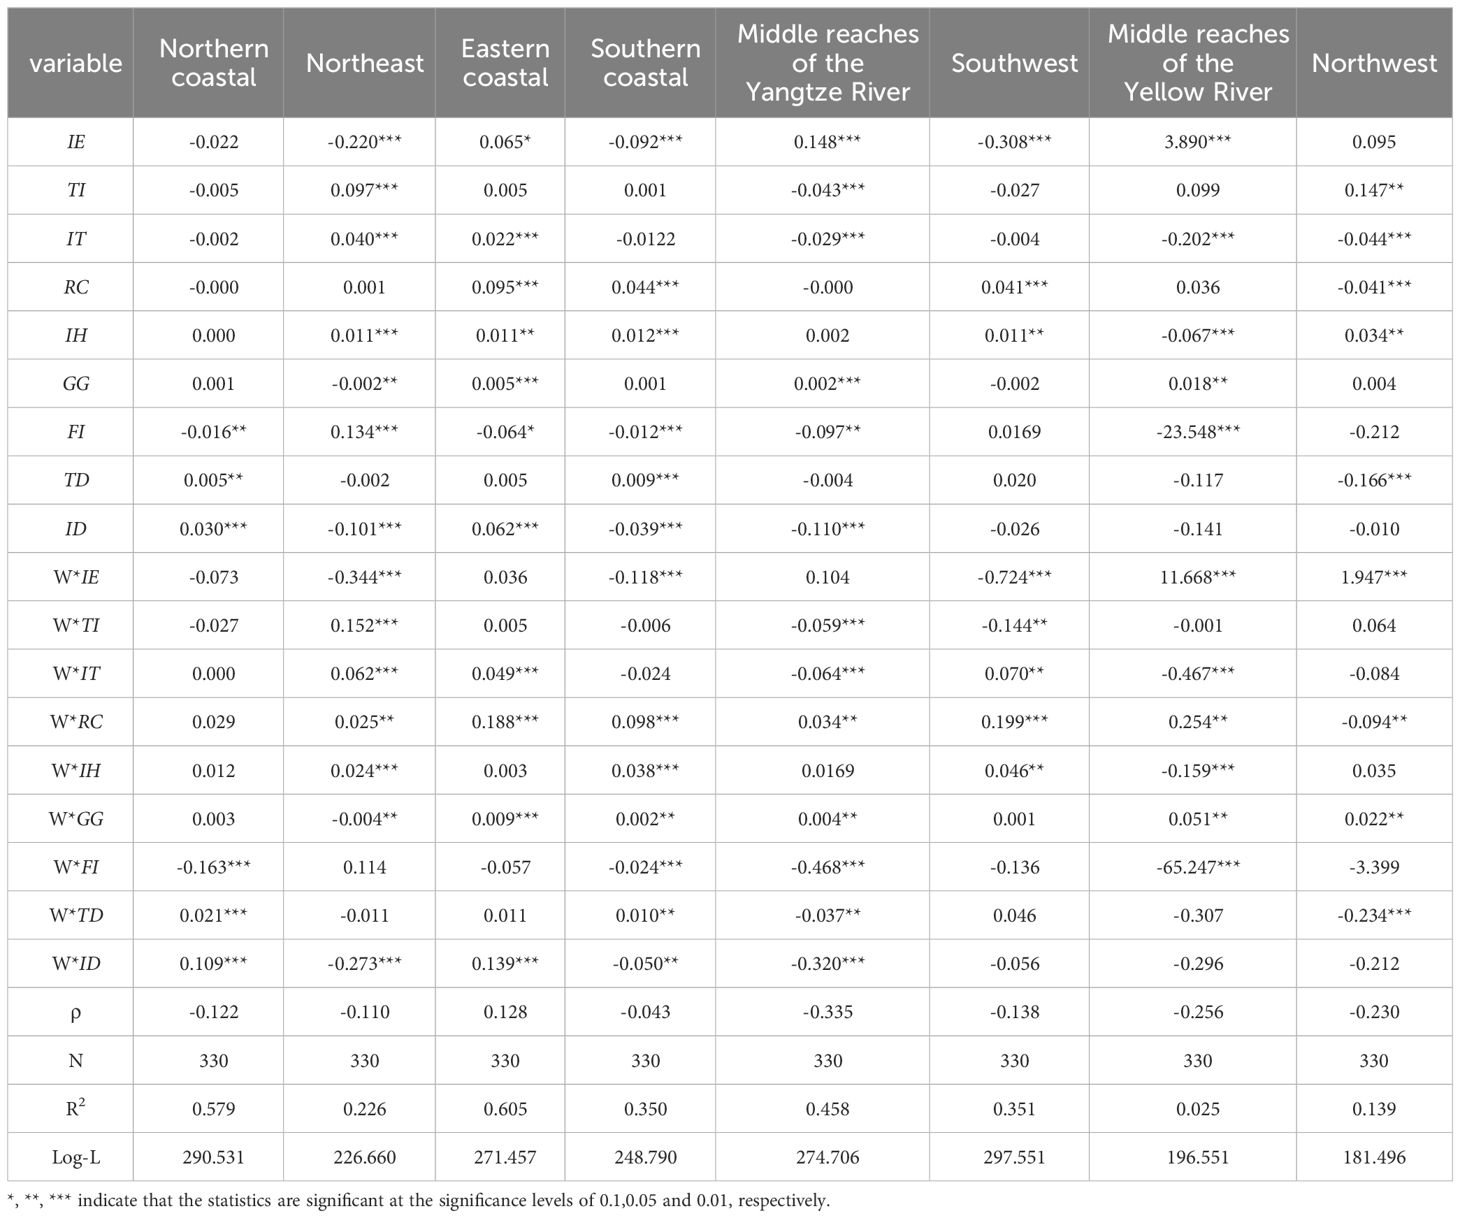
Table 9 The spatial econometric regression results of the eight comprehensive economic zones.
5 Discussion
5.1 Discussion of results
The main contributions of this article are reflected in the following aspects. Firstly, using reasonable methods and indicator systems to measure the integrated economy can fill the gap in the measurement of the integrated economy in the existing literature. Secondly, the innovative incorporation of integrated economy and carbon emissions into the same theoretical framework has deepened the theoretical research on low-carbon economy. Finally, analyze the current situation and inherent relationship between integrated economy and carbon emissions from a spatial perspective, and deepen relevant research in spatial economics. Therefore, for the discussion of the test results this paper will develop 3 aspects. (1) An in-depth discussion of the measured results of the integrated economy and carbon emissions, which includes a discussion of the temporal evolution, spatial distribution, and spatial correlation of IE and CE. (2) In-depth discussion of the test results of the impact of an integrated economy on carbon emissions. (3) In-depth discussion of the regional heterogeneity of the impact of the integrated economy on carbon emissions in the eight economic regions.
5.1.1 In-depth discussion of measurement results
In this section, the results of the IE and CE measurements are discussed, which are mainly divided into the discussion of the results of the IE measured by the coupled coordination model, the evolutionary characteristics of the IE and CE, and the spatial autocorrelation of IE and CE.
5.1.1.1 Measurement results of the integrated economy
Table 5 shows the measurement results of the integrated economy. Firstly, the IE grades of China’s 30 provinces show an upward trend during the study period, and the overall shift from A2 to A4 is realized, which is consistent with the findings of (Zhang et al., 2022). This indicates that China’s economy still maintains a high level of growth, and IE formed by the coupling and coordination of the digital economy and the real economy has become a new type of economic form. This is related to China’s policy move since 2015 to focus on the real economy and vigorously develop the digital economy. This paper constructs an indicator system to measure the development level of the real economy from three aspects: scale, structure, and development potential, which is different from the measurement of the real economy by scholars such as (Zhang et al., 2022; Shi and Sun, 2023), and has certain innovation and application value. Secondly, the level of IE varies among the 30 provinces in the country. Guangdong has been highly integrated for a long time. The headline provinces of Beijing, Jiangsu, and Zhejiang are second only to Guangdong. Notably, the IE of Hainan, Qinghai, Ningxia, and Tibet have been in an unbalanced or low integration state, with a large gap between their integration levels and those of other provinces. Differences in regional development are related to China’s policy preferences. China’s economic development started in the eastern coastal region and penetrated from the east to the west (Chen, 2022). Thus Guangdong, Beijing, Jiangsu, and Zhejiang have higher levels of integrated economic development than Qinghai, Ningxia, and Tibet in the west. This reveals that China should make full use of the penetration effect of the eastern region in policy formulation to reduce regional differences.
5.1.1.2 The time evolution and spatial distribution of IE and CE
Figure 2 shows the change in national mean time for IE and CE from 2011 to 2021. From Figure 2, it can be seen that IE shows an increasing trend (decreasing after 2019) and CE shows a slow decreasing trend in general. The fluctuation of IE in 2019 is related to the impact of the new crown epidemic on the development of the real economy (Takyi et al., 2023). As China’s national attention to carbon reduction and emission reduction continues to increase, and policy pilots continue to grow, carbon emissions will also show a significant downward trend (Feng et al., 2024). However, given China’s large energy consumption base, carbon emissions will only decline slowly.
Figures 3 and 4 show the spatial distribution of IE in 2011 and 2021. Comparing the two figures, it can be found that: firstly, from 2011 to 2021, the level of IE in each province has been increasing, and the inter-provincial gap has been decreasing. This suggests that China’s policy initiatives for IE have achieved some success, and the digital economy can effectively reduce regional disparities (Zhou et al., 2023), which is consistent with the findings of (Zhang et al., 2022). The spatial distribution of IE shows the trend of “decreasing from the east to the west”, and regional disparities are reduced over time, which is similar to the results of the study of (Wu et al., 2023). This is related to China’s long-standing policy bias, where all of China’s eastern coastal cities are developed cities, the western region is economically backward, and environmental and geographic factors are strong impediments to the development of the economy, so the regional distribution of most economic forms shows a decreasing trend from east to west. The results of this paper reveal the spatial evolution trend of IE, effectively proving the important role of the digital economy in narrowing regional gaps and promoting high-quality development.
Figures 5 and 6 show the spatial distribution of CE in China from 2011 to 2021. The comparison shows that the national distribution of China’s CE has changed from polarization (i.e., the gap between CE in the north and south regions was large in 2011) to a trend of concentration and diffusion (i.e., a smaller gap between CE in the north and south in 2021, with regional agglomeration). 2011, China’s industrial layout was that the north was dominated by heavy industry, the south was dominated by light industry and service industry, and the north’s carbon emissions were higher. In 2011, China’s industrial layout was dominated by heavy industries in the north and light industries and services in the south, with higher carbon emissions in the north. By 2021, after 10 years of industrial transformation and the application of decarbonization technologies, carbon emissions in the north will be lower, and thus the gap between the north and the south of CE will be gradually narrowed. The results of this study are similar to (Wang et al., 2014), but this paper reveals the trend and characteristics of CE, which is a reference value for understanding the current situation of CE in China’s provinces.
5.1.1.3 Spatial autocorrelation of IE and CE
Figure 7 plots the trend of the global Moran’s index of IE from 2011 to 2021. First, IE has strong spatial autocorrelation (i.e., places with strong IE tend to be positively clustered and vice versa), which is consistent with the findings of (Zhang et al., 2022). IE belongs to the new economic form, which has strong industrial agglomeration characteristics. Relevant industries will cluster to give full play to the scale advantage of the industry, such as the Internet industry cluster, which can make full use of the infrastructure advantage and knowledge spillover effect in the space. Second, the CE all have significant positive spatial correlations (except for 2013-2015), indicating that carbon emissions also have spatial agglomeration characteristics. Because energy consumption is closely related to industrial layout, high-carbon emission industries tend to cluster to give full play to the scale effect of the industry. This is similar to the findings of (Zhang et al., 2024). Finally, the spatial correlation of IE is much higher than that of CE, indicating that economic effects are more likely to form spatial agglomeration than environmental effects, which is because economic activities are more affected by distance, while environmental pollution is more likely to spread. This study reveals the important role of economic effects in regional agglomeration theory and also proves that environmental pollution can form regional agglomeration in the diffusion to surrounding areas, enriching relevant theoretical research.
Figures 8, 9 shows the localized Moran’s index results for IE and CE in 2011 and 2021. It can be seen that from 2011 to 2021, the IE of the 30 provinces is mainly concentrated in the first and third quadrants. This is because regions with higher IE levels will have a diffusion effect on their neighbors, promoting IE in the surrounding provinces and forming ‘high - high agglomeration’, while places with lower IE levels are not led by the leading provinces and it is difficult for them to leap forward in the hierarchy, thus forming ‘low - low agglomeration’. The ‘low-low agglomeration’ is formed. This is consistent with the findings of (Zhang et al., 2022). However, this study finds that this two-way agglomeration may lead to the widening of the East-West regional gap and exacerbate the Matthew effect, and it is expected that ‘low-low agglomeration’ can be reduced through effective policy instruments. The Moran scatterplot of CE for 30 provinces in China in 2011 is mainly concentrated in the second and third quadrants, and there are more in the third quadrant. This suggests that ‘mixed agglomeration’ and ‘low-low agglomeration’ co-existed in 2011, and the agglomeration is more obvious in places with lower carbon emissions. In 2021, the Moran scatterplot of China’s 30 provinces mainly concentrates in the third quadrant and most of them are southern cities, and the number of low-carbon emission areas increases and continues to be agglomerated. This is related to the implementation of low-carbon pilot policies (Feng et al., 2024). Unlike previous spatial agglomeration analyses of carbon emissions, the study in this paper can effectively demonstrate the impact of policy preferences on carbon emissions, for example, taking developed coastal cities (Zhejiang, Shanghai, Jiangsu, etc.) as the pilot areas for low-carbon policies can effectively reduce carbon emissions in the local area and neighboring regions.
5.1.2 In-depth discussion of the impact of IE on CE
5.1.2.1 Spatial modeling regression results
The results of the spatial effect test of IE on CE are shown in Table 6. Firstly, the spatial autoregressive coefficient is negative and significant. This indicates that the more concentrated the area with large carbon emissions is, the more favorable it is for centralized management, and the easier it is to reduce the intensity of carbon emissions. Second, IE has an obvious inhibitory effect on CE, and the inhibitory effect is stronger when considering the spatial spillover effect. It can be seen that IE can give full play to the clean production characteristics of the digital economy and green the real economy, which is similar to the findings of (Wu et al., 2023). The impacts of IE have spatial spillovers, i.e. the development of local IE can effectively reduce carbon emissions in neighboring areas. Unlike previous studies, this paper focuses on exploring the carbon reduction effect of IE from a spatial perspective, aiming to propose feasible regional policies. Finally, the control variables such as TI, RC, and GG have a significant reduction effect on CE when the spatial matrix is considered (the influence coefficients are -0.242, -0.081, and -0.016, respectively). This is an important finding of this paper that is different from other studies. Therefore, policymakers should fully consider the coordination and linkage among technological innovation, regional coordination, green development policies, and IE to help reduce carbon emissions.
5.1.2.2 Spatial Spillover Effect Decomposition
The decomposition results of the spatial spillover effects are shown in Table 7. From Table 7, it can be seen that the direct and spatial effects of IE on CE are both significant, and the indirect inhibition effect on CE is stronger than the direct effect. It shows that IE in this region and adjacent areas will reduce CE, and IE in adjacent areas has a stronger effect. The development of IE in this region will have a demonstration effect on IE in neighboring areas, prompting neighboring areas to vigorously promote IE, thereby reducing CE in neighboring areas. The results of the study can inform the formulation of regional development policies.
5.1.3 In-depth discussion of regional heterogeneity
Spatial econometric regression of the data for the eight integrated economic zones based on the selected time-fixed SDM model described above is shown in Table 9. Table 9 shows that, firstly, the IE of the three regions of the Northeast, the Southern Coastal Region, and the Southwest Comprehensive Economic Zone can significantly reduce CE (similar to the results of Shi and Sun, 2023), and the carbon emission reduction effect is stronger after considering the spatial spillover effect. This is because the Northeast Economic Zone is an old industrial base with a larger carbon emission base, and IE has a stronger carbon emission reduction effect in the region. The southern coastal economic zone has a more developed digital economy, which has a double carbon reduction effect. The Southwest Comprehensive Economic Zone has a stronger carbon sink capacity, which can promote the IE effect to a large extent. Secondly, the IE to CE enhancement effect is obvious in the Middle reaches of the Yangtze River Comprehensive Economic Zone and the Middle reaches of the Yellow River Comprehensive Economic Zone, which may be related to the fact that the current comprehensive economies of these two regions are dominated by high-carbon manufacturing and supplemented by digital intelligent manufacturing. It is worth noting that, considering the spatial effect, the enhancement effect of IE on CE is more obvious in the Middle Yellow River Comprehensive Economic Zone. Finally, the effect of IE on CE in the North Coastal Integrated Economic Zone is negative and insignificant, which may be due to the inconsistent development of the internal provinces. The IE of the East Coast Comprehensive Economic Zone has an increasing effect on CE, but the effect is not strong, and the effect is not significant when spatial spillover effects are considered. Considering the spatial effect, the IE of the Greater Northwest Comprehensive Economic Zone can significantly increase CE, which may be due to the imperfect construction of digital infrastructure in the Northwest. The results of the study prove that the effects of IE on CE impacts in China’s eight economic regions are different, and not all regions have a lowering effect of IE on CE. This reveals that we should formulate policies according to the characteristics of regional development to avoid the enhancing effect of IE on CE. In addition, different control variables have different effects in different regions, which also makes the eight economic zones IE have different effects on CE, and the result has important implications for the harmonization of different regional policies.
5.2 Policy implications
Based on these findings and discussion, this paper offers the following policy implications. These policy insights, combined with regional development characteristics and the findings of this paper, can provide a reference for policymakers to effectively reduce carbon emissions and achieve green and high-quality development.
(1) Continuously strengthening investment in digital infrastructure. Accelerating the construction of new digital infrastructure such as 5G, data centers, artificial intelligence, the Internet of Things and the industrial Internet in all provinces, especially in the western provinces, so as to build a firm foundation of integration for the development of an integrated economy and promote the interconnection of the digital economy and the real economy. The real economy will be transformed and upgraded through intelligent and collaborative new modes of production, and the divide in the development of the convergence economy will be reduced with the help of the digital economy dividend.
(2) Give full play to the spatial spillover effect of the integrated economy to reduce carbon emissions. First, the development advantages of the head provinces, such as Beijing, Shanghai, and Jiangsu, should be promoted to establish ‘demonstration zones’ for the integration and development of the digital economy and the real economy, so as to form a diffusion effect and drive the development of the surrounding regions with the center. Secondly, the central region should fully cooperate with the east, fully absorb the overflow from the east, and realize a new situation of regional green development. Finally, the disadvantaged western provinces should make full use of the role of the ‘One Belt and One Road’ and ‘Western Development’ strategies to reduce the spatial spillover effect of the disadvantaged regions and embark on the road of ecological protection and green development based on their resource endowments and environmental characteristics.
(3) ‘Tailor-made’ regional economic development policies. Differentiated macroeconomic control policies have been implemented by the actual situation of the economic zones, and different high-quality development policies have been focused on promoting integrated economic development and carbon emission reduction. On the one hand, encourage the construction of a digital economy in the Northeast, Southern Coastal, and Southwest Comprehensive Economic Zones, to promote industrial integration through the development of a digital economy and realize the effective reduction of carbon emissions. On the other hand, strengthen the development of industrial modernization in the middle reaches of the Yangtze River and the middle reaches of the Yellow River comprehensive economic zones, reduce the proportion of high-energy-consuming industries in the integration economy, and reduce carbon emissions within the economic zones. In addition, regional economic development strategies under the global framework are formulated to reduce the overall differences in the integrated economy.
5.3 Research limitations
Taking China as the research object, this study analyzes the spatial impact effect of the integration economy on carbon emissions using data from 30 provinces from 2011 to 2021. However, this study has certain limitations in terms of variable selection, data collection, and research object, which need to be improved and refined in subsequent studies. First, this study examined the spatial impact of the integration economy on carbon emissions at the national level, but it lacked the consideration of intermediate action mechanisms. Future studies should analyze in depth the intrinsic mechanisms through which the integration economy acts on carbon emissions. Second, due to the limitation of data availability, the relevant calculation results may not accurately represent the variables. Therefore, future research should start with data to enhance the accuracy and completeness of variable measurement. Finally, based on eight comprehensive economic zones, this study analyzed the regional heterogeneity of the impact of IE on CE based on provincial data but did not consider the city, county, and district levels. Subsequent studies could focus on specific regions such as the city and county levels.
6 Conclusions
This paper takes 30 inland provinces in China (Hong Kong Special Administrative Region, Macao Special Administrative Region, Taiwan, and Tibet Autonomous Region are excluded from the study due to data acquisition problems) as the research subjects. Based on the panel data from 2011 to 2021, this paper analyzes the spatial characteristics of the impact of the integrated economy on carbon emissions by using principal component analysis, coupled coordination degree model, Moran index, and spatial econometrics. The contributions of this article are reflected in the following aspects. Firstly, using reasonable methods and indicator systems to measure the integrated economy can fill the gap in the measurement of the integrated economy in the existing literature. Secondly, the innovative incorporation of integrated economy and carbon emissions into the same theoretical framework has deepened the theoretical research on low-carbon economy. Finally, analyze the current situation and inherent relationship between integrated economy and carbon emissions from a spatial perspective, and deepen relevant research in spatial economics. The main conclusions of the study are as follows.
(1) Characterizing the spatial and temporal evolution of the integrated economy and carbon emissions. Over the study period, the integrated economy showed a yearly increase while carbon emissions showed a yearly decrease. The spatial distribution of IE shows a trend of ‘decreasing from east to west’, with regional differences decreasing with the evolution of time. China’s CE shows a distribution of ‘low in the south and high in the north’, with low-carbon areas continuing to spread from south to north.
(2) Analyzing the spatial correlation between the integrated economy and carbon emissions. From the global perspective of China, both integrated economy and carbon emissions have significant positive spatial correlations. From the local perspective, an integrated economy is mainly characterized by ‘high-high agglomeration’ and ‘low-low agglomeration’, while carbon emissions are characterized by ‘low-low agglomeration’.
(3) Exploring the spatial impact effects of an integrated economy on carbon emissions. Using the time-fixed SDM model, it is found that the integrated economy has a significant negative effect on carbon emissions, and the negative effect is even stronger when spatial spillover effects are considered, and the result still holds under multiple robustness tests. This suggests that the integrated economy has a strong spatial effect and can effectively reduce carbon emissions in China.
(4) Discussing the spatial heterogeneity of the impact of the integrated economy on carbon emissions. The impact of an integrated economy on carbon emissions varies from one integrated economic zone to another. The integrated economy of the three regions of the Northeast, the Southern Coastal Region, and the Southwest Comprehensive Economic Zone can significantly reduce carbon emissions. The integrated economy to carbon emissions enhancement effect is obvious in the Middle reaches of the Yangtze River Comprehensive Economic Zone and the Middle reaches of the Yellow River Comprehensive Economic Zone. The effect of an integrated economy on carbon emissions in the North Coastal Integrated Economic Zone is negative and insignificant. The integrated economy of the East Coast Comprehensive Economic Zone has an increasing effect on carbon emissions, but the effect is not strong.
(5) Providing insights for policy development. First, investment in digital infrastructure should be continuously strengthened. Accelerate the construction of new digital infrastructure in all provinces, especially in the western provinces, and promote the interconnection of the digital economy with the real economy. Second, give full play to the spatial spillover effect of the integrated economy to reduce carbon emissions. Promote the development advantages of headline provinces such as Beijing, Shanghai, and Jiangsu, and establish “demonstration zones” for the integrated development of the digital economy and the real economy, so that the center can drive the development of the surrounding areas. Finally, ‘tailor-made’ regional economic development policies. Implement differentiated macro-control policies based on the actual situation of economic zones, and implement different high-quality development policies around promoting integrated economic development and carbon emission reduction.
Data availability statement
The original contributions presented in the study are included in the article/Supplementary Material. Further inquiries can be directed to the corresponding author.
Author contributions
YW: Funding acquisition, Methodology, Resources, Supervision, Writing – review & editing. QK: Conceptualization, Data curation, Methodology, Resources, Validation, Writing – original draft, Writing – review & editing. SL: Data curation, Methodology, Writing – review & editing, Funding acquisition.
Funding
The author(s) declare financial support was received for the research, authorship, and/or publication of this article. This work was supported by the National Natural Science Foundation of China Project Research on The Mechanism, Dynamic Evaluation and Implementation Path of Environmental Protection and Industrial Collaborative Development in the Yellow River Basin [grant numbers 72273103], Major Project of the Key Research Base of Humanities and Social Sciences of the Ministry of Education the Integration Path and Policy of Digital Economy and Real Economy in Western China [grant numbers 22JJD790063] and Shaanxi Province Philosophy and Social Science Research Special Youth Program Research on the Constraints and Promotion Mechanisms of the Integration and Development of the Digital Economy and the Real Economy in Shaanxi Province[grant numbers 2024QN341].
Acknowledgments
We thank the precious suggestions by reviewers and editors, which have greatly helped the improvement of the paper.
Conflict of interest
The authors declare that the research was conducted in the absence of any commercial or financial relationships that could be construed as a potential conflict of interest.
Publisher’s note
All claims expressed in this article are solely those of the authors and do not necessarily represent those of their affiliated organizations, or those of the publisher, the editors and the reviewers. Any product that may be evaluated in this article, or claim that may be made by its manufacturer, is not guaranteed or endorsed by the publisher.
Supplementary material
The Supplementary Material for this article can be found online at: https://www.frontiersin.org/articles/10.3389/fevo.2024.1374724/full#supplementary-material
References
Ahmadi M. H., Madvar M. D., Sadeghzadeh M., Rezaei M. H., Herrera M., Shamshirband S. (2019). Current status investigation and predicting carbon dioxide emission in latin american countries by connectionist models. Energies 12. doi: 10.3390/en12101916
Case A. C., Rosen H. S., Hines J. R. (1993). Budget spillovers and fiscal policy interdependence: Evidence from the states. J. Public Economics 52, 285–307. doi: 10.1016/0047-2727(93)90036-S
Chang H., Ding Q., Zhao W., Hou N., Liu W. (2023). The digital economy, industrial structure upgrading, and carbon emission intensity – empirical evidence from China’s provinces. Energy STRATEGY Rev. 50. doi: 10.1016/j.esr.2023.101218
Chen P. (2022). Is the digital economy driving clean energy development? -New evidence from 276 cities in China. J. Cleaner Production 372, 13378. doi: 10.1016/j.jclepro.2022.133783
Chen H., Yi J., Chen A., Peng D., Yang J. (2023). Green technology innovation and CO2 emission in China: Evidence from a spatial-temporal analysis and a nonlinear spatial durbin model. Energy Policy 172. doi: 10.1016/j.enpol.2022.113338
Cheng Z., Li L., Liu J., Zhang H. (2018). Total-factor carbon emission efficiency of China’s provincial industrial sector and its dynamic evolution. Renewable Sustain. Energy Rev. 94, 330–339. doi: 10.1016/j.rser.2018.06.015
Cheng Y., Zhou X., Li Y. (2023). The effect of digital transformation on real economy enterprises’ total factor productivity. Int. Rev. Economics Finance 85, 488–501. doi: 10.1016/j.iref.2023.02.007
Dai D., Li K., Zhao S., Zhou B. (2022). Research on prediction and realization path of carbon peak of construction industry based on EGM-BP model. Front. Energy Res. 10. doi: 10.3389/fenrg.2022.981097
Fatima S., Desouza K. C., Dawson G. S. (2020). National strategic artificial intelligence plans: A multi-dimensional analysis. Econ Anal. Policy 67, 178–194. doi: 10.1016/j.eap.2020.07.008
Feng Y., Li L., Chen H. (2023a). Carbon emission reduction effect of digital infrastructure: from the “Broadband China” Strategy. Ecol. Chem. Eng. S-Chema I Inzynieria Ekologicza S 30, 283–289. doi: 10.2478/eces-2023-0030
Feng Z., Song D., Xie W. (2023b). DigitalEconomy helps realizethe ‘DoubleCarbon’Goal : basic approaches,Internal mechanismsandActionStrategies. J. Beijing Normal University(Social Sciences) 01), 52–61.
Feng X., Zhao Y., Yan R. (2024). Does carbon emission trading policy has emission reduction effect?—An empirical study based on quasi-natural experiment method. J. Environ. Manage. 351, 119791. doi: 10.1016/j.jenvman.2023.119791
Gao P., Yue S., Chen H. (2021). Carbon emission efficiency of China’s industry sectors: From the perspective of embodied carbon emissions. J. Cleaner Prod. 283, 124655. doi: 10.1016/j.jclepro.2020.124655
Granados N., Gupta A. (2013). Transparency strategy: competing with information in a digital world. Mis Q. 37, 637–641. doi: 10.5555/2535658.2535676
Guan Y., Shan Y., Huang Q., Chen H., Wang D., Hubacek K. (2021). Assessment to China’s recent emission pattern shifts. Earth’s Future 9, e2021EF002241. doi: 10.1029/2021EF002241
He W., Zhang K., Kong Y., Yuan L., Peng Q., Mulugeta Degefu D., et al. (2023). Reduction pathways identification of agricultural water pollution in Hubei Province, China. Ecol. Indic. 153, 110464. doi: 10.1016/j.ecolind.2023.110464
Hong Y., Ren B. (2023). Connotation and approach of deep integration of the digital economy and the real economy. China Ind. Economics 02), 5–16. doi: 10.19581/j.cnki.ciejournal.2023.02.001
Jiang H., Chen Z., Liang Y., Zhao W., Liu D., Chen Z. (2023). The impact of industrial structure upgrading and digital economy integration on China’s urban carbon emissions. Front. Ecol. Evol. 11. doi: 10.3389/fevo.2023.1231855
Jiang S., Sun Y. (2020). An empirical study on the effect of digital economy on real economy. Sci. Res. Manage. 41, 32–39.
Klippert M., Marthaler F., Spadinger M., Albers A. (2020). Industrie 4.0 – An empirical and literature-based study how product development is influenced by the digital transformation. Proc. CIRP 91, 80–86. doi: 10.1016/j.procir.2020.02.152
Li J., Huang X., Yang H., Chuai X., Li Y., Qu J., et al. (2016). Situation and determinants of household carbon emissions in Northwest China. Habitat Int. 51, 178–187. doi: 10.1016/j.habitatint.2015.10.024
Li Z., Zhou Q. (2021). Research on the spatial effect and threshold effect of industrial structure upgrading on carbon emissions in China. J. Water Climate Change 12, 3886–3898. doi: 10.2166/wcc.2021.216
Liu Z., Liu H., Lang W., Fang S., Chu C., He F. (2022b). Scaling law reveals unbalanced urban development in China. Sustain. Cities AND Soc. 87. doi: 10.1016/j.scs.2022.104157
Liu Y., Tan H., Chen X., Yang C. (2022a). Research on the impact of the digital economy on the investment efficiency of the real economy. China Soft Sci. 10), 20–29.
Liu H., Wang L., Shen Y. (2023). Can digital technology reduce carbon emissions? Evidence from Chinese cities. Front. Ecol. Evol. 11. doi: 10.3389/fevo.2023.1205634
Liu Y., Zheng M., Shum W. Y. (2024). On the linkages between digital finance and real economy in China: A cointegration analysis. Innovation Green Dev. 3, 100109. doi: 10.1016/j.igd.2023.100109
Lopes de Sousa Jabbour A. B., Chiappetta Jabbour C. J., Choi T.-M., Latan H. (2022). ‘Better together’: Evidence on the joint adoption of circular economy and industry 4.0 technologies. Int. J. Production Economics 252, 108581. doi: 10.1016/j.ijpe.2022.108581
Meng Z., Wang H., Wang B. (2018). Empirical analysis of carbon emission accounting and influencing factors of energy consumption in China. Int. J. OF Environ. Res. Public Health 15 (11), 2467. doi: 10.3390/ijerph15112467
Peng J., Chen H., Jia L., Fu S., Tian J. (2023). Impact of digital industrialization on the energy industry supply chain: evidence from the natural gas industry in China. Energies 16 (4), 1564. doi: 10.3390/en16041564
Qi Y., Yang Y., Jin F. (2013). China’s economic development stage and its spatio-temporal evolution: A prefectural-level analysis. J. Geographical Sci. 23, 297–314. doi: 10.1007/s11442-013-1011-0
Shan Y., Guan D., Zheng H., Ou J., Li Y., Meng J., et al. (2018). China CO2 emission accounts 1997–2015. Sci. Data 5, 170201. doi: 10.1038/sdata.2017.201
Shan Y., Huang Q., Guan D., Hubacek K. (2020). China CO2 emission accounts 2016–2017. Sci. Data 7, 54. doi: 10.1038/s41597-020-0393-y
Shan Y., Liu J., Liu Z., Xu X., Shao S., Wang P., et al. (2016). New provincial CO2 emission inventories in China based on apparent energy consumption data and updated emission factors. Appl. Energy 184, 742–750. doi: 10.1016/j.apenergy.2016.03.073
Shao S., Li X., Cao J., Yang L. (2016). China’s economic policy choices for governing smog pollution-based on spatial spillover effects. Econ Res. J. 51, 73–88.
Shi D., Sun G. (2023). The influence of the integration of digital economy and real economy on green innovation. Reform 02), 1–13.
Sun G., Fang J., Li J., Wang X. (2024). Research on the impact of the integration of digital economy and real economy on enterprise green innovation. Technol Forecasting Soc. Change 200, 123097. doi: 10.1016/j.techfore.2023.123097
Takyi P. O., Dramani J. B., Akosah N. K., Aawaar G. (2023). Economic activities’ response to the COVID-19 pandemic in developing countries. Sci. Afr. 20, e01642–e01642. doi: 10.1016/j.sciaf.2023.e01642
Tang K., Yang G. (2023). Does digital infrastructure cut carbon emissions in Chinese cities? Sustain. Prod. Consumption 35, 431–443. doi: 10.1016/j.spc.2022.11.022
Tian G., Yu S., Wu Z., Xia Q. (2022). Study on the emission reduction effect and spatial difference of carbon emission trading policy in China. Energies 15, 1921. doi: 10.3390/en15051921
Tong X. (2020). The spatiotemporal evolution pattern and influential factor of regional carbon emission convergence in China. Adv. Meteorol 2020. doi: 10.1155/2020/4361570
Wang J., Cai B., Zhang L., Cao D., Liu L., Zhou Y., et al. (2014). High resolution carbon dioxide emission gridded data for China derived from point sources. Environ. Sci. Technol. 48, 7085–7093. doi: 10.1021/es405369r
Wang G., Feng Y. (2024). Analysis of carbon emission drivers and peak carbon forecasts for island economies. Ecol. Model. 489, 110611. doi: 10.1016/j.ecolmodel.2023.110611
Wang J., Wu H., Chen Y. (2020). Made in China 2025 and manufacturing strategy decisions with reverse QFD. Int. J. Production Economics 224, 107539. doi: 10.1016/j.ijpe.2019.107539
Wang H., Wu D. L., Zeng Y. M. (2023). Digital economy, market segmentation and carbon emission performance. Environ. Dev. Sustainbil. doi: 10.1007/s10668-023-03465-w
Wu R., Hua X., Peng L., Liao Y., Yuan Y. (2022). Nonlinear effect of digital economy on carbon emission intensity—Based on dynamic panel threshold model. Front. Environ. Sci. 10. doi: 10.3389/fenvs.2022.943177
Wu T., Peng Z., Yi Y., Chen J. (2023). The synergistic effect of digital economy and manufacturing structure upgrading on carbon emissions reduction: Evidence from China. Environ. Sci. pollut. Res. 30, 87981–87997. doi: 10.1007/s11356-023-28484-y
Xu J. (2023). Study on spatiotemporal distribution characteristics and driving factors of carbon emission in Anhui Province. Sci. Rep. 13 (1), 14400. doi: 10.1038/s41598-023-41507-5
Xu Q., Dong Y.-x., Yang R., Zhang H.-o., Wang C.-j., Du Z.-w. (2019). Temporal and spatial differences in carbon emissions in the Pearl River Delta based on multi-resolution emission inventory modeling. J. Cleaner Production 214, 615–622. doi: 10.1016/j.jclepro.2018.12.280
Xu B., Li E., Zheng H., Sang F., Shi P. (2017). The remanufacturing industry and its development strategy in China. Strategic Study CAE 19, 61–65.
Xu G., Lu T., Liu Y. (2021). Symmetric reciprocal symbiosis mode of China’s digital economy and real economy based on the logistic model. Symmetry-Basel 13 (7), 1136. doi: 10.3390/sym13071136
Xu A., Song M., Wu Y., Luo Y., Zhu Y., Qiu K. (2024). Effects of new urbanization on China’s carbon emissions: A quasi-natural experiment based on the improved PSM-DID model. Technol Forecasting Soc. Change 200, 123164. doi: 10.1016/j.techfore.2023.123164
Xu L. D., Xu E. L., Li L. (2018). Industry 4.0: state of the art and future trends. Int. J. Prod. Res. 56, 2941–2962. doi: 10.1080/00207543.2018.1444806
Yi Y., Cheng R., Wang H., Yi M., Huang Y. (2023). Industrial digitization and synergy between pollution and carbon emissions control: new empirical evidence from China. Environ. Sci. pollut. Res. 30, 36127–36142. doi: 10.1007/s11356-022-24540-1
Yuan L., Qi Y., He W., Wu X., Kong Y., Ramsey T. S., et al. (2024). A differential game of water pollution management in the trans-jurisdictional river basin. J. Cleaner Prod. 438, 140823. doi: 10.1016/j.jclepro.2024.140823
Zha Q., Liu Z., Wang J. (2023). Spatial pattern and driving factors of synergistic governance efficiency in pollution reduction and carbon reduction in Chinese cities. Ecol. Indic. 156. doi: 10.1016/j.ecolind.2023.111198
Zhang C., Fang J., Ge S., Sun G. (2024). Research on the impact of enterprise digital transformation on carbon emissions in the manufacturing industry. Int. Rev. Economics Finance 92, 211–227. doi: 10.1016/j.iref.2024.02.009
Zhang G., Wang T., Lou Y., Guan Z., Zheng H., Li Q., et al. (2022a). Research on China’s provincial carbon emission peak path based on a LSTM neural network approach. Chin. J. Manage. Sci. 11, 1–12. doi: 10.16381/j.cnki.issn1003-207x.2022.0097
Zhang L., Mu R., Zhan Y., Yu J., Liu L., Yu Y., et al. (2022b). Digital economy, energy efficiency, and carbon emissions: Evidence from provincial panel data in China. Sci. Total Environ. 852. doi: 10.1016/j.scitotenv.2022.158403
Zhang S., Wu Z., Lu Z., Zhang N. (2022c). Spatio-temporal evolution characteristics and driving factors of the integration between digital economy and real economy in China. Econ Geogr. 42, 22–32.
Zhao B., Sun L., Qin L. (2022). Optimization of China’s provincial carbon emission transfer structure under the dual constraints of economic development and emission reduction goals. Environ. Sci. pollut. Res. 29, 50335–50351. doi: 10.1007/s11356-022-19288-7
Zhao T., Zhang Z., Liang S. (2020). Digital economy, entrepreneurship, and high-quality economic development: empirical evidence from urban China. J. Manage. World 36, 65–76. doi: 10.19744/j.cnki.11-1235/f.2020.0154
Zhao X. G., Zhu J. (2022). Impacts of two-way foreign direct investment on carbon emissions: from the perspective of environmental regulation. Environ. Sci. pollut. Res. 29, 52705–52723. doi: 10.1007/s11356-022-19598-w
Keywords: integrated economy, carbon emissions, digital economy, real economy, spatial effect, China
Citation: Wang Y, Ke Q and Lei S (2024) The spatial effect of integrated economy on carbon emissions in the era of big data: a case study of China. Front. Ecol. Evol. 12:1374724. doi: 10.3389/fevo.2024.1374724
Received: 22 January 2024; Accepted: 11 April 2024;
Published: 24 April 2024.
Edited by:
Chuanbao Wu, Shandong University of Science and Technology, ChinaCopyright © 2024 Wang, Ke and Lei. This is an open-access article distributed under the terms of the Creative Commons Attribution License (CC BY). The use, distribution or reproduction in other forums is permitted, provided the original author(s) and the copyright owner(s) are credited and that the original publication in this journal is cited, in accordance with accepted academic practice. No use, distribution or reproduction is permitted which does not comply with these terms.
*Correspondence: Qian Ke, MzE5MjA0OTE0QHFxLmNvbQ==
†These authors have contributed equally to this work and share first authorship