 Mark Novak
 Daniel B. Stouffer
94% of researchers rate our articles as excellent or good
Learn more about the work of our research integrity team to safeguard the quality of each article we publish.
Find out more
CORRECTION article
Front. Ecol. Evol., 12 March 2024
Sec. Population, Community, and Ecosystem Dynamics
Volume 12 - 2024 | https://doi.org/10.3389/fevo.2024.1371112
A Corrigendum on
Geometric complexity and the information-theoretic comparison of functional-response models
by Novak M and Stouffer DB (2021) Front. Ecol. Evol. 9:740362. doi: 10.3389/fevo.2021.740362
Due to an error in our formulation of the citardauq solution to quadratic equations, our reformulation of the Steady State Saturation (SSS) model of Jeschke et al. (2002) to a more traditional Holling-type form was incorrect. The incorrect equation that we used in our analyses and gave in Table 1 was
The correct equation is
The latter equation is equivalent to the quadratic solution originally given by Jeschke et al. (2002) as
Correcting the error affects the SSS-specific panel of Figure 5, as well as Figures S4, S8, S12, and S16 of the Supplementary Material. To permit comparison between the correctly calculated geometric complexity of the SSS and that of the 18 other three-parameter models that we considered, we here include the corrected Figure 5 in its entirety. The Supplementary Material has been updated in the original article. All the panels in these figures that pertain to models other than the SSS remain unchanged.
Using the correct equation for the SSS does not change our primary inference that the SSS is less flexible (i.e., has lower geometric complexity) than the baseline Holling-Real Type III (H3R) model and most other prey-dependent three-parameter models. However, the corrected SSS model has similar (rather than much lower, as previously stated) flexibility compared to the other least-flexible Abrams II (A2) model. Furthermore, the correction makes the effects of different experimental designs on the flexibility of the SSS more consistent with the effects seen for the other prey-dependent models: for both a golden-ratio (Figure 5) and an arithmetic spacing (Figure S8) of prey and predator abundances, (i) increasing maximum prey abundance causes the difference between and to decrease (rather than increase, as previously stated), with (ii) variation in maximum predator abundance having a weak effect on their difference (rather than a large effect, as previously stated). Further, (iii) variation in the number of prey levels has a larger effect on the difference between and than does variation in the number of predator levels (Figure S4) (rather than a smaller effect, as previously stated). The correction does not change the conclusion that decreasing the minimum (Figure S12) or increasing the maximum (Figure S16) expected number of eaten prey (by an order of magnitude) has little to no effect on the inferences of our primary analysis.
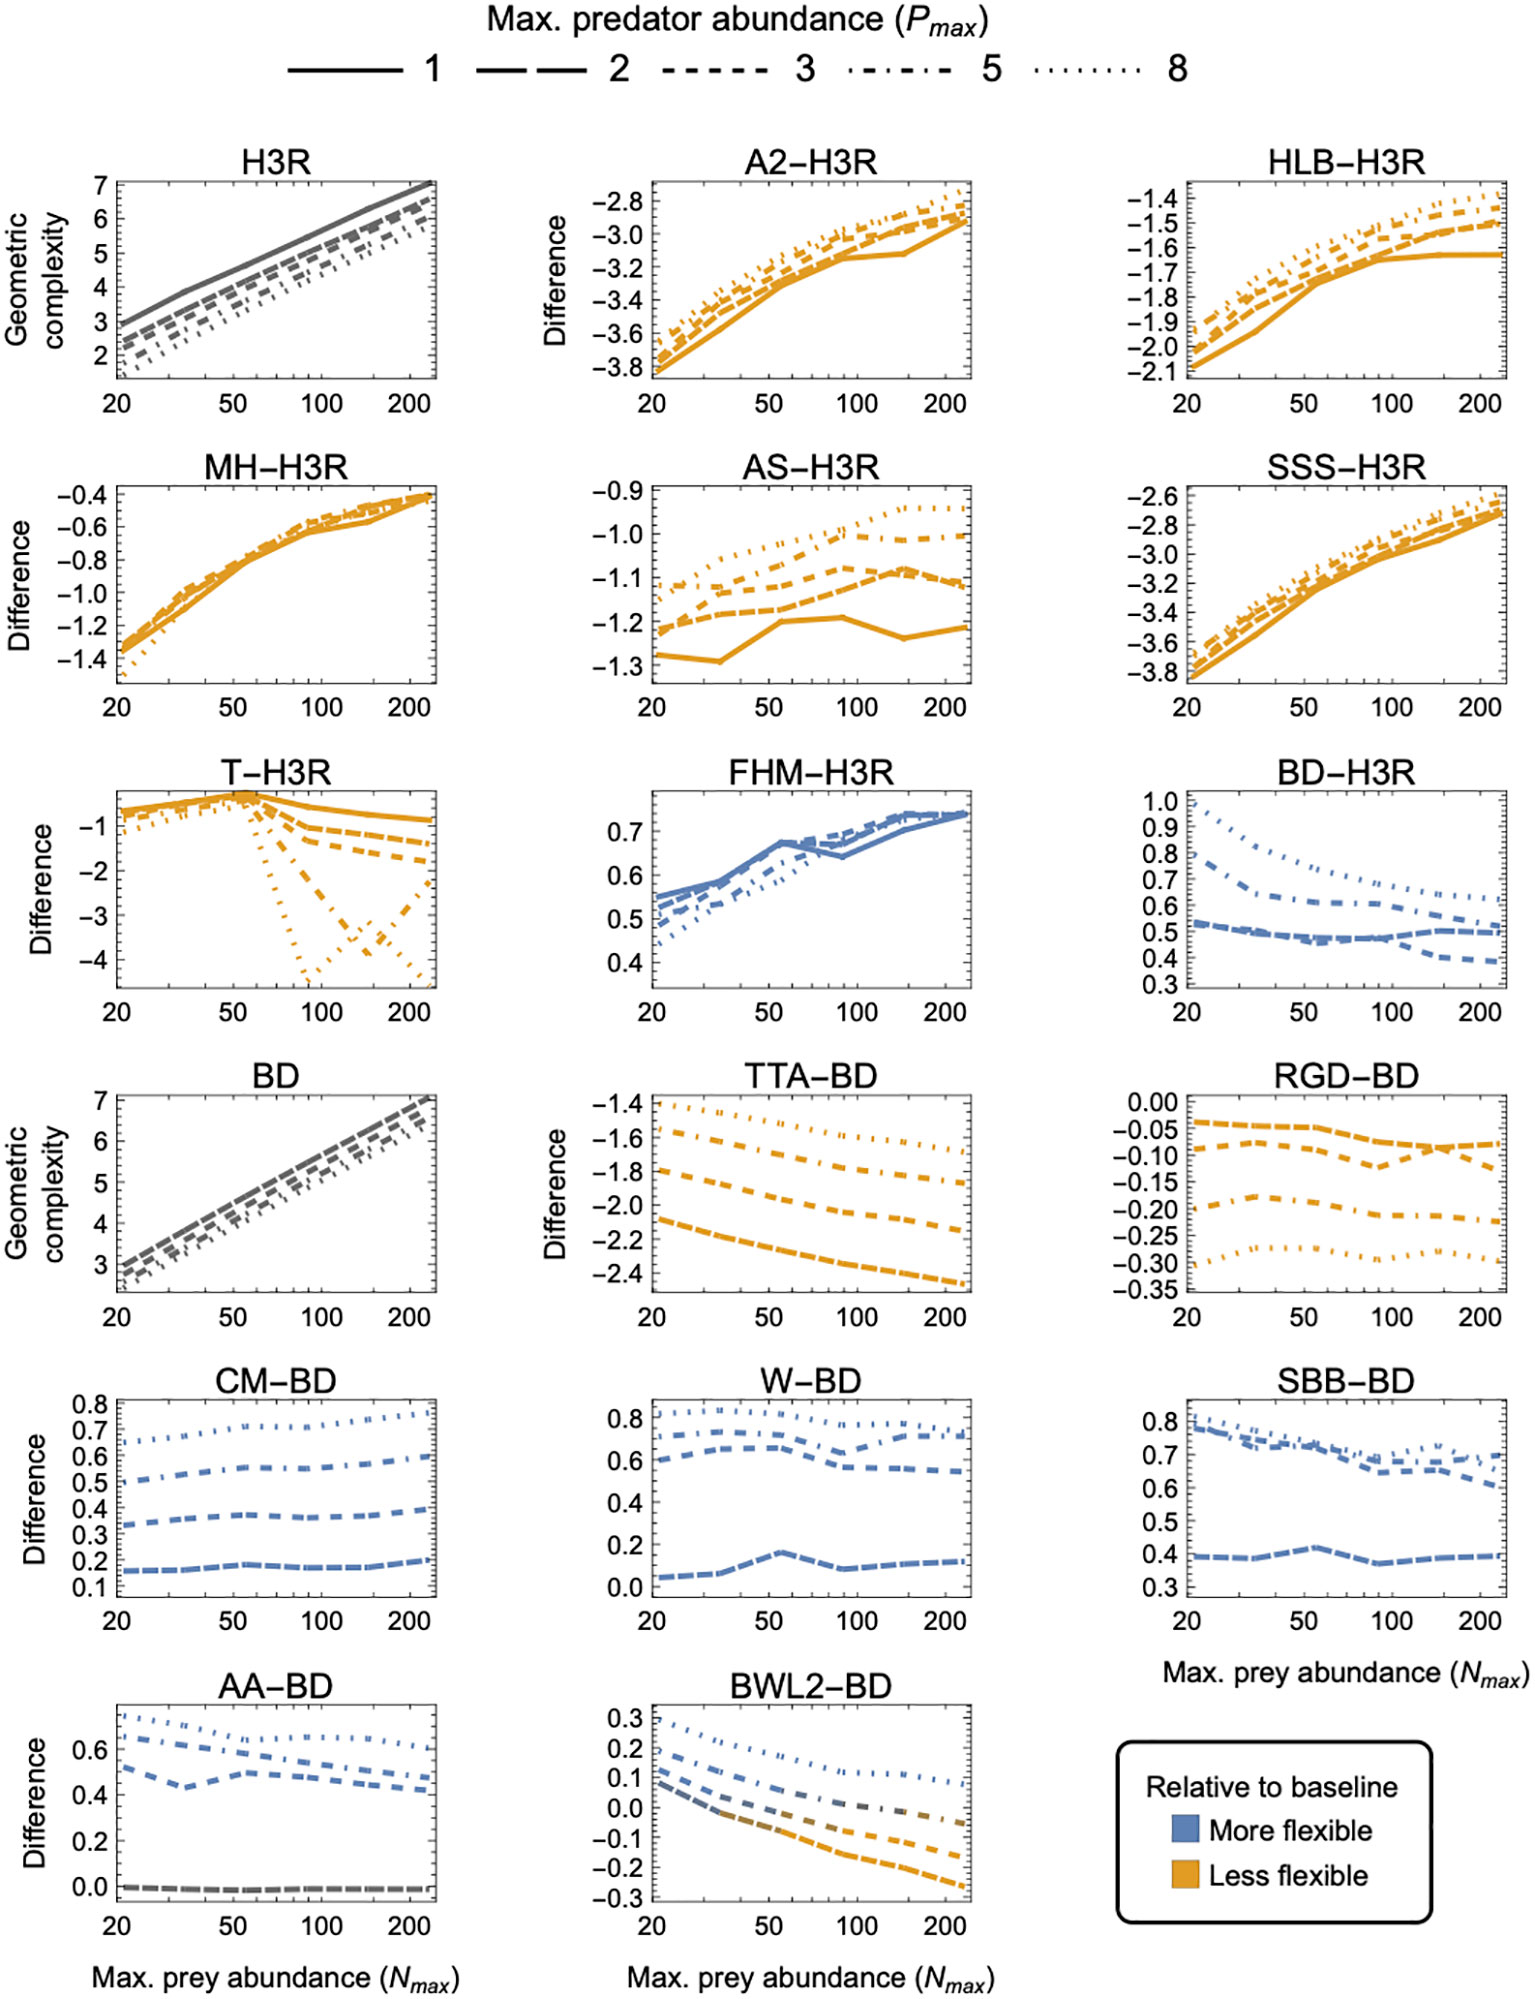
Figure 5 As in Figure 3 but for three-parameter (k = 3) functional-response models. First and tenth panels: The geometric complexity of the baseline Holling–Real Type III (H3R) and Beddington–DeAngelis (BD) models as a function of the experiment’s maximum prey and predator abundances ( and ). Other panels: The difference in of the other three-parameter prey-dependent (top two rows) and ratio- and predator-dependent (bottom two rows) models relative to the baseline models. As a visual aid, models with greater geometric complexity than H2 are colored in blue while those with less geometric complexity than H2 are colored in orange.
In Section 3.4, paragraph 2 originally read:
For the ratio- and predator-dependent models, differences to BD were more sensitive to variation in Pmax than to variation in Nmax. The degree to which CM, W, SBB, and AA were more flexible than BD increased with increasing Pmax, reaching a difference in geometric complexity of 0.8 information units at Pmax = 8. For these models, the most equitable design therefore entailed small Pmax regardless of Nmax, but for TTA and RGD, for which the difference to BD decreased with increasing Pmax, it was designs entailing large Pmax which reduced their lower geometric complexity the least (by no less than 1.4 and up to 2.9 information units). The degree to which the prey-dependent AS, SSS and T models were less flexible than H3R was also more sensitive to variation in Pmax than in Nmax, but the degree to which A2, HLB, and MH were less flexible and the degree to which FHM was more flexible was relatively insensitive to variation in Pmax. As Nmax increased, SSS and T became less flexible than H3R, A2, HLB, MH, and AS became less inflexible relative to H3R, and FHM became more flexible than H3R. For BWL2, which could either be more or less flexible than H3R depending on design, the most equitable designs spanned those that had the largest considered Nmax when Pmax was large to those that had the smallest considered Nmax when Pmax was small. Overall, SSS and RGD exhibited the greatest potential disparity relative to their H3R and BD baselines, respectively differing in their geometric complexity by about 13 and almost 2.9 information units for the least equitable designs. The greatest potential disparity among all other considered three-parameter models was about 11 information units and occurred between SSS and CM for large Nmax, large Pmax designs in favor of CM.
This has been updated to read:
For the ratio- and predator-dependent models, differences to BD were more sensitive to variation in Pmax than to variation in Nmax. The degree to which CM, W, SBB, and AA were more flexible than BD increased with increasing Pmax, reaching a difference in geometric complexity of 0.8 information units at Pmax = 8. For these models, the most equitable design therefore entailed small Pmax regardless of Nmax, but for TTA and RGD, for which the difference to BD decreased with increasing Pmax, it was designs entailing large Pmax which reduced their lower geometric complexity the least (by no less than 1.4 and up to 2.9 information units). The degree to which the prey-dependent AS and T models were less flexible than H3R was also more sensitive to variation in Pmax than in Nmax, but the degree to which A2, HLB, MH, and SSS were less flexible and the degree to which FHM was more flexible was relatively insensitive to variation in Pmax. As Nmax increased, T became less flexible than H3R, A2, HLB, MH, AS, and SSS became less inflexible relative to H3R, and FHM became more flexible than H3R. For BWL2, which could either be more or less flexible than BD depending on design, the most equitable designs spanned those that had the largest considered Nmax when Pmax was large to those that had the smallest considered Nmax when Pmax was small. Overall, A2, SSS and TTA exhibited the greatest potential disparity relative to their H3R and BD baselines, respectively differing in their geometric complexity up to almost 3.8 information units for the least equitable designs. The greatest potential disparity among all other considered three-parameter models was about 4.6 information units and occurred between A2, SSS and CM for small Nmax designs in favor of CM.
Ironically, our error emphasizes the main message of our article that (functional-response) models of equivalent parametric complexity (i.e., having the same number of free parameters, just like the first two equations of this corrigendum) can differ in their geometric complexity (i.e., their flexibility) and thereby in their ability to fit data.
The authors apologise for these errors and state that they do not change the scientific conclusions of the article in any way. The original article has been updated.
All claims expressed in this article are solely those of the authors and do not necessarily represent those of their affiliated organizations, or those of the publisher, the editors and the reviewers. Any product that may be evaluated in this article, or claim that may be made by its manufacturer, is not guaranteed or endorsed by the publisher.
Keywords: consumer-resource interactions, model comparison, structural complexity, model flexibility, nonlinearity, experimental design, fisher information, prediction
Citation: Novak M and Stouffer DB (2024) Corrigendum: Geometric complexity and the information-theoretic comparison of functional-response models. Front. Ecol. Evol. 12:1371112. doi: 10.3389/fevo.2024.1371112
Received: 15 January 2024; Accepted: 09 February 2024;
Published: 12 March 2024.
Edited and Reviewed by:
Thomas John Hossie, Trent University, CanadaCopyright © 2024 Novak and Stouffer. This is an open-access article distributed under the terms of the Creative Commons Attribution License (CC BY). The use, distribution or reproduction in other forums is permitted, provided the original author(s) and the copyright owner(s) are credited and that the original publication in this journal is cited, in accordance with accepted academic practice. No use, distribution or reproduction is permitted which does not comply with these terms.
*Correspondence: Mark Novak, bWFyay5ub3Zha0BvcmVnb25zdGF0ZS5lZHU=
†These authors have contributed equally to this work
Disclaimer: All claims expressed in this article are solely those of the authors and do not necessarily represent those of their affiliated organizations, or those of the publisher, the editors and the reviewers. Any product that may be evaluated in this article or claim that may be made by its manufacturer is not guaranteed or endorsed by the publisher.
Research integrity at Frontiers
Learn more about the work of our research integrity team to safeguard the quality of each article we publish.