 Andrea Redoglio
 Erik Sperfeld
94% of researchers rate our articles as excellent or good
Learn more about the work of our research integrity team to safeguard the quality of each article we publish.
Find out more
ORIGINAL RESEARCH article
Front. Ecol. Evol., 25 April 2024
Sec. Population, Community, and Ecosystem Dynamics
Volume 12 - 2024 | https://doi.org/10.3389/fevo.2024.1368445
The growth of autotroph communities is frequently (co-)limited by essential nutrients such as nitrogen (N) and phosphorus (P). Several mechanisms have been proposed to explain the observed co-limitation patterns at different levels of biological organization, especially at the biochemical level for individual species. When considering communities, the presence of different species and functional groups with contrasting physiologies and nutrient requirements leads to a more difficult understanding of the mechanisms involved in nutrient (co-)limitation. To investigate what drives co-limitation patterns and possible underlying mechanisms based on biomass responses in autotroph communities, we grew phytoplankton communities differing in species composition in experimental microcosms on three N:P ratios to impose different limiting conditions. Afterwards, N, P, both, or none were factorially supplied to the communities to test which nutrients were limiting growth. We measured the biovolume of single species in the communities to assess how they responded to nutrient additions and compared it to the response of the overall community biovolume. The types of nutrient (co-)limitation identified, i.e. the factorial limitation scenarios for community biomass were single N limitation or simultaneous co-limitation by N and P, and were strongly driven by the dominant species. The phytoplankton species in the communities responded differently to the nutrient addition treatments, i.e. they showed contrasting limitation outcomes and therefore likely different nutrient requirements. Our experiment indicates that phylogenetically distantly-related phytoplankton species grown in a community can have different resource use efficiencies and thus can be limited by different nutrients. We suggest that the dominance of species or groups with similar traits in nutrient requirements and acquisition is one of the leading mechanisms that determines the biomass pattern of nutrient (co-)limitation observed at the community level. This work also highlights the potential of predicting community growth limitation outcomes based on knowledge of nutrient use efficiencies of one or few dominant species, which can be a suitable tool for lake restoration and oligotrophication efforts.
Autotrophs require macro-elements such as nitrogen (N), phosphorus (P), potassium (K), and trace elements such as iron (Fe), cobalt (Co), and molybdenum (Mo), among others (Lampert and Sommer, 2007; Kaspari and Powers, 2016). These essential elements provide structural, electrochemical, and catalytic functions, but on Earth they are not particularly abundant in soluble forms that can be taken up by most primary producers (Sterner and Elser, 2002). N and P, necessary for protein synthesis, building nucleic acids, and energy transfer, are the primary limiting nutrients in most aquatic (Conley et al., 2009) and terrestrial (Du et al., 2020) ecosystems. In a global meta-analysis, Elser et al. (2007) compiled a dataset of growth experiments in which N, P, and N&P combined were factorially supplied to primary producers. The outcomes of the so called ‘factorial limitation scenarios’ showed that both N and P limitation of primary producer growth is strong and widespread across ecosystems and that combined N&P enrichment leads to a positive synergistic growth response compared to single N and P addition (Elser et al., 2007). Expanding on this previous study, Harpole et al. (2011) found not only a synergistic effect of N and P addition on autotroph growth, but also identified different types of factorial limitation scenarios that varied in magnitude depending on whether primary producer communities were limited by a single nutrient or co-limited. More recent studies highlighted the prevalence of co-limitation by N&P and other elements in different systems (Ma et al., 2019; Klupar et al., 2021; Browning and Moore, 2023).
The observation that autotrophs are frequently co-limited by more than one nutrient supports the Multiple Limitation Hypothesis (Gleeson and Tilman, 1992), which was developed in contrast to Liebig’s Law of the Minimum (Von Liebig, 1840). Von Liebig formulated the law to describe the limitation of crop yields by essential nutrients, but it has been generally used to explain how autotroph growth is limited in different systems (Paris, 1992). The law postulates that only a single nutrient is limiting at a time, depending on the availability of that nutrient and its demand by the organism (de Baar, 1994). On the other hand, the Multiple Limitation Hypothesis states that more than one nutrient can simultaneously limit growth (Gleeson and Tilman, 1992). These two concepts differ in their assumption of the type of the essential resource or nutrient (Tilman, 1982; Saito et al., 2008; Sperfeld et al., 2012). Liebig’s law assumes nutrients to be strictly essential, so that the limiting nutrient can change continually and even abruptly, but only one is limiting at a given time. Contrarily, the Multiple Limitation Hypothesis assumes interactively essential nutrients; thus, all nutrients are co-limiting simultaneously, but at different magnitudes depending on supply and demand. Sperfeld et al. (2016) integrated Liebig’s Law of the Minimum and the Multiple Limitation Hypothesis into a general (co-)limitation framework, which also comprises two approaches frequently used to study nutrient (co-)limitation, i) factorial limitation scenarios (Craine, 2009; Allgeier et al., 2011; Harpole et al., 2011) and ii) ‘response surfaces’ across a multi-dimensional, continuous nutrient space based on specific nutrient categories (Tilman, 1982; Saito et al., 2008; Sperfeld et al., 2012).
This theoretical (co-)limitation framework links the two approaches in that several factorial (co-)limitation scenarios emerge within a two-dimensional continuous supply space of two nutrients, depending on the initial concentration and ratio, and on the response surface type of the co-limiting nutrients (Sperfeld et al., 2016; Halvorson et al., 2017; Redoglio et al., 2022). The response surfaces in this framework were developed combining Tilman (1980, 1982) graphical approach of using growth isoclines for describing different resource categories and Saito et al. (2008) definitions of (co-)limitation types using simple mathematical equations. Depending on the location of a hypothetical basal nutrient supply point (i.e. a control, Ctrl) within the continuous nutrient space, factorial nutrient additions (i.e. N, P and N&P supply) lead to growth responses that result in different types of factorial limitation scenarios (see Figure 1; Supplementary Material). Among scenarios classified as true co-limitation, simultaneous co-limitation arises when only the combined addition of two nutrients causes a positive response, while independent co-limitation results from a positive response to the addition of either nutrient alone or in combination (Harpole et al., 2011; Sperfeld et al., 2016; Figure 1). In these cases, the addition of both nutrients produces an additive or synergistic response compared to the single nutrient addition. On the other hand, single limitation occurs when only the supplement of one nutrient and the addition of both nutrients produces the same positive response, while serial limitation arises if the response to the addition of both nutrients is higher than when a single nutrient is supplied (Figure 1). In these scenarios, not only the addition of both nutrients leads to a positive response, but also the supply of one of the two nutrients alone can cause a response comparable to that from the addition of both nutrients. Some of these factorial limitation scenarios can emerge across different response surfaces types and others are specific to a response surface type, also depending on where the basal nutrient supply point before factorial additions is situated within the nutrient space (Sperfeld et al., 2016).
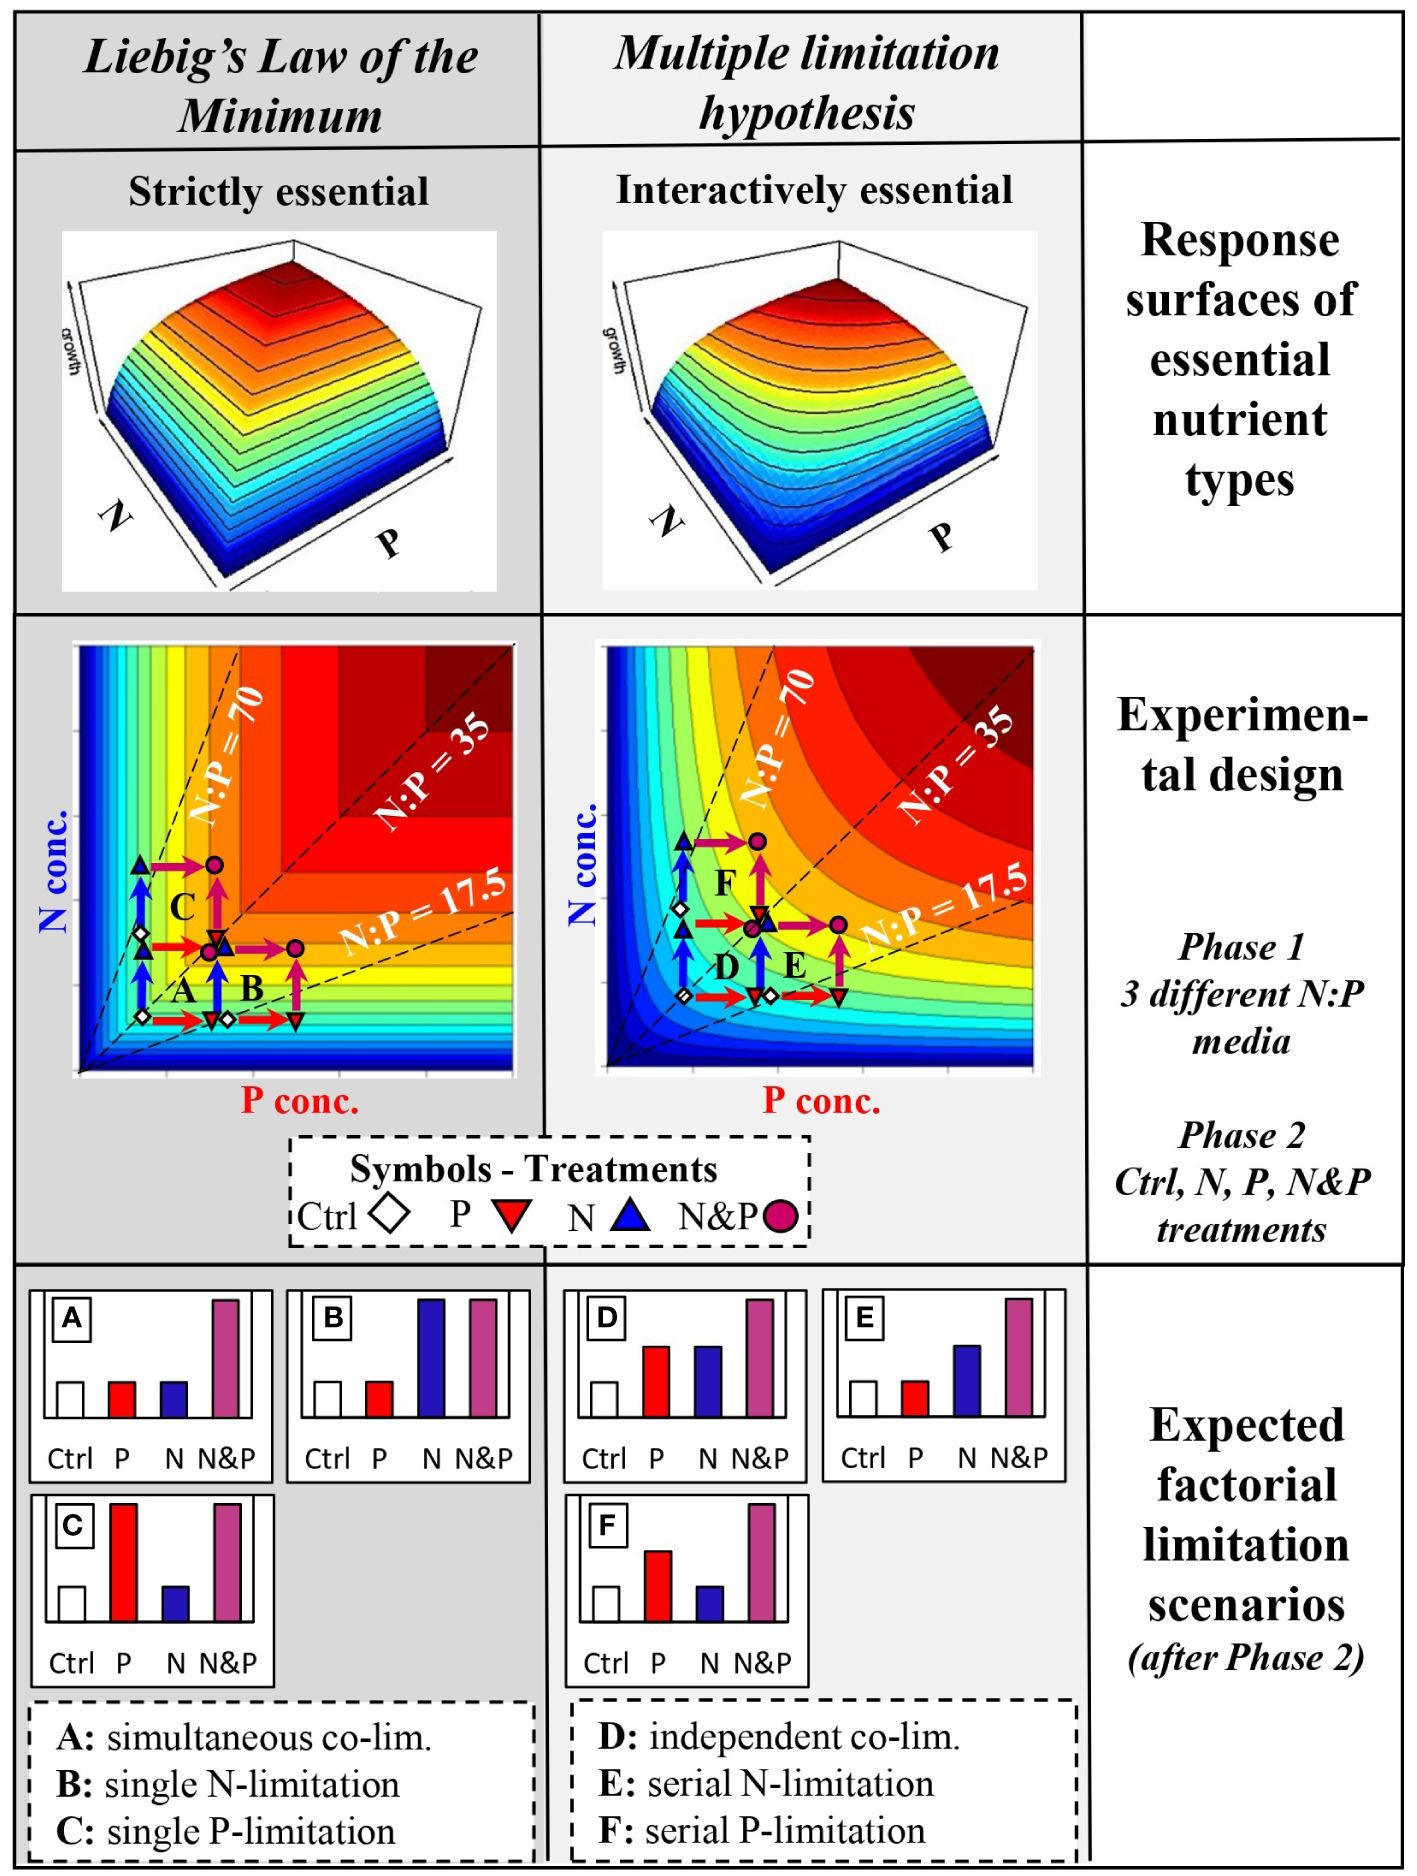
Figure 1 Conceptual and experimental design with expected outcomes (for more details, see Supplementary Material). The first row shows growth response surfaces in a two-dimensional nutrient space of N and P depending on whether the nutrients are considered strictly or interactively essential resources according to Tilman (1982) and Sperfeld et al. (2016). Additionally, the response surface types are separated in order to comply with the theoretical concepts of Liebig’s Law of the Minimum (first column, dark grey background) or the Multiple Limitation Hypothesis (second column, light grey background). The second row presents the experimental design with response surfaces across a gradient of N and P concentrations. The dashed lines indicate the initial medium N:P during phase 1, while symbols are the factorial nutrient additions at the beginning of phase 2. Treatment color-coded arrows show the expected growth response when the nutrient is supplied. The third row shows the expected community responses as factorial limitation scenarios at the end of phase 2 depending on medium N:P of phase 1, nutrient supply treatment of phase 2, and the underlying response surface type. Limitation scenarios (A–F) are described in the text.
The use of factorial growth assays and the resulting limitation scenarios is advantageous to address nutrient (co-)limitation not only because it can be reconciled with the theoretical background through response surfaces (Sperfeld et al., 2016), but also because it allows to directly test with nutrient addition experiments which nutrient alone or combination elicits a response, i.e. is limiting growth. The direct response to nutrient addition often measured in autotrophs at limiting conditions is biomass increase (Elser et al., 2007; Harpole et al., 2011; Browning and Moore, 2023). Nutrient limitation can also be indirectly estimated by measuring the nutrient concentration in the environment to infer what is limiting depending on scarcity, even though this approach cannot ‘prove’ what is limiting growth at a given time and nutrient concentration in the environment is usually also far from constant (Beardall et al., 2001). Autotroph elemental composition (e.g. cellular nutrient quotas or tissue concentrations) on the other hand can also point to the nutrients limiting growth and relates to the physiology of organisms (Marleau et al., 2015; Wirtz and Kerimoglu, 2016), but often the stoichiometric composition itself is influenced by other co-limiting nutrients (Bracken et al., 2015), making the direct identification of the (co-)limiting nutrients challenging.
Several mechanisms explaining the observed co-limitation patterns have been proposed at different levels of biological organization, but are still not well understood. At the biochemical level, for example, nutrients can substitute for the same function in a molecule (e.g. two elements equally substitutable within the same enzyme, such as zinc and cobalt in carbonic anhydrase; Sunda and Huntsman, 1995). The limitation of one nutrient can also lead to the inability to acquire another nutrient, and both nutrients must be simultaneously available to perform the biochemical function (Saito et al., 2008; Moore et al., 2013). At the cellular and organism level, nutrients can be in such a low concentration for uptake that both need to be added to observe a growth response (Arrigo, 2005; Sperfeld et al., 2016). In addition, the mechanisms described at the biochemical level can be extended to cells and organisms, considering that several elements might limit distinct biochemical pathways and that the mechanisms involved might differ for each process (Harpole et al., 2011).
At the community level, the presence of species and functional groups with contrasting physiologies and traits adds complexity (Reynolds et al., 2002; Litchman et al., 2007; Falkenberg et al., 2013), making our understanding of the mechanisms of nutrient (co-)limitation more difficult. Several studies have proposed mechanisms to explain the observed patterns of nutrient (co-)limitation of primary producer communities. Harpole et al. (2011) suggested that in the case of a community consisting of functionally equivalent species co-limited by the same nutrients, the mechanisms defined at the biochemical and organismal level should also apply. In this niche overlap setting, (co-)limitation at the community level reflects the patterns of single species or organisms and thus mechanisms at the biochemical level can be extended to communities. On the other hand, species may occupy separate niches within the community or vary in their nutrient requirements and thus can be each limited by different nutrients simultaneously (Arrigo, 2005). Marleau et al. (2015) also showed in a model study that differences in movement rates of nutrients can explain nutrient (co-)limitation patterns of autotrophs at the ecosystem level. Studies investigating the mechanisms of (co-)limitation at the community level are very scarce. Danger et al. (2008), using bacterial communities as a model, suggested that Liebig’s Law of the Minimum is not applicable at the community level and that communities as a whole are co-limited by nutrients due to competition and coexistence processes that optimize resource use. A model on terrestrial plants predicted responses to N and P limitation that resemble the theoretical response surfaces of both Liebig’s Law of the Minimum and the Multiple Limitation Hypothesis (Ågren et al., 2012). Kaspari and Powers (2016) also proposed to retire Liebig’s Law of the Minimum and to consider the interaction between elements that leads to co-limitation. Bannon et al. (2022) recently introduced the concept of Community Interaction Co-limitation, that is a limitation of interacting groups within the community by different nutrients that results in an inadequate production of a biologically produced nutrient. They also highlighted how this is likely to be impacted by community composition, because of the close interactions among different microbial groups. Despite extensive data on the frequency of (co-)limitation by N and P in primary producers across terrestrial and aquatic ecosystems (Elser et al., 2007; Allgeier et al., 2011; Harpole et al., 2011; Bratt et al., 2020), we still lack knowledge on the underlying mechanisms that result in the observed (co-)limitation scenarios in autotroph community biomass.
Using experimental microcosms with phytoplankton communities as a model system, we explored what leads to the frequently observed patterns of N and P (co-)limitation in autotroph communities. We assess the type of (co-)limitation at the community level as the response of overall community biomass to factorial nutrient additions after an initial growing phase at certain nutrient conditions. The communities were pre-grown at different N:P supply ratios and subsequently supplied factorially with N and P to assess the factorial limitation scenarios. Depending on the changes in species composition and growth patterns before and after nutrient additions in the different communities, we explored possible mechanisms based on biomass responses of individual species leading to nutrient (co-)limitation patterns at the community level (cf. Supplementary Figure S1). Similar to Ågren et al. (2012), we hypothesize the emergence of single or serial limitation scenarios after factorial N and P additions at imbalanced N:P ratios (Figure 1). At more balanced N:P ratios, true co-limitation patterns (i.e. simultaneous and/or independent co-limitation) will likely arise after nutrient additions (Figure 1). We further hypothesize that the community limitation pattern is driven by the dominant species, favored by the addition of the nutrient in shortest supply, if a community is limited by a single nutrient (Supplementary Figure S1B). For N&P co-limitation scenarios, we hypothesize that either the dominant species drives the pattern in overall community biomass (Supplementary Figure S1C) or sub-dominant species contribute to the observed community biomass patterns if the dominant species does not respond to nutrient additions (Supplementary Figure S1A). Finally, we propose that Liebig’s Law of the Minimum can be still applied to the community level, even though each species in the community is limited or co-limited by different nutrients depending on resource use efficiency.
Stocks of phytoplankton strains were grown in axenic batch monocultures on full COMBO medium (50 µM P L-1, 1000 µM N L-1, molar N:P = 20) with vitamins. The medium allows phytoplankton culturing and modification of nutrient concentrations (Kilham et al., 1998). The cultures were kept in a walk-in climate chamber at 20°C on low light levels with a 16:8 h light:dark cycle. Every three weeks, after stock monocultures reached the stationary growth phase, small aliquots of the phytoplankton strains were transferred to new flasks containing full COMBO medium under sterile conditions to keep the cultures ongoing.
For the experiment, we composed three freshwater phytoplankton communities, each consisting of a subset from seven stock phytoplankton species, belonging to different major taxonomic groups of relevance in freshwater systems (Table 1). The experiment comprised two phases. In the first phase, the communities were cultured on COMBO media of three different N:P ratios in batch cultures until reaching or approaching the stationary growth phase. Then, on day 21, phase 2 started with the factorial addition of N, P or both nutrients to the communities, and cultures were monitored again until stationary growth. At the end of phase 1, stationary growth indicates when phytoplankton communities have used up N, P, or both nutrients (depending on N:P supply ratio) to limiting levels in the medium. At the end of phase 2, factorial addition of nutrients alone or in combination should reveal which nutrient is limiting the communities by observation of further growth responses compared to a treatment without nutrient addition.
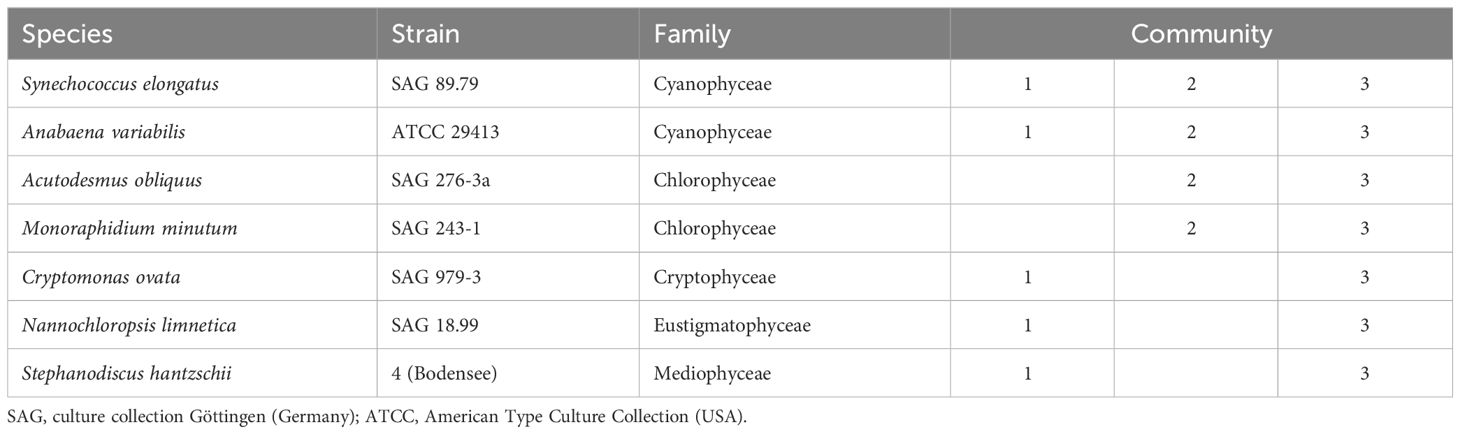
Table 1 Species used to assemble the phytoplankton communities differing in composition.
For phase 1, we prepared three modified COMBO media of different N:P ratios designed to stimulate limitation by N, P or both nutrients. The medium low in N (5.17 µM P L-1, 90.41 µM N L-1, molar N:P = 17.5) and the medium low in P (2.58 µM P L-1, 180.82 µM N L-1, molar N:P = 70) should be rather N- and P-limiting, respectively, while the medium with low N and P concentrations (2.58 µM P L-1, 90.41 µM N L-1, molar N:P = 35) may be more balanced and thus co-limiting. An experiment with a similar setup, but designed around the Redfield ratio (N:P = 16, Redfield, 1958) for the medium low in N&P, showed primarily N limitation of phytoplankton (Redoglio et al., 2022). Furthermore, is has been reported that optimal nutrient ratios for phytoplankton communities are often higher than N:P = 16 and sometimes as high as N:P = 50 (Hillebrand et al., 2013; Frank et al., 2020). This indicated a molar ratio for optimal growth higher than the Redfield ratio for similarly composed phytoplankton communities. Based on this information and preliminary experiments, we chose a molar N:P = 35 as our more balanced ratio for the medium low in N&P (Figure 1). We added potassium chloride (KCl) to the media low in P and N&P to avoid potential potassium (K) limitation (Kilham et al., 1998). 250 mL of the three COMBO media were distributed into 108 300-mL Erlenmeyer flasks (36 flasks per medium = 108 flasks).
Prior to composing the phytoplankton communities, each stock phytoplankton monoculture grown to stationary phase was gently centrifuged (Heraeus Biofuge Primo R, Thermo Scientific). We removed the supernatant (full COMBO medium) and resuspended the pellet (phytoplankton biomass) in N&P reduced COMBO medium to remove potential residual nutrients from the full medium. For each community, the respective resuspended monocultures were mixed with equal relative biomass to obtain the three starting communities. Community 1 was composed with cyanobacteria, C. ovata, N. limnetica and S. hantzschii. Community 2 consisted of green algae and cyanobacteria, while community 3 included all the phytoplankton species (Table 1). We started the three communities with different sets of species to allow for differences in community processes and species interactions, such as competition for resources and competitive exclusion. Afterwards, either one of the three communities was distributed to 12 flasks of each medium, targeting the same phytoplankton biomass inoculum in each flask. All handling steps were executed under sterile conditions.
Flasks were placed in a climate chamber (20°C) illuminated in a 16:8 h light:dark cycle with LED lamps (Econlux, SolarStinger, SunStrip 70 Fresh) at a photon flux density (400–700 nm) of 53.2 ± 8.6 µmol m-2 s-1 (mean ± SD), and were shaken twice a day and randomly repositioned daily for the whole experiment duration. In addition, we transferred the communities to new sterile flasks every 7th day to avoid wall-growth. Using a spectrophotometer (Shimadzu, UV-1280), we measured optical density (OD, photometric light extinction measured at 800 nm in a 1 mL subsample) every 2nd day from the start of the experiment to monitor the biomass development over time. When the communities reached or approached the stationary growth phase (after 21 days), we took subsamples from each flask and fixed with Lugol’s iodine solution for the determination of phytoplankton biovolume at the end of phase 1. We counted and measured cells using an inverted microscope (Leica DM IL LED Fluo) equipped with a computer-aided camera (Leica DFC3000 G) and measurement software (Leica Application Suite software, LAS X, v. 3.7.1.21655). Geometric forms closely corresponding to the shapes of phytoplankton species were used for the calculation of biovolume of individual phytoplankton cells (Hillebrand et al., 1999).
For phase 2, we established four treatments in triplicates for each medium: a control (Ctrl, no nutrient addition), N supply (N, 90.41 µM N L-1), P supply (P, 2.58 µM P L-1), and combined N and P supply (N&P, 2.58 µM P L-1 and 90.41 µM N L-1). We added the aforementioned nutrients depending on treatment to each flask on day 21 and monitored OD every second day after nutrient additions, until the communities showing further growth reached or approached the stationary growth phase again (day 43, end of phase 2). We took subsamples and fixed with Lugol’s iodine solution for the determination of phytoplankton biovolume at the end of phase 2 (see above). One replicate from community 2, medium N:P = 70, treatment N&P (sample 40) was excluded due to implausible counting results probably caused by erroneous sub-sampling.
Statistical analyses were performed using the statistical software R, version 4.0.2 (R Core Team, 2023). Figures were created using the ggplot2 package (Wickham, 2016). We used Pearson’s correlations between paired samples of biomass measured as OD and total community biovolume to check their relationship in both phase 1 and phase 2, in order to assess the correspondence between the two methods of biomass estimation. We excluded from statistical analysis some of the outcompeted phytoplankton species that went extinct or whose biovolume at the end of phase 2 was very low.
We used general linear models (lm function) to test for treatment effects (i.e. nutrient addition effects) on phytoplankton community total biovolume at the end of both phase 1 and phase 2. It is expected that the general linear model used for phase 1 (total biovolume ~ community*medium*treatment) will not show a significant treatment effect, because nutrient additions occurred only after end of phase 1, and this would indicate good starting conditions for phase 2. The general linear model used for phase 2 (total biovolume ~ community*medium*treatment) should show a treatment effect, either by a significant main effect and/or by a significant interaction with medium, if the nutrient addition treatment at the beginning of phase 2 results in responses that suggest different factorial limitation scenarios at the end of phase 2. We used Tukey’s HSD (honestly significant difference) post hoc tests to test for differences in responses of total community biovolume and biovolume of single species to factorial nutrient supplies within each medium of each community, based on general linear models with treatment as sole explanatory variable (biovolume ~ treatment; for the data subsets). The post hoc test outcomes of total community biovolume were then compared to the hypothesized patterns of the factorial limitation scenarios shown in Figure 1. The factorial limitation scenarios identified from the post hoc tests were used to suggest the underlying growth response surface type and thus whether growth limitation of community biomass follows rather Liebig’s Law of the Minimum or the Multiple Limitation Hypothesis (Sperfeld et al., 2016).
To investigate whether and which species of the community are driving the observed biomass patterns (i.e. the factorial limitation scenarios), we assessed how much variance in total community biovolume was explained by the biovolume of the different species in a community. We used general linear models without interactions (i.e. multiple linear regressions; total biovolume ~ biovol.species.A + biovol.species.B +…) to calculate the variance in total biovolume at the end of phase 2 explained by individual species’ biovolumes within each community and each medium. Regressions were tested for multicollinearity using Variance Inflation Factors (VIFs) and explanatory variables (i.e. species biovolume) with a VIF > 2 were excluded (Zuur et al., 2010). Backward model selection was performed according to the Akaike Information Criterion (Akaike, 1973). We calculated the variance contribution (%) explained by individual species in the models based on the sum of squares of the ANOVA table results. Furthermore, we used general linear models to assess how much variance in total community biovolume was explained by the biovolume of single species within each community and medium, in order to evaluate the strength of potentially dominating species in driving the pattern of overall community biomass. All biovolume data were log10-transformed to comply with normality assumptions.
During phase 1, phytoplankton biomass measured as optical density (OD) increased similarly in all 3 communities and all three media (Figure 2). The communities reached or approached stationary growth approximately on day 20. Biomass (OD) was positively correlated with the total biovolume at the end of phase 1 (Pearson correlation: R = 0.78, p < 0.001). During phase 2, phytoplankton biomass responded differently in the 3 communities depending on nutrient addition treatment and medium. OD increased at N:P = 17.5 only after N and N&P addition. At N:P = 35, the response changed based on the community, with mainly N and N&P causing an increase in biomass. At N:P = 70, community 1 biomass increased when N and N&P were added while biomass in community 2 and 3 generally increased regardless of nutrient addition, but more when combined N&P were supplied (Figure 2). The biomass was positively correlated with the total biovolume at the end of phase 2 in all three communities (Pearson correlations: R > 0.81, p < 0.001 in each community).
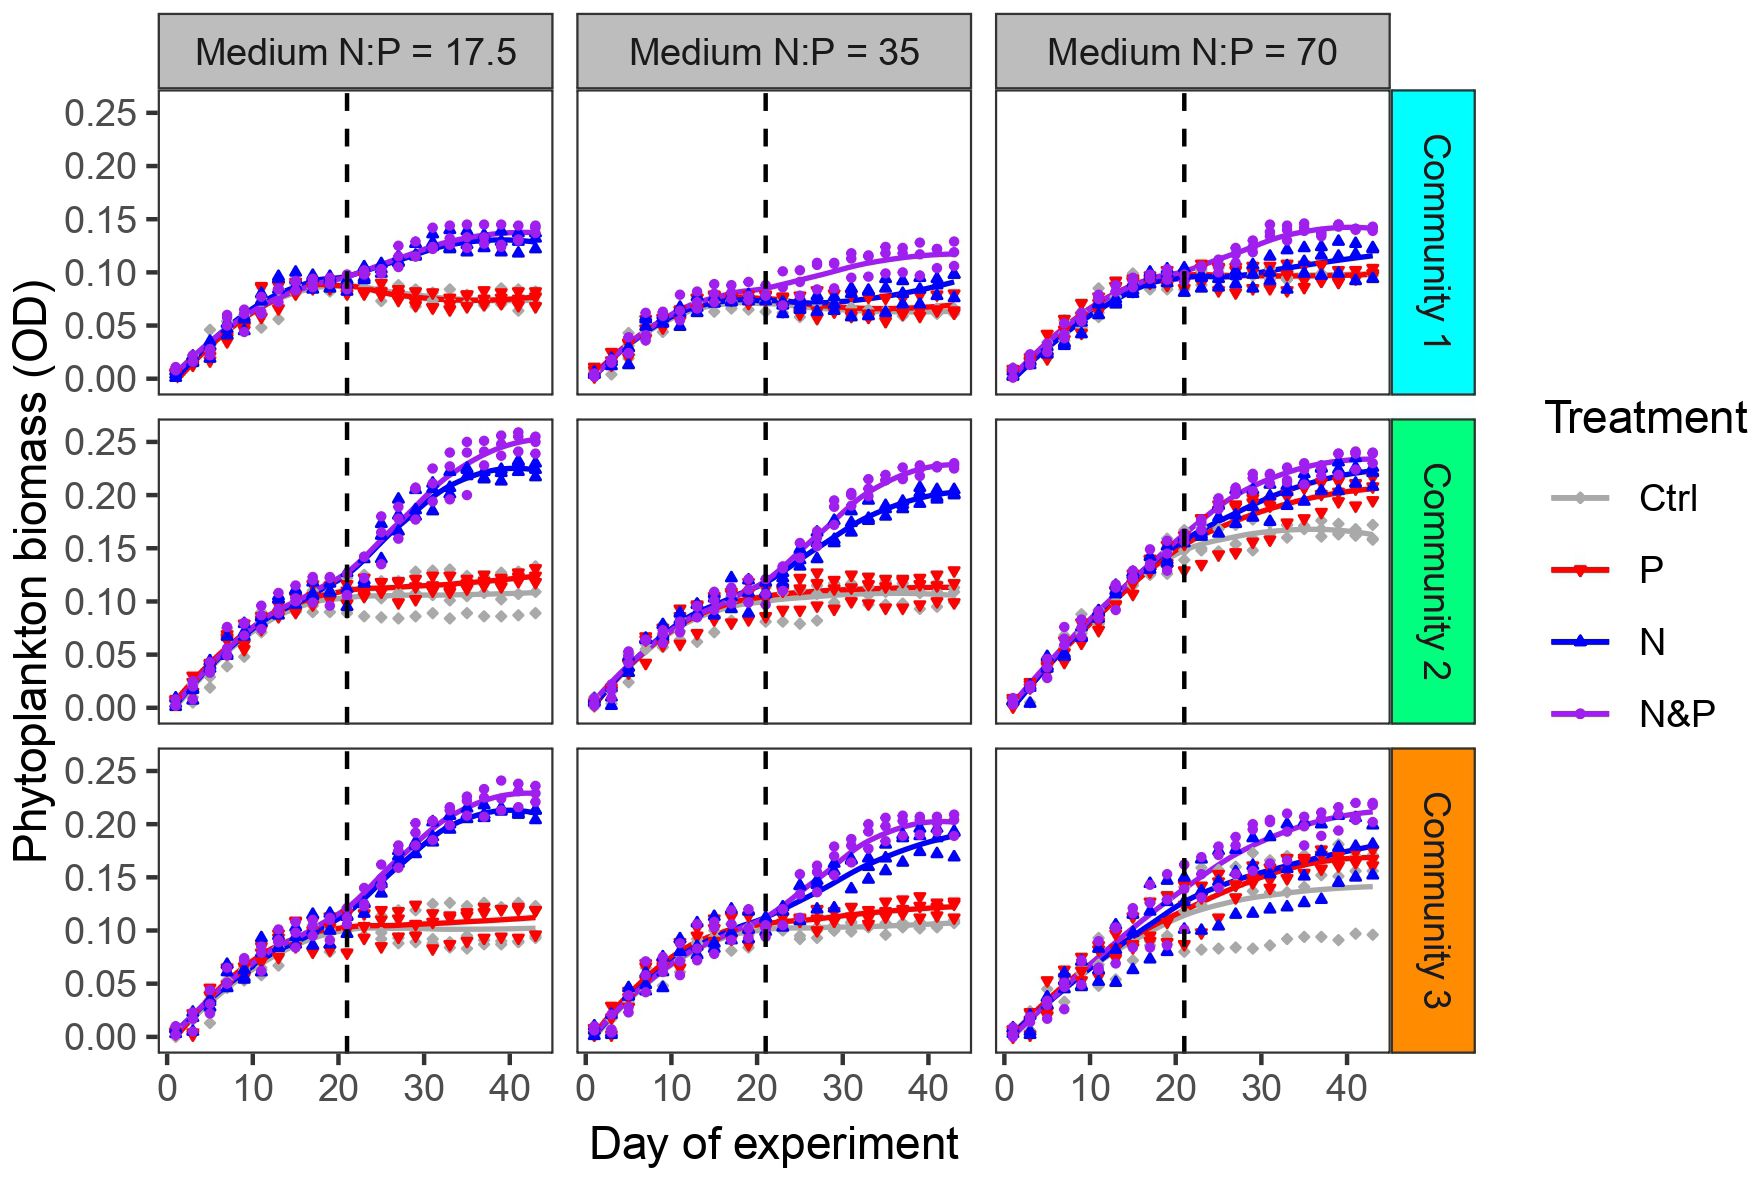
Figure 2 Phytoplankton biomass (measured as OD) development in the 3 communities for each of the three initial medium N:P throughout the experiment. Colors indicate experimental treatments during phase 2. Experimental phases 1 and 2 are separated by the dashed vertical line.
At the end of phase 1, total biovolume was only affected by the medium, community, and their interaction (Table 2; Supplementary Figure S2). Further, the abundance of each species was similar within replicates across media and communities (Supplementary Figure S2). These two points indicate optimal starting conditions for experimental phase 2 and the assessment of factorial limitation scenarios at its end. Already at the end of phase 1, several species (namely A. variabilis, C. ovata, and S. hantzschii) became either extinct or were found at very low biovolumes in the communities (Supplementary Figures S2, S4).
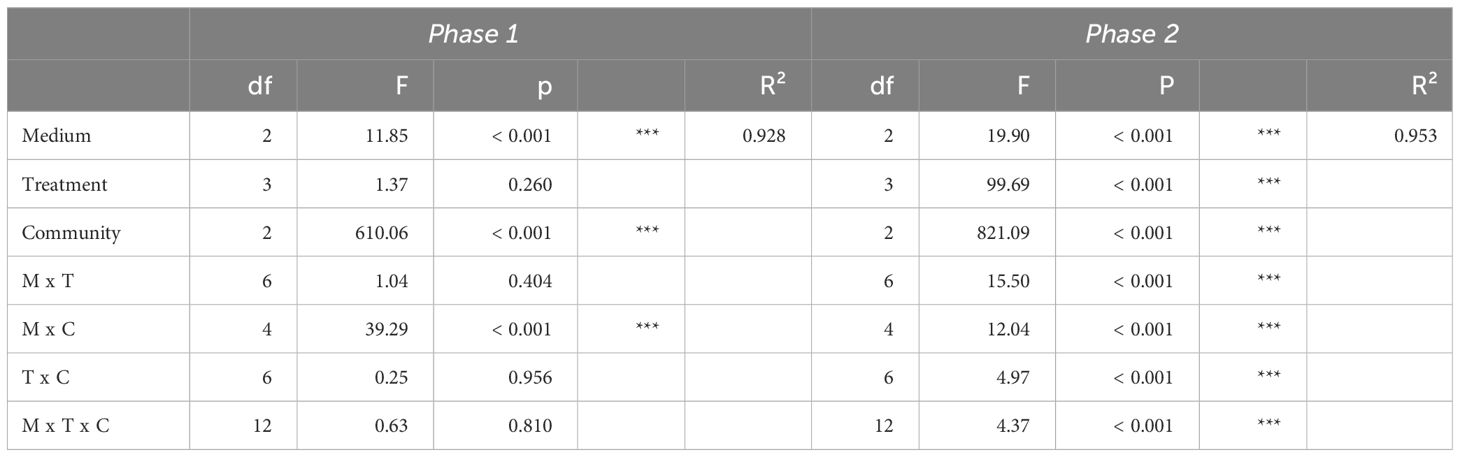
Table 2 ANOVA results of general linear models testing the effects of medium (M), treatment (T), community (C) and their interaction on phytoplankton total biovolume (log10-transformed) after phase 1 and phase 2.
At the end of phase 2, total biovolume was affected by medium, treatment, community and their interactions (Table 2). These results indicate that nutrient supplies affected the response in total community biovolume differently depending on the media and the community as well as differently in the communities depending on the media, suggesting the emergence of different factorial limitation scenarios. After the addition of nutrients, we were able to assess the factorial limitation scenarios in the three communities based on total biovolume (Figure 3). In the N:P = 35 and N:P = 70 media of community 1 we detected simultaneous co-limitation, because only the combined N&P addition and not the addition of either N or P alone resulted a positive growth response compared to the Ctrl, while in the N:P = 17.5 medium, we identified single N limitation, because the addition of both N&P and N resulted in a comparable positive biomass response and P addition alone did not produce a response significantly different from the Ctrl. Community 2 was single-limited by N in the N:P = 35 and in the N:P = 17.5 medium, while in the N:P = 70 medium a tendency towards single N or independent co-limitation can be observed, because the N&P addition seemed to result in a higher growth response than single N or P addition. Community 3, similarly, was single-limited by N in the N:P = 35 and in the N:P = 17.5 medium, and although not significant, simultaneously co-limited in the N:P = 70 medium, because the response to N&P was higher compared to the other nutrient supply treatments (Figure 3).
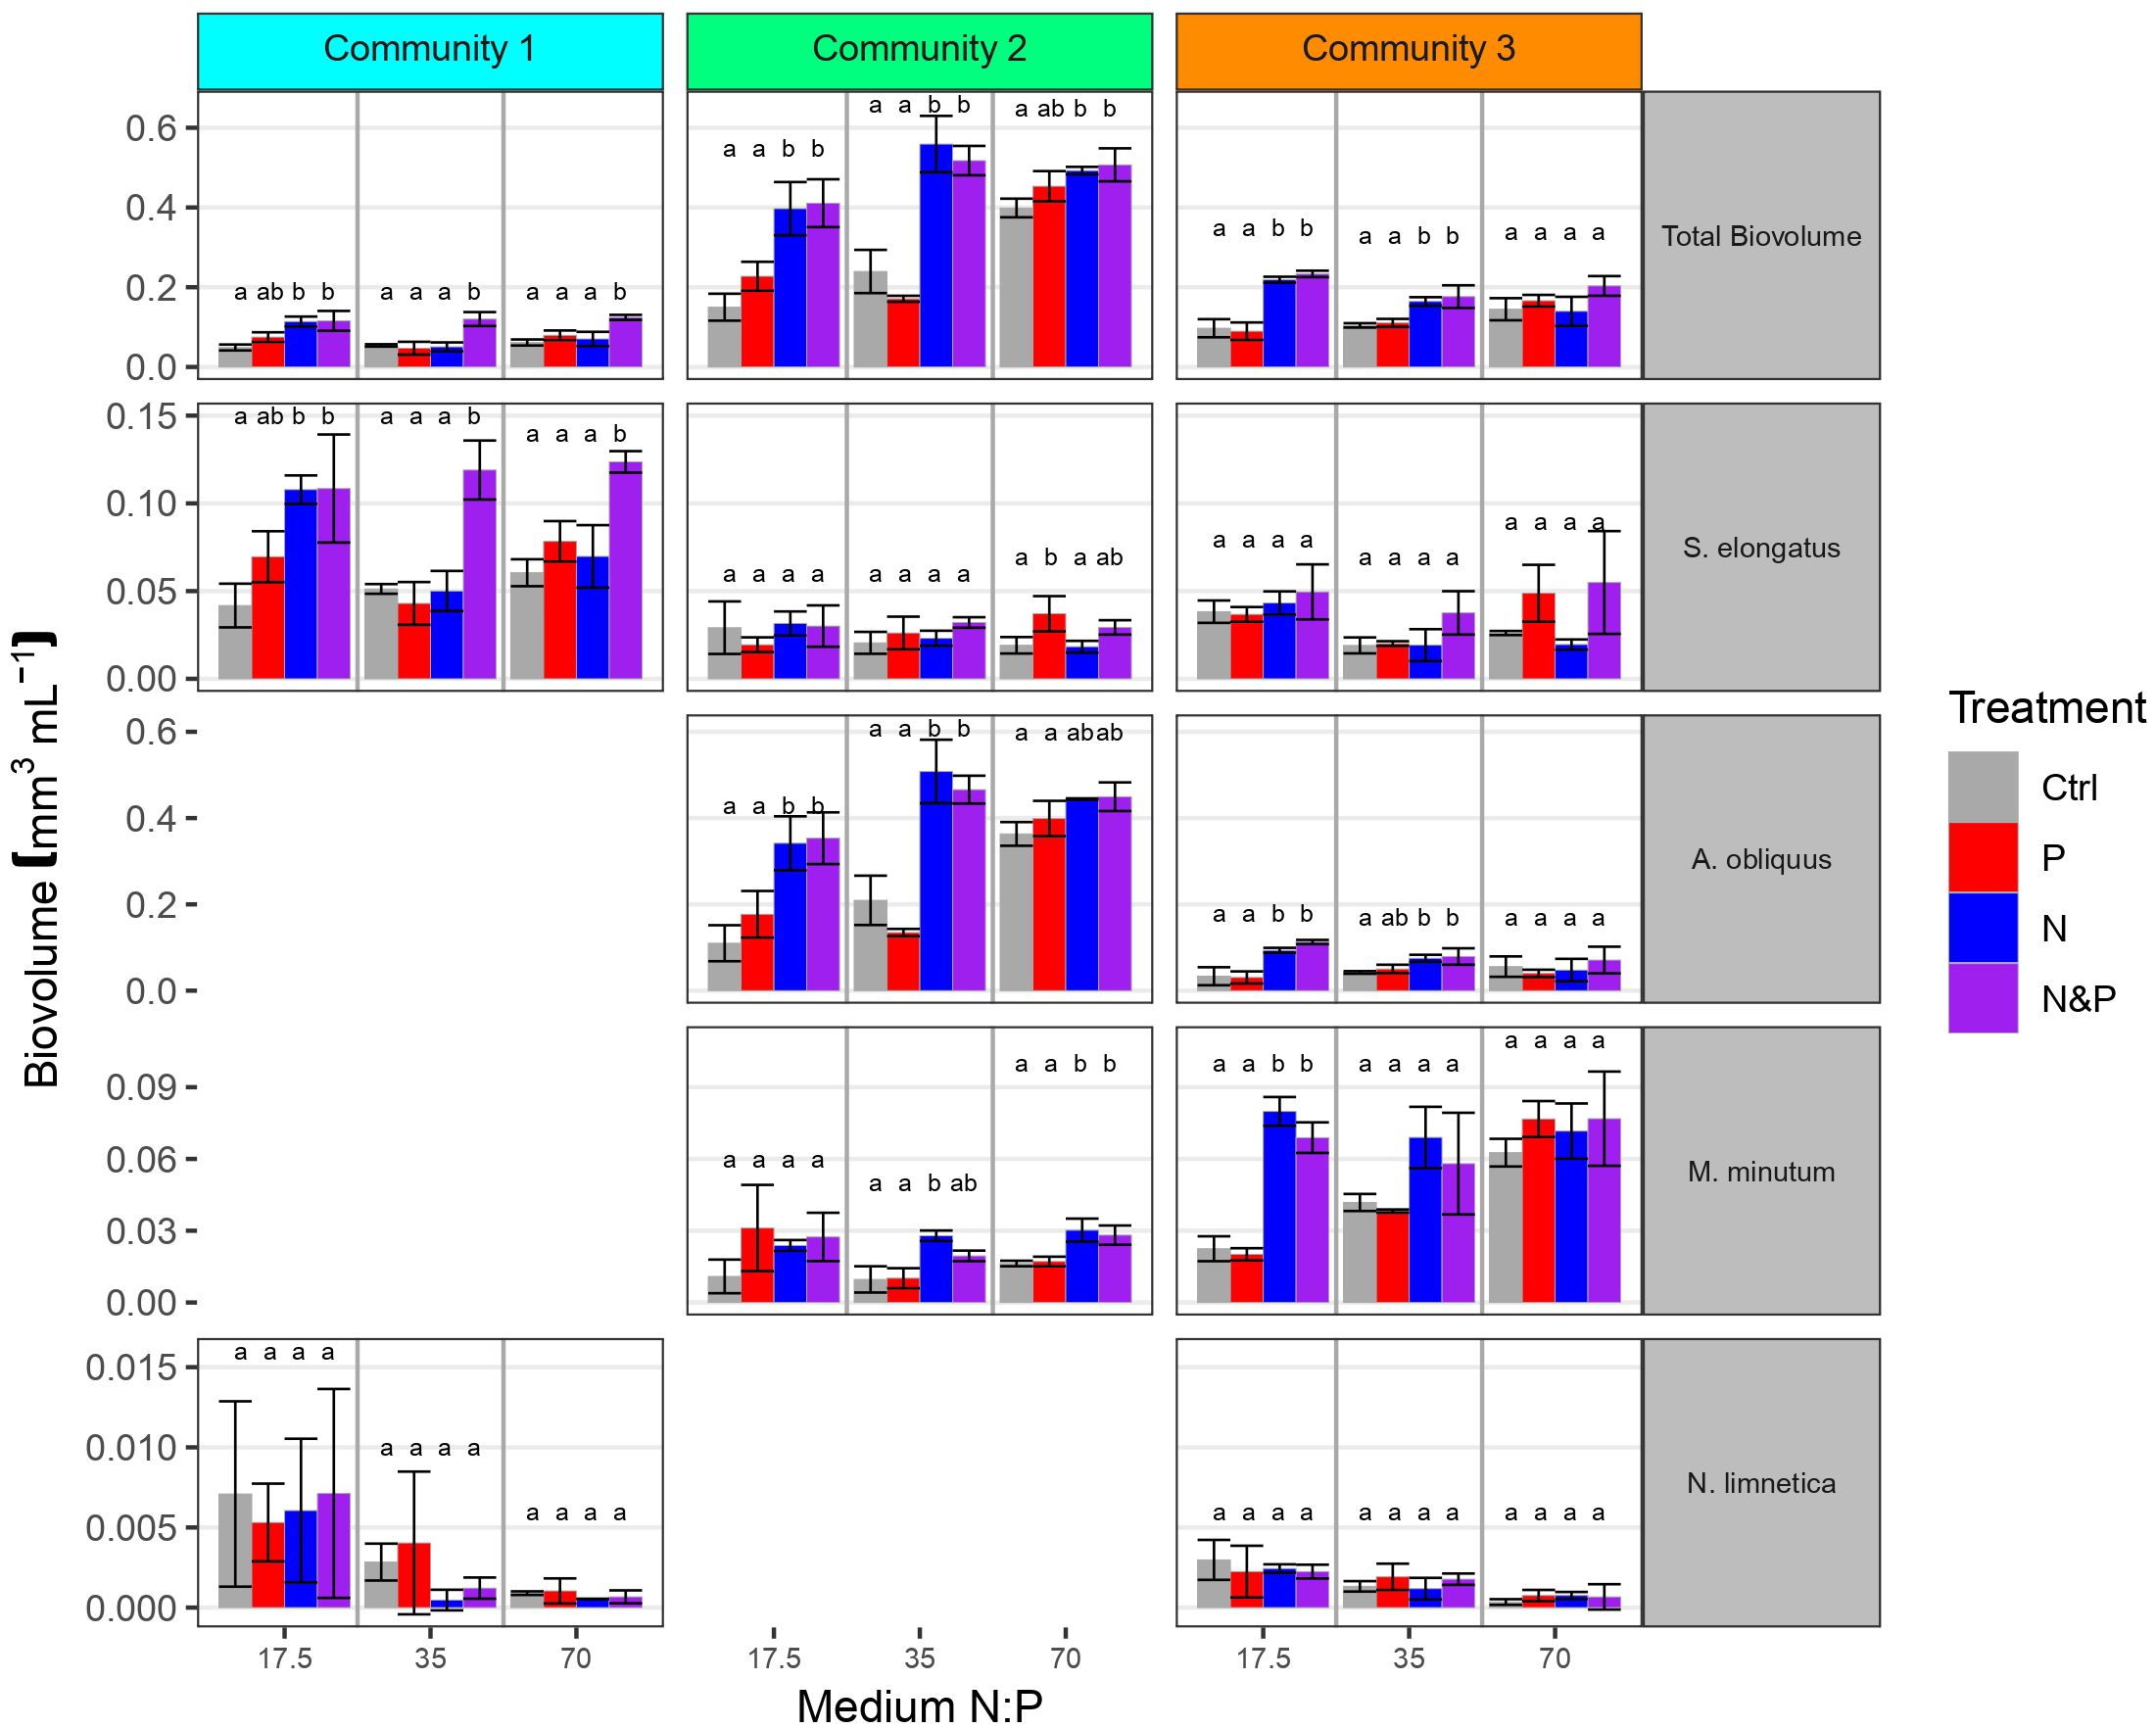
Figure 3 Total phytoplankton biovolume and biovolume of key species in the 3 communities at the end of phase 2 for each of the three initial medium N:P. Colors indicate factorial nutrient additions at the beginning of phase 2. Letters above error bars indicate significant differences between treatments within community, medium and biovolume categories (Tukey’s HSD post hoc tests). Scales are different for each species and missing panels represent species not included in the starting community.
At the end of phase 2, the species that were found at low densities in phase 1 (namely A. variabilis, C. ovata, and S. hantzschii) either became extinct or decreased further in biovolume (Figure 4; Supplementary Figures S3, S4). Because these species contributed only a negligible proportion to the total community biovolume (maximum mean proportion ± SD < 6.21 ± 6.04% and < 2.61 ± 2.92% at the end of phase 1 and 2, respectively), we excluded them from statistical analyses. The biovolume of N. limnetica at the end of phase 2 was also occasionally similar to that of the low-density species from phase 1, but we did not exclude this species from our analyses in order to maintain three communities still varying in species composition.
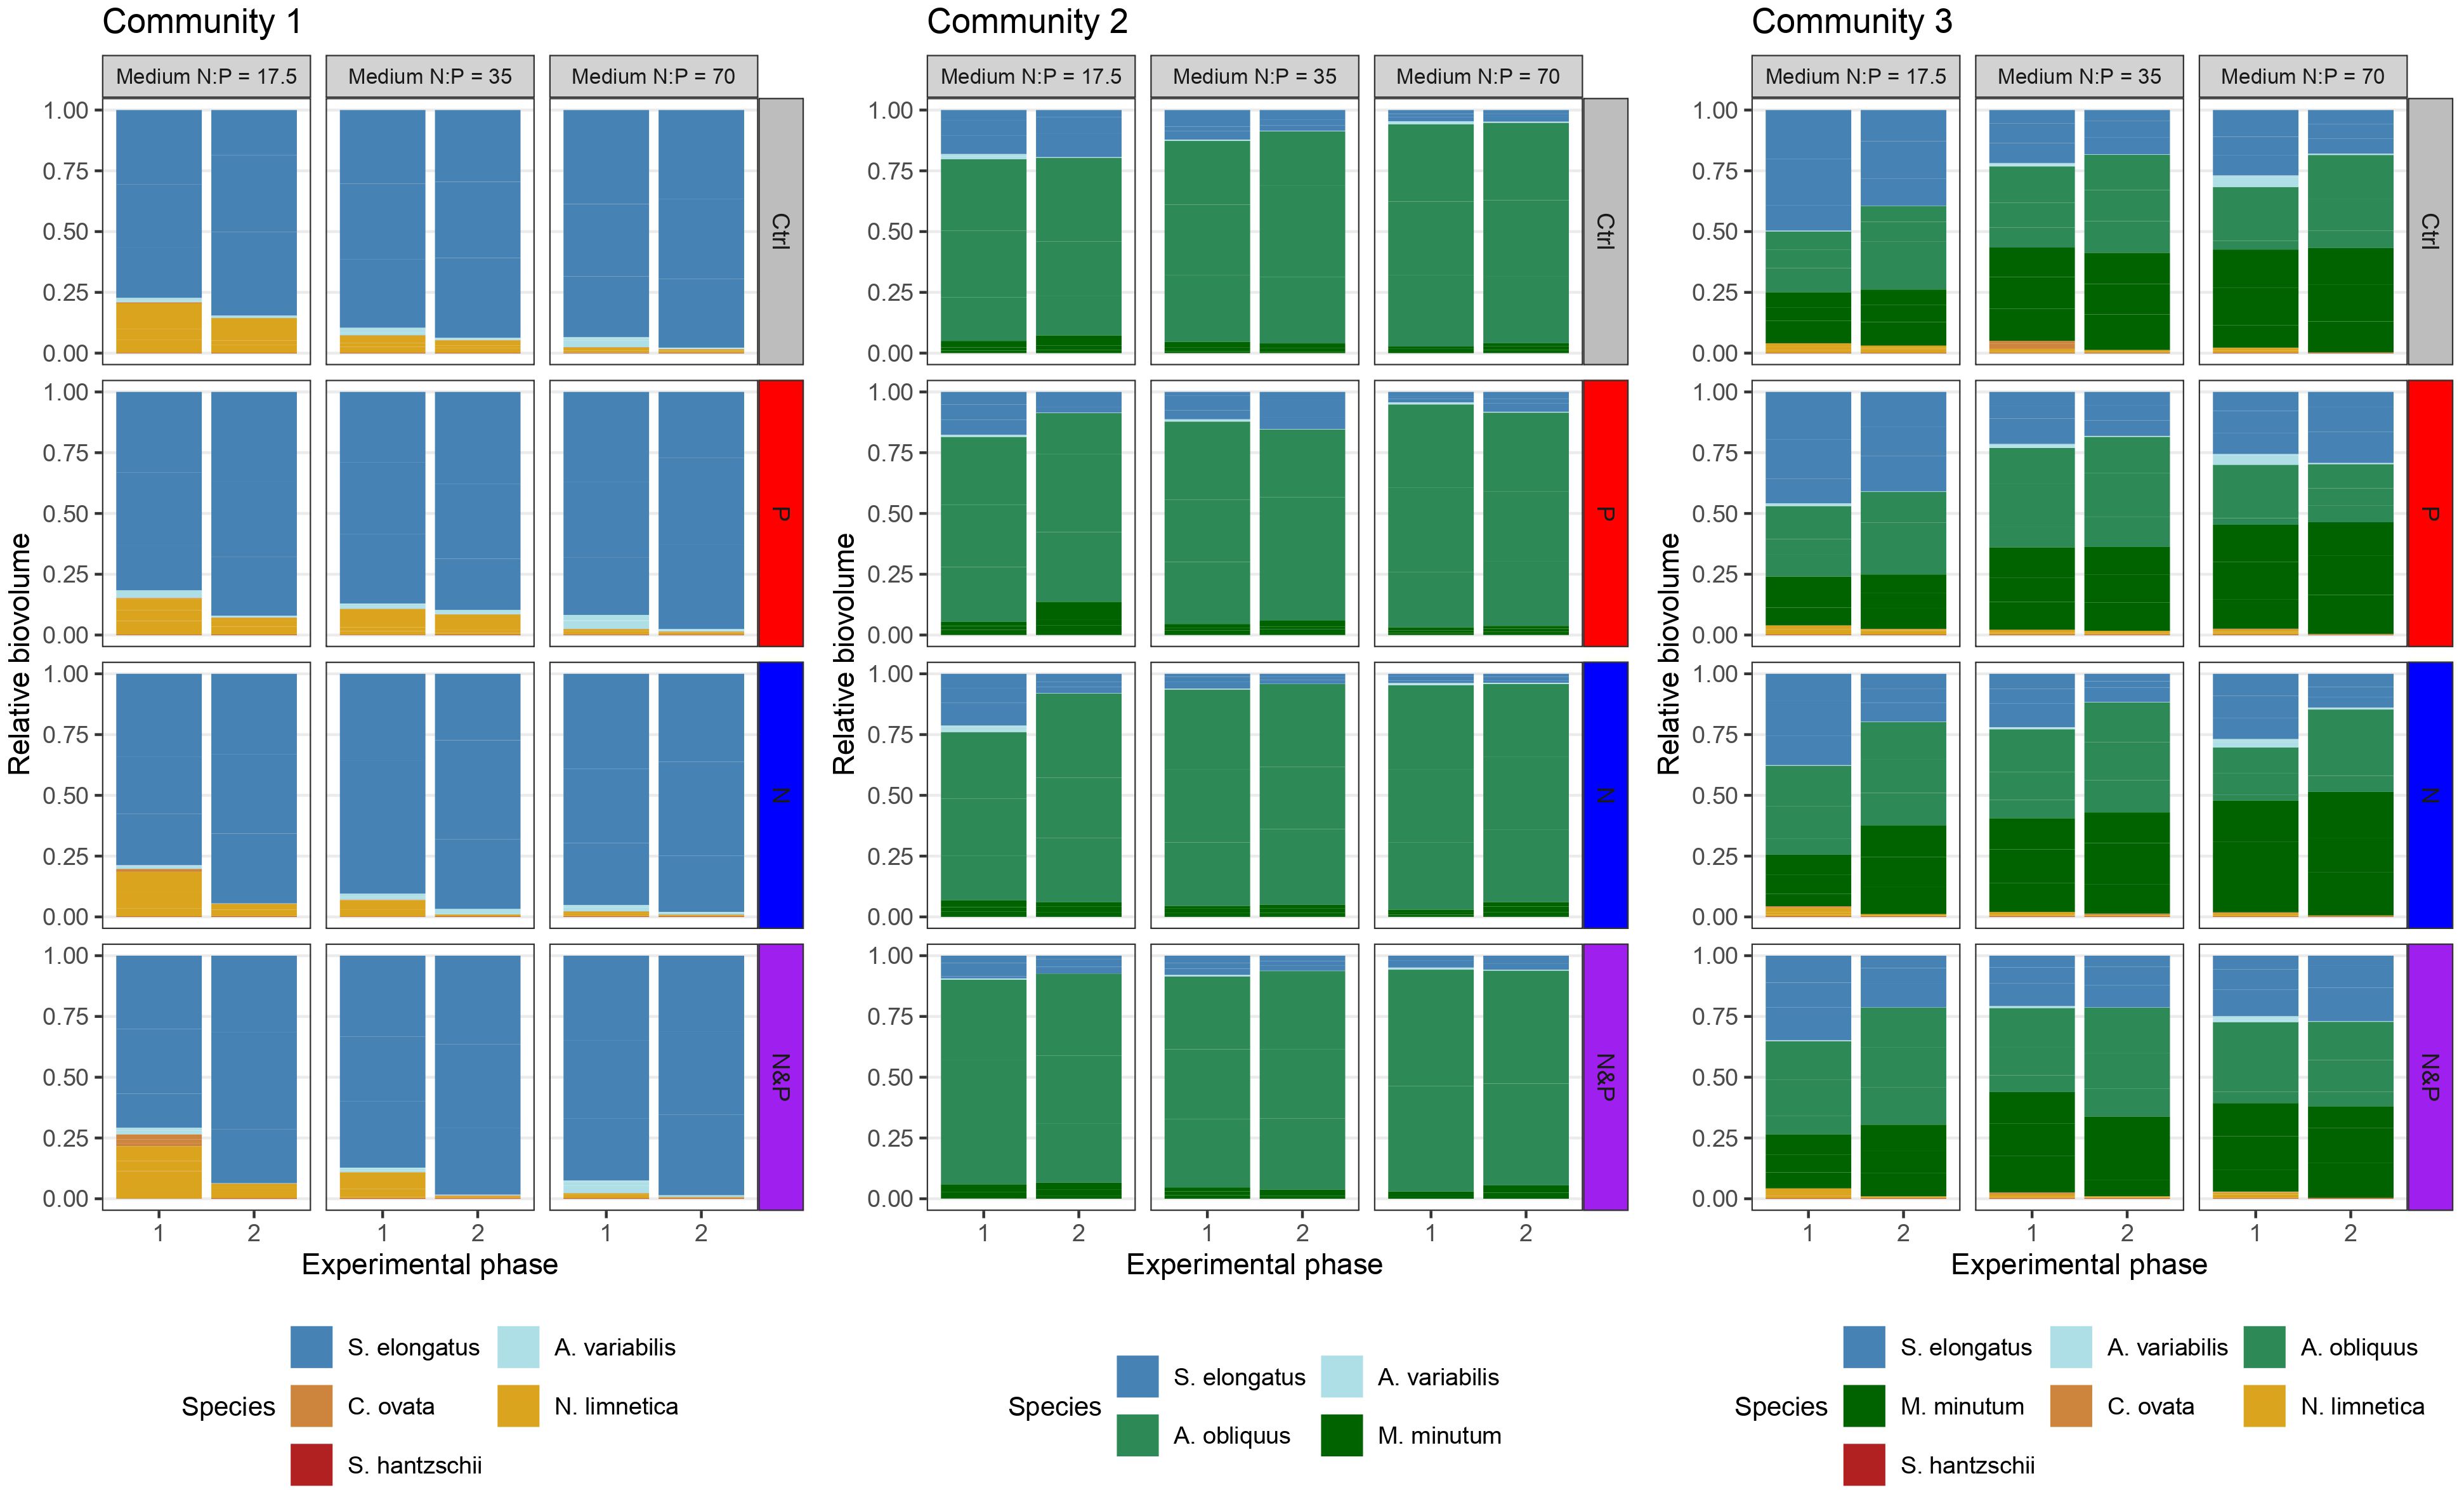
Figure 4 Relative biovolume of the phytoplankton species in the three communities at the end of experimental phase 1 and phase 2. Vertical facets indicate the initial medium N:P, while horizontal facets indicate factorial nutrient additions at the beginning of phase 2 (color-coded according to the treatment).
As a result of species interactions and competitive exclusion, some species became dominant in the communities, and overall, individual species responded differently to nutrient additions depending on the medium and also on the community (Figure 3). S. elongatus dominated community 1 in all three media, and was ten times more abundant than the subdominant N. limnetica (Figures 3, 4). The limitation patterns of S. elongatus biovolume reflected those observed for total community biovolume, while N. limnetica showed no differences between treatments and thus no clear limitation pattern (Figure 3). In all three media, S. elongatus biovolume alone contributed to almost all of the observed variance in total phytoplankton biovolume (Tables 3; S1). While N. limnetica had a significant effect on total biovolume in the N:P = 35 and N:P = 17.5 media, it contributed only very little to the explained variance (≤1.5%, Table 3), and thus did not drive the limitation pattern of community 1.
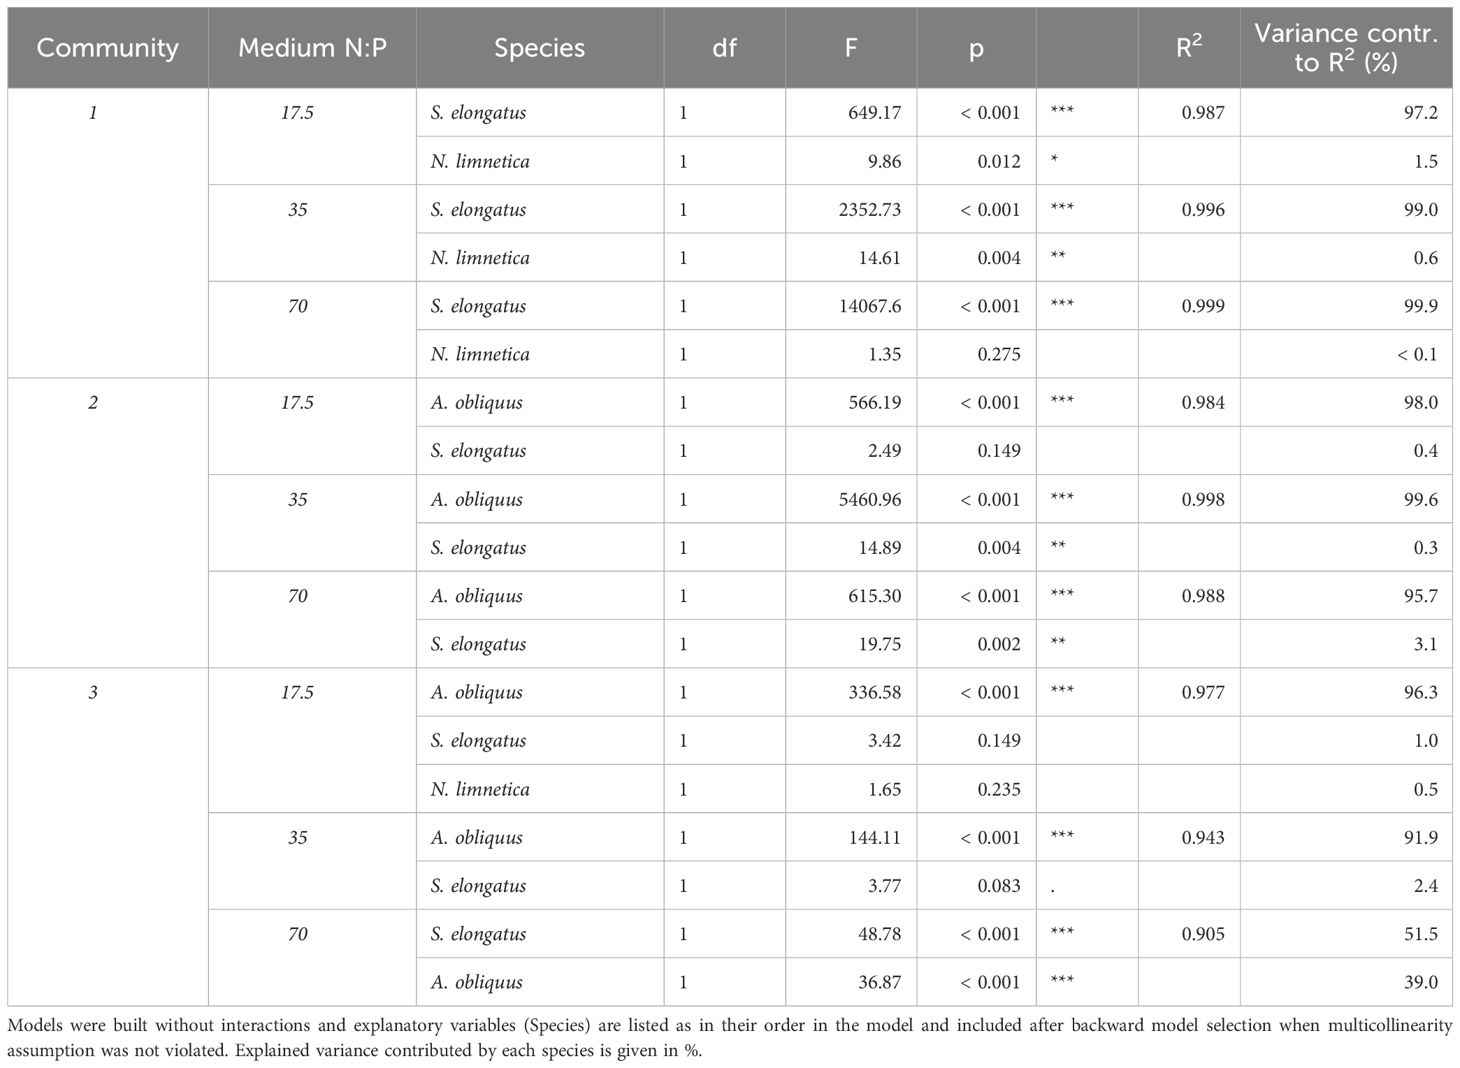
Table 3 ANOVA results of general linear models testing the effects of biovolume of selected phytoplankton species (log10-transformed, mm3/mL) on total community biovolume (log10-transformed, mm3/mL) at the end of phase 2 for each medium per community combination.
A. obliquus was the dominant species in all three media of community 2, and was approximately ten times more abundant than S. elongatus and M. minutum (Figures 3, 4). Limitation patterns of A. obliquus biovolume mirrored those observed for the total community biovolume, while the two subdominant species showed somewhat different nutrient limitation patterns (Figure 3). In all three media, A. obliquus biovolume alone contributed to almost all of the observed variance in total biovolume (Table 3). M. minutum showed a similar single N limitation pattern to A. obliquus in the N:P = 70 medium and to a lesser extent in the N:P = 35 medium, which likely explains the high correlation of biovolumes between the two species (VIF > 2). S. elongatus had a significant effect on total biovolume in N:P = 35 and N:P = 70 media, but contributed only a small portion to the explained variance (<3.5%, Table 3). Thus, biomass developments of the two green algae after nutrient additions likely drove the limitation pattern observed in community 2.
The biomass of community 3 was generally more evenly distributed among the three species A. obliquus, M. minutum, and S. elongatus, but the two green algae together constituted the dominant group in all three media (Figures 3, 4). In N:P = 17.5 and slightly in N:P = 35 media, the limitation patterns of the two green algae corresponded to those of total community biovolume (single N limitation), while S. elongatus was rather simultaneously co-limited (Figure 3). In the N:P = 70 medium, the two dominating green algae did not show any significant limitation pattern. A. obliquus was likely simultaneously co-limited by N&P, whereas the cyanobacterium S. elongatus and M. minutum seemed to be single-limited by P (Figure 3). N. limnetica showed only little biomass and no clear limitation pattern in any media (Figure 3). M. minutum showed a limitation pattern generally similar to A. obliquus in the three media, and its biovolume was highly correlated to the more abundant A. obliquus (VIF > 2.9 in each medium). In N:P = 35 and N:P = 17.5 media, A. obliquus biovolume alone contributed to almost all of the explained variance in total biovolume, while S. elongatus did not have a significant effect on total biovolume (Table 3). In the N:P = 70 medium, on the other hand, biovolume of S. elongatus and A. obliquus contributed 51.5% and 39% respectively to the explained variance (Table 3). Thus, the biomass pattern in the N:P = 17.5 medium was mainly driven by S. elongatus (Supplementary Table S1) and to a smaller extent by A. obliquus.
We used phytoplankton communities in highly controlled microcosms to investigate potential mechanisms based on biomass responses of individual species that lead to the development of nutrient (co-)limitation patterns at the community level. We designed an experiment simulating several (co-)limitation scenarios and used biovolume data of three communities varying in species composition to explore what has led to the different community growth patterns based on their biomass responses.
At the end of the second growing phase, we identified single N limitation and co-limitation by N and P at the community level. These limitation scenarios were mostly based on responses of the dominant species (see below). Strictly defined co-limitation scenarios were frequently observed in our experimental communities, but single N limitation was the most common scenario, which is partially in agreement with the findings of the meta-analysis of Harpole et al. (2011). In a study with a similar experimental design and phytoplankton communities, but with an initial ‘balanced’ N:P = 16:1 (Redfield Ratio: Redfield, 1958) in the growth medium, we did not detect co-limitation and N was the single or primary limiting nutrient (Redoglio et al., 2022). Frank et al. (2020) also reported a stronger response to N supply in experimental phytoplankton communities, suggesting optimal N:P > 16. By shifting towards N:P = 35 in the initial growth medium as the more balanced nutrient ratio, we aimed to create conditions where co-limitation scenarios can emerge.
We expected co-limitation to arise at N:P = 35 (Figure 1), but this was observed only for community 1 where S. elongatus was dominating. In community 2 and 3, where green algae A. obliquus and M. minutum were prevalent (Figure 4), we observed single N limitation (Figure 3). On the other hand, we detected co-limitation, or at least a tendency, at N:P = 70:1 in all three communities. Despite this medium being already N-rich from phase 1, P supply significantly favored growth only when combined with N. At N:P = 17.5, our expectation of N to become the limiting nutrient was met. Thus, we did not find a confirmation for the hypothesis of co-limitation emerging under the more balanced N:P = 35 across all communities, while the hypothesis of single or serial limitation arising at imbalanced N:P was partially supported, as we detected single N limitation at N:P = 17:5, but not single or serial P limitation at N:P = 70 in the communities.
These results suggest that community 2 and 3 had a high optimal N:P and were particularly N demanding, while the more balanced N:P of community 1 was closer to our expectations. This can be explained considering the phytoplankton species composition (Figure 4; Supplementary Figure S4) and their traits regarding nutrient requirements (Litchman et al., 2007). Already at the end of phase 1 and later at the end of phase 2, our communities were dominated either by green algae or cyanobacteria, which have been shown to have an optimal N:P higher than the Redfield ratio (Arrigo, 2005; Hillebrand et al., 2013). The dominating green algae (A. obliquus and M. minutum) and the cyanobacterium S. elongatus are also fast growing species (Sperfeld et al., 2010). Concurrently, cyanobacteria such as Anabaena spp. are known to fix atmospheric nitrogen (Huisman et al., 2018). Thus, their higher occurrence relative to total biovolume in community 1, might have lowered the optimal N:P for that community compared to the others. In addition, we used species with different nutrient uptake capabilities (Table 1), that may have assimilated the nutrients after nutrient spikes differently and thus grew at different rates during the non-stationary growth phase. Physiological traits of the phytoplankton species might thus have influenced the community structure and dominance of species (Litchman et al., 2007) at stationary growth in our experiment. This still represents a realistic scenario, as it is often observed in nature that certain species are dominating under particular conditions (Barcelos Ramos et al., 2017; Burson et al., 2018).
Overall, our hypotheses that mainly the dominant species in case of single nutrient limitation determines the community pattern (Supplementary Figures S1B, C), while also sub-dominant species in case of co-limitation can drive the community response (Supplementary Figure S1A), are only partially supported. Although (co-)limitation patterns of whole community biomass could theoretically be partly or entirely the result of biomass responses of rare or sub-dominant species (Supplementary Figures S1A, D), we found that both co-limitation and single N limitation patterns identified for the whole community were strongly driven by the dominant species. In community 1 and 2, S. elongatus and A. obliquus were respectively ten times more abundant than the other species, which indicates these species as better competitors for the nutrients in the given ratios and supplies (Litchman et al., 2007; Edwards et al., 2011). It appears that M. minutum, despite being relatively low in biovolume in community 2, showed similar single N limitation patterns to A. obliquus, which is expected as both green algae are assumed to have similar nutrient demands and traits (Sperfeld et al., 2010). In these cases (community 1 and 2), where the community has low diversity, and one species outcompetes the others, it seems that co-limitation arises only when the dominant species is co-limited and sub-dominant species do not contribute much to the community response. In community 3, species were more equally abundant, even though the green algae M. minutum and A. obliquus together prevailed (Figure 4). Interestingly, although not significant, we can see a tendency of community co-limitation at N:P = 70, despite the single species showing contrasting limitation patterns. Nevertheless, S. elongatus, which mostly drove the overall pattern in community 3, seemed to be more responsive to both P and N&P additions (Figure 3), while A. obliquus which also contributed to the overall pattern, seemed to increase only after N&P addition. In such a case of a community in which species are more evenly distributed, sub-dominant species can be (co-)limited by different nutrients and each species may contribute to the overall biomass pattern observed (cf. Supplementary Figure S1D).
The biovolume of species at the end of the phase 2 is the result of a 43-days long experiment with nutrient manipulations where communities starting with different sets of species were allowed to build up biomass. Due to species interactions along the duration of the experiment, community processes such as competition for resources, species sorting and competitive exclusion, led some species to become dominant. Also natural communities can often show biomass distributions with one or few dominant species (Tokeshi, 1993). In particular at high nutrient supplies, phytoplankton communities can increase their productivity but decrease in diversity, with few abundant and several rare species in the ocean (Vallina et al., 2014) and in freshwater systems (Reinl et al., 2022). Nevertheless, even if rare species do not contribute considerably to overall community biomass, they can be important in competitive processes, as we observed in community 2 and 3. The rare species C. ovata, N. limnetica and S. hantszchii influenced the competitive outcome of the dominant green algae species M. minutum and A. obliquus (Figure 4); in community 3, where C. ovata, N. limnetica and S. hantszchii were present, the two green algae showed a comparable biovolume, while in community 2, where the rare species were not part of the initial community assembly, A. obliquus strongly dominated the community. Likewise, the cyanobacterium S. elongatus showed much higher relative biovolumes in community 3 than in community 2 (Figure 4), which depended solely on the presence/absence of the three rare species in the initial set of species, and further highlights the effect of low biomass species on the competition outcomes in our communities.
The community biomass responses (Table 2) and the responses of individual species within the communities (Figure 3) differed depending on the initial medium N:P, the nutrient supply treatment, and the community itself. As a reaction to the manipulation of resources, such as nutrient supply and ratio, species can adjust their morphology or physiology for uptake-related traits (Bonachela et al., 2011). In addition, phytoplankton species have been shown to exhibit different degrees of flexibility in their demands for optimal nutrient ratios, particularly depending on their growth rate (Hillebrand et al., 2013). This phenotypic or physiological plasticity can also influence species interactions and sorting, and thus overall community composition (Miner et al., 2005). For example, the cyanobacterium S. elongatus showed a similar growth response at different media (N:P = 35 and 70) in community 1 where it was dominating, but the growth response changed in community 2 and 3 and also differed in the aforementioned media in these communities (Figure 3), indicating that S. elongatus exhibited plasticity in resource acquisition traits and that this plasticity was modulated by the community context and competition processes with other species.
The trait-based ecology approach proposes that community ecology and characteristics can be assessed based on traits that vary among species (Litchman and Klausmeier, 2008). Traits such as resource utilization or cell size can, among others, shape the species distribution and thus contribute to structuring phytoplankton communities (Litchman et al., 2010; Sommer et al., 2017). If we apply this approach to our experiment and to the predictions of nutrient (co-)limitation scenarios, we see that where one or closely-related species are dominant, the community (co-)limitation pattern can be predicted based on the response of the dominant species or functional group. Thus, where the patterns coincide, the community response might also be predicted based on the traits of the species or groups regarding nutrient acquisition and storage. When the species in the community are more evenly distributed, our data show that (co-)limitation patterns can differ between individual species of contrasting nutrient requirements and the whole community, which makes predicting a community response from traits of single species more difficult.
Arrigo (2005) proposed that the addition of multiple nutrients may favor the growth of different members of the community, thus resulting in community co-limitation even if the species of the community are each limited by a single nutrient. In our experiment, we found a confirmation of this only when the species composition of the community was more even. However, as this was the case only in one out of nine instances, further investigations are needed to support this hypothesis. The community as a whole can be also co-limited by multiple nutrients when species occupy separate niches and when they have different physiologies and nutrient requirements (Falkenberg et al., 2013). The patterns identified for the different species can thus lead to a community limitation pattern that does not arise in single species, as we saw in community 2 and slightly in community 3, N:P = 70. When a species became dominant, the community (co-)limitation pattern was driven by that species, regardless of the limitation type (single or co-limitation). Thus, based on observations of similar biomass responses, the nutrient requirements of the community seem to coincide with those of the most abundant species. Our results are partially in contrast with what has been studied by Danger et al. (2008), who used bacteria communities to test their assumption that Liebig’s Law of the Minimum does not hold at the community level. We found that phytoplankton communities can be limited by a single nutrient, following Liebig’s Law of the Minimum, as well as co-limited by multiple nutrients. Outcomes from our experiments are more in line with model predictions by Ågren et al. (2012) of limitation responses that can follow both Liebig’s Law of the Minimum and the Multiple Limitation Hypothesis.
With our experiment, we wanted to investigate the underlying mechanisms in terms of biomass responses of individual species driving (co-)limitation of primary producer communities. We found that the dominant species, or functional groups with species showing similar nutrient requirements (inferred based on observations of similar biomass responses), mostly determine the (co-)limitation pattern observed at the community level. We suggest that the dominance of species or groups with specific nutrient requirements is one important mechanism that determines the pattern of nutrient (co-)limitation observed at the community level. However, this mechanism might only be valid if nutrient limitation (bottom-up) is the main driver of autotroph biomass responses, as other processes like the strength of herbivory (top-down) could also change the outcomes. In addition, when the abundances of species in a community are more evenly distributed, a community co-limitation scenario can arise even though species are each limited by different nutrients. We propose that not only the Multiple Limitation Hypothesis but also Liebig’s Law of the Minimum can be applied to communities as a whole. A single nutrient limitation pattern that follows Liebig’s Law of the Minimum can emerge at the community level, which means that overall community biomass can be seemingly limited by a single nutrient despite the individual species being limited by other or different nutrients. This makes the understanding of co-limitation at the community level more complex, and ecological mechanisms of species coexistence, competition and predation may add a further layer of complexity. Furthermore, we highlight the importance of community properties, such as species abundance and composition, and of species traits related to growth rate and nutrient acquisition that can shape the response of the community to nutrient (co-)limitation. Our study is a first step aiming a better understanding of community (co-)limitation in terms of biomass responses. Future studies should additionally consider and integrate physiological and/or biochemical responses to have a deeper understanding on the mechanisms involved at lower levels of biological organization. Finally, our results show that community (co-)limitation outcomes can be predicted based on knowledge of nutrient use requirements of one or few dominant species, which may be a useful tool for lake restoration and oligotrophication efforts.
The original contributions presented in the study are publicly available. This data can be found here: FigShare, https://figshare.com/s/fa812b103c58d8087c87.
AR: Conceptualization, Data curation, Formal analysis, Investigation, Methodology, Software, Validation, Visualization, Writing – original draft, Writing – review & editing. ES: Conceptualization, Funding acquisition, Project administration, Resources, Supervision, Validation, Writing – review & editing, Formal analysis.
The author(s) declare financial support was received for the research, authorship, and/or publication of this article. This work was supported by the German Research Foundation (Deutsche Forschungsgemeinschaft, Grant No SP1473/3-1 (project no. 449402474) to ES).
We thank Christin Park, Hamam Aflok and Melanie Köhne for technical assistance in the laboratory, and Alexander Wacker for scientific support and supervision. We acknowledge support for the Article Processing Charge by the German Research Foundation (project no. 449402474). We thank the reviewers and the editor for constructive comments that improved the final version of the article.
The authors declare that the research was conducted in the absence of any commercial or financial relationships that could be construed as a potential conflict of interest.
All claims expressed in this article are solely those of the authors and do not necessarily represent those of their affiliated organizations, or those of the publisher, the editors and the reviewers. Any product that may be evaluated in this article, or claim that may be made by its manufacturer, is not guaranteed or endorsed by the publisher.
The Supplementary Material for this article can be found online at: https://www.frontiersin.org/articles/10.3389/fevo.2024.1368445/full#supplementary-material
Ågren G. I., Wetterstedt J.Å.M., Billberger M. F. K. (2012). Nutrient limitation on terrestrial plant growth - modeling the interaction between nitrogen and phosphorus. New Phytol. 194, 953–960. doi: 10.1111/j.1469-8137.2012.04116.x
Akaike H. (1973). “Information theory as an extension of the maximum likelihood principle,” in Second International Symposium on Information Theory, (Springer, New York, USA) 267–281.
Allgeier J. E., Rosemond A. D., Layman C. A. (2011). The frequency and magnitude of non-additive responses to multiple nutrient enrichment. J. Appl. Ecol. 48, 96–101. doi: 10.1111/j.1365-2664.2010.01894.x
Arrigo K. R. (2005). Marine microorganisms and global nutrient cycles. Nature 437, 343–348. doi: 10.1038/nature04159
Bannon C., Rapp I., Bertrand E. M. (2022). Community interaction co-limitation: nutrient limitation in a marine microbial community context. Front. Microbiol. 13. doi: 10.3389/fmicb.2022.846890
Barcelos Ramos E. J., Schulz K. G., Voss M., Narciso Á., Müller M. N., Reis F. V., et al. (2017). Nutrient-specific responses of a phytoplankton community: A case study of the North Atlantic Gyre, Azores. J. Plankton Res. 39, 744–761. doi: 10.1093/plankt/fbx025
Beardall J., Young E., Roberts S. (2001). Approaches for determining phytoplankton nutrient limitation. Aquat. Sci. 63, 44–69. doi: 10.1007/PL00001344
Bonachela J. A., Raghib M., Levin S. A. (2011). Dynamic model of flexible phytoplankton nutrient uptake. Proc. Natl. Acad. Sci. U. S. A 108, 20633–20638. doi: 10.1073/pnas.1118012108
Bracken M. E. S., Hillebrand H., Borer E. T., Seabloom E. W., Cebrian J., Cleland E. E., et al. (2015). Signatures of nutrient limitation and co-limitation: Responses of autotroph internal nutrient concentrations to nitrogen and phosphorus additions. Oikos 124, 113–121. doi: 10.1111/oik.01215
Bratt A. R., Finlay J. C., Welter J. R., Vculek B. A., Van Allen R. E. (2020). Co-limitation by N and P characterizes phytoplankton communities across nutrient availability and land use. Ecosystems 23, 1121–1137. doi: 10.1007/s10021-019-00459-6
Browning T. J., Moore C. M. (2023). Global analysis of ocean phytoplankton nutrient limitation reveals high prevalence of co-limitation. Nat. Commun. 14, 1–12. doi: 10.1038/s41467-023-40774-0
Burson A., Stomp M., Greenwell E., Grosse J., Huisman J. (2018). Competition for nutrients and light: testing advances in resource competition with a natural phytoplankton community. Ecology 99, 1108–1118. doi: 10.1002/ecy.2187
Conley D. J., Paerl H. W., Howarth R. W., Boesch D. F., Seitzinger S. P., Havens K. E., et al. (2009). Controlling eutrophication: nitrogen and phosphorus. Science 323, 1014–1015. doi: 10.1126/science.1167755
Craine J. M. (2009). Resource Strategies of Wild Plants (Princeton: Princeton University Press). doi: 10.1515/9781400830640
Danger M., Daufresne T., Lucas F., Pissard S., Lacroix G. (2008). Does Liebig’s Law of the Minimum scale up from species to communities? Oikos 117, 1741–1751. doi: 10.1111/j.1600-0706.2008.16793.x
de Baar H. J. (1994). von liebig’ s law of the minimum and plankton ecology. Prog. Oceanogr 33, 347–386. doi: 10.1016/0079-6611(94)90022-1
Du E., Terrer C., Pellegrini A. F. A., Ahlström A., van Lissa C. J., Zhao X., et al. (2020). Global patterns of terrestrial nitrogen and phosphorus limitation. Nat. Geosci 13, 221–226. doi: 10.1038/s41561-019-0530-4
Edwards K. F., Klausmeier C. A., Litchman E. (2011). Evidence for a three-way trade-off between nitrogen and phosphorus competitive abilities and cell size in phytoplankton. Ecology 92, 2085–2095. doi: 10.1890/11-0395.1
Elser J. J., Bracken M. E. S., Cleland E. E., Gruner D. S., Harpole W. S., Hillebrand H., et al. (2007). Global analysis of nitrogen and phosphorus limitation of primary producers in freshwater, marine and terrestrial ecosystems. Ecol. Lett. 10, 1135–1142. doi: 10.1111/j.1461-0248.2007.01113.x
Falkenberg L. J., Russell B. D., Connell S. D. (2013). Contrasting resource limitations of marine primary producers: Implications for competitive interactions under enriched CO2 and nutrient regimes. Oecologia 172, 575–583. doi: 10.1007/s00442-012-2507-5
Frank F., Danger M., Hillebrand H., Striebel M. (2020). Stoichiometric constraints on phytoplankton resource use efficiency in monocultures and mixtures. Limnol. Oceanogr 65, 1734–1746. doi: 10.1002/lno.11415
Gleeson S. K., Tilman D. (1992). Plant allocation and the multiple limitation hypothesis. Am. Nat. 139, 1322–1343. doi: 10.1086/285389
Halvorson H. M., Sperfeld E., Evans-White M. A. (2017). Quantity and quality limit detritivore growth: mechanisms revealed by ecological stoichiometry and co-limitation theory. Ecology 98, 2995–3002. doi: 10.1002/ecy.2026
Harpole W. S., Ngai J. T., Cleland E. E., Seabloom E. W., Borer E. T., Bracken M. E. S., et al. (2011). Nutrient co-limitation of primary producer communities. Ecol. Lett. 14, 852–862. doi: 10.1111/j.1461-0248.2011.01651.x
Hillebrand H., Dürselen C. D., Kirschtel D., Pollingher U., Zohary T. (1999). Biovolume calculation for pelagic and benthic microalgae. J. Phycol 35, 403–424. doi: 10.1046/j.1529-8817.1999.3520403.x
Hillebrand H., Steinert G., Boersma M., Malzahn A., Meunier C. L., Plum C., et al. (2013). Goldman revisited: Faster-growing phytoplankton has lower N: P and lower stoichiometric flexibility. Limnol. Oceanogr 58, 2076–2088. doi: 10.4319/lo.2013.58.6.2076
Huisman J., Codd G. A., Paerl H. W., Ibelings B. W., Verspagen J. M. H., Visser P. M. (2018). Cyanobacterial blooms. Nat. Rev. Microbiol. 16, 471–483. doi: 10.1038/s41579-018-0040-1
Kaspari M., Powers J. S. (2016). Biogeochemistry and geographical ecology: Embracing all twenty-five elements required to build organisms. Am. Nat. 188, S62–S73. doi: 10.1086/687576
Kilham S. S., Kreeger D. A., Lynn S. G., Goulden C. E., Herrera L. (1998). COMBO: A defined freshwater culture medium for algae and zooplankton. Hydrobiologia 377, 147–159. doi: 10.1023/A:1003231628456
Klupar I., Rocha A. V., Rastetter E. B. (2021). Alleviation of nutrient co-limitation induces regime shifts in post-fire community composition and productivity in Arctic tundra. Glob. Change Biol. 27, 3324–3335. doi: 10.1111/gcb.15646
Litchman E., de Tezanos Pinto P., Klausmeier C. A., Thomas M. K., Yoshiyama K. (2010). “Linking traits to species diversity and community structure in phytoplankton,” in Fifty years after the ‘“Homage to Santa Rosalia”’: Old and new paradigms on biodiversity in aquatic ecosystems. (Dordrecht, The Netherlands: Springer). doi: 10.1007/978-90-481-9908-2_3
Litchman E., Klausmeier C. A. (2008). Trait-based community ecology of phytoplankton. Annu. Rev. Ecol. Evol. Syst. 39, 615–639. doi: 10.1146/annurev.ecolsys.39.110707.173549
Litchman E., Klausmeier C. A., Schofield O. M., Falkowski P. G. (2007). The role of functional traits and trade-offs in structuring phytoplankton communities: Scaling from cellular to ecosystem level. Ecol. Lett. 10, 1170–1181. doi: 10.1111/j.1461-0248.2007.01117.x
Ma B., Zhou X., Zhang Q., Qin M., Hu L., Yang K., et al. (2019). How do soil micro-organisms respond to N, P and NP additions? Application of the ecological framework of (co-)limitation by multiple resources. J. Ecol. 107, 2329–2345. doi: 10.1111/1365-2745.13179
Marleau J. N., Guichard F., Loreau M. (2015). Emergence of nutrient co-limitation through movement in stoichiometric meta-ecosystems. Ecol. Lett. 18, 1163–1173. doi: 10.1111/ele.12495
Miner B. G., Sultan S. E., Morgan S. G., Padilla D. K., Relyea R. A. (2005). Ecological consequences of phenotypic plasticity. Trends Ecol. Evol. 20, 685–692. doi: 10.1016/j.tree.2005.08.002
Moore C. M., Mills M. M., Arrigo K. A., Berman-Frank I., Bopp L., Boyd P. W., et al. (2013). Processes and patterns of oceanic nutrient limitation. Nat. Geosci 6, 701–710. doi: 10.1038/ngeo1765
Paris Q. (1992). The von liebig hypothesis. Am. Agric. Econ. Assoc. 74, 1019–1028 doi: 10.2307/1243200
R Core Team (2023). R: A Language and Environment for Statistical Computing (Vienna, Austria: R Foundation for Statistical Computing).
Redfield A. C. (1958). The biological control of chemical factors in the environment. Am. Sci. 46, 205–221. Available at: http://www.jstor.org/stable/27827150.
Redoglio A., Radtke K., Sperfeld E. (2022). How nitrogen and phosphorus supply to nutrient-limited autotroph communities affects herbivore growth: testing stoichiometric and co-limitation theory across trophic levels. Oikos 2022, 1–14. doi: 10.1111/oik.09052
Reinl K. L., Harris T. D., Elfferich I., Coker A., Zhan Q., De Senerpont Domis L. N., et al. (2022). The role of organic nutrients in structuring freshwater phytoplankton communities in a rapidly changing world. Water Res. 219, 118573. doi: 10.1016/j.watres.2022.118573
Reynolds C. S., Huszar V., Kruk C., Naselli-Flores L., Melo S. (2002). Towards a functional classification of the freshwater phytoplankton. J. Plankton Res. 24, 417–428. doi: 10.1093/plankt/24.5.417
Saito M. A., Goepfert T. J., Ritt J. T. (2008). Some thoughts on the concept of colimitation: Three definitions and the importance of bioavailability. Limnol. Oceanogr 53, 276–290. doi: 10.4319/lo.2008.53.1.0276
Sommer U., Charalampous E., Genitsaris S., Moustaka-Gouni M. (2017). Benefits, costs and taxonomic distribution of marine phytoplankton body size. J. Plankton Res. 39, 494–508. doi: 10.1093/plankt/fbw071
Sperfeld E., Martin-Creuzburg D., Wacker A. (2012). Multiple resource limitation theory applied to herbivorous consumers: Liebig’s minimum rule vs. interactive co-limitation. Ecol. Lett. 15, 142–150. doi: 10.1111/j.1461-0248.2011.01719.x
Sperfeld E., Raubenheimer D., Wacker A. (2016). Bridging factorial and gradient concepts of resource co-limitation: Towards a general framework applied to consumers. Ecol. Lett. 19, 201–215. doi: 10.1111/ele.12554
Sperfeld E., Schmidtke A., Gaedke U., Weithoff G. (2010). Productivity, herbivory, and species traits rather than diversity influence invasibility of experimental phytoplankton communities. Oecologia 163, 997–1010. doi: 10.1007/s00442-010-1594-4
Sterner R. W., Elser J. J. (2002). Ecological stoichiometry: the biology of elements from molecules to the biosphere. (Princeton, USA: Princeton Univ. Press).
Sunda W. G., Huntsman S. A. (1995). Cobalt and zinc interreplacement in marine phytoplankton: Biological and geochemical implications. Limnol. Oceanogr 40, 1404–1417. doi: 10.4319/lo.1995.40.8.1404
Tilman D. (1980). Resources: A graphical-mechanistic approach to competition and predation. Am. Nat. 116, 362–393. doi: 10.1086/283633
Tilman D. (1982). Resource Competition and Community Structure (Princeton N.J: University Press). doi: 10.2307/4549
Tokeshi M. (1993). Species abundance patterns and community structure. Adv. Ecol. Res. 24, 111–186. doi: 10.1016/S0065-2504(08)60042-2
Vallina S. M., Follows M. J., Dutkiewicz S., Montoya J. M., Cermeno P., Loreau M. (2014). Global relationship between phytoplankton diversity and productivity in the ocean. Nat. Commun. 5, 1–10. doi: 10.1038/ncomms5299
Von Liebig J. (1840). Die Organische Chemie in ihre Anwendung auf Agricultur und Physiologie. F. Vieweg und Sohn, Braunschweig. (Braunschweig, Germany: F. Vieweg und Sohn)
Wickham H. (2016). ggplot2: Elegant Graphics for Data Analysis. (New York, USA: Springer) doi: 10.1007/978-3-319-24277-4
Wirtz K. W., Kerimoglu O. (2016). Autotrophic stoichiometry emerging from optimality and variable co-limitation. Front. Ecol. Evol. 4. doi: 10.3389/fevo.2016.00131
Keywords: co-limitation, phosphorus, nitrogen, community, experimental microcosms, autotroph, phytoplankton
Citation: Redoglio A and Sperfeld E (2024) What drives growth responses of nitrogen and phosphorus (co-)limited primary producer communities? Front. Ecol. Evol. 12:1368445. doi: 10.3389/fevo.2024.1368445
Received: 10 January 2024; Accepted: 10 April 2024;
Published: 25 April 2024.
Edited by:
Ford Ballantyne, University of Georgia, United StatesReviewed by:
Kohei Yoshiyama, University of Shiga Prefecture, JapanCopyright © 2024 Redoglio and Sperfeld. This is an open-access article distributed under the terms of the Creative Commons Attribution License (CC BY). The use, distribution or reproduction in other forums is permitted, provided the original author(s) and the copyright owner(s) are credited and that the original publication in this journal is cited, in accordance with accepted academic practice. No use, distribution or reproduction is permitted which does not comply with these terms.
*Correspondence: Andrea Redoglio, cmVkb2dsaW9hbmRyZWFAZ21haWwuY29t
Disclaimer: All claims expressed in this article are solely those of the authors and do not necessarily represent those of their affiliated organizations, or those of the publisher, the editors and the reviewers. Any product that may be evaluated in this article or claim that may be made by its manufacturer is not guaranteed or endorsed by the publisher.
Research integrity at Frontiers
Learn more about the work of our research integrity team to safeguard the quality of each article we publish.