 He Zhang
 Chonghan Yu
 Zhenglong Jiang*
 Xuqian Zhao
- School of Ocean Sciences, China University of Geosciences, Beijing, China
Background: Calcareous nannofossils are minute microfossils widely present in marine strata. Their identification holds significant value in studies related to stratigraphic dating, paleo-environmental evolution, and paleoclimate reconstruction. However, the process of identifying these fossils is time consuming, and the discrepancies between the results obtained from different manual identification methods are substantial, hindering quantification efforts. Therefore, it is necessary to explore automated assisted identification of fossil species. This study mainly focused on 18 key fossil species from the Miocene era. Five convolutional neural network (CNN) models and 10 data augmentation techniques were compared. These models and techniques were employed to analyze and collectively train two- and three-dimensional fossil morphologies and structures obtained from three different fossils observed under single-polarized light microscopy, orthogonal polarized light microscopy, and scanning electron microscopy. Finally, the model performance was evaluated based on the predictive outcomes on the test set, using metrics such as confusion matrix and top-k accuracy.
Result: The results indicate that, for the calcareous nannofossil images, the most effective data augmentation approach is a combination of four methods: random rotation, random mirroring, random brightness, and gamma correction. Among the CNN models, DenseNet121 exhibits the optimal performance, achieving an identification accuracy of 94.56%. Moreover, this model can distinguish other fossils beyond the 18 key fossil species and non-fossil debris. Based on the confusion matrix, the evaluation results reveal that the model has strong generalization capability and outputs highly credible identification results.
Conclusion: Drawing on the identification results from CNN, this study asserts a robust correlation among extinction photographs, planar images, and stereoscopic morphological images of fossil species. Collective training facilitates the joint extraction and analysis of fossil features under different imaging methods. CNN demonstrates many advantages in the identification of calcareous nannofossils, offering convenience to researchers in various fields, such as stratigraphy, paleo-ecology, paleoclimate, and paleo-environments of ancient oceans. It has great potential for advancing the development of marine surveys and stratigraphic recognition processes in the future.
1 Introduction
Calcareous nannofossils are microfossils composed primarily of calcium carbonate that formed during geological history. They originate from calcium-rich planktonic microorganisms and have been widespread in marine strata since the Jurassic period. Owing to their extensive distribution and rapid evolution, these nannofossils serve as an important basis for establishing fossil age frameworks and finely delineating stratigraphic sequences (Perch-Nielsen, 1985). Specifically, the calcareous nannofossil zones are primarily marked by the first and last appearance data of their key fossil species. In 1836, German microbiologist C. G. Ehrenberg made the pioneering discovery of calcareous nannofossils (Ehrenberg, 1836). Since then, vast collections of fossil samples have been accumulated, particularly through advancements such as petroleum exploration and ocean drilling. However, whether using optical or electron microscopy, the identification process remains heavily reliant on the skills of experienced paleontologists. Novices in paleontological identification must invest significant time and effort to a rigorous learning process, encompassing extensive memorization and repetitive identification exercises, to thoroughly comprehend the essentials of fossil identification. This directly impacts the pace and depth of research progress (Hao et al., 1989). To overcome these challenges, Dollfus and Beaufort (1999) developed a structured system named SYRACO2 using artificial neural networks (ANN). They conducted classification training on 13 types of calcareous nannofossils, each type containing 100 images from a single source, and achieved an 86% training accuracy. Subsequently, Beaufort and Dollfus (2004) employed an ANN with three convolutional layers to classify 11 types of calcareous nannofossils from the Pleistocene epoch. This version, trained on more than 150 images per species from a single image source, achieved a classification accuracy of 96%. However, the traditional ANN described above contains only three sequentially connected convolutional layers and one fully connected layer, which has a limited generalization capability and is unable to summarize and distinguish complex features. When the test image contains multiple imaging modalities or the image source is complex, that is, the color, sharpness, size, scale, and other parameters of the images vary greatly, the identification accuracy of such models decreases significantly. Meanwhile, challenges such as the widespread inferior preservation of fossils predating the Pleistocene epoch persist. Consequently, predecessors mostly utilized Pleistocene fossils as the training set and rarely studied older fossil images. Moreover, sediments sometimes contain redeposited fossil species and non-fossil debris that morphologically resemble fossils, making it difficult for existing identification systems to distinguish these components.
Convolutional neural networks (CNNs) leverage multiple layers of neural networks to automatically learn and synthesize complex data features. As an important application of deep learning in the visual domain, CNNs employ convolution and pooling operations to progressively abstract image features, enabling the model to comprehend visual information at various levels. This facilitates the resolution of multiclassification tasks for intricate images (Krizhevsky et al., 2012). Various network structures, training strategies, and optimization methods have been extensively validated in the fields of general object recognition and medical imaging for lesion detection and organ tissue classification (Prechelt, 1998; Kingma and Ba, 2014; Szegedy et al., 2015; He et al., 2016; Huang et al., 2017; Shu et al., 2020; Su et al., 2021). It is now possible to handle more challenging multiclassification tasks across complex and imbalanced data sources. In the field of machine vision, He et al. (2016) proposed the residual network (ResNet) model, trained on datasets such as ImageNet and MS-COCO, while Huang et al. (2017) introduced the DenseNet model, trained on datasets such as CIFAR and ImageNet. Following the principles of transfer learning, the model weights pretrained on these large datasets can be used to enhance the model’s ability to generalize common features and significantly accelerate training speeds (Zhuang et al., 2020). Nevertheless, in the field of calcareous nannofossils, no attempt has been made to employ these state-of-the-art techniques to automatically learn biological features from images captured under three different microscopes and then uniformly identify them.
To assist researcher in making quick judgements about calcareous nannofossil species and improve identification efficiency, this study proposed a new method for image-based identification of key fossil species within the Miocene Calcareous Nannofossil Zone. Following the latest fossil zone division scheme of Backman et al. (2012), we selected 18 key fossil species in the Miocene fossil zone.
Comparative experiment was conducted with five models, data cleaning was employed to address noisy and anomalous data, and 10 data augmentation techniques were combined to strengthen the models for extracting fossil features from the images. The objectives of this research are as follows: (1) to develop a new image identification method (assisted identification of calcareous nannofossils, abbreviated as AICN) and accomplish fossil species identification of calcareous nannofossil images; (2) to select optimal data augmentation techniques and determine the best model and parameters for deep CNN; (3) to rapidly output identification results, assisting researchers in improving identification efficiency; and (4) to identify and remove other fossil species beyond the 18 key fossil species and non-fossil debris.
2 Materials and methods
2.1 Data collection
This study selected 18 species of key fossils from the Miocene Calcareous Nannofossil Zone (Backman et al., 2012). The 18 species correspond to the following species (Appendix A): (1) Amaurolithus primus, (2) Calcidiscus premacintyrei, (3) Catinaster coalitus, (4) Ceratolithus acutus, (5) Discoaster berggrenii, (6) Discoaster hamatus, (7) Discoaster kugleri, (8) Discoaster quinqueramus, (9) Discoaster signus, (10) Helicosphaera carteri, (11) Helicosphaera euphratis, (12) Nicklithus amplificus, (13) Reticulofenestra pseudoumbilicus, (14) Sphenolithus belemnos, (15) Sphenolithus delphix, (16) Sphenolithus disbelemnos, (17) Sphenolithus heteromorphus, and (18) Triquetrorhabdulus carinatus. These are the key fossil of CNM1–20 during Aquitatanian to Messinian stages in Miocene (23–5.36 Ma) (Backman et al., 2012), corresponding to fossil zones NN1-NN12 (Martini and Worsley, 1971) and CN1c-CN10a (Okada and Bukry, 1980). These 18 fossil species have totally 1859 images, in which 618 were captured under single-polarized light microscopy, 1013 under orthogonal polarized light microscopy, and 228 through scanning electron microscopy (Figure 1). The images were obtained from the Nannotax3 database on the official website of the International Nannoplankton Association (Young et al., 2022); 143 online articles retrieved from Science Citation Index and China National Knowledge Infrastructure (Appendix B); and a collection of original images we captured during previous experiments.
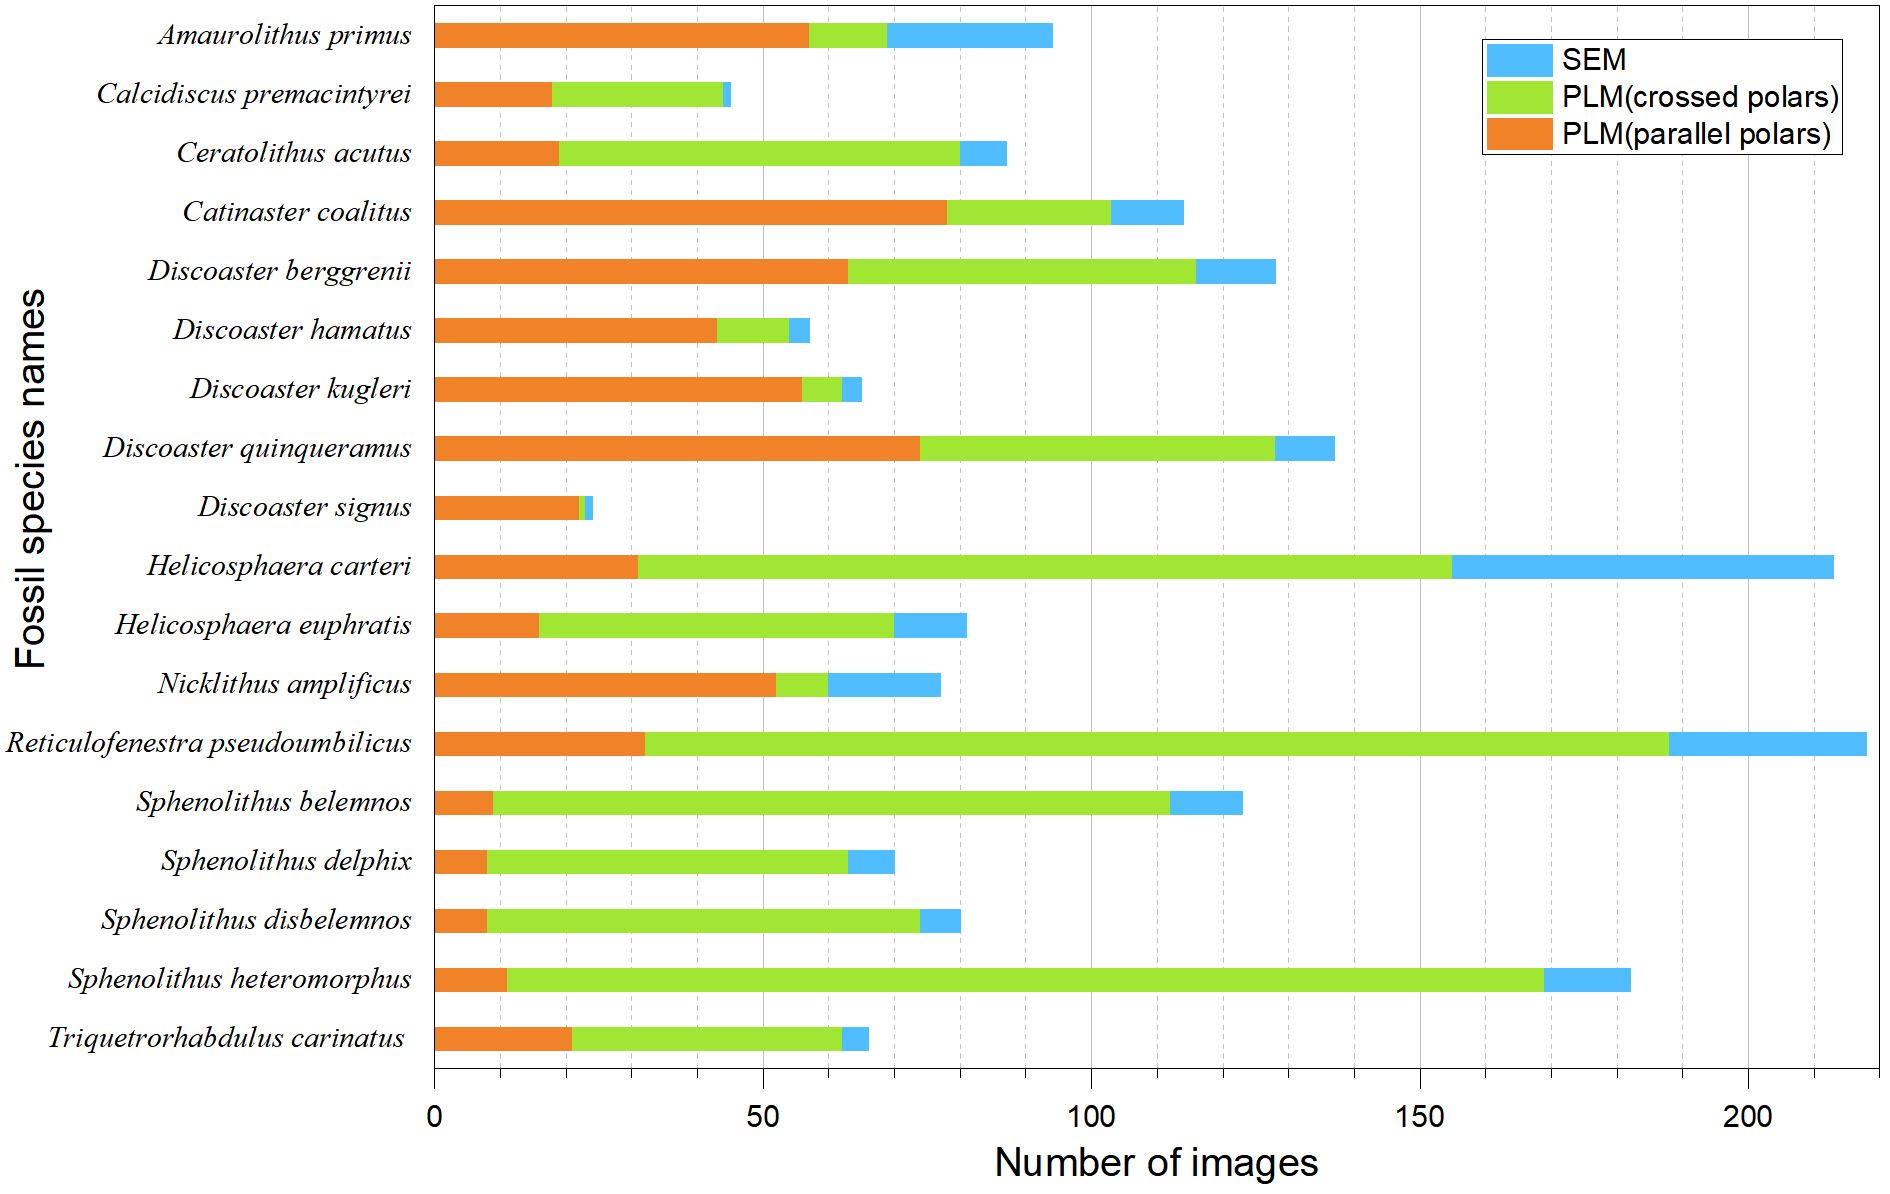
Figure 1 Bar diagram showing the number of PLM (parallel polars), PLM (crossed polars), and SEM images in each species.
This study used the graphical features of calcareous nannofossils under all three microscopes, which correspond to their fossil morphology, and thus the logic of distinguishing fossil species based on morphology, to perform collective training on the three microscope images. The strong domain generalization capabilities of CNNs combined with data augmentation facilitate the extraction and analysis of common features of fossils using different imaging modalities (Otalora et al., 2019; Zhou et al., 2023). For a description of the morphology of each species, see the Farinacci catalog pages (Young et al., 2022), and for image examples, see de Kaenel and Villa (1996), Young (1998), Salomon (1999), Fernando et al. (2007), Bergen et al. (2017), Blair et al. (2017), Boesiger et al. (2017), de Kaenel et al. (2017), and Young et al. (2017).
2.2 Data preprocessing
2.2.1 Data cleaning
The original images underwent data cleaning (Ridzuan and Zainon, 2019) to eliminate noise, anomalies, and incomplete data arising from instrument deviation, human entry errors, and various other factors. Incorrectly labeled and low-quality images difficult to identify were excluded. For instance, in Figure 2, image (A) should represent Helicosphaera euphratis but was erroneously labeled as Sphenolithus disbelemnos (Figure 2B) in the article associated with that image (Sant et al., 2019). Corrections were also made to the species of image (A). Image (C)–(D) were of extremely poor quality, hampering the identification of key features. In addition, image (E) displayed blurry features, making it indistinguishable from Sphenolithus disbelemnos, Sphenolithus delphix, Sphenolithus heteromorphus, and Sphenolithus belemnos. Consequently, images (C)–(E) were excluded from training to prevent model result confusion.
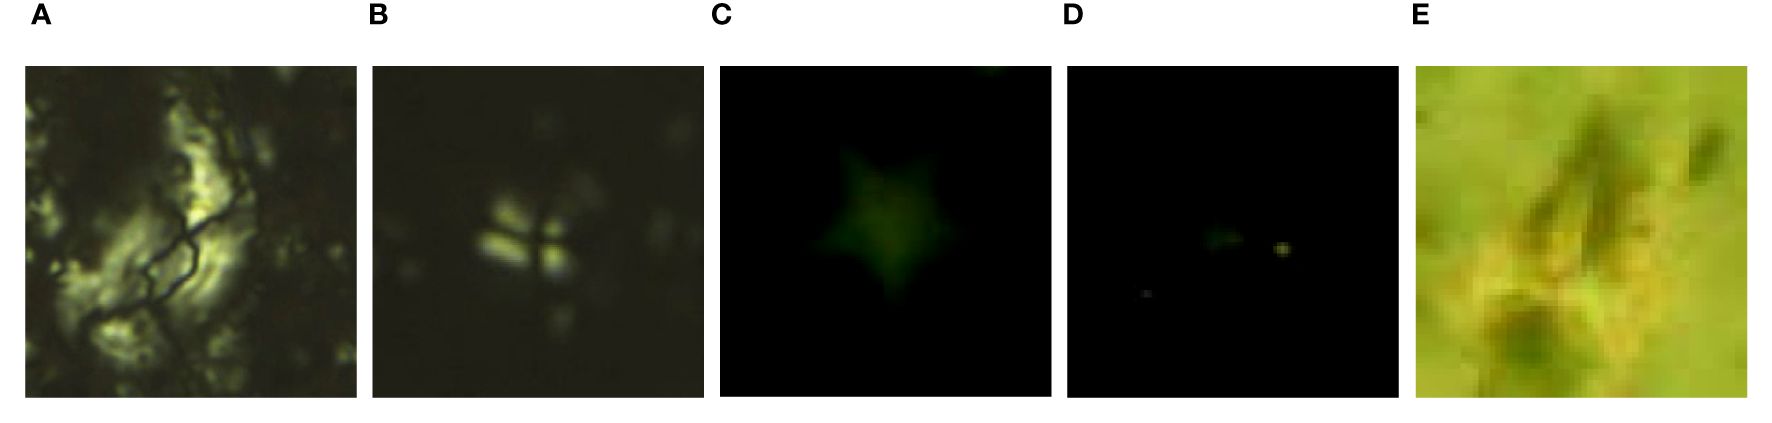
Figure 2 Mislabeled images and low-quality images that are difficult to recognize. (A) Helicosphaera euphratis Haq, 1966 (Sant et al., 2019); (B) Sphenolithus disbelemnos Fornaciari and Rio, 1996 (Sant et al., 2019); (C, D) Low-quality images (Ola, 2018); (E) Illegible image (Ola, 2018).
2.2.2 Data augmentation
Before augmentation, approximately 15% of the images were randomly extracted from each species as the validation set. Another 15% were designated as the test set, and the remaining 70% were allocated as the training set (Figure 3). The training set was utilized for model training. The validation set was employed for model fine-tuning and selection, as well as screening of augmentation methods and their combinations. The test set was reserved for evaluating the performance and generalizability of the final model.
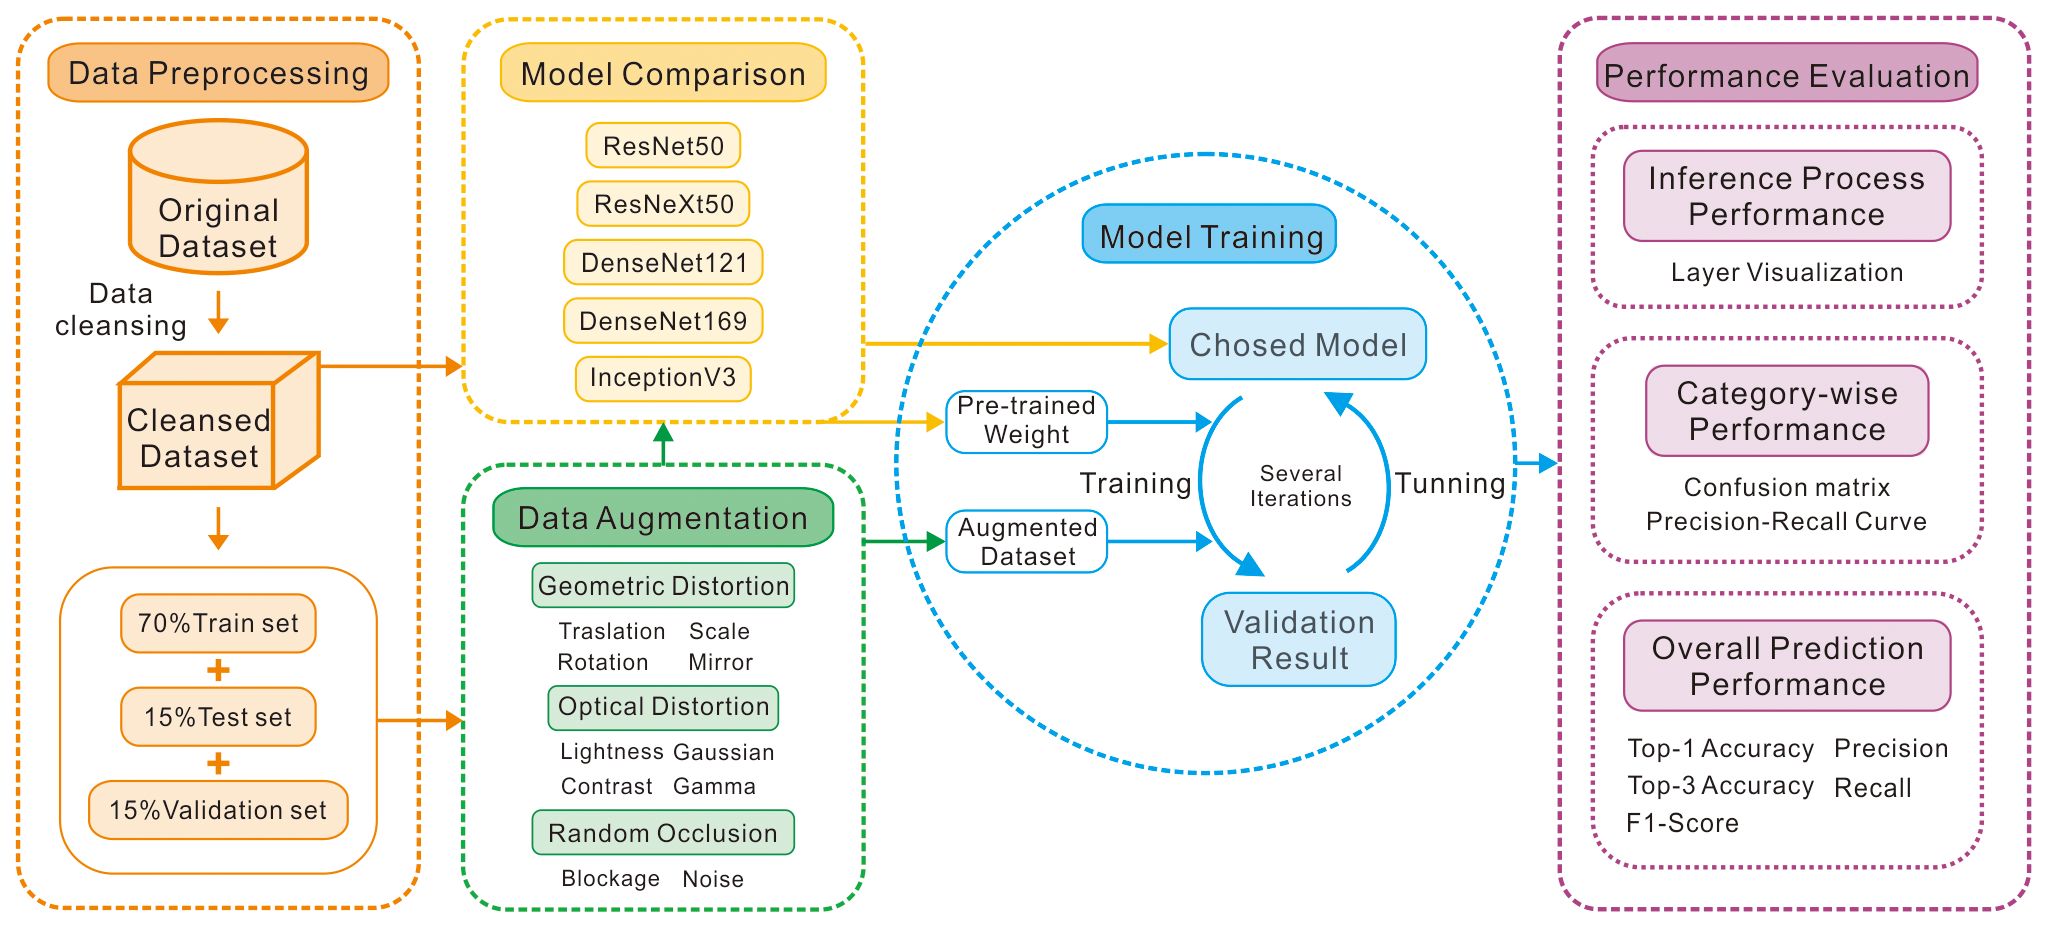
Figure 3 Workflow diagram of the proposed model for calcareous nannoplankton classification.
This study performed data augmentation on the training set, resulting in a sample count of 12,351 images using the following methodology. First, the original images were transformed into square images by background filling. Second, 10 singular data augmentation techniques were applied to the training set images, namely, random translation, random rotation, random scaling, mirroring, random brightness, random contrast (Yang et al., 2022), gamma correction (Zhou et al., 2019), Gaussian blur (Rusak et al., 2020), random masking (Zhong et al., 2020), and salt-and-pepper noise (Veerakumar et al., 2009). These processes generated 10 new training set. Each new set, combined with the original training set, was trained, verified on the validation set, and evaluated for accuracy. To ensure comparable training results across different augmentation methods and mitigate model performance fluctuations due to floating-point precision variations and random optimization strategies during the training process (Zhang et al., 2022), identical random seeds were employed for training, leveraging the determinism mechanism of TensorFlow. Third, the data augmentation methods that significantly improved the model performance from the initial step were selected and combined to augment the training set images. The augmented training set was superimposed onto the original training set, followed by training, verification, and accuracy comparison. The training process employed the same CNN model and validation set. The results were compared when the validation set loss converged to a near-optimal value.
2.3 Model training
The data preprocessing was performed locally using the OpenCV, while the TensorFlow-based CNN model was deployed on the Google Colab platform. An NVIDIA T4 graphics processing unit powered the entire training process.
Given the diverse morphological features, similarity among fossils within the same genus and strong correlation among extinction images, planar images, and stereoscopic morphological images of fossil species, we need a strong model to distinguish species differences and collective training for common features under different imaging modalities. This study selected five CNN models with strong feature induction capabilities, adept at capturing multiscale morphological features: ResNet50 (He et al., 2016), ResNeXt50 (Xie et al., 2017), DenseNet121, DenseNet169 (Huang et al., 2017), and InceptionV3 (Szegedy et al., 2015). Specifically, each model was trained using the following steps: First, to solve the species imbalance, weighting coefficients were introduced into the loss function based on the number of images for each species (Cui et al., 2019), adjusting the model’s focus on different species. Hyperparameters related to the model structure, such as the convolutional kernel size, number of convolution kernels, pooling kernel size, and pooling method, were set following the models’ default configurations (Szegedy et al., 2015; He et al., 2016; Huang et al., 2017; Xie et al., 2017). Adjustable hyperparameters, such as activation function type, optimizer type, learning rate, and batch size, remained consistent, following the principle of the controlled variables method (Bressem et al., 2020). Pre-training techniques were used to initialize the parameters. By leveraging pre-training with pretrained weights from the CIFAR and ImageNet datasets (Huang et al., 2017), the model began with an optimized parameter space, resulting in accelerated convergence and improved identification accuracy. After comparative experiment, the model with the highest validation accuracy was selected. Second, the best model and data augmentation strategy determined in the previous steps underwent repeated training. Various measures were adopted to improve model accuracy while preventing overfitting (Ying, 2019), such as adjusting the hyperparameters (Yu and Zhu, 2020), exploring different optimization algorithms (Ruder, 2016), and applying various regularization techniques (Cortes et al., 2012). Third, the trained model was executed on the test set to evaluate the final model’s accuracy. Additionally, the optimal model and data augmentation approach were utilized to train images captured solely under orthogonally polarized light microscopy, enabling comparison with models trained on images from multiple sources.
2.4 Model evaluation
Based on the model predictions on the test set, a confusion matrix was constructed (Duntsch and Gediga, 2019) to display the distribution of predicted results across different calcareous nannofossil species and the correlation of correct and incorrect predictions. In the matrix, the rows and columns indicate the actual and predicted species of calcareous nannofossils, respectively. To comprehensively evaluate the model performance with species imbalance, precision and recall were calculated, along with their harmonic mean F1-score (Sokolova et al., 2006), effectively reflecting the model performance across different calcareous nannofossil species. Furthermore, top-k accuracy was employed to obtain the k species with the highest confidence in the model prediction for a specific image. The multiple predictions and their confidence levels were analyzed comprehensively (Petersen et al., 2022). This approach objectively assessed the model’s genuine generalizability while assisting researchers in judging inter-species similarities based on similar confidence levels. In addition, to further understand how the model extracted features and derived inference results, five representative layers, including the first convolutional layer and the last convolutional layer of the four DenseBlocks, were visualized (Zeiler and Fergus, 2014) to summarize the model’s reasoning process.
3 Results
3.1 Results of model comparison
This study conducted training and validation on five models, that is, ResNet50, ResNeXt50, DenseNet121, DenseNet169, and InceptionV3, using the same training and validation sets. The top-1 accuracy and F1-score of these models on the validation set are depicted in Figure 4A. The results indicate that ResNet50 and InceptionV3 yielded comparatively lower performance with accuracies of only 73.96% and 75.26%, respectively, and correspondingly lower F1-scores of 74.41% and 75.93%. ResNeXt50 exhibited an accuracy of 76.56%, surpassing ResNet50, and achieved an F1-score of 76.56%, even outperforming InceptionV3. The DenseNet series showed the highest accuracy, reaching 79.95% and 78.65%. Their F1-scores reached 81.02% and 79.56%. DenseNet169 demonstrated a lower accuracy than DenseNet121 on the validation set. Overall, DenseNet121 attained the optimal performance without encountering overfitting, exhibiting an accuracy of 79.95%. Therefore, DenseNet121 was selected as the foundational model for training in the subsequent experiments.
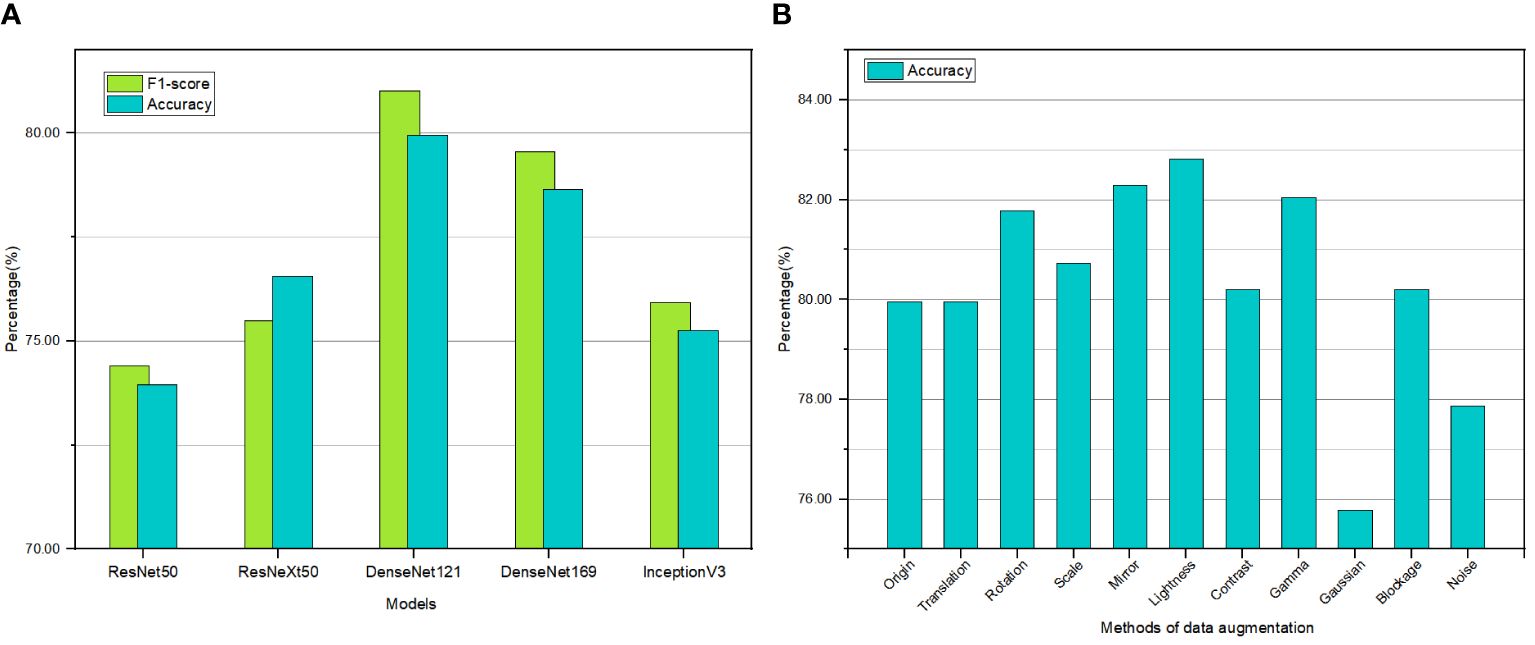
Figure 4 Histogram showing the percentage of accuracy and F1-score for different models (A) and data augmentation methods (B).
3.2 Results of data augmentation
Drawing upon the morphological, structural, and frequency domain features of the Miocene calcareous nannofossil images, this study evaluated 10 data augmentation methods. Comparative experiments were conducted under the same network model and training strategy, and the results are shown in Figure 4B. The original training set achieved an accuracy of 79.95%. The training sets augmented by random noise and Gaussian blur suffered a decline in model performance, yielding accuracies of 77.86% and 75.78%, respectively. In contrast, the training sets augmented by random translation, random masking, and random contrast attained model accuracies of 79.95%, 80.21%, and 80.21%, respectively, nearly identical to the training results of the original data. Thus, these data augmentation techniques did not improve or degrade the model performance. Regarding the test set augmented by random scaling, the model achieved an accuracy of 80.73%, a marginal improvement of less than 1%. Models employing random rotation, random mirroring, random brightness, and gamma correction obtained accuracies of 81.77%, 82.29%, 82.81%, and 82.03%, respectively. The performance of these four models was significantly improved compared to that of the original data. Therefore, these four augmentation methods were chosen as the primary strategies for preprocessing the training set images.
To expand the diversity of the training set images and enhance the overall generalization ability of the model, this study employed combined training approaches using the four data augmentation techniques that substantially improved the model performance (Cubuk et al., 2019). The combined training results are listed in Table 1. The experimental results show that employing a combination of two data augmentation techniques improved the average model accuracy, increasing it from 82.23% (achieved with a single data augmentation technique) to 84.03%. Furthermore, using three data augmentation techniques led to a slight increase in the average model accuracy, reaching 84.44%. It can be observed that, by applying the combination of random rotation, random mirroring, random brightness, and gamma correction, the model accuracy reached the highest level of 85.68%. Consequently, the combined application of multiple data augmentation techniques effectively enhanced the performance of CNN models in identifying Miocene calcareous nannofossil images, leading to improved accuracy. Based on these results, the training set underwent data augmentation, achieving a species balanced sample count of 12,351 images (Figure 5).
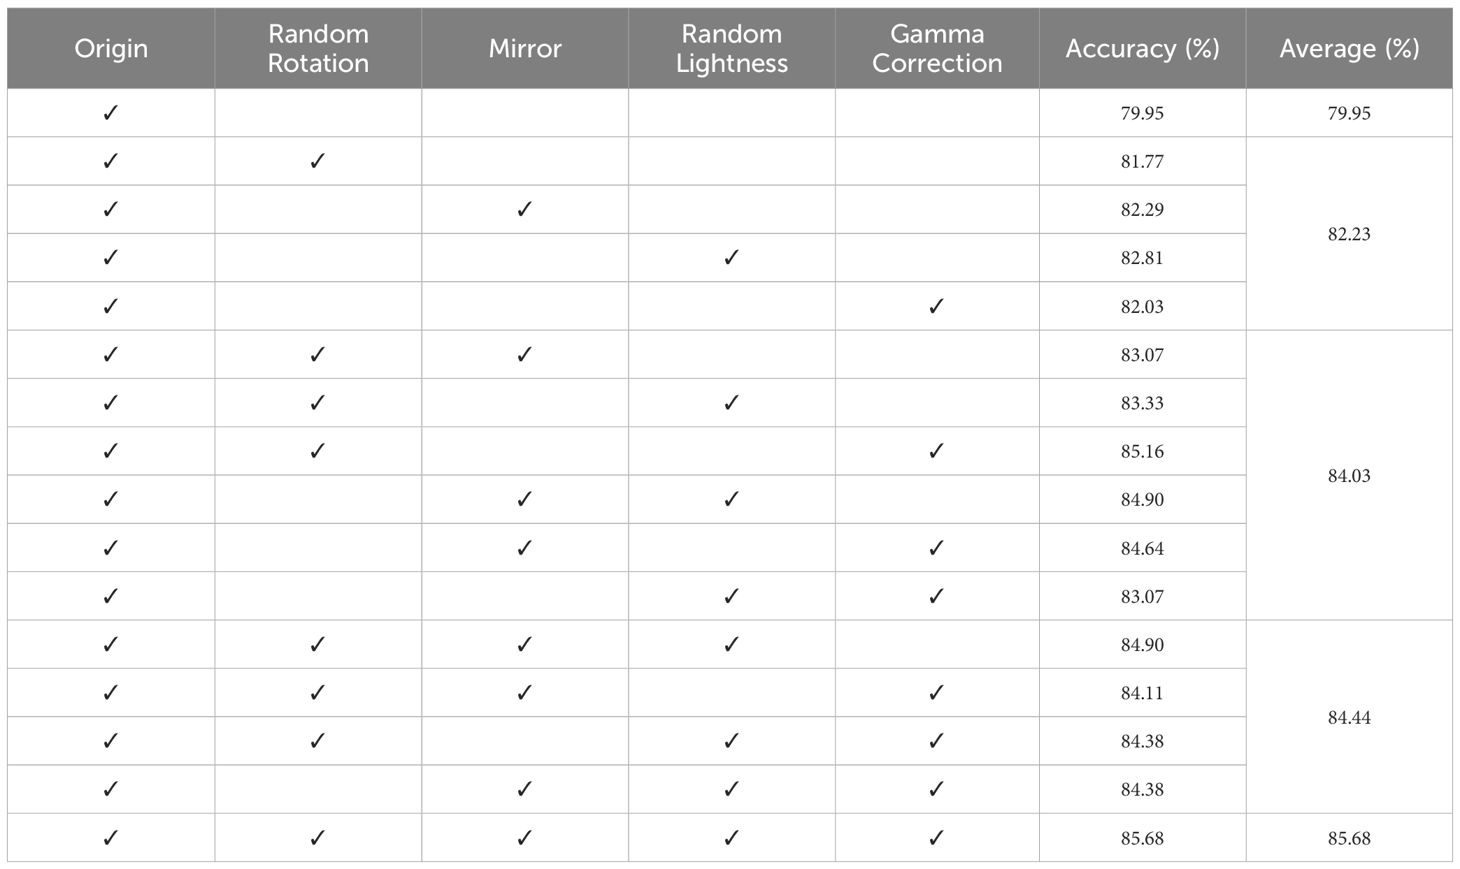
Table 1 Training results of data augmentation methods and combinations.

Figure 5 Histogram showing the number of each species of images before and after data augmentation.
3.3 Training results of the final model
The model trained solely on the original training set using the basic DenseNet121 yielded an accuracy of only 79.95%. However, after species balance was achieved using the various data augmentation techniques, the model accuracy reached 85.68%. Eventually, this study employed a solution that combines the four data augmentation techniques on the original training set, expanding the training sample count to 12,351, and trained the DenseNet121 model on the augmented training set. During the training process, the Adam optimization algorithm with adaptive learning rates was adopted, along with L2 regularization, which effectively suppressed overfitting. After multiple rounds of parameter tuning and training, the model attained promising results. The top-1 accuracy stood at 94.56% while the top-3 accuracy reached 98.71%. Simultaneously, the study conducted training on sufficient Miocene calcareous nannofossil images obtained exclusively through orthogonal polarized light microscopy, resulting in a top-1 accuracy of 95.73%, an F1-score of 95.73%, and a top-3 accuracy of 98.78%.
To better display the model performance across different species of Miocene calcareous nannofossils, this study utilized a confusion matrix (Figure 6) to assess the test results of the final model on the test set. Figure 6 displays the true calcareous nannofossil species on the vertical axis and the predicted species on the horizontal axis. When the predicted species matches with the actual species, the corresponding statistical results are distributed along the diagonal, indicating correct classification. The values outside the diagonal represent the quantity of misclassified samples. The final experimental results indicated that the vast majority of the predicted species matched closely with the true species. Only a few species were predicted incorrectly. For instance, considering Ceratolithus acutus, 33 samples were predicted and indeed belonged to this species, resulting in a 100.00% precision. However, three samples were mistakenly classified as Nicklithus amplificus and Sphenolithus heteromorphus, leading to a recall of 91.67%. Moreover, all 52 samples of Sphenolithus belemnos were accurately categorized, achieving a 100.00% recall. Nevertheless, five samples were incorrectly classified as Sphenolithus belemnos, with the true species being Catinaster coalitus and Sphenolithus delphix, resulting in a precision of 91.23%. Precision denotes the accuracy of predictions, indicating the proportion of correctly predicted samples among all samples predicted as positive. In contrast, recall signifies the comprehensiveness of predictions, representing the proportion of correctly predicted samples among the actual positive samples. In this study, the desired model should be both accurate and comprehensive in prediction, which means that the two parameters are of equal importance. Therefore, their harmonic mean, F1-score, is a concise and potent evaluation metric. In the test set, calcareous nannofossil images of different species differed significantly in sample count, yet possessed equal importance. Thus, the macro F1-score was utilized to effectively assess the comprehensive performance of each model across different species. The final value of this metric reached 94.62%.
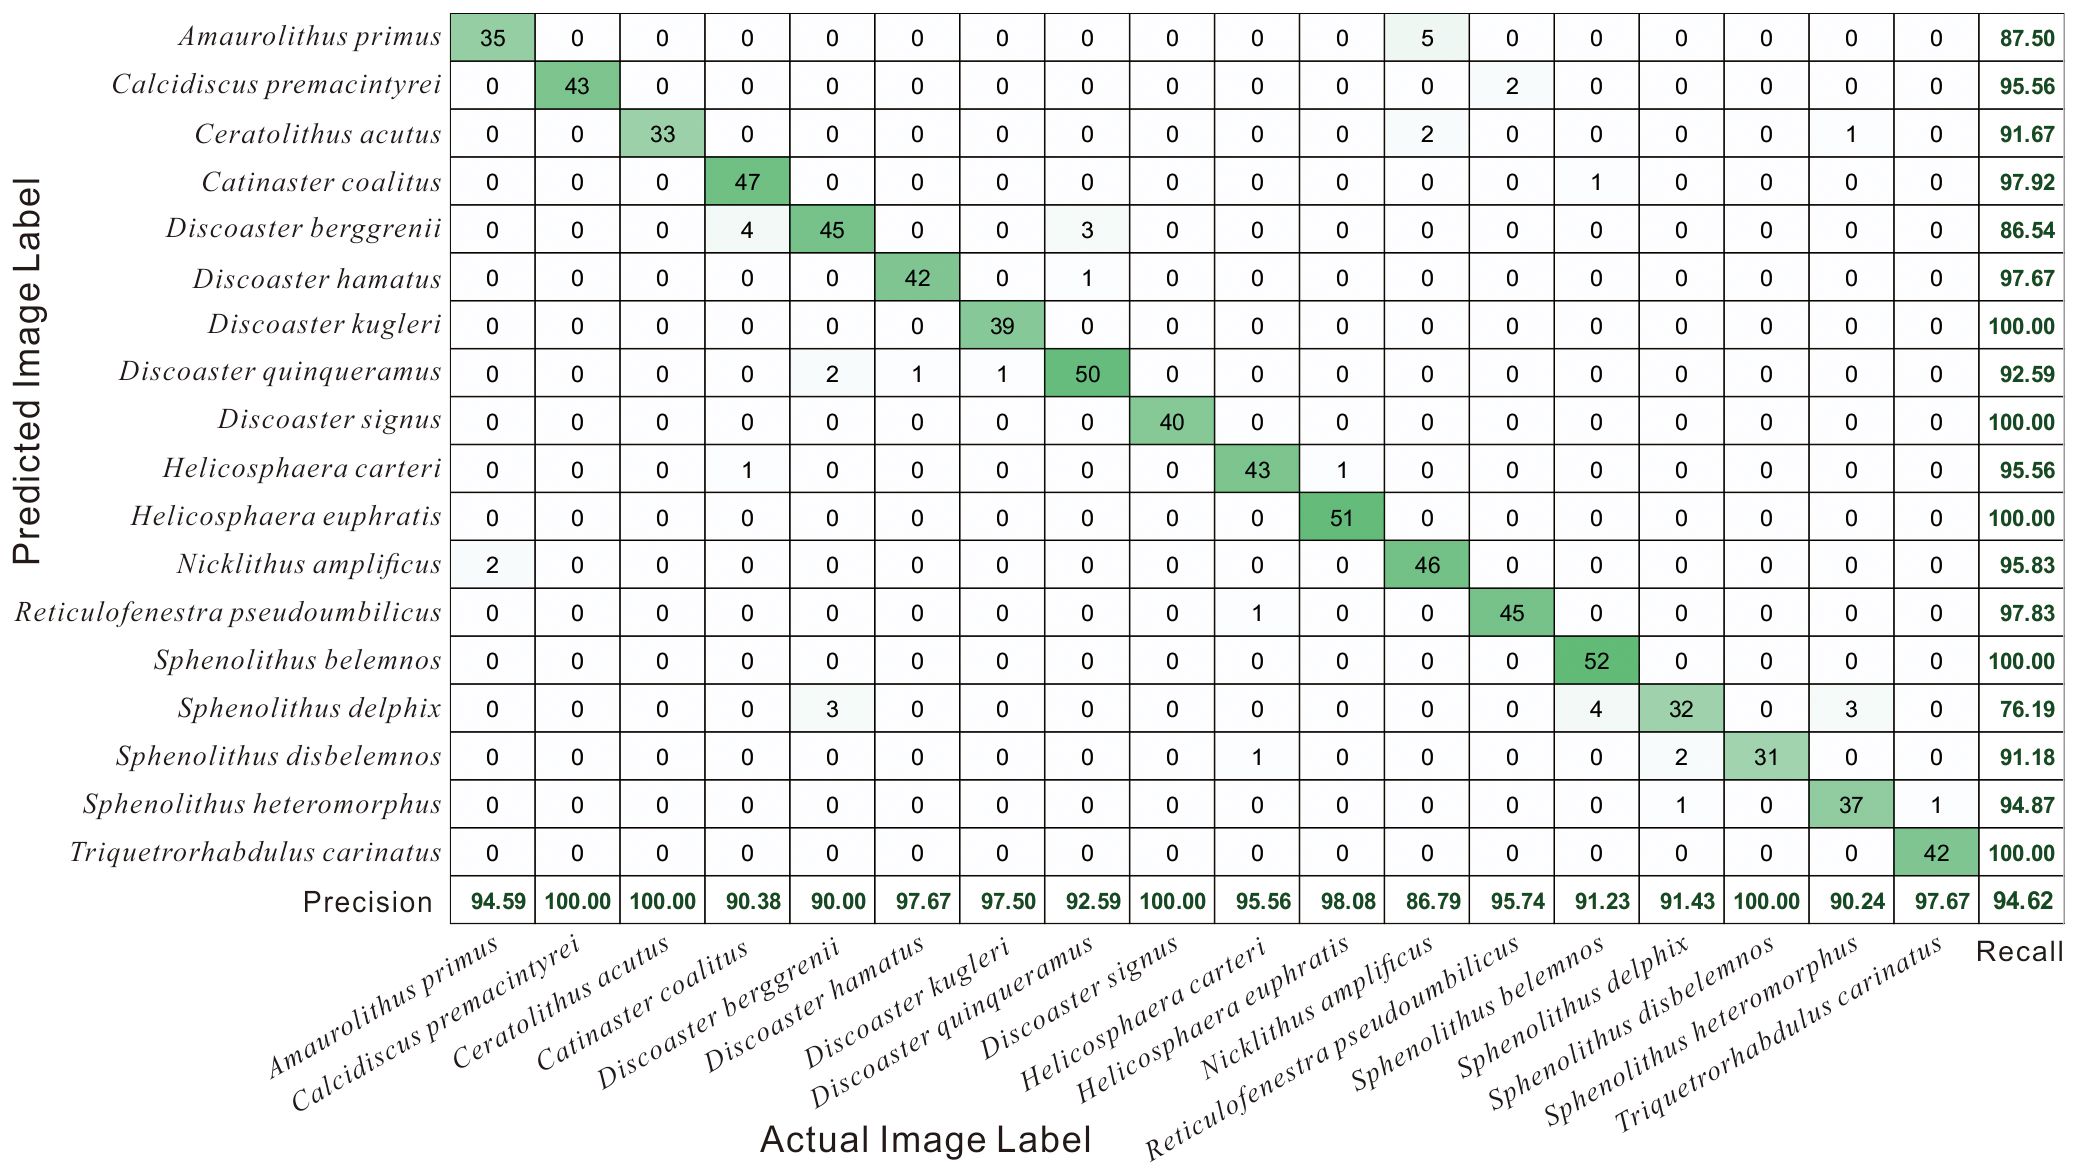
Figure 6 Confusion Matrix for the test images classified by DenseNet121 model. Diagonal values represent correct predictions, and off-diagonal values represent incorrect predictions. Accuracy of the model is in the lower righthand corner.
4 Discussion
4.1 Selection of optimal model based on existing key fossil species of Miocene calcareous nannofossils
This study employed five CNN models with strong morphological feature abstraction capabilities to identify the morphological features of calcareous nannofossils in images obtained under orthogonal polarized light microscopy, single-polarized light microscopy, and scanning electron microscopy. Using the training set and default parameters, with enabled determinism mechanism of TensorFlow, we obtained accuracies ranging between 73.96% and 79.95%. All five models demonstrated remarkable generalization abilities in identifying the images of calcareous nannofossils.
Among them, DenseNet stood out as the top performer. Its dense block structure facilitated feature reuse, enhancing the network’s ability to extract features in tasks involving images rich in fine-grained details. This is particularly advantageous in the classification of detailed calcareous nannofossil images. DenseNet, initially proposed by Huang et al. (2017), achieved an accuracy of 79.20% on the general object dataset ImageNet (Deng et al., 2009). Subsequently, Zhang et al. (2018) applied DenseNet to medical image analysis and proposed an advanced sparse-view computed tomography reconstruction algorithm, which improved structural reconstruction similarity by 18% and reduced root mean square error by 42%. Wang et al. (2020) applied DenseNet in geographic remote sensing to identify water bodies and their boundaries in remote sensing images. DenseNet obviously outperformed models such as ResNet, VGG, and SegNet. Their experiment revealed that DenseNet121 and DenseNet169, having structurally similar architectures but differing in the number of layers, achieved validation set accuracies of 79.95% and 78.65%, respectively. These accuracies greatly surpassed those of ResNet50, ResNeXt50, and InceptionV3. Notably, despite having more layers and parameters, DenseNet169 did not perform better. It attained a test result of 78.65% on the validation set, which is much lower than the model with fewer layers and parameters (DenseNet121). It can be observed that, when dealing with relatively limited datasets, complex models with numerous parameters cannot acquire sufficient information and thus face difficulties in deriving effective features from such datasets. This reduces the generalization capability and accuracy of these models (Hu et al., 2021).
ResNet introduces residual blocks that significantly enhance deep architecture by learning residual mapping. This model has shown outstanding performance in various domains such as general object recognition and medical image analysis (Shu et al., 2020; Su et al., 2021). However, in comparative model experiments, ResNet50 exhibited relatively poorer performance. Its accuracy was only 73.96%, markedly inferior to DenseNet121. This could be attributed to DenseNet’s dense connection structure, which captures feature correlations more effectively in calcareous nannofossil images compared to the residual connections in ResNet. Inception operates with multiple filters of various sizes in parallel, adept at capturing information at different scales. However, in the task of classifying calcareous nannofossil images, this model performed moderately with an accuracy of 75.26%. This could be due to the insufficient size differences of fossils, as well as the inherent scale invariance of convolution operations. ResNeXt incorporates the concept of cardinality, which significantly enhances the model’s ability for nonlinear transforms by setting up multiple branches with similar topologies within each residual block. In this study, this model obtained an accuracy of 76.56%, slightly superior to Inception.
Despite the excellent design of these three models, their accuracy was inferior to that of DenseNet121. This can be attributed to differences in network structure and model complexity (Goodfellow et al., 2016). First, from a network structure perspective, the unique DenseBlock architecture in DenseNet enables each layer to receive inputs from all preceding layers within DenseBlock. This dense interconnectivity enhances feature propagation and facilitates cross-layer feature reuse, thereby improving discrimination capability (Huang et al., 2017). In contrast, alternative models lack these structures. Second, the model complexity is typically characterized by the size or number of trainable parameters. Five CNN models from the TensorFlow library were employed: ResNet50, ResNeXt50, DenseNet121, DenseNet169, and InceptionV3. Their respective numbers of trainable parameters are 25.5 million, 24.9 million, 7.99 million, 14.1 million, and 23.8 million. DenseNet121 has the smallest number of trainable parameters. In deep learning, under consistent experimental conditions, models with larger parameter scales require larger datasets, are more prone to overfitting, and demonstrate a weaker generalization ability for unseen data (Srinivasan et al., 2021). Given the limited sample size of the calcareous nannofossil used in this study, DenseNet121, with relatively fewer parameters, provides a better chance of achieving the desired performance than its counterparts. Moreover, during the collection of calcareous nannofossil image data, multiple factors, including significant differences in magnification ratios, shooting parameters, and varying image quantities among different species, contributed to noise and anomalous data within the original data. All these factors can affect the actual predictive results of neural network models.
To illustrate the reasoning process of the model more effectively, this study provides a visualization (Figure 7). Figures 7A–E show five distinct convolutional layers, each representing various stages of the reasoning process. In these visualizations, the color gradient from dark green to light yellow corresponds to neuron values ranging from zero to one. Using Helicosphaera euphratis as an example, the original image was processed in the DenseNet121 model. Initially, a convolutional layer with 64 filters generated 64 feature maps (Goodfellow et al., 2016), as illustrated in Figure 7A. Subsequently, the pooling layer reduces the feature map size by half for compression. The output feature maps then undergo 12 consecutive convolutional operations, with the results added to the initial inputs of the subsequent three groups of 12 convolutional operations (Huang et al., 2017). This sequence of 48 convolutional operations produced 128 feature maps, as shown in Figure 7B. This network architecture, termed DenseBlock, is connected by transition layers composed of convolutional and pooling layers, facilitating a reduction in the feature map size and further compression of information. This process was repeated three times, as shown in Figures 7C–E, and 1024 feature maps were obtained, as shown in Figure 7E. Subsequently, in the global average pooling operation, each feature map is compressed to a single value, resulting in a 1024-dimensional output vector for this layer. The next dense layer, that is, the fully connected layer, further compressed these 1024 feature values into the 18 categories expected from the model’s output. Following normalization, each value ranged from zero to one, with the sum of the 18 values totaling one. In Figure 7, the highest value corresponds to the 11th category, indicating that the model predicted the image as Helicosphaera euphratis. Moreover, a dropout at the end of the model prevents overfitting by randomly deactivating certain neurons (Srivastava et al., 2014).
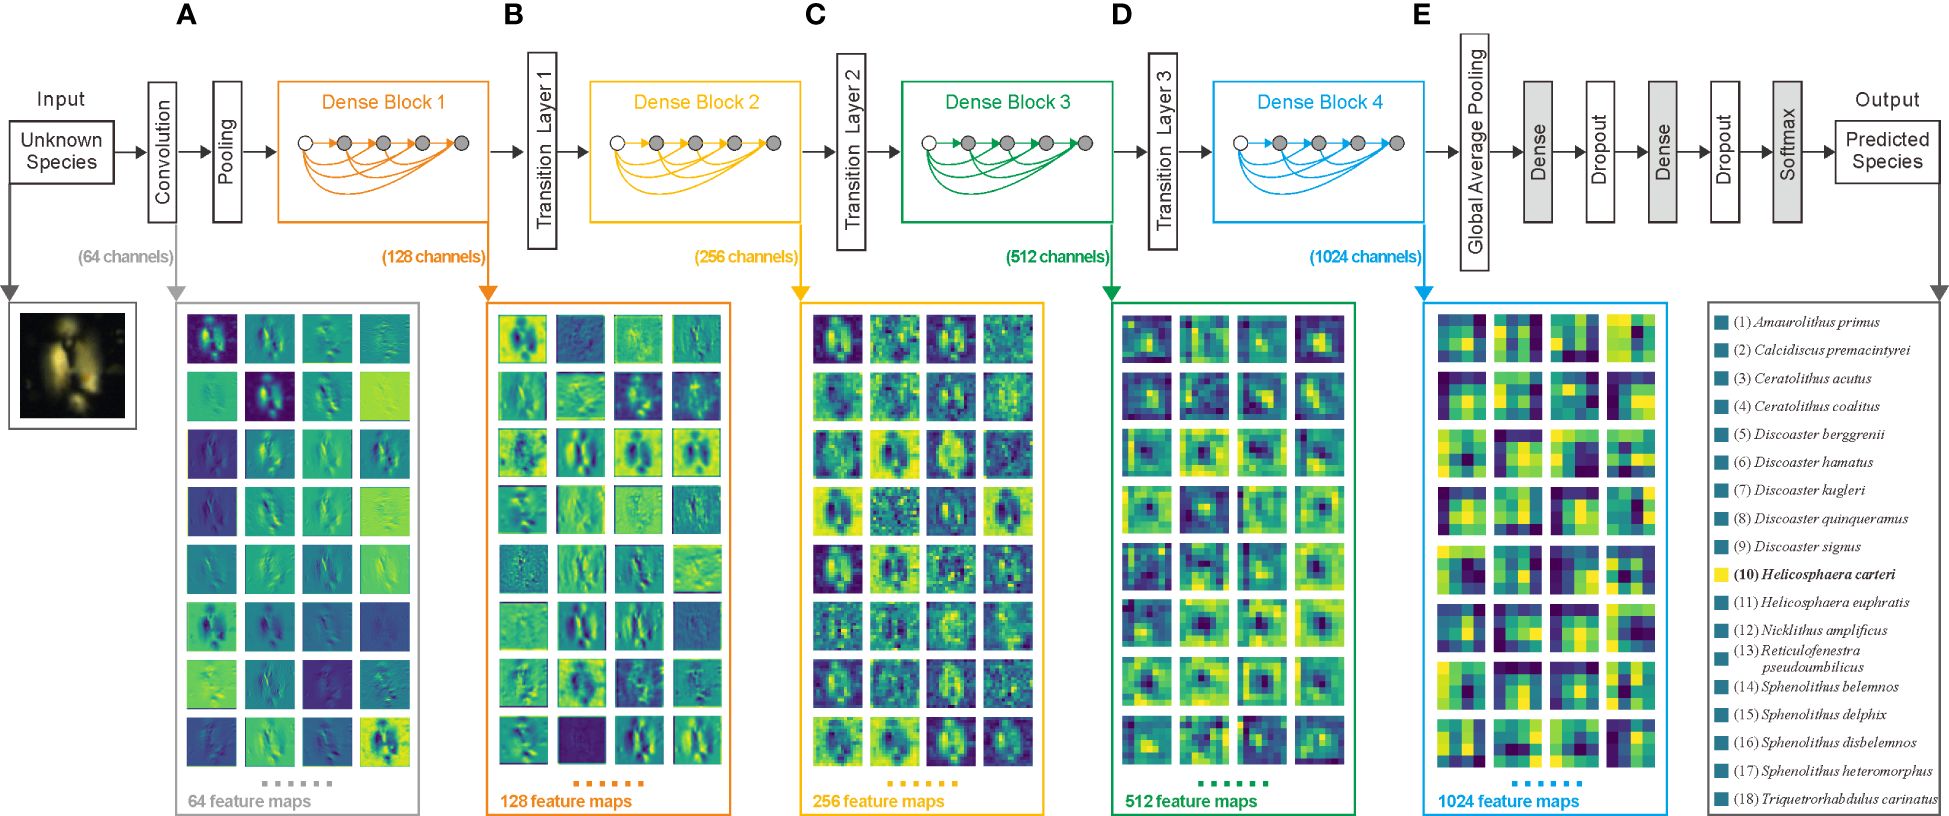
Figure 7 Model architecture and layer visualization of DenseNet121. The example original image is Helicosphaera carteri. (A) Output of the first convolution layer; (B) Output of the first DenseBlock; (C) Output of the second DenseBlock; (D) Output of the third DenseBlock; (E) Output of the fourth DenseBlock.
Through a visual comparison of the four sets of feature maps shown in Figure 7, it is apparent that different convolutional kernels emphasize various image details (Goodfellow et al., 2016). As the depth of the convolutional operations increases, the feature map representations transition from concrete to abstract (Zhang and Zhu, 2018), progressively encoding the image into a numerical form.
4.2 Comparison and selection of data augmentation methods
The training set in this study faces several challenges, such as a limited number of samples, an imbalanced distribution of species, and substantial scene variations. This study conducted comparative experiments on 10 data augmentation methods. The experimental results showed that the combination of random rotation, random mirroring, random brightness, and gamma correction provided the most significant enhancement in model accuracy.
Random rotation augmented the model’s ability to induce rotational invariance in fossil features, improving the accuracy by 1.82%. As fossil orientations vary considerably in images of calcareous nannofossils, random rotation allows the model to overlook these differences and focus on key features distinguishing fossil species. Random mirroring enhances the model’s understanding of fossil image morphology, boosting the accuracy by 2.34%. Mirror transforms of fossil images simulate different preservation states of fossils in thin sections, allowing the model to disregard these variations and better learn calcareous nannofossil morphology. Overall, random rotation and random mirroring achieved significant performance improvements. Although typical CNN filters are not affected by rotation or mirroring when handling basic features, their ability to generalize complex features is clearly insufficient. To address this limitation, early-stage data augmentation is necessary. Compared to the original image (Figure 8A), random brightness (Figures 8B, C) strengthened the model’s capability to extract features under different lighting conditions, resulting in a 2.86% accuracy improvement. The images in this study were obtained from various publications by researchers from different institutions. The technical parameters vary with the acquisition equipment and collection processes. These variations cause significant brightness disparities in calcareous nannofossil images. Random brightness linearly alters pixel values, expanding the distribution of the image data. Gamma correction, a nonlinear transform, boosted the accuracy by 2.08%. As shown in Figure 8D, gamma correction highlighted the image details, providing the model with more valuable information for training. Ultimately, the combined use of random rotation, random mirroring, random brightness, and gamma correction attained the highest relative model accuracy at 85.68%. Previous studies have also employed a combination of various data augmentation methods. For instance, Taylor and Nitschke (2018) conducted systematic benchmark testing on multiple data augmentation methods, indicating that methods such as random rotation and random mirroring significantly enhance the overall accuracy of CNN models. Cubuk et al. (2019) proposed an automatic data augmentation method, revealing that the synergy of multiple data augmentation methods usually improves model performance. This is particularly true for datasets with limited samples. Appropriate data augmentation could expand the dataset from multiple aspects, enhancing training sample diversity.
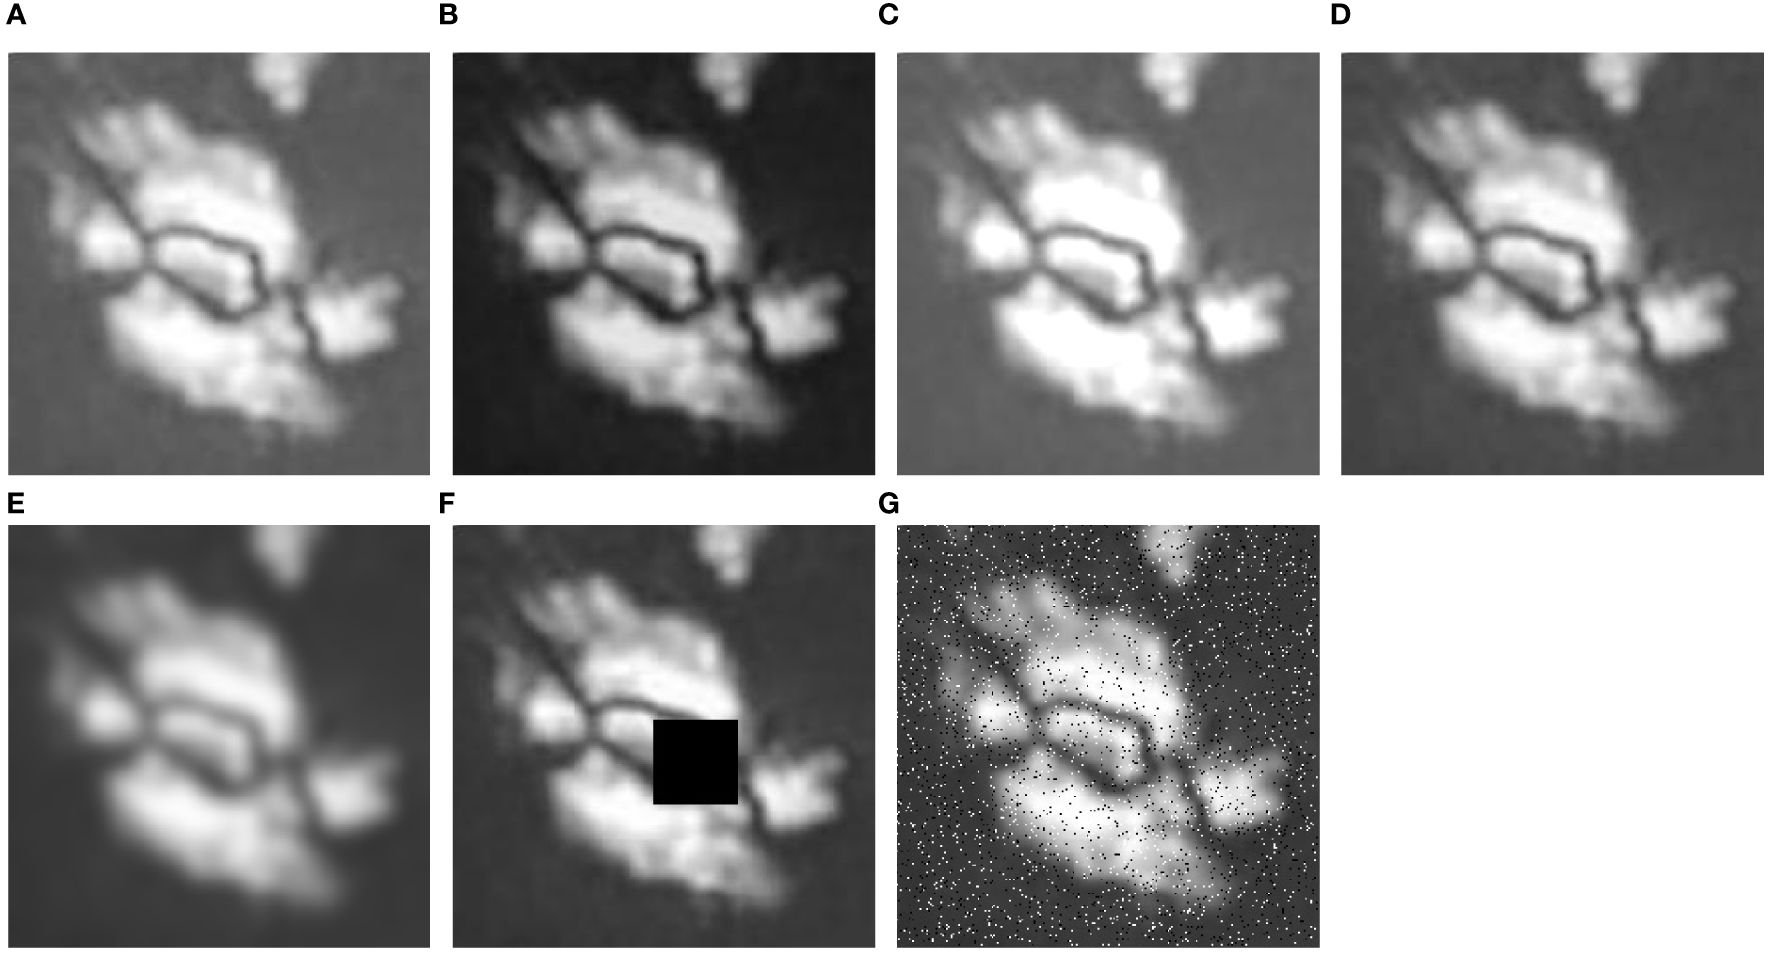
Figure 8 Comparison of multiple data augment methods for images: take Helicosphaera euphratis as an example. (A) Original image (Senemari and Jalili, 2021); (B) Reduce lightness; (C) Enhance lightness; (D) Gamma correction; (E) Gaussian blur; (F) Random blockage (Black block: pixel values are set to 0, used as blockage); (G) Pepper-salt noise.
Niu (2021) categorized these 10 data augmentation methods into three types: geometric distortion (random translation, random rotation, random scaling, and mirroring), optical distortion (random brightness, random contrast, gamma correction, and Gaussian blur), and random occlusion (random masking and salt-and-pepper noise). The validation set is sensitive to geometric distortion and optical distortion augmentation methods while being insensitive to random occlusion methods.
In the geometric distortion type, our training results indicate sensitivity toward random rotation and random mirroring, and insignificant effects of random translation and random scaling. The ineffectiveness of random translation is attributed to convolution operations that extract features by sliding filters over images. Therefore, CNN can detect corresponding features despite slight shifts in fossil patterns. Random scaling offers negligible model enhancement, because the down-sampling of multiple convolutional and pooling layers inherently possesses a degree of scale invariance. As most images have minor differences in proportions, the reliance on large-scale invariance is minimal.
Regarding the optical distortion type, our training results indicate sensitivity toward random brightness and gamma correction, insignificant effects of random contrast, and a negative impact from Gaussian blur. Random contrast essentially performs a linear transform similar to convolutional operations, resulting in nearly zero improvement in model performance. After Gaussian blur processing (Figure 8E), a significant decrease in model accuracy occurred, probably because many images already had insufficient clarity. Gaussian blur further diminished more detailed information, outweighing the benefits of noise reduction.
In the random occlusion type, the primary focus is enhancing the model’s robustness and avoiding overreliance on local information. Our training results indicate insensitivity toward both random masking and salt-and-pepper noise. The core concept of our method stems from dropout. The activation values of certain neurons are reduced to zero with a probability to lower the network model’s overreliance on certain neurons, thereby shifting attention to overall fossil structure features. Calcareous nannofossil images commonly contain noise signals, local occlusions, local blurriness, and fragmentation. Therefore, this study tentatively compared random masking and salt-and-pepper noise (Figures 8F, G). The two augmentation methods led to a 0.26% increase and a 2.08% decrease in accuracy, respectively, failing to achieve the expected performance improvement. By analyzing the image distribution, it was found that these images do not have issues such as fragmentation or occlusion. Images of the same fossil were collected from multiple publications. However, different publications reported different imaging scenarios and considered a limited image sample size. As a result, random masking and salt-and-pepper noise erased the already few features of the original data, worsening the model generalization. This shows that when the sample size is relatively small, random occlusion does not contribute to the model performance. However, for other domains with large datasets, random occlusion may still serve as an effective data augmentation method.
In summary, data augmentation techniques can mimic rotations, mirroring, and brightness variations encountered in the identification of calcareous nannofossils, effectively enhancing identification accuracy. For the validation set, the combination of random rotation, random mirroring, random brightness, and gamma correction achieved the highest relative model accuracy, increasing it by 5.73%. Despite the laborious collection of images from established published databases, books, and journals, the sample size remained limited, restricting the efficacy of data augmentation techniques. To improve the effectiveness of model training in the future, it is necessary to further collect Miocene sediment and add microscopic images to the training set.
4.3 Confusion matrix and the morphological causes
Based on the confusion matrix for the test images classified by the DenseNet121 model (Figure 6), 11 calcareous nannofossil species had a recall in the range of 95–100%, four genera had a recall in the range of 90–95%, and three genera had a recall of less than 90%. This represents a very good assessment of the majority of calcareous nannofossil species using the DenseNet121 model in this study, which is consistent with the model providing a macro F1-score of 94.62%. Species with a recall of 90–95% are Ceratolithus acutus, Discoaster quinqueramus, Sphenolithus disbelemnos, and Sphenolithus heteromorphus. The species with a recall lower than 90% were Amaurolithus primus, Discoaster berggrenii, and Sphenolithus delphix.
This low recall value represents an error in the discrimination of calcareous nannofossil species caused by morphological similarities between species. The species with the lowest recall was Sphenolithus delphix with a recall of 76.19%. 32 Sphenolithus delphix were correctly identified, four were incorrectly identified as Sphenolithus belemnos, three were incorrectly identified as Discoaster berggrenii, and three were incorrectly identified as Sphenolithus heteromorphus. Sphenolithus delphix is a conical discoasterid with a concave base and composed of a mass of elements radiating from a common origin. The apical spine and two basal spines of Sphenolithus delphix are slender and elongated, resulting in a triradiate outline. The remaining spines were small and compact. Under cross-polarized light, the apical spine was prominent and the basal spines were faint at 90° and 270°. The reverse was true at 0° and 180°. The fact that the genus Sphenolithus has a common conical discoasterid with a concave base and apical spine, as well as the differences in the images presented by Sphenolithus delphix at different extinction angles, contributed to the low identification rate of this species. The species with the second-lowest recognition rate was Discoaster berggrenii, with a recall rate of 86.54%. About 45 Discoaster berggrenii were correctly identified, four were incorrectly identified as Catinaster coalitus and three were incorrectly identified as Discoaster quinqueramus. Discoidal discoasteralids are formed from a single, non-birefringent cycle in the plan view. Radiate nanoliths of Discoaster with each ray. Radiate nanoliths of Discoaster with each ray formed from a discrete crystal unit. Catinaster is characterized by forked ray tips, which form a basket-like structure. Catinaster is characterized by bifurcated ray tips, which form a basket-like structure. However, both Discoaster and Catinaster are Discoasteraceae, with radially symmetric nanoliths that cause morphological confusion. The species with the third-lowest recognition rate was Amaurolithus primus, with a recognition rate of 87.50%. About 35 Amaurolithus primus were correctly identified and five were incorrectly identified as Nicklithus amplificus. Both Nicklithus and Amaurolithus belong to the Ceratolithaceae family and both have horseshoe-shaped nanoliths and simple hoop-shaped nanoliths, causing morphological confusion. However, Nicklithus has a straight left arm with knots, and the model does not judge this detail well.
The remaining four calcareous nannofossil species with recall values in the 90–95% range were as follows: 33 Ceratolithus acutus were correctly identified, two were incorrectly identified as Nicklithus amplificus, and one was incorrectly identified as Sphenolithus heteromorphus. Approximately 50 Discoaster quinqueramus were correctly identified, two were incorrectly identified as Discoaster berggrenii, one was incorrectly identified as Discoaster hamatus, and one was incorrectly identified as Discoaster kugleri. About 31 Sphenolithus disbelemnos were correctly identified, two were incorrectly identified as Sphenolithus delphix and one was incorrectly identified as Helicosphaera carteri. 37 Sphenolithus heteromorphus was correctly identified, one was incorrectly identified as Sphenolithus delphix, and one was incorrectly identified as Triquetrorhabdulus carinatus. Many of the questions above address species similar to those in the previous section; overall, the models are more likely to make errors in judging species when they have morphological similarities, which often arise from their evolutionary significance.
This result demonstrates the potential of the DenseNet121 convolutional neural network model for studying the evolutionary relationships of calcareous nannofossils. Adaime used neural networks to develop an explicit phylogenetic toolkit for analyzing the overall shape, internal structure, and texture of pollen grains (Adaime et al., 2023). This study shows that the phylogenetic history encoded in pollen morphology can be detected using neural networks. This is similar to what is shown in the confusion matrix used in the present study.
4.4 Identification of other classes
During the identification of the calcareous nannofossils, there were numerous other unidentifiable fossil species, older redeposited fossils, and non-fossil fragments. With these practical considerations, this study specially created ‘other’ classes to include all other fragments, excluding the 18 calcareous nannofossil species, images exclusively from the real world. The model must first be able to distinguish between other classes and known species and then identify species within the 18 known species. In this study, the rectified linear unit (ReLU) was used as the activation function for the last layer of DenseNet121 (Agarap, 2018). Following the methods of Vareto et al. (2017) and Mahdavi and Carvalho (2021), an initial classification of known species/other classes was conducted on images fed into the model.
Statistical analysis was performed on the model’s inference results for the test set of known species and images of other classes. The results revealed that the distribution of output activation values for the known species had a mean of 7.4985 and a variance of 2.0115, whereas the distribution for the unknown classes had a mean of 4.6388 and a variance of 2.5488. Based on these distribution differences, a decision threshold was set to distinguish other types outside the key fossil species of the Miocene Calcareous Nannofossil Zone. According to the calculation results, when the threshold was set to 5.3, the model achieved the highest accuracy in differentiating between known and other class images, reaching 84.14%. When the activation value was greater than 7.9, the species was deemed as a key fossil species of the Miocene Calcareous Nannofossil Zone. Then, the species identification of the image could be further completed using sigmoid as the activation function of the final output layer (Han and Moraga, 1995). For images with activation values between 5.3 and 7.9, the model may have ambiguity while predicting for this data segment. If images with activation values greater than 5.3 are categorized as known species, there could be a misclassification rate of 9.09%.
Owing to the efficient network structure of DenseNet121 and powerful computation capabilities of NVIDIA T4, the image identification speed was approximately 138 images per second, significantly higher than the testing speed in the works of researchers such as Dollfus and Beaufort (1999).
Currently, AICN has achieved good discriminatory ability for identifying 18 key fossil species of the Miocene Calcareous Nannofossil Zone and clearly distinguished debris outside these 18 species. However, the images of calcareous nannofossils faces multiple issues, including an inadequate sample size, an unbalanced distribution of image quantities across different species, and disparities in image quantities under different microscopes. In the future, the limited sample size issue can be addressed by continuously capturing fossil images to establish a larger and more complete fossil library, coupled with data augmentation techniques.
In terms of model identification capabilities, four data augmentation methods, namely, random rotation, random mirroring, random brightness, and gamma correction, were combined and applied to the DenseNet121 CNN model. This approach achieved an individual species identification accuracy of nearly 95%. However, the discrimination accuracy for the other classes only reached 84.14%. To enhance the model’s discrimination capabilities for other classes, more sophisticated methods, such as ensemble learning, active learning, and model uncertainty evaluation like Bayesian deep learning, can be explored. In the actual division of stratigraphic fossil zones, individual fossil identification is only the initial step. The delineation of fossil zones requires consideration of the first and last appearance data of fossil profiles. To expedite and enhance the fossil identification process, future efforts should focus on developing robust detection models capable of automatically scanning and recognizing entire thin sections.
5 Conclusions
Based on this research, the following results and insights were obtained:
(1) A novel CNN-based automated assisted identification method (AICN) was developed to classify 18 key fossil species in the Miocene Calcareous Nannofossil Zone using images acquired under orthogonally polarized, single-polarized, and scanning electron microscopy.
(2) This study evaluated ten data enhancement methods and found that a combination of random rotation, random mirroring, random brightness, and gamma correction was the most effective way to improve recognition efficiency.
(3) By leveraging the DenseNet121 model, AICN achieved an impressive identification accuracy of 94.56% for 18 key fossil species in the Miocene Calcareous Nannofossil Zone at a speed of over 138 images per second, effectively assisting researchers in fossil identification.
(4) The model emulated real-world data, first being able to distinguish between 18 known species and all other fragments in other classes, and second being able to identify species within the 18 known species.
Data availability statement
The raw data supporting the conclusions of this article will be made available by the authors, without undue reservation.
Author contributions
HZ: Conceptualization, Data curation, Formal analysis, Methodology, Resources, Software, Validation, Visualization, Writing – original draft, Writing – review & editing. CY: Formal analysis, Investigation, Resources, Writing – original draft, Writing – review & editing. ZJ: Conceptualization, Funding acquisition, Project administration, Supervision, Writing – review & editing. XZ: Data curation, Writing – review & editing.
Funding
The author(s) declare that no financial support was received for the research, authorship, and/or publication of this article.
Acknowledgments
We deeply appreciate Jeremy Young and the International Nannoplankton Association for generously providing some of the image data that supported this study. We are very grateful to Zhuo Niu, who provided technical guidance for the success of this project. We also thank the reviewers and editors for their valuable suggestions for the improvement of the manuscript.
Conflict of interest
The authors declare that the research was conducted in the absence of any commercial or financial relationships that could be construed as a potential conflict of interest.
Publisher’s note
All claims expressed in this article are solely those of the authors and do not necessarily represent those of their affiliated organizations, or those of the publisher, the editors and the reviewers. Any product that may be evaluated in this article, or claim that may be made by its manufacturer, is not guaranteed or endorsed by the publisher.
References
Adaime M.-E., Kong S., Punyasena S. W. (2023). Deep learning approaches to the phylogenetic placement of extinct pollen morphotypes. PNAS. Nexus. 3, 1–13. doi: 10.1101/2023.07.09.545296
Agarap A. F. (2018). Deep learning using rectified linear units (relu). arXiv. preprint. arXiv:1803.08375.
Backman J., Raffi I., Rio D., Fornaciari E., Palike H. (2012). Biozonation and biochronology of Miocene through Pleistocene calcareous nannofossils from low and middle latitudes. Newsl. Stratigr. 45, 221–244. doi: 10.1127/0078–0421/2012/0022
Beaufort L., Dollfus D. (2004). Automatic recognition of coccoliths by dynamical neural networks. Mar. Micropaleontol. 28, 57–73. doi: 10.1016/j.marmicro.2003.09.003
Bergen J. A., de Kaenel E., Blair S. A., Boesiger T. M., Browning E. (2017). Oligocene-Pliocene taxonomy and stratigraphy of the genus Sphenolithus in the circum North Atlantic Basin: Gulf of Mexico and ODP Leg 154. J. Nannoplankton. Res. 37, 77–112. doi: 10.58998/jnr2016
Blair S. A., Bergen J. A., de Kaenel E., Browning E., Boesiger T. M. (2017). Upper Miocene-Lower Pliocene taxonomy and stratigraphy in the circum North Atlantic Basin: radiation and extinction of Amauroliths, Ceratoliths and the D.quinqueramus lineage. J. Nannoplankton. Res. 37, 113–144. doi: 10.58998/jnr2018
Boesiger T. M., de Kaenel E., Bergen J. A., Browning E., Blair S. A. (2017). Oligocene to Pleistocene taxonomy and stratigraphy of the genus Helicosphaera and other placolith taxa in the circum North Atlantic Basin. J. Nannoplankton. Res. 37, 145–175. doi: 10.58998/jnr2021
Bressem K. K., Adams L. C., Erxleben C., Hamm B., Niehues S. M., Vahldiek J. L. (2020). Comparing different deep learning architectures for classification of chest radiographs. Sci. Rep. 10, 13590. doi: 10.1038/s41598–020-70479-z
Cortes C., Mohri M., Rostamizadeh A. (2012). L2 regularization for learning kernels. arXiv. preprint. arXiv:1205.2653.
Cubuk E. D., Zoph B., Mane D., Vasudevan V., Le Q. V. (2019). “Autoaugment: Learning augmentation strategies from data,” in 2019 IEEE/CVF conference on computer vision and pattern recognition (CVPR 2019). Ed. O’Conner L. (IEEE Computer Society, Long Beach, California), 113–123. doi: 10.1109/CVPR.2019.00020
Cui Y., Jia M., Lin T., Song Y., Belongie S. (2019). “Class-balanced Loss Based on Effective Number of Samples,” in 2019 IEEE/CVF Conference on Computer Vision and Pattern Recognition (CVPR 2019). Ed. O’Conner L. (IEEE Computer Society, Long Beach, California), 9260–9269. doi: 10.1109/CVPR.2019.00949
de Kaenel E., Villa G. (1996). Oligocene-Miocene calcareous nannofossil biostratigraphy and paleoecology from the Iberian Abyssal Plain. Proc. Ocean. Drill. Program Sci. Results. 149, 79–145. doi: 10.2973/odp.proc.sr.149.208.1996
de Kaenel E., Bergen J. A., Browning E., Blair S. A., Boesiger T. M. (2017). Uppermost Oligocene to Middle Discoaster and Catinaster taxonomy and stratigraphy in the circum North Atlantic Basin: Gulf of Mexico and ODP Leg 154. J. Nannoplankton. Res. 37, 215–244. doi: 10.58998/jnr2077
Deng J., Dong W., Socher R., Li L., Li K., Fei-Fei L. (2009). “ImageNet: A large-scale hierarchical image database,” in 2009 IEEE Computer Society Conference on Computer Vision and Pattern Recognition. Ed. O’Conner L. (IEEE Computer Society, Miami, Florida), 248–255. doi: 10.1109/CVPR.2009.5206848
Dollfus D., Beaufort L. (1999). Fat neural network for recognition of position-normalised objects. Neural Netw. 11, 553–560. doi: 10.1016/s0893–6080(99)00011–8
Duntsch I., Gediga G. (2019). Confusion matrices and rough set data analysis. J. Phys.: Conf. Ser. 1229, 12055. doi: 10.1088/1742–6596/1229/1/012055
Ehrenberg C. G. (1836). Zur Erkenntniss der Organisation in der Richtung des kleinsten Raumes (Berlin: Druckerei der Königlichen Akademie der Wissenschaften).
Fernando A. G. S., Peleo-Alampay A. M., Wiesner M. G. (2007). Calcareous nannofossils in surface sediments of the eastern and western South China Sea. Mar. Micropaleontol. 66, 1–26. doi: 10.1016/j.marmicro.2007.07.003
Goodfellow I., Bengio Y., Courville A. (2016). Deep Learning (Massachusetts: MIT Press). Available at: www.deeplearningbook.org.
Han J., Moraga C. (1995). “The influence of the sigmoid function parameters on the speed of backpropagation learning,” in From Natural to Artificial Neural Computation. Eds. Mira J., Sandoval F. (Springer Berlin Heidelberg, Berlin, Heidelberg), 195–201. doi: 10.1007/3–540-59497–3_175
Hao Y., Wang S., Lei X. (1989). Micropaleontology microcomputer-aided research system. GeoSci 4, 369–376.
He K., Zhang X., Ren S., Sun J. (2016). “Deep residual learning for image recognition,” in 29th IEEE Conference on Computer Vision and Pattern Recognition (CVPR 2016). Ed. O’Conner L. (IEEE Computer Society, Las Vegas, Nevada), 770–778. doi: 10.1109/CVPR.2016.90
Hu X., Chu L., Pei J., Liu W., Bian J. (2021). Model complexity of deep learning: a survey. Knowl. Inf. Syst. 63, 2585–2619. doi: 10.1007/s10115–021-01605–0
Huang G., Liu Z., Laurens M. (2017). “Densely connected convolutional networks,” in 30th IEEE Conference on Computer Vision and Pattern Recognition (CVPR 2017). Ed. O’Conner L. (IEEE Computer Society, Honolulu, Hawaii), 2261–2269. doi: 10.1109/CVPR.2017.243
Kingma D. P., Ba J. (2014). Adam: A method for stochastic optimization, arXiv preprint. arXiv:1412.6980.
Krizhevsky A., Sutskever I., Hinton G. E. (2012). Imagenet classification with deep convolutional neural networks. Adv. Neural Inf. Process. Syst. 25, 1097-1105. doi: 10.1016/j.aasri.2014.05.013
Mahdavi A., Carvalho M. (2021). “A Survey on open set recognition,” in 2021 IEEE Fourth International Conference on Artificial Intelligence and Knowledge Engineering (AIKE) Laguna Hills, CA: IEEE Artificial Intelligence and Knowledge Engineering. 37–44. doi: 10.1109/AIKE52691.2021.00013
Martini E., Worsley T. (1971). “Tertiary calcareous nannoplankton from the western Equatorial Pacific,” in Initial reports DSDP 7. Eds. Winterer E. L., Riedel W. R., Bronnimann P., Gealy E. L., Heath G. R., Kroenke L., et al (Washington: U.S. Govt. Printing Office), 1471–1507. doi: 10.2973/dsdp.proc.7.129.1971
Niu Z. (2021). Safety augmentation of construction sites with augmented data (Karlsruhe: Karlsruhe Institute of Technology. Department of Mechanical Engineering).
Okada H., Bukry D. (1980). Supplementary modification and introduction of code numbers to the low-latitude coccolith biostratigraphic zonation (Bukry 1973, 1975). Mar. Micropaleontol. 5, 321–325. doi: 10.1016/0377–8398(80)90016-x
Ola P. S. (2018). Morphological description of calcareous nannofossils assemblage of a middle-miocene to late-miocene section in the Niger-delta, Nigeria. OJG 8, 925–937. doi: 10.4236/ojg.2018.89055
Otalora S., Atzori M., Andrearczyk V., Khan A., Muller H. (2019). Staining invariant features for improving generalization of deep convolutional neural networks in computational pathology. Front. Bioeng. Biotechnol. 7, 198. doi: 10.3389/fbioe.2019.00198
Perch-Nielsen K. (1985). “Mesozoic calcareous nannofossils,” in Plankton Stratigraphy. Eds. Bolli H. M., Saunders J. B., Perch-Nielsen K. (Cambridge University Press, Cambridge), 329–426.
Petersen F., Kuehne H., Borgelt C., Deussen O. (2022). “Differentiable top-k classification learning,” in Proceedings of the 39th International Conference on Machine Learning, vol. 162 . Eds. Chaudhuri K., Jegelka S., Song L., Szepesvari C., Niu G., Sabato S. (Cambridge, MA: PMLR), 17656–17668. Available at: https://proceedings.mlr.press/v162/petersen22a.html
Prechelt L. (1998). “Early stopping – but when?,” in Neural Networks: Tricks of the Trade. Eds. Montavon G., Orr G., Muller K. R. (Springer Berlin Heidelberg, Berlin, Heidelberg), 55–69.
Ridzuan F., Zainon W. (2019). A review on data cleansing methods for big data. Proc. Comput. Sci. 161, 731–738. doi: 10.1016/j.procs.2019.11.177
Ruder S. (2016). An overview of gradient descent optimization algorithms. arXiv. preprint. arXiv:1609.04747.
Rusak E., Schott L., Zimmermann R. S., Bitterwolf J., Bringmann O., Bethge M., et al. (2020). “A simple way to make neural networks robust against diverse image corruptions,” in Computer Vision–ECCV 2020: 16th European Conference. Eds. Vedaldi A., Bischof H., Brox T., Frahm J. M. (Springer, Glasgow, UK), 53–69. doi: 10.1007/978–3-030–58580-8_4
Sant K., Palcu D. V., Turco E., Stefano A. D., Baldassini N., Kouwenhoven T., et al. (2019). Litho- and biostratigraphic data of lower-middle Miocene sections in the Transylvanian basin and SE Carpathian Foredeep (Romania). Data Brief. 24, 1–28. doi: 10.1016/j.dib.2019.103904
Senemari S., Jalili F. (2021). Eocene to Oligocene nannofossils stratigraphy and environmental conditions in lzeh Province, Zagros Basin, East Tethys. J. Palaeogeogr. 10, 209–221 (00230). doi: 10.1186/s42501–021-00092–2
Shu J., Nian F., Yu M., Xu L. (2020). An Improved mask R-CNN model for multiorgan segmentation. Math. Probl. Eng. 2020, 8351725. doi: 10.1155/2020/8351725
Sokolova M., Japkowicz N., Szpakowicz S. (2006). “Beyond accuracy, F-score and ROC: a family of discriminant measures for performance evaluation,” in Australasian joint conference on artificial intelligence, vol. 4304 . Eds. Sattar A., Kang B. (Springer Berlin Heidelberg, Berlin, Heidelberg), 1015–1021. doi: 10.1007/11941439_114
Srinivasan K., Garg L., Datta D., Alaboudi A. A., Jhanjhi N. Z., Agarwal R., et al. (2021). Performance comparison of deep CNN models for detecting driver’s distraction. Comput. Mater. Continua 8, 4109-4124. doi: 10.32604/cmc.2021.016736
Srivastava N., Hinton G., Krizhevsky A., Sutskever I., Salakhutdinov R. (2014). Dropout: a simple way to prevent neural networks from overfitting. J. Mach. Learn. Res. 15, 1929–1958. doi: 10.5555/2627435.2670313
Su Y., Li D., Chen X. (2021). Lung nodule detection based on faster R-CNN framework. Comput. Methods Programs. Biomed. 200, 105866. doi: 10.1016/j.cmpb.2020.105866
Szegedy C., Liu W., Jia Y., Sermanet P., Reed S., Anguelov D., et al. (2015). “Going deeper with convolutions,” in 28th IEEE conference on Computer Vision and Pattern Recognition (CVPR 2015). Ed. O’Conner L. (IEEE Computer Society, Boston, Massachusetts), 1–9. doi: 10.1109/CVPR.2015.7298594
Taylor L., Nitschke G. (2018). “Improving deep learning with generic data augmentation,” in 2018 IEEE symposium series on computational intelligence (SSCI 2018). Ed. Sundaram S. (IEEE Computer Society, Bengaluru), 1542–1547. doi: 10.1109/SSCI.2018.8628742
Vareto R., Silva S., Costa F., Schwartz W. R. (2017). “Towards open-set face recognition using hashing functions,” in 2017 IEEE international joint conference on biometrics (IJCB). Ed. IJCB Editorial Board (IEEE Computer Society, Denver, Colorado), 634–641. doi: 10.1109/BTAS.2017.8272751
Veerakumar T., Jayaraman S., Esakkirajan S. (2009). Digital Image Processing (NewYork: Tata McGraw Hill Education).
Wang G., Wu M., Wei X., Song H. (2020). Water identification from high-resolution remote sensing images based on multidimensional densely connected convolutional neural networks. Remote Sens. 12, 795. doi: 10.3390/rs12050795
Xie S., Girshick R., Dollar P., Tu Z., He K. (2017). “Aggregated Residual Transformations for Deep Neural Networks,” in 30th IEEE Conference on Computer Vision and Pattern Recognition (CVPR 2017). Ed. O’Conner L. (IEEE Computer Society, Honolulu, Hawaii), 5987–5995. doi: 10.1109/CVPR.2017.634
Yang B., Xu K., Wang H., Zhang H. (2022). Random Transformation of image brightness for adversarial attack. J. Intell. Fuzzy. Syst. 42, 1693–1704. doi: 10.3233/JIFS-211157
Ying X. (2019). An overview of overfitting and its solutions. J. Phys.: Conf. Ser. 1168, 22022. doi: 10.1088/1742–6596/1168/2/022022
Young J. R. (1998). “Neogene,” in Calcareous Nannofossil Biostratigraphy. Ed. Bown P. R. (Chapman & Hall, London), 225–265.
Young J. R., Bown P. R. (1997). Cenozoic calcareous nannoplankton classification. J. Nannoplankton. Res. 19, 36–47. doi: 10.58998/jnr2278
Young J. R., Bown P. R., Lees J. A. (2022) Nannotax3 website. International Nannoplankton Association. Available online at: www.mikrotax.org/Nannotax3 (Accessed December 15, 2022).
Young J. R., Pratiwi S., Su X., the Expedition 359 Scientists (2017). “Data report: surface seawater plankton sampling for coccolithophores under-taken during IODP Expedition 359,” in Proceedings of the International Ocean Discovery Program, 359: Maldives Monsoon and Sea Level. Eds. Betzler C., Eberli G. P., Alvarez Zarikian C. A., the Expedition 359 Scientists (San Diego, CA: International Ocean Discovery Program). 359, 1465–1472. doi: 10.14379/iodp.proc.359.111.2017
Yu T., Zhu H. (2020). Hyper-parameter optimization: A review of algorithms and applications. arXiv. preprint. arXiv:2003.05689.
Zeiler M. D., Fergus R. (2014). “Visualizing and understanding convolutional networks,” in Computer Vision–ECCV 2014: 13th European Conference, vol. 8689 . Eds. Fleet D., Pajdla T., Schiele B., Tuytelaars T. (Springer, Zurich, Switzerland), 818–833. doi: 10.1007/978–3-319–10590-1_53
Zhang Z., Liang X., Dong X., Xie Y., Cao G. (2018). A sparse-view CT reconstruction method based on combination of denseNet and deconvolution. IEEE Trans. Med. Imaging. 37, 1407–1417. doi: 10.1109/TMI.2018.2823338
Zhang S., McDanel B., Kung H. T. (2022). “FAST: DNN training under variable precision block floating point with stochastic rounding,” in 2022 IEEE International Symposium on High-Performance Computer Architecture (HPCA 2022). Ed. Ceballos C. (IEEE Computer Society, Seoul, South Korea), 846–860. doi: 10.1109/hpca53966.2022.00067
Zhang Q., Zhu S. (2018). Visual interpretability for deep learning: a survey. Front. Inf. Technol. Electronic. Eng. 19, 27–39. doi: 10.1631/FITEE.1700808
Zhong Z., Zheng L., Kang G., Li S., Yang Y. (2020). “Random erasing data augmentation,” in Proceedings of the AAAI conference on artificial intelligence, vol. 34 . Ed. Assoc Advancement Artificial Intelligence (Clarivate, NewYork), 13001–13008. Available at: https://www.webofscience.com/wos/alldb/full-record/WOS:000668126805057.
Zhou K., Liu Z., Qiao Y., Xiang T., Loy C. C. (2023). Domain generalization: A survey. IEEE Trans. Pattern Anal. Mach. Intell. 45, 4396–4415. doi: 10.1109/TPAMI.2022.3195549
Zhou W., Zyner A., Worrall S., Nebot E. (2019). Adapting semantic segmentation models for changes in illumination and camera perspective. IEEE Robot. Autom. Lett. 4, 461–468. doi: 10.1109/LRA.2019.2891027
Zhuang F., Qi Z., Duan K., Xi D., Zhu Y., Zhu H., et al. (2020). A comprehensive survey on transfer learning. Proc. IEEE. 109, 43–76. doi: 10.1109/JPROC.2020.3004555
Appendix A. Taxonomic appendix
The list includes all taxa cited in the paper. The taxonomy and relative bibliographical references can be found in Perch Nielsen (1985) and Young and Bown (1997).
Amaurolithus primus (Bukry and Percival, 1971) Gartner and Bukry (1975).
Calcidiscus premacintyrei (Wise and Windsor, 1976) Theodoridis (1984).
Ceratolithus acutus Gartner and Bukry (1974).
Catinaster coalitus Martini and Bramlette (1963).
Discoaster berggrenii Bukry (1971).
Discoaster hamatus Martini and Bramlette (1963).
Discoaster kugleri Martini and Bramlette (1963).
Discoaster quinqueramus Gartner (1969).
Discoaster signus Bukry (1971).
Helicosphaera carteri (Wallich, 1877) Kamptner (1954).
Helicosphaera euphratis Haq (1966).
Nicklithus amplificus (Bukry and Percival, 1971) Raffi, Backman and Rio (1998).
Reticulofenestra pseudoumbilicus (Gartner, 1967) Gartner (1969).
Sphenolithus belemnos Bramlette and Wilcoxon (1967).
Sphenolithus delphix Bukry (1973).
Sphenolithus disbelemnos Fornaciari and Rio (1996).
Sphenolithus heteromorphus Deflandre (1953).
Triquetrorhabdulus carinatus Martini (1965).
Appendix B. Appendix of image data references for key fossils from the Miocene Calcareous Nannofossil Zone
We hereby make the following declarations regarding the use of image data in our study on Miocene calcareous nannofossil classification using deep learning technology:
The use of images in this study is strictly for academic research purposes and does not involve any commercial purposes. All images used in the study have been properly credited, indicating the original author and source. We strictly adhered to the data mining policies of the copyright holders. The images used during the data mining process are owned by the original copyright holders. Any third-party use in any form must comply with the policies and requirements of the copyright holders.
Keywords: calcareous nannofossils, convolutional neural network, data augmentation, model training, automated identification
Citation: Zhang H, Yu C, Jiang Z and Zhao X (2024) A new method for identifying key fossil species in the Miocene Calcareous Nannofossil Zone: insights from deep convolutional neural networks. Front. Ecol. Evol. 12:1363423. doi: 10.3389/fevo.2024.1363423
Received: 30 December 2023; Accepted: 07 June 2024;
Published: 28 June 2024.
Edited by:
Pierre Gueriau, Université de Lausanne, SwitzerlandReviewed by:
Shu Kong, Texas A and M University, United StatesPaula Granero Ordóñez, University of Vienna, Austria
Copyright © 2024 Zhang, Yu, Jiang and Zhao. This is an open-access article distributed under the terms of the Creative Commons Attribution License (CC BY). The use, distribution or reproduction in other forums is permitted, provided the original author(s) and the copyright owner(s) are credited and that the original publication in this journal is cited, in accordance with accepted academic practice. No use, distribution or reproduction is permitted which does not comply with these terms.
*Correspondence: Zhenglong Jiang, amlhbmd6bEBjdWdiLmVkdS5jbg==