 Sen Wang
 Jinye Li*
- School of Economics and Management, Xinjiang University, Urumqi, China
Introduction: With the rapid development of digital technology and its deep integration with environmental and ecological fields, the digital economy has become an effective way to guide the transition of cities to an eco-friendly model. However, empirical studies on the nonlinear spatial effects between digital economy and ecological welfare performance are still insufficient.
Methods: Based on the panel data of 270 prefecture-level cities in China from 2011 to 2020, this paper empirically examines the impact of the digital economy on the ecological welfare performance of cities and its mechanism of action using spatial econometric modeling.
Results: The promotion effect of digital economy development on the ecological welfare performance of cities is characterized by the “J” shape of increasing marginal effect, and the spatial spillover effect on the ecological welfare performance of neighboring cities is the inverted “U” shape of inhibiting first and then promoting later. The mechanism test shows that the development of digital economy can enhance the ecological welfare performance of cities through the marginal incremental promotion of green technological innovation in local and neighboring cities and has a positive spatial spillover effect. The development of digital economy can have a direct U shape effect on local ecological welfare performance by influencing factor allocation efficiency and energy utilization efficiency. It also has an inverted U-shaped spatial spillover effect. Environmental regulation has an inverted U-shaped moderating effect on the local eco-welfare performance affected by the digital economy. As the level of rural revitalization increases, it produces a U-shaped moderating effect of inhibiting. Heterogeneity analysis reveals that digital economy development has a more significant facilitating effect and a positive spatial spillover effect on the ecological welfare performance of cities in central China.
Discussion: This paper will provide a reference for the synergistic optimization of digital economy development and ecological welfare performance among regions. The findings of the study will promote the development of digital economy and accelerate the realization of the goal of “Beautiful China”.
1 Introduction
Although China’s economy has achieved leapfrog development, it has suffered significant damage to ecological welfare performance (EWP), including environmental overdrafts, ecological deficits, and income disparities, because of its rough-and-tumble approach to development (Wang et al., 2023). As we enter a new era of socialism, driven by the three-dimensional goals of pursuing economic growth (EG) as well as environmental friendliness and social equity, the realization of improved EWP is a proper way to promote the harmonious coexistence of human beings and nature and to realize the comprehensive development of human beings (Qu et al., 2023). In the 20th session of the People’s Congress, the Chinese Government put forward new requirements for economic and social development and the enhancement of people’s wellbeing, and the green and sustainable development model has gradually become an important way of transforming China’s development mode and realizing high-quality development (Tan et al., 2023). When the eco-friendly conditions of economic development (ED) are locked in advance, the low-cost and rough EG will be unsustainable (Cui et al., 2022). As a new form of ED generated by digital technology, by 2020, the digital economy (DE) will contribute more than 70% to the overall gross domestic product (GDP) of first-tier and new first-tier cities, and a series of new industries, modes, and forms of business will become a strong driving force for green EG and social progress (Han and Liu, 2022). As of 2022, the scale of China’s DE has reached 50.2 trillion yuan, with a nominal year-on-year growth of 10.3%, which has been significantly higher than the nominal growth rate of GDP in the same period for 11 consecutive years, and the DE accounts for a proportion of GDP equivalent to the proportion of the secondary industry in the national economy, which reaches 41.5%, showing a strong momentum of growth. “EWP” emphasizes the coexistence of growth, greenness, and fairness, and is a “people-centered” approach to sustainable development (Feng et al., 2019), while the DE has multiple characteristics such as high efficiency, low energy, and sharing (Liu et al., 2023). How does the development of DE affect the EWP of cities? Through what channels does it affect the level of EWP of cities? Does it affect the level of EWP of neighboring cities? Does it have heterogeneity in its impact on the EWP of cities? Answering these questions can provide a theoretical basis and policy guidance for the formulation of time-sensitive and targeted growth strategies for DE and EWP. Thus, by exploring the nonlinear spatial transmission mechanism of the DE’s impact on the urban ecological welfare system, this paper unearths a deeper connection between the DE and the urban ecological welfare system, and the study reveals the importance of spatial effects in the relationship between the DE and EWP, which can help us better understand the complex relationship between digital ED and ecological welfare. In addition, the study provides practice paths on how digital technologies can be utilized to maximize ecological wellbeing, helping to further advance cutting-edge scientific research. It also provides policymakers with important insights into the need to fully consider and utilize spatial effects when planning and promoting DE development. Accordingly, the marginal contribution of this paper is as follows:
First, based on the existing research literature, this paper deepens the theoretical organic connection and understanding of the nonlinear relationship between DE and urban EWP based on the nonlinear spatial effect perspective. Second, this paper systematically establishes the theoretical analysis framework of the nonlinear spatial effect of DE on urban EWP based on the combination of EG theory, welfare economics theory, and sustainable development theory, and constructs an empirical model based on the results of the theoretical analysis, scientifically verifying the nonlinear spatial effect of the two and its mechanism of action through quantitative research, which helps to improve the theoretical level of DE’s urban EWP influence that is insufficiently researched. Third, it breaks through the realization path of urban EWP improvement from the perspective of DE, and explores the transmission mechanism of the nonlinear spatial influence of DE on urban EWP. The research results of this paper can provide feasible policy suggestions for Chinese cities to realize the EWP goals.
2 Literature review
Many scholars have extensively studied the DE and its development, the great changes it has brought to human production and lifestyle, and its positive utility in saving resources and protecting the environment in terms of resource utilization efficiency. According to the research theme of this paper, the literature involved is reviewed from the following three aspects: (1) studies related to the economic effects of the DE, (2) studies related to EWP, and (3) studies on the impact of the DE on EWP.
2.1 Research on the economic effects of the digital economy
With the rapid development of DE, scholars have been studying it more thoroughly, mainly focusing on the social and economic effects it brings. At the macro level, the impact of the DE is mainly studied from the overall height of the country; for example, a large number of scholars, represented by Chen and Yao (2023), Liu et al. (2023), and Wang and Li (2023), have researched the role of the DE and economic (high-quality) growth, and academics generally have a positive attitude toward the role of the DE in ED. At the same time, a large number of scholars focus on the DE and the green and low-carbon development of the economy. Lyu et al. (2023b) believe that the DE can promote the green development of the economy, but one needs to focus on the balanced development of DE. The development imbalance of the DE leads to the “digital gap” between the central city and the marginal cities, which, in turn, produces a negative effect. Some scholars believe that environmental regulation can effectively guide the DE to green development (Zhang et al., 2022; Lyu et al., 2023a). It has also been argued that technological innovation is the main channel through which the DE influences low-carbon development, but green technological innovation (GTI) may crowd out other technological innovations at the initial stage, resulting in a decline in total factor productivity (TFP) (Lyu et al., 2023a). Research at the meso level mainly focuses on regions and industries, and typical studies include a large number of scholars, represented by Ma et al. (2023), Zhao et al. (2023), and Zheng et al. (2023), who analyzed the impact of the DE on the coordinated development of the region and its mechanisms, and scholars have conducted empirical analyses by utilizing the data of the central provinces, the Sichuan–Chongqing region, and other regions, and have concluded that the DE can significantly promote coordinated regional development and that there is a more obvious spatial influence. Scholars have analyzed the impact of DE on manufacturing (Hmamed et al., 2023; Wu and Zhuang, 2023; Zhao et al., 2023), finance (Chen, 2023; Fan et al., 2023), and other industries in terms of industry (Chang et al., 2023). In addition, a large number of literature also provide analysis from the micro level, with the research object involving residents, enterprises (platforms), and the government, among others. Among them, there are abundant studies on the DE’s impact on residents’ income and disparity (Das and Chatterjee, 2022; Bento, 2023; Li et al., 2023) and residents’ energy consumption (Guo et al., 2023; Ma et al., 2023; Wang and Liu, 2023; Zhao et al., 2024), but the conclusions tend to differ.
2.2 Research related to ecological welfare performance
With the continuous development of social economy, the people’s demand for ecological environment (EE) quality is becoming more prominent and the demand for EWP is becoming more apparent, with the state advocating a more sustainable development model (Feng et al., 2023). EWP is proposed from the theory of sustainable development. The research paradigm of sustainable development is broadly divided into two types: strong and weak. The weak sustainability research paradigm originates from neoclassical economics, which believes that man-made capital and natural capital are substitutable, and that ED is not constrained by the EE (Solow, 2000). Typical evaluation indexes include green GDP (Liu, 2021). The theoretical basis of the strong sustainability research paradigm is ecological economics, which emphasizes that the ED is constrained by the EE, and the typical evaluation indexes include environmental economic efficiency, environmental welfare performance, and EWP (Jiang and Chen, 2011; Zhang and Wu, 2022; Yin et al., 2023). Daly, an earlier proponent of EWP, pointed out that the economic system is a subsystem of the finite natural ecosystem (environment); that in the case of relative affluence of man-made capital, the absolute scarcity of natural capital has become a key element restricting the development of human beings; and that the EWP is measured by the ratio of the amount of services to the amount of throughput (Gruzalski, 1999). Existing scholars (Liu et al., 2018; Bandara and Pathiratne, 2023; Lin et al., 2023) based on this research paradigm evaluated sustainable development from the perspective of EWP at the national level, provincial level, and municipal level, respectively. Su et al. (2023) studied the relationship between GTI and EWP based on the perspective of spatiotemporal transformation. Li and Yang (2023) decomposed and measured the EWP of cities and analyzed the internal mechanism of its transformation process. In addition to the above studies, the level of ED, urbanization process, population density, and industrial agglomeration are also aspects that scholars pay attention to in terms of EWP. By analyzing and studying the EWP of industries through analysis, You et al. (2023) pointed out that industrial enterprises in economically developed regions would invoke relatively more clean and environmentally friendly technologies, employ higher-quality labor, and, at the same time, invest more in the prevention and treatment of pollution. Li and Yang (2023) considered that the two aforementioned approaches would have an impact not only on the EWP by incorporating the level of urbanization and environmental endowment in the framework of the research analysis but also on the analysis of the region by considering more social factors such as urbanization rate, but they are not applicable to the analysis of EWP of the industry. Zhong and Feng (2018) studied the impact of population structure on EWP and concluded that when the level of ED reaches a certain level, there is a significant positive correlation between population density and EWP. Criveanu (2023) analyzed that the agglomeration of productive service industries has a U-shaped impact on EWP, which is firstly inhibited and then promoted.
2.3 Research on the impact of the digital economy on ecological welfare performance
With China’s emphasis on high-quality ED, scholars have continued to supplement their research on the impact of the DE on EWP around the positive utility of the DE and EWP in the high-quality ED and the promotion of technological innovation (Chen et al., 2023), specifically sorted out as follows: Criveanu (2023) argued that the rapid development of general-purpose technology and the new characteristics of ED in the new digital era make it possible to bring about, on the one hand, the innovation of traditional science and technology and, on the other hand, the means of technology to provide impetus to promote the transformation of ED and the structure of industry, reconstructing the economic production model, which can promote the increase of supply-side efficiency and quality increase, further promoting the greening of the production mode. From the perspective of whether resources can be rationally allocated, Wu et al. (2023) believed that the DE can save resources, reduce resource loss, and thus avoid ecological damage, and that the DE, with communication technology as the key element, is more high end and more powerful than the traditional economy, and can promote economic and social development in all aspects. Ma and Lin (2023) focused on the current existing crude EG model and believed that by improving the efficiency of technological innovation, one can realize green and sustainable development and improve the production model at the same time. Chen et al. (2023), based on the micro level from lifestyle, believed that the DE is more sustainable than the traditional economy and can form a healthy, low-carbon, green mode of life and consumption pattern, which, in turn, reduces the input and consumption of resource endowments, reduces damage to the EE, and promotes the green transformation of the production model. In addition, the DE can inject a constant stream of vitality into the improvement of economic efficiency, economic quality, and ED dynamics through technological means, and become an enabler of high-quality ED.
2.4 Comment on the research literature
In summary, as a new form of ED accompanying the digital technology revolution and the industrial revolution, the DE plays an important role in improving the efficiency of resource allocation, reducing the consumption of ecological resources, and improving the welfare of residents. Existing studies have conducted a preliminary examination on the impact of the DE on the performance of EWP, but the following three aspects remain to be discussed. First, the research on the impact of DE on EWP mainly focuses on the national or provincial macro level, while the research on the city level mainly focuses on the impact of DE on the green development of the city, and very few studies explore the spatial impact of DE on EWP from the city level. Second, the existing literature only explores the impact of DE on EWP from a simple linear relationship, and few scholars have discussed the deeper nonlinear relationship between the two, and even fewer studies have explored the nonlinear spatial impact of DE on EWP from the perspective of a spatial spillover effect. Third, the established literature needs to explore the transmission mechanism of the nonlinear spatial impact of the DE on urban EWP, which requires further discussion.
In view of the lack of research in the above literature, this paper combines the characteristics of the DE, uses the Technique for Order of Preference by Similarity to Ideal Solution (TOPSIS) entropy weighting method to re-measure the urban DE with the core elements of “support, drive, support and guarantee”, adopts the Super-SBM-DEA method to measure the EWP at the urban level, and utilizes the spatial econometric model to test the nonlinear spatial impacts of the development of DE on the performance of the city’s eco-welfare and its intrinsic functioning mechanism.
3 Theoretical analysis and research hypothesis
3.1 DE development and urban EWP
The enhancement of urban EWP through the development of DE should be driven by a combination of eco-efficiency and welfare levels (Song et al., 2022). On the one hand, DE is favorable to the improvement of ecological efficiency (Shen et al., 2022). The DE can not only break through the geographical restrictions, better play the function of the market to effectively allocate resources, and improve the resource utilization efficiency of the whole economic system (Xin et al., 2023), but also reduce the resource consumption of the production side by strengthening the cooperation of upstream and downstream enterprises and the integration of front- and back-end industries (Wang et al., 2023). In addition to this, the DE can also lead the green consumption and reduce the pollution emission at the consumption side by constructing a digitalized innovation system of information sharing and an interconnection of networks and platforms, and by leading the green consumption and demand (Yang and Liang, 2023). On the other hand, in terms of the impact of the development of DE on the welfare of residents, the development of DE not only is conducive to the entry of more people into the DE industry, thus increasing employment (Idowu and Elbanna, 2022), but also helps regions to obtain equitable development opportunities and realize inclusive growth (Ren et al., 2022). In addition, the development of DE also makes many niche and popular products easily accessible to residents, which greatly meets the expectations of the residents for obtaining expectations of diversified services or products (Choi et al., 2020). Moreover, the development of DE is in line with Metcalfe’s law; as the development of DE increases, its impact on the performance of urban EWP will show the outcome of an increasing marginal effect (Ma et al., 2023). Moreover, in the early stages of the DE, large investments may be required to introduce new technologies and train employees, whereas, over time, innovations and advances may contribute to productivity gains and cost reductions, and these innovations may lead to higher eco-welfare performance, thus creating a J-shaped growth model (Bi et al., 2022).
Based on the above analysis, the following hypothesis is proposed in this paper:
Hypothesis 1: The development of DE is conducive to the enhancement of urban EWP, and the promotion effect is characterized by the “J” type of increasing marginal effect.
At the same time, the early stage of the development of DE will be widely used in the mining industry (Nham et al., 2023), expanding the scale of fossil energy extraction, resulting in excessive consumption of resources and an increase in pollution emissions (Wei, 2024). Because mining and other heavily polluting industries are mostly located in the inter-city neighboring areas, the development of DE in the early stage of the EE in the neighboring cities may have a negative impact (Bi et al., 2022). In addition, as a city’s DE develops, more focus may be placed on high-tech and service industries, and industries with a high environmental impact may be relocated out of the city, while neighboring cities are usually the preferred target locations for these industries to move to due to their geographic location and labor cost, making it possible for neighboring cities to see a decline in their EWP in the short term (Wang et al., 2023). However, the level of development of DE itself can empower the real economy to enhance the role of the real economy, promote the real economy of intelligent and flexible production (Ma et al., 2020), and reduce the intermediate consumption of the production process (Rajput and Singh, 2020). The DE can bring GTI with the theme of green, low-carbon, and energy-saving emission reduction (Song et al., 2023); promote the development of industries in the direction of an intelligent, green, and low-carbon economy (Zhou et al., 2019); improve regional energy utilization and industrial production efficiency (Ge et al., 2022); reduce energy consumption; and thus improve the EWP of neighboring cities (Zhou et al., 2022).
Based on the above analysis, the following hypothesis is proposed in this paper:
Hypothesis 2: DE through spatial spillovers may have a nonlinear spatial impact on the EWP of neighboring cities in the form of inhibition followed by promotion.
3.2 Mechanisms of influence of DE development on urban EWP
3.2.1 GTI effect
The DE, with data as the key production factor and digital technology as the core driving force, can promote GTI (Xu et al., 2023), which, in turn, is an important driver of EWP (Cui et al., 2022). On the one hand, the development of DE has increased the demand for green products and services among urban residents and stimulated the willingness of enterprises to rely on the DE for green innovation (Ning et al., 2022). Data have the characteristics of high efficiency and cleanliness, low cost, replicability, and massive accessibility, and through the integration with traditional production factors, it can promote GTI with the theme of green, low-carbon, and energy-saving emission reduction, and boost enterprises to carry out cleaner and intelligent production, thus reducing the dependence of enterprises’ production on energy resources, and enhancing the performance of eco-welfare (Ge et al., 2022). On the other hand, digital technology has the characteristics of fast iteration, fast diffusion, and strong permeability (Huang et al., 2023). Through the penetration and fusion with energy-saving and low-carbon technologies, it can accelerate the supply and diffusion of GTIs, promote the transformation of traditional industries to low-carbonization and intelligence (Lo et al., 2023), improve the technological efficiency and labor productivity in the production process of traditional industries, and reduce the energy consumption and carbon emissions per unit of output (Ma and Zhu, 2022). In addition, the embedded integration of digital technology and energy development technology helps the development of photovoltaic, wind power, and renewable energy; promotes the transformation of the energy consumption structure to diversification, cleanliness, and low carbonization; and then enhances the EWP (Zheng and Zhang, 2023). At the same time, there are quantitative and qualitative differences in GTI, in the early stage of the development of DE, and in the scale of DE impact on the quantity of GTI to produce a stronger effect (Dou and Gao, 2022). However, with the development of DE, for GTI to reach a certain scale, the enterprise in the market of competitive learning must be able to access the required green technology faster (Krystofik and Gaustad, 2018). In order to obtain the advantages of green technology, the enterprise should be further strengthened in terms of the quality of the GTI and the research and development investment (Xue et al., 2023). Thus, the development of DE will continue to enhance the level of GTI and thus promote the performance of urban EWP (Bimonte et al., 2023).
Based on the above analysis, this paper puts forward the following hypothesis:
Hypothesis 3: The development of DE can promote GTI to enhance urban EWP, and the promotion effect is gradually increasing.
3.2.2 Factor allocation optimization effects
With the continuous advancement of market-oriented reform, China’s commodity market gradually became market-oriented; however, the development of the factor market has been relatively slow, given the double distortion in allocation and price, which negatively affects the improvement of urban EWP (Tang and Zhao, 2023; Yang et al., 2023). According to Krugman’s classic study, under the combined effect of scale effects, market boundaries, labor endowment, and iceberg costs, the “center-periphery” model of urban development may result in the agglomeration of factor endowments from the periphery to the center, or the diffusion of factor endowments from the center to the periphery (Zhao et al., 2023). The development of DE, with scale, network, and platform effects, has created space and new channels for the free flow of factors (Wang and Xue, 2023). However, owing to the differences in the level of digital infrastructure among cities, the DE may generate new digital inequality and the “digital divide” phenomenon in the early stage of development, and lead to the “siphon effect” (Zhang et al., 2023) because of the relative lack of new digital infrastructure such as mobile base stations, Internet of Things, big data centers, and cloud platforms. In peripheral cities, given the relative backwardness of the soft environment such as the institutional environment and policy preferences, the development of DE may accelerate the flow of all kinds of factors from the peripheral cities to the central city, thus generating the “siphon effect” phenomenon, leading to the “Matthew effect” (i.e., “the weaker is weaker, the stronger is stronger”), further distorting the allocation of factors, and impeding the enhancement of the performance of urban EWP (Cui et al., 2023). However, with the rising level of DE development in cities, DE development can effectively reduce the cost of searching, trading, matching, and copying by alleviating information asymmetry (Xue and Li, 2022), thus reducing the transaction barriers, breaking the market boundary, and expanding the scope of the market, which is conducive to the flow of factors in a larger space, and optimizing the distortion of factor allocation (Qu et al., 2023). Moreover, the DE can replace and eliminate the traditional backward industries with high pollution and high energy consumption through the substitution effect, and it can apply new technologies to empower and improve the efficiency of traditional industries through the empowerment effect, thus giving rise to new industries, new business forms, and new modes, opening up new channels for factor flows, enhancing the efficiency of factor allocation, and thus improving the performance of urban EWP (Bao et al., 2023).
Based on the above analysis, this paper proposes the following hypothesis:
Hypothesis 4: The development of DE can affect the urban EWP through the nonlinear effect of inhibiting and then promoting the efficiency of factor allocation, and then affect the performance of urban EWP.
3.2.3 Energy conservation and utilization effects
The DE consumes a large amount of energy in the early stages of its development, leading to an increase in pollution emissions and negatively affecting the EWP of cities (Chen, 2022). With the improvement of the energy efficiency of the DE itself and the enhancement of its enabling effect on the real economy, it can promote the transformation of traditional industries to digitalization, intelligence, intensification, and greening, and promote the improvement of urban EWP (Zhang et al., 2022). The development of DE in the initial process accompanied by a large amount of energy consumption is mainly manifested in three aspects: First, the operation and development of DE itself requires a large amount of energy-intensive infrastructure and power consumption, and the digital industry relies on electronic components, equipment manufacturing, and machine production, which all involve high energy consumption, thus increasing pollution emissions, which is not conducive to the enhancement of the performance of the city’s eco-welfare (Gao and Peng, 2023). Second, the rapid development of DE in various fields has given rise to more digital product consumption and services. Xin et al. (2022) found that the application of digital technology in the field of transportation will expand the scale of traffic and travel, resulting in more energy consumption and pollution emissions, which, in turn, inhibit the performance of urban EWP. Third, the technological progress caused by the DE prompted enterprises to reset production equipment at the beginning of the development; thus, increasing production will increase the consumption of resources and energy, resulting in an increase in pollution emissions, which, in turn, reduces the level of urban EWP (Zhang et al., 2021). With the enhancement of the degree of DE development, the DE can improve the efficiency of energy utilization and promote the level of urban EWP, mainly in the following three aspects: First, the DE relies on strong digital technology and massive data elements, can break through the limitations of space and time, and can accelerate the exchange of knowledge and technology between economic agents, giving rise to new technologies, new business forms, and new modes related to energy production and consumption, thus promoting urban energy conservation and utilization (EUE) and reducing the negative impact of pollution emissions on EWP (Akizu-Gardoki et al., 2020). Second, the development of DE can promote the deeply embedded integration of digital technologies such as big data, artificial intelligence, cloud computing, and enterprises, which can improve the original production process and industrial organization, eliminate high-consumption and low-efficiency industries, and reduce the energy consumption of the unit output, which, in turn, promotes the improvement of EWP level (Dong et al., 2024). Third, DE development changes the public’s consumption concept; promotes consumption upgrading; invariably enhances the public’s awareness of energy conservation, environmental protection, and green, low-carbon economy; and stimulates residents’ preference for the selection of green and low-carbon products and services (Wang et al., 2023), which helps to form an energy-saving and carbon-reducing lifestyle, thus improving the city’s EWP.
Based on the above analysis, this paper proposes the following hypothesis:
Hypothesis 5: The development of DE can influence urban EWP through the nonlinear effect of inhibiting and then promoting urban EUE.
3.3 Regulatory impacts of the internal and external urban environment
3.3.1 External urban environment factor: intensity of environmental regulation
From the viewpoint of the external urban environment, for the DE to better serve the goal of “green water and green mountains” (Yang and Liang, 2023), it is necessary to formulate relevant environmental regulatory (ER) policies and mandatory measures through administrative means to guide the development of digital technology in the direction of “reducing pollution and increasing greenness” (Guo et al., 2023). In the case of cities, the degree of importance attached to ecological protection by the local government will influence the regional sewage disposal main body and increase its motivation for pollution reduction and ecological protection (Liu et al., 2023). Therefore, we believe that the intensity of urban ER is an important indicator of the importance local governments attach to EE protection, which affects the effect of the DE on EWP (Ni et al., 2023). However, differences in the intensity of ER can also bring different impacts on local ED (Xie et al., 2023). In the case of the important main body of urban sewage, under moderate ER, enterprises can level out short-term costs by improving their technology level, thus improving their long-term competitiveness (Qiu et al., 2023). At the same time, the environmental awareness of enterprises will also be enhanced, paying more attention to the green and sustainable development at the production and operation level (Yin et al., 2023). Digital transformation plays a more significant role in improving the GTI of enterprises, which, in turn, can better promote the pollution emission reduction and EE protection of enterprises (Song et al., 2022). However, it is worth noting that it is a risky decision for enterprises to carry out digital transformation (Guo et al., 2022). If ERs are too strong, it will be difficult for enterprises to use additional investment in digital transformation to take care of environmental protection in their normal production and operation, resulting in a smaller incentive for digital transformation to green their production and operation processes, which, in turn, will have a limited impact on pollution abatement and EE protection (Wan and Shi, 2022). At the same time, the regulatory effect of ER, as an important tool for local governments to govern the environment, is more limited by geographical constraints (Wu et al., 2022).
On this basis, we propose the following hypothesis:
Hypothesis 6: As the intensity of ER increases, ER produces a nonlinear moderating effect that first promotes and then inhibits the DE in affecting local EWP, but its moderating effect on neighboring cities is not significant.
3.3.2 Intra-urban environmental factor: level of rural revitalization
From the viewpoint of the internal urban environment, the imbalance and inadequacy of the development of DE between urban and rural areas is an important reason for the digital divide (Lin et al., 2022). The urban DE is developing faster than the rural DE, resulting in a mismatch between digital technology and digital infrastructure in rural areas, creating a digital divide that is not conducive to the DE playing a positive role in the EWP of rural areas (Liu and Zhou, 2023). Thus, upgrading the level of rural revitalization (RR) can help narrow the digital divide and guide digital technology to play a positive role in EE protection in rural areas (Liu et al., 2023). However, in the early stages of RR, the application of digital technology in rural areas has yet to come into fruition, and it may take time for the digital technology to take effect. Moreover, when the government promotes RR, it needs to carry out a series of reforms, such as infrastructure construction and industrial structural adjustment, which may bring about short-term environmental impacts in the early stage, for example, changes in land use and adjustment of resources, thus weakening the DE’s positive effect on the EWP of cities (Zhang and Fan, 2023) and in turn the positive impact of the DE on urban EWP (Zhang et al., 2023). However, as the level of RR continues to rise, the government pays more attention to the construction of rural ecological civilization, and promotes environmental protection, sustainable agriculture, and other aspects of development through DE means. With the widespread application of digital technology in rural areas, the agricultural production process can be digitized and made intelligent, which improves production efficiency and reduces resource inputs, which not only has a positive impact on rural EG but also helps to improve the rural EE and reduces the negative impact on urban water sources and air quality (Zhou et al., 2023). Thereby, the improvement of the EE by the level of RR may gradually emerge, which, in turn, strengthens the positive impact of the DE on the EWP of cities (Wang, 2023). At the same time, the rural areas between neighboring cities not only are geographically connected but also have convergence in development patterns, and a high level of RR in rural areas will bring a demonstration effect to the neighboring areas, so that the improvement of the level of RR can contribute to the effect of the DE on the EWP of the neighboring cities.
On this basis, we put forward the following hypothesis:
Hypothesis 7: As the level of RR increases, the level of RR will have a nonlinear moderating effect of inhibition followed by promotion in the DE affecting the local EWP, and at the same time, it will have a positive moderating effect on the neighboring cities.
In summary, the impact of DE on urban EWP and the transmission mechanism is shown in Figure 1.
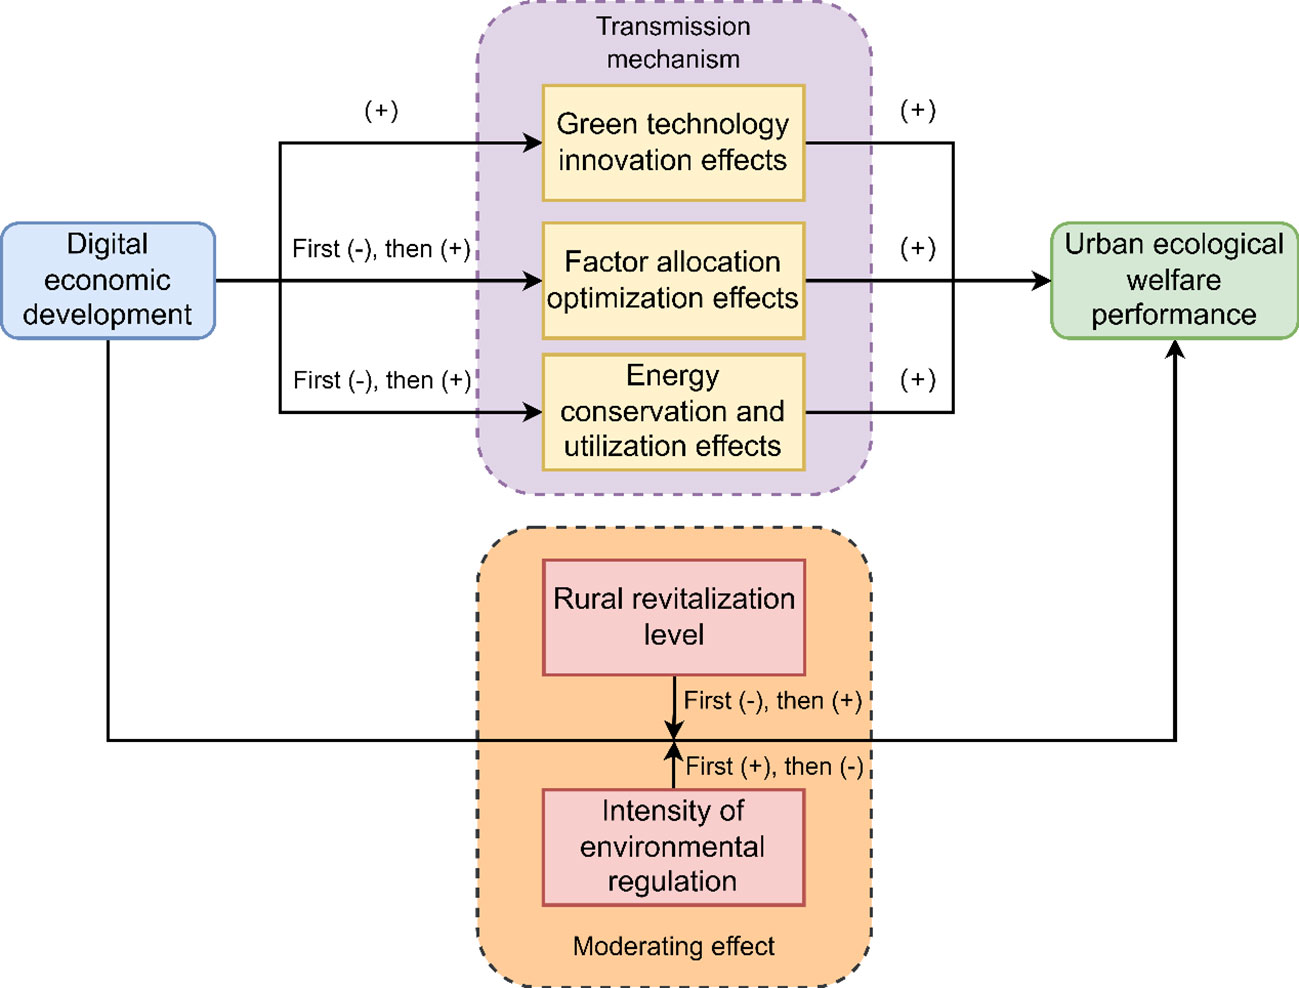
Figure 1 Diagram of the impact of DE development on urban EWP and transmission mechanisms.
4 Data and methods
4.1 Econometric modeling
To test the impact of DE on urban EWP, this paper sets up the following basic econometric model.
The dependent variables EWPit and DEit in model (1) represent the urban EWP and DE development of firm product i in year t, respectively. Xj,it are control variables (CV), μi and δt control for city fixed effects (C-FE) and time fixed effects (T-FE), respectively, εit is a random disturbance term, and robust standard errors are clustered to the city level.
It has been verified in the literature that both DE and EWP may have spatial spillover effects, and the factors affecting urban EWP in one region may also have an impact on neighboring regions through the spatial correlation effect of EWP between regions; thus, DE and other control variables may affect the level of EWP in the neighboring regions (Shen et al., 2022). Ordinary least squares (OLS) regression cannot avoid the influence of spatial autocorrelation, and the empirical results may have some bias. Therefore, this paper introduces the spatial lag terms of urban EWP, DE, and other control variables in Equation 1, further extending the model into a spatial Durbin model.
In Equation 2, W is the spatial weight matrix, ρ represents the spatial autoregressive coefficient, and θ1 and γj are the elasticity coefficients of the spatial interaction terms of the core explanatory variables and control variables. The spatial weight matrix can characterize the degree of association of spatial areas, and this paper firstly sets the urban geographic distance matrix to construct the spatial weight matrix, as shown in Equation 3.
where represents the geographic distance matrix, dij represents the geographic distance between cities i and cities j, in order to ensure the robustness of the regression results, this paper also set the economic and geographic nested matrix for robustness test, as shown in Equation 4.
where represents the geographic distance matrix, dij represents the geographic distance between cities i and cities j, represents the economic distance matrix, represents the weight of the geographic distance matrix, which is set to 0.5 in this paper based on the study of Shen et al. (2022).
To further discuss the role mechanism of DE affecting cooperation and innovation, this paper selects three mechanism variables for mechanism testing, and the OLS model is shown in Equation 5.
Among them, Mit represents the mechanism variables, which are urban GTI (GTI), urban factor allocation efficiency (FAE), and urban EUE (FUE). In addition, considering the spatial spillover effect, this paper draws on the practice of Gao and Peng (2023) to jointly test the mechanism variable model and the spatial panel model, as shown in Equation 6.
If the coefficients of the explanatory variables in Equation 6 and are significant, it indicates that the development of DE can affect the performance of urban EWP through this mechanism; if the coefficients of the explanatory variables and in Equation 6 are significant, it indicates that this mechanism is also valid in the spatial panel model.
Finally, to discuss the moderating role of internal and external urban environmental factors in the development of DE affecting cooperation and innovation, this paper selects two moderating variables to test the moderating effect, and the OLS model is shown in Equation 7.
Among them, Tit represents the moderating variables, which are urban ER intensity (ER) and urban RR level (RR). In addition, considering the spatial spillover effect, this paper draws on the practice of Dou and Gao (2022) to jointly test the moderating effect model and the spatial panel model, as shown in Equation 8.
If the coefficients of the explanatory variables in Equation 7 are significant, it indicates that the moderating variables can have a moderating effect in the DE, affecting the performance of urban EWP; if the coefficients of the explanatory variables in Equation 8 are significant, it indicates that the moderating effect is also valid in the spatial panel model.
4.2 Variables
4.2.1 Explained variables: urban EWP
Urban EWP (EPW): The current common methods for EWP measurement are as follows: (1) the ratio method, such as using the ratio of social welfare or happy life index to the ecological footprint; and (2) the non-parametric method, such as data envelopment analysis. Since it is difficult for a single indicator to measure both factors at the same time, and the evaluation system constructed through tends to duplicate information (Cui et al., 2023), with reference to Tang and Zhao (2023) and Xue and Li (2022), in this paper, the Super SBM-DEA method is used to measure urban EWP using efficiency values of inputs and outputs.
EWP refers to the efficiency of natural ecological factor inputs into human welfare, in which natural ecological factor inputs reflect the consumption of natural resources and EE disturbance by human activities. The goal of natural ecological factor inputs is to promote human development and improve the level of welfare, which can be divided into two aspects: consumption of ecological resources and disturbance of the EE. Human welfare or wellbeing refers to the state of health, happiness, and materially rich life (Krystofik and Gaustad, 2018), which can be specifically divided into subjective welfare and objective welfare (Li et al., 2022). According to the connotation of EWP, drawing on relevant research results (Ning et al., 2022), considering the accessibility of indicator data, based on the input–output theory, using the Super-SBM-DEA methodology, and taking the consumption of non-ecological resources, ecological resource consumption, and EE damage as the cost-type input elements, and the human welfare as the benefit-type output elements, we construct the urban EWP evaluation index system (Table 1). Among them, non-ecological resource consumption inputs are characterized by capital, labor, and public facilities, which are measured using total urban fixed assets, employees of the unit at year end, and miles of road per 10,000 population, respectively; ecological resource consumption inputs are characterized by land resources, water resources, and energy consumption, which are measured using standard coal per capita, water resources per capita, and urban built-up area per capita, respectively. Ecological damage products appear in the form of outputs in the actual production, which, according to the connotation of EWP, can be regarded as input costs, and thus ecological damage inputs are characterized by wastewater, exhaust gas, solid waste, and carbon dioxide emissions, which are measured using industrial wastewater discharge per capita, industrial sulfur dioxide emissions per capita, industrial smoke and dust emissions per capita, and carbon dioxide emissions per capita, respectively. The Human Development Index (HDI) proposed by the United Nations Development Program measures the welfare level of human development with three indices: income, education, and health (Xue et al., 2023). On this basis, this paper characterizes the welfare level of human development by four aspects: ED, education popularization, medical health, and environmental friendliness. Considering the poor accessibility of subjective welfare and other related data at the urban scale, GDP per capita, urban and rural residents’ income equalization level (per-capita disposable income of rural residents/per-capita disposable income of urban residents), and the employment rate are selected to characterize the welfare level of ED; educational resources per 10,000 people, the level of human capital of the city where it is located, and the number of public cultural and sports venues are selected to characterize the welfare level of education popularization. The number of beds in health institutions per 10,000 people and the number of doctors per 10,000 people are selected to characterize the welfare level of medical health; the green space per capita and the amount of investment in environmental health per 10,000 people are selected to characterize the welfare level of environmental friendliness. Table 1 details the corresponding definitions of these variables. The spatial distribution of EWP in 2011 and 2020 is shown in Figures 2, 3. (Note: All maps have been produced in accordance with the regulations of the State Administration of Surveying, Mapping and Geoinformation of China (Audit No.: GS(2019)1822) without any modification to the base map).

Table 1 Urban EWP indicator system.
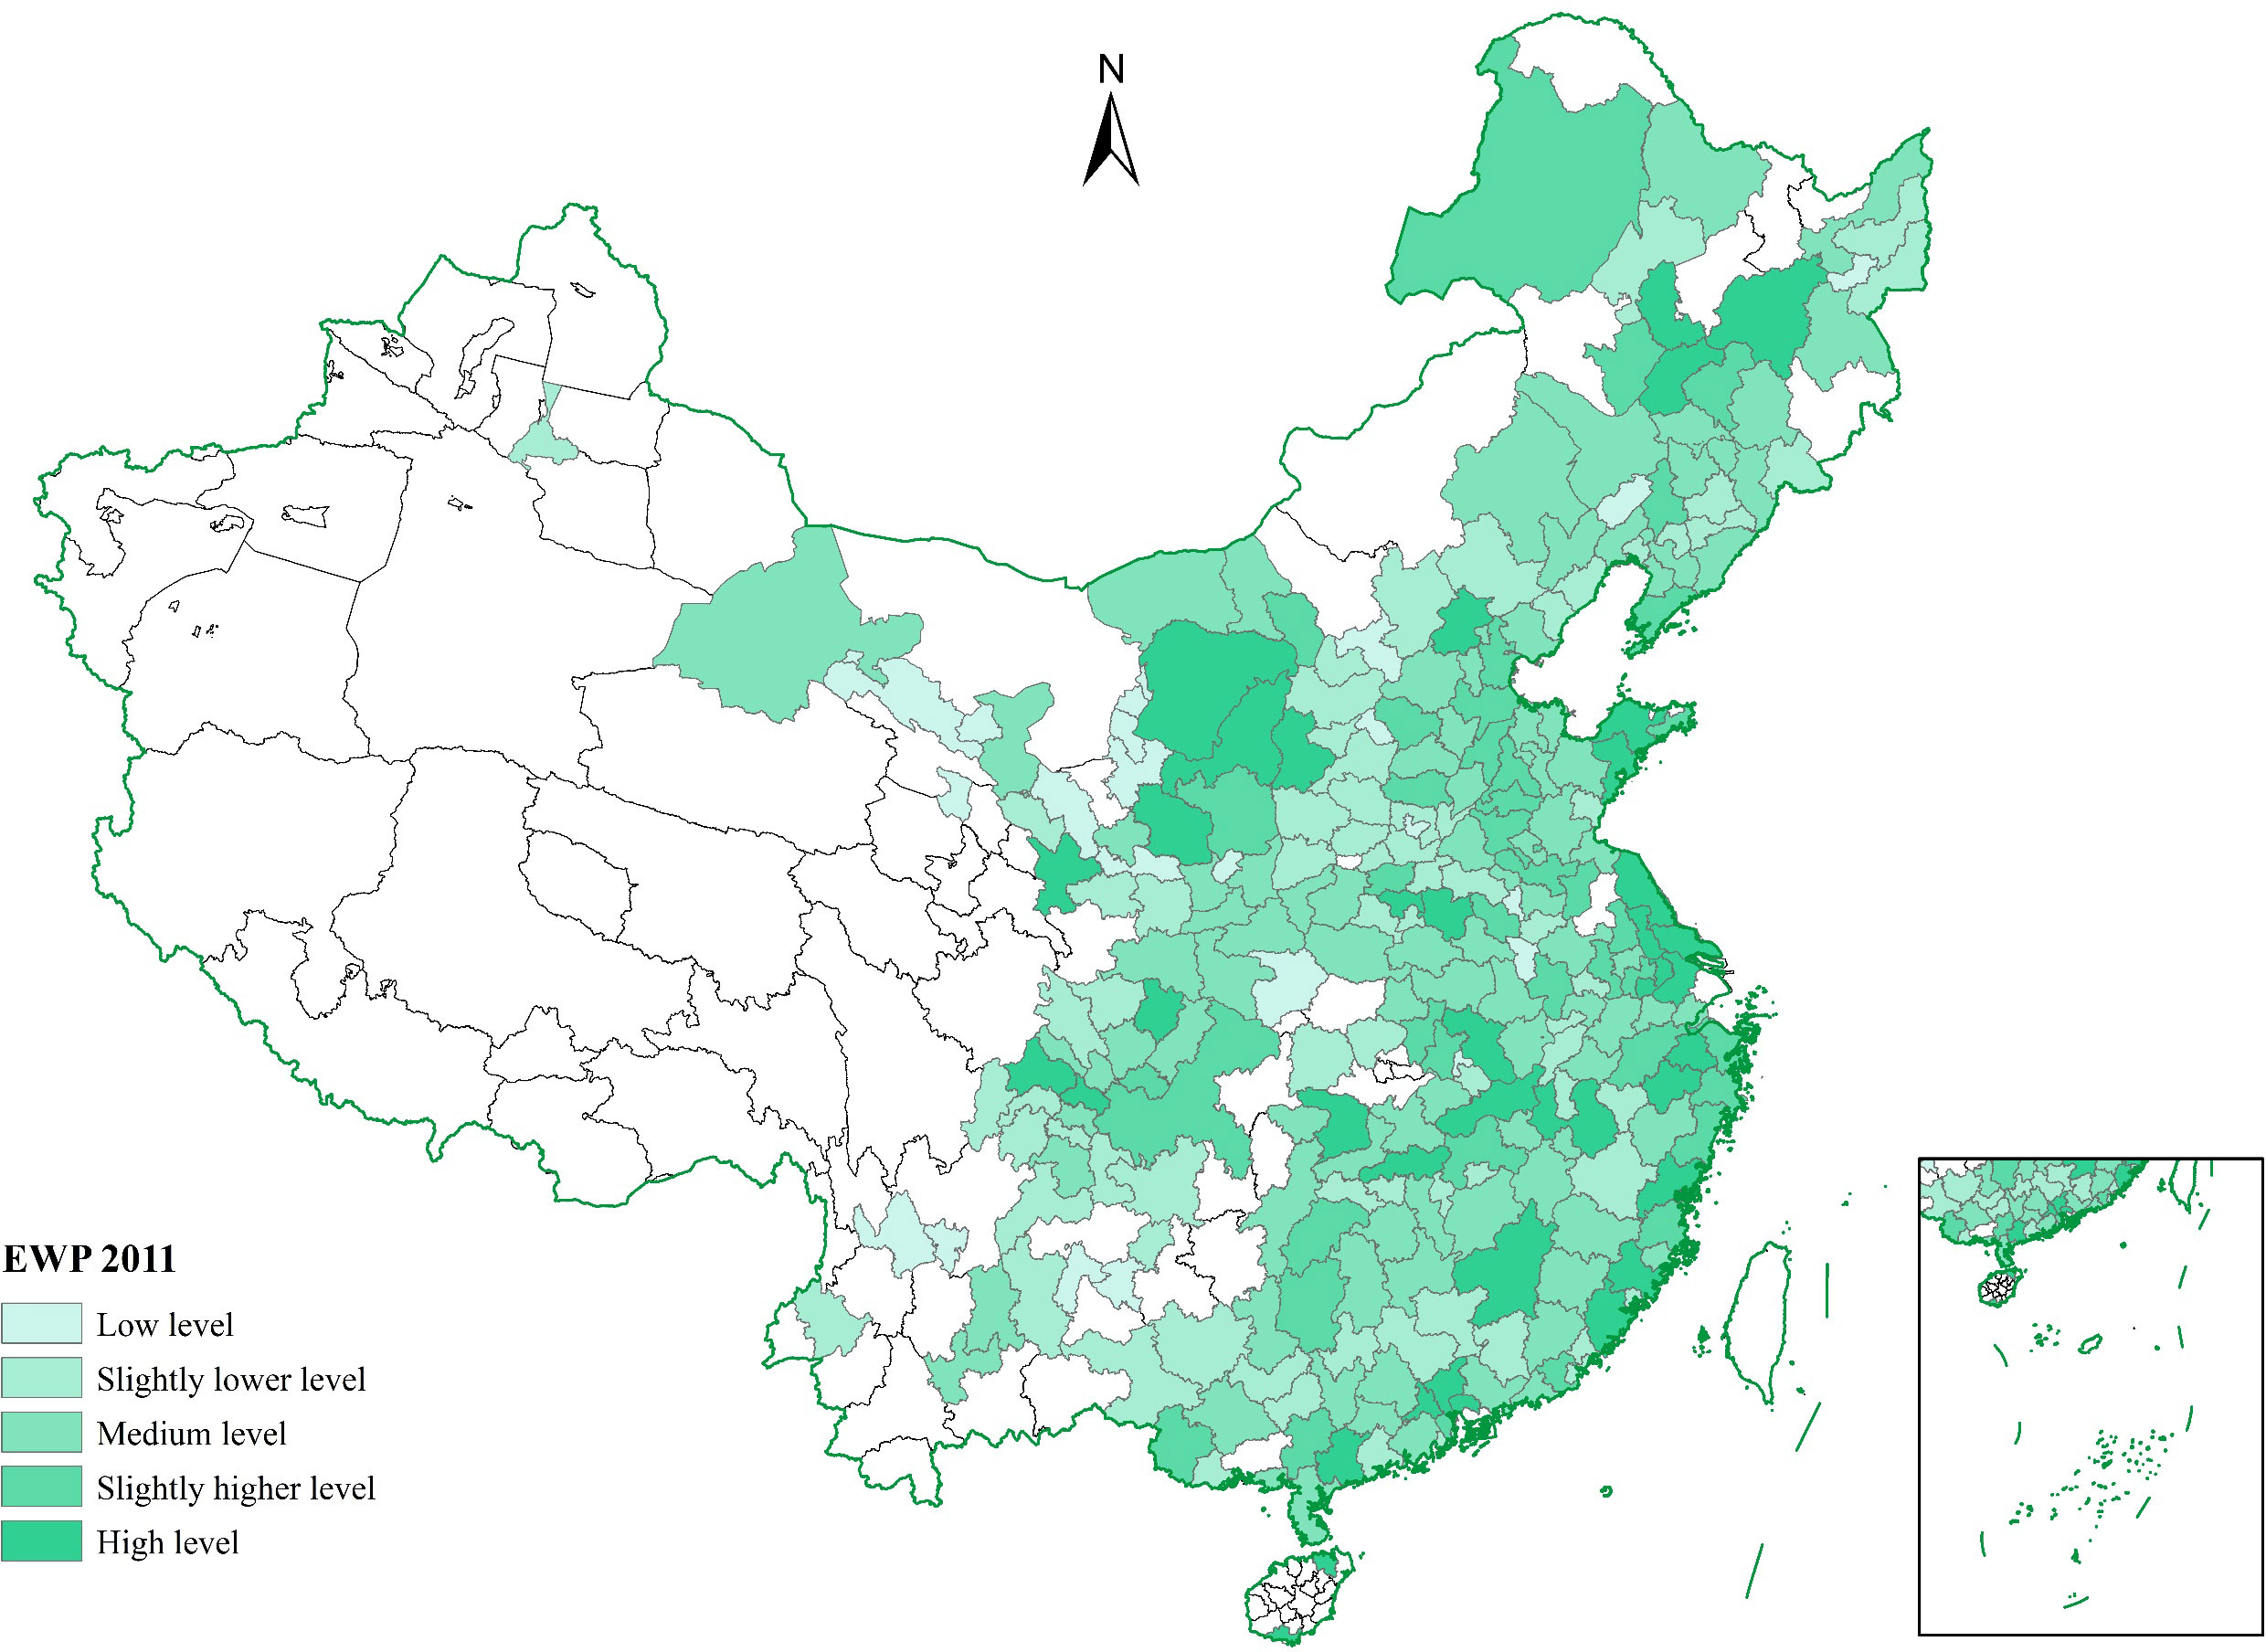
Figure 2 Spatial distribution of EWP in 2011.
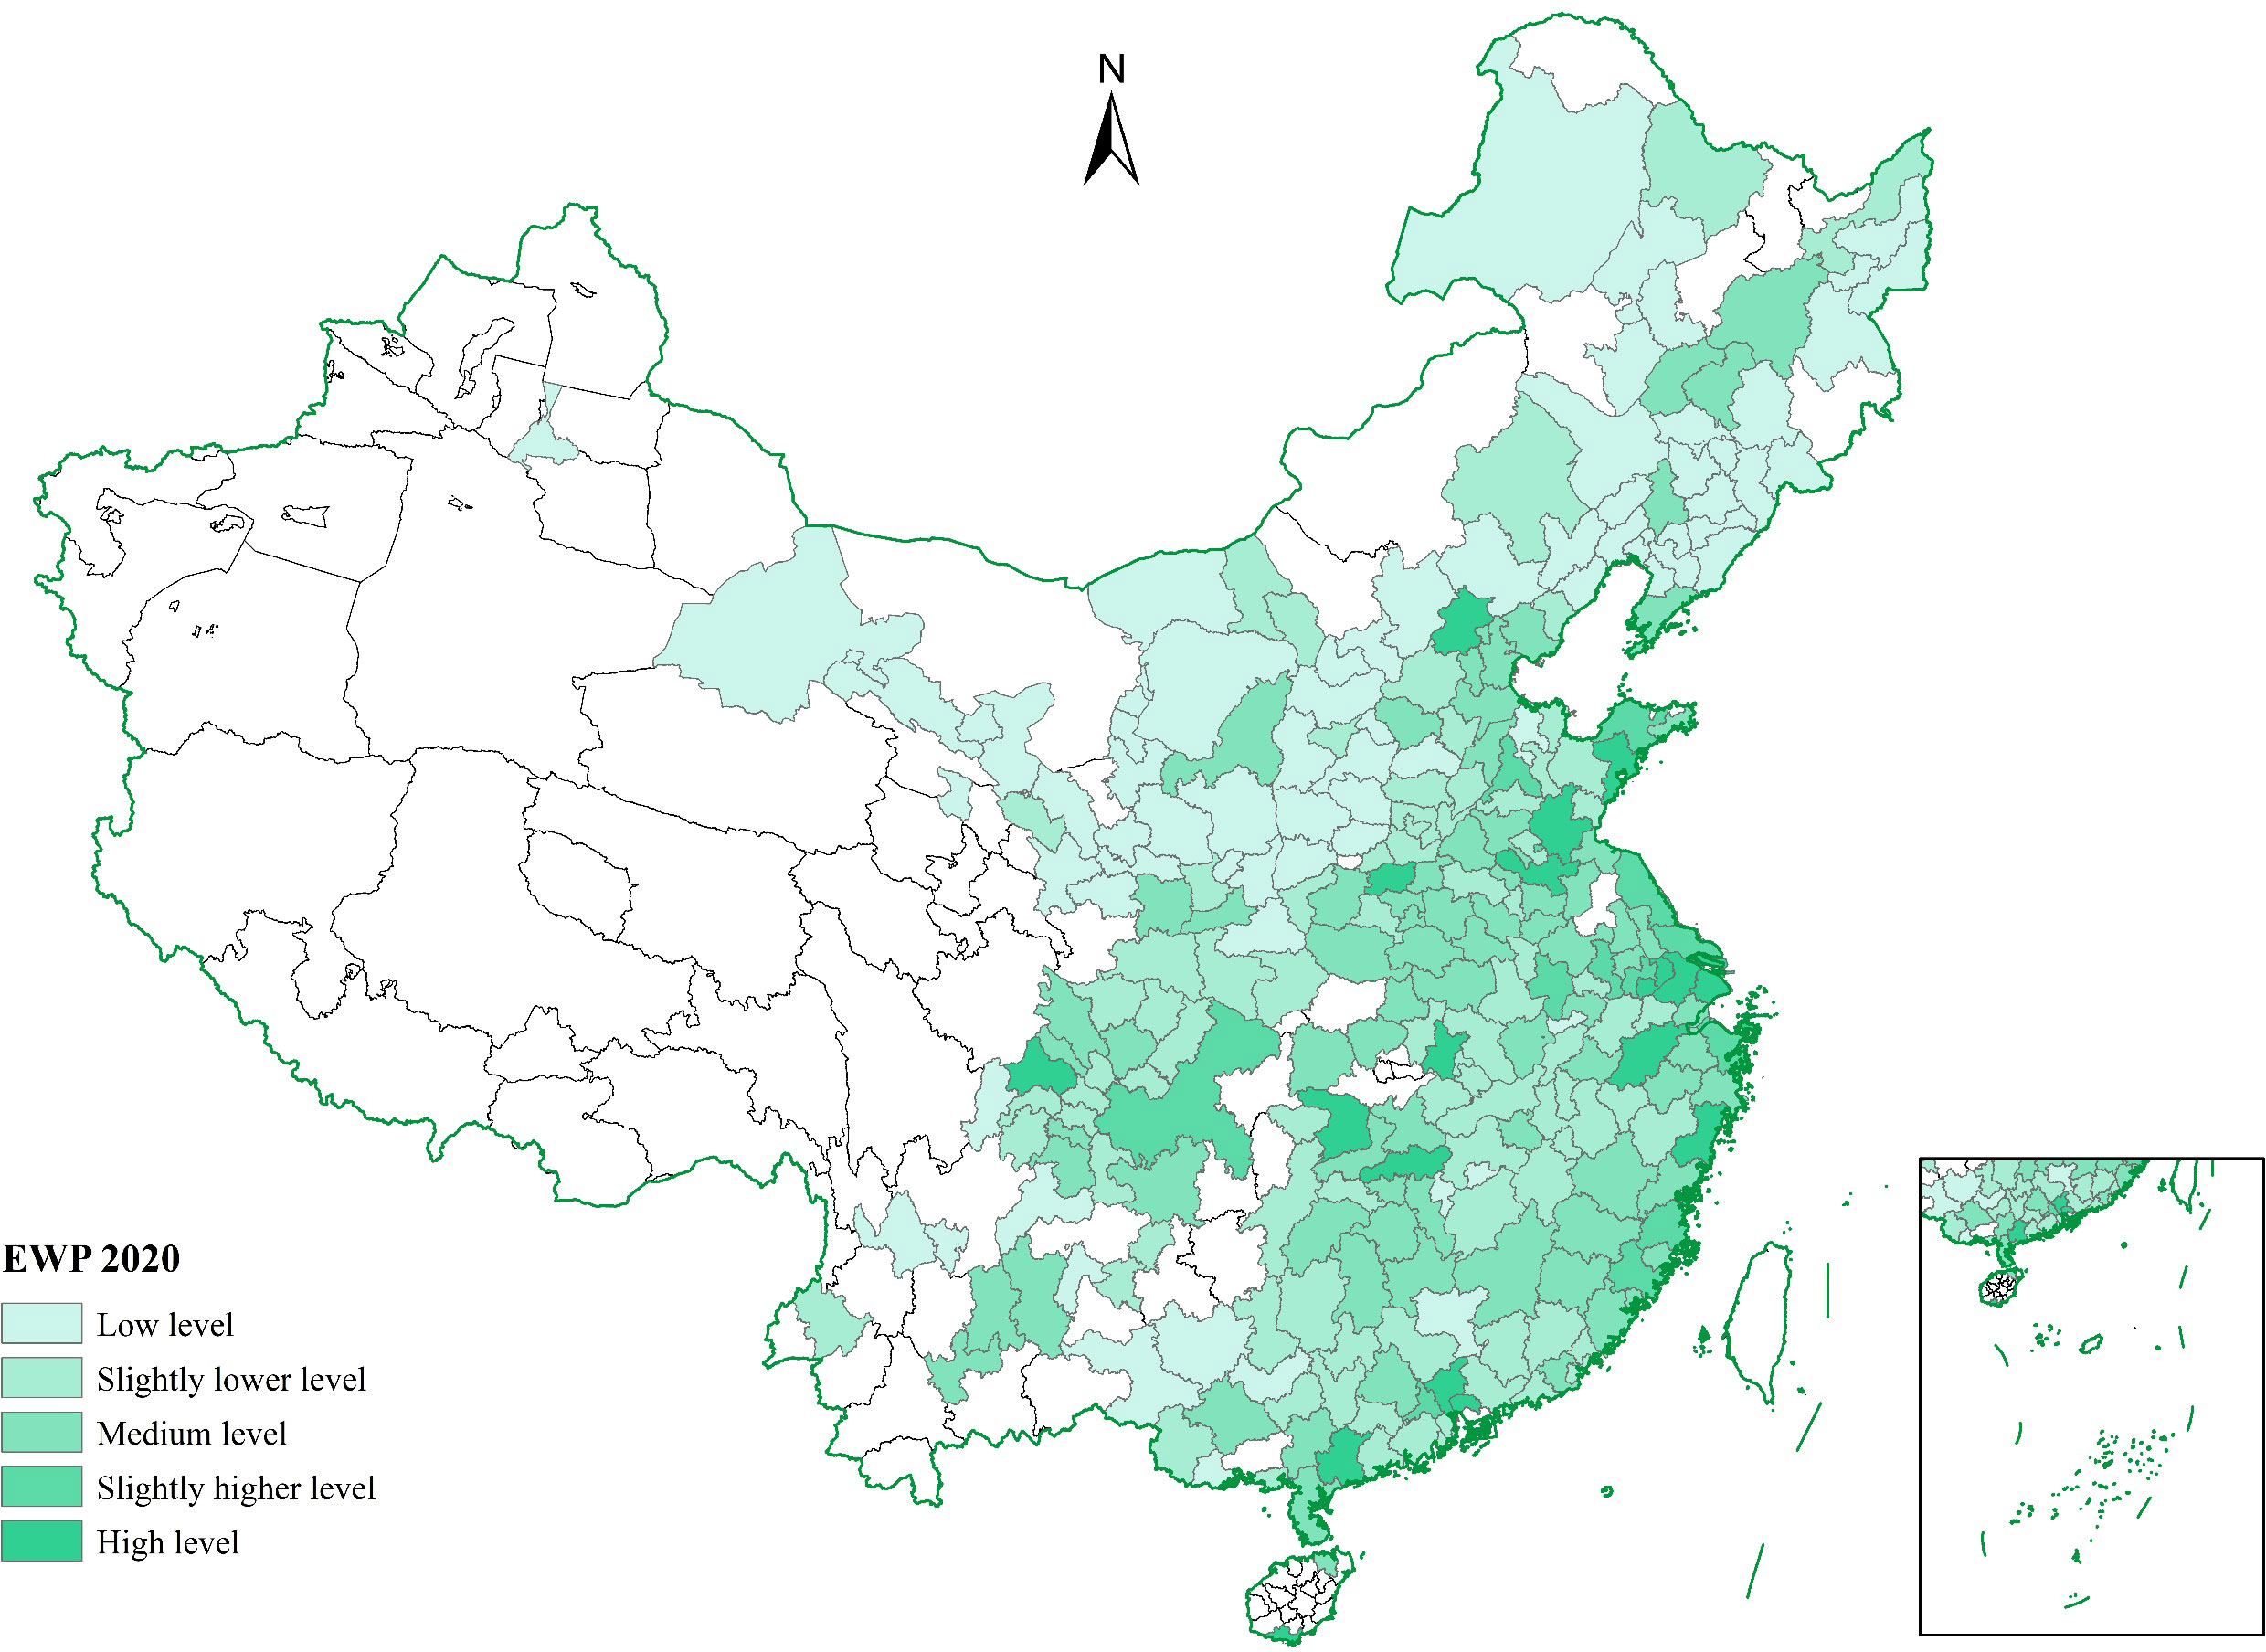
Figure 3 Spatial distribution of EWP in 2020.
4.2.2 Explanatory variables: level of development of DE
The existing literature mainly adopts the following two ways to measure the DE: one is to directly adopt the DE indexes of research institutes, which mainly include the DE Index of Chinese Cities by Xinhua San Group, the DE Index of Caixin Think Tank, and the DE Index of “Internet+” by Tencent Research Institute, and the other is to adopt the method of index system construction, in which scholars measure the DE multidimensionally from the aspects of digital infrastructure, digital industrialization, industrial digitization, and digital governance based on clarifying the connotation of DE (Zheng and Zhang, 2023). Considering that the DE index of research institutions mostly adopts enterprise or platform research data, the data exclusivity is strong, and the construction of its index system more reflects the characteristics of the industry, there is a certain degree of subjectivity that makes it difficult to portray the actual level of development of DE at the city level in China. Based on fully considering the authenticity, scientificity, and availability of data, the DE development indicator system at the city level is constructed. It mainly follows the following three principles: First, the principle of objectivity. Based on the inherent requirements of promoting China’s high-quality development, the selection of indicators objectively reflects the reality of the development of the city’s DE, avoiding the influence of subjective factors to the greatest extent possible. Second, the principle of comprehensiveness. It focuses on the specific objectives of “supporting, driving, relying on, and guaranteeing” the development of DE, corresponding to the four dimensions of digital integration capacity, digital innovation capacity, digital transaction capacity, and digital governance capacity as a guideline layer, covering all stages of the development of DE. Third, the principle of hierarchy. The indicator system deeply reflects the internal logic, main structure, and operation level of China’s DE development and is measured by 9 indicator layers and 17 specific indicators, including industrial digitization, digital industrialization, digital innovation inputs, digital innovation outputs, digital transaction bases, digital transaction impacts, e-government services, economic and social environments, and institutional environments (Table 1). The TOPSIS entropy weighting method in the objective assignment method is used as the main method to measure the development of DE, and the principal component analysis method is chosen as the robustness test. Table 2 details the corresponding definitions of the indicator system. The spatial distribution of DE in 2011 and 2020 is shown in Figures 4, 5.
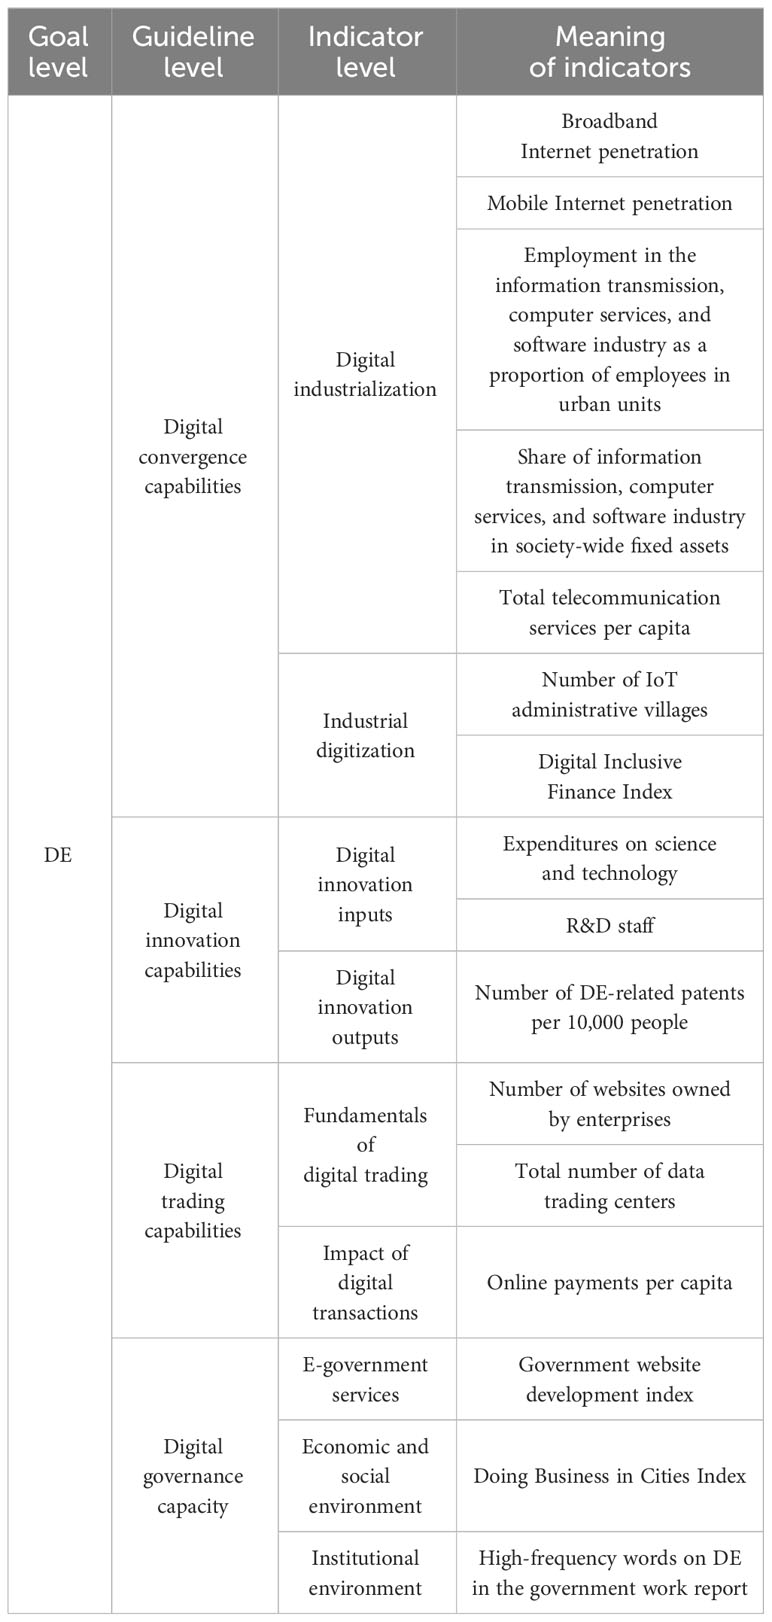
Table 2 DE development indicator system.
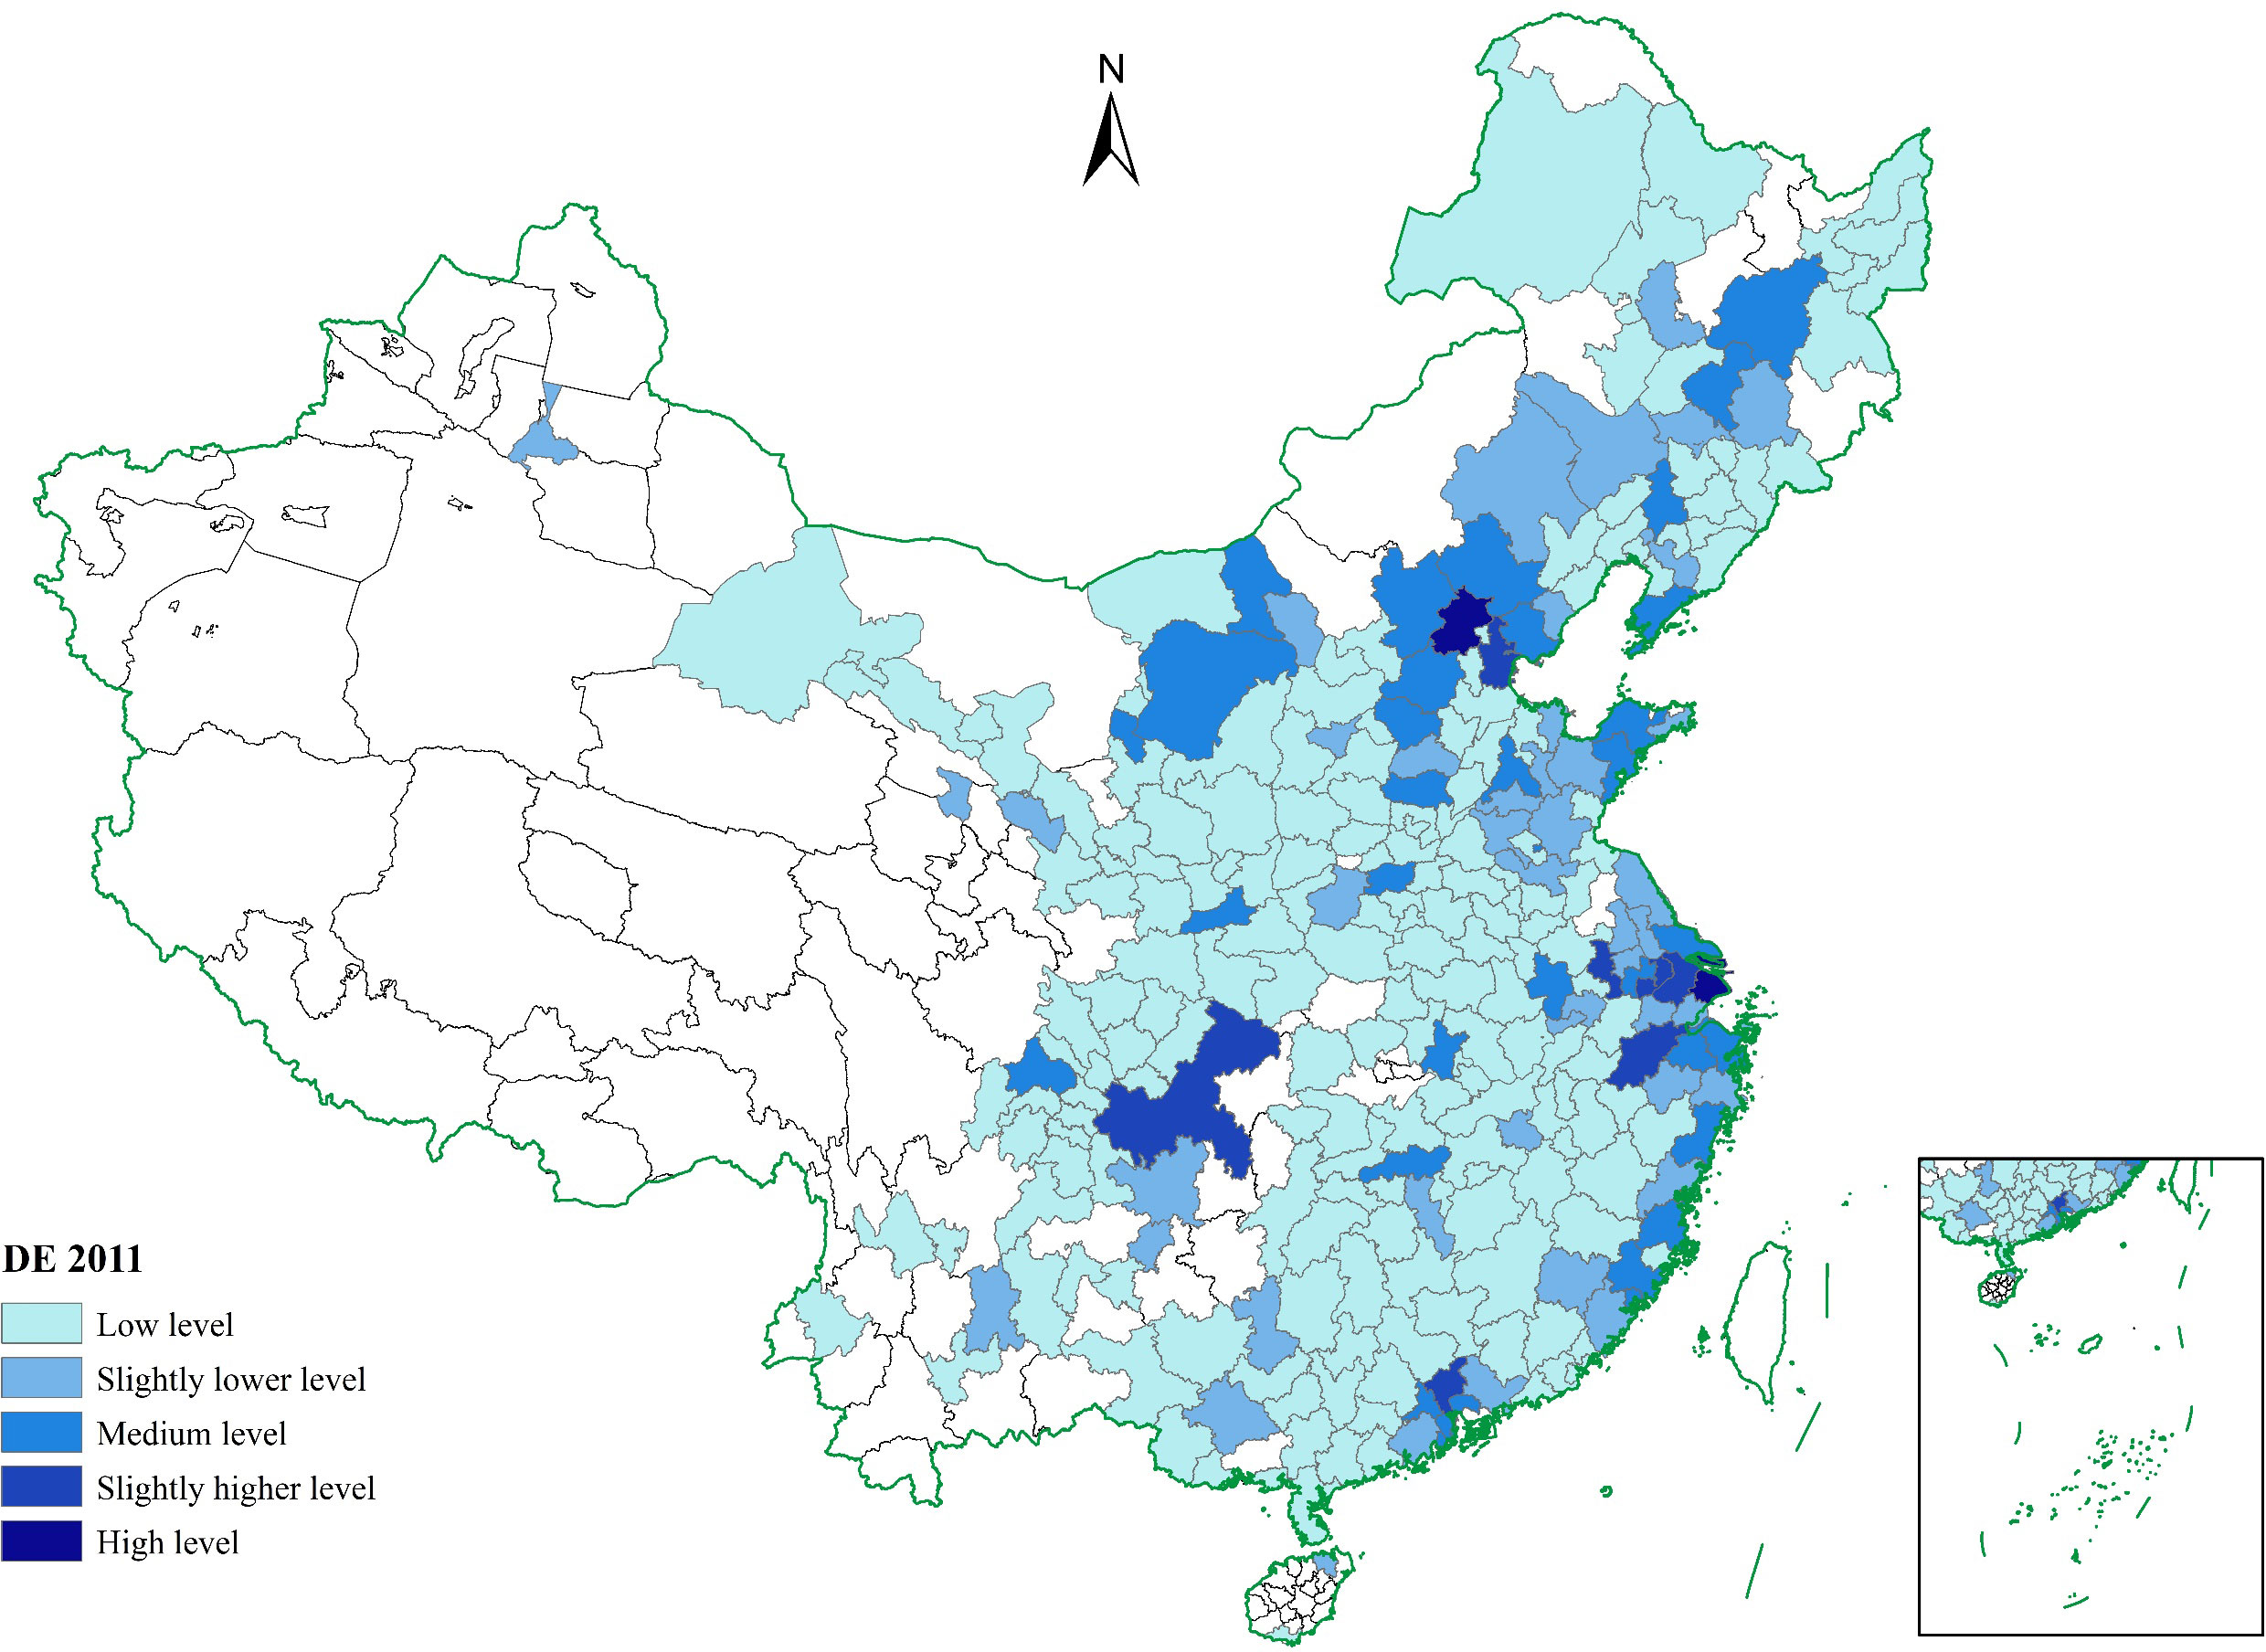
Figure 4 Spatial distribution of DE in 2011.
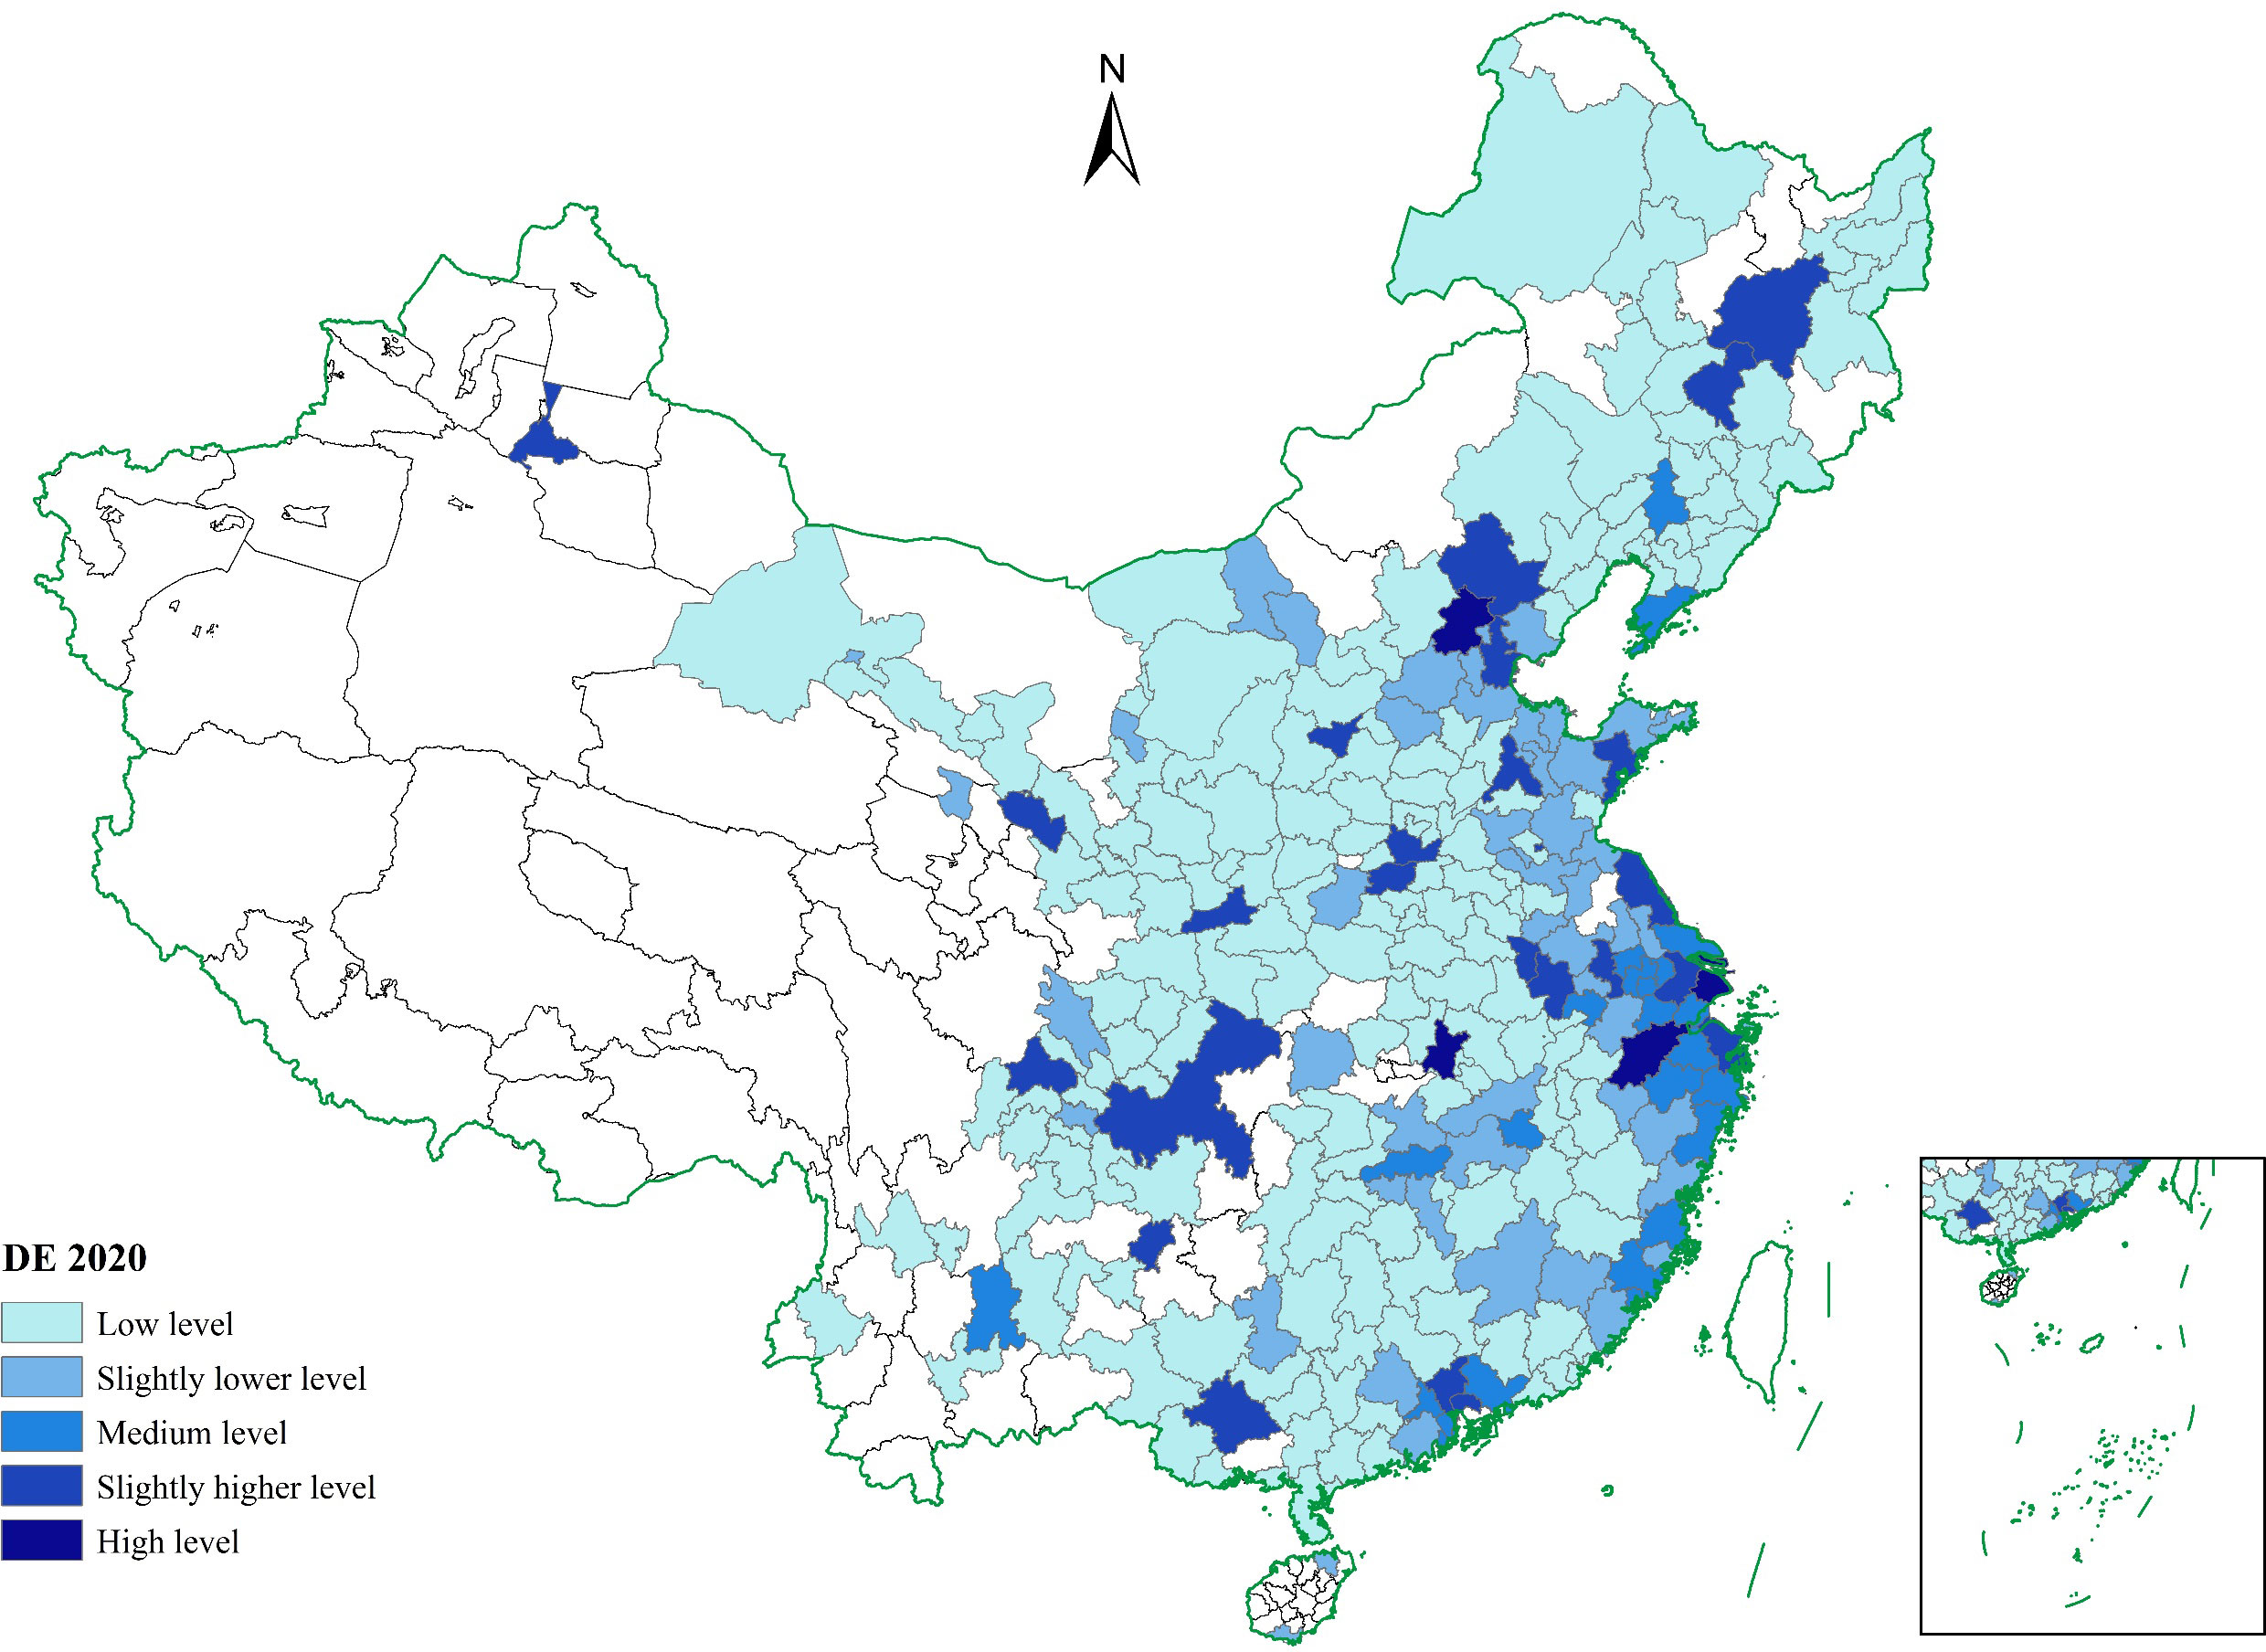
Figure 5 Spatial distribution of DE in 2020.
4.2.3 Control variables
To ensure the accuracy of the estimation of empirical results, based on the reference to the relevant information of Chen et al. (2023), and considering the availability of urban data, this paper also controls for other factors that may affect the performance of urban eco-welfare. The control variables are set as follows: Urbanization rate (CR): urban resident population/(urban resident population + rural resident population) is used. Housing price (HP): measured by the logarithm of the sales price per square foot of commercial housing in each city. Transportation passenger capacity (TP): measured using the natural logarithm of road passenger traffic (TP) (Wu et al., 2023). Transportation freight capacity (TF): measured using the natural logarithm of road freight volume (Chen et al., 2023). Government intervention (GI): measured using the ratio of local finance general budget expenditure to regional GDP. Resident consumption (RC): measured using the logarithm of total retail sales of consumer goods (Li and Yang, 2023). Industrial structure (IS): measured using the ratio of the value added of the tertiary industry to the value added of the secondary industry (Liu et al., 2018). Average worker wage (AW): measured using the logarithm of the average wage of urban workers (Roy and Mohanty, 2023).
4.2.4 Mechanism variables
According to the analysis above, the transmission mechanism of the DE on the EWP of the city includes the GTI effect, the optimization effect of factor allocation, and the energy-saving and utilization effect. GTI effect (GTI): measured by the natural logarithm of the number of green patents granted in the city (Huang et al., 2023). Factor allocation optimized efficiency (FAO): Using the Stochastic Frontier Approach (SFA) and Beyond Logarithmic Production Function (BLPF) to measure the TFP of the city, and then decomposing the TFP to obtain the factor allocation efficiency, thus measuring the optimization effect of factor allocation (Xue and Li, 2022). EUE effect: The SBM-GML-DEA method, which includes undesired outputs, is used to measure the city’s EUE, and then the EUE effect is measured (Wang et al., 2023).
4.2.5 Moderating variables
According to the analysis above, the effect of DE on the EWP of cities is influenced by the internal and external environmental factors of cities. The external urban environmental factor is the intensity of government ER (ER): measured using the natural logarithm of the frequency of words related to environmental protection in the government’s work report, such as environmental protection, low-carbon development, eco-friendliness, energy saving, and emission reduction (Song et al., 2022). The internal environmental factor is the RR level: measured by the RR index, which measures the urban RR index in terms of industrial revitalization, talent revitalization, cultural revitalization, ecological revitalization, and organizational revitalization (Zhang and Fan, 2023).
4.3 Data sources and descriptive statistics
This paper selects 270 prefecture-level cities in China from 2011 to 2020 as the research sample and carries out a series of screening for the sample: (1) cities with missing data for more than four consecutive years; (2) cities with administrative divisions adjusted or changed during the research period; and (3) cities with inconsistent statistical caliber in statistical yearbooks, national economic and social statistical development bulletins, and the EPS database. The following types of data are highlighted: City economic panel data: mainly from the EPS database of China City Statistical Yearbook and Regional Economic Statistical Yearbook; part of the missing data is supplemented by the bulletin of the development of national economic and social statistics of each city, and consecutively missing data (≤3 years) are filled in using the linear interpolation method. For price attribute indicators, the GDP deflator was used to deflate to the real value with 2011 as the base period.
DE Indicator Data: Digital Inclusive Finance Data from China’s Digital Inclusive Finance Index (http://tech.antfin.com/research/data) are calculated by the Digital Finance Research Center of Peking University in cooperation with the Ant Financial Services Group; DE-related Patent Data are from the Patent Search Website of the State Intellectual Property Office (http://pss-system.cnipa.gov.cn/); the Government Website Development Index is from the Research Report on the Development of Chinese Government Websites compiled by the Research Center for Online Government of the State Information Center (http://pss-system.cnipa.gov.cn/); the Government Website Development Index is from the Research Report on the Development of Chinese Government Websites (http://www.sic.gov.cn/) compiled by the Research Center for Online Government of the State Information Center. The urban business environment index mainly refers to the approach of Nham et al. (2023), which measures seven dimensions: public services, human resources, market environment, innovation environment, financial services, rule of law environment, and government environment. The high-frequency words of the government work report on DE are mainly processed with the help of ROSTCM6.0 software to eliminate redundant words such as “realize, batch, business, and form”, and finally extract the top 100 words that appear more frequently in the report and reflect the focus of the DE policy. Table 3 shows the descriptive statistics of the main variables. The mean value of urban EWP is 0.3443, the standard deviation is 0.1415, the minimum value is 0.0428, and the maximum value is 0.7881, which means that the level of EWP of different cities varies greatly. The mean value of digital ED is 0.0562, the standard deviation is 0.0495, the minimum value is 0.0157, and the maximum value is 0.6163, which means that there is a large difference in the level of digital ED of different cities, and some cities have a higher level of digital ED, but some cities are lagging behind in the development of DE. The distribution characteristics of the rest of the control variables are roughly the same as those of previous studies and will not be repeated.
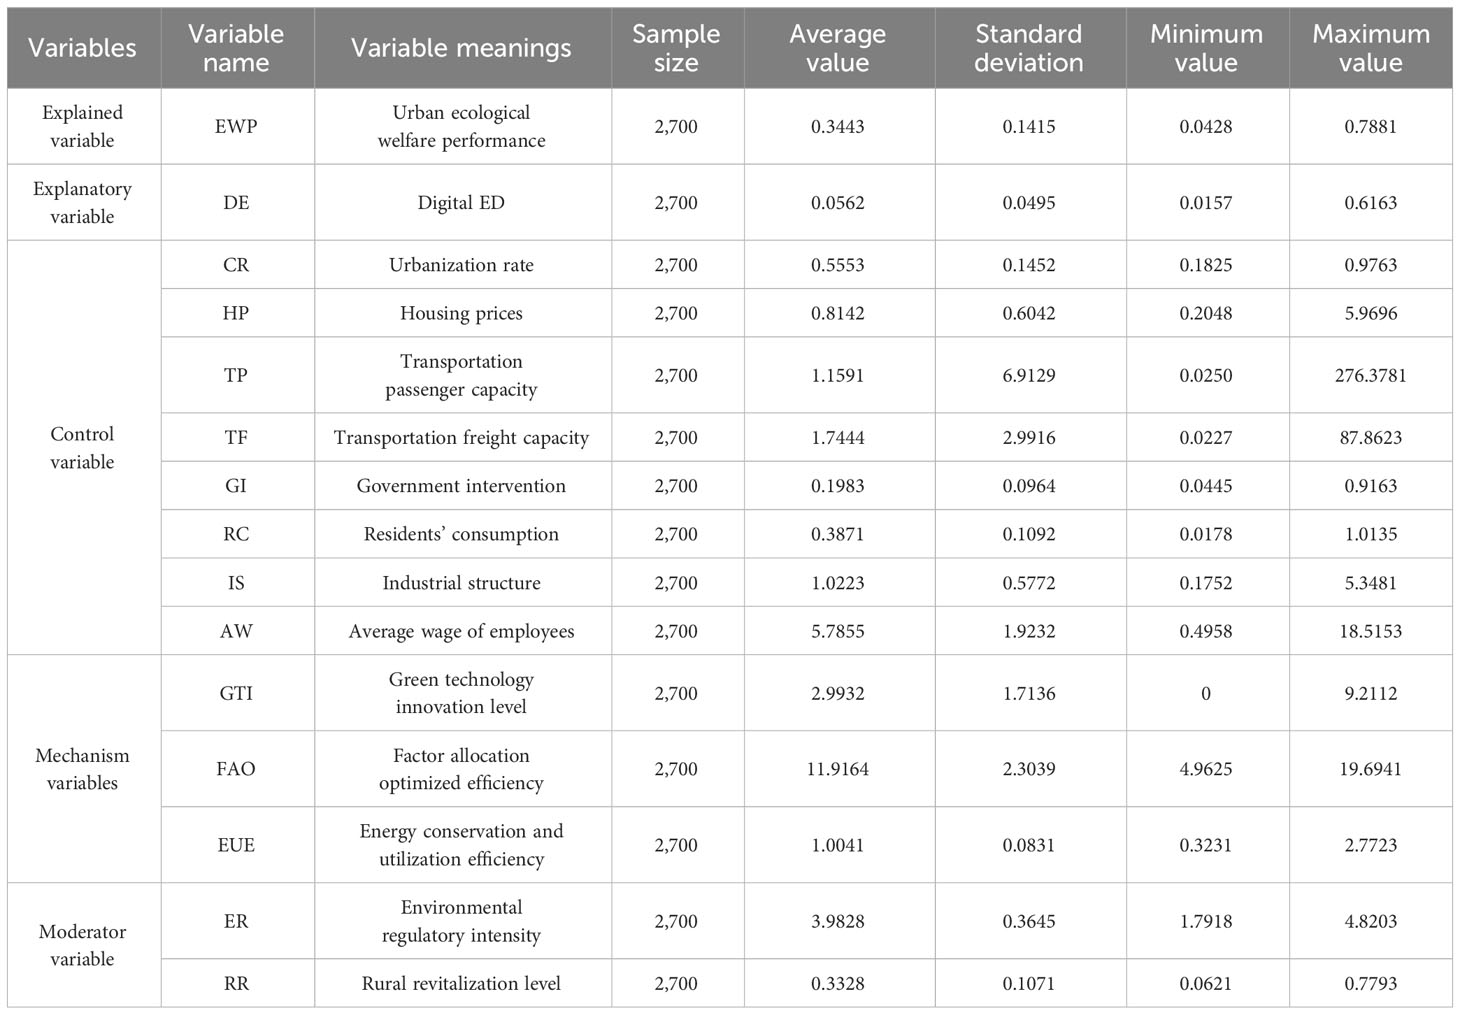
Table 3 Descriptive statistics of the main variables.
5 Empirical findings and discussion
5.1 Model setting tests
In the first step, the spatial effects of DE (DE) and urban EWP (EWP) in 2011–2020 were measured by Moran’s I index method, and the results are shown in Table 4. It can be found that Moran’s I of urban EWP (EWP) and DE (DE) are both significantly positive at the 1% significance level, indicating that there is spatial autocorrelation between urban EWP and DE in China from 2011 to 2020.
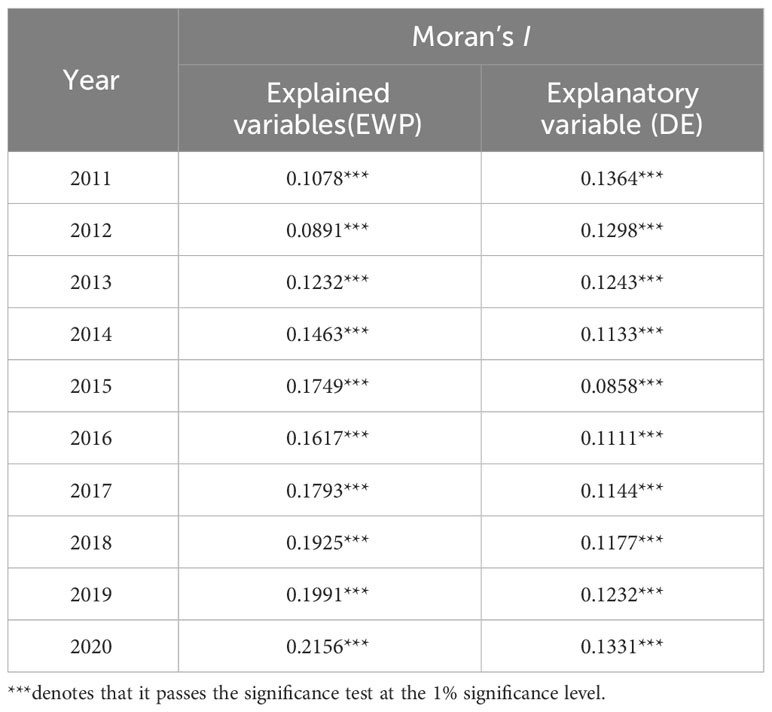
Table 4 Moran’s index correlation results.
The second step is to choose the spatial panel model. According to Ren et al. (2022) test ideas for a series of tests: first, the results of the LM test show that the LM-lag, LM-error, and RLM-lag tests all passed the test at the 1% significance level, while the RLM-error test failed to pass the test, indicating that the panel data that have spatial correlation can be applied to the SAR model; second, the Wald test results are very significant, indicating the rejection of SDM model degradation into SAR and SEM models, while the LR test results are also at the 1% significance level, which is consistent with the Wald test results, and therefore, the SDM model should be selected; third, the Hausman test is used to select the fixed effects or random effects, and the Hausman test results are significant at the 1% significance level, indicating that the SDM fixed effects model is optimal; fourth, the LR test is used to choose the kind of fixed effect, and the test result shows that the SDM model with spatiotemporal double fixation should be chosen.
5.2 Benchmark regressions
To compare and test the stability of the variable parameters, this paper includes the results of OLS, SAR, SEM, and SDM with urban and time double fixed effects in the benchmark regression, as shown in Table 5. From the regression results of the OLS model in Table 5, it can be seen that the coefficients of the variables DE and DE2 are always positive at the 1% significant level, which initially indicates that the impact of the DE on urban EWP presents a “J”-type characteristic of increasing marginal effect; i.e., the development of DE plays an “accelerator” role in the urban EWP. That is, the development of DE plays a “gas pedal” role in urban EWP. The regression results of the SDM model show that the coefficients of variables DE and DE2 are still significantly positive, which is consistent with the results of the previous model, and at the same time, ρ passes to be significantly positive, indicating that the urban EWP has a positive spatial spillover effect on itself. However, the coefficients of the spatial interaction terms of variables DE and DE2 are significantly negative and positive at the 1% and 10% levels, respectively, which indicates that the DE has a significant spatial effect and shows a prioritization effect of DE, as well as the “U” shape characteristic of siphoning and then overflow. In summary (according to the hypothesis), with the development of DE, the DE not only enhances the promotion of local EWP but also gradually changes the influence on the EWP level of neighboring cities from inhibition to promotion, and Hypotheses 1a and 1b are established. Both R2 and Sigma2_e statistics in the SDM model test passed the test, indicating that the model in this paper fits better and the empirical results are more credible.
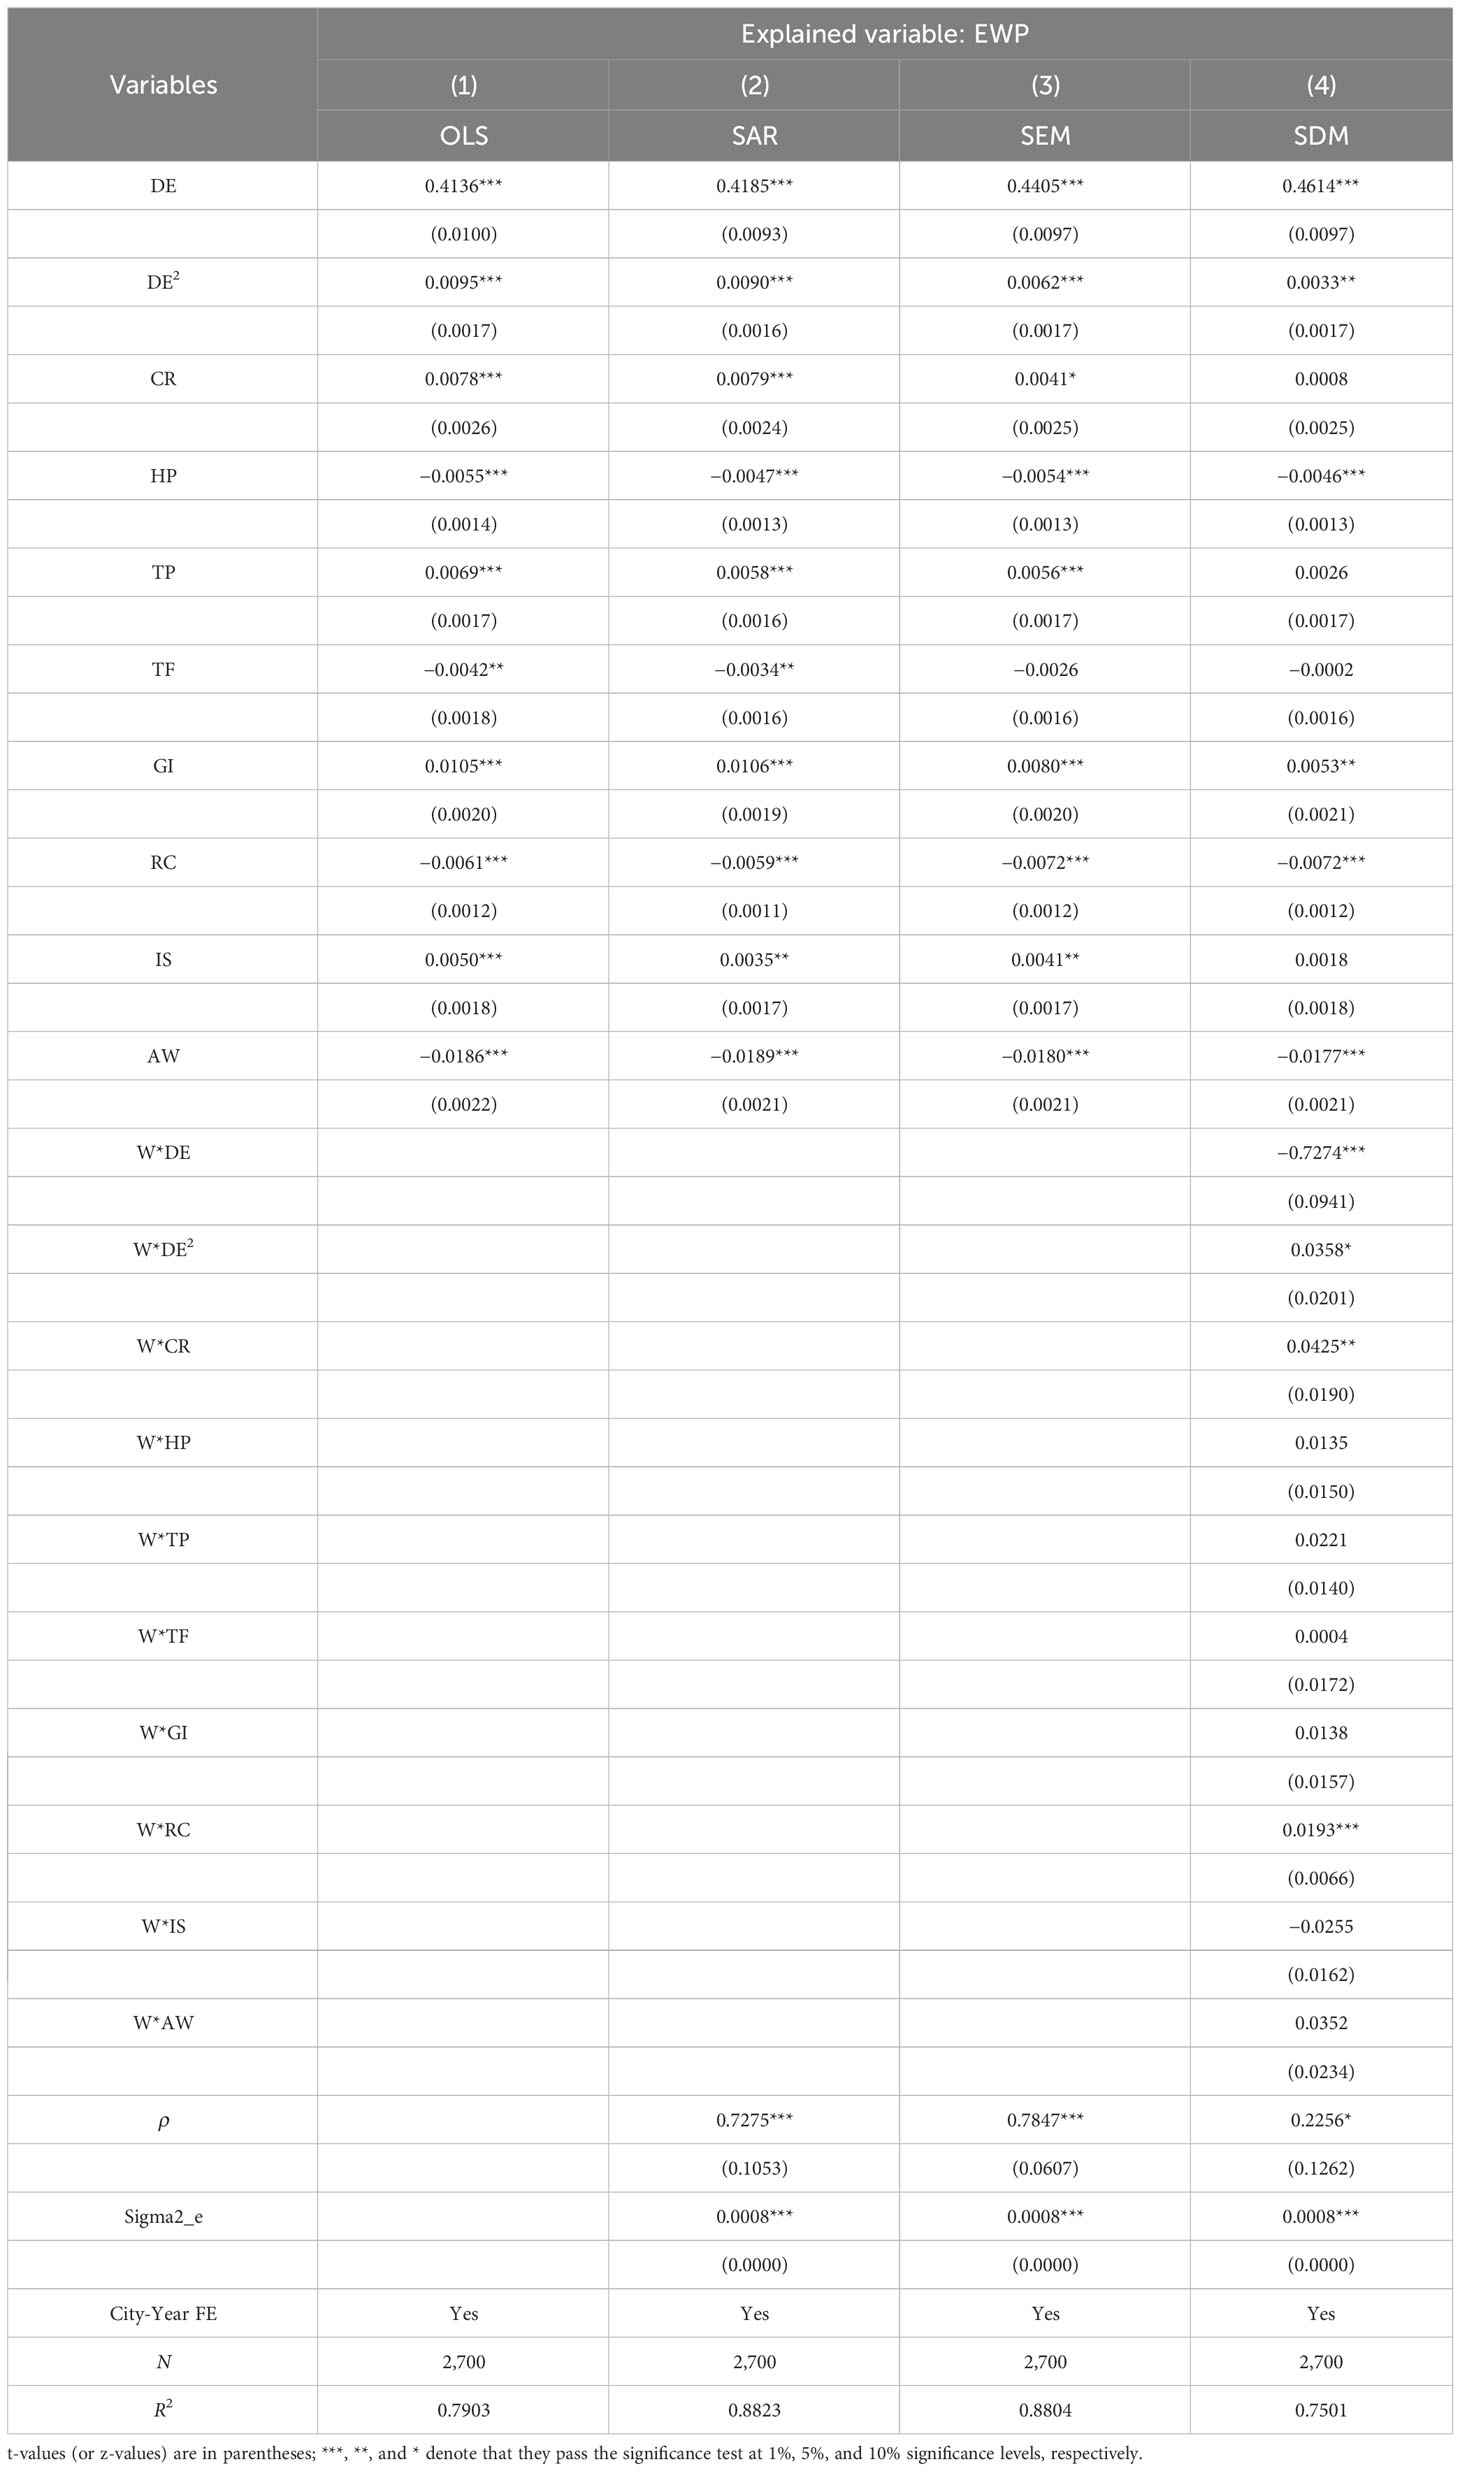
Table 5 Benchmark regression results.
Analyzing the spatial spillover effects between regions only through simple point regression results may produce misestimation; thus, the partial differential explanation of variable changes, i.e., direct effect and indirect effect (spatial spillover effect), are used for further explanation, and the results of effect decomposition are shown in Table 6. The results show that the direct effects of DE and DE2 are both positive at the 1% significance level, and their spatial spillover effects are negative and positive at the 1% significance level. From the quantitative coefficients of the spatial decomposition, it can also be seen that the spatial spillover effect of the DE on the performance of the urban EWP accounts for more than 63.87% of the total effect, which indicates that the DE is able to influence neighboring cities through the significant spatial effects to neighboring cities. Combining the results of Tables 2, 4, it can be seen that DE can reduce the limitation of spatial and temporal distance and the degree of administrative boundary division through data elements, digital platforms, and digital technology, and then promote the overflow of green innovation resources and reduce pollution emissions, which not only can have a marginal effect of increasing the promotion of the EWP of the local city but also will have a nonlinear effect of inhibiting and then promoting the EWP of the neighboring cities through the spatial overflow effect. The spatial spillover effect will also have a nonlinear effect on the EWP of neighboring cities. The above benchmark regression results are basically consistent with the findings of Lyu et al. (2023b). The imbalance in the development of DE leads to a “digital gap” between the central city and the peripheral cities, and thus produces a nonlinear spatial effect that inhibits and then promotes the EWP of neighboring cities.
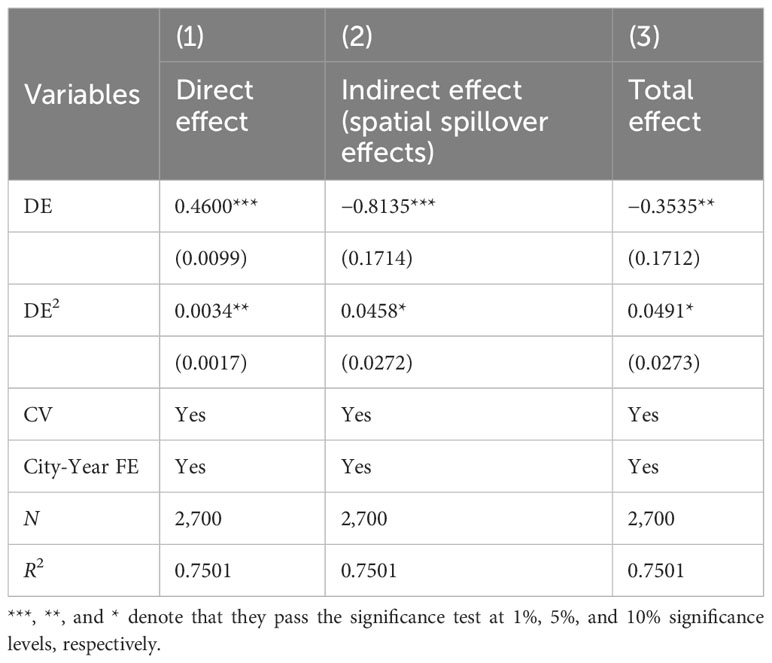
Table 6 Effect decomposition results.
5.3 Robustness tests
5.3.1 Replace the spatial weight matrix
To ensure the robustness of the above empirical results, this paper constructs the economic–geographical distance nested matrix as a new spatial weight matrix for analysis, and the nested matrix is constructed as shown in Equation 7 above. The estimation results are shown in column (1) of Table 7, the coefficients of variables DE and DE2 in the direct effect of DE development are significantly positive, and the coefficients of variables DE and DE2 in the indirect effect are significantly negative and positive, respectively, which indicates that the proximity of the economic geographic distance will strengthen the spatial spillover effect of the DE, and that the DE development can improve the local EWP level and have an initial inhibitory effect and then a promoting effect on the EWP level of the neighboring cities. The development of DE can increase the local EWP level and inhibit and then promote the EWP level of neighboring cities.
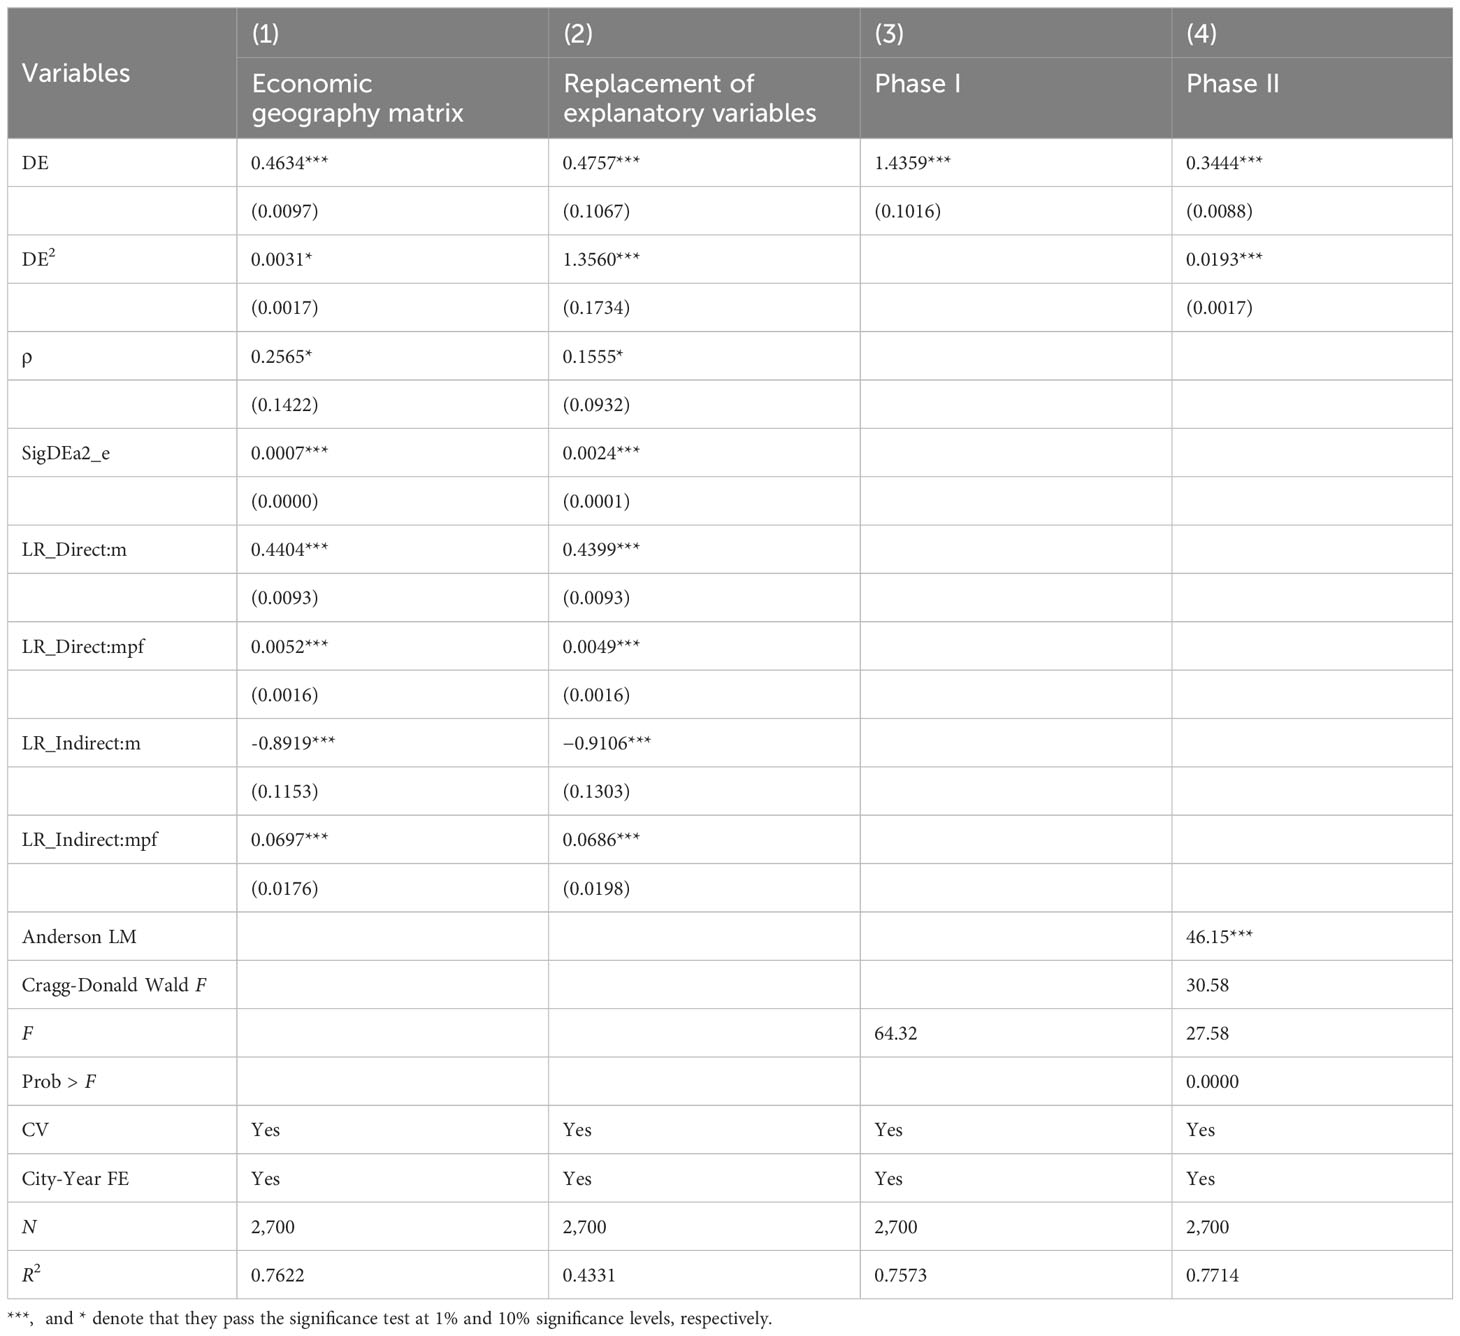
Table 7 Robustness test results.
5.3.2 Substitution of explanatory variables
At present, some scholars measure the level of urban digital development from micro enterprise data; this paper draws on the practice of Wang and Shao (2023): first, extract the text of the annual report of listed companies and, according to the five characteristics of the vocabulary of artificial intelligence, blockchain, cloud computing, big data, and data applications in the enterprise annual report to search, match and calculate the digital word frequency to obtain the total digital word frequency of each enterprise; the word frequency is summarized to the city level according to the location of the enterprise, the proxy variable of the city’s DE development level is obtained and then regressed, and the results are shown in column (3) of Table 7. The results show that the development of DE can have a marginal incremental effect on the local EWP level and inhibit and then promote the EWP level of neighboring cities.
5.3.3 Endogenous processing
There may be potential endogeneity problems in the model of this paper, which mainly come from the omitted variable problem and reverse causality. To deal with these problems, this paper firstly selects appropriate instrumental variables and processes them using the two-stage least squares method. In this paper, the number of fixed-line telephones owned by the city in 1984 is used as an instrumental variable for the development of DE (Xin et al., 2023). On the one hand, the construction and improvement of urban telecommunication and network infrastructure is an important foundation for the development of DE, and China’s Internet was initially accessed by telephone dial-up; thus, cities with higher fixed-line telephone ownership historically should have higher levels of DE development, which is in line with the condition of instrumental variable correlation (Zhou et al., 2019). On the other hand, the number of fixed-line telephone ownership in 1984 can hardly have an impact on the innovation of inter-city cooperation nowadays, which satisfies the condition of exogeneity of instrumental variables. However, the number of fixed-line telephone ownership in 1984 is cross-sectional data and cannot be used in panel data regression. This paper refers to the practice of Bi et al. (2022), introduces a time-varying variable, and selects the amount of urban Internet investment as a time-varying variable, and finally, this paper uses the amount of Internet investment in the last period and the number of fixed-line telephone ownership in 1984 to form an interaction term as an instrumental variable. Columns (3) and (4) in Table 7 show the results of 2SLS regression. The first-stage regression results show that the core explanatory variables and instrumental variables show a significant positive correlation, in which the Cragg–Donald Wald F-statistic is 30.58, which is much larger than 10, and excludes the problem of weak instrumental variables. The results of the second-stage regression show that the effect of DE development on the performance level of urban EWP is still significantly positive. Therefore, after considering the endogeneity problem, it is still found that DE can have a marginal incremental effect on the level of urban EWP. In summary, the findings of this paper are robust.
5.4 Analysis of impact mechanisms
The above theoretical level analyzes the intrinsic influence mechanism of DE on urban EWP and puts forward research hypotheses to test whether the hypotheses are valid; this part of the mechanism test is from three aspects, namely, the GTI effect, the FAO effect, and the energy-saving and utilization effect. Table 8 shows the OLS and SDM results of DE on the mechanism variables, and mainly observes the results of direct and indirect effects.
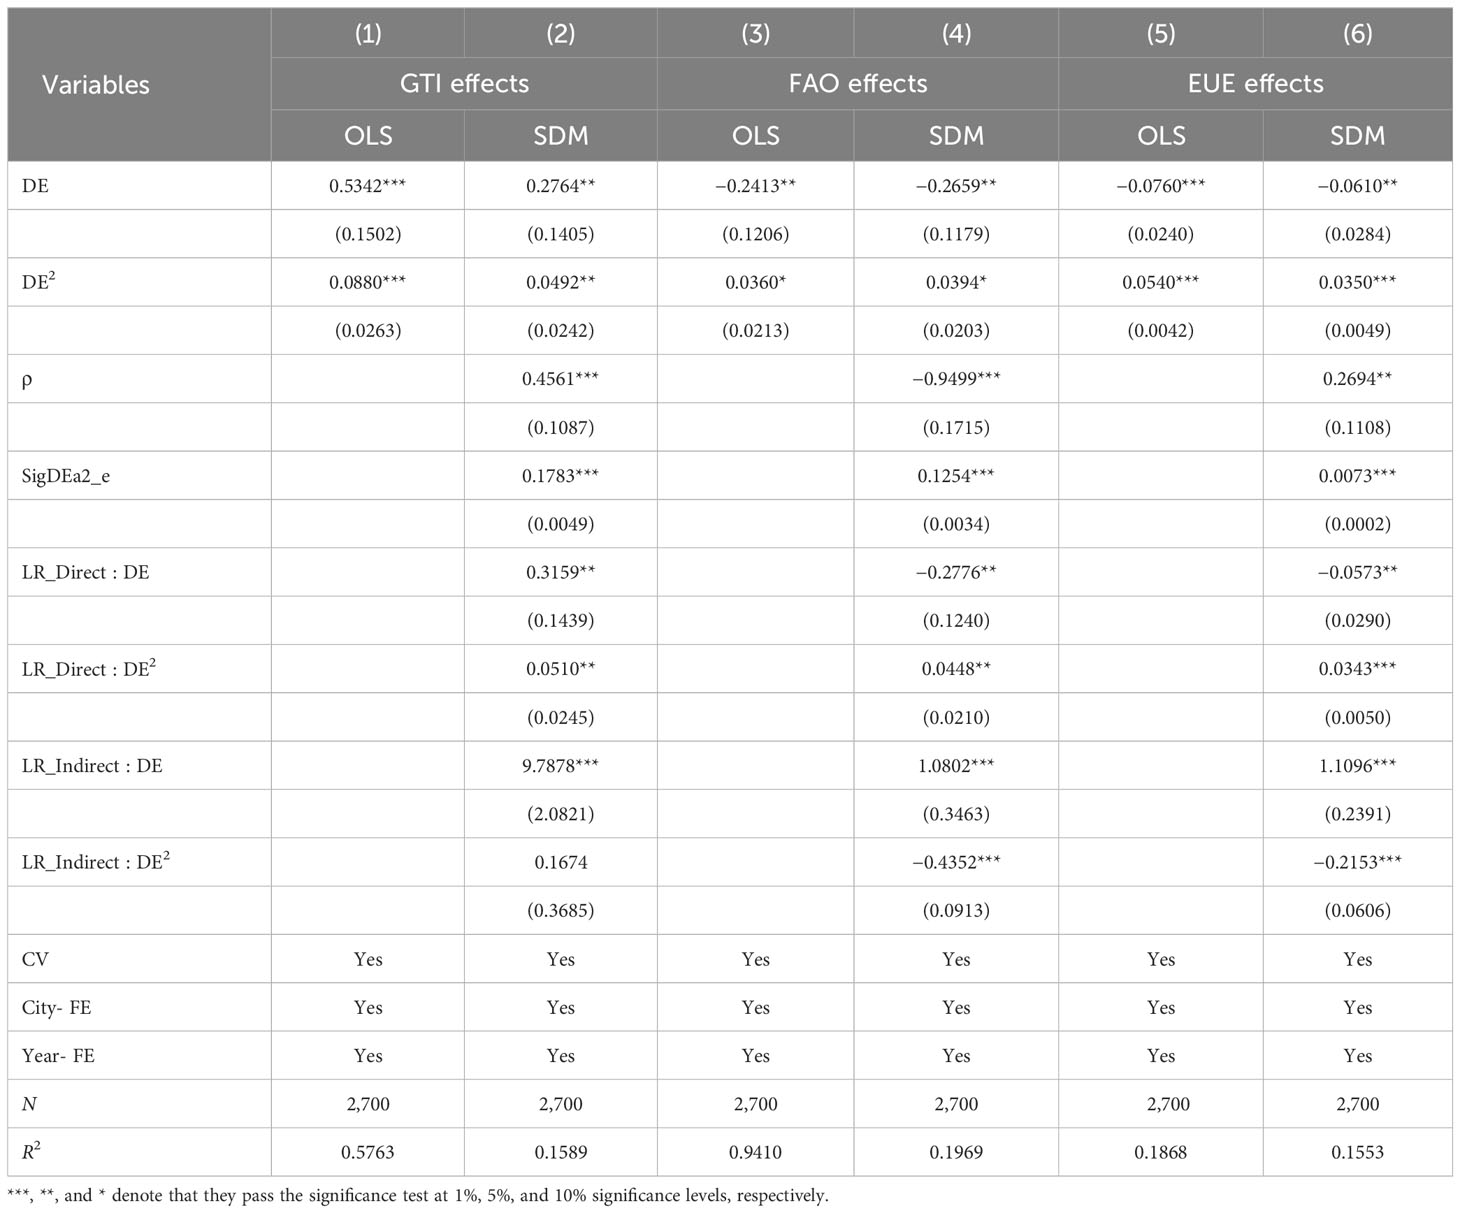
Table 8 Mechanism test regression results.
5.4.1 GTI mechanism
The results in column (1) of Table 8 show that DE is conducive to strengthening the GTI effect, and there is a marginal incremental “J”-type characteristic of the impact on GTI; the results in column (2) show that the direct and indirect effects of DE on the level of GTI in the city are significantly positive, and there is a significant spatial spillover effect, indicating that DE can not only strengthen the local GTI effect but also help strengthen the GTI effect of neighboring cities, and then integrate them into the regional ecological construction and GTI through strengthening the linkage between the cities. The results in column (2) show that the direct and indirect effects of DE on the level of urban GTI are both significantly positive, and there is a significant spatial spillover effect, which indicates that the development of DE not only strengthens the effect of local GTI but also facilitates the strengthening of the effect of GTI in the neighboring cities, and then integrates them into the regional eco-construction and promotes the ecological performance of the city through strengthening the linkage of GTI between the cities. The above regression results are consistent with the conclusion of Yanwei Lyu et al. (2023c). Technological innovation is the main channel through which the DE influences low-carbon development, but GTI may crowd out other technological innovations at the initial stage, and thus the DE promotes EWP to a lesser extent in the early stage.
5.4.2 Mechanisms for optimizing the allocation of elements
The results in column (3) of Table 8 show that the impact of DE development on the FAO effect is characterized by a U shape; the results in column (4) show that the direct effect of DE development on the FAO of the city is the impact of inhibition followed by facilitation, and the indirect effect is the impact of facilitation followed by inhibition, and there is a significant spatial spillover effect. The possible reasons for this result are as follows: there are differences in the level of digital infrastructure among cities, and although the DE accelerates the factor flow in the early stage of development, it will promote the aggregation of local factors to a small number of core cities, and the development of DE in the core cities will have a siphoning effect on the surrounding cities, which will form the digital divide and inhibit the efficiency of the local FAO, and is not conducive to the enhancement of the performance of the city’s eco-welfare. However, with the development of DE, the digital infrastructure of each city has been popularized and improved, and the factors in the core cities gradually flow back to the local area, improving the allocation efficiency of the local factor market; thus, the development of DE through the FAO effect on the EWP of the city is suppressed, and the impact of Hypothesis 4 is established.
5.4.3 EUE mechanisms
The results in column (5) of Table 8 show that the impact of DE development on the EUE effect shows a U-shaped characteristic; the results in column (6) show that the direct effect of DE development on the EUE effect of the city is the effect of inhibition followed by promotion, and the indirect effect is the effect of promotion followed by inhibition, and there is a significant spatial spillover effect. The possible reason for this result is that the large amount of energy consumption associated with the development of DE in the initial process not only reduces the local energy efficiency but also generates a large amount of energy demand for neighboring cities. As the degree of development of DE increases, the DE accelerates the exchange of knowledge and technology among economic agents, giving rise to new technologies, new business forms, and new modes related to energy production and consumption, thus promoting the conservation of energy between cities and reducing the negative impact of pollution emissions on the performance of local eco-welfare, but the local demand for energy in the neighboring cities will have a rebound effect on the energy from the lowering of EUE in neighboring cities, which is detrimental to the EUE in the neighboring cities. EUE is not conducive to the improvement of the EWP level of neighboring cities. Therefore, the DE development through the EUE effect on the EWP of the city inhibits and then promotes the impact; thus, Hypothesis 5 is established.
5.5 Analysis of the moderating role of internal and external environmental factors in cities
The above paragraphs analyzed the factors of urban internal and external environment in which DE affects the performance of urban EWP from the theoretical level, thus putting forward the research hypotheses; in order to test whether such hypotheses are valid or not, this section carries out the mechanism test from the aspects of the factor of ER intensity of the urban external environment and the factor of the level of RR of the urban internal environment. Table 9 shows the OLS and SDM results of DE on mechanism variables (MV : ER or RR) and mainly observes the results of direct and indirect effects.
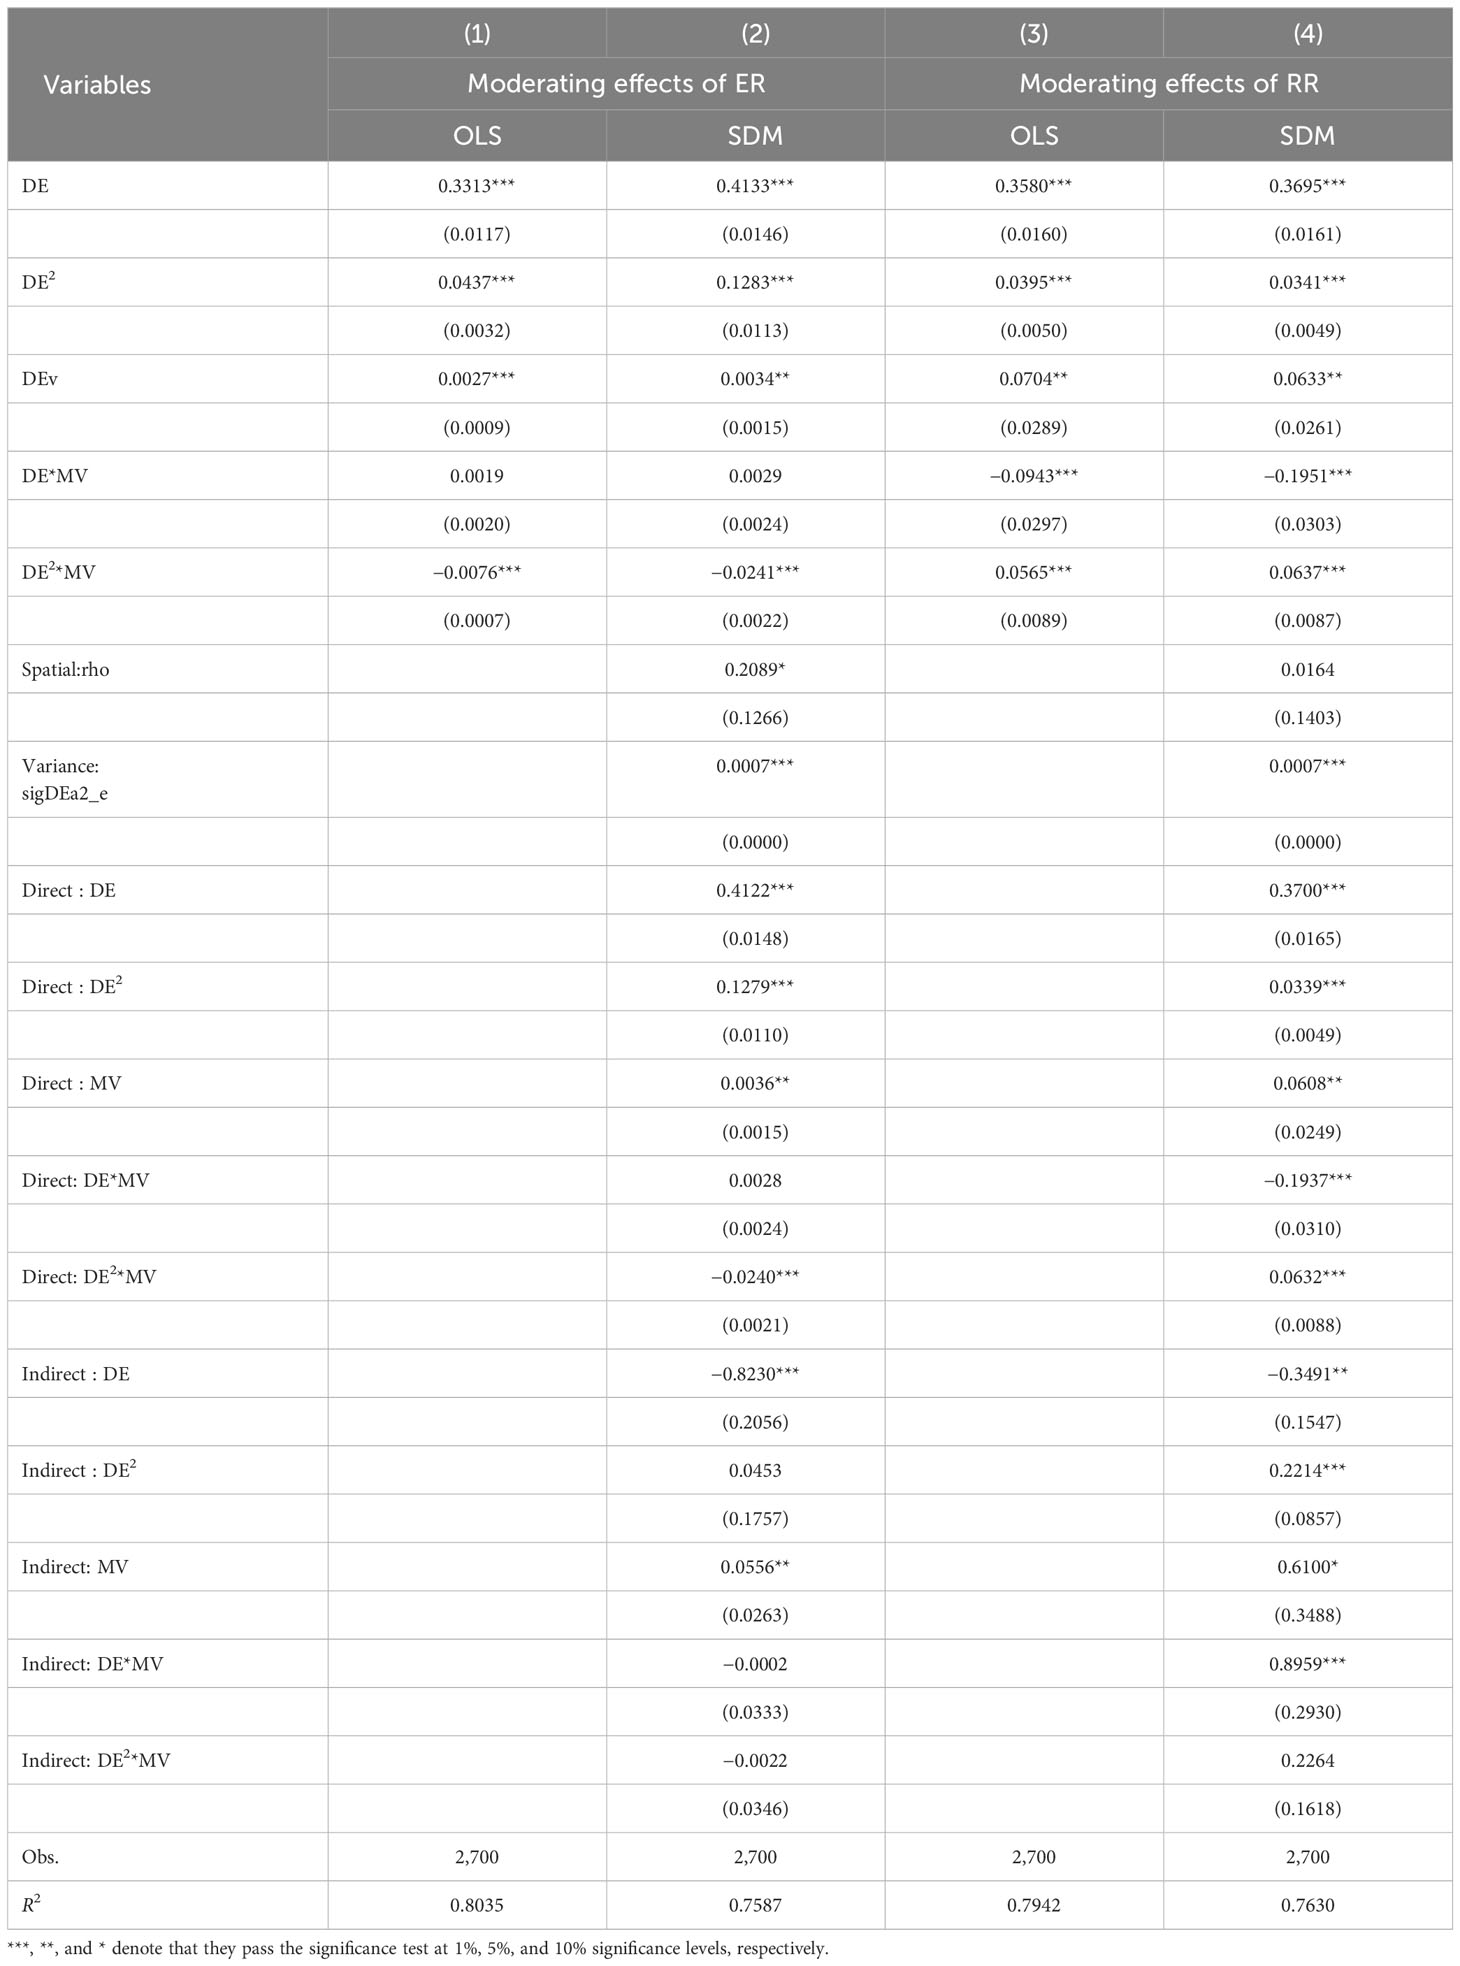
Table 9 Analysis of the moderating role of the internal and external urban environment.
5.5.1 External urban environment: intensity of ER
The results in column (1) of Table 9 show that excessive increase in the intensity of ER is not conducive to the development of DE to promote urban EWP. Column (2) in Table 9 shows that only the coefficient of the quadratic interaction term is significant and negative in the direct effect of DE development on urban EWP, while the interaction terms in the indirect effect are insignificant, indicating that ER can have a positive moderating effect in the initial period, but with the increase of ER intensity, it will weaken the positive impacts of the DE on the performance of the local eco-welfare, but its effects on neighboring cities are limited. The positive effect of DE on local EWP is gradually weakened as the intensity of ER increases, but its effect on neighboring cities is limited. The possible reasons for this result are that, in the case of cities, moderate ER can constrain digital technologies to empower ED in an eco-friendly direction, but as the intensity of ER increases, it also increases the cost of environmental governance, thus weakening the investment in the construction of the DE, and at the same time, higher ER is not conducive to digital transformation of enterprises and the updating of digital technologies and, thus, not conducive to the role of the DE in enhancing the performance of local EWP. At the same time, ER mainly acts locally, subject to the influence of regional jurisdiction and other factors, and its regulatory effect on neighboring cities is more limited; thus, Hypothesis 6 is established. The above regression results are consistent with the conclusion of J. Zhang et al. (2022) that environmental governance can play a role in the DE’s impact on urban ecosystems.
5.5.2 Inner-city environment: level of RR
The results in column (3) of Table 9 show that the moderating effect of the level of RR has a U-shaped characteristic. Column (4) in Table 9 shows that the direct effect of DE development on the EWP of cities has a significant negative coefficient of the primary interaction term between the level of RR and the DE, and the coefficient of the secondary interaction term is significantly positive, while the indirect effect is significant and positive only for the primary interaction term, which indicates that the level of RR has an inhibitory and then facilitatory moderating effect in the DE’s impact on the performance of the local EWP, but it can have a positive moderating effect on the neighboring cities. The possible reasons for this result are the fact that the process of RR is accompanied by industrial upgrading and structural adjustment. Initially, some industrial adjustments may lead to some negative ecological impacts, but as the level of RR increases, the government will pay more attention to the sustainable development of rural areas and implement environmental protection measures, which is conducive to enhancing the positive impacts of the DE on the local EWP, and RR has a demonstrative role for the neighboring areas, and its development can have a positive impact on the neighboring cities.
5.6 Heterogeneity analysis
Considering the large differences in factor endowments among regions in China and the significant differences in urban EWP levels, this section first divides the sample into four groups—eastern, central, western, and northeastern regions—and conducts regressions on these groups. The results are shown in columns (1)–(4) of Table 10. In terms of direct effects, the development of DE in eastern cities has a monotonically increasing effect on local EWP, while the development of DE in cities in other regions has a marginal increasing effect on local EWP. In terms of indirect effects, the DE development of central cities has a marginal incremental contribution to the indirect effects on the EWP of neighboring cities, while the DE development of cities in other regions has a U-shaped relationship of inhibition followed by promotion on the EWP of neighboring cities. The possible reasons for this result are that the eastern region is more developed, with higher levels of DE development and urban EWP, and therefore, compared with cities in other regions, its promotion effect on the local area is stronger in the early stage. The central region’s transportation location advantage amplifies the diffusion effect of the DE, and its urban DE development has a significant spatial spillover effect on the EWP of neighboring cities. As for the western and northeastern regions, because of the more remote geographic location, the development of DE lags behind other regions; thus, the development of DE on the local EWP promotion effect in the initial period of the local EWP is relatively slow, and will produce a siphoning effect on the surrounding urban EWP, and the degree of development of DE needs to reach a certain level, in order to unleash a stronger role in promoting the development of DE.
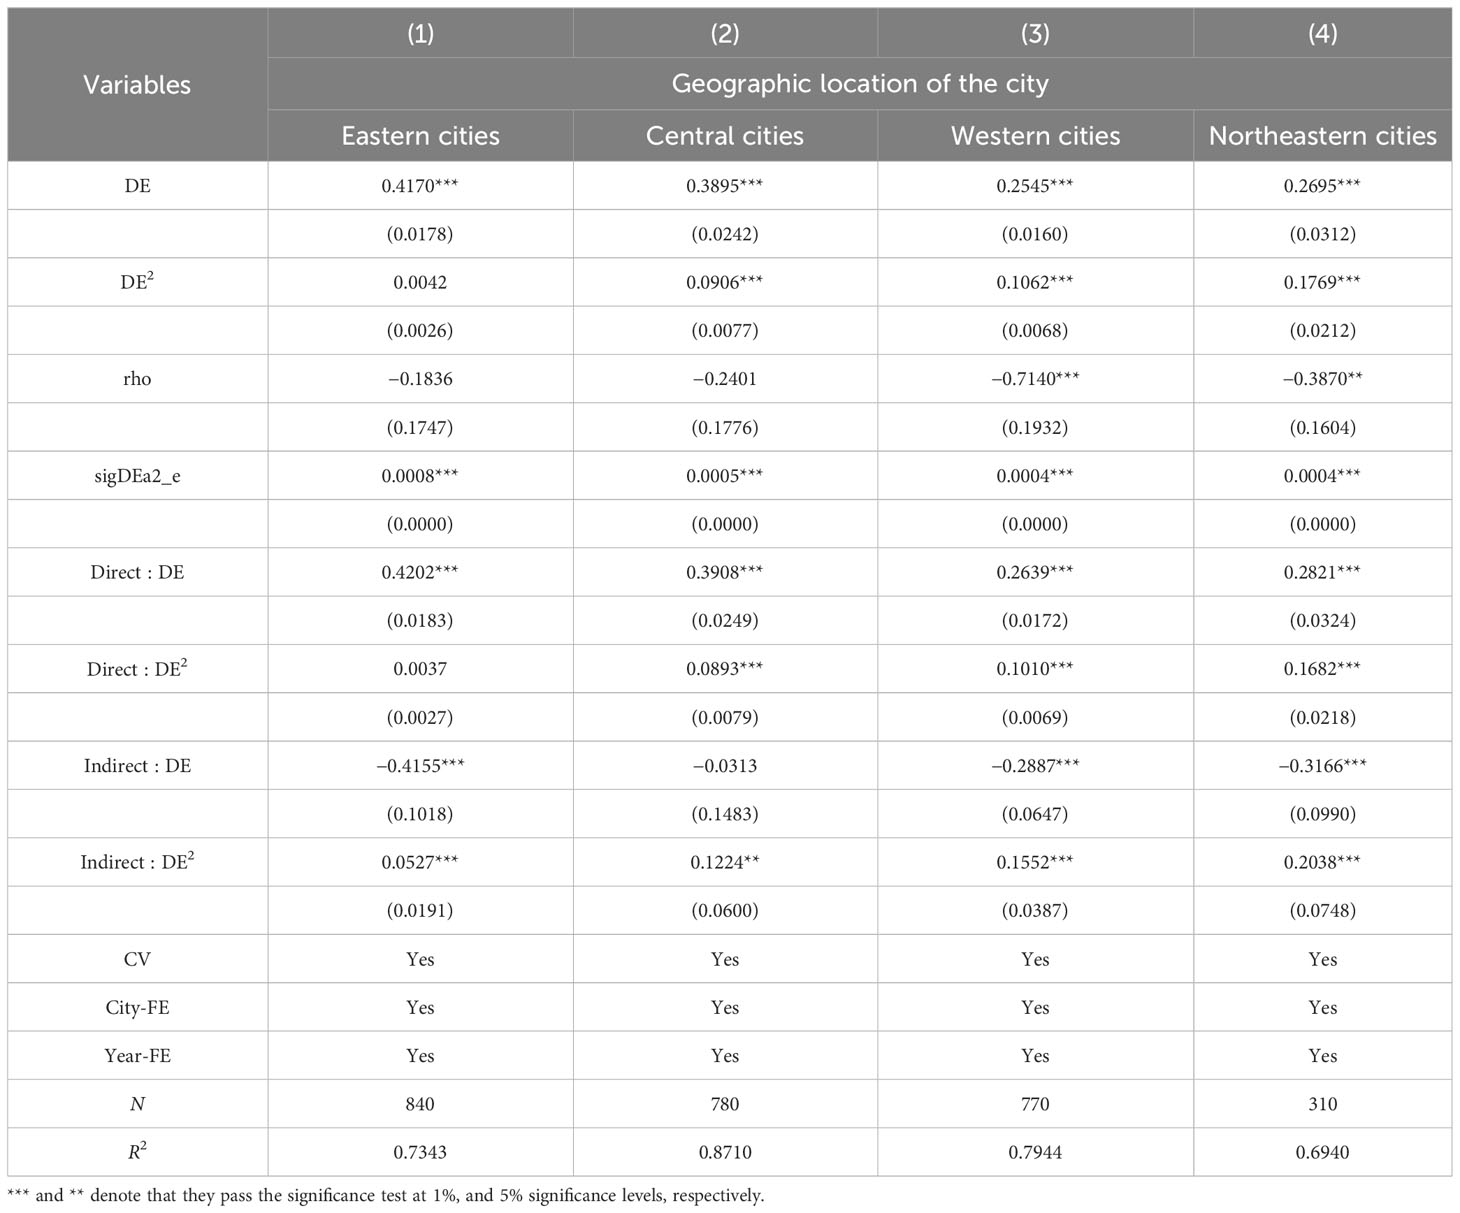
Table 10 Heterogeneity analysis: urban geographic location heterogeneity.
6 Conclusions and policy recommendations
6.1 Conclusion
The promotion effect of DE development on the EWP of cities is characterized by a “J” shape with increasing marginal effects and has a spatial spillover effect on the EWP of neighboring cities, which is inhibited first and then promoted. After a series of robustness tests, the results are still robust. The mechanism test shows that, on the one hand, the development of DE can enhance the EWP of cities through the marginal incremental promotion of GTI in local and neighboring cities and has a positive spatial spillover effect. On the other hand, the development of DE can inhibit and then promote the local EWP by influencing the efficiency of factor allocation and EUE in a nonlinear way. Moreover, the development of DE can have a nonlinear spatial spillover effect on the EWP of neighboring cities by influencing the factor allocation efficiency and energy use efficiency of neighboring cities, which will first promote and then inhibit the EWP of neighboring cities. The analysis of the moderating effect of internal and external environmental factors reveals that, in the moderating effect of external environmental factors, with the increase of the intensity of ER, ER has a nonlinear moderating effect of promoting and then inhibiting the local EWP affected by the DE, but its moderating effect on the neighboring cities is not significant. In the moderating effect of internal urban environmental factors, as the level of RR increases, the level of RR produces a nonlinear moderating effect of inhibiting and then promoting the DE, affecting the local EWP, while it produces a positive moderating effect on neighboring cities. Heterogeneity analysis finds that DE development has a more significant facilitating effect and positive spatial spillover effect on the EWP of ordinary cities, resource cities, low-carbon pilot cities, and cities in central China.
6.2 Policy recommendations
Based on the above findings, the following recommendations are made: first, strengthen the top-level design of the DE and consolidate the construction of digital infrastructure. The state should grasp the top-level design and overall planning of the development strategy of the DE; accelerate the construction of new infrastructures such as 5G, IoT, AI, and blockchain; and promote the in-depth integration of digital technology and industrial development, to help the DE become an important method to enhance the performance of EWP. Second, develop the DE according to local conditions so that it plays a leading role in advantageous regions. Local governments should, based on local natural resource endowments, combine their own DE industrial foundation, guide the formation of a new industrial development model with regional characteristics, and fully release the driving effect of DE development on the EWP of the surrounding areas. Third, improve the quality of the conduction mechanism and give full play to digital effectiveness. Local governments should accelerate the construction of a governance system compatible with the development stage of the DE, find a balance point for the integration of the DE and local industries, accelerate the breakthrough of core technology bottlenecks in the field of information, and, under the premise of ensuring the quality, realize the advanced and rationalized industrial structure, ensure the stable development of the DE industry, enhance the scale of the regional economy, and realize the enhancement of the level of the welfare of the urban residents within the ecological threshold.
6.3 Limitations and research perspectives
In this paper, we have conducted an exploratory and innovative study on the nonlinear spatial impact of the level of DE on the EWP of cities and its mechanism of action, but there are some limitations: first, we have investigated the causal relationship between the level of DE and the welfare performance of the local and neighboring cities, as well as the roles of the GTI effect, the optimization effect of the allocation of factors, and the effect of the conservation and utilization of energy in such a relationship, but there may be other mechanisms that can be further explored; second, future studies can refine the classification of the DE and then analyze the EWP of the cities, which can result in different conclusions that can guide the practice.
Data availability statement
The original contributions presented in the study are included in the article/supplementary materials, further inquiries can be directed to the corresponding author.
Ethics statement
The work does not involve any hazards, such as the use of animal or human subjects’ issue.
Author contributions
SW: Data curation, Resources, Writing – original draft, Writing – review & editing. JL: Funding acquisition, Project administration, Supervision, Writing – review & editing.
Funding
The author(s) declare financial support was received for the research, authorship, and/or publication of this article. This work was supported by the National Natural Science Foundation of China Project (71964032), JL (https://www.nsfc.gov.cn/); Outstanding Doctoral Student Innovation Project of Xinjiang University (XJU2023BS011). SW (https://gs.xju.edu.cn/); the Project of Xinjiang Social Science Foundation (19BJL028) JL (http://kjt.xinjiang.gov.cn/kjt/index.shtml); the Project of Xinjiang Natural Science Foundation (2018D01C052) JL (http://kjt.xinjiang.gov.cn/kjt/index.shtml). All funded projects played an active role in the study design, data collection and analysis, decision to publish and preparation of the manuscript, allowing this study to be completed properly.
Conflict of interest
The authors declare that the research was conducted in the absence of any commercial or financial relationships that could be construed as a potential conflict of interest.
Publisher’s note
All claims expressed in this article are solely those of the authors and do not necessarily represent those of their affiliated organizations, or those of the publisher, the editors and the reviewers. Any product that may be evaluated in this article, or claim that may be made by its manufacturer, is not guaranteed or endorsed by the publisher.
Abbreviations
EWP, Ecological welfare performance; DE, Digital economic development; GTI, Green technological innovation; EUE, Energy conservation and utilization; FAO, Factor allocation optimized efficiency; ER, Environmental regulation; RR, Rural revitalization; EE, Ecological environment; EG, Economic growth; ED, Economic development.
References
Akizu-Gardoki O., Kunze C., Coxeter A., Bueno G., Wiedmann T., Lopez-Guede J. (2020). Discovery of a possible Well-being Turning Point within energy footprint accounts which may support the degrowth theory. Energy Sustain. Dev. 59, 22–32. doi: 10.1016/j.esd.2020.09.001
Bandara S., Pathiratne A. (2023). Assessing the marine ecological welfare performance of coastal regions in China and analysing its determining factors. Mar. Pollut. Bull. 188. doi: 10.1016/j.marpolbul.2023.114639
Bao L., Ding X., Zhang J., Ma D. (2023). Can new urbanization construction improve ecological welfare performance in the yangtze river economic belt? Sustainability 15. doi: 10.3390/su15118758
Bento N. (2023). The potential of digital convergence and sharing of consumer goods to improve living conditions and reduce emissions. Environ. Res. Lett. 18. doi: 10.1088/1748-9326/ad067e
Bi L., Wang Z., Wu Z., Zhang Y. (2022). A new reform of mining production and management modes under industry 4.0: cloud mining mode. Appl. Sciences-Basel 12. doi: 10.3390/app12062781
Bimonte G., Ioppolo G., Senatore L., Trincone B. (2023). Government eco-innovation incentives in a recycling system: A Stackelberg-type model. Business Strategy Environ. 32, 3792–3800. doi: 10.1002/bse.3337
Chang M., Li F., Lin S., Zhang J., Shi H. (2023). How is agricultural water efficiency affected by the digital economy? Insights from China. Water Policy. doi: 10.2166/wp.2023.168
Chen H. (2023). Fintech and investment risk of digital finance: mediating role of clean energy and green bonds through the dynamics of spill over. Environ. Sci. Pollut. Res. 30, 82286–82296. doi: 10.1007/s11356-023-28181-w
Chen P. (2022). Is the digital economy driving clean energy development? -New evidence from 276 cities in China. J. Cleaner Production 372. doi: 10.1016/j.jclepro.2022.133783
Chen W., Du X., Lan W., Wu W., Zhao M. (2023). How can digital economy development empower high-quality economic development? Technological Economic Dev. Economy. doi: 10.3846/tede.2023.18784
Chen W., Yao L. (2023). The impact of digital economy on carbon total factor productivity: A spatial analysis of major urban agglomerations in China. J. Environ. Manage. 351, 119765–119765. doi: 10.1016/j.jenvman.2023.119765
Chen Y., Xu S., Lyulyov O., Pimonenko T. (2023). China’s digital economy development: incentives and challenges. Technological Economic Dev. Economy 29, 518–538. doi: 10.3846/tede.2022.18018
Choi T., Zhang J., Cai Y. (2020). Consumer-to-consumer digital-product-exchange in the sharing economy system with risk considerations: will digital-product-developers suffer? IEEE Trans. Syst. Man Cybernetics-Systems 50, 5049–5057. doi: 10.1109/TSMC.2019.2925063
Criveanu M. (2023). Investigating digital intensity and E-commerce as drivers for sustainability and economic growth in the EU countries. Electronics 12. doi: 10.3390/electronics12102318
Cui H., Cao Y., Zhang C. (2023). Assessing the digital economy and its effect on carbon performance: the case of China. Environ. Sci. pollut. Res. 30, 73299–73320. doi: 10.1007/s11356-023-26825-5
Cui S., Wang Y., Xu P., Li L. (2022). Ecological welfare performance, industrial agglomeration and technological innovation: an empirical study based on Beijing-Tianjin-Hebei, Yangtze River Delta and Pearl River Delta. Environ. Dev. Sustainability. doi: 10.1007/s10668-022-02772-y
Das S., Chatterjee A. (2022). Impacts of ICT and digital finance on poverty and income inequality: a sub-national study from India. Inf. Technol. Dev. doi: 10.1080/02681102.2022.2151556
Dong K., Liu Y., Wang J., Dong X. (2024). Is the digital economy an effective tool for decreasing energy vulnerability? A global case. Ecol. Economics 216. doi: 10.1016/j.ecolecon.2023.108028
Dou Q., Gao X. (2022). The double-edged role of the digital economy in firm green innovation: micro-evidence from Chinese manufacturing industry. Environ. Sci. pollut. Res. 29, 67856–67874. doi: 10.1007/s11356-022-20435-3
Fan S., Huang H., Mbanyele W., Zhao X. (2023). A step toward inclusive green growth: can digital finance be the main engine? Environ. Sci. Pollut. Res. 30, 96075–96097. doi: 10.1007/s11356-023-29155-8
Feng T., Wu X., Guo J. (2023). Racing to the bottom or the top? Strategic interaction of environmental protection expenditure among prefecture-level cities in China. J. Cleaner Production 384. doi: 10.1016/j.jclepro.2022.135565
Feng Y., Zhong S., Li Q., Zhao X., Dong X. (2019). Ecological well-being performance growth in China, (1994-2014): From perspectives of industrial structure green adjustment and green total factor productivity. J. Cleaner Production 236. doi: 10.1016/j.jclepro.2019.07.031
Gao W., Peng Y. (2023). Energy saving and emission reduction effects of urban digital economy: technology dividends or structural dividends? Environ. Sci. Pollut. Res. 30, 36851–36871. doi: 10.1007/s11356-022-24780-1
Ge W., Xu Y., Liu G., Shen B., Su X., Liu L., et al. (2022). Exploring the impact of the digital economy on carbon emission efficiency under factor misallocation constraints: new insights from China. Front. Environ. Sci. 10. doi: 10.3389/fenvs.2022.953070
Gruzalski B. (1999). Beyond growth: the economics of sustainable development. Environ. Ethics 21, 93–96.
Guo Q., Ding C., Wu Z., Guo B., Xue Y., Li D. (2022). The impact of digital economy and industrial structure distortion on Xinjiang’s energy intensity under the goal of “double carbon”. Front. Environ. Sci. 10. doi: 10.3389/fenvs.2022.1036740
Guo Q. Q., Ma X., Zhao J. (2023). Can the digital economy development achieve the effect of pollution reduction? Evidence from Chinese Cities. Environ. Sci. pollut. Res. 30, 74166–74185. doi: 10.1007/s11356-023-27584-z
Guo Q., Wu Z., Jahanger A., Ding C., Guo B., Awan A. (2023). The spatial impact of digital economy on energy intensity in China in the context of double carbon to achieve the sustainable development goals. Environ. Sci. Pollut. Res. 30, 35528–35544. doi: 10.1007/s11356-022-24814-8
Han D., Liu M. (2022). How does the digital economy contribute to regional green development in China? Evidence-based on the intermediary effect of technological innovation. Sustainability 14. doi: 10.3390/su141811147
Hmamed H., Cherrafi A., Benghabrit A., Tiwari S., Sharma P. (2023). The adoption of I4.0 technologies for a sustainable and circular supply chain: an industry-based SEM analysis from the textile sector. Business Strategy Environ. doi: 10.1002/bse.3645
Huang X., Zhang S., Zhang J., Yang K. (2023). Research on the impact of digital economy on Regional Green Technology Innovation: Moderating effect of digital talent Aggregation. Environ. Sci. pollut. Res. 30, 74409–74425. doi: 10.1007/s11356-023-27279-5
Idowu A., Elbanna A. (2022). Digital platforms of work and the crafting of career path: the crowdworkers’ Perspective. Inf. Syst. Front. 24, 441–457. doi: 10.1007/s10796-020-10036-1
Jiang M. M., Chen B. (2011). Integrated urban ecosystem evaluation and modeling based on embodied cosmic exergy. Ecol. Model. 222, 2149–2165. doi: 10.1016/j.ecolmodel.2011.04.012
Krystofik M., Gaustad G. (2018). Tying product reuse into tying arrangements to achieve competitive advantage and environmental improvement. Resour. Conserv. Recycling 135, 235–245. doi: 10.1016/j.resconrec.2017.08.028
Li J., Chen L., Chen Y., He J. (2022). Digital economy, technological innovation, and green economic efficiency-Empirical evidence from 277 cities in China. Managerial Decision Economics 43, 616–629. doi: 10.1002/mde.3406
Li C., Sha Z., Sun T. (2023). Rural households’ Internet use on common prosperity: evidence from the chinese social survey. Soc. Indic. Res. doi: 10.1007/s11205-023-03217-3
Li Y., Yang H. (2023). The incentive effect of creating a national health city on the ecological welfare performance: based on the evidence of Yangtze River Delta in China. Environ. Sci. pollut. Res. 30, 83735–83759. doi: 10.1007/s11356-023-28207-3
Lin H., Gao Y., Zhu T., Wu H., Hou P., Li W., et al. (2022). Measurement and identification of relative poverty level of pastoral areas: an analysis based on spatial layout. Environ. Sci. pollut. Res. 29, 87157–87169. doi: 10.1007/s11356-022-21717-6
Lin F., Huang C., Zhang X., Chu D. (2023). The interactive relationship between ecological well-being performance and tourism economic development in major tourism cities in China. Environ. Res. Commun. 5. doi: 10.1088/2515-7620/ace761
Liu D. (2021). Application and research of analytic hierarchy process in green GDP development planning of smart city. J. Urban Plann. Dev. 147. doi: 10.1061/(ASCE)UP.1943-5444.0000646
Liu N., Jiang X., Cheng J., Li H., Li W., Xue K., et al. (2018). Current situation of foreign organic greenhouse horticulture and its inspiration for sustainable development of Chinese protected agriculture. Trans. Chin. Soc. Agric. Eng. 34, 1–9. doi: 10.11975/j.issn.1002-6819.2018.15.001
Liu Z., Luo Y., Zhang Q., Xu C. (2023). Research on the empowering effect of digital economy development on the green economic efficiency- empirical evidence from 285 Chinese cities. Appl. Economics. doi: 10.1080/00036846.2023.2288048
Liu Y. Y., Wan Q., Chen W. (2023). Digital inclusive finance as a catalyst for rural revitalization: an empirical analysis from the county development perspective in hubei province. J. Knowledge Economy. doi: 10.1007/s13132-023-01493-5
Liu Y., Xie Y., Zhong K. (2023). Impact of digital economy on urban sustainable development: Evidence from Chinese cities. Sustain. Dev. doi: 10.1002/sd.2656
Liu Y., Zhou M. (2023). Can rural e-commerce narrow the urban-rural income gap? Evidence from coverage of Taobao villages in China. China Agric. Economic Rev. doi: 10.1108/CAER-09-2022-0221
Lo S., Lu W., Chang C., Hung S., Yang L. (2023). An efficiency-driven approach for global ecological industrial parks. J. Cleaner Production 424. doi: 10.1016/j.jclepro.2023.138837
Lyu Y., Wang W., Wu Y., Zhang J. (2023a). How does digital economy affect green total factor productivity? Evidence from China. Sci. Total Environ. 857, 159428. doi: 10.1016/j.scitotenv.2022.159428
Lyu Y., Wu Y., Wu G., Wang W., Zhang J. (2023b). Digitalization and energy: How could digital economy eliminate energy poverty in China? Environ. Impact Assess. Rev. 103, 107243. doi: 10.1016/j.eiar.2023.107243
Lyu Y., Zhang J., Qing X., Bai Y. (2023c). The influence of non-financial enterprises’ financialization on total factor productivity of enterprises: Promotion or inhibition? Int. J. Finance Economics. doi: 10.1002/ijfe.2912
Ma R., Lin B. (2023). Digital infrastructure construction drives green economic transformation: evidence from Chinese cities. Humanities Soc. Sci. Commun. 10. doi: 10.1057/s41599-023-01839-z
Ma R., Lin Y., Lin B. (2023). Does digitalization support green transition in Chinese cities? Perspective from Metcalfe’s Law. J. Cleaner Production 425. doi: 10.1016/j.jclepro.2023.138769
Ma S., Wei W., Li J. (2023). Has the digital economy improved the ecological environment? Empirical Evidence from China. Environ. Sci. pollut. Res. 30, 91887–91901. doi: 10.1007/s11356-023-28445-5
Ma S., Zhang Y., Liu Y., Yang H., Lv J., Ren S. (2020). Data-driven sustainable intelligent manufacturing based on demand response for energy-intensive industries. J. Cleaner Production 274. doi: 10.1016/j.jclepro.2020.123155
Ma D., Zhu Q. (2022). Innovation in emerging economies: Research on the digital economy driving high-quality green development. J. Business Res. 145, 801–813. doi: 10.1016/j.jbusres.2022.03.041
Nham N., Hoa T., Ha L. (2023). Influences of digitalization on sustaining marine minerals: A path toward sustainable blue economy. Ocean Coast. Manage. 239. doi: 10.1016/j.ocecoaman.2023.106589
Ni L., Yu Y., Wen H. (2023). Impact of fintech and environmental regulation on green innovation: inspiration from prefecture-level cities in China. Front. Ecol. Evol. 11. doi: 10.3389/fevo.2023.1265531
Ning J., Yin Q., Yan A. (2022). How does the digital economy promote green technology innovation by manufacturing enterprises? Evidence from China. Front. Environ. Sci. 10. doi: 10.3389/fenvs.2022.967588
Qiu Y., Liu W., Wu J. (2023). Digital economy and urban green innovation: from the perspective of environmental regulation. J. Environ. Plann. Manage. doi: 10.1080/09640568.2023.2244668
Qu K., Zhang Y., Liu Y., Feng T. (2023). Examining the impact of China’s new environmental protection law on enterprise productivity and sustainable development. J. Knowledge Economy. doi: 10.1007/s13132-023-01500-9
Rajput S., Singh S. (2020). Industry 4.0 Model for circular economy and cleaner production. J. Cleaner Production 277. doi: 10.1016/j.jclepro.2020.123853
Ren S., Li L., Han Y., Hao Y., Wu H. (2022). The emerging driving force of inclusive green growth: Does digital economy agglomeration work? Business Strategy Environ. 31, 1656–1678. doi: 10.1002/bse.2975
Roy S., Mohanty R. P. (2023). Green logistics operations and its impact on supply chain sustainability: An empirical study. Business Strategy Environ. doi: 10.1002/bse.3531
Shen X., Zhao H., Yu J., Wan Z., He T., Liu J. (2022). Digital economy and ecological performance: Evidence from a spatial panel data in China. Front. Environ. Sci. 10. doi: 10.3389/fenvs.2022.969878
Solow R. M. (2000). “The economics of resources or the resources of economics,” in Classic papers in natural resource economics. Ed. Gopalakrishnan C. (Palgrave Macmillan, UK, London), 257–276. doi: 10.1057/9780230523210_13
Song M., Pan H., Vardanyan M., Shen Z. (2023). Evaluating the energy efficiency-enhancing potential of the digital economy: Evidence from China. J. Environ. Manage. 344. doi: 10.1016/j.jenvman.2023.118408
Song X., Tian Z., Ding C., Liu C., Wang W., Zhao R., et al. (2022). Digital economy, environmental regulation, and ecological well-being performance: A provincial panel data analysis from China. Int. J. Environ. Res. Public Health 19. doi: 10.3390/ijerph191811801
Su Y., Li W., Chen M., Wu C., Tan X. (2023). Innovation policy and ecological welfare performance: evidence from a quasi-natural experiment of China. Environ. Sci. pollut. Res. 30, 100994–101013. doi: 10.1007/s11356-023-29307-w
Tan L., Yang Z., Irfan M., Ding C., Hu M., Hu J. (2023). Toward low-carbon sustainable development: Exploring the impact of digital economy development and industrial restructuring. Business Strategy Environ. doi: 10.1002/bse.3584
Tang J., Zhao X. (2023). Does the new digital infrastructure improve total factor productivity? Bull. Economic Res. 75, 895–916. doi: 10.1111/boer.12388
Wan Q., Shi D. (2022). Smarter and cleaner: the digital economy and environmental pollution. China World Economy 30, 59–85. doi: 10.1111/cwe.12446
Wang J. (2023). Digital inclusive finance and rural revitalization. Finance Res. Lett. 57. doi: 10.1016/j.frl.2023.104157
Wang X., Li J. (2023). Heterogeneous effect of digital economy on carbon emission reduction. J. Cleaner Production 429. doi: 10.1016/j.jclepro.2023.139560
Wang H., Liu P. (2023). Characteristics of China’s digital economy network and its impact on carbon emissions. Front. Ecol. Evol. 11. doi: 10.3389/fevo.2023.1243360
Wang L., Shao J. (2023). Digital economy, entrepreneurship and energy efficiency. Energy 269. doi: 10.1016/j.energy.2023.126801
Wang Y., Wang Y., Shahbaz M. (2023). How does digital economy affect energy poverty? Analysis from the global perspective. Energy 282. doi: 10.1016/j.energy.2023.128692
Wang J., Wu H., Xiao D., Luo X., Liu Y., Wang W. (2023). Can the digital economy address the loss of green development efficiency due to resource mismatch? Evidence from China’s land transaction markets. J. Environ. Plann. Manage. doi: 10.1080/09640568.2023.2258554
Wang S., Xue Z. (2023). Has the development of the digital economy improved green total factor productivity in China?-A study based on data at the provincial level in China. Front. Environ. Sci. 11. doi: 10.3389/fenvs.2023.1073997
Wang B., Yan H., Liu H., Pan L., Feng Z. (2023). Keep sustainable livestock production without Grassland degradation: Future cultivated pasture development simulation based on agent-based model. J. Cleaner Production 417. doi: 10.1016/j.jclepro.2023.138072
Wei A. (2024). Fueling green growth: Unveiling the catalyst of mineral resource trade in diverse economies. Resour. Policy 88. doi: 10.1016/j.resourpol.2023.104429
Wu R., Hua X., Peng L., Liao Y., Yuan Y. (2022). Nonlinear effect of digital economy on carbon emission intensity-based on dynamic panel threshold model. Front. Environ. Sci. 10. doi: 10.3389/fenvs.2022.943177
Wu T., Peng Z., Yi Y., Chen J. (2023). The synergistic effect of digital economy and manufacturing structure upgrading on carbon emissions reduction: Evidence from China. Environ. Sci. pollut. Res. doi: 10.1007/s11356-023-28484-y
Wu Q., Zhuang Q. (2023). Nonlinear effects of digital development on manufacturing innovation: evidence from China. Appl. Economics. doi: 10.1080/00036846.2023.2287555
Xie Z., Ma J., Huang S., Zhu J. (2023). Digital economy and inclusive green growth: The moderating effect of government environmental regulation. Environ. Sci. pollut. Res. 30, 107938–107955. doi: 10.1007/s11356-023-29934-3
Xin Y., Chang X., Zhu J. (2022). How does the digital economy affect energy efficiency? Empirical research on Chinese cities. Energy Environ. doi: 10.1177/0958305X221143411
Xin C., Fan S., Mbanyele W., Shahbaz M. (2023). Towards inclusive green growth: does digital economy matter? Environ. Sci. pollut. Res. 30, 70348–70370. doi: 10.1007/s11356-023-27357-8
Xu Q., Li X., Dong Y., Guo F. (2023). Digitization and green innovation: how does digitization affect enterprises’ green technology innovation? J. Environ. Plann. Manage. doi: 10.1080/09640568.2023.2285729
Xue J., He Y., Xu H., Gong Z. (2023). Under the ecological label policy: Supply chain Heterogeneous product innovation strategies for green marketing. J. Cleaner Production 428. doi: 10.1016/j.jclepro.2023.139370
Xue R., Li H. (2022). Characteristics, experience, and enlightenment of leisure and sports policy and public health development in developed countries. J. Environ. Public Health 2022. doi: 10.1155/2022/9162584
Yang G., Li H., Nie Y., Yue Z., Wang H. (2023). Digital transformation and firm performance: the role of factor allocation. Appl. Economics. doi: 10.1080/00036846.2023.2269631
Yang Y., Liang Q. (2023). Digital economy, environmental regulation and green eco-efficiency-Empirical evidence from 285 cities in China. Front. Environ. Sci. 11. doi: 10.3389/fenvs.2023.1113293
Yin X., Qi L., Zhou J. (2023). The impact of heterogeneous environmental regulation on high-quality economic development in China: based on the moderating effect of digital finance. Environ. Sci. pollut. Res. 30, 24013–24026. doi: 10.1007/s11356-022-23709-y
Yin F., Shi X., Guo H., Shen Y. (2023). Performance evaluation of rural water environment governance based on AHP: a case study of the Beitang River Basin. Water Sci. Technol. doi: 10.2166/wst.2023.354
You L., Ji T., Shao B., Wu X., Shi L. (2023). Design-driven regional industry transformation and upgrading under the perspective of sustainable development. Sci. Rep. 13, 17071–17071. doi: 10.1038/s41598-023-44190-8
Zhang R., Cao Y., Wu K., Sun H. (2022). Research on the effect of green credit on ecological welfare performance: Evidence from China. Front. Environ. Sci. 10. doi: 10.3389/fenvs.2022.950341
Zhang X., Fan D. (2023). Can agricultural digital transformation help farmers increase income? An empirical study based on thousands of farmers in Hubei Province. Environ. Dev. Sustainability. doi: 10.1007/s10668-023-03200-5
Zhang J., Lyu Y., Li Y., Geng Y. (2022). Digital economy: An innovation driving factor for low-carbon development. Environ. Impact Assess. Rev. 96, 106821. doi: 10.1016/j.eiar.2022.106821
Zhang S., Ma X., Cui Q. (2021). Assessing the impact of the digital economy on green total factor energy efficiency in the post-COVID-19 era. Front. Energy Res. 9. doi: 10.3389/fenrg.2021.798922
Zhang S., Ma X., Cui Q., Liu J. (2023). Digitalization and urban resilience: how does the allocation of digital factors affect urban resilience under energy constraints in China? Environ. Dev. Sustainability. doi: 10.1007/s10668-023-03614-1
Zhang Z., Sun C., Wang J. (2023). How can the digital economy promote the integration of rural industries-taking China as an example. Agriculture-Basel 13. doi: 10.3390/agriculture13102023
Zhang Y., Wu Z. (2022). Environmental performance and human development for sustainability: Towards to a new Environmental Human Index. Sci. Total Environ. 838. doi: 10.1016/j.scitotenv.2022.156491
Zhao C., Dong K., Liu Z., Ma X. (2024). Is digital economy an answer to energy trilemma eradication? The case of China. J. Environ. Manage. 349. doi: 10.1016/j.jenvman.2023.119369
Zhao X., Huang Q., Zhang H., Zhao L. (2023). Can digital transformation in manufacturing enterprises mitigate financial distress? Technol. Anal. Strategic Manage. doi: 10.1080/09537325.2023.2290161
Zhao T., Jiao F., Wang Z. (2023). The impact of the digital economy development on haze pollution: evidence from the perspective of factor marketization. Environ. Sci. Pollut. Res. 30, 35478–35491. doi: 10.1007/s11356-022-24706-x
Zhao S., Peng D., Wen H., Wu Y. (2023). Nonlinear and spatial spillover effects of the digital economy on green total factor energy efficiency: evidence from 281 cities in China. Environ. Sci. Pollut. Res. 30, 81896–81916. doi: 10.1007/s11356-022-22694-6
Zheng Y., Zhang Q. (2023). Digital transformation, corporate social responsibility and green technology innovation- based on empirical evidence of listed companies in China. J. Cleaner Production 424. doi: 10.1016/j.jclepro.2023.138805
Zheng Z., Zhu Y., Wang Y., Yang Y., Fang Z. (2023). Spatio-temporal heterogeneity of the coupling between digital economy and green total factor productivity and its influencing factors in China. Environ. Sci. Pollut. Res. 30, 82326–82340. doi: 10.1007/s11356-023-28155-y
Zhong S., Feng Y. (2018). Research on the system dynamics of ecological migration engineering and ecosystem sustainable development: for example of Three-river-source region ecological migration. China Population Resour. Environ. 28, 10–19.
Zhou T., Jiang G., Ma W., Zhang R., Yang Y., Tian Y., et al. (2023). Revitalization of idle rural residential land: Coordinating the potential supply for land consolidation with the demand for rural revitalization. Habitat Int. 138, 102867. doi: 10.1016/j.habitatint.2023.102867
Zhou Y., Zang J., Miao Z., Minshall T. (2019). Upgrading pathways of intelligent manufacturing in China: transitioning across technological paradigms. Engineering 5, 691–701. doi: 10.1016/j.eng
Keywords: digital economy, urban eco-welfare performance, nonlinear spatial effects, green technology innovation, energy conservation and utilization
Citation: Wang S and Li J (2024) Nonlinear spatial impacts of the digital economy on urban ecological welfare performance: evidence from China. Front. Ecol. Evol. 12:1361741. doi: 10.3389/fevo.2024.1361741
Received: 26 December 2023; Accepted: 30 January 2024;
Published: 13 March 2024.
Edited by:
Salvador García-Ayllón Veintimilla, Polytechnic University of Cartagena, SpainReviewed by:
Feng Hu, Zhejiang Gongshang University, ChinaJianhua Zhu, Harbin Institute of Technology, China
Yanwei Lyu, Shandong University, China
Copyright © 2024 Wang and Li. This is an open-access article distributed under the terms of the Creative Commons Attribution License (CC BY). The use, distribution or reproduction in other forums is permitted, provided the original author(s) and the copyright owner(s) are credited and that the original publication in this journal is cited, in accordance with accepted academic practice. No use, distribution or reproduction is permitted which does not comply with these terms.
*Correspondence: Jinye Li, MTA3NTU2NTIyMDQxQHN0dS54anUuZWR1LmNu