 Qun Zhang
 Cheng-He Sun
 Jin-Long Huang1†
94% of researchers rate our articles as excellent or good
Learn more about the work of our research integrity team to safeguard the quality of each article we publish.
Find out more
ORIGINAL RESEARCH article
Front. Ecol. Evol., 30 January 2024
Sec. Evolutionary and Population Genetics
Volume 12 - 2024 | https://doi.org/10.3389/fevo.2024.1345739
The broad-banded velvetchin Hapalogenys analis is an economically and scientifically important global temperate and tropical nearshore marine fish. To understand the genetic evolution mechanism of H. analis, simplified genome sequencing analysis was conducted on 82 samples of H. analis from three populations (Akashi, Zhoushan, and Shantou) in the northwestern Pacific Ocean using double-digest restriction site-associated DNA sequencing. Genetic characteristics were identified using single-nucleotide polymorphism loci, and a small fragment library (250–450 bp long) was constructed for double-end sequencing. Single-nucleotide polymorphisms (SNPs) were detected using Stacks software and analyzed. The phylogenetic tree was constructed to analyze the population structure characteristics and the genetic evolutionary relationships between individuals in different regions at the genetic level. The sequencing library constructed for 82 samples of H. analis using double-digest restriction site-associated DNA sequencing possessed an average of 7,931,195 sequencing sequences and an average of 1,141,560,806 bases in the 82 samples. A total of 3,204,106 SNP loci were obtained from the three populations of H. analis, indicating rich genetic diversity. The transition to transversion ratio of SNPs was >1.5, indicating transformational reversal bias in H. analis. The observed heterozygosity of the various populations was 0.186–0.199, with an expected heterozygosity of 0.253–0.268. High diversity in all three populations was detected using nucleotide diversity analysis. AS and ZS had the highest degree of differentiation. The H. analis samples shared two gene libraries; some populations were closely related, whereas others had a distant genetic relationship. The results of genetic statistics, genetic differentiation, population structure, principal component, phylogenetic, and genetic relationship analyses supported independent clustering of the AS population, which can be used as a new genetic resource for conserving H. analis. These results provide a reference basis for comparative genomics studies of H. analis and rational utilization of Hapalogenys resources.
The broad-banded velvetchin Hapalogenys analis Richardson (1845) belongs to the order Perciformes and family Pomadasyidae and is an economically important global temperate and tropical nearshore marine fish (Zheng et al., 2020; Sun et al., 2023). Middle- and lower-level fish, which prefer to inhabit rocky areas, are typical island reef fishes that feed on small fish, crustaceans, and shellfish. Hapalogenys analis is distributed along the northwest Pacific coast and has a desirable meat flavor and bright body color, making it an economically important edible and ornamental fish (Mohapatra et al., 2013; Sun et al., 2023). The market supply is limited because of the scarcity of wild resources of H. analis. Its unique characteristics, such as having a wide salt content and resistance to low temperatures, make this fish particularly suitable for artificial breeding and ecological resource restoration. In addition, it is a natural ideal animal model for studying the adaptation of fish to the middle and lower layers of the nearshore. Studies have been performed to evaluate the origin and evolution (Iwatsuki and Russell, 2006), mitochondrial genome (Zheng et al., 2020), and population structure (Sun et al., 2023) of H. analis. Research on Hapalogenys is relatively mature.
With the rapid development of molecular biology technologies, simplified genome sequencing based on second-generation sequencing technology has been widely applied (Henning et al., 2014; Alam et al., 2017; Raffini et al., 2017). Among these methods, double-digest restriction-site-associated DNA sequencing (dd-RAD) was developed based on traditional second-generation sequencing RAD sequencing, which is extensively used in population genetic structure, diversity analyses (Nyinondi et al., 2020), and genetic evolution (Guo et al., 2021) and can be used to rapidly identify high-density single-nucleotide polymorphism (SNP) sites (Severn-Ellis et al., 2020). The SNP locus, which is the most susceptible type of variation in the genome, is an ideal tool for studying population and quantitative genetics (Mondini et al., 2009). However, dd-RAD sequencing technology has not been used in genetic diversity research of striped sea bream. In this study, we used dd-RAD sequencing for population genetic analysis of H. analis to identify its genetic characteristics through SNP loci analysis, construct a phylogenetic tree, analyze its population structure characteristics, and investigate the genetic evolutionary relationships between individuals in different regions. This study aimed to understand the genetic potential of marine fish resources in the marginal seas of the northwest Pacific Ocean and provide a reference for comparative genomics analysis of H. analis and rational utilization of genus Hapalogenys resources.
The 82 collected samples of H. analis were divided into three geographical populations according to their collection location (Figure 1). Twenty-eight samples were collected from Akashi, Japan (AS, 34°38’30” N, 134°58’19” E), 27 samples were collected from Shantou, China (ST, 23°18’09” N, 116°48’11” E), and 27 samples were collected from Zhoushan, China (ZS, 29°59’08” N, 122°12’26” E). All specimens in this study were collected in accordance with Chinese laws. The collection and sampling of the specimens were reviewed and approved by the Animal Ethics Committee of Jinan University. All samples were wild and purchased from local fishermen with marine fishing permits. After morphological identification of the species (Figure 2), some of the muscle tissues were obtained and frozen at −80 °C for DNA extraction, whereas the remaining tissues were completely immersed in 95% ethanol and stored in the fish bank of the Department of Ecology at Jinan University. Genomic DNA was extracted using the traditional phenol-chloroform, and its quality was evaluated using 1.5% agarose gel electrophoresis and a NanoDrop 2000 instrument with an ultraviolet spectrophotometer. The A260/280 value of genomic DNA was 1.7–2.0, which met the quality requirements. Genomic DNA was stored at −20 °C until analysis.
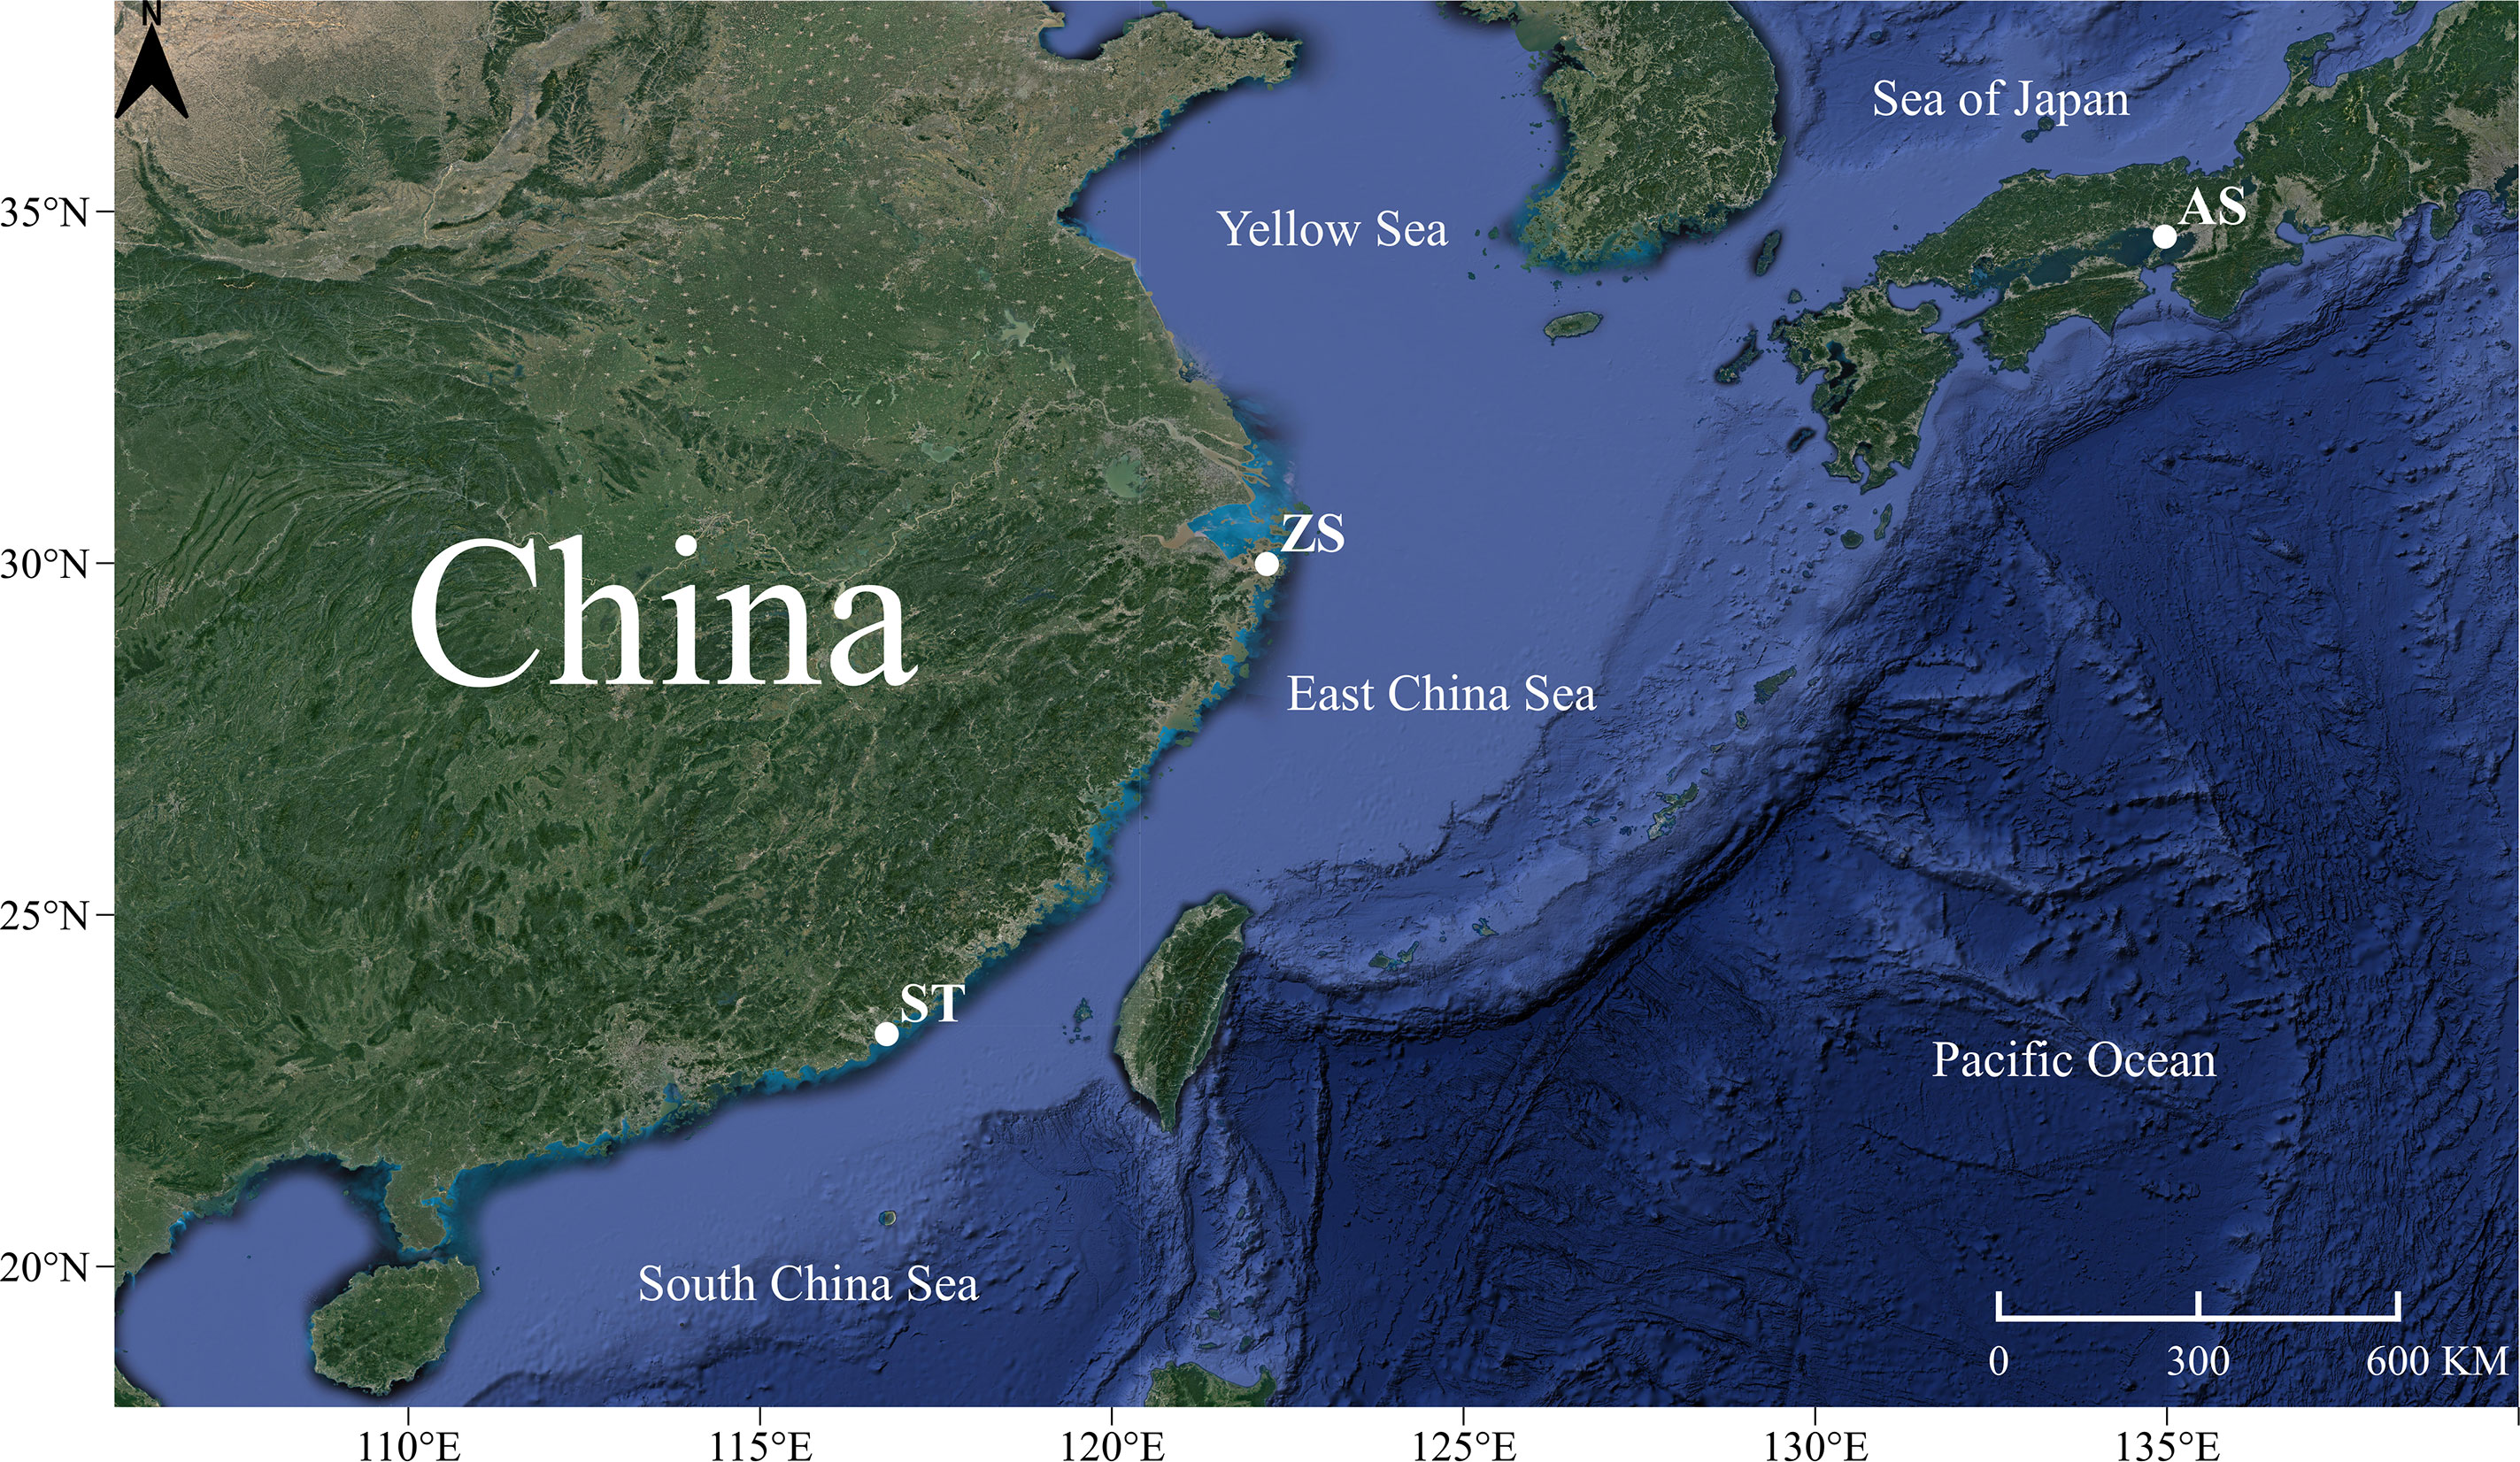
Figure 1 Sampling sites of Hapalogenys analis.
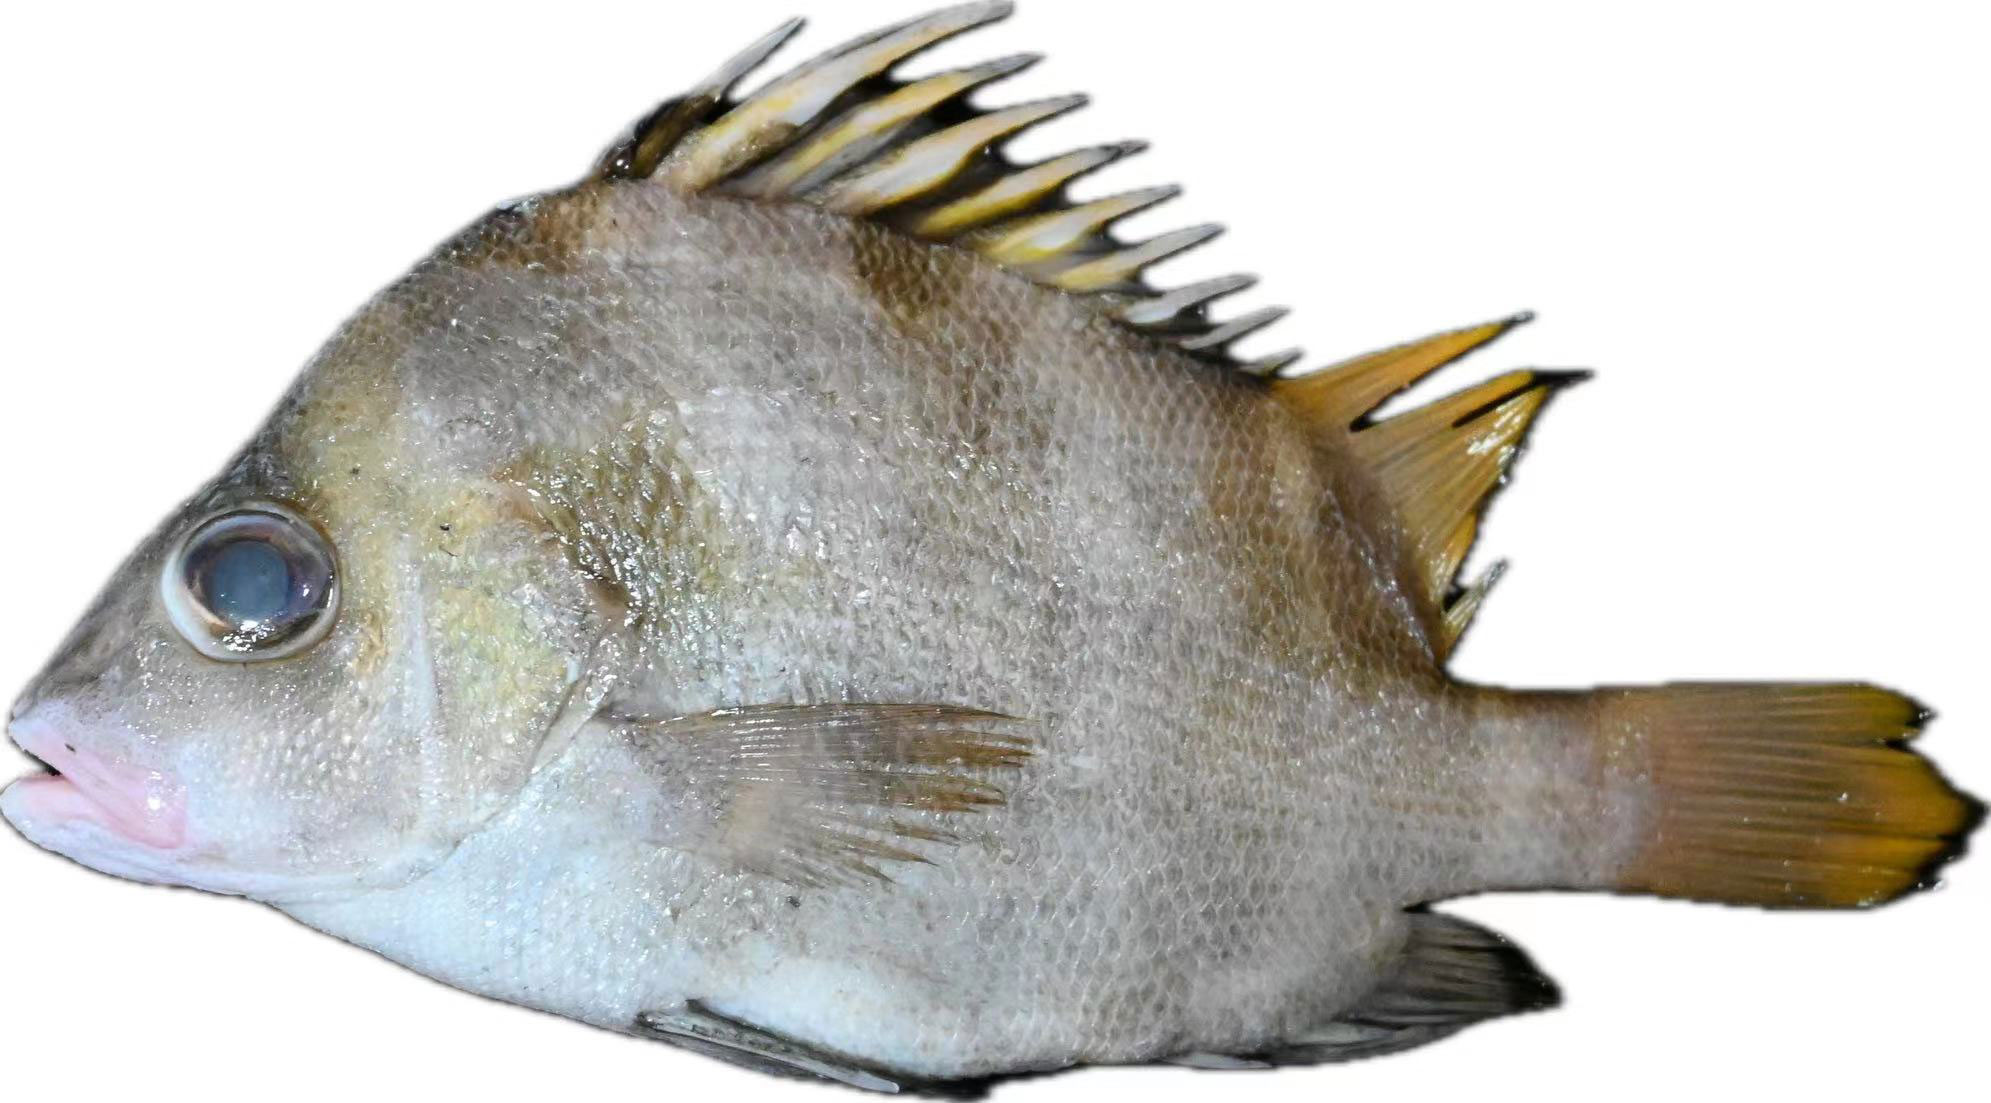
Figure 2 Hapalogenys analis.
All genomic DNA samples were sent to Guangzhou Tianyi Huiyuan Gene Technology Co., Ltd. (Guangzhou, China) for simplified genome sequencing. The experimental process was as follows: restriction endonucleases were selected to cleave genomic DNA and add sequencing connectors with barcodes, after which a small fragment library (250–450 bp long) was constructed using a NovaSeq sequencer (Illumina, San Diego, CA, USA) for 2 × 150 bp double-end sequencing.
Fastp (https://github.com/OpenGene/fastp) (Chen et al., 2018) was used for quality control and filtering to obtain high-quality data. The ustacks command in the Stacks v2.55 package (Catchen et al., 2013) was used to cluster reads in a single sample based on sequence similarity. Stacks software was used to identify SNP sites and statistically analyze the detected SNPs. Principal component analysis (PCA) was conducted using Plink v1.9 (Purcell et al., 2007) software (www.cog-genomics.org) with SNP data (excluding SNPs with multiple allele frequency < 0.05). A phylogenetic tree was constructed using the maximum likelihood algorithm in FastTree software (Price et al., 2009). Admixture software (Alexander and Lange, 2011) was used to analyze the population’s genetic structure with SNP information, and the K = 2–10 model was selected as the mixed model. Population genetic diversity (He, Ho, Pi, Fis and Fst) was analyzed using the population command in the Stack package. The G value between two individuals was calculated using Gmatrix v2 (Steppan et al., 2002). We used Plink v1.9 to calculate the IBS similarity between two individuals, obtained the IBS similarity matrix, and then generated a distance (= 1 – IBS) matrix.
Using dd-RAD sequencing technology, a sequencing library was constructed for 82 samples of H. analis. A total of 650,358,010 original sequences were obtained, with an average of 7,931,195 sequencing sequences per sample. The total number of bases obtained was 93,607,986,112, with an average of 1,141,560,806 bases. The GC ratio of the H. analis samples was 42.11–47.87%, averaging 44.31%. The Q20 and Q30 of all samples were above 96% and above 92%, respectively, indicating that the sequencing results were reliable and that the base error rate was low. Therefore, the data were suitable for further analysis (Supplementary Table S1).
A total of 32,04,106 SNP loci were detected in the 82 H. analis samples. The transition SNP ranged from 18,553–27,126, and the transversion SNP ranged from 11,174–16,710. The ratio of transition to transversion SNPs was 1.588–1.873. The value was greater than 1.5, indicating that H. analis, like most vertebrates (Foran et al., 1988), has a transformational reversal bias (Sloss et al., 2004). The SNP genetic diversity analysis results showed that the number of heterozygous mutations was 17,746–33,356, and the number of homozygous mutations was 6198–14,237 (Supplementary Table S2).
Genetic statistics based on the SNP results showed that the expected heterozygosity was greater for all three populations than the observed heterozygosity. The inbreeding coefficient was 0.219–0.246, with AS showing the lowest value and ZS showing the highest value. Nucleotide diversity analysis showed that all three populations had values greater than 0.25, indicating high diversity (Brown et al., 2004) (Table 1). Calculation of all paired fixation index (Fst) values among the three populations (Table 2) revealed that AS and ZS had the highest degree of differentiation with a value of 0.065. The differentiation coefficient between AS and ST was 0.052, and that between ZS and ST was 0.032.
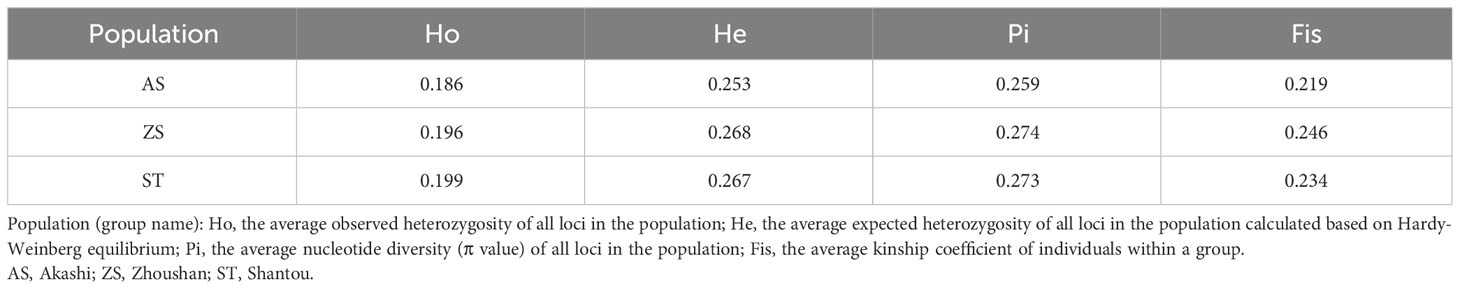
Table 1 Genetic statistics.

Table 2 Pairwise fixation index (Fst) among the three populations.
Population structure analysis revealed that the 82 H. analis individuals with consistent genetic backgrounds were clustered together, indicating accurate clustering results. The cluster with the smallest cross-validation error rate was considered optimal. As shown in Figure 3, the curve of the cross-validation error rate exhibited an upward trend. When the number of clusters (K) was two, the cross-validation error rate value was smallest; K = 2 was the optimal number of clusters, and H. analis was divided into two groups, indicating that the samples shared two gene libraries. PCA revealed that the selected H. analis samples formed three distinct groups with H. analis from AS, ST, and ZS clustered together (Figure 4). Some populations of H. analis were closely related, whereas others had a distant genetic relationship.
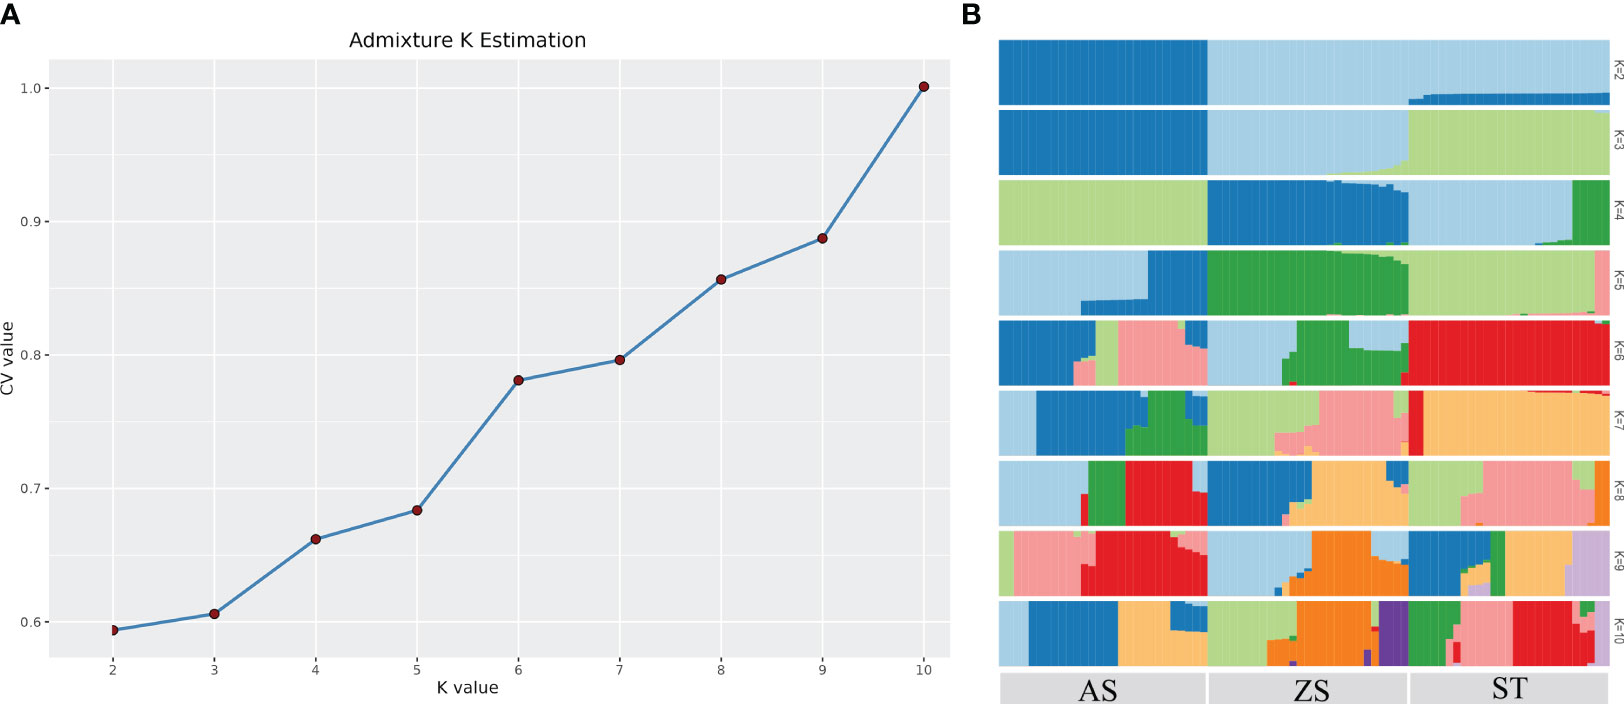
Figure 3 Cross validation error rate corresponding to different K values (A) and group structure (B).
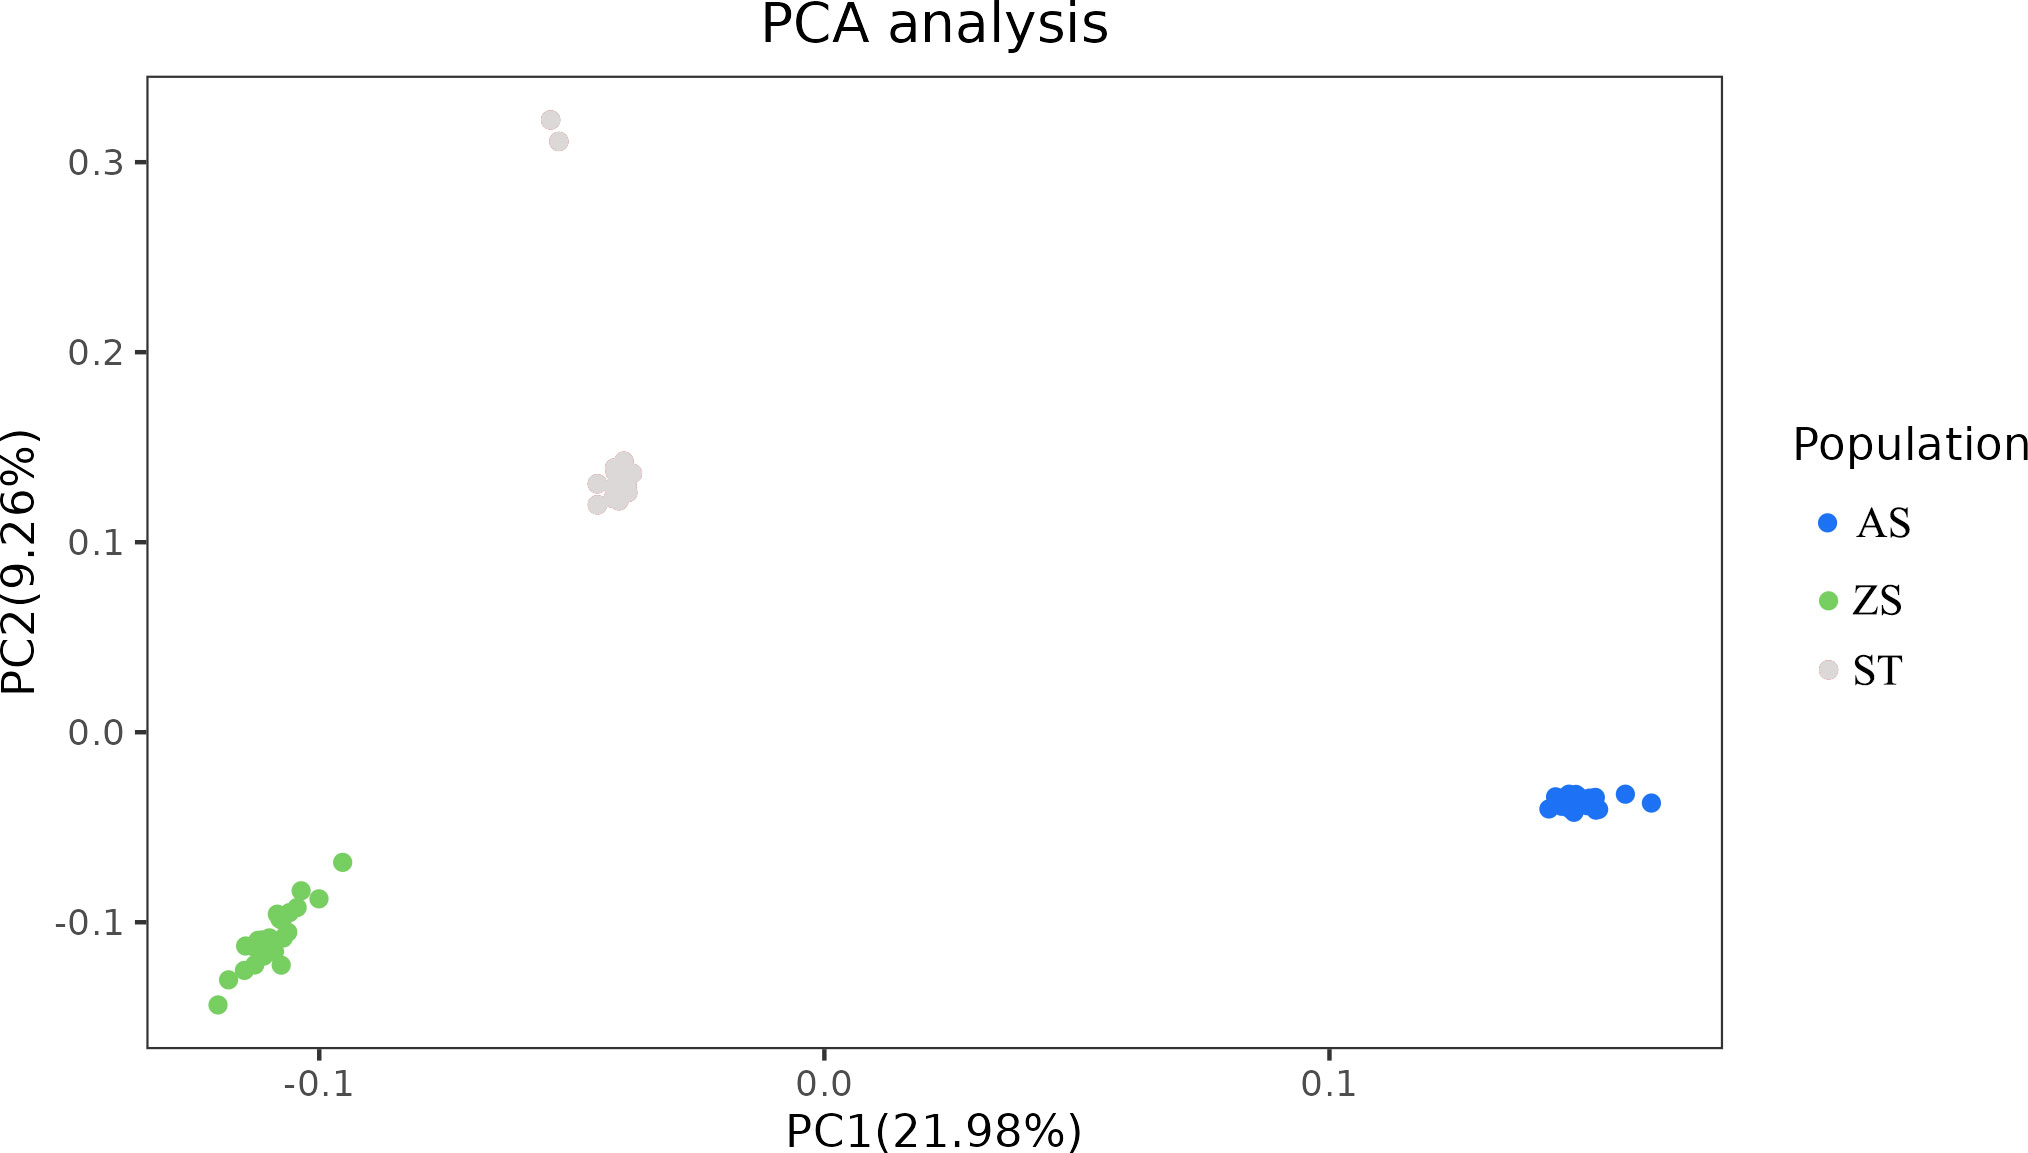
Figure 4 Principal component analysis of 82 Hapalogenys analis samples.
The phylogenetic tree showed that the 82 H. analis samples converged into three larger genetic branches. The first, second, and third categories contained H. analis from ST, from AS and ST, and from ZS and ST, respectively (Figure 5). The analysis results of the G and IBS matrices indicated (Figure 6) that all individuals were divided into two subgroups, that is, a subgroup composed of 28 AS H. analis and a subgroup composed of 27 ZS and 27 ST H. analis, respectively. These subgrouping results are consistent with those obtained using the admixtures.

Figure 5 Phylogenetic tree of 82 Hapalogenys analis based on maximum likelihood method.
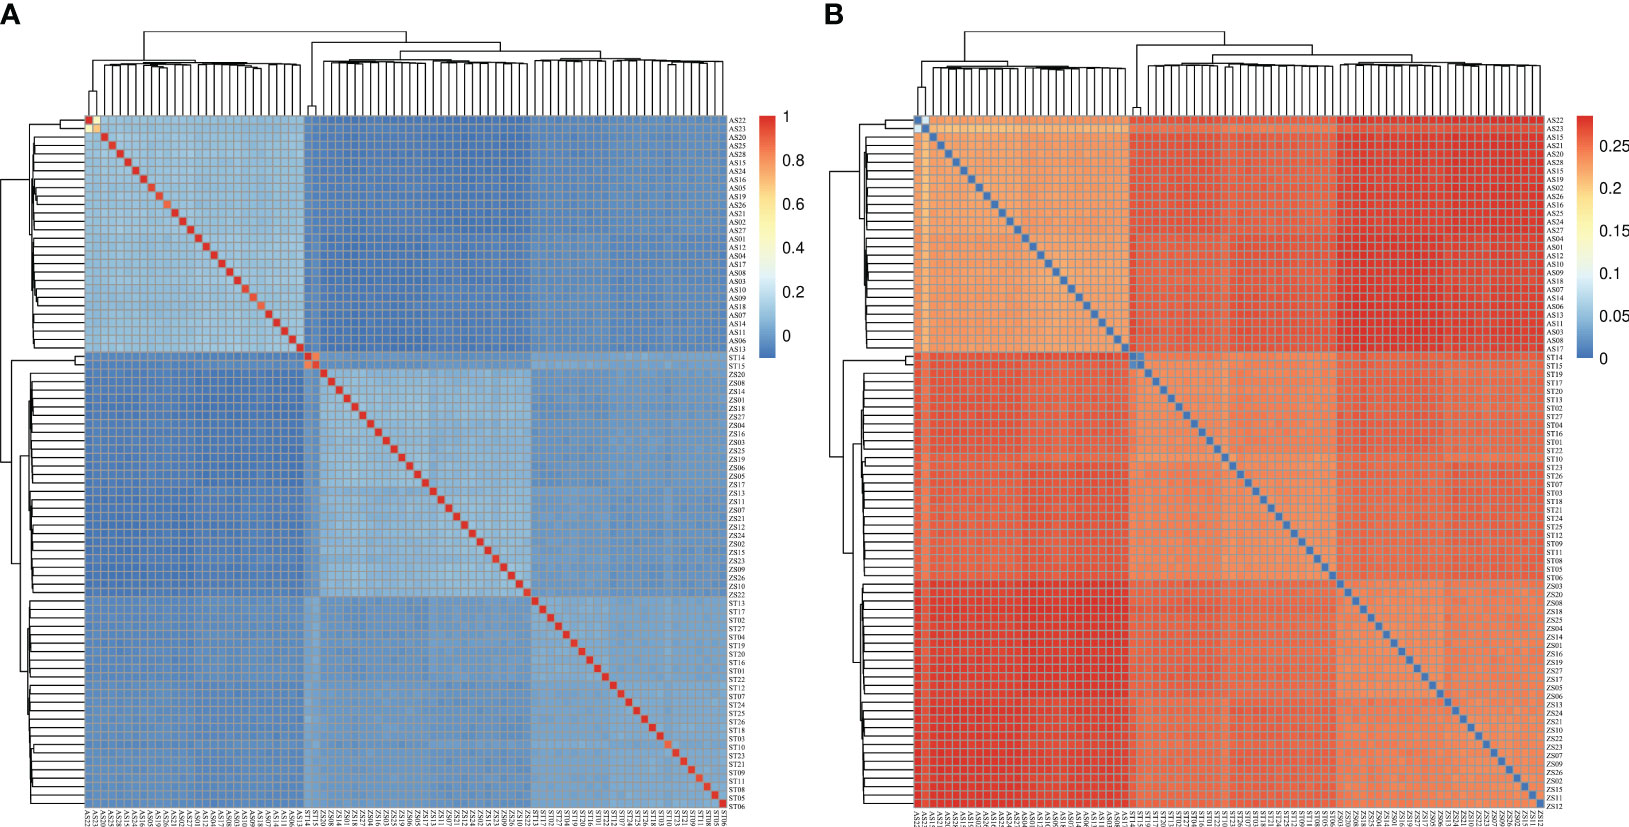
Figure 6 G matrix (A) and identical by state matrix (B).
The northwest Pacific is an ideal sea area for studying how the ice age affected marine organisms’ lineage structure and geographical distribution (Liu et al., 2006; Han et al., 2012). The effects of colonization events, population bottlenecks, isolation differentiation, lineage structure mixing, and marine organisms’ geographical differentiation can be explored within this sea area. Hapalogenys analis, an endemic species in the northwest Pacific, has unique characteristics of wide salinity and low-temperature tolerance, making it an ideal animal model for studying adaptation to the middle and lower layers of the nearshore.
Genetic diversity occurs when species adapt to various complex environments during long-term evolution and is the foundation on which species rely for survival and development (Liu et al., 2020). Studies of populations’ genetic structure and differentiation can provide valuable information for protecting and utilizing germplasm resources (Fu et al., 2019). Heterozygosity is a measure of population genetic diversity. A higher heterozygosity of a variety indicates more genetic information (Allendorf, 1986; Barkley et al., 2006). Our results demonstrated that both the observed and expected heterozygosity were lower in the AS population than in the other two populations, indicating lower genetic diversity in the AS population. The nucleotide diversity index of the three populations indicated that H. analis has high genetic diversity.
We used sequencing data to evaluate the three populations’ genetic relationships and population structure. The population differentiation coefficient, Fst, can reveal the degree of differentiation between populations (Qin et al., 2019). In this study, the degree of differentiation between AS and the other two populations was relatively high, and the Fst values were all >0.05, indicating a moderate degree of genetic differentiation between AS and the other two populations (Weir and Cockerham, 1984). There were significant differences in the clustering patterns between populations. According to PC1 (21.98%), the AS population could be distinguished from the other two populations, which is consistent with the genetic differentiation results.
The phylogenetic tree showed that individuals from the ZS and AS populations clustered independently among the three populations; however, there were individual interspersions between ST and the other two populations. This phenomenon may be attributed to the influence of coastal currents. Notably, a China coastal current flows from ZS towards ST, a reverse Kuroshio current moves from AS towards ST, with a vast East China Sea lying between ZS and AS. Genetic structure analysis of the three populations showed that when K = 2, the cross-validation error rate was the lowest, indicating that the three populations originated from two primitive ancestors. When K = 2, all AS individuals were first isolated; when K = 3, all ST individuals were isolated. When K = 4, there was a significant difference in the genetic structure of ST; an increasing K value is associated with more complex genetic information. The heat map of kinship showed that kinship between individuals in each group was relatively low.
Our results support that clusters formed independently in the AS population; this information can be used to conserve H. analis. Our results are consistent with those of Sun et al. (2023), who used mitochondrial control regions to study four populations of H. analis.
We performed dd-RAD sequencing technology to analyze the genetic diversity of three H. analis populations in the northwest Pacific by calculating various genetic diversity indicators. The results showed that the genetic diversity of all three H. analis populations was relatively high, and the population genetic differentiation coefficient and genetic structure indicated notable differentiation between the AS population and the other two populations. These results provide a theoretical basis for further exploration of the characteristics of H. analis germplasm.
The data presented in the study are deposited in the FigShare repository, accessible via https://doi.org/10.6084/m9.figshare.25060757.
The animal study was approved by Department of Ecology and Institute of Hydrobiology, Jinan University. The study was conducted in accordance with the local legislation and institutional requirements.
QZ: Conceptualization, Data curation, Funding acquisition, Writing – review & editing. C-HS: Formal analysis, Methodology, Software, Writing – original draft, Writing – review & editing. J-LH: Formal analysis, Software, Writing – original draft. Y-LL: Formal analysis, Software, Writing – original draft. X-YC: Formal analysis, Writing – original draft. J-NC: Software, Writing – review & editing.
The author(s) declare financial support was received for the research, authorship, and/or publication of this article. The present study was supported by the Fishery resources survey of Guangxi Zhuang Autonomous Region (GXZC2022-G3-001062-ZHZB).
We are very grateful to the editor and reviewers for critically evaluating the manuscript and providing constructive comments for its improvement.
The authors declare that the research was conducted in the absence of any commercial or financial relationships that could be construed as a potential conflict of interest.
All claims expressed in this article are solely those of the authors and do not necessarily represent those of their affiliated organizations, or those of the publisher, the editors and the reviewers. Any product that may be evaluated in this article, or claim that may be made by its manufacturer, is not guaranteed or endorsed by the publisher.
The Supplementary Material for this article can be found online at: https://www.frontiersin.org/articles/10.3389/fevo.2024.1345739/full#supplementary-material
Alam M. M., Westfall K. M., Pálsson S. (2017). Historical demography and genetic differentiation of the giant freshwater prawn Macrobrachium rosenbergii in Bangladesh based on mitochondrial and dd RAD sequence variation. Ecol. Evol. 7, 4326–4335. doi: 10.1073/pnas.88.6.2545
Alexander D. H., Lange K. (2011). Enhancements to the ADMIXTURE algorithm for individual ancestry estimation. BMC Bioinf. 12, 1–6. doi: 10.1186/1471-2105-12-246
Allendorf F. W. (1986). Genetic drift and the loss of alleles versus heterozygosity. Zoo Biol. 5, 181–190. doi: 10.1002/zoo.1430050212
Barkley N. A., Roose M. L., Krueger R. R., Federici C. T. (2006). Assessing genetic diversity and population structure in a citrus germplasm collection utilizing simple sequence repeat markers (SSRs). Theor. Appl. Genet. 112, 1519–1531. doi: 10.1007/s00122-006-0255-9
Brown G. R., Gill G. P., Kuntz R. J., Langley C. H., Neale D. B. (2004). Nucleotide diversity and linkage disequilibrium in loblolly pine. P. Natl. A Sci. 101, 15255–15260. doi: 10.1073/pnas.0404231101
Catchen J., Hohenlohe P. A., Bassham S., Amores A., Cresko W. A. (2013). Stacks: an analysis tool set for population genomics. Mol. Ecol. 22, 3124–3140. doi: 10.1111/mec.12354
Chen S., Zhou Y., Chen Y., Gu J. (2018). fastp: an ultra-fast all-in-one FASTQ preprocessor. Bioinformatics 34, i884–i890. doi: 10.1093/bioinformatics/bty560
Foran D. R., Hixson J. E., Brown W. M. (1988). Comparisons of ape and human sequences that regulate mitochondrial DNA transcription and D-loop DNA synthesis. Nucleic Acids Res. 16 (13), 5841–5861. doi: 10.1093/nar/16.13.5841
Fu Y., Li S., Guo Q., Zheng W., Yang R., Li H. (2019). Genetic diversity and population structure of two endemic Cupressus (Cupressaceae) species on the Qinghai-Tibetan Plateau. J. Genet. 98, 14. doi: 10.1007/s12041-019-1059-4
Guo C., Ma P. F., Yang G. Q., Ye X. Y., Guo Y., Liu J. X., et al. (2021). Parallel ddRAD and genome skimming analyses reveal a radiative and reticulate evolutionary history of the temperate bamboos. Syst. Biol. 70, 756–773. doi: 10.1093/sysbio/syaa076
Han Z., Yanagimoto T., Zhang Y., Gao T. (2012). Phylogeography study of Ammodytes personatus in Northwestern Pacific: Pleistocene isolation, temperature and current conducted secondary contact. PloS One 7, e37425. doi: 10.1371/journal.pone.0037425
Henning F., Lee H. J., Franchini P., Meyer A. (2014). Genetic mapping of horizontal stripes in Lake Victoria cichlid fishes: benefits and pitfalls of using RAD markers for dense linkage mapping. Mol. Ecol. 23, 5224–5240. doi: 10.1111/mec.12860
Iwatsuki Y. U. K. I. O., Russell B. C. (2006). Revision of the genus Hapalogenys (Teleostei: Perciformes) with two new species from the Indo-west Pacific. Mem. Museum Victoria. 63, 29–46. doi: 10.24199/j.mmv.2006.63.6
Liu F., Qu Y. K., Geng C., Wang A. M., Zhang J. H., Li J. F., et al. (2020). Analysis of the population structure and genetic diversity of the red swamp crayfish (Procambarus clarkii) in China using SSR markers. Electron. J. Biotechnol. 47, 59–71. doi: 10.1016/j.ejbt.2020.06.007
Liu J. X., Gao T. X., Yokogawa K., Zhang Y. P. (2006). Differential population structuring and demographic history of two closely related fish species, Japanese sea bass (Lateolabrax japonicus) and spotted sea bass (Lateolabrax maculatus) in Northwestern Pacific. Mol. Phylogenet. Evol. 39, 799–811. doi: 10.1016/j.ympev.2006.01.009
Mohapatra A., Ray D., Kumar V. (2013). A new fish species of the Genus Hapalogenys (Perciformes: Hapalogenyidae) from the Bay of Bengal, India. Zootaxa, 3718, 367–377. doi: 10.11646/zootaxa.3718.4.6
Mondini L., Noorani A., Pagnotta M. A. (2009). Assessing plant genetic diversity by molecular tools. Diversity 1, 19–35. doi: 10.3390/d1010019
Nyinondi C. S., Mtolera M. S. P., Mmochi A. J., Lopes Pinto F. A., Houston R. D., de Koning D. J., et al. (2020). Assessing the genetic diversity of farmed and wild RuFiji tilapia (Oreochromis urolepis urolepis) populations using ddRAD sequencing. Ecol. Evol. 10, 10044–10056. doi: 10.1002/ece3.6664
Price M. N., Dehal P. S., Arkin A. P. (2009). FastTree: computing large minimum evolution trees with profiles instead of a distance matrix. Mol. Biol. Evol. 26, 1641–1650. doi: 10.1093/molbev/msp077
Purcell S., Neale B., Todd-Brown K., Thomas L., Ferreira M. A., Bender D., et al. (2007). PLINK: a tool set for whole-genome association and population-based linkage analyses. Am. J. Hum. Genet. 81, 559–575. doi: 10.1086/519795
Qin M., Li C., Li Z., Chen W., Zeng Y. (2019). Genetic diversities and differentially selected regions between Shandong indigenous pig breeds and western pig breeds. Front. Genet. 10. doi: 10.3389/fgene.2019.01351
Raffini F., Fruciano C., Franchini P., Meyer A. (2017). Towards understanding the genetic basis of mouth asymmetry in the scale-eating cichlid Perissodus microlepis. Mol. Ecol. 26, 77–91. doi: 10.1073/pnas.88.6.2545
Severn-Ellis A. A., Scheben A., Neik T. X., Saad N. S. M., Pradhan A., Batley J. (2020). Genotyping for species identification and diversity assessment using double-digest restriction site-associated DNA sequencing (ddRAD-seq). Legume genomics. Methods Protoc., 159–187. doi: 10.1007/978-1-0716-0235-5_8
Sloss B. L., Billington N., Burr B. M. (2004). A molecular phylogeny of the Percidae (Teleostei, Perciformes) based on mitochondrial DNA sequence. Mol. Phylogenet. Evol. 32, 545–562. doi: 10.1016/j.ympev.2004.01.011
Steppan S. J., Phillips P. C., Houle D. (2002). Comparative quantitative genetics: evolution of the G matrix. Trends Ecol. Evol. 17, 320–327. doi: 10.1016/S0169-5347(02)02505-3
Sun C. H., Lao Y. L., Huang J. L., Huang X. Y., Zhang Q. (2023). Genetic structure and phylogeography of the endemic species broadbanded velvetchin Hapalogenys analis in the northwest Pacific. Reg. Stud. Mar. Sci. 62, 102956. doi: 10.1016/j.rsma.2023.102956
Weir B. S., Cockerham C. C. (1984). Estimating F-statistics for the analysis of population structure. Evolution 38, 1358–1370. doi: 10.1111/j.1558-5646.1984.tb05657.x
Keywords: Hapalogenys analis, comparative genomics, population genetic diversity, double-digest restriction site-associated DNA sequencing, Northwest Pacific
Citation: Zhang Q, Sun C-H, Huang J-L, Lao Y-L, Chang X-Y and Cao J-N (2024) Genetic diversity of Hapalogenys analis in the northwest Pacific assessed using dd-RAD sequencing. Front. Ecol. Evol. 12:1345739. doi: 10.3389/fevo.2024.1345739
Received: 28 November 2023; Accepted: 08 January 2024;
Published: 30 January 2024.
Edited by:
Gyaneshwer Chaubey, Banaras Hindu University, IndiaReviewed by:
Jiawei Sun, Massachusetts General Hospital and Harvard Medical School, United StatesCopyright © 2024 Zhang, Sun, Huang, Lao, Chang and Cao. This is an open-access article distributed under the terms of the Creative Commons Attribution License (CC BY). The use, distribution or reproduction in other forums is permitted, provided the original author(s) and the copyright owner(s) are credited and that the original publication in this journal is cited, in accordance with accepted academic practice. No use, distribution or reproduction is permitted which does not comply with these terms.
*Correspondence: Qun Zhang, dHFfemhhbmdAeWVhaC5uZXQ=; dHF6aGFuZ0BqbnUuZWR1LmNu
†These authors have contributed equally to this work
Disclaimer: All claims expressed in this article are solely those of the authors and do not necessarily represent those of their affiliated organizations, or those of the publisher, the editors and the reviewers. Any product that may be evaluated in this article or claim that may be made by its manufacturer is not guaranteed or endorsed by the publisher.
Research integrity at Frontiers
Learn more about the work of our research integrity team to safeguard the quality of each article we publish.