 Haotian Yu
 Xuexue Qian2
- 1State Key Laboratory of Earth Surface Processes and Resource Ecology, Faculty of Geographical Science, Beijing Normal University, Beijing, China
- 2Cuiyuan High School, Shenzhen, China
- 3High School of Shenzhen Nanshan Foreign Language School (Group), Shenzhen, China
Introduction: As a key indicator to evaluate biodiversity and eco-function, habitat quality shows the value of ecosystem services. The Qinghai–Tibet Plateau occupies the highest elevation in the global dimension, where the regional environment is greatly affected by multiple factors including the terrain comprehensively.
Methods: In the present study, the InVEST model was employed to assess the habitat quality across varying terrain gradients. The study observed the displacement of the center of gravity of habitat quality under different topographical factors over the past 20 years to learn the trend of changes. Additionally, the Geo-detector model was enhanced to explore the contribution rate of driving factors including biodiversity in different topographic positions and overall.
Results: The results found the following: (1) The habitat quality of the Qinghai–Tibet Plateau was positively correlated with the terrain gradient, and the mean values of habitat quality increased with the gradual increase in terrain gradient. In the period between 2000 and 2020, mean habitat quality values within the study area exhibited a slight fluctuating trend with the spatial distribution characterized by higher values in the southeast and lower values in the northwest. (2) Among different terrain gradients, trends in the mean center’s shift of habitat quality were diverse. The mean center of gradient I went north but gradient V went west. The mean center of the habitat quality in gradients II–IV showed an uncertain trend. (3) The NDVI exerted the most vital influence on the quality of habitats irrespective of different terrain gradients. Annual mean temperature, soil type, and slope occupied two to four places in each terrain.
Discussion: The study indicates that in the last two decades, the habitat quality on the Qinghai–Tibet Plateau has gradually increased across different terrain locations. In terms of policies to protect habitats, terrain should be classified and targeted accordingly.
1 Introduction
Habitat quality is defined as the capacity of an ecosystem to sustain the survival and reproduction of species, thereby preserving biodiversity (Hall et al., 1997). Habitat quality is a determinant of a habitat’s suitability for biological communities and is crucial for the conservation of biodiversity (Tallis and Ricketts, 2011). With the gathered speed in constructing land and enhancing human activities brought about by the continuous progress in urbanization, the stress on natural habitats was increasing, resulting in the fragmentation of biological habitat in the natural state; the decline in biodiversity was larger than ever and has had a negative impact on human wellbeing (Rands et al., 2010). Consequently, research into the evolution of regional habitat quality is of paramount importance for ensuring the stability and fostering the sustainability of biodiversity conservation efforts.
Recent studies showed the relationships between the terrain and the habitat quality, and the terrain gradient index was utilized to evaluate the impact of the topographic factors on habitat quality (Gong et al., 2017). In the study of a region in an island (Huang et al., 2023), an arid plateau (Qu et al., 2022), and the area where the mountains meet the plains (Xiao et al., 2023), the terrain gradient positively corresponds to the habitat quality. This is because human activity caused minimal destruction in areas that are high and steep. The higher places also occupy more areas such as forests or grassland to preserve the ecology. The perspective of terrain provides us with classification criteria and rational dimensions for observing habitat quality.
Initial evaluations of habitat quality were predominantly based on biodiversity inventories and in situ habitat surveys, which exhibited restricted applicability and posed challenges for widespread implementation, often confined to the assessment of habitat quality within minor watersheds (Miller et al., 2009). Large- and medium-scale studies are often evaluated by ecological model simulation methods, such as the ARIES model (Bagstad et al., 2011), the SoIVES model (Brown and Brabyn, 2012), the MIMES model (Boumans et al., 2015), and the InVEST model (Sharp et al., 2018). Because the InVEST model has the characteristics of high reliability, few input parameters, and strong spatial analysis ability (Wang et al., 2015), it has been successfully implemented across various scales, including municipal, regional, and basin-wide levels (Chen et al., 2016; Yan et al., 2018; Chu et al., 2018b; Lee and Jeon, 2020). For research methodology, most previous studies focus on the spatiotemporal evolution (Yan et al., 2018; Sun et al., 2019; Qu et al., 2022; Zheng et al., 2022) and on the prediction (Chu et al., 2018a; Tang et al., 2021; Zhao et al., 2022) of habitat quality, without exploring its driving forces. Gaining a deeper insight into the fundamental factors influencing alterations in habitat quality is essential to uncover the mechanisms at play in such transformations. Methods to explore the driving forces of habitat quality mainly include correlation analysis (Yohannes et al., 2021), the geographical weighted regression model (GWR) (Yang, 2021), and the geographic detector model (Geo-detectors) (Cui et al., 2022; Dong et al., 2022; Jing et al., 2022). Geo-detectors have been extensively utilized to investigate the driving factors influencing habitat quality, as it can detect habitat quality’s both single-factor and multi-factor interaction. As critical components of the nature, terrain factors influence the migration of surface materials and the conversion of energy significantly (Ma et al., 2023). Assessing and analyzing habitat quality in a topographic perspective is crucial for comprehensively comprehending the spatiotemporal dynamics of habitat quality and the factors prompting these changes (Lu et al., 2022).
The Qinghai–Tibet Plateau occupies a delicate ecological system with global significance. Its presence is crucial for the biodiversity and ecological integrity of the plateau and its adjacent areas. The spatial pattern of the Qinghai–Tibet Plateau ecosystem has undergone significant changes recently due to enhancement of human activities, climate warming, humidity, and other important reasons with strong vulnerability (Chen et al., 2015; Zhang et al., 2015; Pritchard, 2019; Han and Wei, 2021; Li and Song, 2021; Fan and Fang, 2022). Under the scenarios in different terrain gradients, the habitat quality of the Tibetan Plateau in 2000, 2005, 2010, 2015, and 2020 was evaluated based on the habitat quality module of the InVEST model. Spatiotemporal distribution characteristics of habitat quality and its influencing factors were analyzed by a Geo-detector. To enhance the stability and sustainability of the plateau, it was of significance to thoroughly understand the current situation of biodiversity and ecological environment security of the Qinghai–Tibet Plateau.
2 Materials and methods
In the present study, we classified topographic factors in different levels by terrain gradient index. Calculating habitat quality by evaluating land-use matrix change index in the InVEST model, spatiotemporal changes in different topographic levels were displayed. We can also witness the spatial aggregation by employing the Moran’I index. The geographical detector model was ultimately employed to ascertain the most significant factors affecting habitat quality at different terrain gradient levels and to pinpoint critical factors in various topographic scenarios. By evaluating the data from natural and social resource comprehensively, the spatiotemporal variations and driving forces of habitat quality in the third pole can be distinctly understood. The roadmap is shown in Figure 1.

Figure 1 Technical roadmap of the article.
2.1 Study area
As the highest plateau in the globe, the Qinghai–Tibet Plateau is located in the southwest of China (Figure 2). Inclining from northwest to southeast, the plateau that was known as the “roof of the world” has a mean altitude of over 4,000 m. The region spans Tibet, Qinghai, and part of Xinjiang, Sichuan, Yunnan, and Gansu, accounting for the total area of 2.58 million km2, which is approximately 1/4 of China (Pritchard, 2019). The annual average temperature of the Qinghai–Tibet Plateau ranges from −10°C to 15°C, with uneven spatial distribution, exhibiting a gradual decrease from southeast to northwest (Bai et al., 2018). The average annual precipitation on the plateau is approximately 400 mm. The southern part affected by warm and moist air from the Indian Ocean gets over 1,000 mm. In contrast, the inland northern part gets only around 100 mm (Han et al., 2017). As the “Asian Water Tower”, the Qinghai–Tibet Plateau has nurtured several river systems including the Yellow River, Yangtze River, Lancang River, and Brahmaputra. It is a critical area for maintaining water resources security both nationally and globally, which provides security for the lives of people in many countries around the world (Wu and Lin, 1981). The region owns a typical plateau climate, and the predominant climatic characteristics include significant diurnal temperature variation, intense solar radiation, low temperature, and precipitation. Spatially, from southeast to northwest, both temperature and precipitation in this region show a decreasing trend (Bao et al., 2015). The land-use classifications on the plateau are categorized into nine main classifications: cropland, forest, shrubland, grassland, wetlands, water body, impervious surfaces, bare areas, and permanent ice and snow. The largest landscape type is grassland, followed by bare areas and forest. In 2020, the grassland area of the research area was 1,486,918 km2, constituting 57.57% of the total. The area of bare areas and forest was 609,702 km2 and 271,272 km2, accounting for 23.61% and 10.5%, respectively. The impervious surface area was 919 km2, which only represented 0.036%. The land-use data reveal the shifts that occurred between 2000 and 2020. In 20 years, the grassland and cropland area decreased by 69,052 km2 and 132 km2, respectively. Inversely, the area of other remaining landscapes increased. The area of bare areas, shrubland, permanent ice and snow, water body, and forest increased the most obviously, by 20,475 km2, 14,422 km2, 12,875 km2, 10,794 km2, and 8,171 km2, respectively. The largest increase is in impervious surface area with an increase of 62.08%.
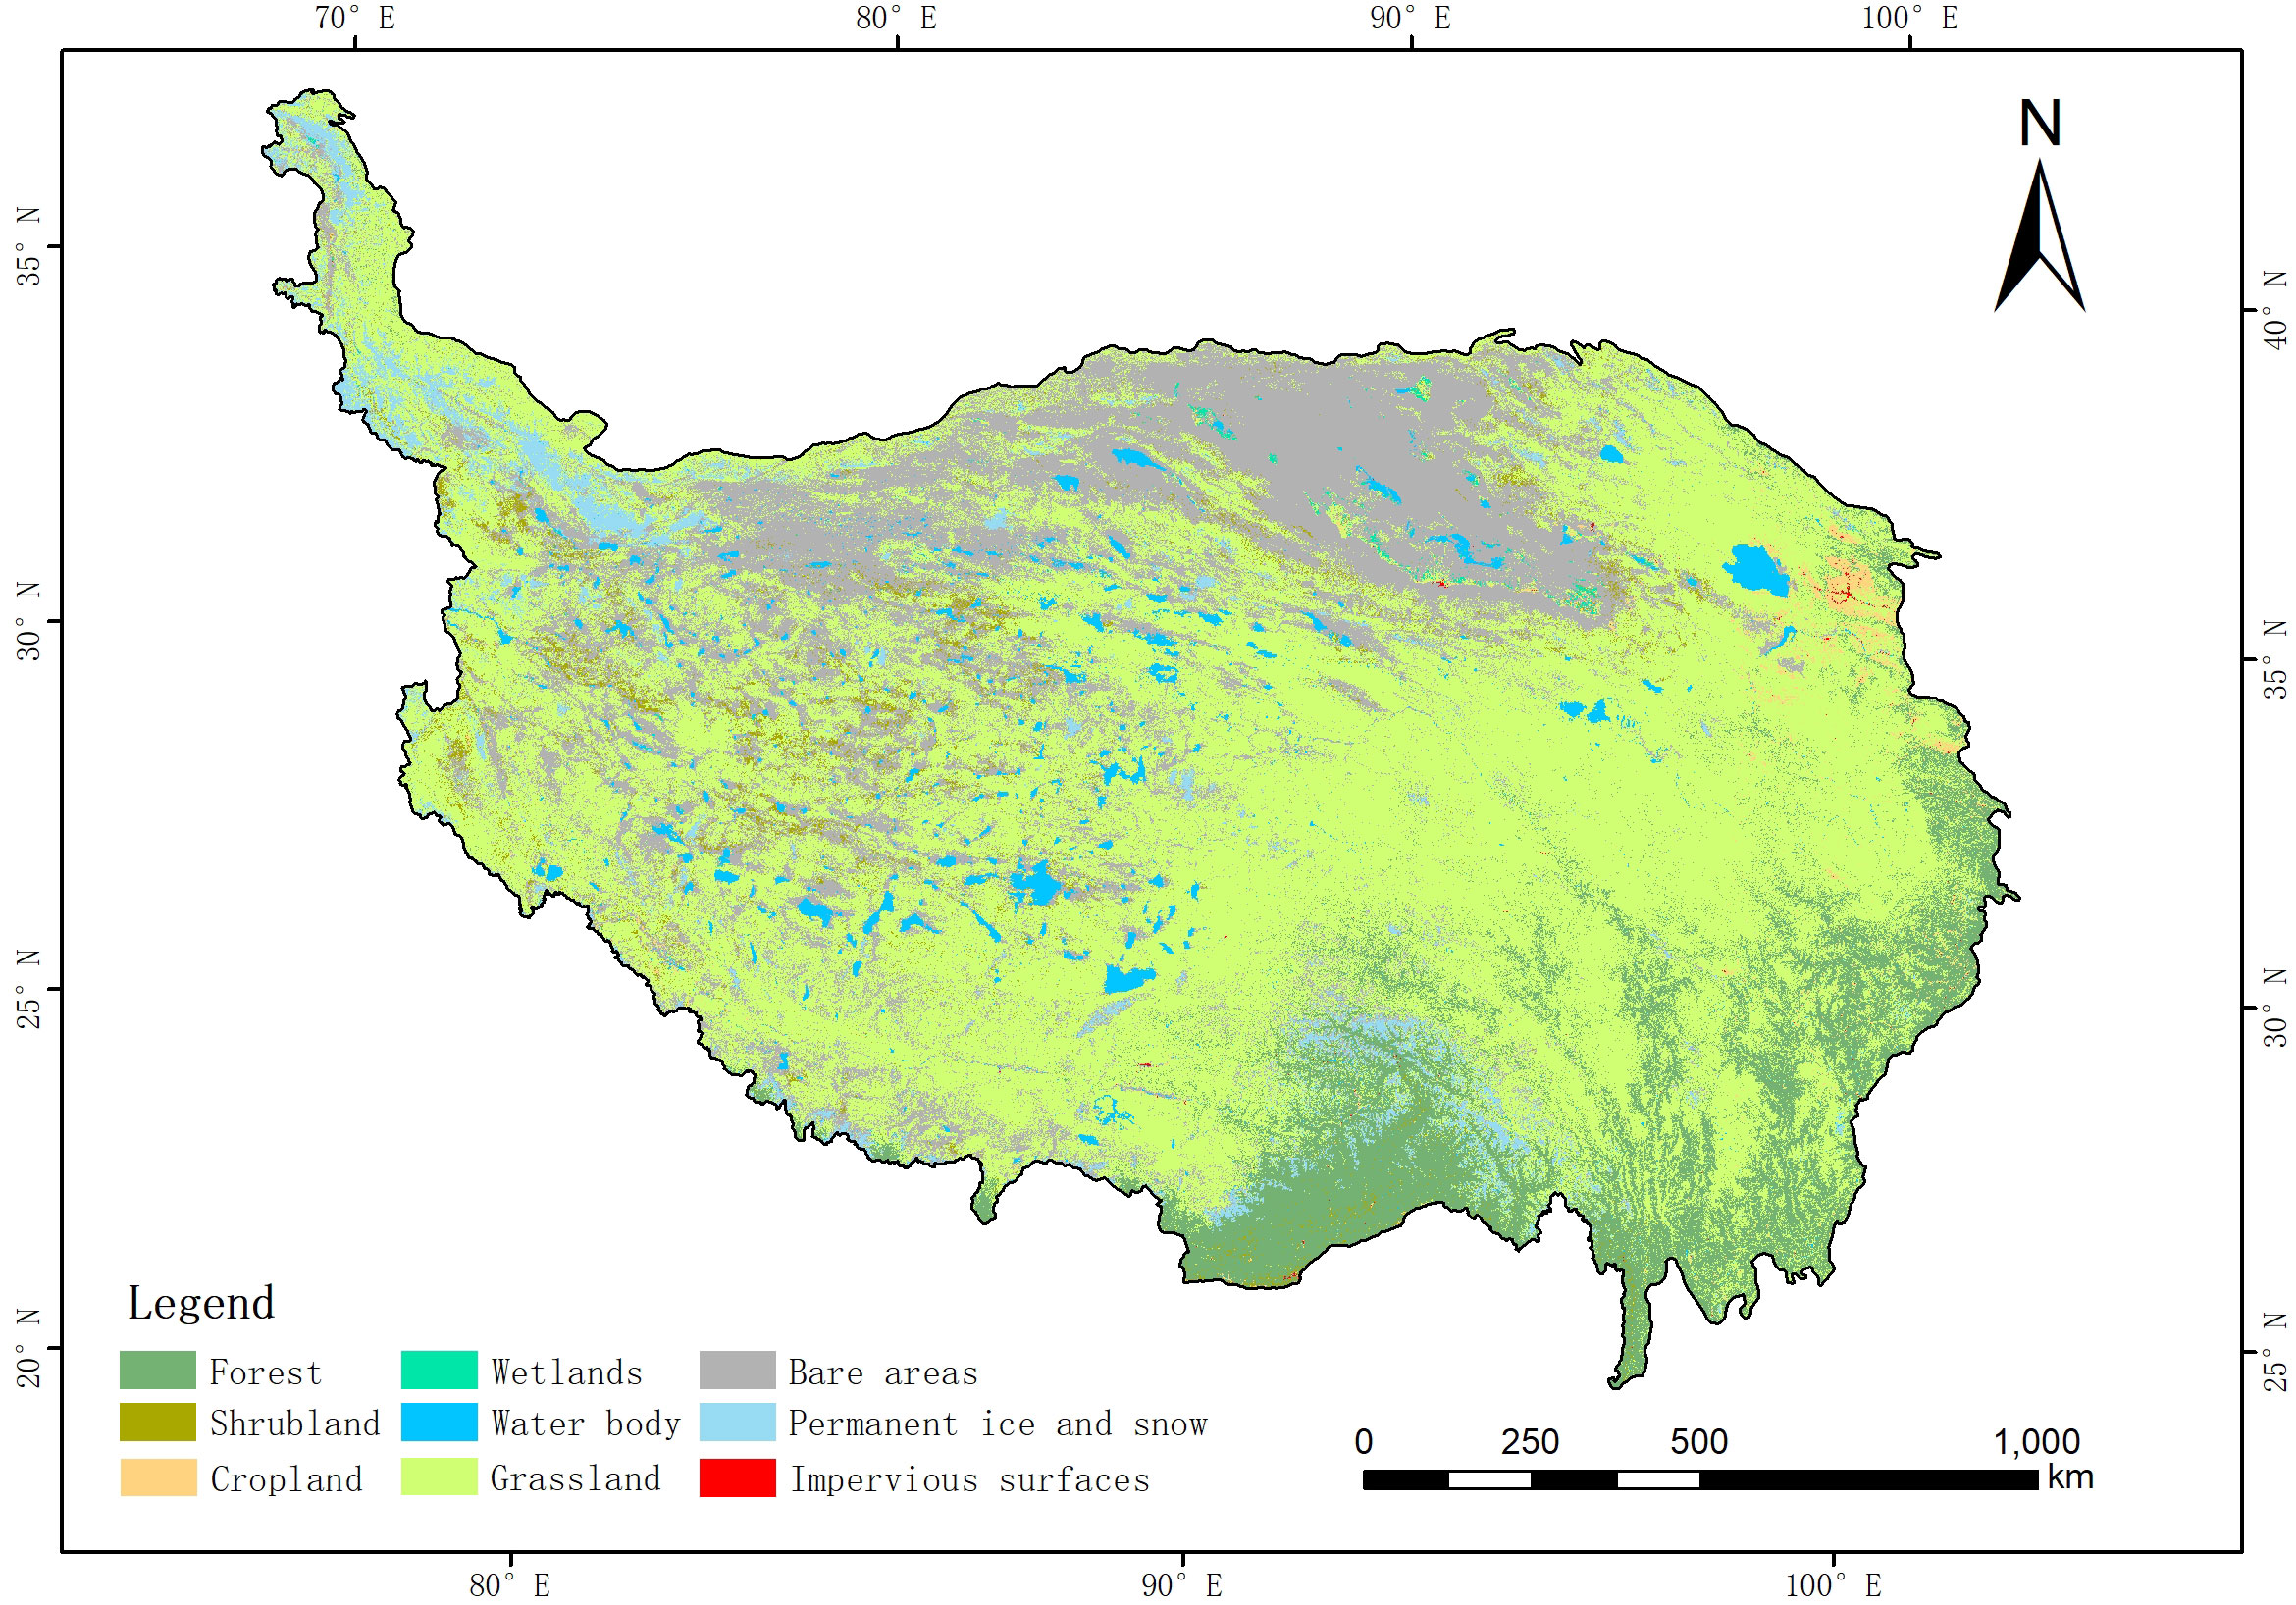
Figure 2 The geographical location and land-use patterns of the Qinghai–Tibet Plateau.
2.2 Data sources
This study primarily utilizes data encompassing land-use classifications, road networks, soil categories, population density, gross domestic product (GDP), mean annual temperature, mean annual precipitation, Normalized Difference Vegetation Index (NDVI), and topographical data. The land-use data were sourced from a global land-cover product featuring a fine-resolution classification system with a 30-m resolution, incorporating time-series analysis (http://data.casearth.cn/sdo/list) as of 7 November 2021, including every 5 years from 1990 to 2020, and the land classifications are categorized into cropland, forest, shrubland, grassland, wetlands, water body, impervious surfaces, bare areas, and permanent ice and snow (nine categories). Digital Elevation Model (DEM) data were obtained from the National Qinghai Plateau Science Data Center (http://data.tpdc.ac.cn) as of 15 November 2021, and slope data were derived using ArcGIS 10.2 software based on the DEM data. Road network data were sourced from the OpenStreetMap website (http://openstreetmap.org) as of 10 November 2021. Soil classification, GDP, and NDVI datasets were acquired from the Resource and Environmental Science and Data Center (RESDC) of the Chinese Academy of Sciences as of 10 November 2021. The yearly data were accessed in the RESDC website (http://www.resdc.cn), which has the resolution of 1,000 m×1,000 m. Population density data were from the WorldPop Population Density Dataset (https://www.worldpop.org) as of 12 November 2021. Shannon’s Diversity Index (SHDI), Patch density (PD), and aggregation index (AI) were calculated by Fragstats4.2 software. The spatial resolution of multi-source raster data is unified to 1,000 m.
2.3 Method
2.3.1 Terrain gradient index
Assessing habitat quality from a topographical standpoint is essential for understanding spatial distribution patterns and its influencing factors (Lu et al., 2022). The terrain gradient index combines elevation and slope attributes to comprehensively reflect a location’s terrain characteristics. As elevation and slope increase, the terrain gradient index correspondingly increases; conversely, lower combinations of elevation and slope result in a reduced terrain gradient index. The terrain gradient index can be calculated as follows (Yu et al., 2001):
Where donates the terrain gradient index; and represent the elevation at any point and its mean value across the area respectively; and represent the slope value of at any point and its mean value respectively.
2.3.2 Assess habitat quality”: InVEST model
Habitat encompasses the resources and conditions necessary for the survival and reproduction of particular species, whereas habitat quality refers to an ecosystem’s ability to provide conditions conducive to the survival and reproduction for organisms and populations (Shui et al., 2018). To assess the habitat quality of the Qinghai–Tibet Plateau, the InVEST model’s habitat quality module quantifies the quality using the Habitat Quality Index. The value is developing with the increasing habitat quality, biological survival suitability, and corresponding biodiversity. Utilizing land-use data, the module establishes a linkage between habitat quality and sources of threat, considering 3 factors: the relative impact of each threat source, the relative sensitivity of each habitat type to the threat source, and the distance between the habitat and the threat source. Distribution patterns of habitat quality within the study area were determined using the habitat quality pattern. Habitat quality was assessed as follows:
Where donates the habitat quality of pixel in land-use type ; represents the habitat appropriateness of land-use type ; denotes the degree of habitat degradation in grid cell with land-use type ; represents the normalization constant, with a value of 2.5 assigned to z in the algorithm. is defined as half the value of the saturation constant, is set to 0.5.
Where denotes the quantity of potential threats; signifies a specific threat layer; is the total grid number of ; denotes the threat source’s weight; quantifies the impact of threat that emanating from grid cell with values ranging from 0 to 1; represents the spatial separation between the habitat and the source of the threat, illustrating how the threat’s influence diminishes with increasing distance; means the grid cell’s level of resistance to interference ; represents the relative sensitivity of land-use type to the threat source
Where is the distance between grid cells and ; and is the maximum impact distance of the threat source.
This study entailed a comprehensive review of the InVEST model manual (Sharp et al., 2018) and pertinent literature (Shui et al., 2018; Zhang et al., 2020; Zhu et al., 2020b). As shown in Supplementary Tables S1, S2, the relevant parameters were set for the model according to regional specific conditions.
2.3.3 Evaluate spatial autocorrelation: Moran’ Index
Spatial autocorrelation indicates whether observed values of a certain position is independent of the value of the variable in the adjacent position, measuring autocorrelation of the observed value in spatial distribution. In the present study, Global Moran Index (GMI) and Local Moran Index (LMI) were introduced to investigate spatial autocorrelation and distribution patterns of habitat quality throughout the plateau. GMI was employed to assess the presence of significant spatial autocorrelation, that is, to judge whether the habitat quality was clustered, discrete, or random in space. LMI explored spatial clustering of habitat quality at a pixel level. GMI ranges from −1 to 1, with values greater than 0 indicating positive spatial autocorrelation. Values less than 0 indicate negative spatial autocorrelation. The higher the value, the stronger the autocorrelation. The smaller the value, the greater the spatial difference. If the value is equal to 0, the space is random. LMI includes four categories: HH (High–High), LL (Low–Low), HL (High–Low), and LH (Low–High), which can represent the habitat quality and local autocorrelation (Fu et al., 2014).
This paper uses ArcGIS10.2 software to calculate GMI and LMI. The calculation principle is as follows:
Where and represent the habitat quality values of units and respectively; donates the sum of habitat units, ; is the spatial weight matrix; represents the mean value of ; is the variance of . When >1.96, <0.05, it represents that the spatial autocorrelation is statistically significant.
2.3.4 Explore spatial heterogeneity: Geo-detector model
The Geo-detector could statistically detect spatial heterogeneity and identify driving forces. This suite consists of four main components: factor detector, interaction detector, risk detector, and the ecology detector. The research mainly utilized the first two modules above. The fundamental principle underlying factor detector theory posits that the spatial distribution of the dependent variable is significantly influenced by an independent variable. Therefore, it is hypothesized that the independent and dependent variables are expected to demonstrate a consistent spatial distribution (Wang and Xu, 2017). In the model, the q-value is used to quantify the explanatory power of the independent variable over the dependent variable, ranging from [0,1]. A q-value approaching 1 indicates a stronger explanatory power of the independent variable, while a q-value near 0 suggests weaker explanatory significance. The principle of factor detection is as follows:
Where donates the factor detector (q-value); represents the quantity of factor classifications or partitions, ; is the total number of samples for the influencing factors; and denote the number of units in class and the entire region, respectively; and denote the variances in the layer and the whole region , respectively. and represent the sum of variances within the layer and the total variance across the whole area, respectively.
Interaction detectors are used to identify interactions between factors and to assess whether their combined effect increases or decreases the explanatory power of the dependent variable. The relationship between the two factors can be divided into five categories: enhanced double factors, enhanced nonlinear factors, independent factors, weakened nonlinear factors, and weakened single-factor nonlinear factors.
To ensure that the Geo-detector’s input variables are categorical variables, the natural breakpoint method is employed to discretize the attribute variable and influencing factors. According to the data accuracy and computing requirements, a 5-km×5-km grid was generated. The mean values of habitat quality and influencing factors in each grid area were extracted. Habitat quality served as the dependent variable, with influencing factors considered as independent variables. These were then inputted into the Geo-detector model for calculation.
3 Results
3.1 Terrain gradient effect of habitat quality
The terrain gradient index within the plateau’s boundary was calculated to classify the topographic complexity into distinct levels (Figure 3). The range of the terrain gradient index was 0–1.78, which was categorized into five grades utilizing the natural breakpoint method. The plateau’s terrain exhibited complexity, characterized by marked spatial variability. Regions in III–V terrain gradient was accounted for 57.77% of the Qinghai–Tibet Plateau’s total area, primarily distributed in the southern and northwestern parts of the plateau. The II terrain gradient represented the largest proportion at 27.75%, primarily located in the central and northern regions of the plateau. The I terrain gradient predominated in the plateau’s northeastern basin area. Combined with distributions of landscape types, 94.96% of permanent ice and snow, 88.77% of forest, and 62.39% of grassland are distributed in III–V terrain gradients; 92.31% of wetlands, 89.18% of water body, 68.75% of the impervious surfaces, 64.14% of bare areas, and 60.34% of cropland are distributed in I and II terrain gradients (Figure 4). The proportion of impervious surfaces, water body, and wetlands decreased with the increase in terrain gradients, and the opposite was observed for permanent ice and snow and forest. Bare areas, grassland, shrubland, and cropland increased first and then declined. Grassland and shrubland were dominant in gradients II–III, while bare areas and cropland were dominant in gradients I–II.
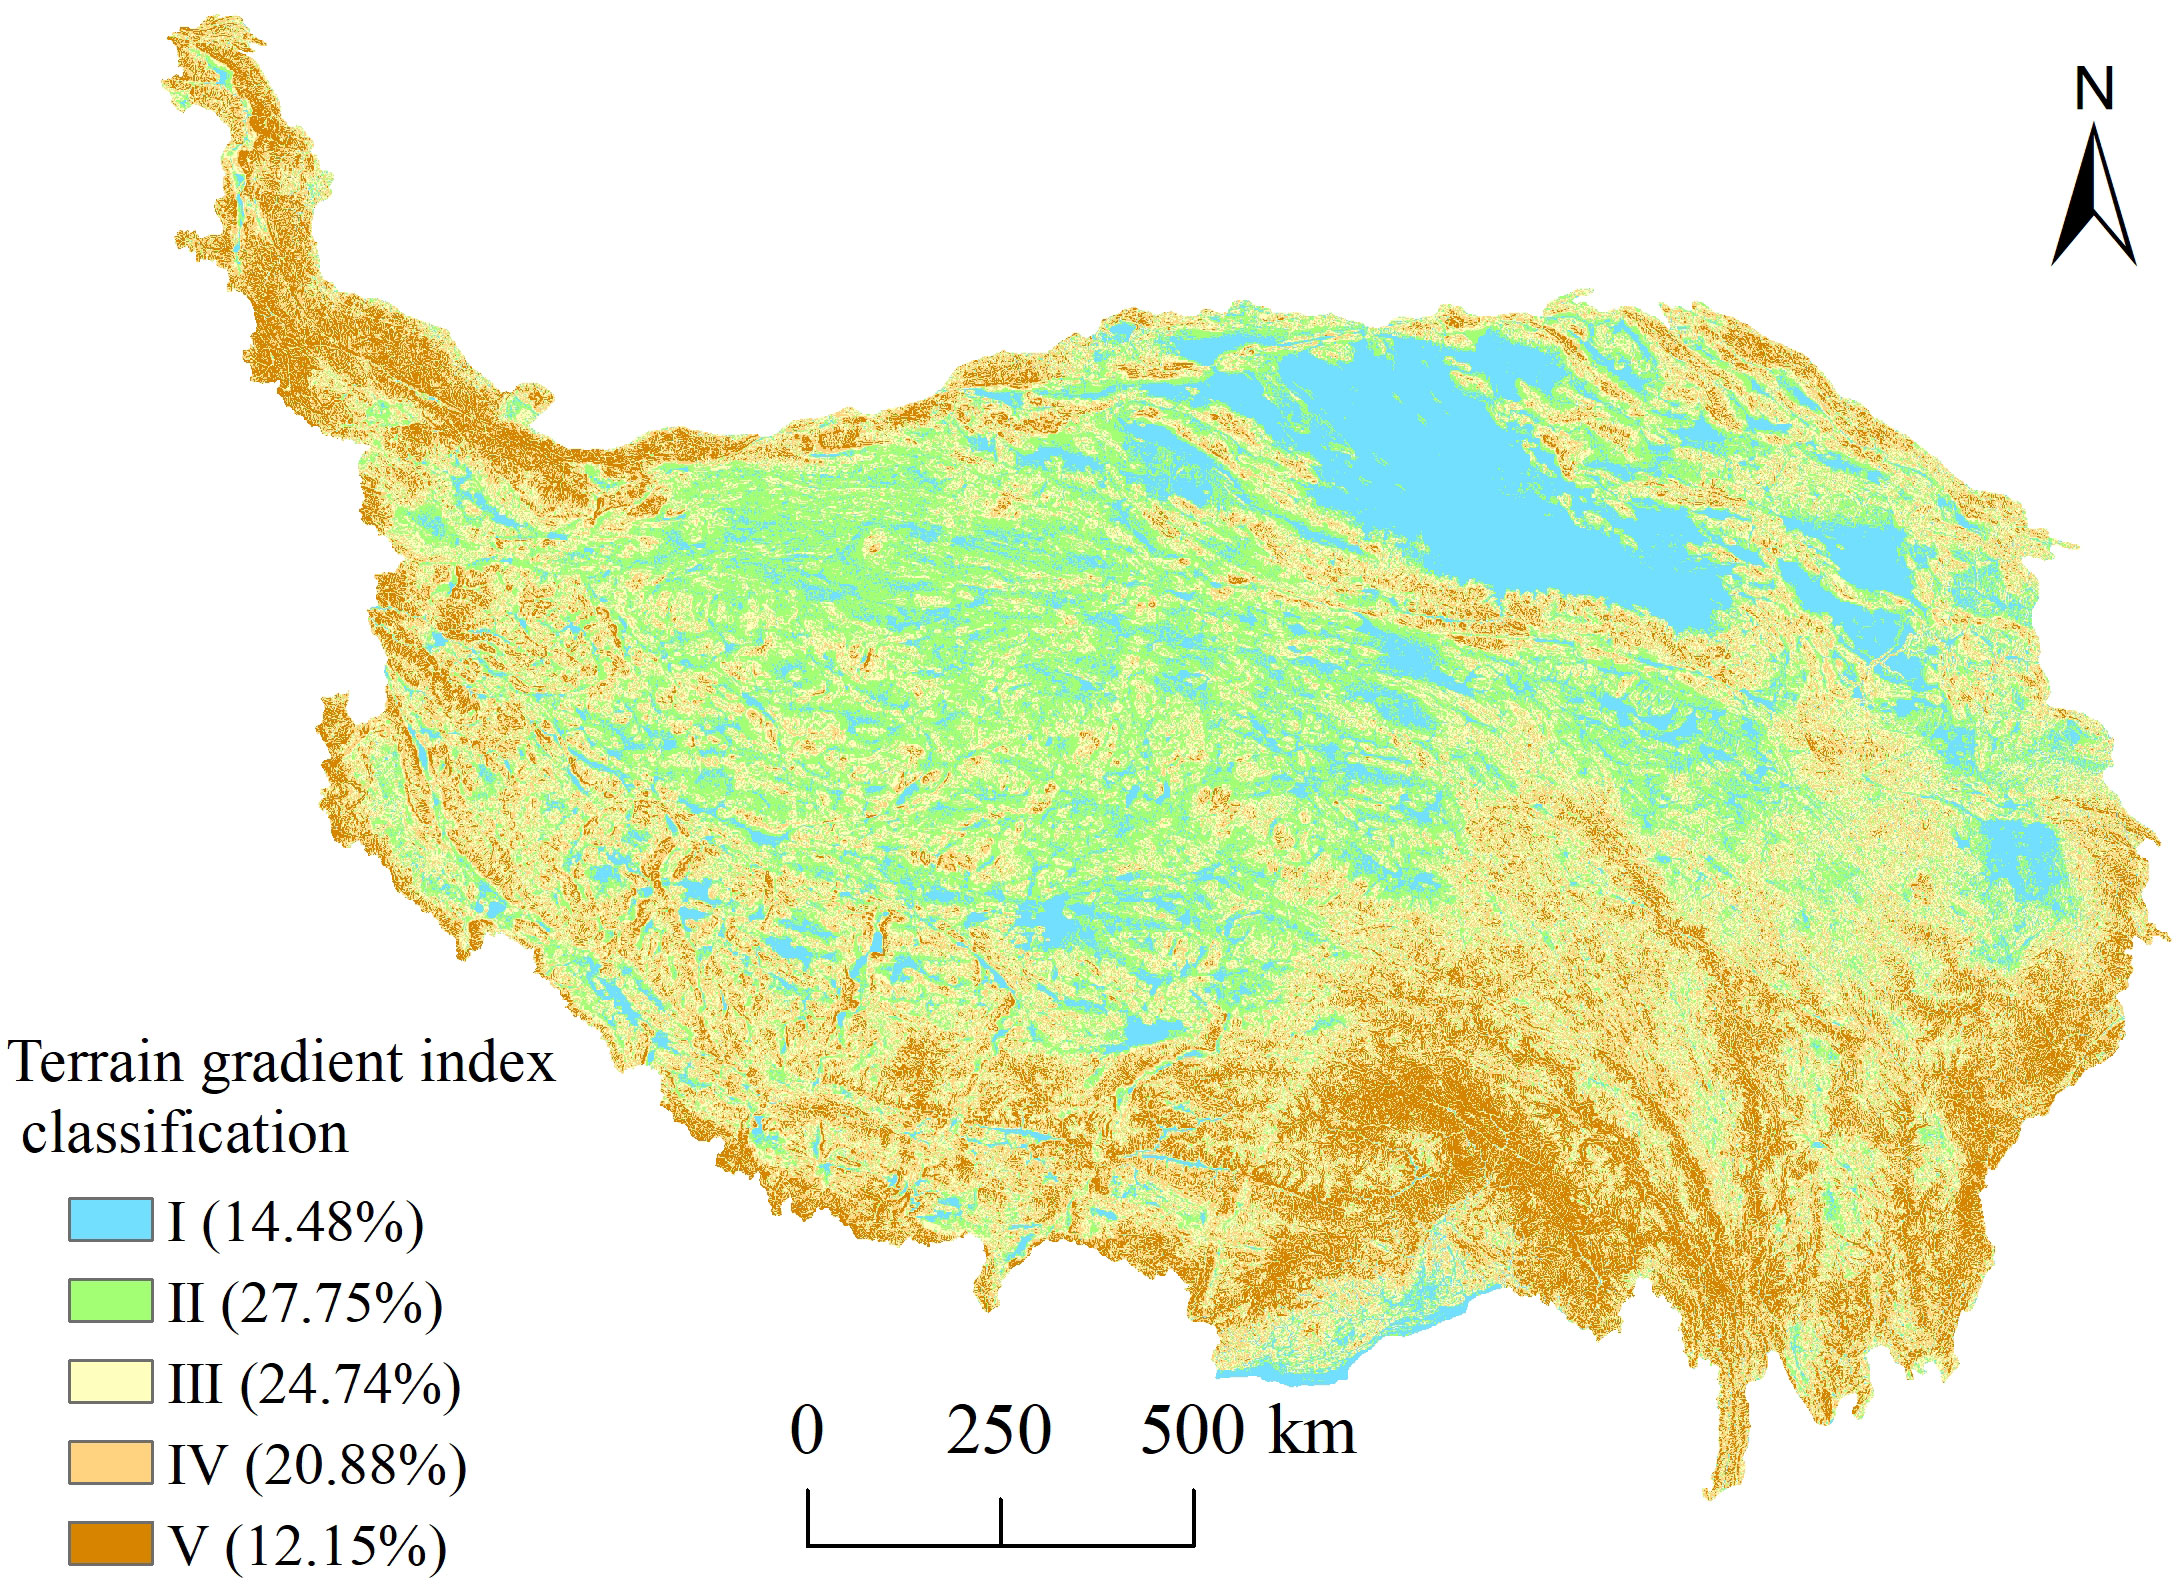
Figure 3 Spatial distribution of the terrain gradient index in the Qinghai–Tibet Plateau.
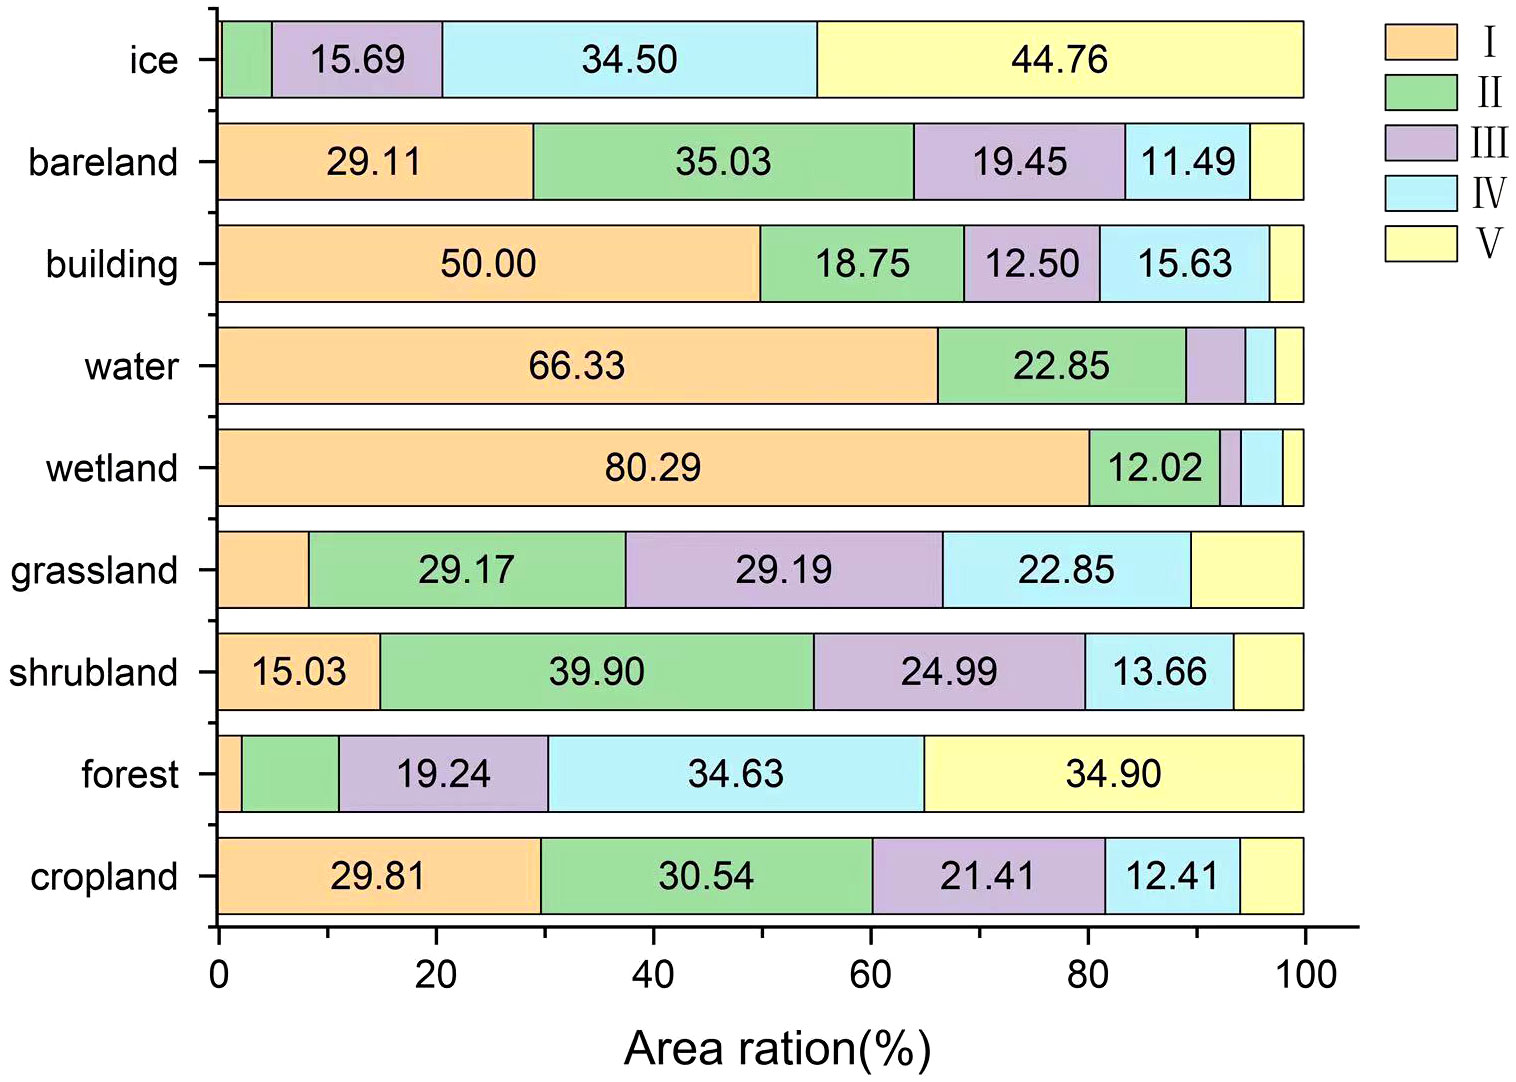
Figure 4 Area proportion of different landscapes at different terrain gradients.
The mean value of habitat quality of different terrain gradients from 2000 to 2020 was calculated (Table 1). It can be seen that with the increase in terrain gradient, the mean of habitat quality gradually increases, and it was positively correlated with terrain gradient index. Human activities are strong in regions with low terrain gradient index, and human production activities have changed the current situation of land use, thus affecting the habitat quality. As the terrain gradient increased, the increasing range of habitat quality initially diminished but subsequently expanded. The habitat quality of gradient V was 1.91 times higher than that of gradient I, and the average increasing range of gradients I to V was 21.39%, 20.73%, 14%, and 14.3%. Between 2000 and 2020, habitat quality across all terrain gradients demonstrated a positive trend, with increases for gradients I–V amounting to 2.94%, 0.13%, 0.34%, 1.3%, and 3.02%, respectively.
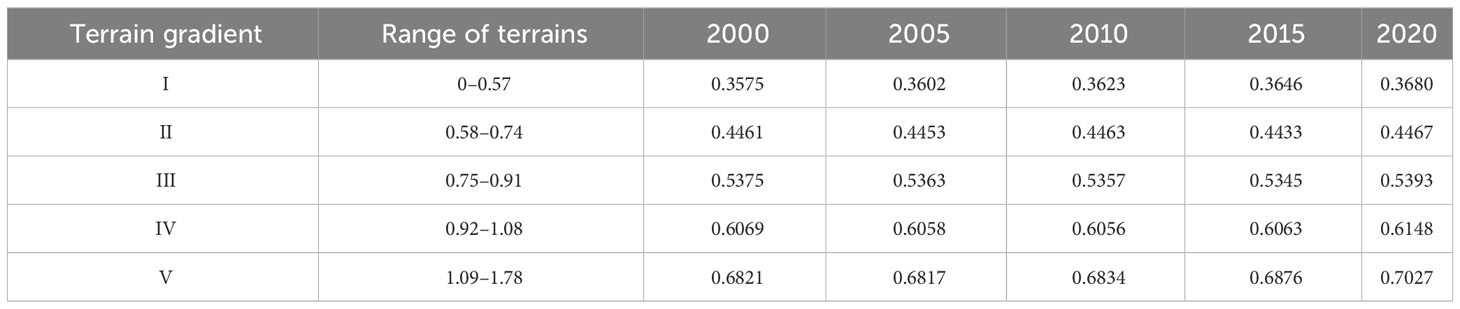
Table 1 Average habitat quality at different terrains.
3.2 Spatiotemporal change in habitat quality
Based on the landscape change matrix (Appendix S1), we calculated the habitat quality in the period of 20 years. The results indicate that the spatial pattern of habitat quality in the Qinghai–Tibet Plateau demonstrates marked differentiation (Figure 5). Regarding temporal variation, the average habitat quality of every 5 years in the study area from 2000 to 2020 was 0.5183, 0.5179, 0.5185, 0.5183, and 0.5246, respectively, showing a slight fluctuation trend (Table 2). Spatially, the habitat quality of the southeastern and northwestern regions in the plateau is quite different. The southeastern part has sufficient precipitation and temperature, and the vegetation was well developed, so the habitat quality was high. There are large areas of bare land in the northwest part, the environment was relatively harsh, and the habitat quality was low. Between 2000 and 2020, habitat quality across 66.52% of the plateau’s area was relatively stable, predominantly in the central and eastern parts; 16.7% of the area decreased slightly, mainly in the central part of the plateau (southern Qinghai Province); 13.26% of the region increased slightly; 2.18% of the area increased significantly (especially in south Tibet); 1.15% of the area was significantly decreased.
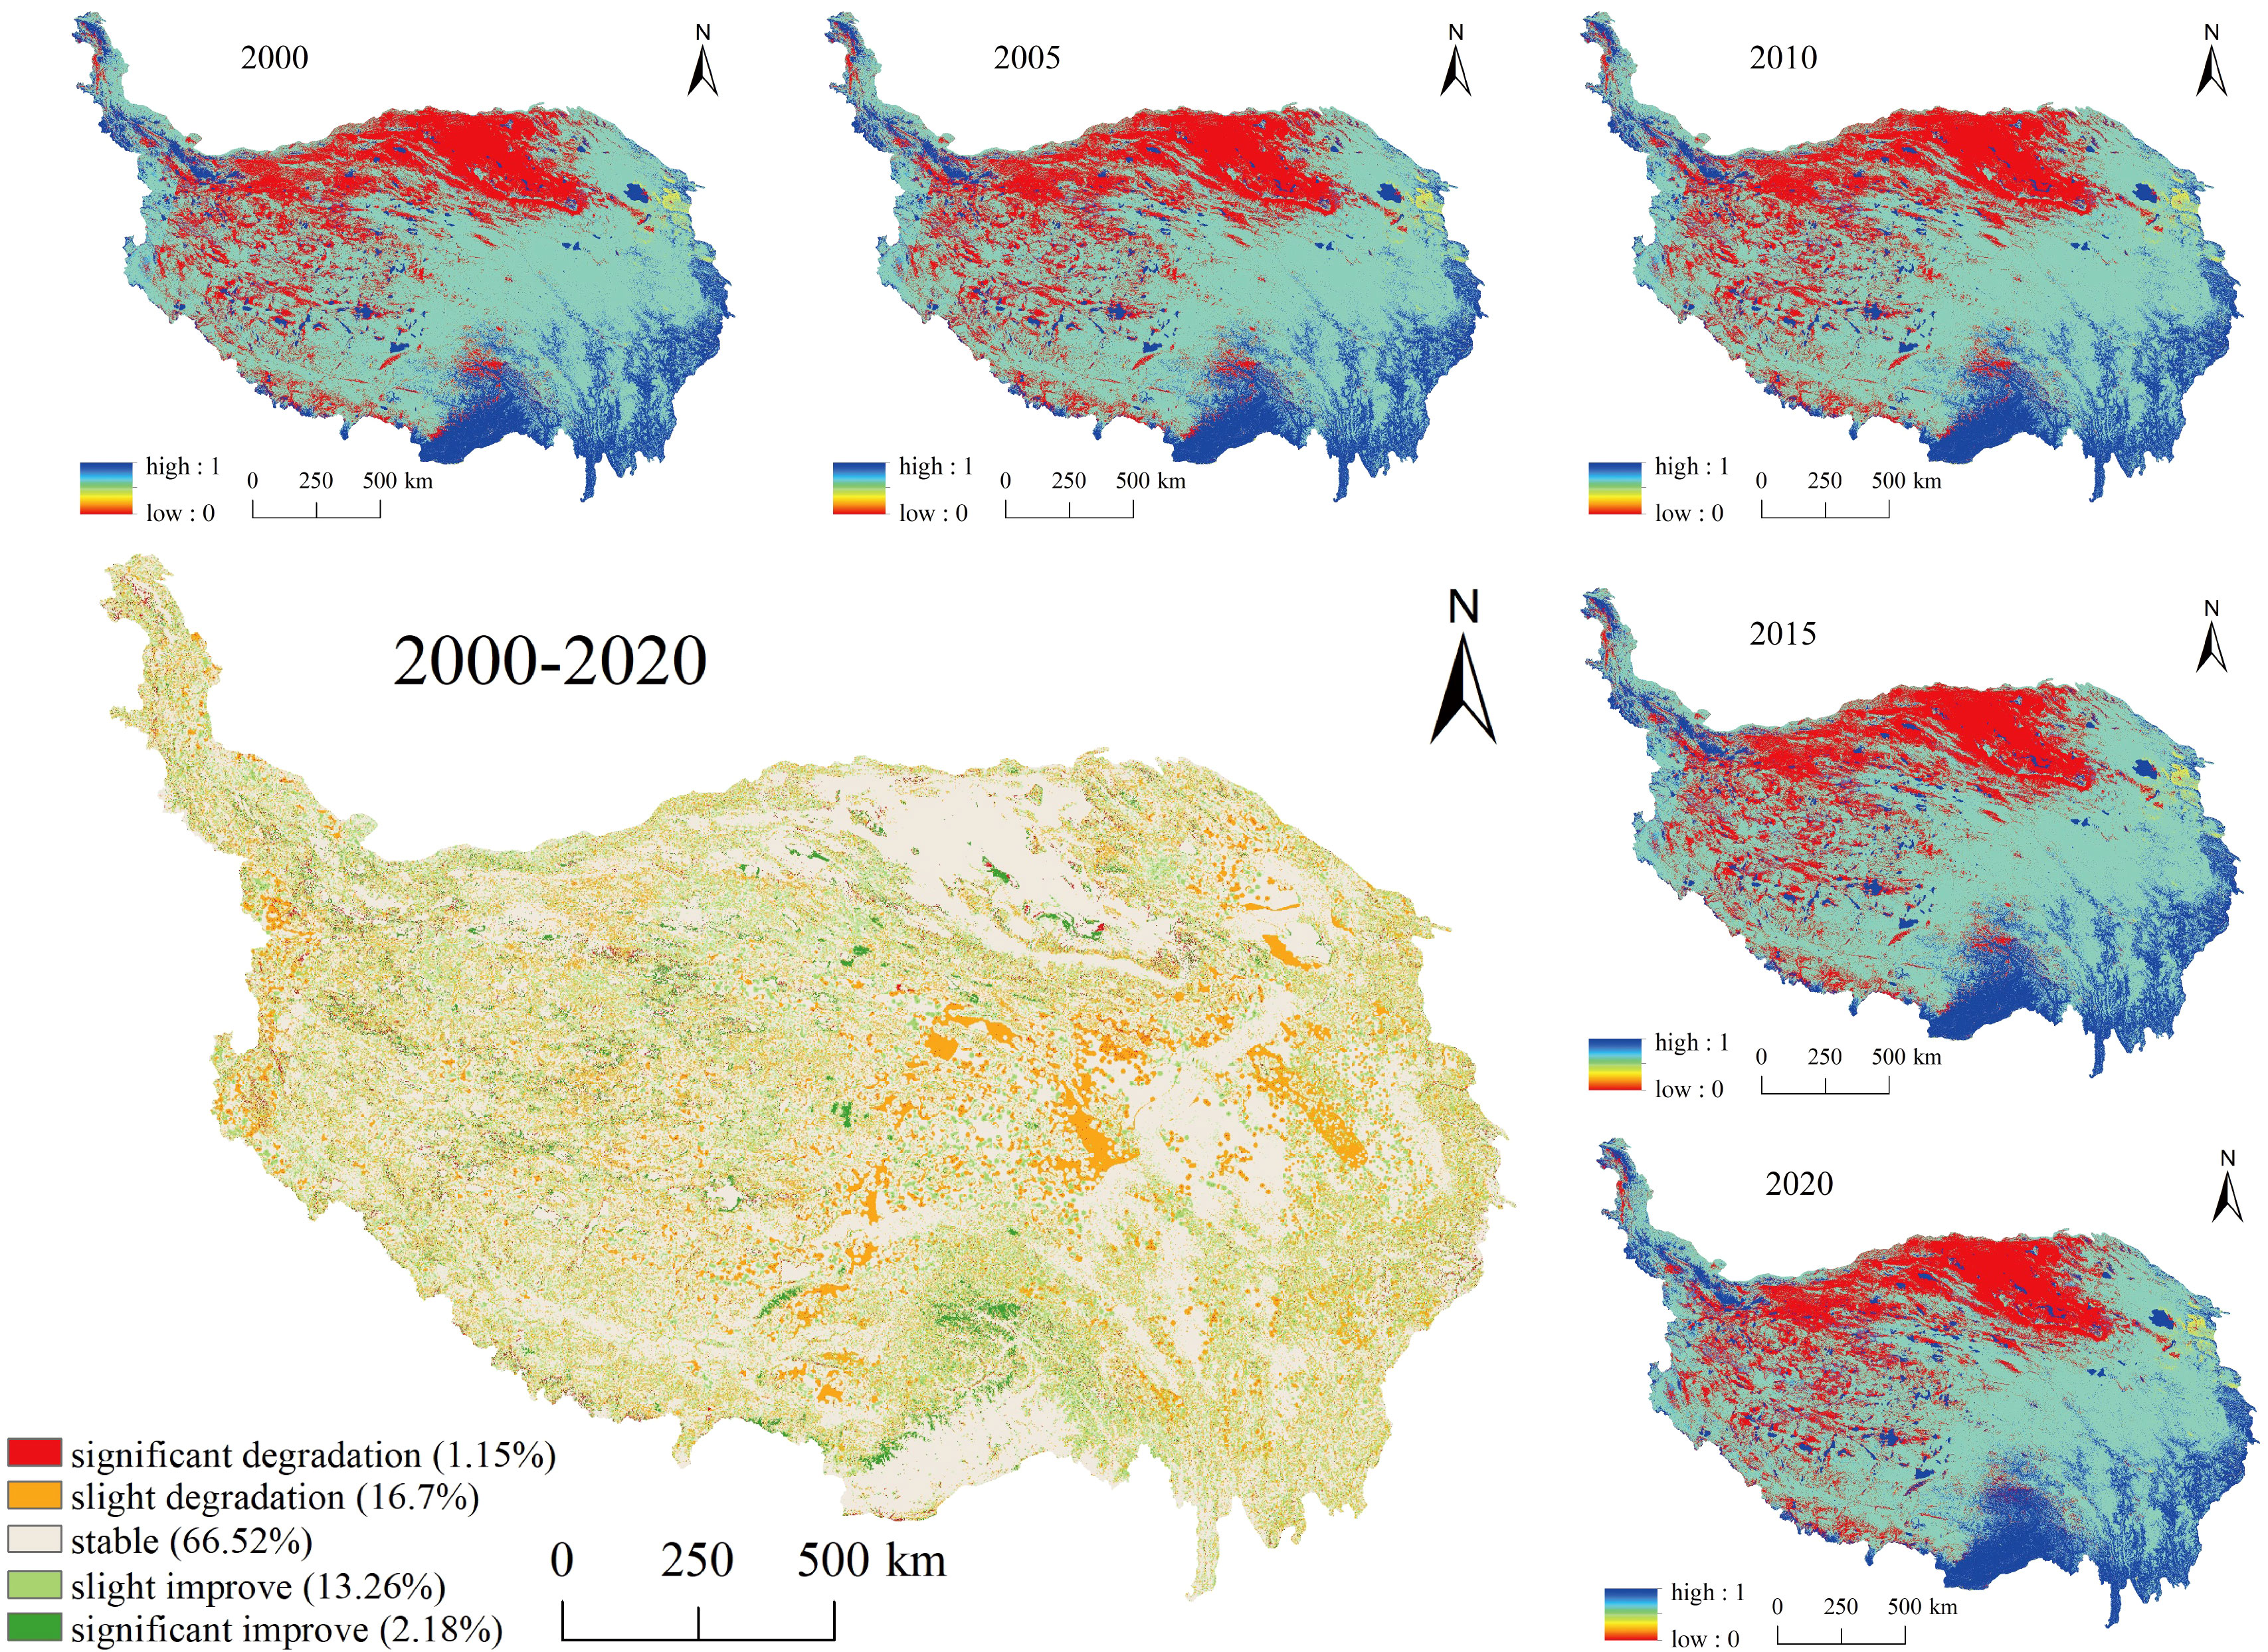
Figure 5 Spatial distribution and change in habitat quality in the study area. The increasing and decreasing regions are intertwined. Increasing regions clustered in the southern mountainous areas and slightly decreasing regions clustered in the central region.
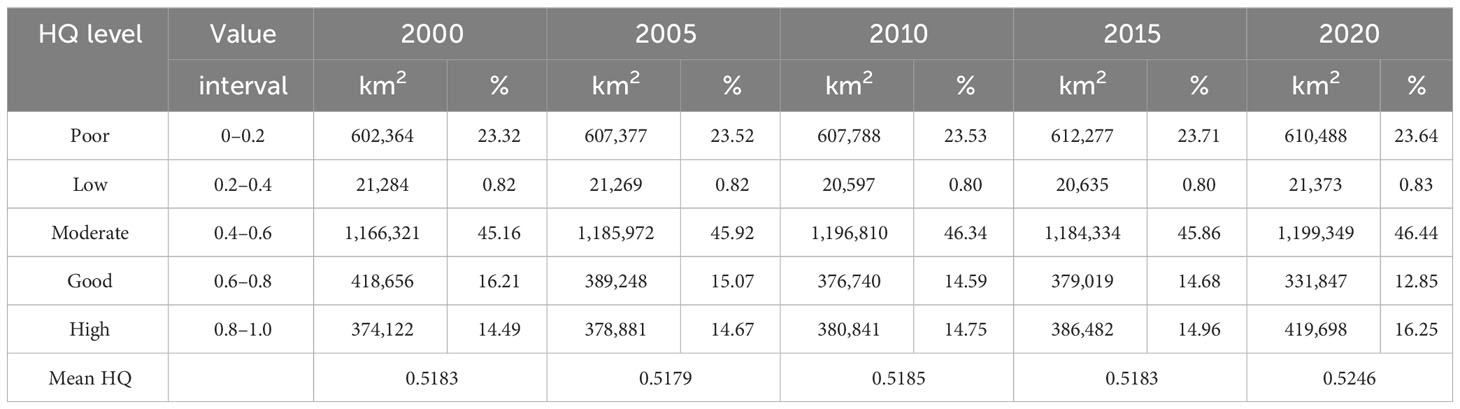
Table 2 Area and ratio of the habitat quality (HQ) level in the study period.
Habitat quality was categorized into five levels based on classification criteria from existing literature (Zhang et al., 2020; Yohannes et al., 2021; Dong et al., 2022; Yue et al., 2022): poor (0–0.2), low (0.2–0.4), moderate (0.4–0.6), good (0.6–0.8), and high (0.8–1) (Table 2). On the whole, the habitat quality of the Qinghai–Tibet Plateau was mainly of moderate quality, accounting for 46% of the total area. In addition, the extent of poor habitat areas in the plateau was relatively large, and the proportion of low habitat quality areas was the smallest. Regarding time, the proportion of high habitat area increased continuously, from 14.49% in 2000 to 16.25% in 2020. The proportion of good habitats decreased sharply, from 16.21% in 2000 to 12.85% in 2020. Areas with moderate habitat quality exhibited an upward trend in their proportion. The prevalence of areas with poor and low habitat quality remained comparatively unchanged. From 2000 to 2005, the area of good habitat quality declined by 29,408 km2, the extent of low-quality habitats remained largely stable, and the coverage of habitats of other quality levels exhibited a growth trend, among which the expansion of moderate-quality habitats was the most pronounced, increasing by 19,651 km2. During the period from 2005 to 2010, the area of moderate and good habitats changed significantly, with an increase of 10,838 km2 in the moderate habitat and a decrease of 12,508 km2 in the good habitat. From 2010 to 2015, areas of moderate habitat quality were a unique category to exhibit a decreasing trend across the four periods, with a reduction of 12,476 km2. From 2015 to 2020, the area of good habitat level changed most obviously, decreasing by 47,172 km2, while the areas of high and moderate habitat were upgraded significantly, increasing by 33,216 km2 and 15,015 km2, respectively.
The habitat quality in different levels of terrain gradient index can be extracted. The mean centers of the habitat quality in levels of every category for terrain gradient index in 20 years are shown in Figure 6. Although there are different terrain levels in different places, the centroid of each level remained concentrated at the center of the study area. The region in level I leans towards the northeast, while the region in level V leans towards the southwest. As the figure shows, with the improvement of terrain gradient index, the gravity of different habitat quality tends towards the south more.
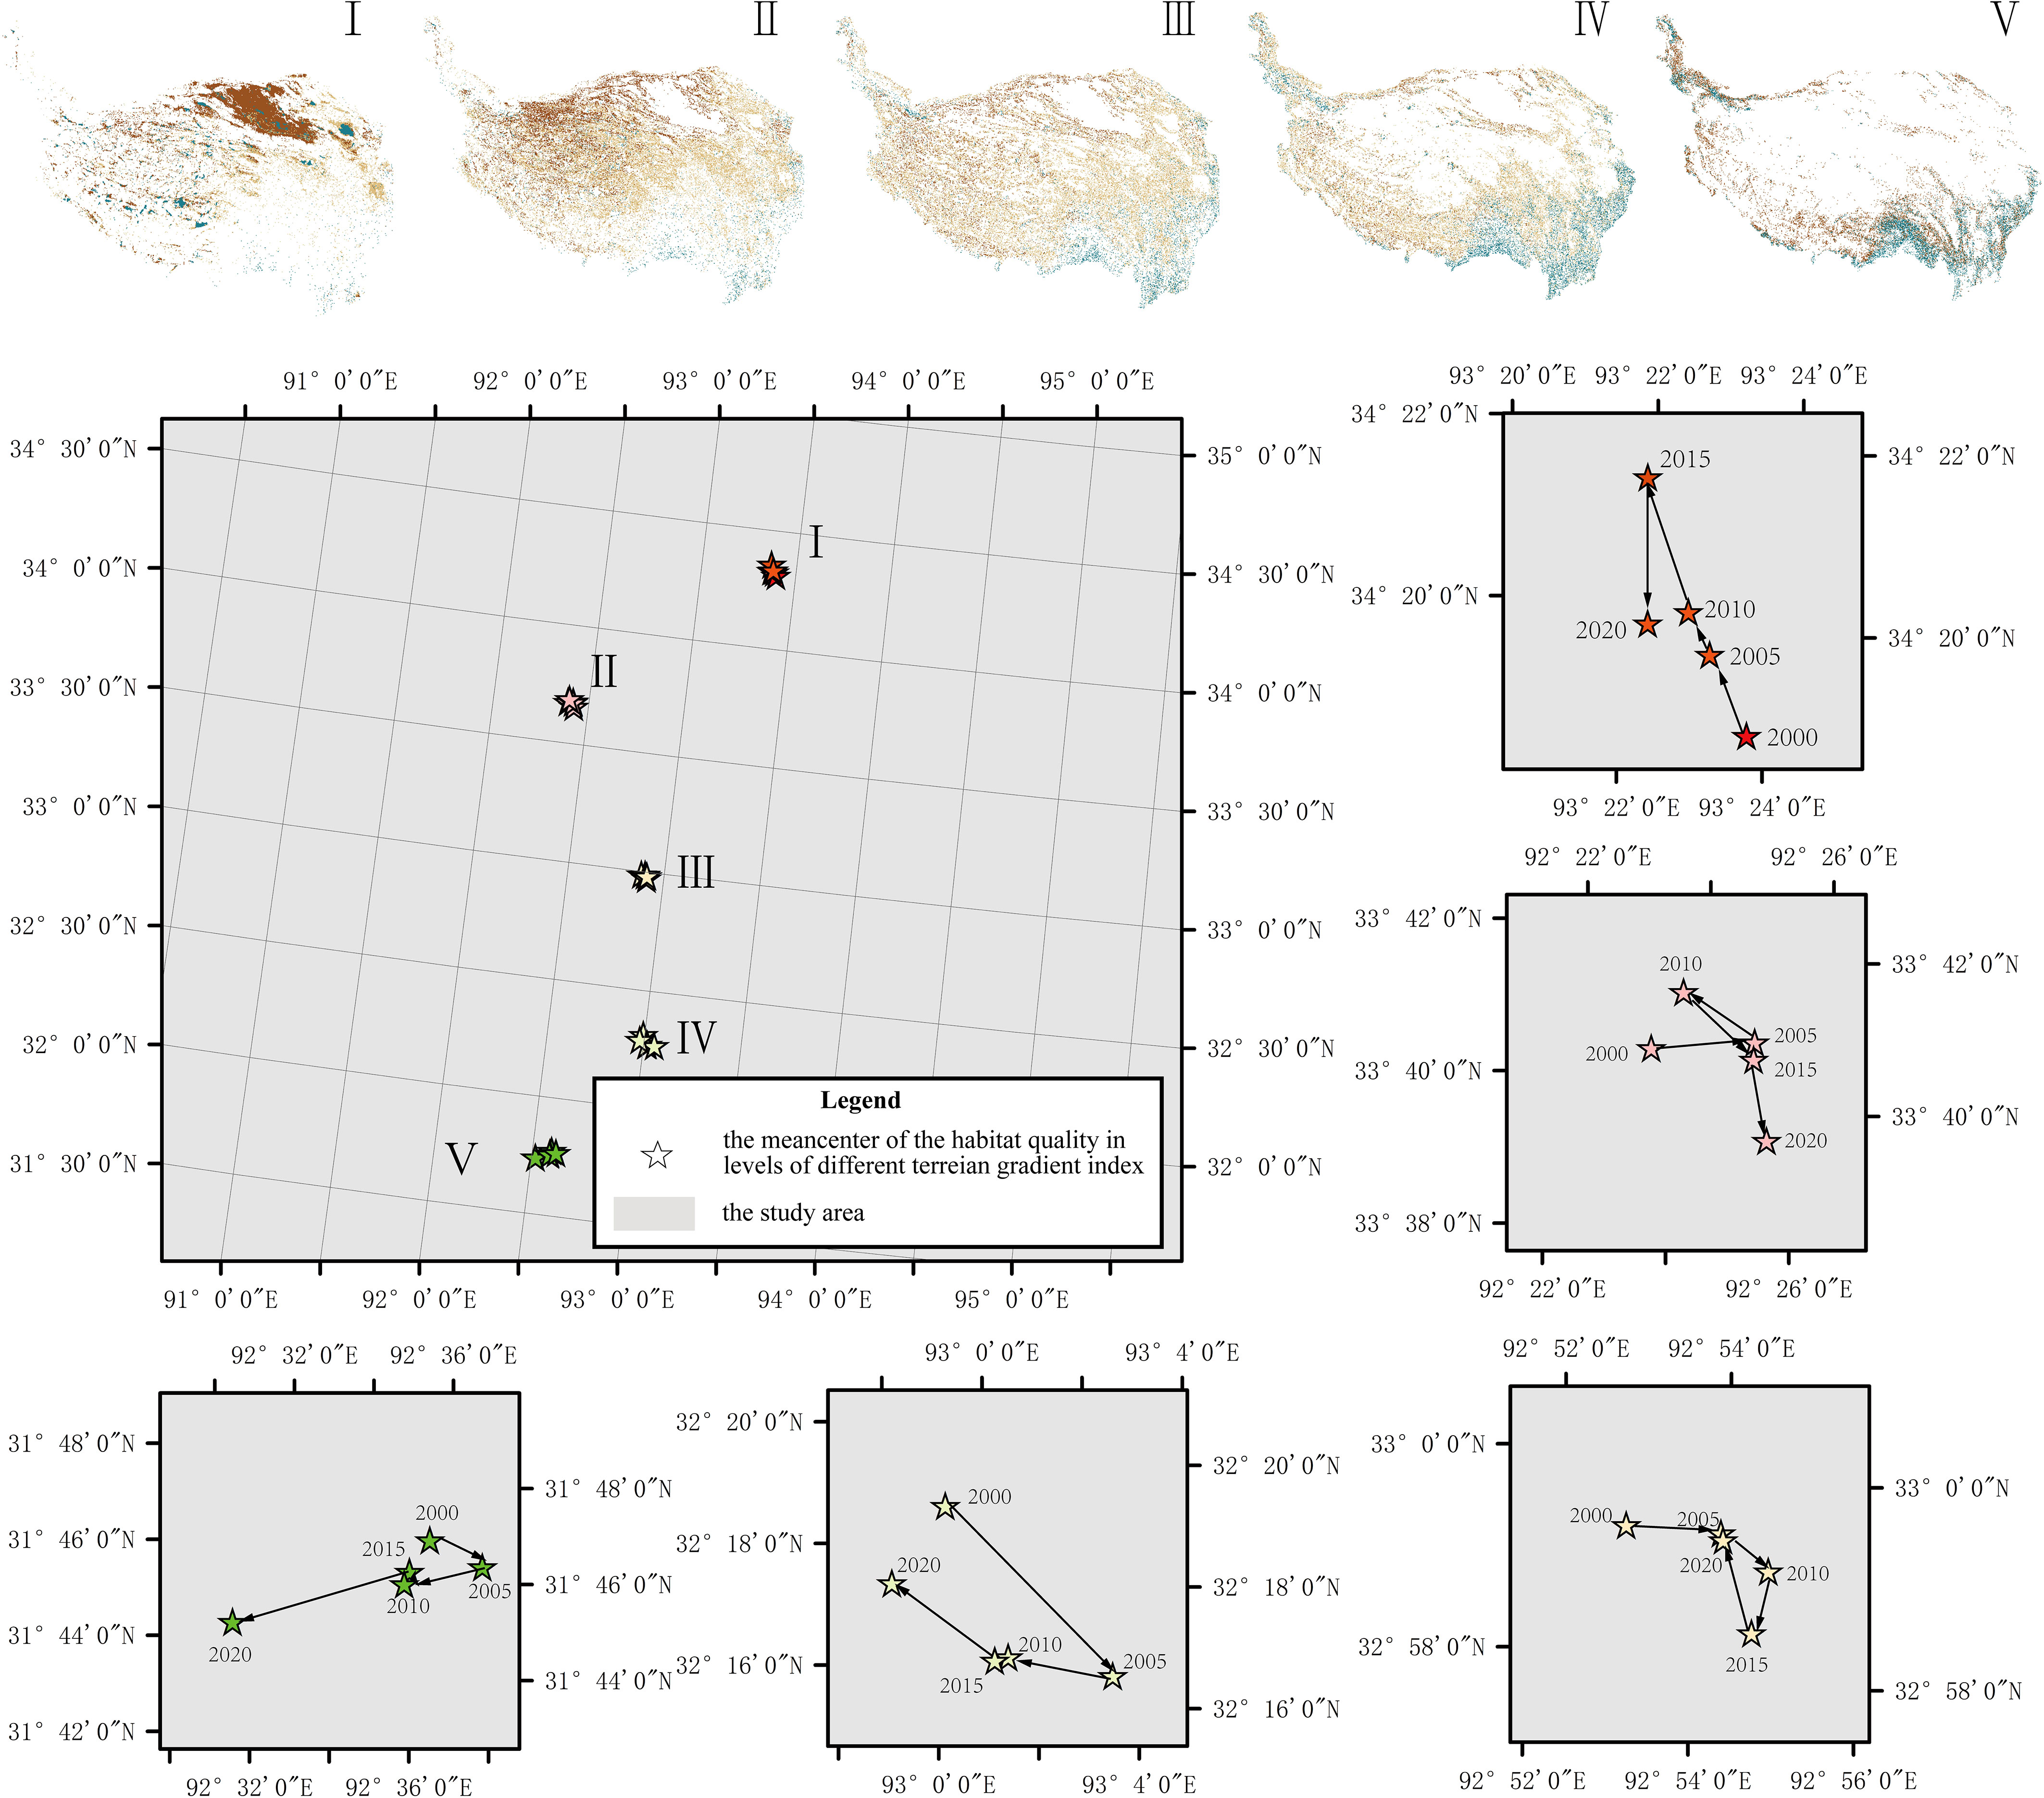
Figure 6 The change in the mean center of habitat quality across various terrain indices. Habitat quality on the top was demonstrated in the year 2020 across different levels of the terrain gravity index. The graphs below display that the mean center went southward with the upgrade of the terrain gradient index. For each level, the mean center changed with the time, and the grade V changed the most.
The gravity of habitat quality for different levels of terrain gradients varies from their changing tendency. As for the area of level I, Figure 6 witnesses that the mean center was constantly going towards the north until 2015, and then came back to the south in 2020. In total, the center in the area of level I tends to the west north in the past 20 years. However, the mean center in the area of levels II–V went toward the east from 2000 to 2005 and followed a different route. For level II, the mean center drifted recklessly and shifting southward in 2020. For levels III and IV, the center went back to the area around the previous point in 2005 and 2000, respectively. The maximum displacement acts on level V, the center of gravity has shifted towards the southwest since 2005, which processes the most maximum displacement variation in every level.
3.3 Spatial pattern evolution of habitat quality
This study employed GMI and LMI indices to analyze both global and local spatial autocorrelation in habitat quality data. GMI was employed to test the total distribution of habitat quality. The global Moran’s I index for habitat quality in 2000, 2005, 2010, 2015, and 2020 were 0.8776, 0.8762, 0.8749, 0.8746, and 0.8768, respectively, with all p-values of 0. The analysis revealed that there existed significant spatial autocorrelation in habitat quality across the study area.
LMI was utilized to explore habitat quality’s local cluster characteristics. The spatial distribution of habitat quality showed the characteristics of polar aggregation with similar values (Figure 7), that is, regions with higher habitat quality agglomerate (H–H), and regions with lower habitat quality agglomerate (L–L). The spatial aggregation characteristics of habitat quality remained consistent across the plateau between 2000 and 2020. The areas of high–high (H–H) concentration were predominantly located in Western Sichuan, northern Yunnan, and southern Tibet in the southeastern Qinghai–Tibet Plateau. L–L aggregation areas are distributed in the northwest. H–H agglomeration zones comprised an increasing share of the plateau’s total area, rising from 46.23% to 48.25%, and the proportion of L–L agglomeration areas decreased from 53.63% to 51.65%, indicating that the overall habitat quality of the plateau has been enhanced (Table 3).
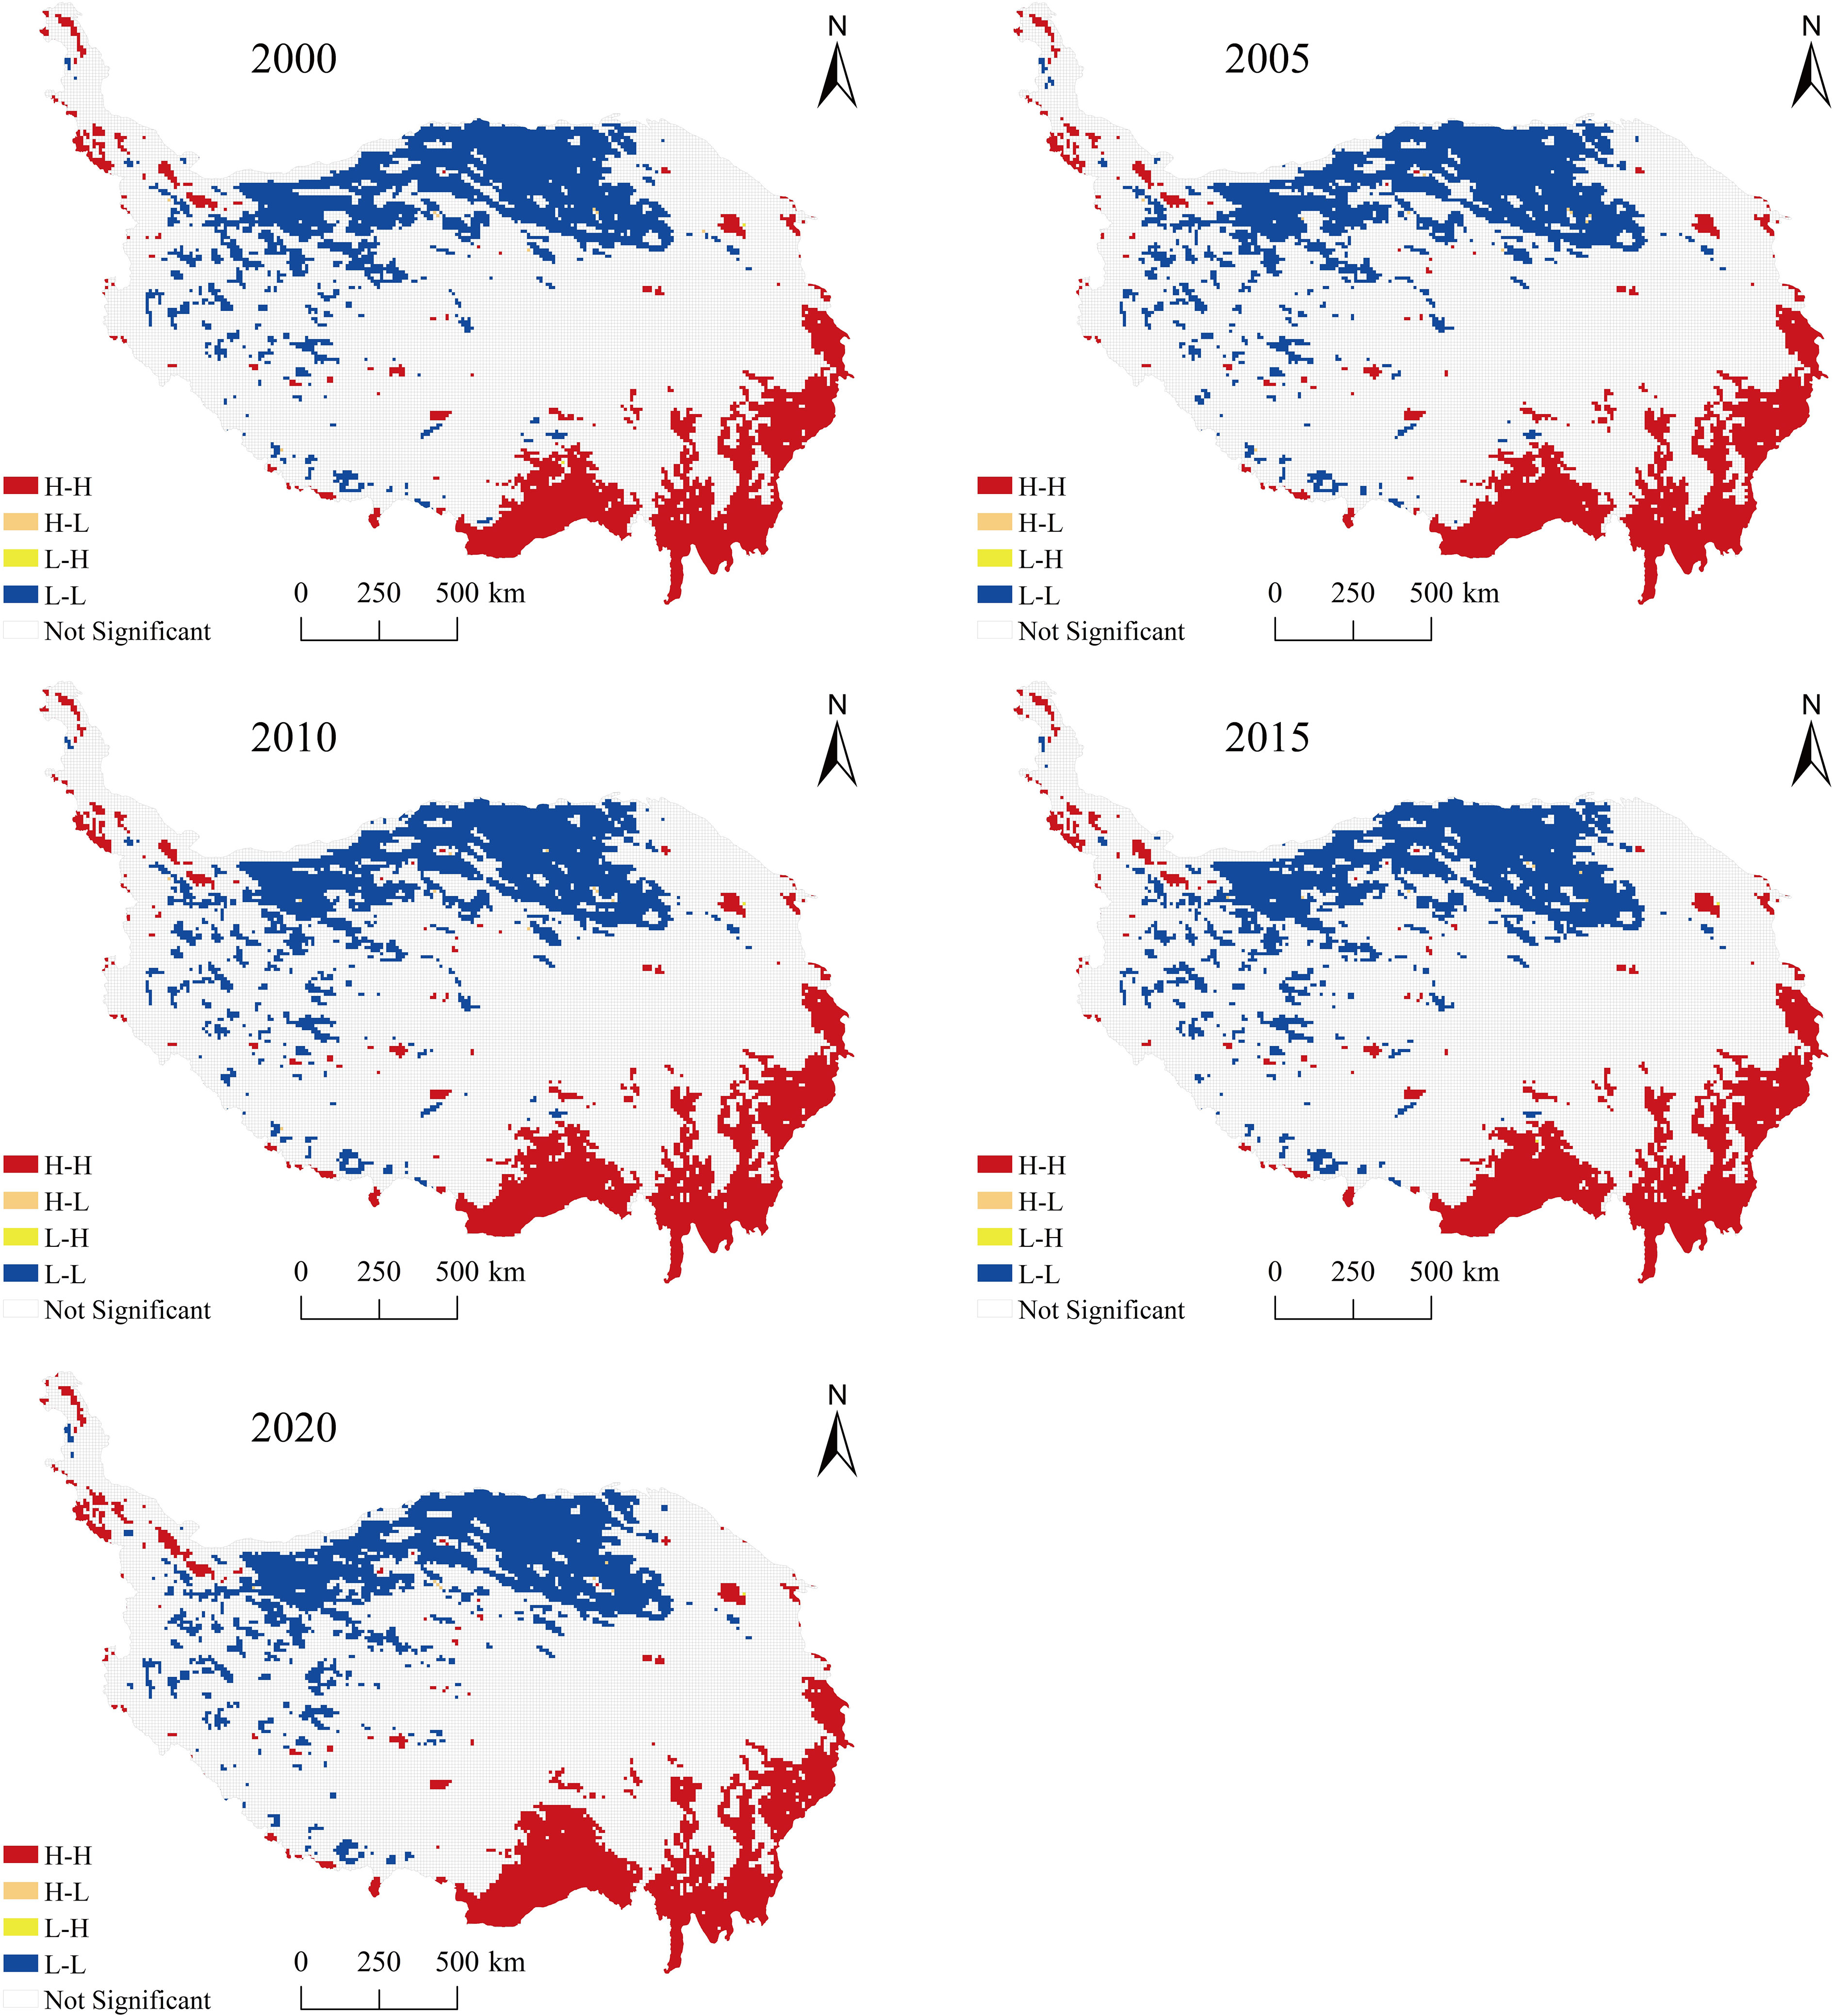
Figure 7 Local indicators of spatial association (LISA) for the habitat quality in the area.
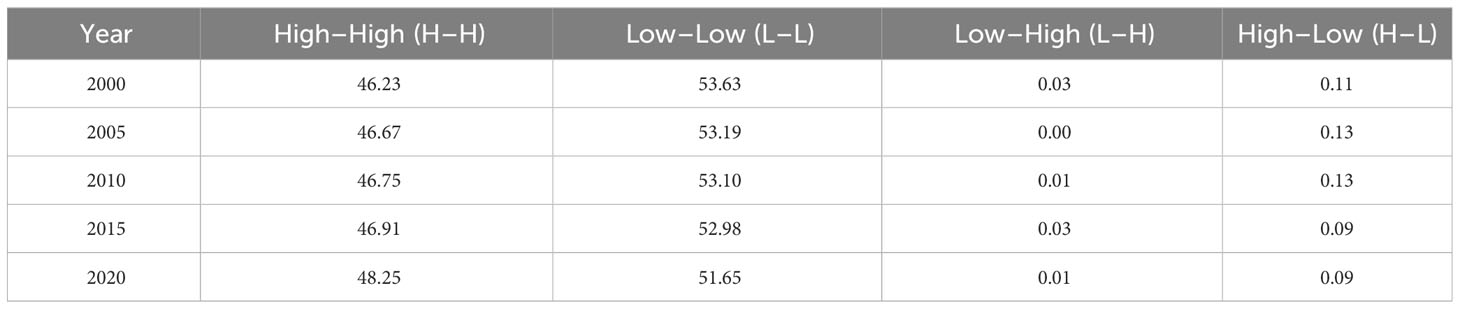
Table 3 The Local Moran’s I clustering statistics for assessing habitat quality (%).
3.4 Factors impacting spatiotemporal change in habitat quality (Geo-detector)
Considering the plateau’s distinct natural conditions and socio-economic attributes, researchers selected 11 driving factors as independent variables. These factors span three categories: the natural environment, socio-economic conditions, and landscape patterns. The habitat quality index was used as the dependent variable. This study involved analyzing the contribution rates of these factors and detecting their interactions. The Geo-detector model served as the analytical tool for this purpose. Consequently, this revealed the main driving factors and their interaction mechanisms responsible for the plateau’s spatial differentiation.
Eleven driving factors are soil type (Soil), population density (Pop), GDP, annual mean precipitation (Pre), annual mean temperature (Tem), patch density (PD), Shannon’s Diversity Index (SHDI), NDVI, slope, DEM, and aggregation index (AI).
The contribution rate of each driving factor on habitat quality in the Qinghai–Tibet Plateau has strong consistency in 2000, 2005, 2010, 2015, and 2020 (Figure 8). Therefore, 2020 is taken as an example for analysis. In the Qinghai–Tibet Plateau, the contribution rates of driving factors to the spatial differentiation of habitat quality in 2020 were as follows, according to the Q statistics: NDVI (0.2759) >Pre (0.2268) >Soil (0.1800) >Slope (0.1389) >Tem (0.0622) >DEM (0.0262). >GDP (0.0329) >POP (0.0188) >SHDI (0.0092) >PD (0.0074) >AI (0.0054). Natural environment factors were the dominant factors affecting the habitat in the Qinghai–Tibet Plateau. Among them, NDVI contributed the most to the quality of the Qinghai–Tibet Plateau, with a q-value of 0.2759. Subsequently, the q-values for annual average precipitation, soil type, and slope were 0.2268, 0.1800, and 0.1389, respectively. Natural environment factors, temperature and DEM, contributed relatively little to the spatial differentiation of the Tibetan Plateau, with q-values of 0.0622 and 0.0262. In the future, it is imperative to enhance the protection of the natural environment of the Qinghai–Tibet Plateau, implement ecological restoration, and protect biodiversity, which will help improve the habitat quality of the Qinghai–Tibet Plateau. The impact of socioeconomic factors on the study was minimal, as indicated by the low q-values of GDP (0.0329) and population density (0.0188). The landscape pattern factor has the lowest contribution rate to the spatial differentiation of the Qinghai–Tibet Plateau (Table 4).
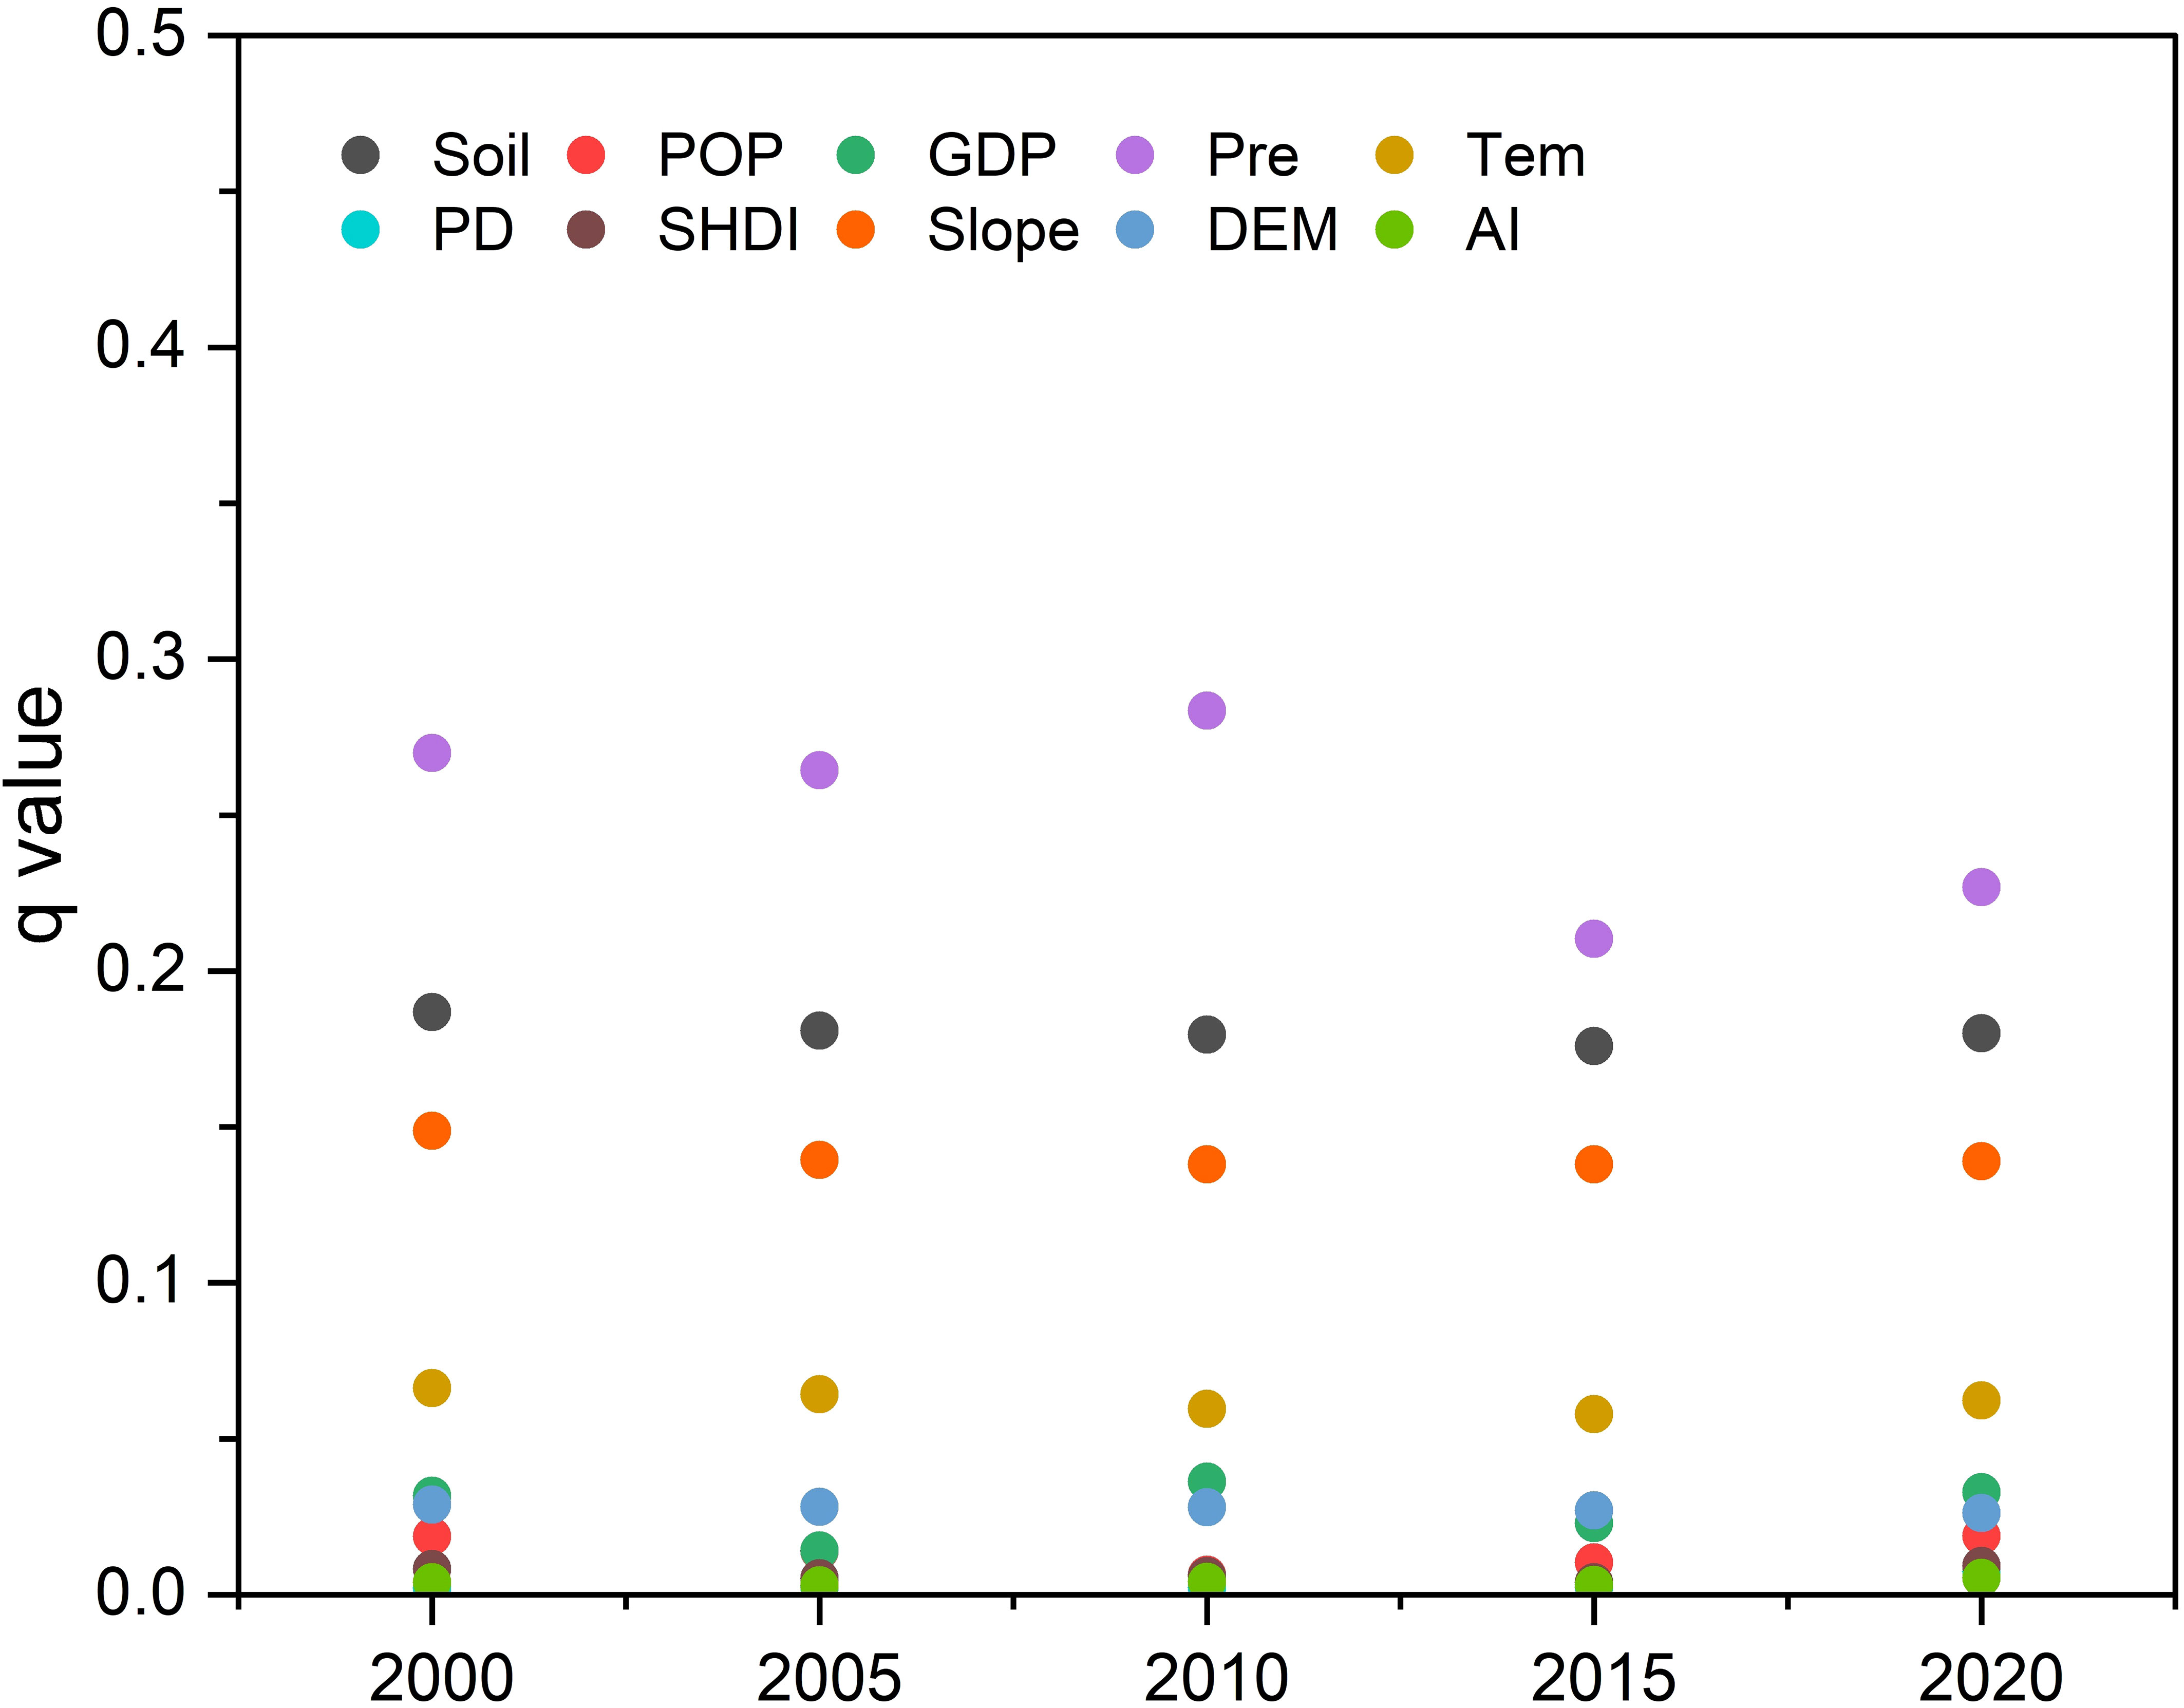
Figure 8 Relative contributions of driving factors to the spatial variability in habitat quality across the plateau (2000–2020).
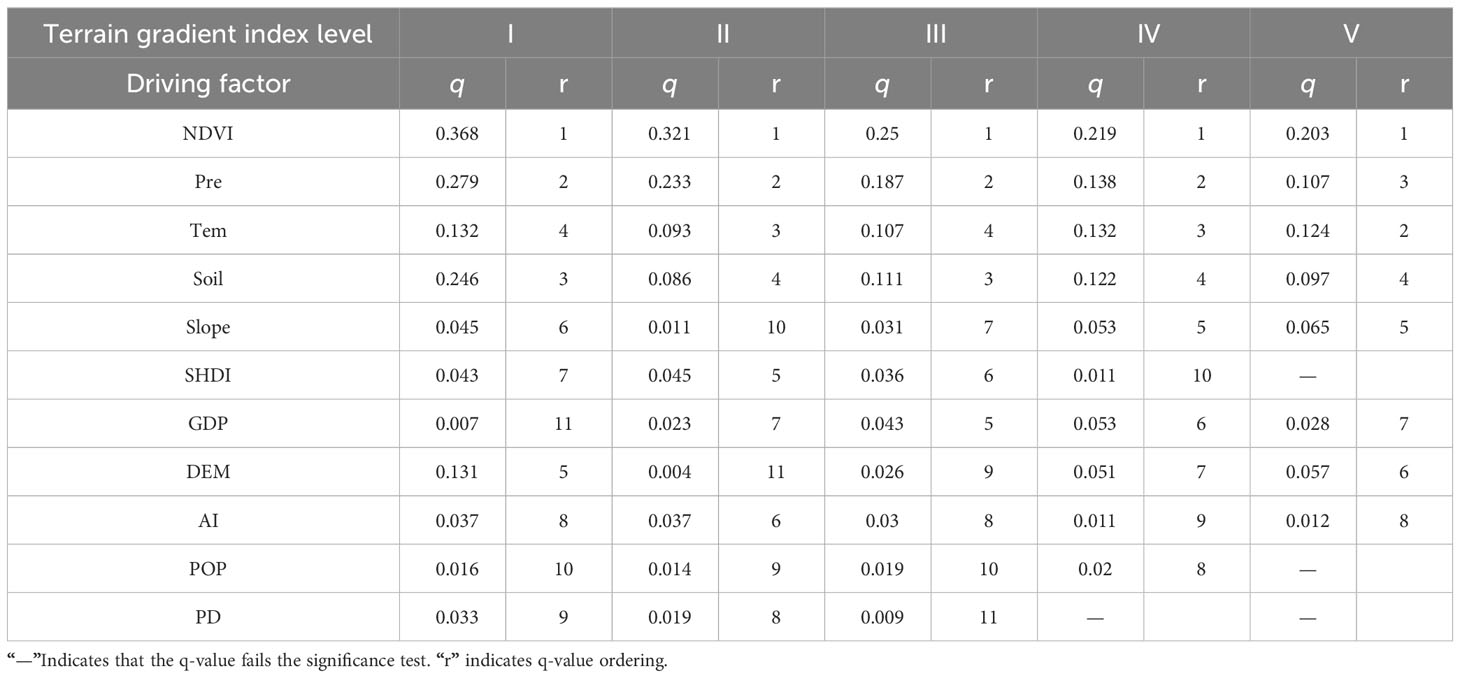
Table 4 Detection results of habitat quality impact factors at different terrain positions.
Under different terrain gradients, the influence of each driving factor on habitat quality spatial differentiation varied significantly. This research took 2020 as an example to explore, and the research results showed that for the I terrain gradient, the q-value of the driving factor of the spatial pattern was NDVI, Pre, Soil, Tem, and DEM. For the II terrain gradient, the q-value was NDVI, Pre, Tem, Soil, and SHDI in order. For the III terrain gradient, the q-value was NDVI, Pre, Soil, Tem, and GDP in order. Across various terrain gradients, NDVI’s influence on habitat quality spatial differentiation was markedly higher than that of other drivers. Furthermore, as the terrain gradient increased, NDVI’s impact on habitat quality spatial differentiation progressively diminished. Additionally, the average annual precipitation was also an important driving factor affecting the spatial differentiation pattern for habitat quality in the Qinghai–Tibet Plateau. Regions with high vegetation coverage and sufficient precipitation are more suitable for species to survive and reproduce, resulting in higher habitat quality (Lu et al., 2022). The contribution rate of soil type to habitat quality under the I terrain gradient was much greater than that of other terrain gradients. The contribution rate of each driver to habitat quality on the IV and V terrain gradients was small, and some driving factors did not pass the significance test. The main land-use types in high terrain gradient areas are Permanent ice and snow, forest, and grassland. The forest and grassland distribution areas have favorable natural conditions and rich biodiversity, and areas with high terrain gradients are less impacted by human activities, resulting in higher habitat quality. Consequently, the majority of the drivers had an insignificant influence on habitat quality spatial differentiation in these areas.
Figure 9 presents the results of interactive detection analyses for drivers influencing the spatial differentiation of habitat quality in plateau regions. These analyses were conducted to determine whether combinations of two factors would amplify or mitigate their individual contributions to habitat quality spatial differentiation. When combined with single-factor detection outcomes, it is evident that the interactive effect of any two factors surpasses the influence of individual factors on habitat quality’s spatial distribution. These differences are not attributable to a single factor but rather to a synergy of multiple driving forces. Notably, the interplay between NDVI ∩ other factors was the most significant contributor to the plateau’s spatial differentiation, followed by the interactions of average annual precipitation with other factors and soil type with other factors. The strongest interaction was observed between NDVI ∩ SHDI, affecting the spatial differentiation of plateau regions, with a q-value of 0.3652. Subsequently, the interactive effects between NDVI ∩ soil, NDVI ∩ AI, and NDVI ∩ PD were also pronounced, with q-values of 0.356, 0.3459, and 0.3421, respectively.
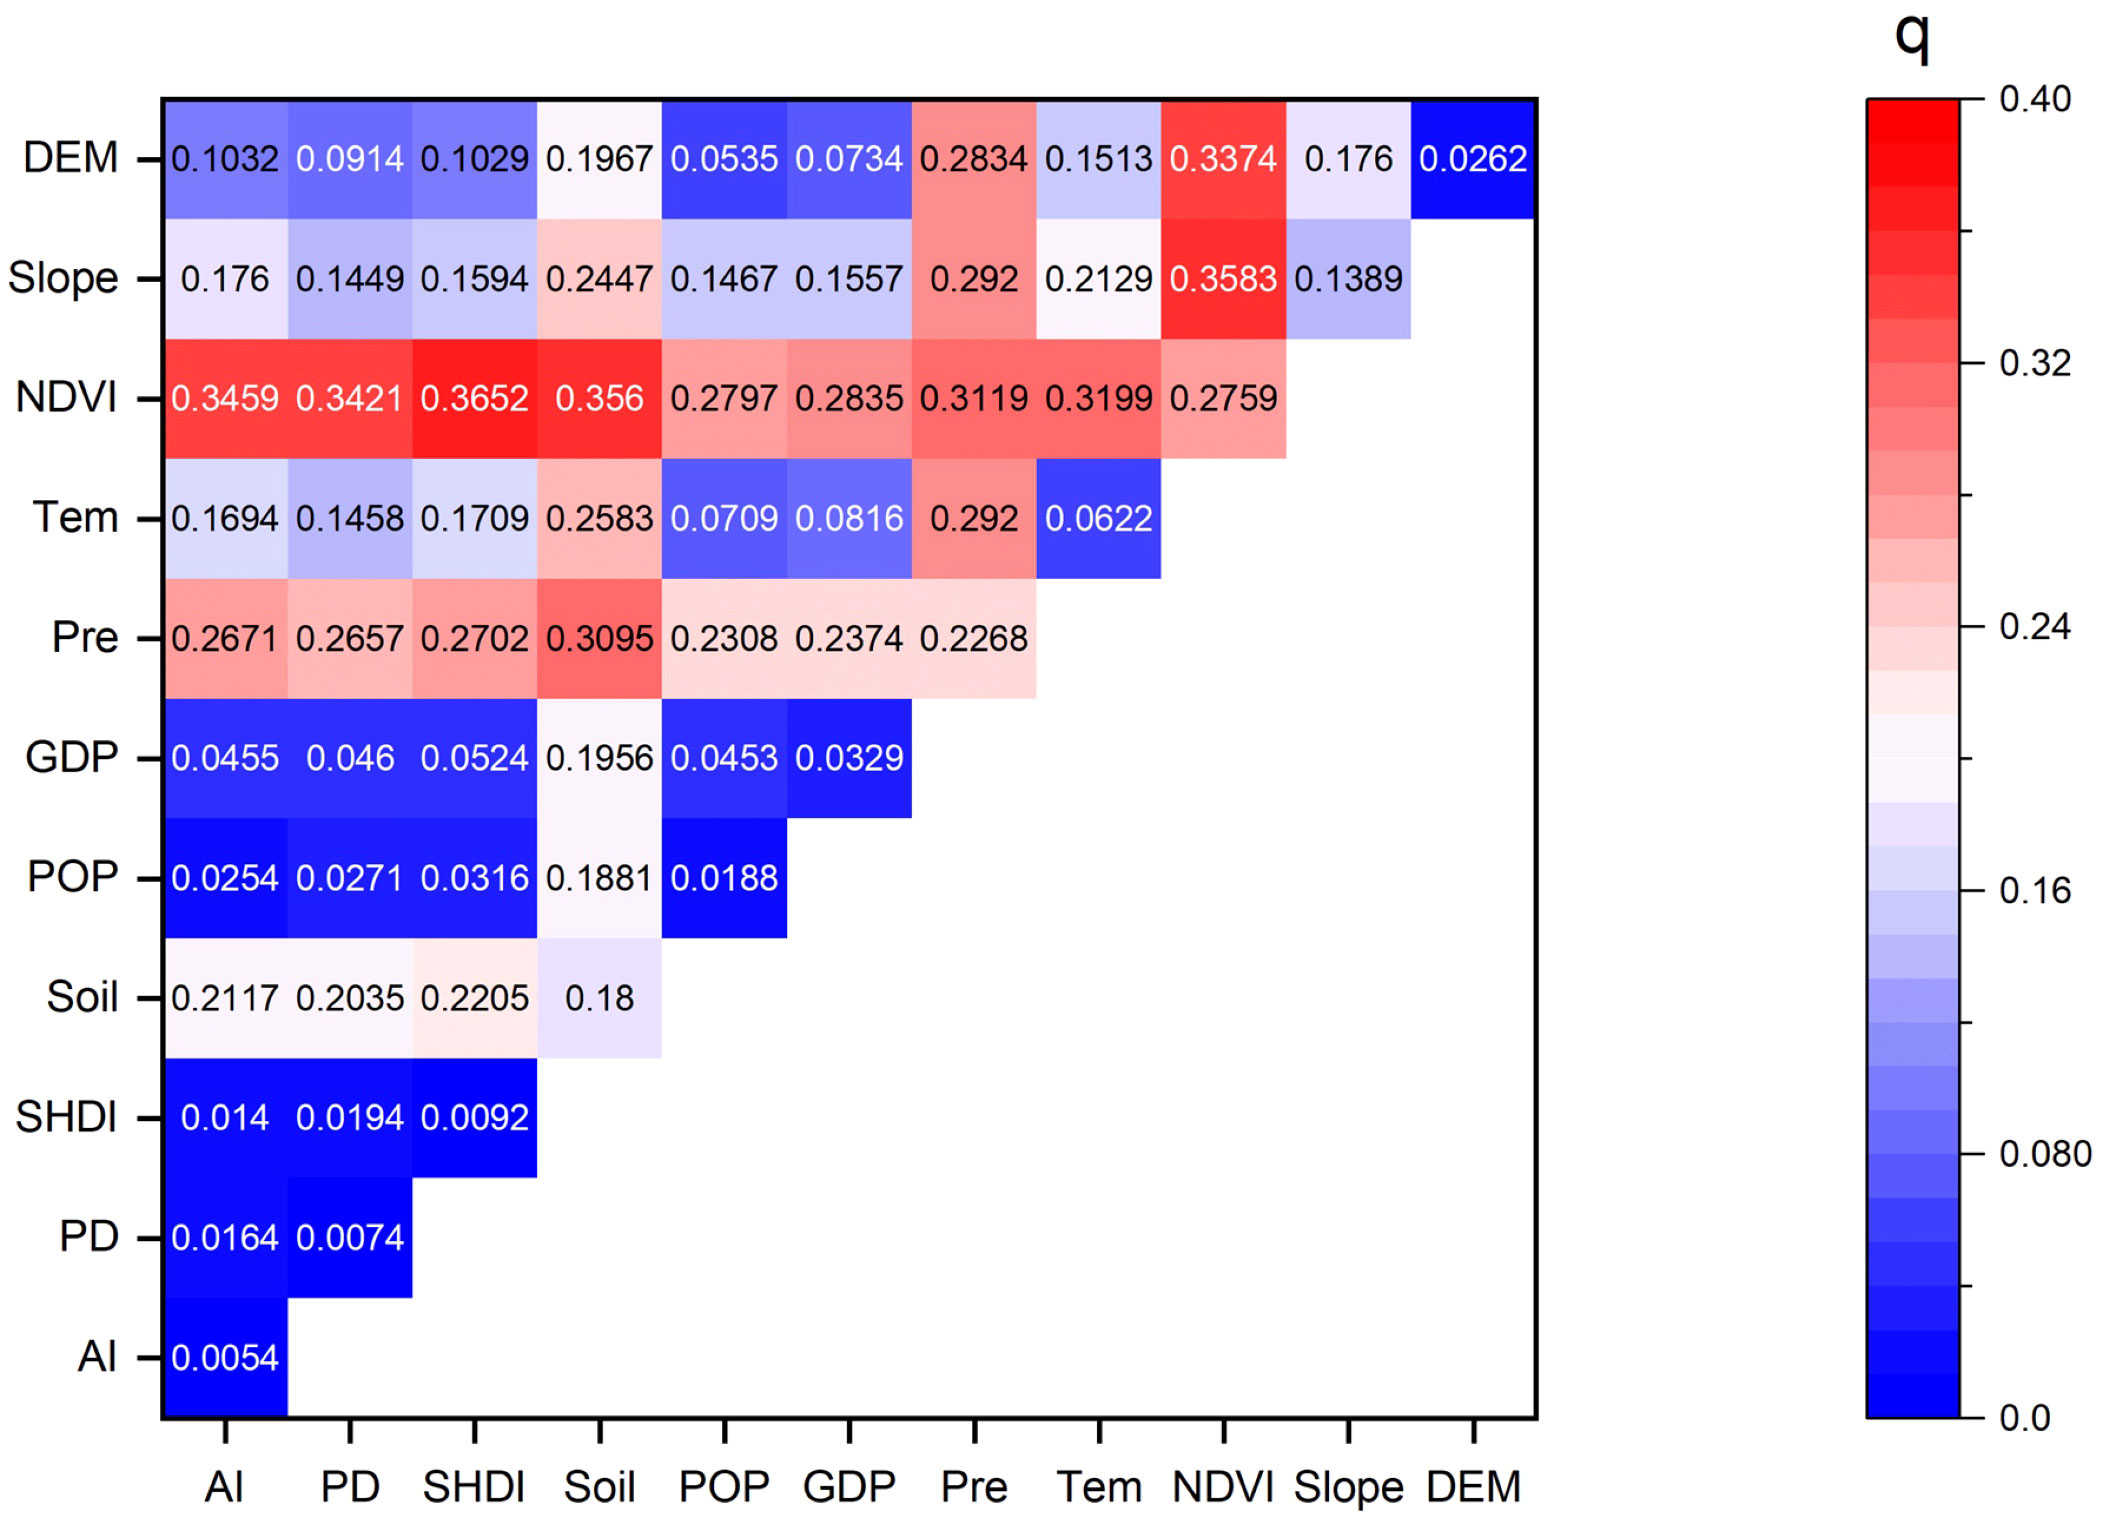
Figure 9 Influence of the interactions between two driving factors on spatial differentiation of habitat quality in the Qinghai–Tibet Plateau.
4 Discussion
4.1 Terrain gradient effect of habitat quality
Habitat quality in the study area exhibits significant spatial heterogeneity. It is characterized by a spatial distribution pattern of “high in the southeast and low in the northwest.” Regions with higher habitat quality are predominantly forest, water body, wetlands, and grassland. Impervious surfaces, bare areas, and cropland tend to be concentrated in areas characterized by moderate to low habitat quality, which is in alignment with the findings of prior studies (Shui et al., 2018; Han et al., 2019).
As reported in numerous studies, the terrain gradient index exhibited a positive correlation with habitat quality (Wang et al., 2023). Corresponding to terrain characters of the low altitude and slope in the northeast and the opposite in the southwest in Qinghai–Tibet plateau, it is observed that habitat quality improves from the northwest to the southeast, which was similar to the previous study in ecosystem service in the Qinghai–Tibet Plateau (Wu et al., 2022). Ecosystem service positively corresponds to the terrain gradient index and slope, but negatively corresponds to the elevation. Terrain may influence the habitat quality in NDVI. Habitat quality correlates with land use, and this land use is constrained by the terrain. In the basin of Lhasa River, it can also be found that the ecosystem service increases with the upgrade of terrain, and it would reflect on the increase of habitat quality (Huang et al., 2022). Thus, in the plateau area, the habitat quality positively corresponds to the terrain gradient. The result was also found in other regions (Xiao et al., 2023).
Grassland and forest have favorable natural ecological conditions and rich biodiversity so that is why the high habitat quality areas was concentrating on grassland and forest. The combination of precipitation and the slope was considered to improve soil conservation, which may increase the cover and quality of grassland and forest (Lu et al., 2023). As the critical factors to improve the habitat quality, 88.77% of the forest and 62.39% of grassland in the Qinghai–Tibet Plateau was distributed in the III–V terrain gradient, which was especially multiplied on the south part of the Himalayas and the north part of the Hengduan Mountains.
In contrast, human activities increased the intensity of land use with changing habitats into non-habitat easily (Deng et al., 2018). Human activities were mostly concentrated in the flatlands and floodplains in the mountainous valley areas, which had a low terrain gradient index. Areas with a high terrain gradient index are less disturbed by human activities and consequently exhibit higher average habitat quality. The finding aligns with the results of prior studies (Liu et al., 2020; Lu et al., 2022).
4.2 The changes of the habitat quality
During the study period, the plateau’s average habitat quality exhibited minor fluctuations. Different terrain gradient areas of the Qinghai–Tibet Plateau showed the different characters and changing trends. For the terrain gradients I–II, the habitat quality demonstrated a trend of improvement. This was because the area of the impervious surfaces increased greatly but the water body area increased significantly too. The water body was located in the northwest part in terrain I (66.33%), which was around Qinghai Lake. The improving land conversion around the lake resulted in the trend of northward movement of the mean center.
For terrains II–IV, the mean center had a fluctuating/changing trend. This means that there was balance in land-use matrix changes. In the northwest, low habitat quality was caused by low vegetation area cover and high bare area cover.
The gradient V area covers a lot of area in the mountainous part, which had high temperature and sufficient precipitation and a large area of forest, resulting in better habitat quality. Thus, the mean center of the gradient V area was located in the southernmost region. As habitat quality improved in the southern and western forests, this trend has shifted towards the southwest. Global warming and the implementation of ecological protection projects have expanded the regions of water body and forest in the Qinghai–Tibet Plateau, indicating that the water cycle activated by the soil active layer could accelerate the increase of habitat quality in the permafrost environment (Zhao et al., 2020).
Overall, the impervious surface area within the study region has significantly increased, with the expansion of impervious surfaces gradually forming strip patterns. This pattern represents a new source of threat that disturbs and endangers adjacent habitats (Cui et al., 2022). Changes in land-use intensity attributable to human activities were the primary drivers for habitat quality degradation in certain regions. Urbanization has a negative influence in habitat quality. In other studies, SHDI affected habitat quality negatively, but AI had a positive correlation (Zhu et al., 2020a), which was different from our study. Now, the plateau will face the threat of drought (Feng et al., 2020), higher summer precipitation (Xie et al., 2021), and flood (Ran et al., 2018) in the near future. In other studies, it has been found that climate change with water resource change and human activities has resulted in the change in animal habitat, such as ungulate species (Shi et al., 2023). The fragile environment in the plateau should pay more attention to protect its lower habitat quality for its wildlife.
4.3 Driving factors of habitat quality
Habitat quality exhibits spatial differentiation due to the interplay of numerous factors. In this study, the Geo-detector model was employed to analyze how various driving factors influence the spatial distribution across the plateau. The results show that natural factors are the dominant factors affecting the spatial distribution pattern of habitat quality in the Qinghai–Tibet Plateau, and social and economic factors are less influential, which was consistent with the research results of Dong et al. (2022). NDVI was the prime driver influencing the spatial distribution pattern of the habitat quality, followed by annual average precipitation, soil type, and slope. In the Qinghai–Tibet Plateau, NDVI has a high character in the southeast but a low character in the northwest, which has similar characters to precipitation and temperature. As for the mechanisms, NDVI was influenced by land use, precipitation, temperature, and vegetation cover, which were the main factors that influence the habitat quality in the Qinghai–Tibet Plateau in other studies (Shui et al., 2018; Gao et al., 2021; Cui et al., 2022).
Under different terrain gradients, the contribution rate of each driving factor to habitat quality spatial differentiation varies greatly. Across the I–IV terrain gradient, the q-value of the annual average precipitation was the second most influential factor on habitat quality, ranking just below the NDVI. Meanwhile, for the V terrain gradient, the q-value of the annual average temperature exceeded that of the annual average precipitation. Owing to the complex topography of the Qinghai–Tibet Plateau, the spatial distribution of precipitation on the plateau was extremely uneven (Yang et al., 2011), and the spatial heterogeneity of vegetation coverage was significant, affecting habitat quality.
The two-factor interaction would enhance the interpretation of habitat quality, indicating that the two-factor interaction had a stronger effect on the single-factor drive. The interaction among different factors would strengthen the influence, which corresponded to previous literature (Hu et al., 2022). The interaction between NDVI and other factors was significantly more pronounced than the interactions involving other individual factors, further suggesting that NDVI is the predominant factor influencing the spatial distribution patterns of habitat quality. The spatial distribution patterns of habitat quality are influenced by a confluence of natural, social, and economic factors, and these factors interact in a complex manner, but natural factors had a greater influence. In the evaluation of ecology asset, the land use was inverted into the asset (Yuan et al., 2023). NDVI is the reflection of the vegetation. The protection of nature resources will benefit the value of regions.
4.4 Uncertainty
This study explored the association between various factors and habitat quality. However, NDVI data may be affected by several factors, including solar angle, cloud cover, atmospheric evaporation, and soil effects. NDVI data derived from remote sensing may not accurately represent the actual conditions. Similar uncertainties have been reported in other studies investigating phenology and aboveground biomass through NDVI (Wang et al., 2021; Ma et al., 2022). Furthermore, other datasets, such as population or GDP estimate at the district level, should be revised with recent data. Additionally, although only limited factors and threat sources were selected for this study, future research could incorporate additional variables. While the interactions among the selected factors were examined, the inclusion of further variables, such as industrial impacts or classifications of vegetation, could enhance the exploration. Consequently, future studies should employ more extensive time series data and enhance precision, as well as integrate additional factors into the analysis.
5 Conclusion
From 2000 to 2020, habitat quality on the plateau experienced slight fluctuations but has seen an increase in recent years with significant shifts in the low terrain gradient and high terrain gradient areas’ centers northward and westward, respectively. The factors influencing habitat quality primarily include NDVI, temperature, soil types, and slopes. Natural factors have had a greater impact on habitat quality than social factors in different terrains, and it is imperative for governments to restore the ecosystem to maintain habitat quality. Despite China’s desertification challenges, long-term environmental efforts have mitigated threats to habitat quality, emphasizing the need for tailored conservation strategies across different terrains. In low-altitude regions, the protection of water bodies from construction is crucial, while in mountainous areas, the preservation of native forests is key to enhancing hydrothermal conditions and habitat quality. The plateau’s ecological integrity is vital for global ecological security, with its habitat changes influenced by global warming and potentially affecting hydrothermal conditions and global climate patterns. Thus, investigating the impacts of global changes on the plateau’s ecosystem requires further research.
Data availability statement
The original contributions presented in the study are included in the article/Supplementary Material. Further inquiries can be directed to the corresponding author.
Author contributions
HY: Data curation, Formal Analysis, Visualization, Writing – original draft. XQ: Formal Analysis, Investigation, Resources, Validation, Visualization, Writing – original draft. HJ: Data curation, Formal Analysis, Investigation, Resources, Writing – original draft. YL: Supervision, Writing – review & editing.
Funding
The author(s) declare financial support was received for the research, authorship, and/or publication of this article. This research was funded by the Second Tibetan Plateau Scientific Expedition and Research Program (STEP), grant number 2019QZKK0608.
Acknowledgments
The authors would like to express thanks to the reviewers and editors for their invaluable con-tributions to the improvement of this paper.
Conflict of interest
The authors declare that the research was conducted in the absence of any commercial or financial relationships that could be construed as a potential conflict of interest.
Publisher’s note
All claims expressed in this article are solely those of the authors and do not necessarily represent those of their affiliated organizations, or those of the publisher, the editors and the reviewers. Any product that may be evaluated in this article, or claim that may be made by its manufacturer, is not guaranteed or endorsed by the publisher.
Supplementary material
The Supplementary Material for this article can be found online at: https://www.frontiersin.org/articles/10.3389/fevo.2024.1345665/full#supplementary-material
References
Bagstad K., Villa F., Johnson G., Voigt B. (2011). Artificial Intelligence for Ecosystem Services: A guide to models and data, version 1.0. Bilbao: The ARIES Consortium.
Bai L., Yao Y., Lei X., Liang. Z. (2018). Annual and seasonal variation characteristics of surface temperature in the tibetan plateau in recent 40 years. J. Geomatics. 43, 15–18. doi: 10.14188/j.2095-6045.2016194
Bao Y., Liu K., Li T., Hu S. (2015). Effects of land use change on habitat based on inVEST model—Taking yellow river wetland nature reserve in shaanxi province as an example. Arid Zone Res. 32, 622–629. doi: 10.13866/j.azr.2015.03.29
Boumans R., Roman J., Altman I., Kaufman L. (2015). The Multiscale Integrated Model of Ecosystem Services (MIMES): Simulating the interactions of coupled human and natural systems. Ecosystem Service 12, 30–41. doi: 10.1016/j.ecoser.2015.01.004
Brown G., Brabyn L. (2012). The extrapolation of social landscape values to a national level in New Zealand using landscape character classification. Appl. Geogr. 35, 84–94. doi: 10.1016/j.apgeog.2012.06.002
Chen D., Xu B., Yao T., Guo Z., Cui P., Chen F., et al. (2015). Assessment of past, present and future environmental changes on the Tibetan Plateau. Chin. Sci. Bull. 60, 3025–3035. doi: 10.1360/n972014-01370
Chen Y., Qiao F., Jiang L. (2016). Effects of land use pattern change on regional scale habitat quality based on inVEST model—a case study in Beijing. Acta Scientiarum Naturalium Universitatis Pekinensis 52, 553–562. doi: 10.13209/j.0479-8023.2016.057
Chu L., Sun T., Wang T., Li Z., Cai C. (2018a). Evolution and prediction of landscape pattern and habitat quality based on CA-Markov and inVEST model in hubei section of three gorges reservoir area (TGRA). Sustainability 10, 3854. doi: 10.3390/su10113854
Chu L., Zhang X., Wang T., Li C., Cai C. (2018b). Spatial-temporal evolution and prediction of urban landscape pattern and habitat quality based on CA-Markov and InVEST model. Chin. J. Appl. Ecol. 29, 4106–4118. doi: 10.13287/j.1001-9332.201812.013
Cui G., Zhang Y., Shi F., Jia W., Pan B., Han C., et al. (2022). Study of spatiotemporal changes and driving factors of habitat quality : A case study of the agro-pastoral ecotone in Northern Shaanxi, China. Sustainability 14, 1–23. doi: 10.3390/su14095141
Deng Y., Jiang W., Wang W., Lu J., Chen K. (2018). Urban expansion led to the degradation of habitat quality in the Beijing-Tianjin-Hebei Area. Acta Ecologica Sin. 38, 4516–4525. doi: 10.5846/stxb201712062200
Dong J., Zhang Z., Liu B., Zhang X., Zhang W., Chen L. (2022). Spatiotemporal variations and driving factors of habitat quality in the loess hilly area of the Yellow River Basin: A case study of Lanzhou City, China. J. Arid Land 14, 637–652. doi: 10.1007/s40333-022-0097-6
Fan Y., Fang C. (2022). Measuring Qinghai-Tibet plateau's sustainability. Sustain. Cities Soc. 85, 104058. doi: 10.1016/j.scs.2022.104058
Feng W., Lu H., Yao T., Yu Q. (2020). Drought characteristics and its elevation dependence in the Qinghai-Tibet plateau during the last half-century. Sci. Rep. 10, 2045–2322. doi: 10.1038/s41598-020-71295-1
Fu W., Jiang P., Zhou G., Zhao K. (2014). Using Moran's I and GIS to study the spatial pattern of forest litter carbon density in a subtropical region of southeastern China. Biogeosciences 11, 2401–2409. doi: 10.5194/bg-11-2401-2014
Gao S., Dong G., Jiang X., Nie T., Yin H., Guo X. (2021). Quantification of natural and anthropogenic driving forces of vegetation changes in the three-river headwater region during 1982-2015 based on geographical detector model. Remote Sens. 13, 4175. doi: 10.3390/rs13204175
Gong W., Wang H., Wang X., Fan W., Stott P. (2017). Effect of terrain on landscape patterns and ecological effects by a gradient-based RS and GIS analysis. J. Of Forestry Res. 28, 1061–1072. doi: 10.1007/s11676-017-0385-8
Hall L., Krausman P., Morrison M. (1997). The habitat concept and a plea for standard technology. Wildlife Soc. Bull. 25, 173–182. doi: 10.2307/3783301
Han Y., Chen K., Yu D. (2019). Evaluation on the impact of land use change on habitat quality in qinghai lake basin. Ecol. Environ. Sci. 28, 2035–2044. doi: 10.16258/j.cnki.1674-5906.2019.10.014
Han Y., Ma W., Wang B., Ma Y., Tian R. (2017). Climatic characteristics of rainfall change over the qinghai-tibetan plateau from 1980 to 2013. Plateau Meteorology 36, 1477–1486. doi: 10.7522/j.issn.1000-0534.2016.00125
Han L., Wei S. (2021). Spatiotemporal distribution and influencing factors of ecosystem vulnerability on qinghai-tibet plateau. Environ. Res. Public Health 18, 6508. doi:–10.3390/ijerph18126508
Hu Y., Xu E., Dong N., Tian G., Kim G., Song P., et al. (2022). Driving mechanism of habitat quality at different grid-scales in a metropolitan city. Forests 13, 248. doi: 10.3390/f13020248
Huang L., He C., Wang B. (2022). Study on the spatial changes concerning ecosystem services value in Lhasa River Basin, China. Environ. Sci. pollut. Res. 29, 7827–7843. doi: 10.1007/s11356-021-16245-8
Huang H., Xiao Y., Ding G., Ding G., Liao L., Yan C., et al. (2023). Comprehensive evaluation of island habitat quality based on the invest model and terrain diversity A case study of Haitan Island, China. Sustainability 15, 11293. doi: 10.3390/su151411293.
Jing H., Liu Y., He P., Zhang J., Dong J., Wang Y. (2022). Spatial heterogeneity of ecosystem services and it’s influencing factors in typical areas of the Qinghai-Tibet Plateau: A case study of Nagqu City. Acta Ecologica Sin. 42, 2657–2673. doi: 10.5846/stxb202104140965
Lee D., Jeon S. (2020). Estimating Changes in Habitat Quality through Land-Use Predictions: Case Study of Roe Deer (Capreolus pygargus tianschanicus) in Jeju Island. Sustainability 12, 10123. doi: 10.3390/su122310123
Li H., Song W. (2021). Spatiotemporal distribution and influencing factors of ecosystem vulnerability on qinghai-tibet plateau. Int. J. Environ. Res. Public Health 18, 6508. doi: 10.3390/ijerph18126508
Liu T., Deng W., Zhou Y., Luo X. (2020). Habitat quality and terrain gradient differentiation of “One Urban Area and Two Town Groups” in Chongqing. Environ. Sci. Technol. 43, 227–236.
Lu R., Dai E., Wu C. (2023). Spatial and temporal evolution characteristics and driving factors of soil conservation services on the Qinghai-Tibet Plateau. Catena 221, 106766. doi: 10.1016/j.catena.2022.106766
Lu Y., Li T., Gong J. (2022). Attribution of habitat quality in different geomorphological types in Guangdong Province. Ecol. Sci. 41, 24–32. doi: 10.19672/j.cnki.1003-6504.2020.11.029
Ma R., Shen X., Zhang J., Xia C., Liu Y., Wu L., et al. (2022). Variation of vegetation autumn phenology and its climatic drivers in temperate grasslands of China. Int. J. Appl. Earth Observations Geoinformation 114, 103064. doi: 10.1016/j.jag.2022.103064
Ma L., Wang C., Wang L., Jin S., Kou X. (2023). Study of spatiotemporal variation and driving factors of habitat quality in the northern foothills of the Qinling Mountains: A case study of Xi’an, China. Front. Ecol. Evol. 11. doi: 10.3389/fevo.2023.1284281.
Miller J., Groom M., Hess G., Steelman T., Stokes D., Thompson J., et al. (2009). Biodiversity conservation in local planning. Conserv. Biol. 23, 53–63. doi: 10.1111/j.1523-1739.2008.01110.x
Pritchard H. (2019). Asia's shrinking glaciers protect large populations from drought stress. Nature 569, 649–654. doi: 10.1038/s41586-019-1240-1
Qu W., Xie B., Chen Y., He Y., Ma L. (2022). Spatio-temporal patterns of habitat quality and habitat degradation and its terrain gradient effects of Yuzhong County based on InVEST model. J. Gansu Agric. Univ. 57, 139–147. doi: 10.13432/j.cnki.jgsau.2022.03.018
Ran Y., Li X., Cheng G. (2018). Climate warming over the past half century has led to thermal degradation of permafrost on the Qinghai-Tibet Plateau. Cryosphere 12, 595–608. doi: 10.5194/tc-12-595-2018
Rands M., Adams W., Bennun L., Butchart S., Clements A., Coomes D., et al. (2010). Biodiversity conservation: challenges beyond 2010. Science 329, 1298–1303. doi: 10.1126/science.1189138
Sharp R., Chaplin-Kramer R., Wood S., Guerry A., Tallis H., Ricketts T., et al. (2018). InVEST User’s Guide. United States: The Natural Capital Project, Stanford University, University of Minnesota: The Nature Conservancy, and World Wildlife Fund.
Shi F., Liu S., An Y., Sun Y., Zhao S., Liu Y., et al. (2023). Climatic factors and human disturbance influence ungulate species distribution on the Qinghai-Tibet Plateau. Sci. Total Environ. 869, 161681. doi: 10.1016/j.scitotenv.2023.161681.
Shui Y., Lu H., Wang H., Yan Y., Wu G. (2018). Assessment of habitat quality on the basis of land cover and NDVI changes in Lhasa River Basin. Acta Ecologica Sin. 38, 8946–8954. doi: 10.5846/stxb201806141331
Sun X., Jiang Z., Liu F., Zhang D. (2019). Monitoring spatio-temporal dynamics of habitat quality in Nansihu Lake basin, eastern China, from 1980 to 2015. Ecol. Indic. 102, 716–723. doi: 10.1016/j.ecolind.2019.03.041
Tallis H., Ricketts T. (2011). InVEST 1.0 Beta User's Guide: Integrated Valuation of Ecosystem Services and Tradeoffs. Stanford: The Natural Capital Project.
Tang F., Fu M., Wang L., Song W., Yu J., Wu Y. (2021). Dynamic evolution and scenario simulation of habitat quality under the impact of land-use change in the Huaihe River Economic Belt, China. PloS One 16, e0249566. doi: 10.1371/journal.pone.0249566
Wang X., Liu G., Xiang A., Xiao S., Lin D., Lin Y., et al. (2023). Terrain gradient response of landscape ecological environment to land use and land cover change in the hilly watershed in South China. Ecol. Indic. 146, 109797. doi: 10.1016/j.ecolind.2022.109797
Wang Y., Meng J., Qi Y., Peng F. (2015). Review of ecosystem management based on the InVEST model. Chin. J. Ecol. 34, 3526–3532. doi: 10.13292/j.1000-4890.2015.0331
Wang Y., Shen X., Jiang M., Tong S., Lu X. (2021). Spatiotemporal change of aboveground biomass and its response to climate change in marshes of the Tibetan Plateau. Int. J. Appl. Earth Observation Geoinformation 102, 102385. doi: 10.1016/j.jag.2021.102385.
Wang J., Xu C. (2017). Geodetector: Principle and prospective. Acta Geographica Sin. 72, 116–134. doi: 10.11821/dlxb201701010
Wu X., Lin Z. (1981). Some characteristics of the climatic changes during the historical time of qinghai-xizang plateau. Acta Meteorologica Sin. 1, 90–97.
Wu J., Wang G., Chen W., Pan S., Zeng J. (2022). Terrain gradient variations in the ecosystem services value of the Qinghai-Tibet Plateau, China. Global Ecol. Conserv. 34, e02008. doi: 10.1016/j.gecco.2022.e02008
Xiao P., Zhou Y., Li M., Xu J. (2023). Spatiotemporal patterns of habitat quality and its topographic gradient effects of Hubei Province based on the InVEST model. Environment Dev. Sustainability 25, 6419–6448. doi: 10.1007/s10668-022-02310-w
Xie L., Huang R., Wang H., Liu S. (2021). Spatial-temporal heterogeneity and meteorological factors of hand-foot-and-mouth disease in Xinjiang, China from 2008 to 2016. PloS One 16, e0255222. doi: 10.1371/journal.pone.0255222
Yan S., Wang X., Cai Y., Li C., Yan R., Cui G., et al. (2018). An integrated investigation of spatiotemporal habitat quality dynamics and driving forces in the upper basin of miyun reservoir, North China. Sustainability 10. 4625 doi: 10.3390/su10124625
Yang Y. (2021). Evolution of habitat quality and association with land-use changes in mountainous areas: A case study of the Taihang Mountains in Hebei Province, China. Ecol. Indic. 129, 107967. doi: 10.1016/j.ecolind.2021.107967
Yang W., He J., Wang P., Wang C. (2011). Inhomogeneity characteristics of intra-annual precipitation over the tibetan plateau in recent 42 years. Acta Geographica Sin. 66, 376–384. doi: 10.11821/xb201103010
Yohannes H., Soromessa T., Argaw M., Dewan A. (2021). Spatio-temporal changes in habitat quality and linkage with landscape characteristics in the Beressa watershed, Blue Nile basin of Ethiopian highlands. J. Environ. Manage. 281, 111885. doi: 10.1016/j.jenvman.2020.111885
Yu H., Zeng H., Jiang Z. (2001). Characteristics of landscape elements along the terrain gradient. Scientia Geographica Sin. 1, 64–69. doi: 10.13249/j.cnki.sgs.2001.01.6
Yuan X. M., Guo B., Lu M., Zang W. Q., Liu C., Wang B. Y., et al. (2023). Eco-asset variations and their driving factors in the qinghai-tibet plateau, China, under the context of global change. Sustainability 15, 7466. doi: 10.3390/su15097466
Yue W., Xia H., Wu T., Xiong J., Zhong P., Chen Y. (2022). Spatio-temporal evolution of habitat quality and ecological red line assessment in Zhejiang Province. Acta Ecologica Sin. 42, 6406–6417. doi: 10.5846/stxb202104010847
Zhang R., Su F., Jiang Z., Gao X., Guo D., Ni J., et al. (2015). An overview of projected climate and environmental changes across the Tibetan Plateau in the 21st century. Chin. Sci. Bull. 60, 3036–3047. doi: 10.1360/N972014-01296
Zhang X., Zhou J., Li M. (2020). Analysis on spatial and temporal changes of regional habitat quality based on the spatial pattern reconstruction of land use. Acta Geographica Sin. 75, 160–178. doi: 10.11821/dlxb202001012
Zhao B., Li S., Liu Z. (2022). Multi-scenario simulation and prediction of regional habitat quality based on a system dynamic and patch-generating land-use simulation coupling model-A case study of jilin province. Sustainability 14, 5303. doi: 10.3390/su14095303
Zhao L., Zou D., Hu G., Du E., Pang Q., Xiao Y., et al. (2020). Changing climate and the permafrost environment on the Qinghai–Tibet (Xizang) plateau. Permafrost Periglacial Processes 7, 341–457. doi: 10.1002/ppp.2056
Zheng J., Xie B., You X. (2022). Evolution of habitat quality and its influencing factors in the different terrain gradient of the Guangdong-Hong kong-Macao greater bay area from 1980 to 2020. Economic Geogr. 42, 41–50. doi: 10.15957/j.cnki.jjdl.2022.08.005
Zhu J., Gong J., Li J. (2020b). Spatiotemporal change of habitat quality in ecologically sensitive areas of eastern QinghaiTibet Plateau: A case study of the Hehuang Valley, Qinghai Province. Resour. Sci. 42, 991–1003. doi: 10.18402/resci.2020.05.16.
Keywords: habitat quality, InVEST model, spatiotemporal variation, terrain gradient index, Geo-detector
Citation: Yu H, Qian X, Jing H and Liu Y (2024) Spatiotemporal evolution characteristics and the driving force of habitat quality in the Qinghai–Tibet Plateau in topographic view (2000–2020). Front. Ecol. Evol. 12:1345665. doi: 10.3389/fevo.2024.1345665
Received: 28 November 2023; Accepted: 29 January 2024;
Published: 16 February 2024.
Edited by:
Arnaldo Marín, University of Murcia, SpainReviewed by:
Rongfang Lyu, Lanzhou University, ChinaXiangjin Shen, Chinese Academy of Sciences (CAS), China
Copyright © 2024 Yu, Qian, Jing and Liu. This is an open-access article distributed under the terms of the Creative Commons Attribution License (CC BY). The use, distribution or reproduction in other forums is permitted, provided the original author(s) and the copyright owner(s) are credited and that the original publication in this journal is cited, in accordance with accepted academic practice. No use, distribution or reproduction is permitted which does not comply with these terms.
*Correspondence: Yinghui Liu, bHloQGJudS5lZHUuY24=