
94% of researchers rate our articles as excellent or good
Learn more about the work of our research integrity team to safeguard the quality of each article we publish.
Find out more
ORIGINAL RESEARCH article
Front. Ecol. Evol., 26 February 2024
Sec. Biogeography and Macroecology
Volume 12 - 2024 | https://doi.org/10.3389/fevo.2024.1340531
This article is part of the Research TopicIndonesian Mangrove Ecology and the Changing ClimateView all 3 articles
 Milkah Royna1,2*
 Daniel Murdiyarso1,2
 Sigit D. Sasmito2,3
 Desra Arriyadi4
 Joeni Setijo Rahajoe5
 Mufidah Ghina Zahro1
 Trialaksita Sari Priska Ardhani1,2
Aquaculture is one of the main drivers of mangrove loss across Southeast Asian countries. The conversion of mangroves to aquaculture generates substantial loss of carbon stocks and reduces carbon storage capacity. Here, we present total ecosystem carbon stocks (TECS), carbon dioxide (CO2) and methane (CH4) effluxes obtained from mangrove forests (fringe and interior mangroves), silvofishery aquaculture ponds (dense and sparse mangroves), and non-silvofishery aquaculture ponds in Sawah Luhur, Banten, Indonesia. We found no significant difference in TECS across five land uses, ranging from 261 ± 14 Mg C ha-1 in non-silvofishery ponds to 574 ± 119 Mg C ha-1 in fringe mangroves. Most of these stocks were found in the soil carbon pool (87%) in fringe and interior mangroves. However, the conversion of mangroves to aquaculture ponds resulted in soil carbon loss from -6% to 60%. The highest soil CO2 effluxes during dry and wet seasons were observed in interior mangroves (151 ± 12 mg CO2 m-2 h-1). The highest soil CH4 effluxes were found in fringe mangroves with 0.13 ± 0.04 mg CH4 m-2 h-1. The highest aquatic CO2 and CH4 effluxes were found in dense silvofishery ponds, at 118 ± 7 mg CO2 m-2 h-1 and 0.38 ± 0.04 mg CH4 m-2 h-1, respectively. Our findings suggest that land use that includes mangroves (i.e., mangrove forest and/or silvofishery ponds) tends to have higher carbon stocks, soil, and aquatic CO2 and CH4 effluxes, compared to aquaculture ponds without mangroves. It is therefore crucial to maintain mangroves for natural carbon capture and storage through carbon stock enhancement.
Mangroves offer a wide range of ecosystem services (Bimrah et al., 2022) and the most well-known mangrove service is the ability to store 3–5 times more carbon than terrestrial forests (Donato et al., 2011). Mangrove carbon stock studies have been widely conducted on a global scale. Kauffman et al. (2020) studied global mangrove carbon stocks and revealed that mangroves could store 11.7 Pg C globally (79–2,208 Mg C ha-1; mean 856 ± 32 Mg C ha-1). Sasmito et al. (2019) also conducted a global assessment of mangrove carbon stocks and emissions relating to land use and land cover change. Furthermore, carbon stock studies also have been conducted in the largest mangrove wetlands in the world, Sundarbans (Chowdhury et al., 2023), and in a country that has the widest mangrove area on this planet, Indonesia such as Kepel et al. (2019) in Sulawesi, Sugiatmo et al. (2023 and Nehren and Wicaksono (2018) in Central Java, Pricillia et al. (2021) in Bali, Arif et al. (2017) in East Java, Hanggara et al. (2021) in Sumatera, and Syarif (2023) in Riau Archipelago. However, within 24 years (1996–2020), global mangrove forests have decreased by 3.4% (5,245 km2) (Bunting et al., 2022) mainly due to conversion to aquaculture and agriculture (Goldberg et al., 2020; Adame et al., 2021). Indonesia, which has the largest mangrove area in the world, lost a 1,739.04 km2 of mangroves between 1996–2020 (Bunting et al., 2022).
Conversion to aquaculture and agriculture has been the main driver of mangrove loss and degradation in Indonesia (Arifanti et al., 2021). In Sawah Luhur, Serang City, Banten, mangroves were converted to aquaculture ponds in the 1990s due to increased demand in the shrimp aquaculture industry across northern coastal Java (Sualia, 2011). When mangrove soils are disturbed and excavated for pond development, organic matter can be exposed and decomposed in the form of CO2 and CH4 effluxes, and these greenhouse gases (GHGs) can contribute to global climate change (Lovelock et al., 2017). A global study by Rosentreter et al. (2021) showed that coastal aquaculture potentially emits four times more methane gas than mangrove ecosystems. Water input from aquaculture activity also negatively affects mangroves, particularly mangrove’s ability to reduce GHG emissions (Queiroz et al., 2019). A global systematic literature review study (spanning 1998–2018) conducted by Sasmito et al. (2019) also revealed that conversion from mangrove to aquaculture has caused an 83% loss in biomass and a 52% loss in carbon stocks, with the potential to emit 2,391 Tg CO2-eq globally during 2020–2100 (Adame et al., 2021).
Conservation interventions such as protection and restoration are required to reverse previous mangrove loss. Economically, the conservation of mangroves that relate to fishery production is valued at USD 12,364–22,861 ha-1 yr-1, demonstrating how mangrove conservation is more beneficial than mangrove conversion (which generates economic revenues of USD 8,103 ha-1 yr-1) (Yamamoto, 2023). Conserved mangroves were also found to be more resistant to degradation than non-forest areas, production forests, and protection forests (Arifanti et al., 2021).
A study of recent literature revealed that there are still geographical gaps in the assessment of whole ecosystem carbon stocks and effluxes in the Asia Pacific region (Sharma et al., 2023). Although studies on the impacts of land use and land cover change in mangroves have been conducted globally, there is limited available data focusing on regional extensive mangrove areas, like those in Indonesia (Sasmito et al., 2019). This study therefore aims to assess changes in carbon stocks and GHG effluxes following mangrove conversion into aquaculture ponds in Sawah Luhur, Serang City, Banten Province, Indonesia. To achieve this aim, the study had two specific objectives: (1) to assess and compare total ecosystem carbon stocks, as well as (2) soil and aquatic CO2 and CH4 effluxes among mangrove forests, silvofishery, and non-silvofishery aquaculture ponds. This research, to our knowledge, is one of the first studies from this region to combine carbon stock and efflux measurements across land-use types in a mangrove landscape. This study’s findings are essential to support the Indonesian government’s commitment to reduce GHG emissions from land use and land use change forestry (LULUCF), as well as support the inventory of regional GHG data for wetland conservation policy-making.
The study took place in Sawah Luhur, Serang City, Banten Province, Indonesia (Figure 1A). Serang City is characterized by a monsoonal climate with an annual precipitation of 1996 mm (Sparks, 2018) which the maximum rainfall occurred in 2013 at 2304 mm, and the minimum rainfall occurred in 2003 at 979 mm based on data from 1991–2016 (Pribadi et al., 2017). Serang City is also characterized by an average air temperature of 27°C (Sparks, 2018) with an average maximum temperature between 29.0–34.8°C and an average minimum temperature between 21.9–25.0°C (Pribadi et al., 2017). It is also characterized by the potential evaporation at 3 mm (Copernicus Climate Change Service, 2017), and a micro-tidal regime at 0.72 m (www.tides.big.go.id). Five different land uses were selected: fringe mangrove (FM), interior mangrove (IM), dense silvofishery pond (DSP), sparse silvofishery pond (SSP), and non-silvofishery pond (NSP). The studied mangrove sites (FM and IM) were located under the jurisdiction of Pulau Dua Nature Reserve (106°11’38” – 106°13’14”E and 6°11’5” – 6°12’5”S), which is dominated by Avicennia marina (Sualia, 2011) and has an area of 32.85 ha (DLHK Dinas Lingkungan Hidup dan Kehutanan (DLHK) Provinsi Banten, 2018). All three aquaculture ponds (DSP, SSP, and NSP) actively cultivated milkfish (Chanos chanos). A total of 38,502 mangroves were planted on the embankments of the DSP (1.77 ha) in December 2009 with mangrove trees growing at an approximate distance of 10–20 cm from each other. A total of 9,760 mangroves were planted in SSP (1.64 ha) in December 2014 which grew at an approximate distance of 40–50 cm from each other. NSP had a total area of 1.67 ha and had no mangroves on its embankment. A detailed description of the study site and environmental data are summarized in Table 1.
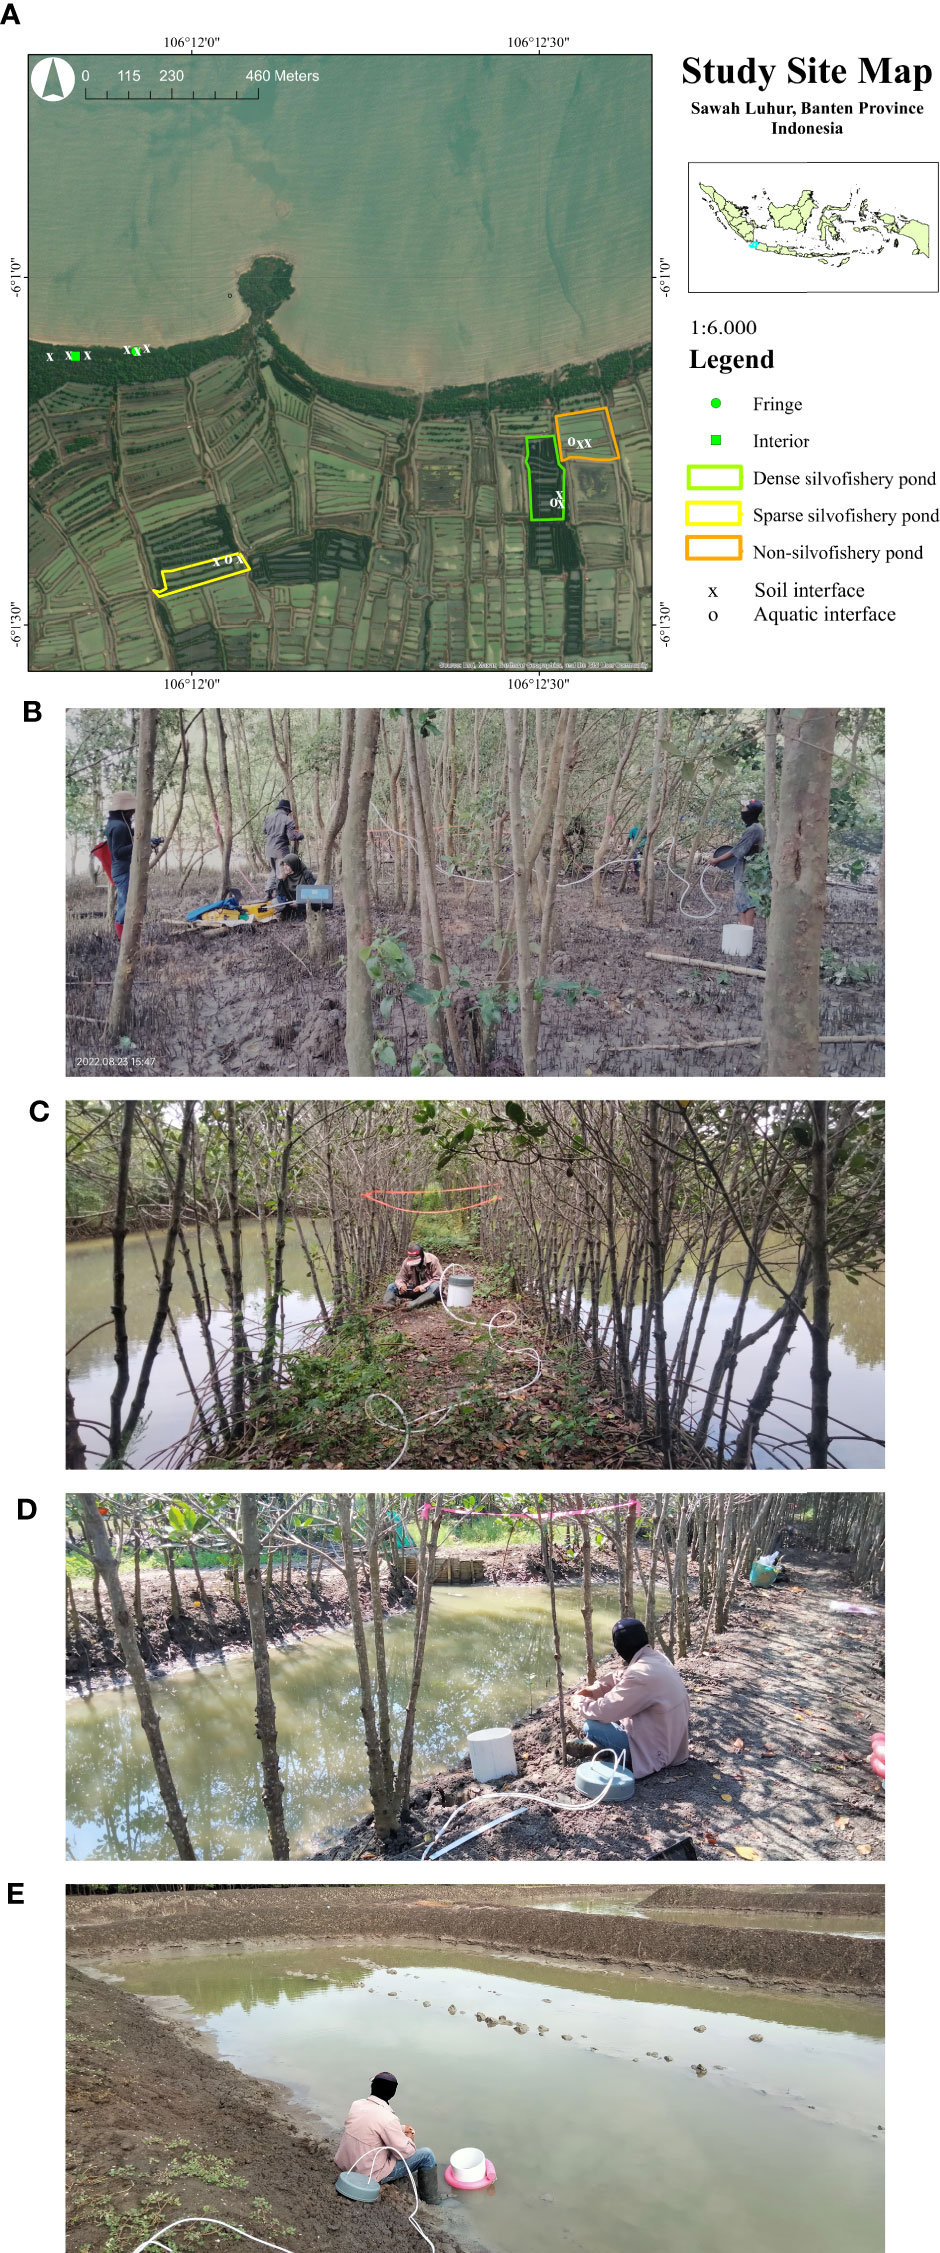
Figure 1 (A) Study site map, located in Sawah Luhur, Serang City, Banten Province, Indonesia, (B) measurement of GHG effluxes in the conserved mangrove forest of Pulau Dua Nature Reserve, (C) dense silvofishery pond, (D) sparse silvofishery pond, and (E) non-silvofishery pond. Source: photographs (B)–(E) were taken by Milkah Royna.
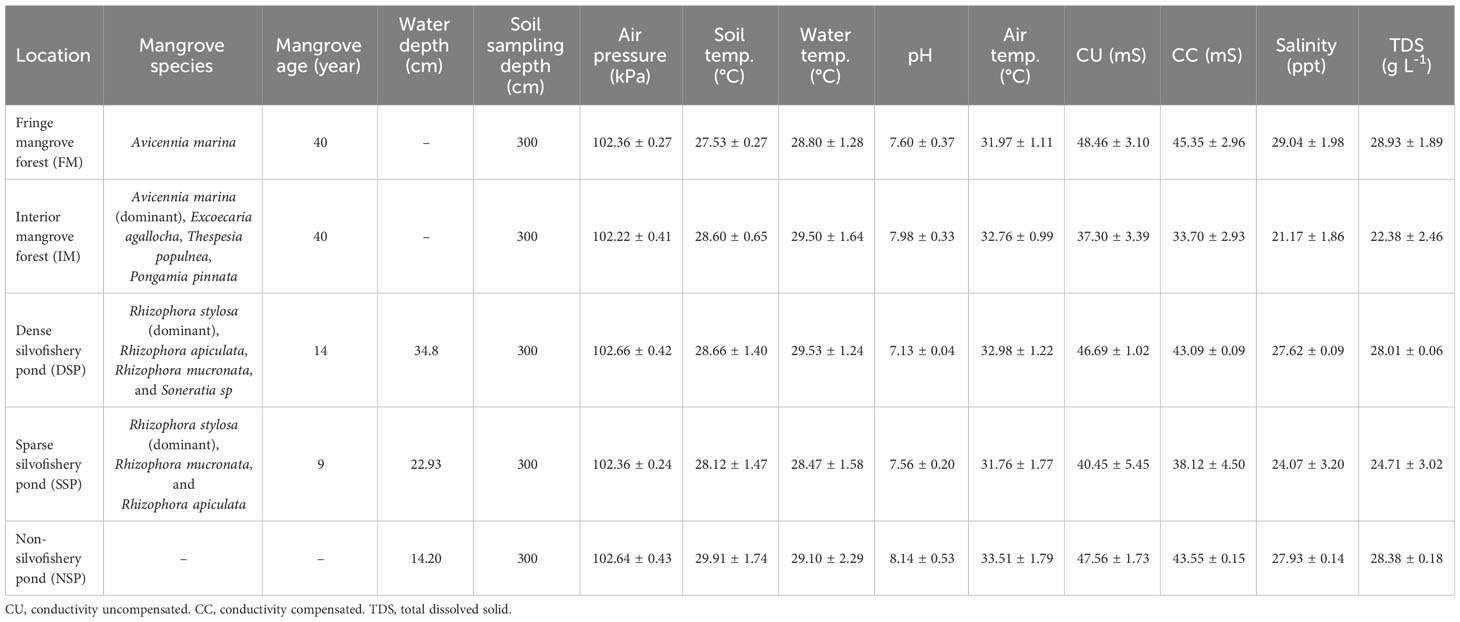
Table 1 Summary of study site details and environmental data during sampling (mean ± SD). All raw data are available on CIFOR dataverse digital repository (https://data.cifor.org).
Total ecosystem carbon stock (TECS) assessment followed protocols from Kauffman and Donato (2012). Aboveground, belowground, and necromass carbon stock assessments were conducted in four keyhole shape plots (Murdiyarso et al., 2021). This study did not assess above and belowground carbon stocks in DSP and SSP due to the difficulty of sampling plot design. The mangroves in silvofishery ponds are also small in number and only located on the edges of embankments, therefore this study assumes their value is negligible. Aboveground, belowground, and necromass carbon stocks were assessed in FM and IM in April 2022, followed by a soil carbon stock assessment in June 2022 across all five land uses. Aboveground and belowground carbon stocks were assessed by diameter at breast height (dbh) measurement and allometric equation (Table 2). Necromass carbon stocks were assessed with the planar intersect technique (Kauffman and Donato, 2012). Soil carbon stocks were assessed by collecting soil in the midpoint of the following depth classes: 0–15 cm, 15–30 cm, 30–50 cm, 50–100 cm, and 100–300 cm. Soil samples were analyzed at the National Research and Innovation Agency with a dry combustion technique (CN Analyzer YANACO JM 1000) to obtain the carbon (C) and nitrogen (N) concentrations, and C/N ratio. Soil carbon stocks were the product of soil bulk density, soil depth, and C concentration (Kauffman and Donato, 2012).
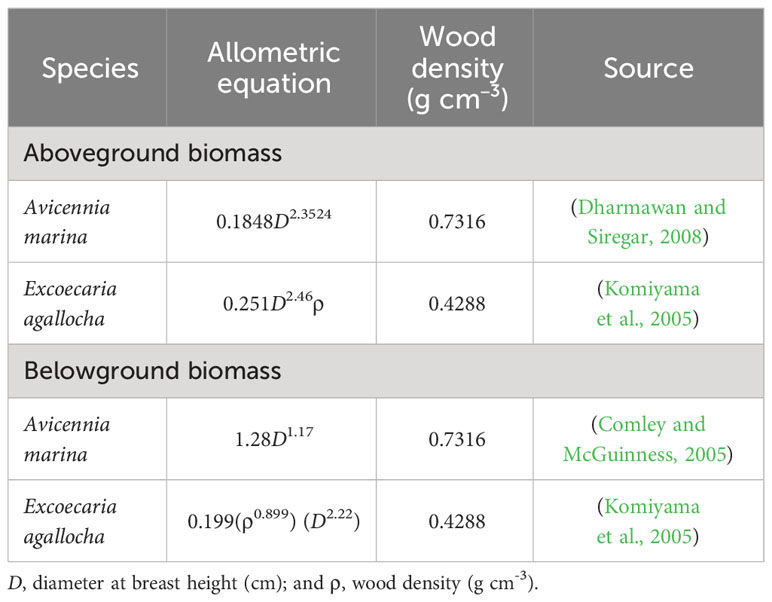
Table 2 Allometric equation used in this study to estimate biomass.
To assess carbon stock losses and gains in the soil carbon pool, this study applied the soil carbon stock difference approach. Soil carbon stock difference was estimated using two methods, namely soil organic carbon on a fixed depth basis (SOCFD) and soil organic carbon on a fixed mass basis (SOCFM), as described by Ellert et al. (2008). SOCFD provides carbon stock comparison across the same depth, while SOCFM helps to provide a standardized comparison of disturbances across different land uses. The SOCFD and SOCFM equations are shown below:
SOCFD : soil organic carbon stock on a fixed depth basis (Mg C ha-1)
OC : organic carbon content for each depth interval (mg g-1)
BD : bulk density (g cm-3)
Dh : soil thickness interval (cm)
SOCFM : soil organic carbon stock on a fixed mass basis (Mg C ha-1)
Mex : excess mass of soil so that mass of soil is equivalent in all sampling sites (g)
OCds : organic carbon concentration in the deepest soil interval (mg g-1)
The in situ CO2 and CH4 effluxes assessment was conducted in August 2022 (dry season) and February 2023 (wet season). Effluxes were measured during low and high tidal periods; this was done to represent soil to atmosphere (soil efflux) and water to atmosphere (aquatic efflux) efflux directions. Soil-atmosphere interface CO2 and CH4 efflux measurements were conducted across all sites, while aquatic or water-atmosphere interface CO2 and CH4 efflux measurements were only carried out in the ponds of the DSP, SSP, and NSP study sites. The Los Gatos Research (LGR) Ultraportable GHG analyzer, equipped with a closed chamber was used to determine CO2 and CH4 effluxes. LGR has<1% uncertainty and has precision –within 100 seconds– up to 100 ppb for CO2, 0.6 ppb for CH4, and 60 ppm for H2O (www.lgrinc.com). The collar of the chamber was made from 25.4 cm diameter and 25 cm high opaque PVC pipe. The collar was inserted approximately 5–10 cm into the soil prior to the sampling. The chamber was connected to the GHG analyzer by using 4 mm PTFE-based Teflon tubing. To measure the aquatic efflux, we used a floating chamber – the same chamber specification but this time attached to a foam collar. For each sampling, the chamber was closed for three minutes and then opened for approximately two minutes to allow for ambient air stabilization inside the chamber. CO2 and CH4 efflux sampling took place at 12 points for the soil efflux interface (see Figure 1, symbol x) and 3 points for the aquatic efflux measurement (see Figure 1, symbol o). The measurement was repeated three times at each point and replicated for three days. In total, this study generated a dataset of 540 CO2 and CH4 efflux measurements, covering both dry and wet seasons and low and high tidal cycles.
We followed Ishikura et al. (2019) for the calculation of CO2 and CH4 effluxes for each sample. The equation to calculate efflux is shown below:
where:
c : Gas concentration (µmol CO2 mol-1 or nmol CH4 mol-1)
w : Water vapor concentration (mol H2O mol-1)
Sw : Water vapor mixing ratio [mol H2O (mol dry air)-1]
F : Gas efflux (mg m-2 hour-1)
P : Air pressure (Pa)
H : Height of chamber (m)
R : Gas constant (8.314 Pa m3 K-1 mol-1)
Tair : Air temperature (K)
dsc/dt : The rate change of CO2 and CH4 mixing ratio per second [µmol CO2 (mol dry air)-1 s-1 or nmol CH4 (mol dry air)-1 s-1]
Data quality control was then applied with multiple qualifications. These included (1) efflux data had a significant slope; the Pearson correlation of the rate change of mixing ratio greater than 0.707887551 (p< 0.01, n=12); (2) stationary, the rate change of mixing ratio in minute two and minute three was calculated together and separately; the difference between these two had to be less than 30%; and (3) the initial concentration of CO2 had to be between 350–1000 µmol mol-1 and 1600–3000 nmol mol-1 for CH4 (Ishikura et al., 2019). In total, just 504 (93.33%) and 404 (74.81%) data met these criteria and qualified for respective CO2 and CH4 efflux analysis. This study also measured ancillary parameters such as pH, water temperature, air pressure, air temperature, water conductivity, salinity, total dissolved solids, and soil temperature (Supplementary Table S1).
The Shapiro-Wilk test of normality (examining how closely data fit with normal distribution) was used to understand the data distribution. If the data were following a normal distribution model, the Analysis of Variance (ANOVA) test was used to acknowledge the differences among CO2 and CH4 effluxes in different land uses. The Pearson Correlation was also used to understand the relationship between environmental parameters and CO2 and CH4 effluxes. If the data were not following a normal distribution model, Kruskal-Wallis (nonparametric test; testing whether data samples originate from the same distribution) and Kendall’s Tau-b Correlation (nonparametric test; determining whether data samples are correlated) were used. IBM SPSS statistical software (21 version) was used for all statistical analyses.
In this study, the TECS did not significantly differ across land uses, having a total range of 261.15 ± 13.72 to 573.69 ± 118.83 Mg C ha-1 (p > 0.05; Figure 2). Mean soil carbon stocks ranged from 261.15 ± 13.72 to 498.07 ± 123.77 Mg C ha-1 with no significant difference seen across the five land uses (p > 0.05). Soil carbon stocks in fringe and interior mangrove forests largely contributed to 86.82% and 87.97% of TECS. In contrast, necromass carbon stocks in fringe and interior mangrove forests contributed 1.11% and 2.51% of TECS, respectively. In fringe mangrove forests, aboveground biomass carbon stocks were 59.39 ± 10.05 Mg C ha-1, while they were 37.17 ± 4.15 Mg C ha-1 in the interior mangrove forest. Belowground carbon stocks in the fringe and interior mangrove forests were similar at 9.84 ± 1.01 and 9.13 ± 1.09 Mg C ha-1, respectively. In addition, the aboveground, belowground, and necromass biomass are shown in Table 3.
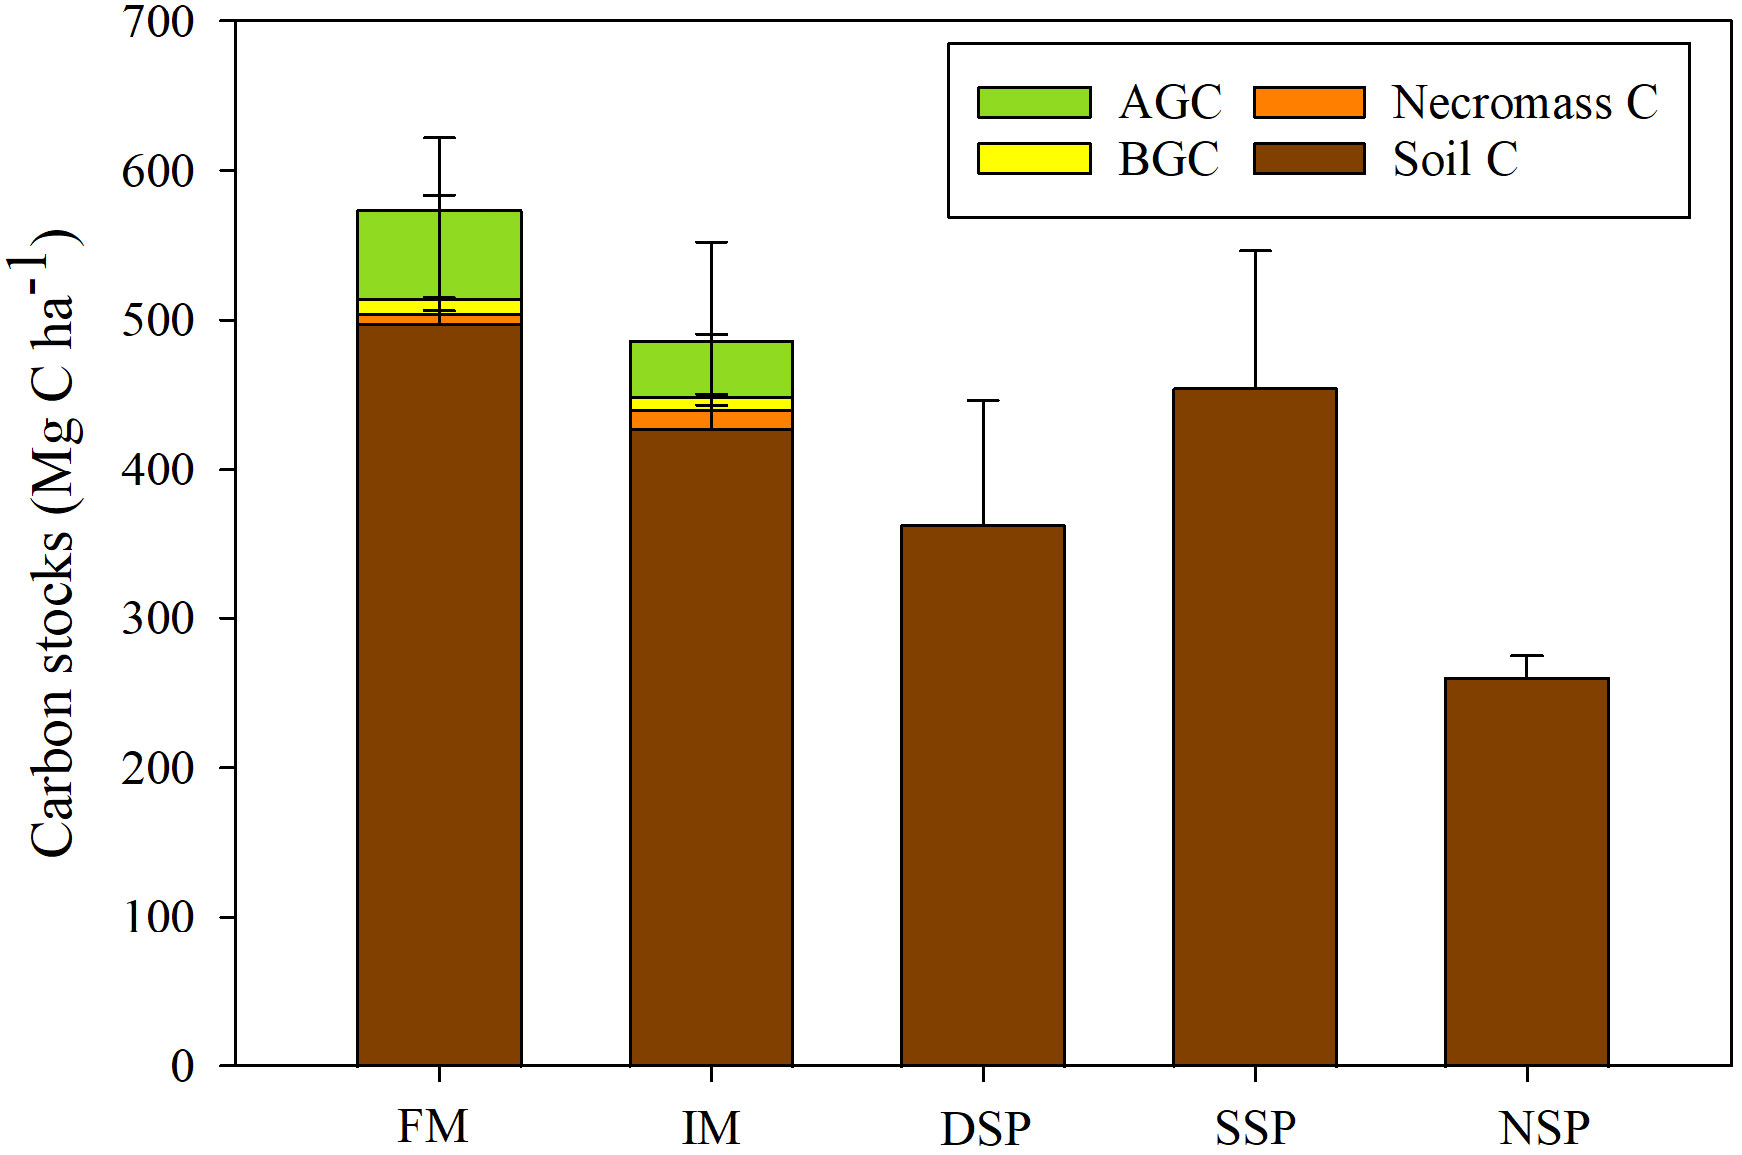
Figure 2 Total ecosystem carbon stocks (TECS) comprising soil carbon stock, necromass carbon stock, belowground carbon stock (BGC), and aboveground carbon stock (AGC). (FM, fringe mangroves; IM, interior mangroves; DSP, dense silvofishery pond; SSP, sparse silvofishery pond; and NSP, non-silvofishery pond).
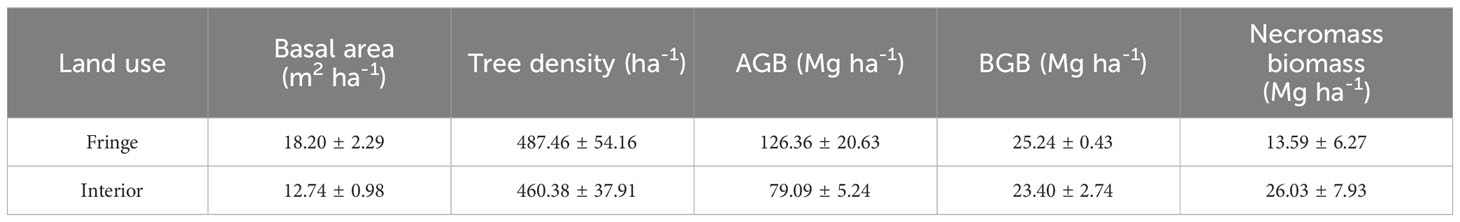
Table 3 Average values (mean ± SE) for basal area, tree density, aboveground-, belowground-, and necromass biomass in fringe and interior mangrove forests.
The largest mean soil organic carbon content was located in interior mangrove forests, while the lowest was found in non-silvofishery ponds (Supplementary Table S2). There were significant differences in the mean bulk density, carbon content (%C), and C and N ratio (C/N) across the five land uses (p< 0.05) but no difference in nitrogen content (%N) (p > 0.05). Based on personal communication with farmers in this study, the sparsely-populated silvofishery pond was also slightly more productive in terms of fish production, at 85 kg ha-1 (IDR 3,500,000) than the non-silvofishery pond, at 75 kg ha-1 (IDR 3,000,000–3,500,000).
Comparing soil carbon stocks between the fringe mangrove forest and non-silvofishery pond showed a high loss in soil carbon stocks; by 59.96% or 131.71 Mg C ha-1 using the fixed depth (SOCFD) approach, and 48.10% or 64.36 Mg C ha-1 using the fixed mass (SOCFM) approach (Figure 3A). Compared to the sparse silvofishery pond, interior mangrove had an 8.31% higher (or 10.97 Mg C ha-1) soil carbon stock using the SOCFD approach, and a 6.26% (or 6.80 Mg C ha-1) more soil carbon stock using the SOCFM approach. When looking at changes in soil properties, non-silvofishery ponds had 15.31% (or 0.12 g cm-3) less bulk density than the fringe mangrove. Non-silvofishery ponds had reduced carbon and nitrogen contents by 57.11% (or 1.63%C) and 35.04% (or 0.10%N) respectively compared to interior mangrove (Figure 3B).
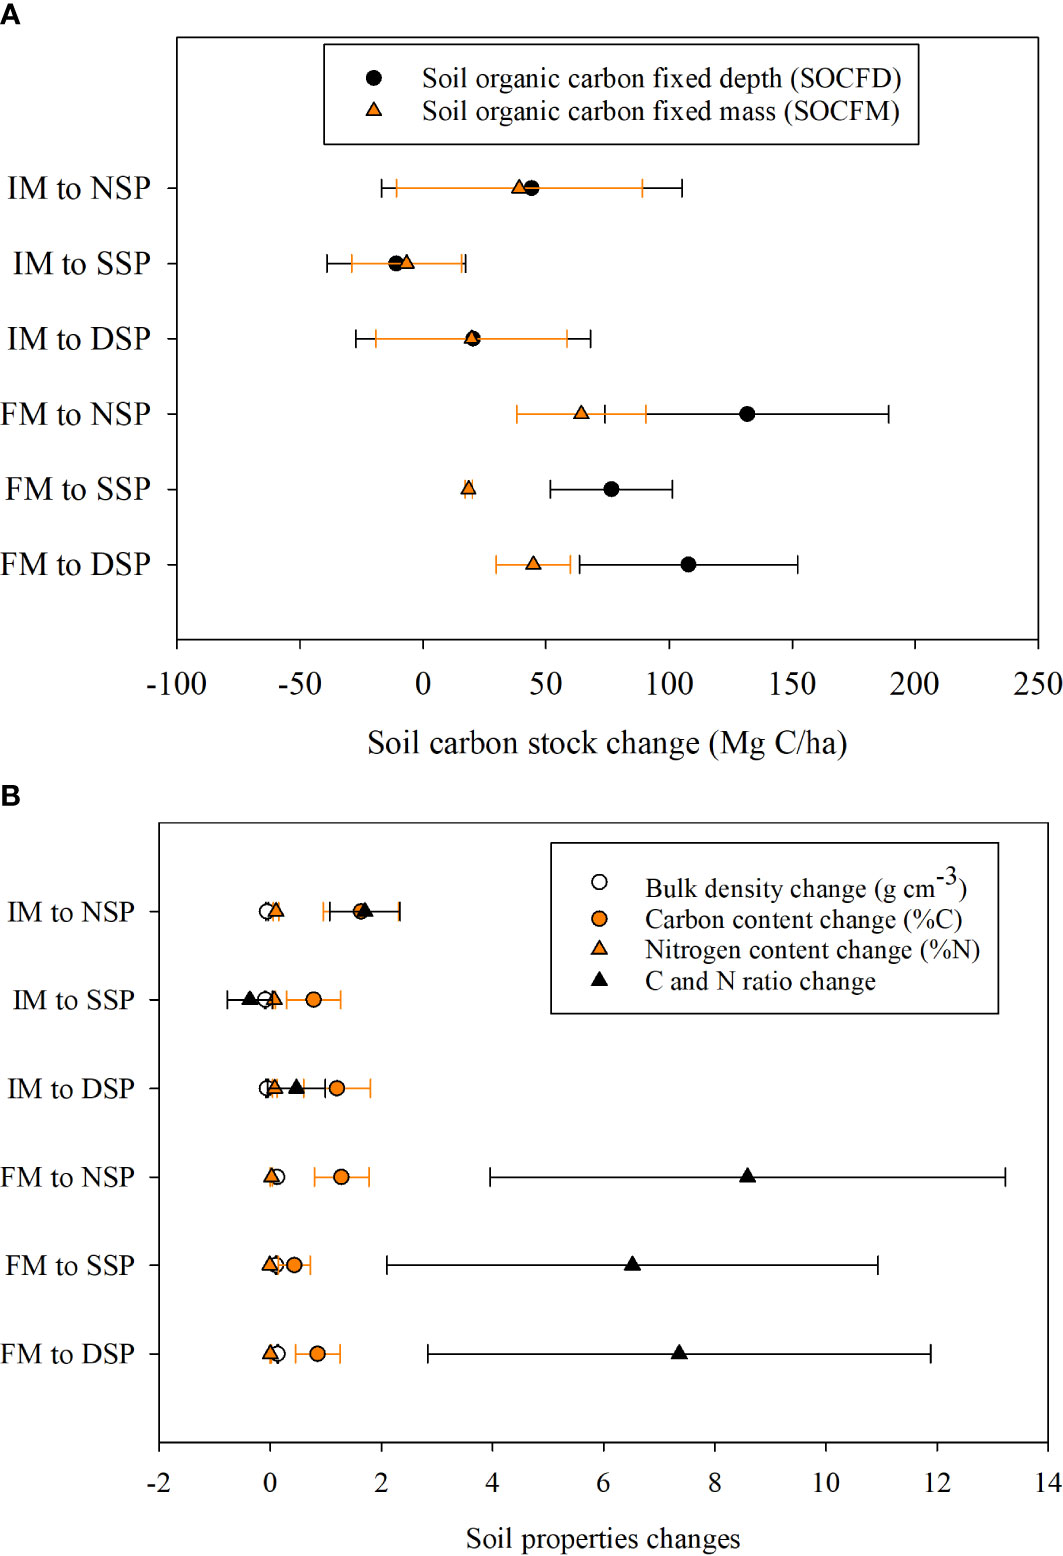
Figure 3 (A) Soil carbon stock changes and (B) soil properties change from fringe (FM)/interior (IM) mangrove forests to dense- (DSP), sparse- (SSP), and non-silvofishery ponds (NSP). A positive value indicates soil carbon stock loss, and a negative value indicates soil carbon stock gain.
The sparse silvofishery pond (SSP) emitted the largest soil CO2 efflux during the dry season, at 215.16 ± 23.05 mg CO2 m-2 h-1 (Figure 4A). Meanwhile, the lowest soil CO2 efflux during the dry season was recorded in the non-silvofishery pond (68.48 ± 17.22 mg CO2 m-2 h-1). During the wet season, the interior mangrove forest had the highest soil CO2 efflux at 378.97 ± 34.78 mg CO2 m-2 h-1 (Figure 4B). This study found significant differences in soil and aquatic CO2 effluxes during dry and wet seasons (p< 0.05), with a higher average value occurring during the wet season (wet season: 187.31 ± 49.78 mg CO2 m-2 h-1; dry season: 134.47 ± 25.44 mg CO2 m-2 h-1). In terms of aquatic CO2 efflux, the dense silvofishery pond had the highest reading during both dry and wet seasons. Over the two seasons, average soil CO2 efflux differed significantly (p< 0.05) across land uses, ranging from 81.39 ± 9.84 mg CO2 m-2 h-1 (or 7.13 ± 0.86 Mg CO2 ha-1 yr-1) in non-silvofishery pond up to 245.41 ± 24.50 mg CO2 m-2 h-1 (or 21.51 ± 2.15 Mg CO2 ha-1 yr-1) in interior mangrove (p< 0.05). The mean aquatic CO2 efflux also differed significantly (p< 0.05) over the two seasons, ranging from 1.23 ± 4.37 mg CO2 m-2 h-1 (or 0.11 ± 0.38 Mg CO2 ha-1 yr-1) in the non-silvofishery pond up to 117.73 ± 6.57 mg CO2 m-2 h-1 (or 10.32 ± 0.58 Mg CO2 ha-1 yr-1) in the dense silvofishery pond (p< 0.05). There was also a significant difference seen in soil and aquatic CO2 effluxes (p< 0.05). Soil CO2 efflux (161.53 ± 26.27 mg CO2 m-2 h-1) was larger than aquatic CO2 efflux (53.61 ± 34.14 mg CO2 m-2 h-1) over both seasons. CO2 effluxes in this study correlated with air pressure, pH, water temperature, conductivity compensated, soil temperature, and total dissolved solids (p< 0.05) and did not correlate to air temperature, conductivity uncompensated, and salinity (p > 0.05) (Supplementary Table S3).
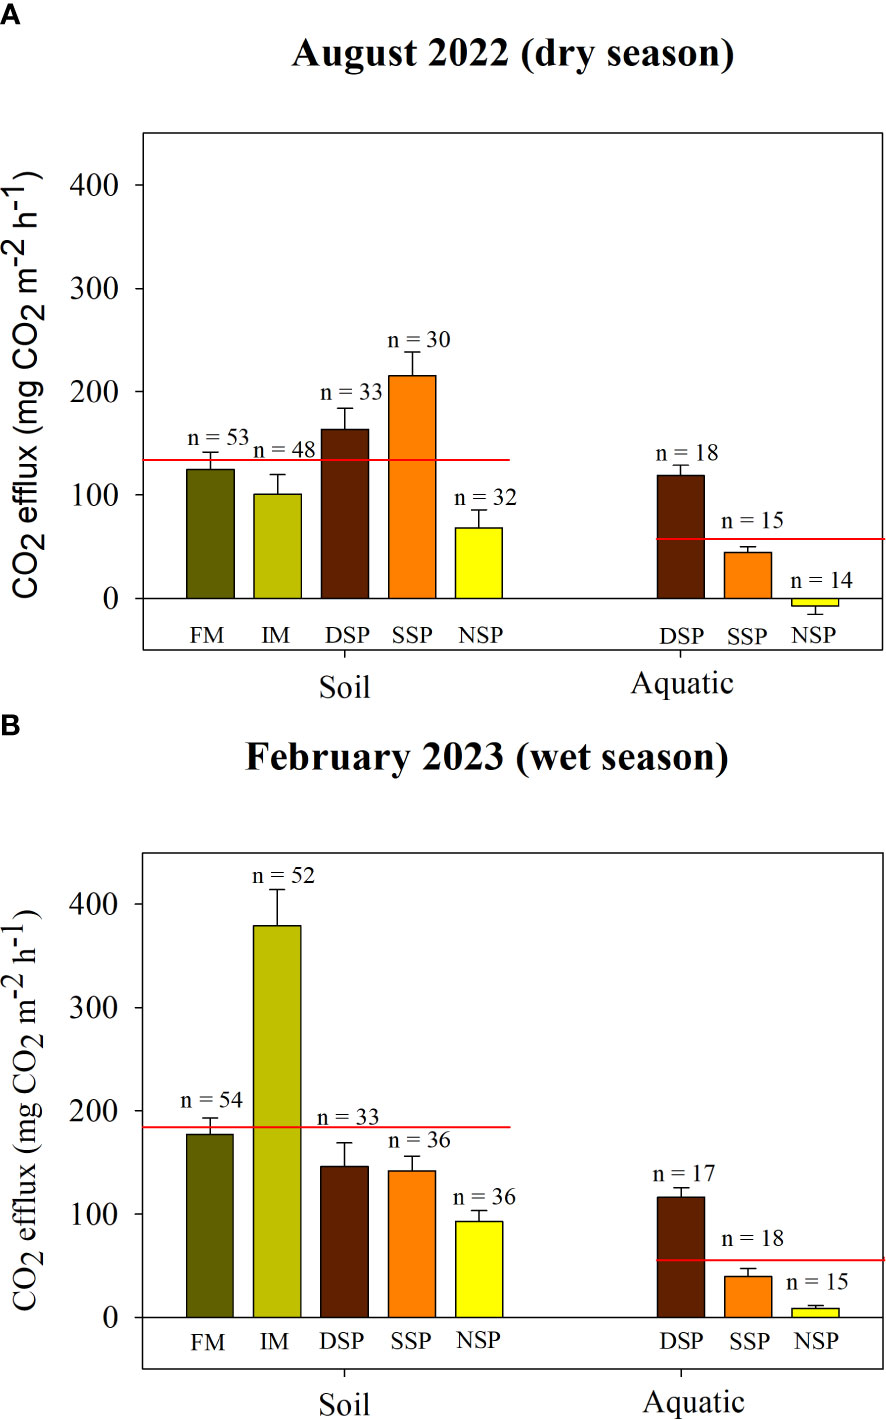
Figure 4 CO2 effluxes between soil and aquatic interfaces during (A) dry season and (B) wet season. FM, fringe mangrove; IM, interior mangroves; DSP, dense silvofishery pond; SSP, sparse silvofishery pond; and NSP, non-silvofishery pond. Red colored lines indicate the mean value.
The sparsely-populated silvofishery mangrove (SSP) had the highest soil CH4 efflux value during the dry season, at 0.12 ± 0.04 mg CH4 m-2 h-1 (Figure 5A). During the wet season, fringe mangroves had the largest soil CH4 efflux value, at 0.13 ± 0.04 mg CH4 m-2 h-1 (Figure 5B). Across both dry and wet seasons, aquatic CH4 effluxes were highest in the dense silvofishery pond (DSP). This study did not find a significant difference in soil and aquatic CH4 effluxes during the dry and wet seasons (p > 0.05). On average, across the two seasons, the fringe mangrove forest had the greatest soil CH4 efflux, at 0.13 ± 0.04 mg CH4 m-2 h-1 (or 11.13 ± 3.23 kg CH4 ha-1 yr-1). Over the two seasons, there were significant differences in average soil CH4 efflux across different land uses (p< 0.05). Looking at mean aquatic CH4 efflux values across the two seasons, these significantly differed (p< 0.05) in different land uses, ranging from -0.01 ± 0.00 mg CH4 m-2 h-1 (or -0.86 ± 0.25 kg CH4 ha-1 yr-1) in the non-silvofishery pond up to 0.38 ± 0.04 mg CH4 m-2 h-1 (or 32.94 ± 3.55 kg CH4 ha-1 yr-1) in the dense silvofishery pond (p< 0.05). Significant differences were also found in soil and aquatic CH4 effluxes (p< 0.05), with aquatic CH4 effluxes (0.17 ± 0.11 mg CH4 m-2 h-1) being larger than soil CH4 effluxes (0.06 ± 0.02 mg CH4 m-2 h-1). CH4 effluxes correlated with air pressure, air temperature, water temperature, conductivity uncompensated, soil temperature, and salinity (p< 0.05) and did not correlate to pH, conductivity compensated, and total dissolved solids (p > 0.05) (Supplementary Table S3).
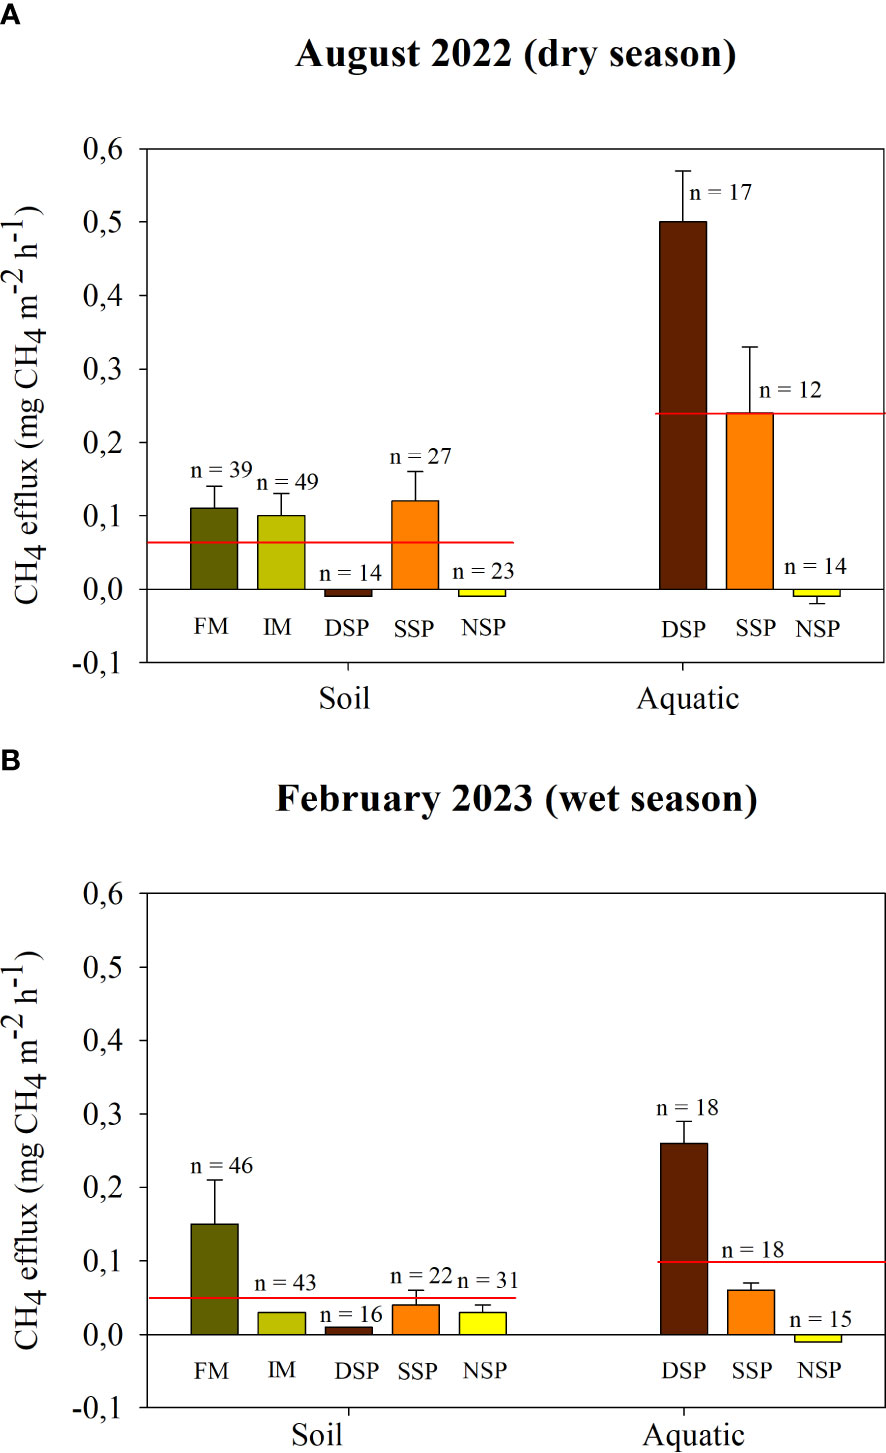
Figure 5 CH4 effluxes from the soil and aquatic interface during (A) the dry season and (B) the wet season. FM, fringe mangrove; IM; interior mangroves; DSP, dense silvofishery pond; SSP, sparse silvofishery pond; and NSP, non-silvofishery pond.
Aboveground carbon stocks (AGC), belowground carbon stocks (BGC), and soil carbon stocks data have been widely measured in Indonesia (Sharma et al., 2023). This study improved the knowledge of carbon stock information, particularly in the Pulau Dua Nature Reserve area. In both fringe and interior mangroves, TECS in this study were smaller than found in the intact mangrove area of the Mahakam Delta, Kalimantan, Indonesia (Arifanti et al., 2019). Compared to mangrove forests in Bintuni Bay, Papua, Indonesia (Murdiyarso et al., 2021) and a global synthesis of data on mangroves (Kauffman et al., 2020), the TECS of fringe and interior mangroves in this study were also smaller. Pulau Dua Nature Reserve has low species diversity and is dominated by one species, Avicennia marina (Zahro, 2023). Our data indicates that mangrove forests in our study sites potentially had less carbon storage capacity due to a lower species diversity. Bai et al. (2021) revealed that an ecosystem with high diversity and richness of mangrove species tends to have higher biomass and carbon storage capacity. Rahman et al. (2021) found that mangrove species diversity also had a positive influence on soil carbon stocks because rootcomplexity can trap more sediment and nutrients that enhance the carbon stocks. All three ponds in this study also had lower total ecosystem carbon stocks than the shrimp pond in Kalimantan (Arifanti et al., 2019). A comparison with data from these previous studies is shown in Table S4.
In this study, soil carbon stocks in the fringe and interior mangrove forests contributed up to 86.82% and 87.97% to TECS. This result is in line with previous studies (Ardhani et al., 2020; Hanggara et al., 2021) that show soil to be the largest carbon pool. Due to the significant contribution soil carbon makes to TECS, these stocks are threatened if mangrove soil is disturbed (e.g., conversion from mangrove to aquaculture pond). Sasmito et al. (2019) revealed that more than half of soil carbon stocks would be lost if mangroves were converted to aquaculture ponds. This study confirmed that mangrove conversion to aquaculture ponds decreased carbon content in the soil. It is therefore important to conserve mangrove soils. Although the soil carbon stock did not significantly differ across the five land uses, land uses with mangrove (FM, IM, DSP, and SSP) tend to have higher soil carbon stocks, which confirms that mangrove conversion negatively affects the soil and/or total ecosystem carbon stocks. Mangroves have higher carbon stocks because they can trap sediment, allowing them to accumulate carbon in the soil. The anaerobic conditions slow down the decay process so that carbon can remain locked away for a long time. Mangroves also have two sources of carbon nutrients, allochthonous and autochthonous, which increases the amount of carbon stocks. This is different in the non-silvofishery pond, which has no mangrove trees on its embankments that can store carbon stock. This study contributes further to the finding that mangrove soil is an important carbon pool. Avoiding the conversion of mangroves and reducing mangrove losses is therefore an appropriate way to mitigate climate change.
The conversion of fringe mangroves to non-silvofishery ponds results in a significant loss of soil carbon stock, up to 59.96% (SOCFD) or 48.10% (SOCFM). The conversion from interior mangrove to non-silvofishery pond also decreased C and N content. This study showed that the conversion of mangrove forests to aquaculture ponds could reduce soil carbon stocks and alter soil properties. This study had similar results to Sasmito et al. (2020) in which 60% of soil carbon stocks were lost due to mangrove conversion to aquaculture. Higher losses have occurred in Ceará State, Brazil, where TECS losses of between 58% and 82% were recorded, equivalent to 182 years of soil carbon accumulation (Kauffman et al., 2018). Greater soil carbon losses have also occurred in the Mahakam Delta, Indonesia, where losses equivalent to 226 years of soil carbon accumulation (Arifanti et al., 2019) were recorded. To minimize soil carbon stock loss, this study suggests applying silvofishery pond systems in converted mangrove areas. The conversion of fringe mangrove to a sparse silvofishery pond resulted in a soil carbon stock loss of 13.76% (SOCFM). Moreover, conversion of interior mangrove to sparse silvofishery pond gained 8.31% (SOCFD) or 6.26% (SOCFM) in soil carbon stock. This gain could have happened because the soil on the upper surface had been dredged during the pond manufacturing process; the remaining soil in the pond is therefore deep soil (probably >100 cm), which holds more soil carbon stock. Although the current depth of the DSP and NSP were 34.8 cm and 22.93 cm respectively, we argue that soil excavated during the making of the pond was >100 cm. However, this study did not quantify the biomass carbon losses, due to the absence of guidelines for measuring biomass carbon stocks in silvofishery ponds. We suggest that further studies to quantify biomass carbon lost from the conversion of mangrove to silvofishery pond could potentially improve our understanding of carbon stock losses associated with land use and land cover changes.
There have been relatively few studies into GHG effluxes in Indonesia (Murdiyarso et al., 2023). This study therefor improves the availability of GHG efflux data in Indonesia, particularly in Tier 3 (highly specific inventory-type data). Mangroves provide a wide range of benefits, one of them being in the coastal biogeochemical cycle (de Lacerda et al., 2022). Most mangrove eco-services are driven by C and N biogeochemical processes and then soil acts as a reservoir for the end products of these biogeochemical processes (Shiau and Chiu, 2020). Unfortunately, climate change threatens mangroves that in turn influences these biogeochemistry processes (de Lacerda et al., 2022). Mangroves are also threatened by land use changes, which affects the dynamics of carbon storage and greenhouse emissions (Shiau and Chiu, 2020). A recent study by de Lacerda et al. (2022) showed that there are limited studies at present about the impacts of mangrove biogeochemical processes.
In the present study, the interior mangrove forest had the largest average soil CO2 efflux across the two seasons; while the non-silvofishery pond had the lowest. Land use without mangroves may have lower soil CO2 effluxes because they have no carbon input from mangroves. This contrasts with the mangrove ecosystem, which is rich in carbon. Castillo et al. (2017) revealed that mangrove forests had CO2 effluxes up to 61.2% higher than those of non-mangrove forests. In non-mangrove forests, heterotrophic respiration contributed to total efflux. In mangrove forests, two respirations (heterotrophic and autotrophic) amount to total efflux. Heterotrophic respiration – through organic matter decomposition by microorganisms – can be exchanged into the atmosphere through soil CO2 efflux (Hien et al., 2018; Cameron et al., 2020). The high organic matter in mangrove soils also influences microbe respiration, which can intensify CO2 production (Kitpakornsanti et al., 2022). The rich soil organic matter in mangroves likewise makes soil CO2 effluxes larger than aquatic CO2 effluxes. This study assumed age may be a contributing factor in gas effluxes. The mangrove forests in this study were 40 years old and Easteria et al. (2022) found that old mangrove had double the CO2 efflux than young mangrove.
The soil CO2 efflux values in the fringe mangrove, dense and sparse silvofishery ponds were in the same range as those found by Iram et al. (2021) in Australia, which was also dominated by Avicennia marina. Fringe mangrove forests in this study emitted lower soil CO2 effluxes than the mangroves in Tanakeke, South Sulawesi, Indonesia (Cameron et al., 2019). The mangrove in Tanakeke had more diverse species of mangrove, including Rhizophora apiculata (42%), Rhizophora stylosa (30.6%), and B. gymnorrhiza (8.3%). By contrast, this study site was characterized by a monoculture, dominated by Avicennia marina. Diversity could thus be an influencing factor on GHG efflux, as was found by Padhy et al. (2020). A comparison with previous research data and findings is shown in Supplementary Table S5.
The CO2 aquatic efflux of the dense silvofishery pond was found to be the largest; this is because the density of mangrove made for higher litterfall, which contributed to the efflux. This finding is in line with Hafizi et al. (2017) and Harnanda et al. (2018) who found that denser mangrove produces more leaf litterfall. When leaf litter falls and settles in the sediment pool, the organic matter decomposes and produces gas (such as CO2) (Gruca-Rokosz et al., 2017). Organic matter from litterfall could increase CO2 emissions (Attermeyer et al., 2018); this strongly correlates with aquatic CO2 efflux (Gruca-Rokosz et al., 2017). Our efflux assessment during the dry season was simultaneous with the peak time for litterfall (Azad et al., 2020).In addition, mangroves that are characterized by anoxic conditions create low dissolved oxygen (DO) environments and thus may be a source of greenhouse gases (Page, 2022). Comparing with other studies, the average aquatic CO2 efflux of the non-silvofishery pond (across the two seasons) was lower than the value recorded for a pond in China (Xiao et al., 2021). However, the average aquatic CO2 efflux (across the two seasons) was higher for the dense- and sparse silvofishery ponds in this study compared to a Malaysian shrimp pond that applied the biofloc technology system (Manan et al., 2019). Aquatic CO2 effluxes in all three ponds in this study were also higher than a milkfish pond in South Sulawesi (Cameron et al., 2019).
The fringe mangrove forest had the greatest soil CH4 efflux average across the two seasons compared with other land uses in this study. It is possible that fringe mangrove emits more CH4 from the soil because it has rich soil organic matter imported and deposited from adjacent habitats. CH4 production by methanogen (methanogenesis) is mainly driven by organic matter availability (Al-Haj and Fulweiler, 2020). The availability of soil organic matter can reduce the methanogen competitor called methanotroph (reducing CH4 emission). In the fringe mangrove, samples were taken from a location close to the river, which provided a way for water to flow in and out of the aquaculture pond. Water flow influences nutrient run-off and aquaculture activity positively influences soil CH4 effluxes (Zheng et al., 2018). Besides anthropogenic activity, Arai et al. (2021) found other factors such as soil condition, methanogens (i.e., CH4-producing microorganisms), methanotroph (i.e., CH4-oxidizing microorganisms), and mangrove species also affected CH4 emissions.
On average across the two seasons, the dense silvofishery pond had the highest aquatic CH4 efflux, while the non-silvofishery pond had the lowest. CH4 efflux is distributed from the sediment to the water through ebullition and diffusion (Xiao et al., 2017). Ebullition is the main pathway, contributing up to 90% of total CH4 emissions (Yang et al., 2020). A study in a lake surrounded by peatland showed that broader canopy coverage enhances soil organic content, which could produce more CH4 (Zhu et al., 2016). This study aligns with the finding that silvofishery ponds with denser mangroves emit more CH4 than other land uses. The dense and sparse silvofishery ponds had larger aquatic CH4 effluxes than the shrimp pond in Karawang, West Java (Rifqi et al., 2020) (Supplementary Table S5). However, CH4 aquatic efflux at the three ponds in this study was much smaller than shrimp ponds in China (Tong et al., 2021).
Across the two seasons, soil CH4 efflux values in the three ponds were significantly larger than their aquatic efflux counterparts. This study showed a similar result to Martin et al. (2020), in which methane emissions in adjacent water were (up to 11 times) more than in mangrove soil. Rosentreter et al. (2021) found that 53% of global aquatic methane emissions came from aquatic ecosystems (e.g., rivers, lakes, coastal wetlands, ponds).
In this study, TECS did not significantly differ across the five land uses. The lowest values were found in the non-silvofishery pond, with the highest found in fringe mangrove. Soil carbon stock contributed the largest part (~87%) to TECS. The conversion of fringe mangrove to a non-silvofishery pond resulted in the largest soil carbon stock loss, up to 60%. In general, the effect of mangrove conversion on carbon stocks was soil carbon stock loss, and a decrease in carbon content. In terms of CO2 effluxes, averages across two seasons of measurement showed that interior mangrove forests emitted the largest soil CO2 efflux, while the non-silvofishery pond had the lowest soil CO2 efflux. On the other hand, the dense silvofishery pond was the greater emitter of CO2 from water to the atmosphere. The lowest aquatic CO2 efflux across two seasons of measurement was from the non-silvofishery pond. In terms of CH4 efflux, averages across two seasons showed that fringe mangrove soil had the highest efflux. The highest aquatic CH4 efflux was found in the dense silvofishery pond, while the lowest was in the non-silvofishery pond. In this study, soil and aquatic CO2 and CH4 effluxes were influenced by land use type. Land with mangrove tended to have higher carbon stocks and effluxes. The effect of mangrove conversion on carbon effluxes was a decreasing value in efflux. It is therefore important to maintain existing mangrove (e.g. through conservation). In terms of the existing aquaculture ponds, this study suggests planting mangrove trees sparsely on the embankments.
The original contributions presented in the study are included in the article/Supplementary Material. Further inquiries can be directed to the corresponding author.
MR: Conceptualization, Writing – original draft, Visualization. DM: Conceptualization, Supervision, Writing – review & editing, Validation. SS: Conceptualization, Supervision, Writing – review & editing, Validation. DA: Methodology, Writing – review & editing. JR: Methodology, Writing – review & editing. MZ: Methodology, Writing – review & editing. TA: Validation, Writing – review & editing, Methodology.
The author(s) declare financial support was received for the research, authorship, and/or publication of this article. This study was part of the Restoring Coastal Landscape for Adaptation Integrated Mitigation (ReCLAIM) Project (Grant #2020-71603), a collaborative effort between the Centre for International Forestry Research (CIFOR) and various Indonesian partners representing academia, government, and civil society, with support from the David and Lucile Packard Foundation; Forests, Trees and Agroforestry (FTA), the Research Program of the Consultative Group of International Agricultural Research (CGIAR); and Sustainable Wetland Adaptation and Mitigation Program (SWAMP) supported by United States Agency for International Development (USAID) (Contract No. 069033).
The first author sincerely thanks PT RMU for supporting with tools and guidance during efflux measurement. Thanks also go to the staff of the National Research and Innovation Agency (BRIN), Cibinong, West Java for helping with the soil carbon stock analysis, as well as to the staff of Pulau Dua Nature Reserve for permitting us to conduct research there.
The authors declare that the research was conducted in the absence of any commercial or financial relationships that could be construed as a potential conflict of interest.
All claims expressed in this article are solely those of the authors and do not necessarily represent those of their affiliated organizations, or those of the publisher, the editors and the reviewers. Any product that may be evaluated in this article, or claim that may be made by its manufacturer, is not guaranteed or endorsed by the publisher.
The Supplementary Material for this article can be found online at: https://www.frontiersin.org/articles/10.3389/fevo.2024.1340531/full#supplementary-material
Adame M. F., Connolly R. M., Turschwell M. P., Lovelock C. E., Fatoyinbo T., Lagomasino D., et al. (2021). Future carbon emissions from global mangrove forest loss. Glob Chang Biol. 27, 2856–2866. doi: 10.1111/gcb.15571
Al-Haj A. N., Fulweiler R. W. (2020). A synthesis of methane emissions from shallow vegetated coastal ecosystems. Glob Chang Biol. 26, 2988–3005. doi: 10.1111/gcb.15046
Arai H., Inubushi K., Chiu C. Y. (2021). Dynamics of methane in mangrove forest: Will it worsen with decreasing mangrove forests? Forests. 12, 1-11. doi: 10.3390/f12091204
Ardhani T. S. P., Murdiyarso D., Kusmana C. (2020). Effects of permeable barriers on total ecosystem carbon stocks of mangrove forests and abandoned ponds in Demak District, Central Java, Indonesia. Biodiversitas 21, 5298–5307. doi: 10.13057/biodiv/d211134
Arif A. M., Guntur G., Ricky A. B., Novianti P., Andik I. (2017). Mangrove ecosystem C-stocks of Lamongan, Indonesia and its correlation with forest age. Res. J. Chem. Environ. 21, 1–9. doi: 10.13140/RG.2.2.27012.78720
Arifanti V. B., Kauffman J. B., Hadriyanto D., Murdiyarso D., Diana R. (2019). Carbon dynamics and land use carbon footprints in mangrove-converted aquaculture: The case of the Mahakam Delta, Indonesia. For Ecol. Manage. 432, 17–29. doi: 10.1016/J.FORECO.2018.08.047
Arifanti V. B., Novita N., Subarno, Tosiani A. (2021). “Mangrove deforestation and CO2 emissions in Indonesia,” in IOP Conference Series: Earth and Environmental Science. 874 (IOP Publishing Ltd). International Conference of Indonesia Forestry Researchers VI 2021 - Stream 3: Enhancing Resilience Capacity of Disaster and Climate Change 7-8. (Jakarta, Indonesia: IOP Publishing Ltd). doi: 10.1088/1755-1315/874/1/012006
Attermeyer K., Catalán N., Einarsdottir K., Freixa A., Groeneveld M., Hawkes J. A., et al. (2018). Organic carbon processing during transport through boreal inland waters: Particles as important sites. J. Geophys Res. Biogeosci. 123, 2412–2428. doi: 10.1029/2018JG004500
Azad M. S., Kamruzzaman M., Paul S. K., Kanzaki M. (2020). Litterfall release, vegetative, and reproductive phenology investigation of Heritiera fomes Buch-Ham in the Sundarbans mangrove forests, Bangladesh: Relationship with environmental variables. For. Sci. Technol. 16, 105–115. doi: 10.1080/21580103.2020.1786470
Bai J., Meng Y., Gou R., Lyu J., Dai Z., Diao X., et al. (2021). Mangrove diversity enhances plant biomass production and carbon storage in Hainan Island, China. Funct. Ecol. 35, 774–786. doi: 10.1111/1365-2435.13753
Bimrah K., Dasgupta R., Hashimoto S., Saizen I., Dhyani S. (2022). Ecosystem services of mangroves: A systematic review and synthesis of contemporary scientific literature. Sustainability (Switzerland). 14, 1-16. doi: 10.3390/su141912051
Bunting P., Rosenqvist A., Hilarides L., Lucas R. M., Thomas N., Tadono T., et al. (2022). Global mangrove extent change 1996–2020: Global mangrove watch version 3.0. Remote Sens. (Basel). 14, 1-32. doi: 10.3390/rs14153657
Cameron C., Hutley L. B., Friess D. A., Munksgaard N. C. (2019). Hydroperiod, soil moisture and bioturbation are critical drivers of greenhouse gas fluxes and vary as a function of land use change in mangroves of Sulawesi, Indonesia. Sci. Total Environ. 654, 365–377. doi: 10.1016/j.scitotenv.2018.11.092
Cameron C., Hutley L. B., Munksgaard N. C., Phan S., Aung T., Thinn T., et al. (2020). Impact of an extreme monsoon on CO2 and CH4 fluxes from mangrove soils of the Ayeyarwady Delta, Myanmar. Sci. Total Environ. 760, 143422. doi: 10.1016/j.scitotenv.2020.143422
Castillo J. A. A., Apan A. A., Maraseni T. N., Salmo S. G. (2017). Soil greenhouse gas fluxes in tropical mangrove forests and in land uses on deforested mangrove lands. Catena (Amst) 159, 60–69. doi: 10.1016/j.catena.2017.08.005
Chowdhury A., Naz A., Maiti S. K. (2023). Variations in soil blue carbon sequestration between natural mangrove metapopulations and a mixed mangrove plantation: A case study from the world’s largest contiguous mangrove forest. Life. 13, 271. doi: 10.3390/life13020271
Comley B. W. T., McGuinness K. A. (2005). Above- and below-ground biomass, and allometry, of four common northern Australian mangroves. Aust. J. Bot. 53, 431–436. doi: 10.1071/BT04162
Copernicus Climate Change Service (2017). ERA5: Fifth generation of ECMWF atmospheric reanalyses of the global climate (Copernicus Climate Change Service Climate Data Store (CDS). Available at: https://cds.climate.copernicus.eu/cdsapp#!/home.
de Lacerda L. D., Ward R. D., Borges R., Ferreira A. C. (2022). Mangrove trace metal biogeochemistry response to global climate change. Front. For. Glob. Change. 5. doi: 10.3389/ffgc.2022.817992
Dharmawan I. W. S., Siregar C. A. (2008). Karbon tanah dan pendugaan karbon tegakan Avicennia marina (Forsk.) Vierh. di Ciasem, Purwakarta. Jurnal Penelitian Hutan dan Konservasi Alam. 5, 317–328. doi: 10.20886/jphka.2008.5.4.317-328
Donato D., Kauffman J., Murdiyarso D., Kurnianto S., Stidham M., Kanninen M. (2011). Mangroves among the most carbon-rich forests in the tropics. Nat. Geosci. 4), 293–297. doi: 10.1038/ngeo1123
Easteria G., Imran Z., Yulianto G. (2022). Estimasi stok karbon mangrove rehabilitasi di Pulau Harapan dan Kelapa, Taman Nasional Kepulauan Seribu, Jakarta. Jurnal Ilmu dan Teknologi Kelautan Tropis. 14, 191–204. doi: 10.29244/jitkt.v14i1.39861
Ellert B. H., Janzen H. H., VandenBygaart A. J., Bremer E. (2008). Soil Sampling and Methods of Analysis. Eds. Carter M. R., Gregorich E. G. (Boca Raton: CRC Press).
Goldberg L., Lagomasino D., Thomas N., Fatoyinbo T. (2020). Global declines in human-driven mangrove loss. Glob Chang Biol. 26, 5844–5855. doi: 10.1111/gcb.15275
Gruca-Rokosz R., Bartoszek L., Koszelnik P. (2017). The influence of environmental factors on the carbon dioxide flux across the water-air interface of reservoirs in south-eastern Poland. J. Environ. Sci. (China). 56, 290–299. doi: 10.1016/j.jes.2016.10.011
Hafizi R., Dewiyanti I., Octavina C. (2017). Produksi serasah hutan mangrove di Kuala Langsa, Provinsi Aceh: Production of mangrove forest in Kuala Langsa, Aceh Province. Jurnal Ilmiah Mahasiswa Kelautan dan Perikanan Unsyiah. 2, 556–561.
Hanggara B. B., Murdiyarso D., Ginting Y. R., Widha Y. L., Panjaitan G. Y., Lubis A. A. (2021). Effects of diverse mangrove management practices on forest structure, carbon dynamics and sedimentation in North Sumatra, Indonesia. Estuar. Coast. Shelf Sci. 259, 1-13. doi: 10.1016/j.ecss.2021.107467
Harnanda F., Rafdinal, Linda R. (2018). Komposisi dan Tingkat Kerusakan Vegetasi Hutan Mangrove di Kecamatan Sukadana Kabupaten Kayong Utara Provinsi Kalimantan Barat. Protobiont. 7, 51–60.
Hien H. T., Marchand C., Aimé J., Cuc N. T. K. (2018). Seasonal variability of CO2 emissions from sediments in planted mangroves (Northern Viet Nam). Estuar. Coast. Shelf Sci. 213, 28–39. doi: 10.1016/j.ecss.2018.08.006
Iram N., Kavehei E., Maher D. T., Bunn S. E., Rezaei Rashti M., Farahani B. S., et al. (2021). Soil greenhouse gas fluxes from tropical coastal wetlands and alternative agricultural land uses. Biogeosciences. 18, 5085–5096. doi: 10.5194/bg-18-5085-2021
Ishikura K., Hirata R., Hirano T., Okimoto Y., Wong G. X., Melling L., et al. (2019). Carbon dioxide and methane emissions from peat soil in an undrained tropical peat swamp forest. Ecosystems. 22, 1852–1868. doi: 10.1007/s10021-019-00376-8
Kauffman J. B., Adame M. F., Arifanti V. B., SChile-Beers L. M., Bernardino A. F., Bhomia R. K., et al. (2020). Total ecosystem carbon stocks of mangroves across broad global environmental and physical gradients. Ecol. Monogr. 90(November 2019), 1–18. doi: 10.1002/ecm.1405
Kauffman J. B., Bernardino A. F., Ferreira T. O., Bolton N. W., Eduardo L., Gabriel D. O. G., et al. (2018). Shrimp ponds lead to massive loss of soil carbon and greenhouse gas emissions in northeastern Brazilian mangroves. Ecol. Evol. 8, 5530–5540. doi: 10.1002/ece3.4079
Kauffman, Donato D. C. (2012). Protocols for the measurement, monitoring and reporting of structure, biomass and carbon stocks in mangrove forests (Bogor, Indonesia: Working Paper 86. CIFOR).
Kepel T. L., Ati R. N. A., Rustam A., Rahayu Y. P., Kusumaningtyas M. A., Daulat A., et al. (2019). Cadangan karbon ekosistem mangrove di Sulawesi Utara dan implikasinya pada aksi mitigasi Perubahan iklim. Jurnal Kelautan Nasional. 14, 87-94. doi: 10.15578/jkn.v14i2.7711
Kitpakornsanti K., Pengthamkeerati P., Limsakul A., Worachananant P., Diloksumpun S. (2022). Greenhouse gas emissions from soil and water surface in different mangrove establishments and management in Ranong Biosphere Reserve, Thailand. Reg. Stud. Mar. Sci. 56, 102690. doi: 10.1016/j.rsma.2022.102690
Komiyama A., Poungparn S., Kato S. (2005). Common allometric equations for estimating the tree weight of mangroves. J. Trop. Ecol. 21, 471–477. doi: 10.1017/S0266467405002476
Lovelock C. E., Atwood T., Baldock J., Duarte C. M., Hickey S., Lavery P. S., et al. (2017). Assessing the risk of carbon dioxide emissions from blue carbon ecosystems. Front. Ecol. Environ. 15, 257–265. doi: 10.1002/fee.1491
Manan H., Zhong J. M. H., Kasan N. A., Suratman S., Ikhwanuddin M. (2019). Carbon dioxide flux from intensive aquaculture shrimp farming applying biofloc system of Setiu Terengganu, Malaysia. Aquaculture. 509, 52–58. doi: 10.1016/j.aquaculture.2019.05.026
Martin R. M., Wigand C., Oczkowski A., Hanson A., Balogh S., Branoff B., et al. (2020). Greenhouse gas fluxes of mangrove soils and adjacent coastal waters in an urban, subtropical estuary. Wetlands. 40, 1469–1480. doi: 10.1007/s13157-020-01300-w/Published
Murdiyarso D., Krisnawati H., Adinugroho W. C., Sasmito S. D. (2023). Deriving emission factors for mangrove blue carbon ecosystem in Indonesia. Carbon Balance Manage. 18, 12. doi: 10.1186/s13021-023-00233-1
Murdiyarso D., Sasmito S. D., Sillanpää M., MacKenzie R., Gaveau D. (2021). Mangrove selective logging sustains biomass carbon recovery, soil carbon, and sediment. Sci. Rep. 11, 1–10. doi: 10.1038/s41598-021-91502-x
Nehren U., Wicaksono P. (2018). Mapping soil carbon stocks in an oceanic mangrove ecosystem in Karimunjawa Islands, Indonesia. Estuar. Coast. Shelf Sci. 214, 185–193. doi: 10.1016/j.ecss.2018.09.022
Padhy S. R., Bhattacharyya P., Dash P. K., Reddy C. S., Chakraborty A., Pathak H. (2020). Seasonal fluctuation in three mode of greenhouse gases emission in relation to soil labile carbon pools in degraded mangrove, Sundarban, India. Sci. Total Environ. 705, 135909. doi: 10.1016/j.scitotenv.2019.135909
Page J. (2022). Spatial variability of greenhouse gases in blue carbon mangrove ecosystem. Nova Southeastern University, Fort Lauderdale. Available at: https://nsuworks.nova.edu/hcas_etd_all/114. Master’s thesis.
Pribadi Y. H., Febrianty D., Yuningsih, Sugiyanti, Yolanda S., Halida M., et al. (2017). Buku Informasi Perubahan Iklim Provinsi Banten dan DKI Jakarta Tahun 2017. Eds. Suhardi B., Amberkahi T., Elsye E. E., Prasetyo M. R. N. (Tangerang Selatang, Indonesia: Climatology Observation Stations in Tangerang Selatan, Indonesian Agency for Meteorology, Climatology, and Geophysics).
Pricillia C. C., Patria M. P., Herdiansyah H. (2021). Environmental conditions to support blue carbon storage in mangrove forest: A case study in the mangrove forest, Nusa Lembongan, Bali, Indonesia. Biodiversitas. 22, 3304–3314. doi: 10.13057/biodiv/d220636
Dinas Lingkungan Hidup dan Kehutanan (DLHK) Provinsi Banten. (2018). Ringkasan Eksekutif Cagar Alam Pulau Dua (Serang (ID): Dinas Lingkungan Hidup dan Kehutanan (DLHK) Provinsi Banten), 1–18.
Queiroz H. M., Artur A. G., Taniguchi C. A. K., da Silveira M. R. S., do Nascimento J. C., Nóbrega G. N., et al. (2019). Hidden contribution of shrimp farming effluents to greenhouse gas emissions from mangrove soils. Estuar. Coast. Shelf Sci. 221, 8–14. doi: 10.1016/j.ecss.2019.03.011
Rahman M. M., Zimmer M., Ahmed I., Donato D., Kanzaki M., Xu M. (2021). Co-benefits of protecting mangroves for biodiversity conservation and carbon storage. Nat. Commun. 12, 1-9. doi: 10.1038/s41467-021-24207-4
Rifqi M., Widigdo B., Mashar A., Wardiatno Y. (2020). CO2 and CH4 flux from the water-air interface of three shrimp culture technologies. AACL Bioflux. 13, 605–617.
Rosentreter J. A., Borges A. V., Deemer B. R., Holgerson M. A., Liu S., Song C., et al. (2021). Half of global methane emissions come from highly variable aquatic ecosystem sources. Nat. Geosci. 14, 225–230. doi: 10.1038/s41561-021-00715-2
Sasmito S. D., Sillanpää M., Hayes M. A., Bachri S., Saragi-Sasmito M. F., Sidik F., et al. (2020). Mangrove blue carbon stocks and dynamics are controlled by hydrogeomorphic settings and land-use change. Glob Chang Biol. 26, 3028–3039. doi: 10.1111/gcb.15056
Sasmito S. D., Taillardat P., Clendenning J. N., Cameron C., Friess D. A., Murdiyarso D., et al. (2019). Effect of land-use and land-cover change on mangrove blue carbon: A systematic review. Glob Chang Biol. 25, 4291–4302. doi: 10.1111/gcb.14774
Sharma S., Ray R., Martius C., Murdiyarso D. (2023). Carbon stocks and fluxes in Asia-Pacific mangroves: Current knowledge and gaps. Environ. Res. Lett. 18, 044002. doi: 10.1088/1748-9326/acbf6c
Shiau Y. J., Chiu C. Y. (2020). Biogeochemical processes of C and N in the soil of mangrove forest ecosystems. Forests. 11, 492. doi: 10.3390/f11050492
Sparks A. H. (2018). Nasapower: A NASA POWER Global meteorology, surface solar energy and climatology data client for R. J. Open Source Software 3, 1035. doi: 10.21105/joss.01035
Sualia I. (2011). Dampa kenaiakan muka laut terhadap pengelolaan pesisir cagar alam Pulau Dua dan keterkaitan dengan kawasan penyangga di Kecamatan Kasemen Kota Serang Provinsi Banten. [Thesis]. Bogor (ID): IPB University.
Sugiatmo P. E., Pudyatmoko S., Purwanto R. H. (2023). Carbon stock at several types of mangrove ecosystems in Bregasmalang, Central Java, Indonesia. Biodiversitas. 24, 182–191. doi: 10.13057/biodiv/d240122
Syarif L. (2023). Struktur komunitas dan potensi cadangan karbon ekosistem mangrove di Pesisir Timur Jemaja Kabupaten Kepulauan Anambas. Proc. Ser. Phys. Formal Sci. 5, 293–303. doi: 10.30595/pspfs.v5i.735
Tong C., Bastviken D., Tang K. W., Yang P., Yang H., Zhang Y., et al. (2021). Annual CO2 and CH4 fluxes in coastal earthen ponds with Litopenaeus vannamei in southeastern China. Aquaculture. 545. doi: 10.1016/j.aquaculture.2021.737229
Xiao Q., Hu Z., Hu C., Islam A. R. M. T., Bian H., Chen S., et al. (2021). A highly agricultural river network in Jurong Reservoir watershed as significant CO2 and CH4 sources. Sci. Total Environ. 769, 1-11. doi: 10.1016/j.scitotenv.2020.144558
Xiao Q., Zhang M., Hu Z., Gao Y., Hu C., Liu C., et al. (2017). Spatial variations of methane emission in a large shallow eutrophic lake in subtropical climate. J. Geophys. Res. Biogeosci. 122, 1597–1614. doi: 10.1002/2017JG003805
Yamamoto Y. (2023). Living under ecosystem degradation: Evidence from the mangrove–fishery linkage in Indonesia. J. Environ. Econ Manage. 118, 1-23. doi: 10.1016/j.jeem.2023.102788
Yang P., Zhang Y., Yang H., Guo Q., Lai D. Y. F., Zhao G., et al. (2020). Ebullition was a major pathway of methane emissions from the aquaculture ponds in southeast China. Water Res. 184. doi: 10.1016/j.watres.2020.116176
Zahro M. G. (2023). Estimasi cadangan karbon ekosistem total cagar alam Pulau Dua, Banten. IPB University, Bogor. Undergraduate Thesis.
Zheng X., Guo J., Song W., Feng J., Lin G. (2018). Methane emission from mangrove wetland soils is marginal but can be stimulated significantly by anthropogenic activities. Forests. 9, 1-13. doi: 10.3390/f9120738
Keywords: carbon stock, CH4 efflux, CO2 efflux, converted mangrove, silvofishery pond
Citation: Royna M, Murdiyarso D, Sasmito SD, Arriyadi D, Rahajoe JS, Zahro MG and Ardhani TSP (2024) Carbon stocks and effluxes in mangroves converted into aquaculture: a case study from Banten province, Indonesia. Front. Ecol. Evol. 12:1340531. doi: 10.3389/fevo.2024.1340531
Received: 18 November 2023; Accepted: 05 February 2024;
Published: 26 February 2024.
Edited by:
Thomas George Bornman, South African Environmental Observation Network (SAEON), South AfricaReviewed by:
Abhiroop Chowdhury, O.P. Jindal Global University, IndiaCopyright © 2024 Royna, Murdiyarso, Sasmito, Arriyadi, Rahajoe, Zahro and Ardhani. This is an open-access article distributed under the terms of the Creative Commons Attribution License (CC BY). The use, distribution or reproduction in other forums is permitted, provided the original author(s) and the copyright owner(s) are credited and that the original publication in this journal is cited, in accordance with accepted academic practice. No use, distribution or reproduction is permitted which does not comply with these terms.
*Correspondence: Milkah Royna, cm95bmFuYW5hbWlsa2FoQGFwcHMuaXBiLmFjLmlk
Disclaimer: All claims expressed in this article are solely those of the authors and do not necessarily represent those of their affiliated organizations, or those of the publisher, the editors and the reviewers. Any product that may be evaluated in this article or claim that may be made by its manufacturer is not guaranteed or endorsed by the publisher.
Research integrity at Frontiers
Learn more about the work of our research integrity team to safeguard the quality of each article we publish.