 Chunmei Mao
 Junjun Niu*
- School of Public Administration, Hohai University, Nanjing, China
Introduction: The Yangtze River Delta is where “the Belt and Road” and China’s Yangtze River Economic Belt converge, which plays a crucial strategic location. However, with the demands of economic growth, environmental issues are frequently present in the Yangtze River Delta as a result of human and exploitation of ecological resources, and there is an urgent need to coordinate the relationship between human development and ecology.
Methods: The Yangtze River Delta region is used as the research subject, quantitatively analyzing various ecosystems within the region from three dimensions: ecosystem services value, ecological carrying capacity, and ecological footprint, and analyzing various factors that affect economic and environmental balance. Then calculate eco-compensation and its payment order based on this information, in order to build a foundation for coordinating ecological interests and safeguarding the environment in the Yangtze River Delta region.
Results and discussion: (1) Jiangsu Province was the main provider of ecosystem services in the Yangtze River Delta; the Yangtze River Delta’s three main ecosystems-waters, forests, and wetlands-accounted for 90% of the ecosystem services valued in the area and must be preserved. (2) The Yangtze River Delta as a whole belonged to an ecological deficit area, showing varying degrees of unsustainable development; In terms of ecological deficits, cultivated land and fossil energy had the worst, and both need to be treated severely. (3) The Yangtze River Delta was a region that paid ecological compensation. The payment order and total amount was 6825.596 billion yuan in Shanghai, 6412.264 billion yuan in Jiangsu, 12088.852 billion yuan in Zhejiang, and 3675.637 billion yuan in Anhui. At the same time, considering the current state of Anhui, the amount of eco-compensation can be appropriately reduced. Finally, recommendations are made based on the findings above, in order to improve the overall ecological benefits of the Yangtze River Delta region and foster ecological integration, all provincial and municipal governments should take reasonable action to reverse the ecological deficit of fossil energy and cultivated land, and also aim to achieve an ecological surplus in both land uses.
1 Introduction
Human life can never be separated from the earth, however, as the world’s population has grown and resource consumption has increased recently, human beings are faced with increasingly serious environmental problems such as water pollution and air pollution (de Groot et al., 2012; Dai et al., 2021; Wu et al., 2022), the same is true in China. Specifically, in the face of severe and complex ecological problems, the Chinese government has been seeking a balance between the economy and the environment. Sustainable development strategies were first included into national development plans in the 1994 White Paper on Population, Environment, and Development in the 21st Century(Hang, 2010), indicating that ecological sustainability will dominate China’s socioeconomic growth in the 21st century. Sustainability is actually a consensus for humans that addresses the relationship between humans and ecology (Guo et al., 2020; Silva et al., 2020; Dong et al., 2022), and ecological compensation is a tried-and-true method of resolving their conflict, which can create a positive feedback loop throughout the entire social system (Solomon et al., 2019; Li et al., 2021).
In China, government’s emphasis on the ecological environment is constantly increasing in recent years, and at the same time, the need for coordinated regional environmental development also keeps growing. In particular, the most active coastal region in eastern China is the Yangtze River Delta (Yu H. et al., 2020; Zhang et al., 2020), and it has considerable ecological and economic value due to its complex landforms and diversified ecosystems. Furthermore, given that the Yangtze River Delta’s regional integration reached the status of national strategic importance in 2018, despite the government’s efforts to promote ecological integration, it still suffers from various environmental pollution problems. Therefore, in this context, a thorough analysis of the Yangtze River Delta ecology is desperately needed, as is a determination of the conflicts between the environment and the economic, reasonably quantify ecological compensation standards, and use ecological compensation mechanisms for coordination and balance, in order to create a strong model for ecological development and encourage ecological integration across regions.
At present, ecological compensation has been recognized as one of the economic means of resource and ecological environment protection (Li, 2017; Lu et al., 2023). The initial research did not have the concept of ecological compensation, but instead focused on paying for ecosystem services (Norgaard and Jin, 2008), this is a common term used to describe socio-economic benefits (Yu X. et al., 2020). In fact, ecological compensation refers to the behavior of the beneficiary or detriment of the ecological environment to compensate the protection of environment (Zhang et al., 2021), which can not only restore the ecological function, but also maintain the balance of interests (Gastineau et al., 2021; Saboori et al., 2022), realizing the sustainability of the entire social system for the benefit of all mankind (Ding et al., 2022; Zhao et al., 2022). Therefore, the rational calculation of eco-compensation is a crucial aspect of sustainable development (Liu et al., 2022). These are the current methods of calculation: opportunity cost approach (Zhou et al., 2022), conditional value method (Mutandwa et al., 2019), ecosystem service value assessment method (Wang et al., 2021), ecological footprint methodology (Yang et al., 2022) etc. But these methods have some drawbacks, for example, research has shown that ecological compensation based exclusively on ecosystem services value is excessively high, making it impossible to implement in reality and only useful as the maximum level of compensation (Gao et al., 2019; Zhong et al., 2020). In view of the above shortcomings, the value of ecosystem service and ecological footprint is a comprehensive method proven to be able to scientifically measure ecological compensation (Xu and Zheng, 2017; Zhao et al., 2021). For example, by merging the two models, Liang et al. estimated the ecological compensation data of energy supply and demand in Ordos City and established the appropriate ecological compensation standard (Liang et al., 2015).
The value of an ecosystem in a nation or area is reflected in the ecosystem services it provides, which may be used to gauge how well the environmental quality (Hu et al., 2020). The concept of ecosystem services was first proposed in the 1960s (Helliwell, 1969), but the most representative was Daily (1997), who believes that it was the process by which ecosystems and their species maintain human life. Ouyang et al. (1999) introduced in detail ecosystem services and the accounting method of its value, pioneering the research on ecosystem services in China. Xie et al. (2008) offered a table of ecosystem service value equivalent factors applicable to China, which provided a reliable basis for subsequent studies (Lu, 2014). Later, after nearly a decade of research, Xie et al. (2015) revised it, further enhancing the accuracy of eco-compensation accounting, and it was widely applied in eco-compensation research (Gao et al., 2018).
Rees (1992) was the first to propose the concept of an ecological footprint, and Wackernagel and Rees (1997) further developed it. Ecological footprint model consists of two parts: ecological footprint and ecological carrying capacity. It is possible to assess whether resources are in deficit or surplus in various locations by measuring ecological footprint (Chen et al., 2020), providing a theoretical framework for an evaluation of sustainability (Xu et al., 2006; Yang et al., 2022), and after that, the quantity of ecological compensation may be determined by establishing a matching connection with ecosystem service values.
Based on the research above, after understanding the relevant factors such as ecological compensation mentioned above, research on the following important areas is required: What are the variations in ecosystem services’ supply-demand? What is the current state of the ecological footprint? Can environmental development be sustained? In what ways might environmental sustainability be attained going forward? In response to the aforementioned issues, the article sequentially calculates and analyzes three provinces and one city in the Yangtze River Delta’s environmental data, clarifies the ecological status, provides reference for improving the Yangtze River Delta’s ecological compensatory system, and ensures the promotion of ecological integration.
2 Materials and methods
2.1 Study area
The Yangtze River Delta region includes Jiangsu, Zhejiang, Anhui, and Shanghai, sometimes referred to as the “three provinces and one city” and including 41 cities, and is located on China’s east coast and the Yangtze River’s lower reaches. The land area is approximately 107200 km2, 105600 km2, 140100 km2, and 6300 km2 respectively, around 359200 km2 in size overall, comprising 3.74% of the land area of China. The permanent population of the Yangtze River Delta was 236.47 million as of the end of 2021. The specific research area is shown in Figure 1. The Yangtze River Delta’s climate is a subtropical monsoon climate with significant seasonality. Only the northern part of Jiangsu belongs to the transitional zone between subtropical and warm temperate monsoon climates, and also has the characteristics of southern and northern climates. In addition, with lakes and rivers interspersed throughout, the Yangtze River Delta area boasts a dense water network, making it the area in China with the largest density of river networks. Agriculture has always been developed, commonly known as “Su Lake is ripe, the world is full”. Jiangsu and Anhui are also major agricultural provinces in China, and are one of China’s primary grain-producing regions. In 2021, 12.52% of the country’s total grain production was produced in the Yangtze River Delta. In addition, there are plenty of mudflat and wetland resources in the coastal regions, such unique natural geographical conditions also provide a good resource and environmental basis for the Yangtze River Delta’s development.
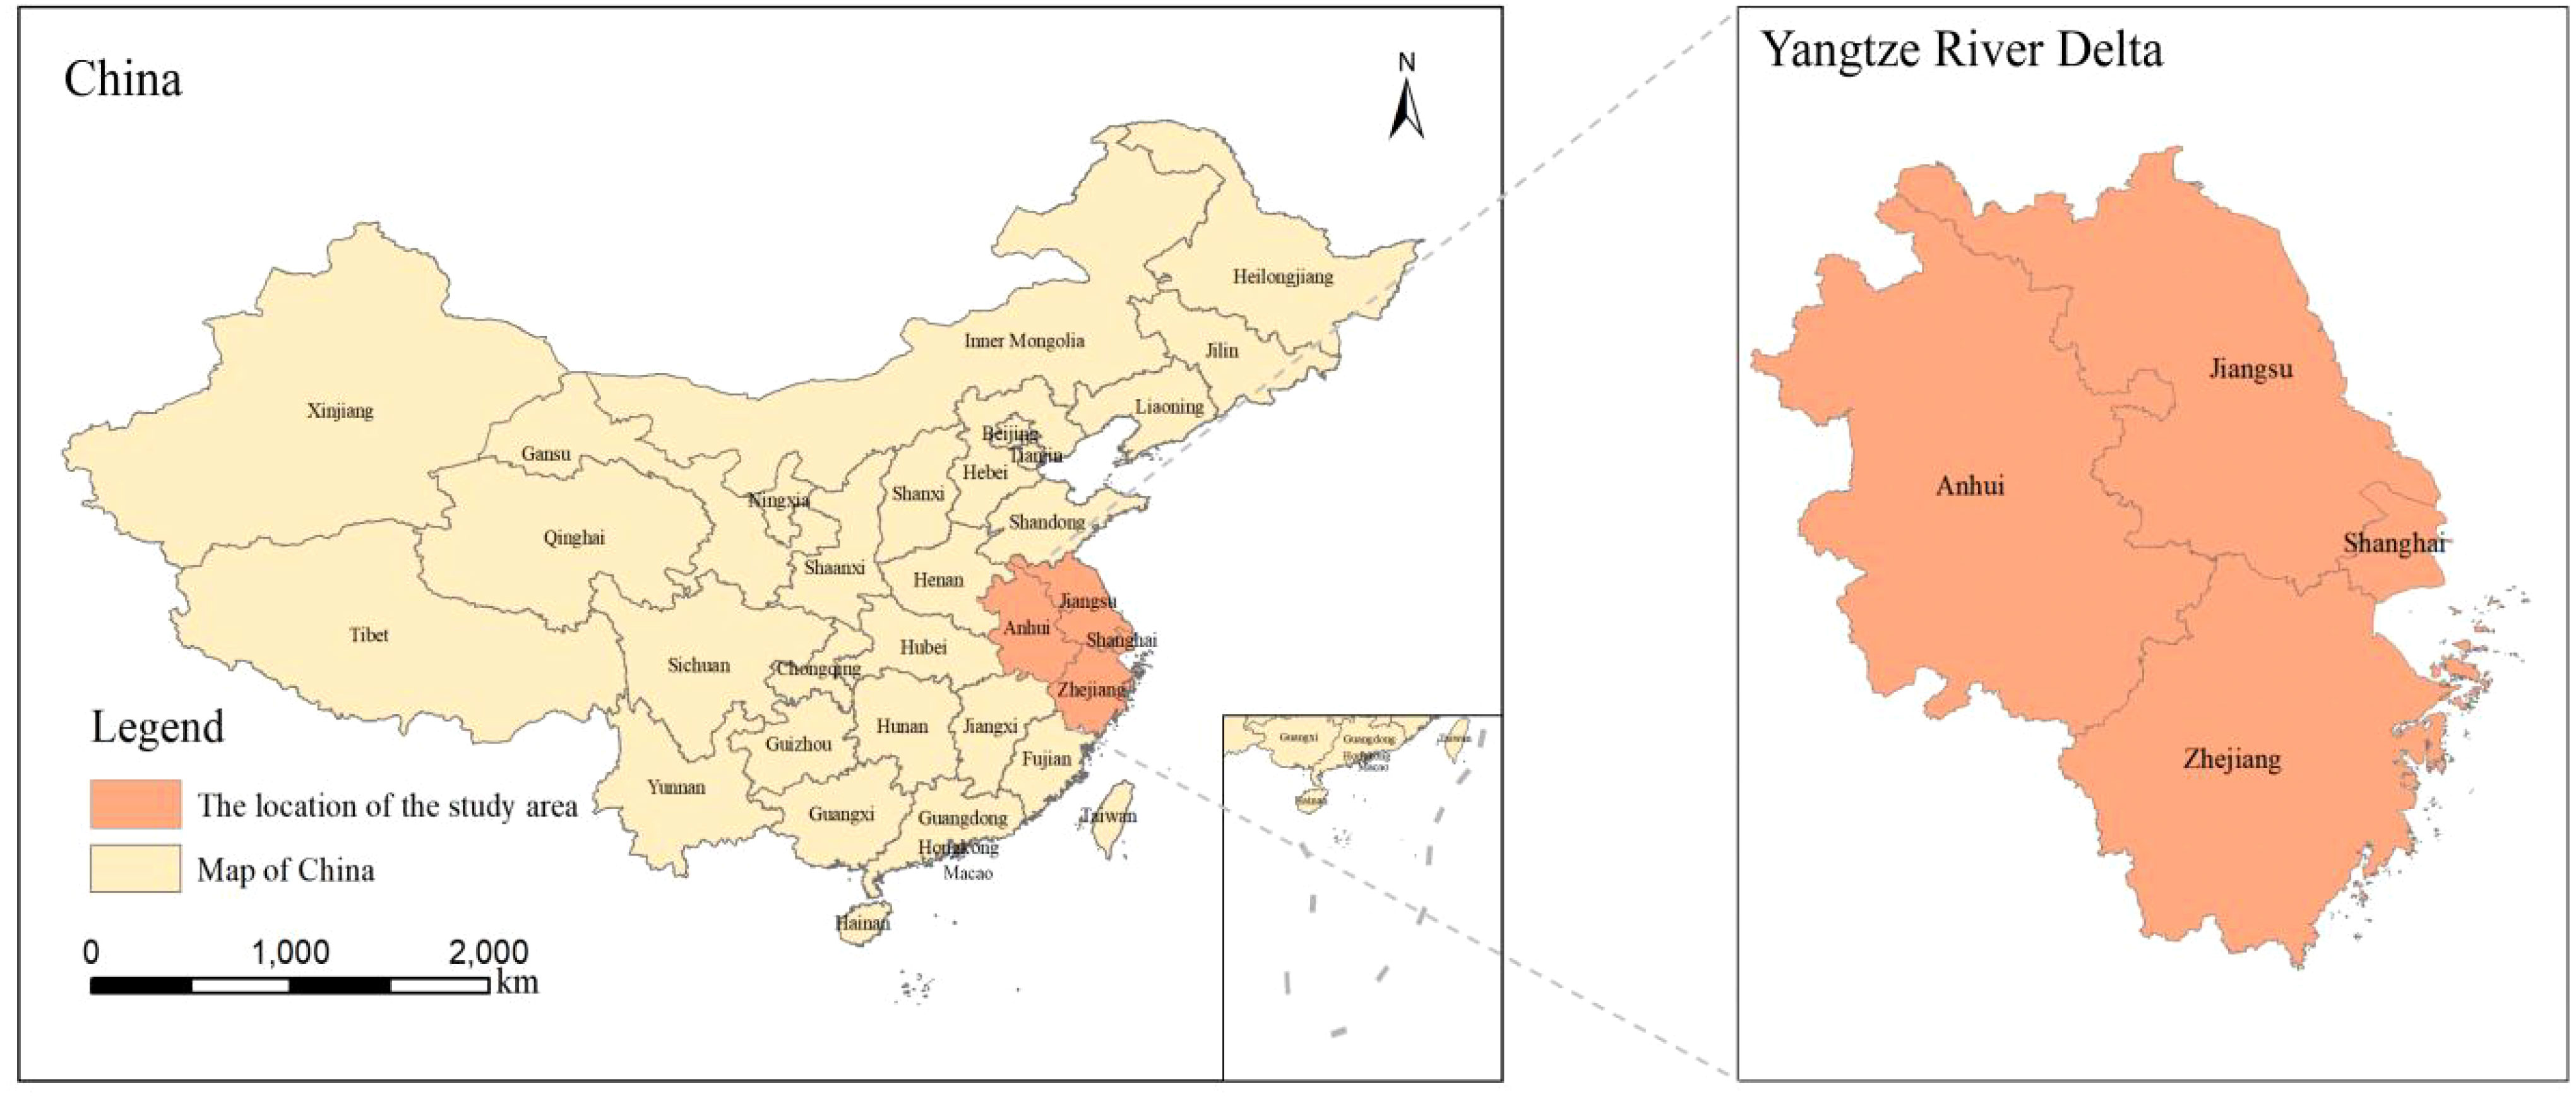
Figure 1 Map of China and the Yangtze River Delta region.
2.2 Research methods
2.2.1 Ecosystem services’ value
The equivalent factor assessment method multiplies the total area of ecosystem with the equivalent factor value per unit area (Jia et al., 2021; Kang et al., 2022). It was introduced at the close of the previous century by the researcher Costanza et al. (1997). Following this, researchers Xie and colleagues employed this technique to carry out empirical studies in 2008 and 2015, respectively, building upon Costanza’s findings and gradually improving the approach that is suitable for China (Xie et al., 2008; Xie et al., 2015). Numerous domestic academics have refined and confirmed this procedure throughout time, and it has now become a thorough and widely used accounting approach (Yu et al., 2023).
The article adopts equivalent factor approach to calculate the Yangtze River Delta’s ecosystem service value, based on the large scale and difficult access to ecological data in the region. Referring to Xie and other scholars’ latest research findings in 2015 (Xie et al., 2015), a factor table was established through localized adjustments. At the same time, due to the geographical proximity of each region of the Yangtze River Delta, the natural environment, climate conditions, and land types are similar, the equivalent factor table for the three provinces and one city remains consistent. In order to adapt to the findings of researchers like Xie et al. (2015), the article divides the Yangtze River Delta ecosystem into 11 categories, as shown in Table 1.
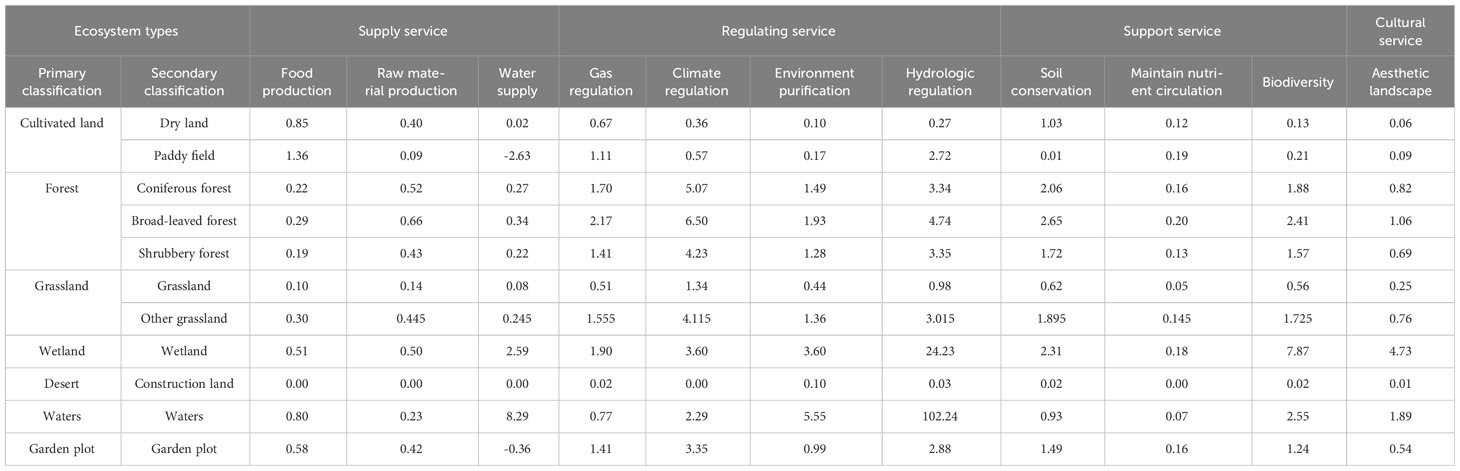
Table 1 An equivalent factors table for the Yangtze River Delta’s ecosystem services value.
2.2.1.1 Coefficient of ecosystem services value
The term “ecosystem services value per unit of land” refers to the economic value generated by growing organic grains on a hectare of farmland annually (Xie et al., 2008). Researchers have shown that, in the absence of human involvement, the market value of food produced by a region per unit of cropland is only one-seventh of the value of the ecological services that initially produced with human involvement (Zhang et al., 2022). As a result, the calculation process has been displayed in Equation 1.
Ea is an acronym for ecosystem services value per unit area, yuan/hm2; n indicates grain types, namely wheat, rice and corn, and the value ranges from 1 to 3; i refers to specific grains; the region’s planting area for the i-th variety of grain is mi, hm2; the average price of the i-th type of grain in the nation is pi, yuan/kg; the region’s i-th type of grain’s unit area yield is qi, kg/hm2; M is the entire area in the region where n grains have been sown, hm2.
2.2.1.2 The total value of ecosystem services
The ecosystem services’ overall worth is calculated as shown in Equation 2.
In the formula, the overall value of type i service functions in a type j ecosystem is denoted by ESVij, stated in Hundred million yuan; i-th service function in the j-th ecosystem is called eij; the type of ecological service function that is i; j represents the kinds in the ecosystem; Aj displays the j-th ecosystem kind’s area.
2.2.2 Ecological footprint
The ecological footprint, which mostly consists of the footprints of biological and energy resources, shows how much natural resources local residents require for both survival and productivity. Because actual consumption items of these two footprints are different, their calculation methods are also different, and in the specific calculation, the quantity of resources used by humans is mainly converted by coefficient and multiplied by an equilibrium factor, so as to obtain six different types of biologically productive land areas, which reveal the local human activities’ ecological imprint.
2.2.2.1 Ecological footprint of biological resources
Through the arrangement of relevant data in the “China Statistical Yearbook” and the corresponding statistical yearbooks of the three provinces and one city that make up the Yangtze River Delta. Table 2 below lists the consumption items of each type of land.
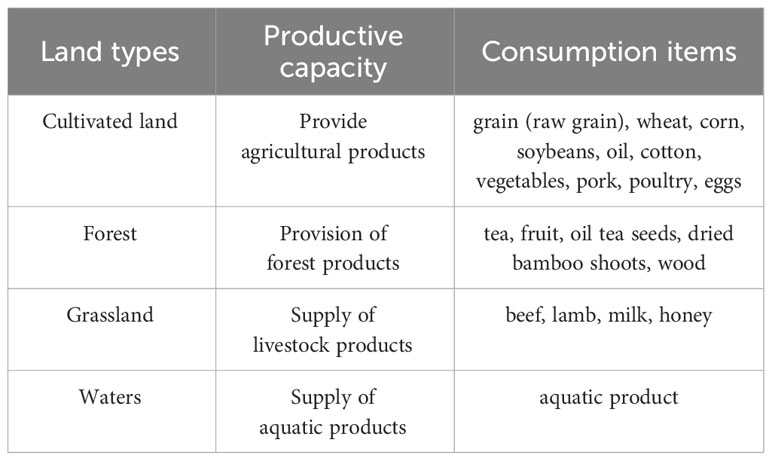
Table 2 Biological resource consumption items in the Yangtze River Delta.
The calculation process of ecological footprint of biological resources is displayed in Equation 3.
EF displays the whole footprint of biological resources, hm2; ecological footprint per individual is represented by the letter ef, hm2; the whole population is represented by N; i is a representation of the consumer goods category; the average production capacity of i-th item of consumption is denoted by pi, kg/hm2; ci is the per capita consumption of type i consumption item, kg; the factor of equilibrium is ri, it is founded on research findings from scholars such as Liu and Li (2010).
2.2.2.2 Ecological footprint of energy resources
The items that are consumed by energy resources are displayed in Table 3 below.
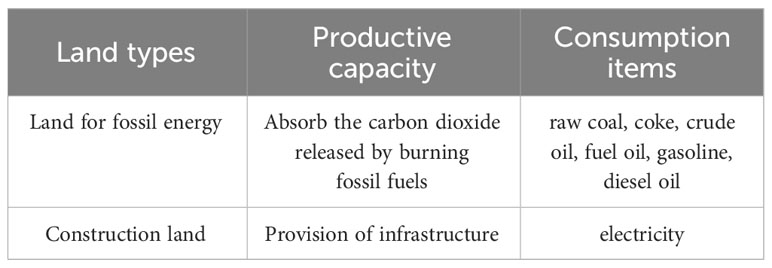
Table 3 Energy resource consumption items in the Yangtze River Delta.
Equation 4 illustrates the calculating procedure for the energetic resources’ ecological footprint.
In the formula, the region’s energy consumption is t; r is the energy conversion coefficient; the average worldwide energy footprint is denoted by E, GJ/hm2, and pertinent data is displayed in Table 4 below (Wackernagel et al., 2002).
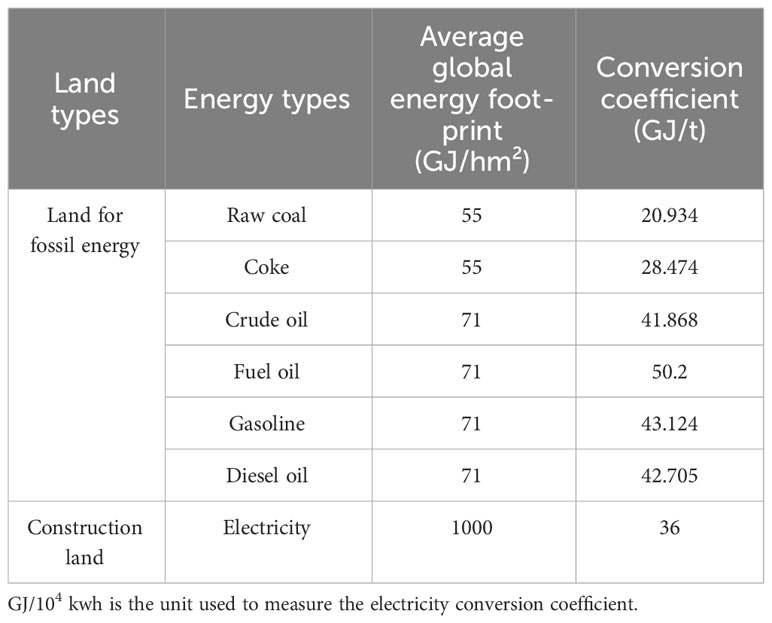
Table 4 The global energy footprint on average and conversion coefficient.
2.2.3 Ecological carrying capacity
Ecological carrying capacity is the term used to describe the ability of the environment to provide resources. Cultivated land, forest, grassland, waters, and construction land are the various types of land that can offer valuable resources. The conversion of different land areas into ecological carrying capacity is achieved by utilizing adjustment factors, specifically equilibrium factors and yield factors. The specific calculation is listed in Equation 5.
The formula includes the variables: EC representing the ecological carrying capacity overall in hm2; N representing the total population; ec representing the per-person ecological carrying capacity in hm2; yj representing the yield factor, rj representing the equilibrium factor, and aj representing the per-person land area in hm2. The yield factor pertains to research carried out by Liu et al. (2010). Moreover, when determining the ecological carrying capacity for the region, it is necessary to deduct 12% of the designated biodiversity area, leading to an ecological carrying capacity of 88% EC (Yang et al., 2022).
2.2.4 Ecological compensation
2.2.4.1 Determination of obtaining or paying ecological compensation
Equation 6 reveals that the decision to acquire or provide ecological compensation in a region relies on the assessment of ecological footprint and ecological carrying capacity.
The formula involves obtaining or paying for ecological compensation, denoted by I; the complete ecological footprint is represented by EF, measured in hm2; EC refers to the overall ecological carrying capacity, also measured in hm2.When EC is greater than EF, it signifies that the level of resource utilization in the area does not surpass the available supply, which promotes the sustainable growth of the region and warrants ecological compensation; Conversely, when EC is less than EF, it indicates insufficient resource supply to meet the region’s demands, which hampers sustainable development and necessitates ecological compensation; Lastly, when EC equals EF, it signifies a state of ecological equilibrium in the region, where no ecological compensation is exchanged.
2.2.4.2 Priority of ecological compensation
When paying or receiving compensation, it is important to consider the full impact of ecological compensation on economic development, taking into account the varying economic levels in different regions. Therefore, in order to ensure the coordination between regional economy and ecology, it is crucial to arrange the payment order reasonably. The formula in question is given in Equation 7.
The formula includes ECPS which denotes the ecological compensation priority; VALn represents the non-market value of ecosystem services per unit area in yuan/hm2; GDPn is the gross regional product per unit area in yuan/hm2.
In areas where ecological compensation is mandatory, if ecological compensation’s priority is not significant, it indicates that the impact on their own development after paying ecological compensation is relatively small, and priority should be given to paying ecological compensation; In areas where ecological compensation is required, if the priority is given high, it indicates that the area will benefit its own development after receiving ecological compensation, and priority should be given to obtaining ecological compensation.
2.2.4.3 Ecological overload index
The percentage of ecological carrying capacity that differs between ecological carrying capacity and ecological footprint is known as the ecological overload index.
(Wackernagel, 1999), which may illustrate how supply and demand for area resources are related, demonstrate the extent to local ecological environment utilization. Equation 8 represents the specific formula.
Where, EFI stands for ecological overload index; EC refers to the overall ecological carrying capacity, measured in hm2; the complete ecological footprint is represented by EF, also measured in hm2; When the ecological overload index exceeds zero, it signifies an abundance of regional resources, with a higher value indicating a greater surplus; Conversely, when the ecological overload index falls below zero, it suggests excessive utilization of regional resources; A value of zero for the ecological overload index represents an ecological equilibrium.
2.2.4.4 Ecological compensation correction coefficient
The increased human understanding of ecological benefits and ability to pay for them is expressed in this study using Li (2002) S-curve of Peel growth. The degree of socioeconomic development and living standards is measured by the Engel coefficient, and ecological compensation for a given region is revised. The formula in question is presented in Equations 9 and 10.
The ecological compensating correction coefficient in the formula is denoted as l; En represents the combined Engel coefficient for urban and rural areas, with e being a constant; The Engel coefficient for rural areas is Ex, while the Engel coefficient for urban areas is Ec; The level of urbanization is represented by θ. According to the equation, if En is smaller, there will be a greater level of regional socio-economic development and individual living standards. Additionally, a higher value for l suggests a greater willingness to provide compensatory payments.
2.2.4.5 Ecological compensation amount
Hence, this research paper establishes a link between environmental services value and the ecological footprint through the utilization of the ecological overload index. Additionally, it adjusts for the level of economic advancement in the region and ultimately computes the quantity of ecological compensatory payments (Zhang et al., 2015). Equation 11 represents the precise formula.
The formula includes E, which represents the ecological compensatory payments that the region needs to give or receive, measured in billions of yuan; The ecological service value, or ESV, also measured in billions of yuan; The ecological overload index is referred to as EFI, and l is the ecological compensatory correction coefficient.
2.3 Data sources
Data are sorted out according to the accounting content, specifically as follows:
The value of ecosystem services is determined by the area of each ecological type, which can be found in the 2022 China Statistical Yearbook and the Third National Land Survey data. Additionally, grain production and area information can be obtained from the 2022 China Statistical Yearbook and the respective Statistical Yearbooks of the three provinces and one city in the Yangtze River Delta. The grain price data can be obtained from the Price Monitoring Center of the National Development and Reform Commission.
Ecological footprint: The population figures (according to the Statistical Yearbooks of the three provinces and one city in the Yangtze River Delta for the year 2022); According to the 2022 China Statistical Yearbook, the consumption of biological resources per individual can be obtained, as well as partial resource consumption according to the China Ministry of Agriculture and Rural Affairs, is reported; The biological resources’ output and area (Statistical Yearbooks of the three provinces and one city in the Yangtze River Delta in 2022, Forestry Professional Knowledge Service System, and Summary of Agriculture and Rural Statistics in China); In 2022, the per capita utilization of energy resources was recorded in the Statistical Yearbooks of the three provinces and one city in the Yangtze River Delta.
In 2022, the Statistical Yearbooks of the three provinces and one city in the Yangtze River Delta provide data on ecological compensatory payments, including rural and urban Engel coefficients, the rate of urbanization, and the gross domestic product of the region.
3 Results and discussion
3.1 Valuation analysis of ecosystem services
Relevant data on grains can be obtained from the National Price Monitoring Center and the Statistical Yearbook of the three provinces and one city, as per the information provided. Next, by applying formula 1, it is possible to compute the unit area worth of ecosystem services. Table 5 below displays the specific results.
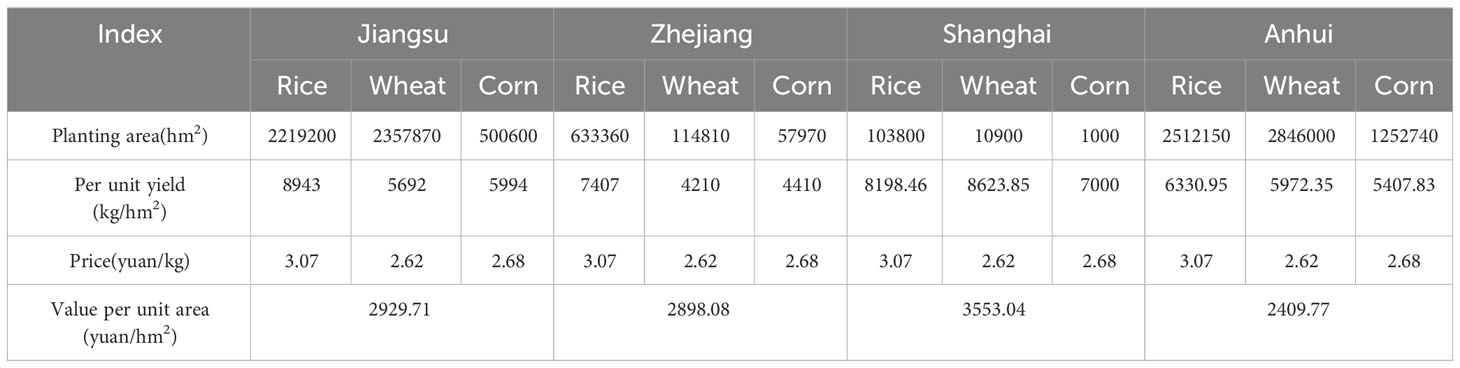
Table 5 Unit area value of the Yangtze River Delta’s ecosystem services in 2021.
From the above table, it can be seen that the unit area value of ecosystem services in the Yangtze River Delta’s three provinces and one city in 2021 was 2929.71 yuan/hm2 in Jiangsu, 2898.08 yuan/hm2 in Zhejiang, 3553.04 yuan/hm2 in Shanghai, and 2409.77 yuan/hm2 in Anhui. Subsequently, utilizing the area of each ecosystem, formula 2 can be employed to compute the value of the ecological service function associated with different categories of ecosystems. The specific outcomes are displayed in Table 6. The research results will be analyzed from two perspectives: ecosystem type and ecosystem service function.
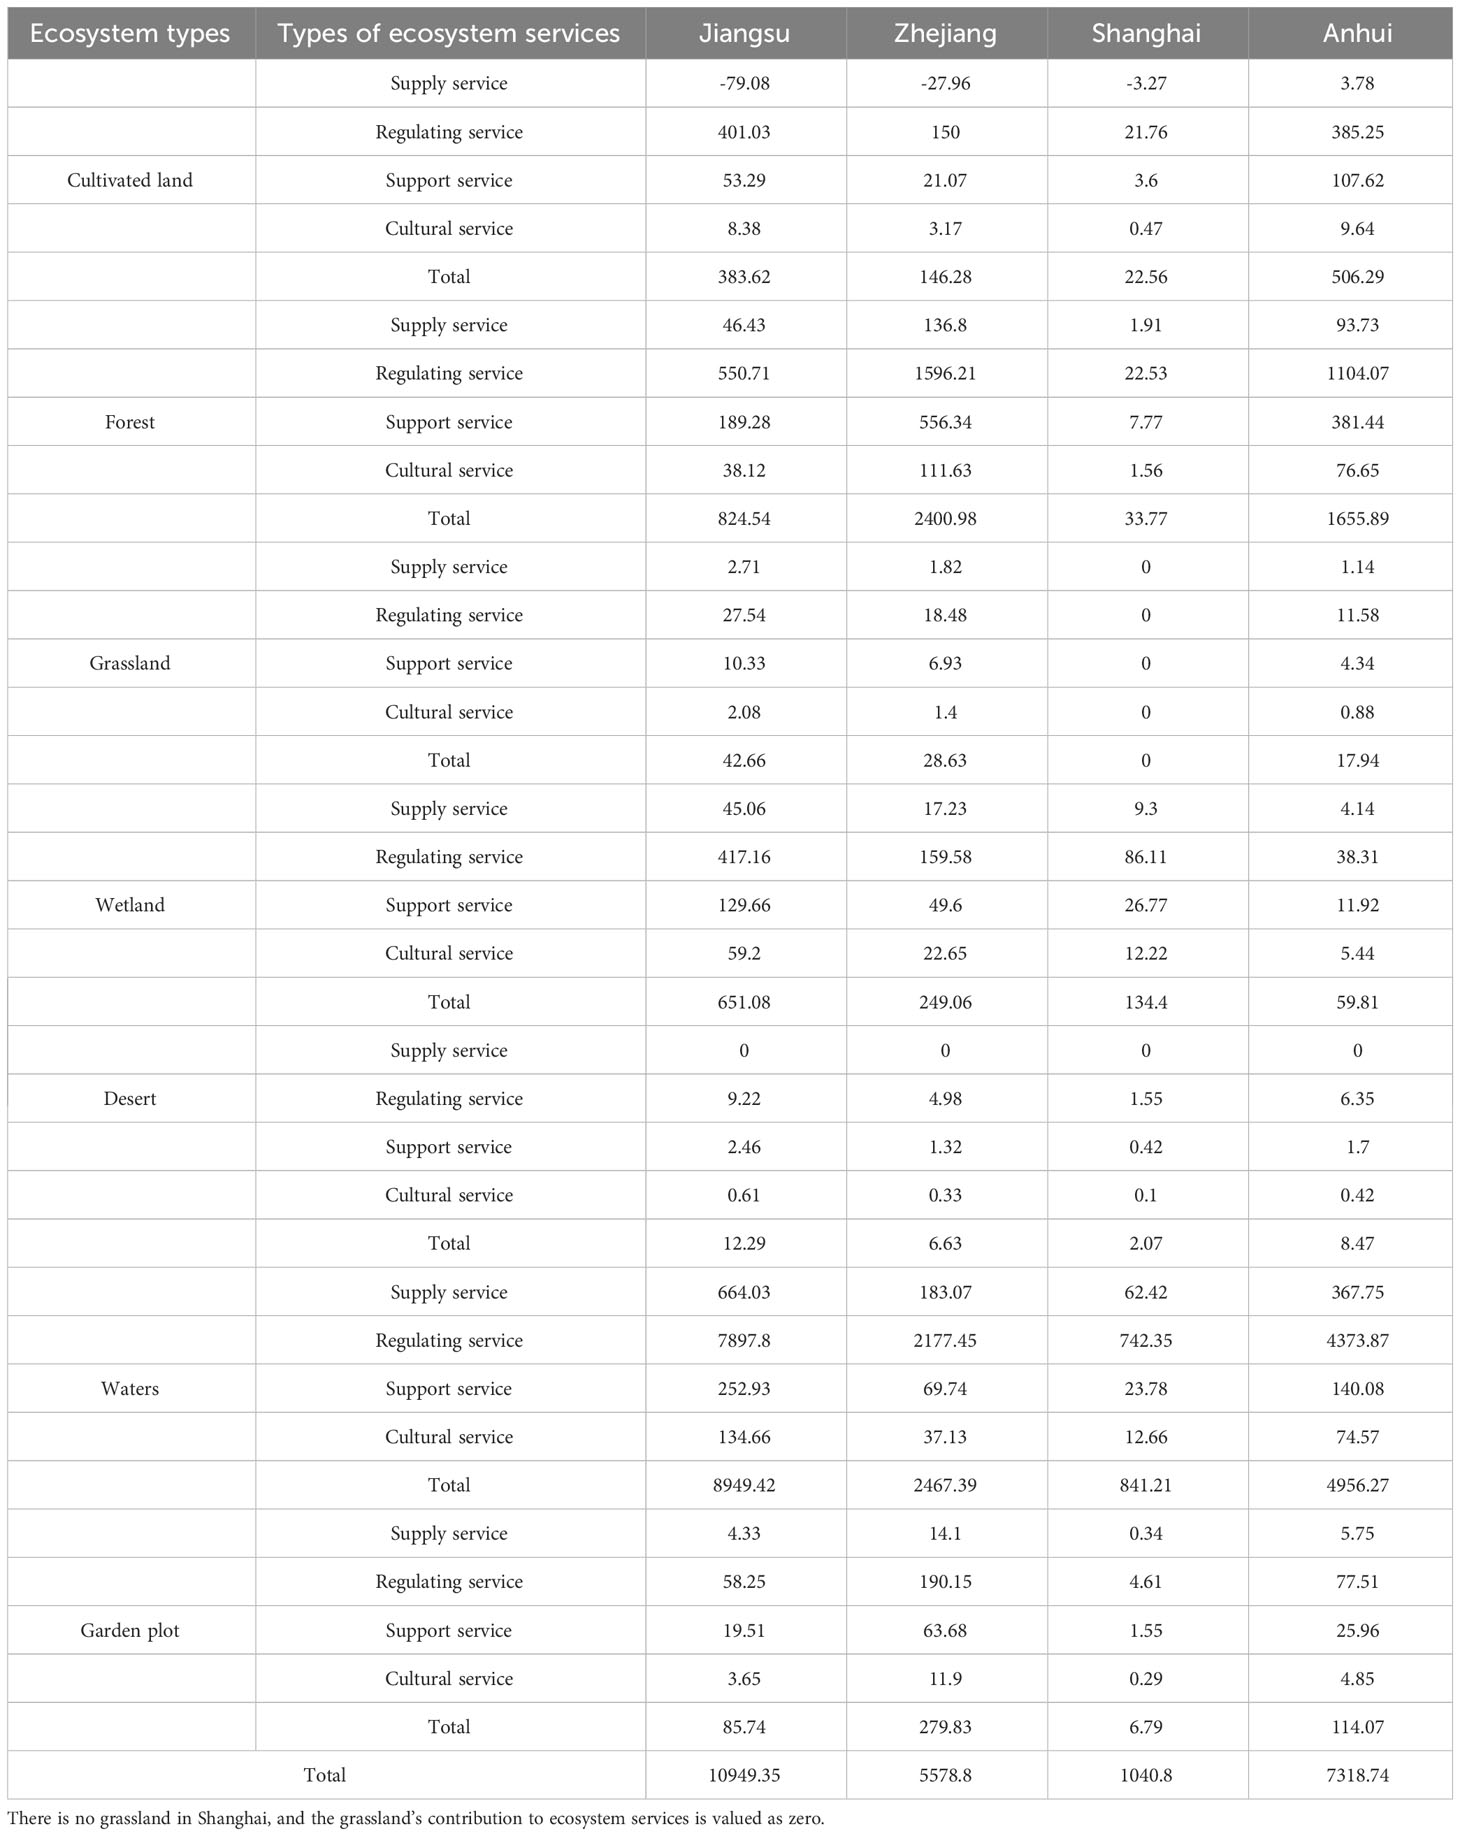
Table 6 Value of ecosystem services overall in the Yangtze River Delta region in 2021 (unit:100 million yuan).
3.1.1 Analysis of ecosystem types
Jiangsu Province’s ecosystem services were worth 1094.935 billion yuan in total in 2021. Water ecosystem accounted for the largest share, at 81.73%, in terms of the value of services offered among various ecosystem types. Because of Jiangsu’s high rate of urbanization, the quantity of forests, wetlands, and cultivated land was relatively small, and their ecosystem service value accounted for less than 10%. Nevertheless, the desert, grassland, and garden plot offered a remarkably meager service value, constituting less than 1%. Although the service value provided by forest was relatively low, it was also second only to water bodies. Hence, the major share of Jiangsu Province’s ecosystem service value came from its forests and water resources, particularly in the latter, which covered 22.69% of the entire area of land in the province and 81.73% of its ecosystem service value. Please refer to Figure 2 for details.
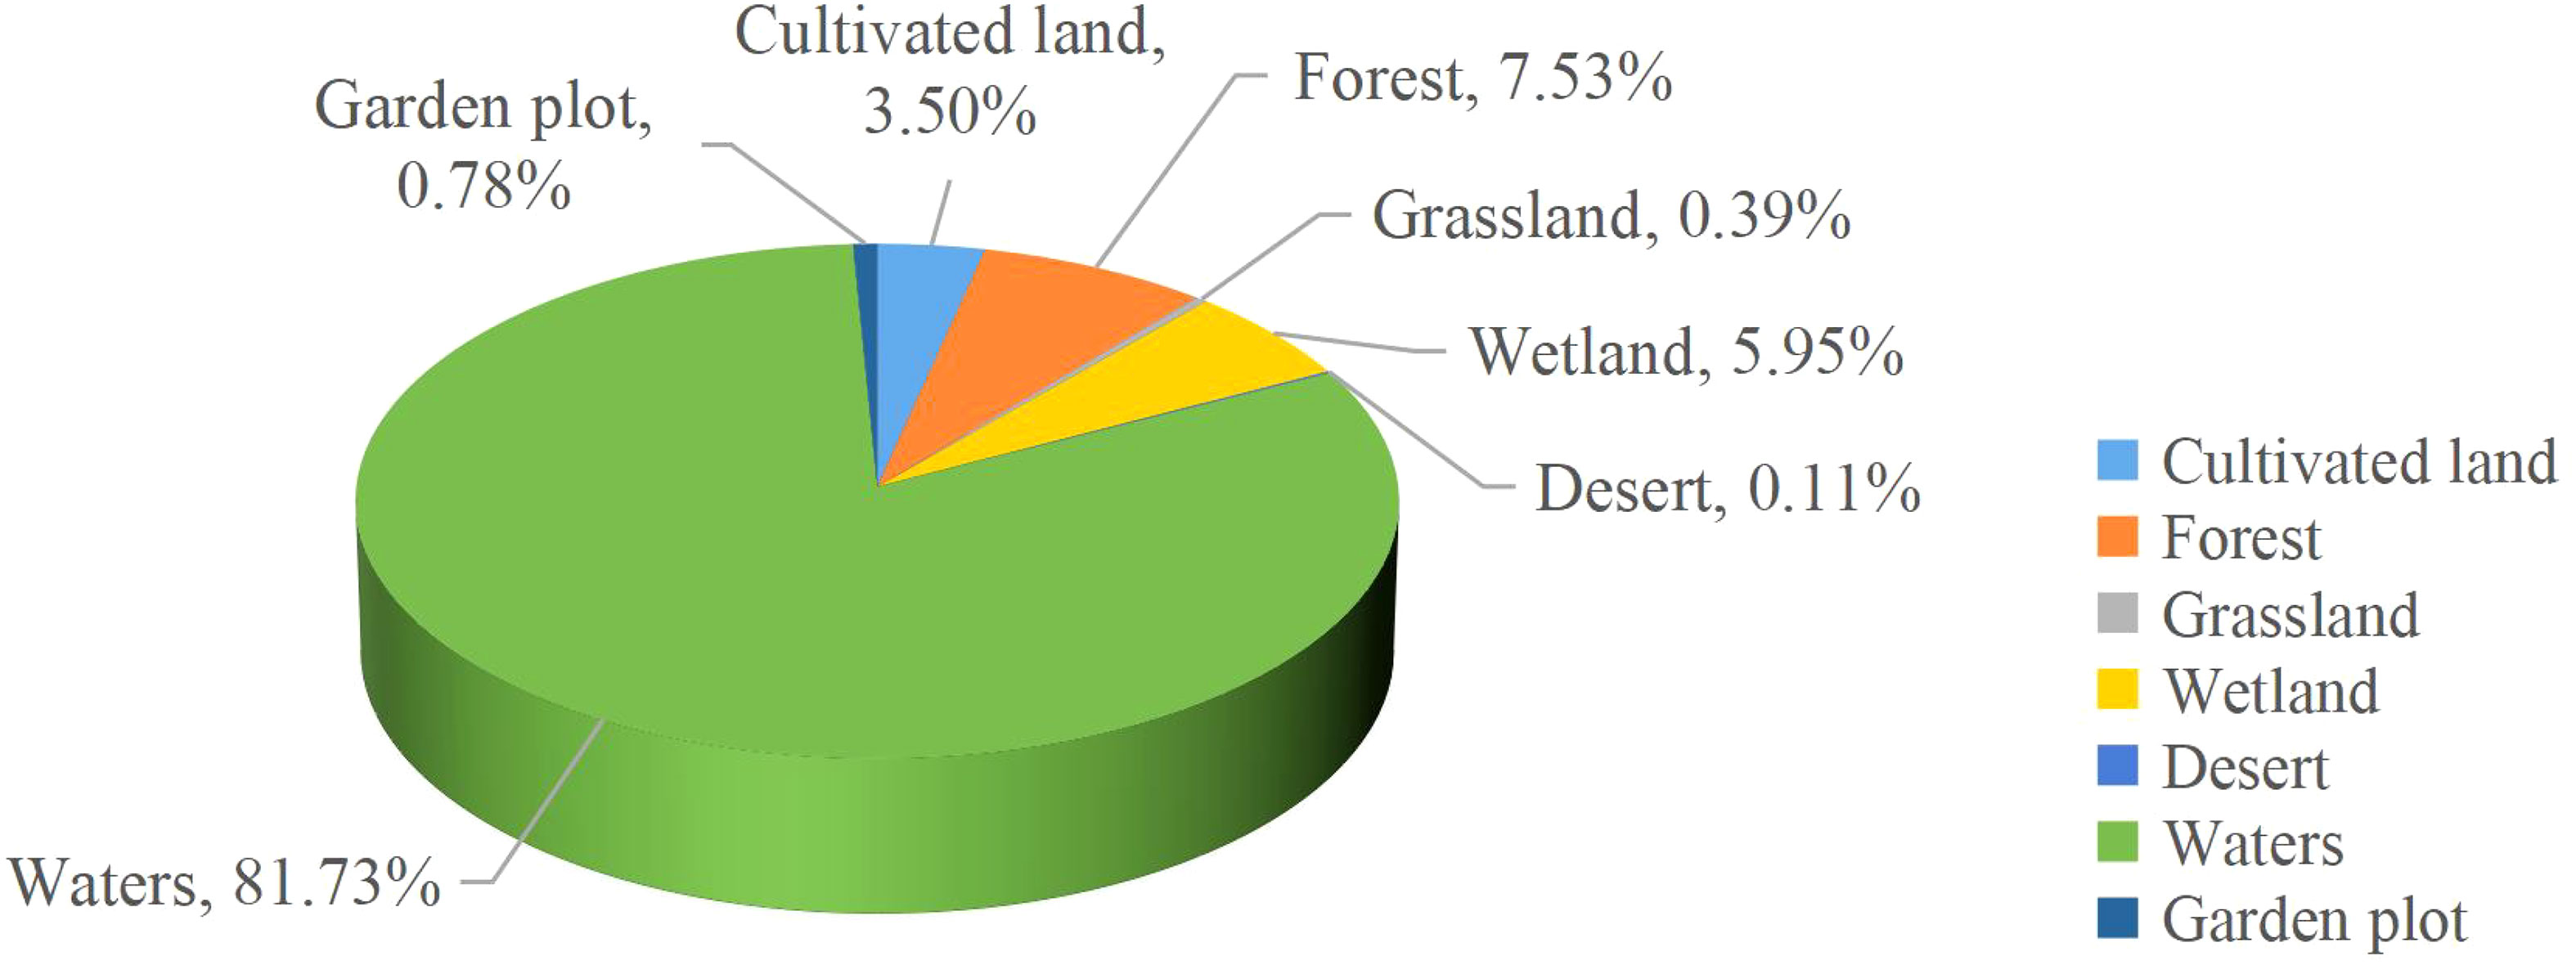
Figure 2 Structural analysis of ecosystem types in Jiangsu Province.
Ecosystem services in Zhejiang were valued at 557.88 billion yuan in 2021. The services provided by forest and water ecosystems were valued similarly, making up 44.23% and 43.04%, respectively. They were two major ecosystems in Zhejiang that provide service value. However, due to the relatively small area of garden plot, wetland, and cultivated land, their service value accounted for a relatively low proportion (5.02%, 4.46%, and 2.62%). Grassland and desert accounted for less than 1%. Figure 3 illustrates the specific data.
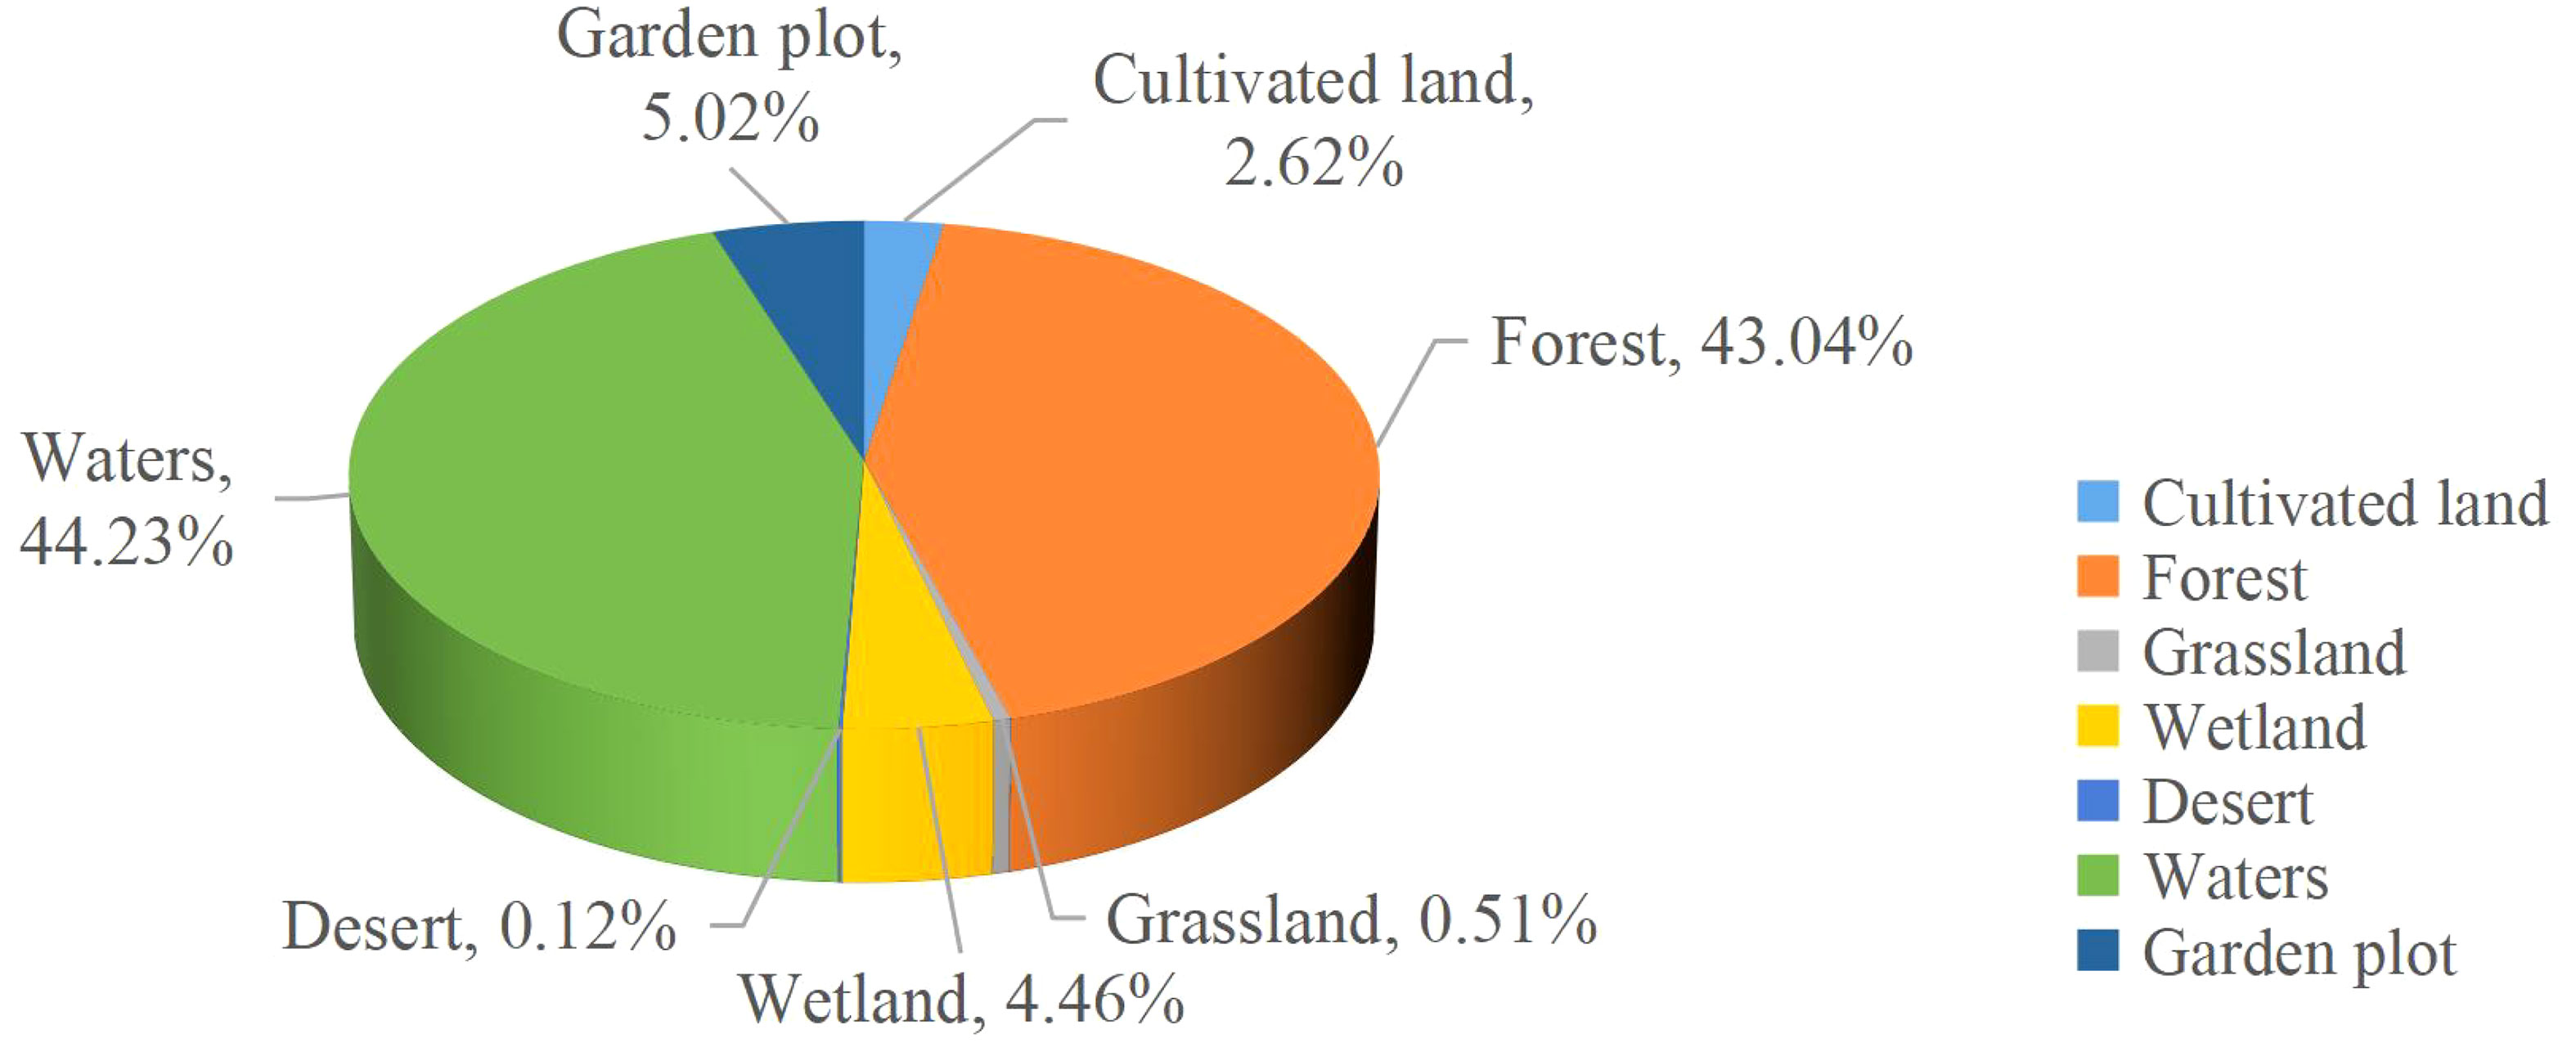
Figure 3 Structural analysis of ecosystem types in Zhejiang Province.
Shanghai’s ecosystem services were worth 104.08 billion yuan in total in 2021. The services offered by waters and wetland had a relatively high value (80.82% and 12.91%), followed by forest and cultivated land (3.24% and 2.17%), while the service value of garden plot and desert accounted for less than 1%. Due to differences in geographical location and ecological environment, there was no grassland in Shanghai, so grassland did not provide service value. Figure 4 illustrates the specific results.
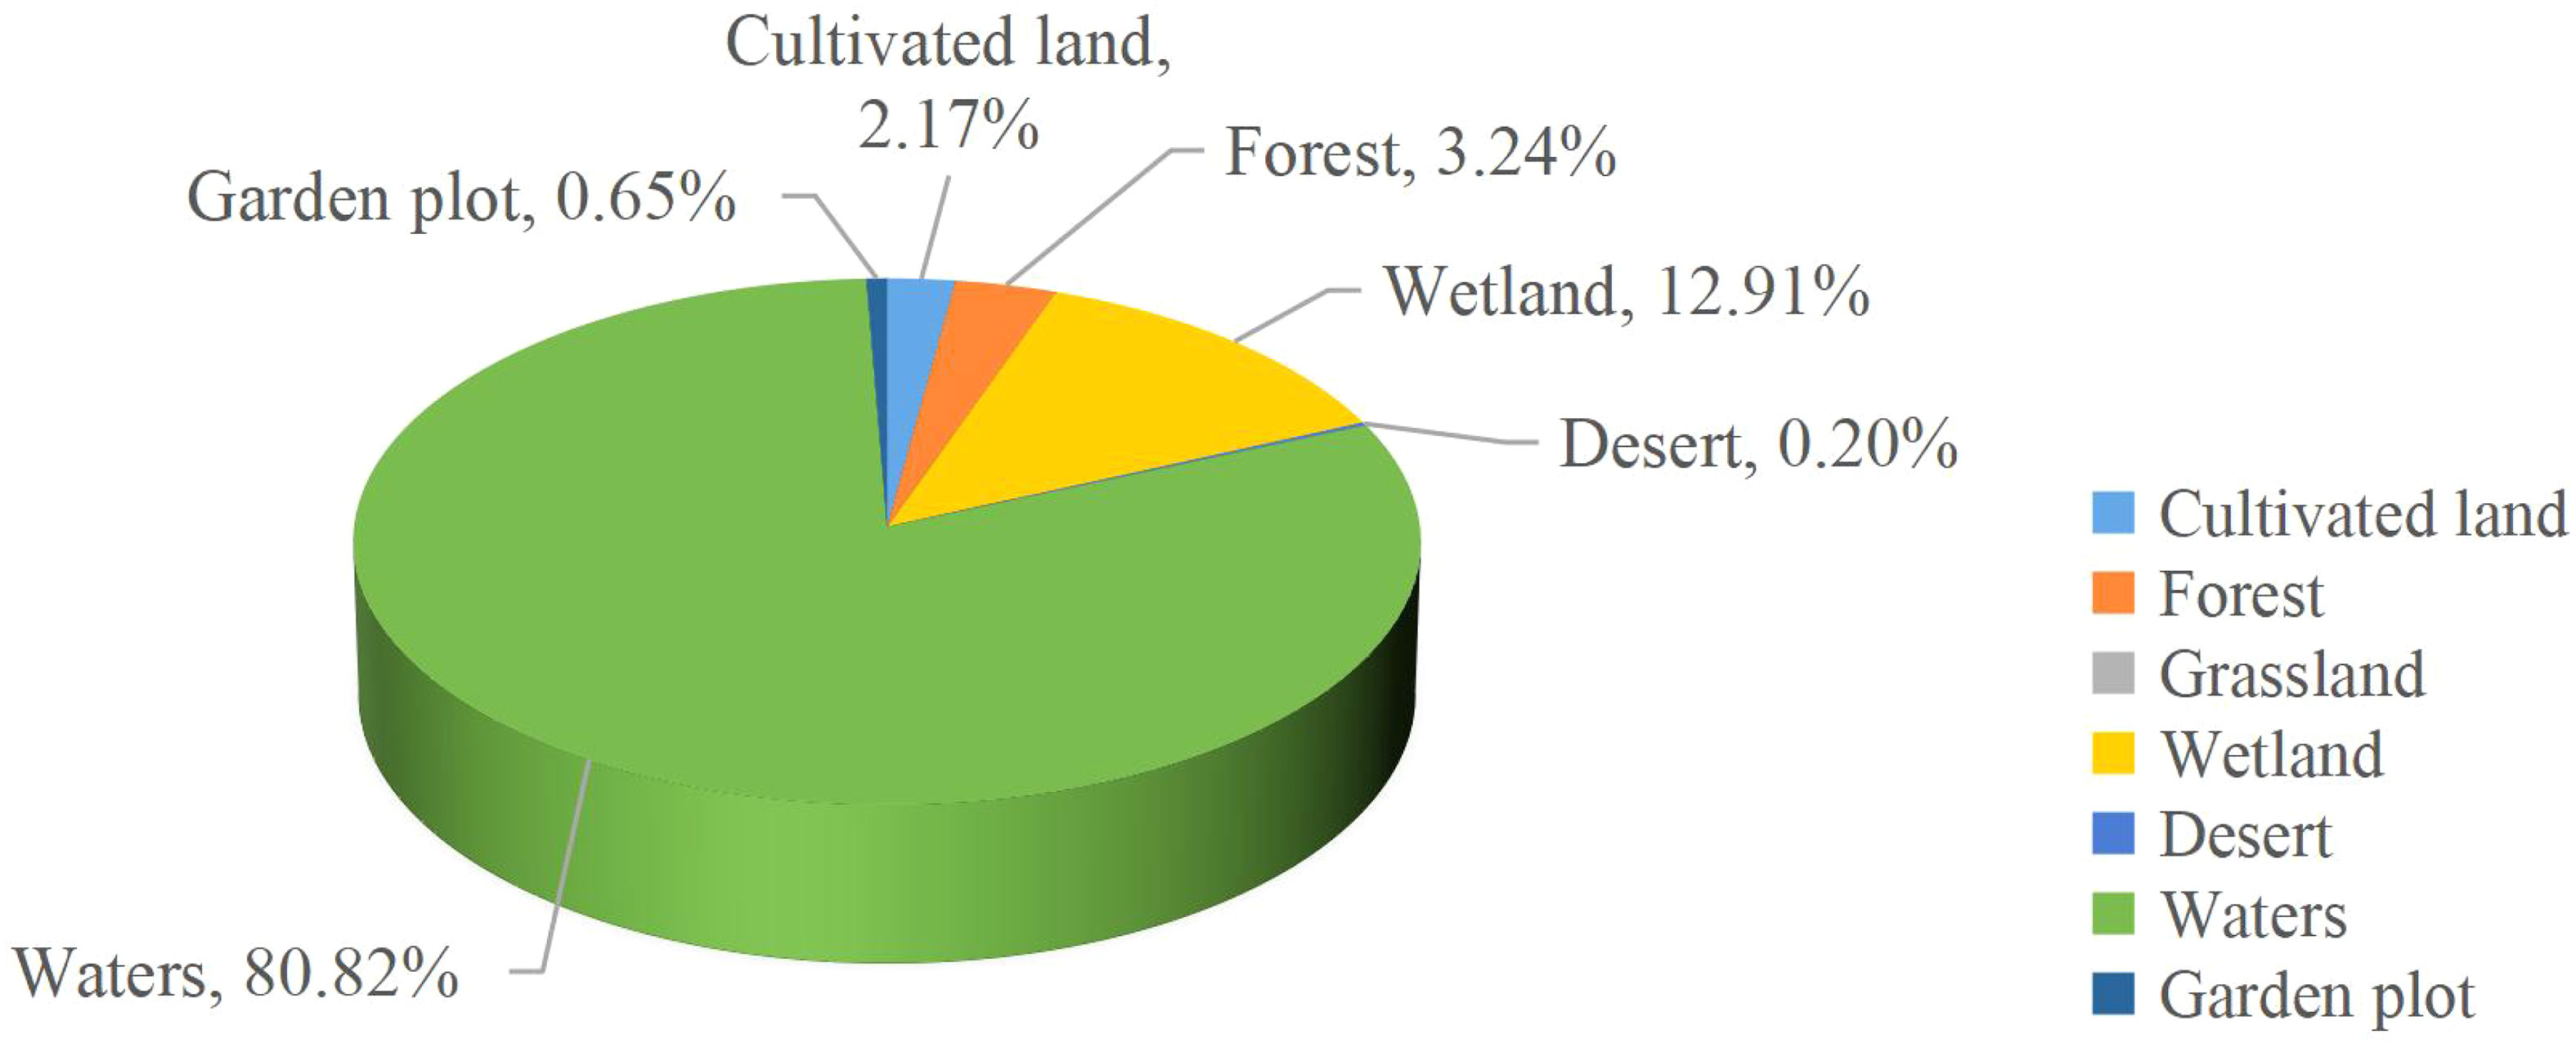
Figure 4 Structural analysis of ecosystem types in Shanghai.
In Anhui, ecosystem services were worth 731.874 billion yuan in 2021. Waters and forests were the two major ecosystems in Anhui. The value of ecosystem services provided by cultivated land and garden plot came second, with 6.92% and 1.56%, respectively. Wetland, grassland, and desert were relatively small (0.82%, 0.25%, and 0.12%). Figure 5 presents the specific results.

Figure 5 Structural analysis of ecosystem types in Anhui Province.
According to the above data analysis, the contribution of ecosystem service value in the Yangtze River Delta region was mainly focused on water, forest, and wetland ecosystems, these ecosystems are crucial and require significant protection moving forward. It is essential to adhere to the ecological integration policy, preserve and enhance the ecosystem, and achieve sustainable growth of local ecology and economy.
3.1.2 Analysis of ecological service function types
Table 6’s values for the four key ecological service functions show that Jiangsu Province had the greatest percentage of value for regulating service according to the first level classification of ecological service functions, at 85.5%, followed by supply service and support service, at 6.24% and 6%, respectively. The lowest proportion was cultural service, at 2.25%. The value of regulating service in Zhejiang Province accounted for 77.02%, providing the largest ecological service functional value. Support service, supply service, and cultural service came next, with respective values of 13.78%, 5.83%, and 3.37%. Shanghai still had the highest value for regulation service, accounting for 84.45%. The highest values that followed were supply service, support service, and cultural service. In Anhui Province, the ecological service function values were, in order, regulation service (81.94%), support service (9.2%), supply service (6.51%), and cultural service (2.36%). Based on the data provided, it can be observed that the Yangtze River Delta had the highest value for regulating service. Additionally, there was a slight imbalance in the percentage of the four primary ecological service functions across different provinces and cities. In future protection and management, the importance of strengthening the supply service, cultural service, and support service roles should be taken into consideration. Furthermore, after conducting an analysis, it was discovered that the market worth offered by the Yangtze River Delta area merely constituted approximately 4% of the complete value. Conversely, the non-market value of regulation services, support services, and cultural services collectively represented about 96% of the overall value, highlighting the significant role played by non-market value within the entire ecosystem services framework.
According to Figure 6’s secondary classification of ecosystem service functions, hydrological regulation service value, at 73.22% of total value, had the highest proportion in Jiangsu, followed by environmental purification and climatic regulation, at 4.95% and 4.83%, respectively. The value of hydrological and climate regulation service in Zhejiang Province contributed to the biggest percentage of overall value (49.38% and 15.26%), followed by biodiversity (6.83%). The highest percentage of ecosystem service function value in Shanghai was hydrological regulation (73.80%), followed by environmental purification and water resource supply (4.97% and 4.92%). In Anhui Province, hydrological regulation also had the highest percentage of ecosystem service function value (63.14%), followed by climate regulation and environmental purification (9.03% and 5.40%). From this, it can be seen that the core services of the ecosystem in the Yangtze River Delta included hydrological regulation, climate regulation, environmental purification, biodiversity, and water resource supply, as evident from this observation.
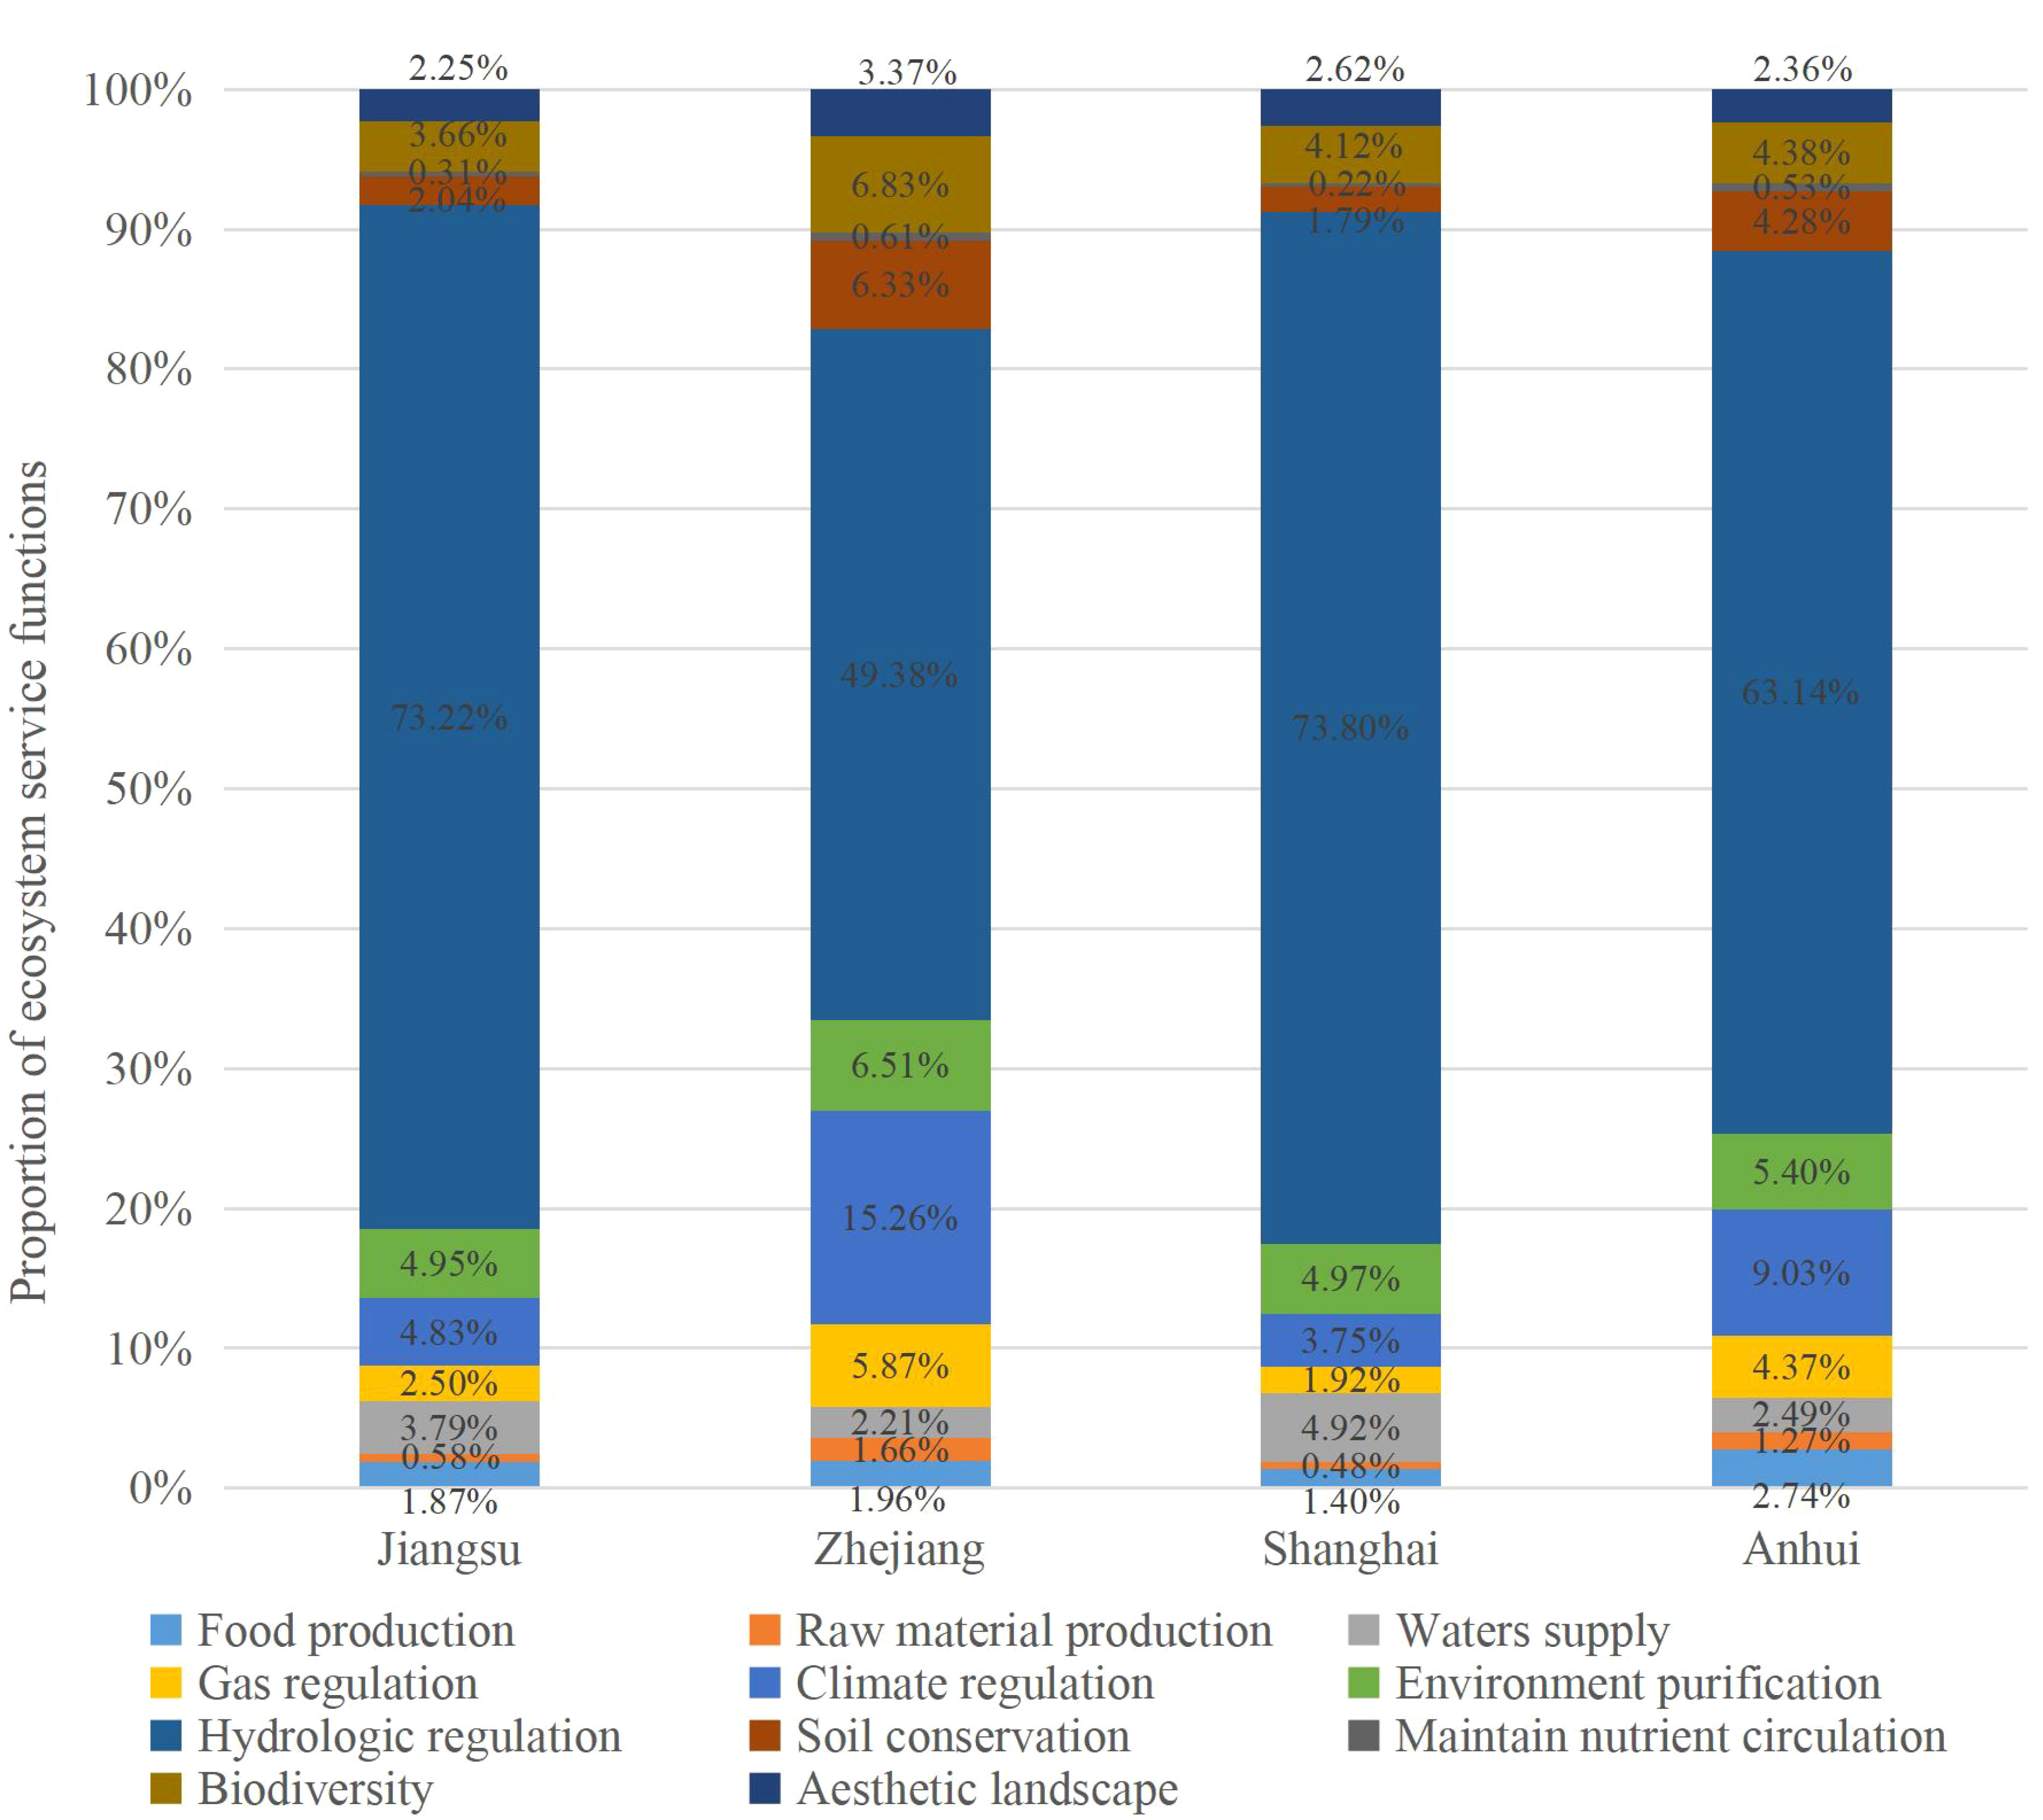
Figure 6 Structural analysis of ecological service functions in the Yangtze River Delta.
3.2 Analysis of ecological footprint model
3.2.1 Ecological footprint
The ecological footprint results are presented in Table 7 below using the ecological footprint formula and pertinent data.
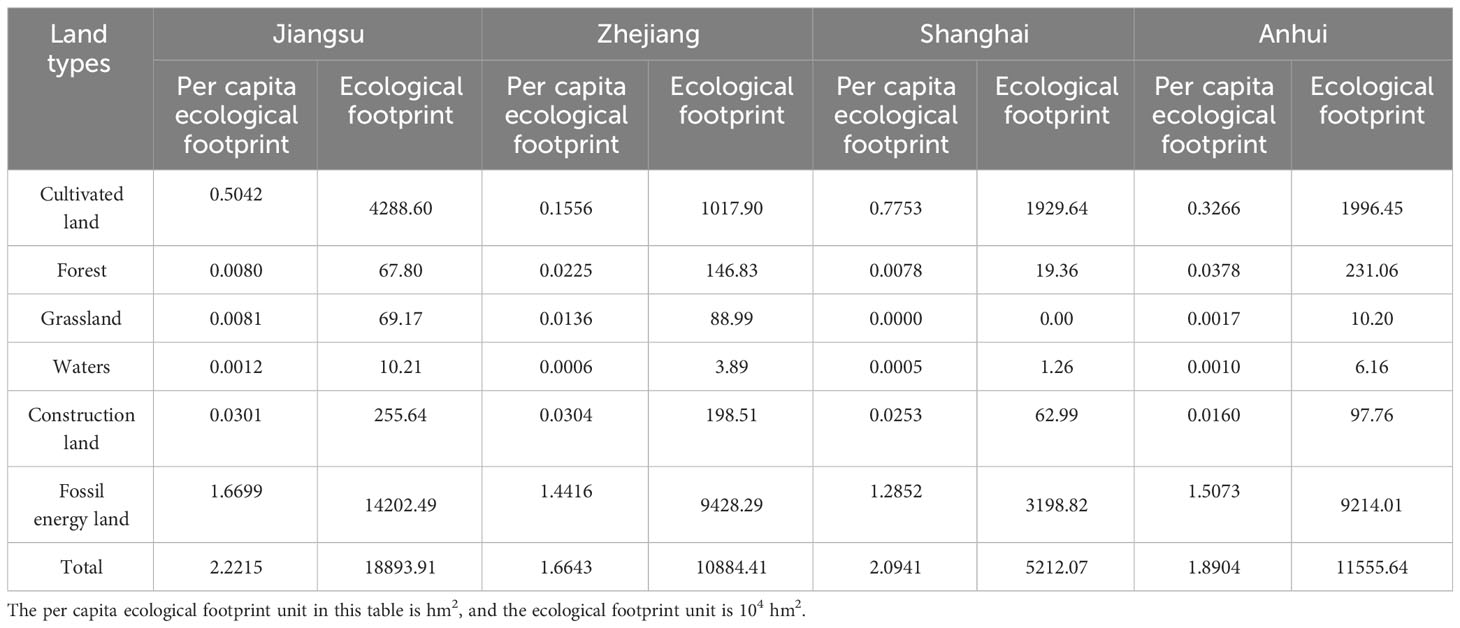
Table 7 Ecological footprint of the Yangtze River Delta region in 2021.
According to the ecological footprint data provided in Table 7, the Yangtze River Delta region’s ecological footprint proportions for various land types may be found in 2021. Table 8 below reveals the specific results.
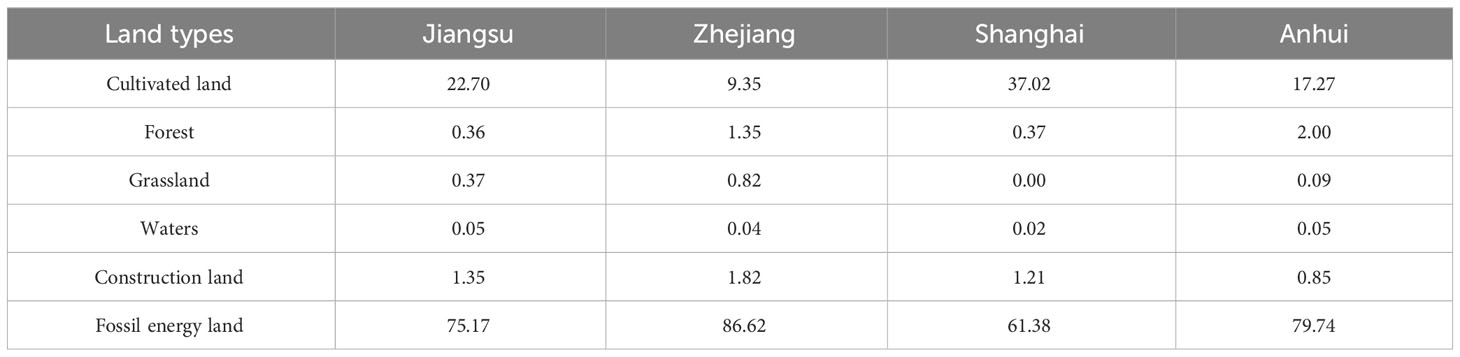
Table 8 Proportion of ecological footprint composition in the Yangtze River Delta region in 2021 (unit: %).
The information in Table 8 shows that among the four provinces and cities, the order of the proportion of ecological footprints of the six land types is basically the same. Fossil energy land and cultivated land accounted for over 90% of the regional ecological footprint, ranking as the two highest contributors. On the other hand, forest land, grassland, and construction land had comparatively small ecological footprints. according to additional investigation, Figure 7 illustrates that coal had the greatest utilization among all fossil energy sources. This implies that coal served as the primary energy resource for consumption in the Yangtze River Delta. However, the utilization of this energy has the potential to exacerbate environmental pollution, necessitating a necessary adjustment in the energy consumption framework.
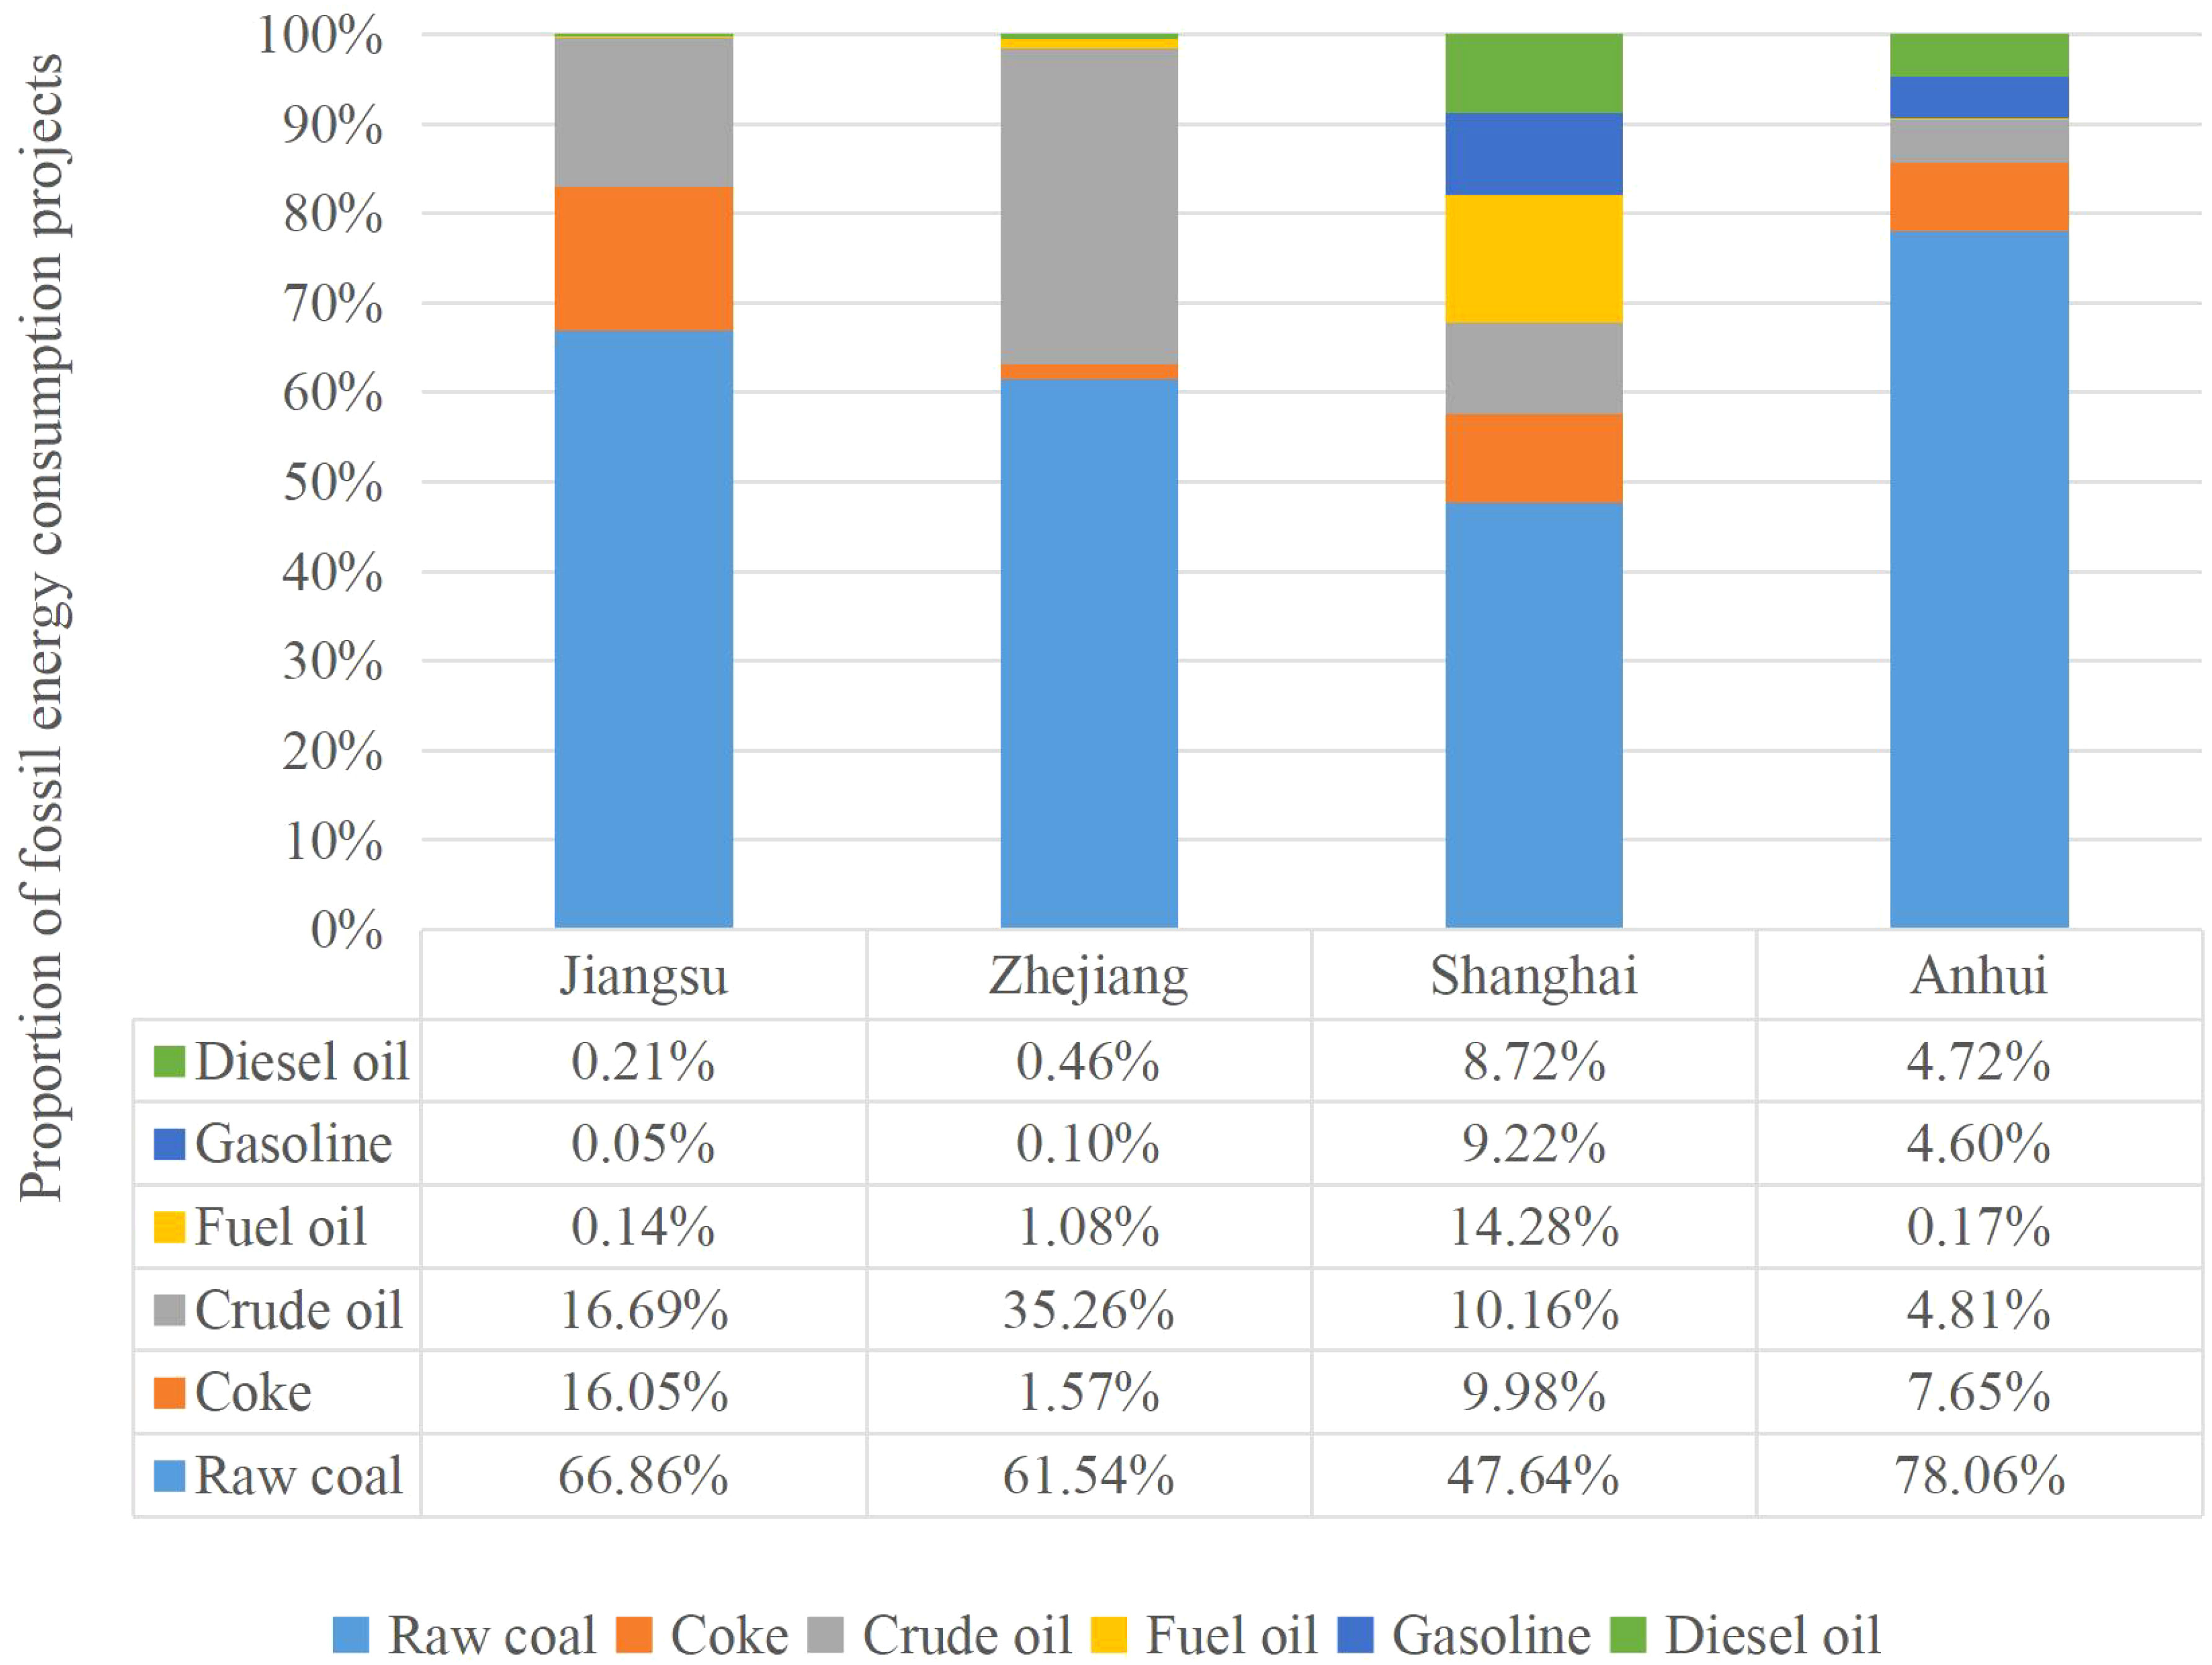
Figure 7 Proportion of fossil energy ecological footprint in the Yangtze River Delta region.
3.2.2 Ecological carrying capacity
By utilizing the ecological carrying capacity formula and considering factors like yield and equilibrium, the Yangtze River Delta region’s ecological carrying capacity for 2021 has been obtained. The specific data results have already subtracted 12% of the biological protective area, as may be seen in Table 9 below.
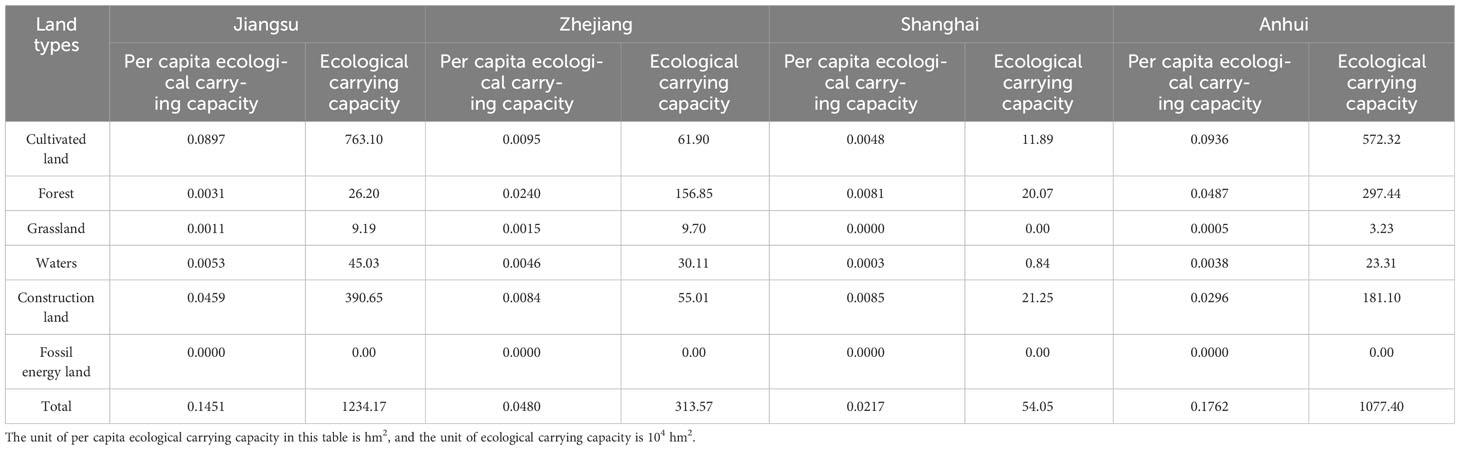
Table 9 Ecological carrying capacity of the Yangtze River Delta region in 2021.
Table 9 provides statistics on ecological carrying capacity that can be used to determine the ecological carrying capacity proportion of different land types in the Yangtze River Delta region in 2021. Table 10 below gives the specific results.
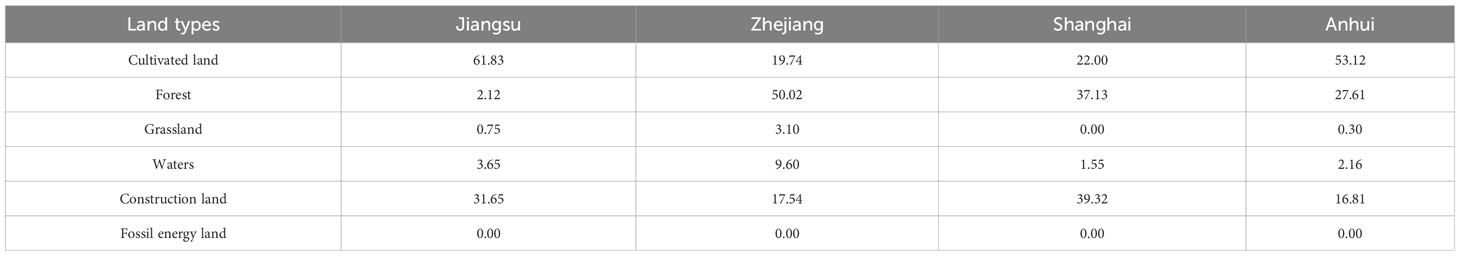
Table 10 Proportion of ecological carrying capacity in the Yangtze River Delta in 2021 (unit: %).
In terms of the ratio of ecological carrying capacity, Zhejiang, Shanghai, and Anhui in the Yangtze River Delta, apart from Jiangsu, all had the highest rankings for ecological carrying capacity of cultivated land, forest land, and construction land. The proportion of ecological carrying capacity in Jiangsu was in order of cultivated land, construction land, and water, with little difference in the proportion of forest and water. Meanwhile, Shanghai’s construction land had a higher ecological carrying capacity than cultivated land, but Jiangsu, Zhejiang, and Anhui had a lower proportion than cultivated land. Moreover, the main part of Shanghai’s ecological carrying capacity was also construction land, indicating that Shanghai, as a modern metropolis, undertook more economic development tasks. Furthermore, the combined capacity of cultivated land, forest, and construction land in different areas surpassed 85% of the overall local capacity. This highlights the significance of safeguarding cultivated land and forest, as well as promoting the responsible usage of construction land, in order to ensure the sustainable progress of both ecology and economy within the Yangtze River Delta region.
3.3 Ecological profit and loss analysis
Table 11 below displays the ecological profit and loss status of different land types. Among them, a negative data result indicates an ecological deficit, while a positive result indicates an ecological surplus.

Table 11 Ecological profit and loss in the Yangtze River Delta region in 2021.
The table data indicates that in 2021, the Yangtze River Delta were all manifested as ecological deficits, indicating an imbalance between ecological footprint and ecological carrying capacity, and the environment was in a serious overload state. Protecting the environment and achieving sustainable ecological development are urgent. Specifically, the only ecological surplus was the forest land in Zhejiang, Shanghai, and Anhui, as well as the water bodies in Jiangsu, Zhejiang, and Anhui, and the construction land in Jiangsu, Anhui. This indicated that effective measures have been implemented in these areas in terms of water source control, urban construction, and forest harvesting and protection. In addition, the ecological deficits of the other land types were all present, but the most severe deficit was seen on fossil energy land. The reason for this was that the unreasonable energy consumption structure in various regions had led to an excessively high ecological footprint of fossil energy land, which far exceeded the maximum supply that ecological environment can offer. Meanwhile, with the continuous improvement of economic level, the demand for energy such as gasoline and diesel would also increase, leading to an inevitable worsening of the ecological deficit in fossil energy land. Therefore, the Yangtze River Delta’s various regions need to use regional integration strategies to attract a huge amount of scientific and technological talents and develop and use renewable energy. Secondly, there was an ecological deficit in cultivated land. Despite the ample availability of cultivable land resources in the Yangtze River Delta region, it also experiences a higher influx of people and greater resource consumption. The encroachment on arable land during urbanization construction reduced its area, and agricultural production methods were more extensive. Unregulated application of fertilizers and pesticides led to decreased productivity in agricultural activities, posing a risk of ecological imbalances. The primary cause for the insufficient supply of grassland was the relatively small size of grassland areas in different regions, which could not adequately meet the demands of people. However, what is unique is that Shanghai did not have grasslands, and the required ecological products were provided by its external municipal areas. Its ecological data should also belong to the external municipal areas. Hence, this research documented that the Shanghai grassland has a recorded ecological footprint and ecological carrying capacity of zero.
3.4 Analysis of ecological compensation results
Table 12 below summarizes the calculation process of ecological compensation amount in 2021, based on the aforementioned data results and relevant calculation formulas. Based on the data provided in the table, ecological deficits were observed in every area within the Yangtze River Delta. So the ecological compensation need to be paid.
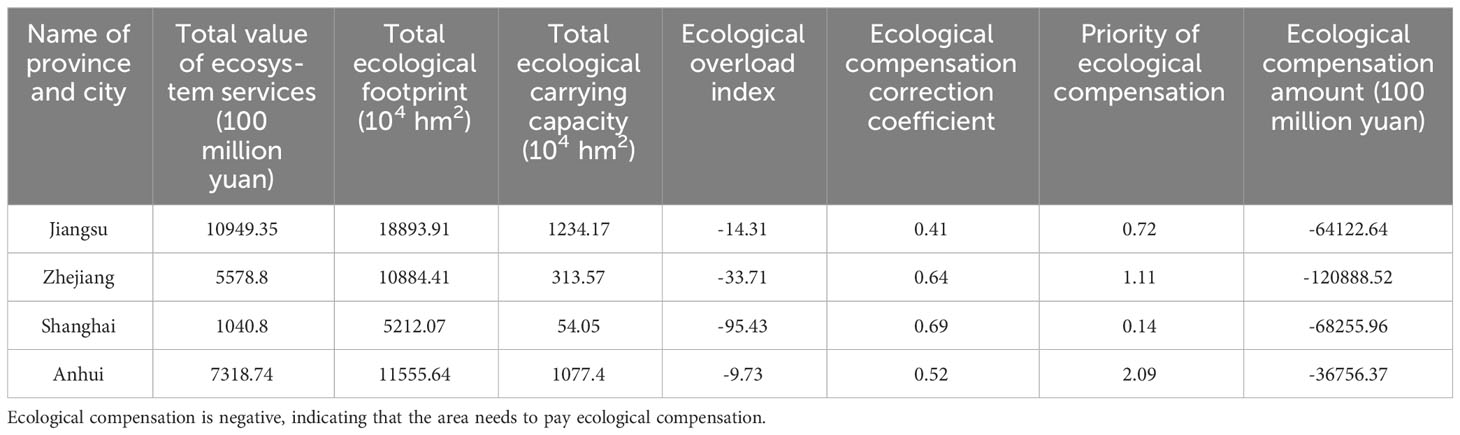
Table 12 Ecological compensation in the Yangtze River Delta region in 2021.
In the Yangtze River Delta, the entire sum of ecological compensation to be paid in 2021 was 29002.349 billion yuan. In specific payments, the payment proportions of each province and city were 41.68% in Zhejiang, 23.53% in Shanghai, 22.11% in Jiangsu, and 12.67% in Anhui. This occurrence was consistent with the current situation of each areas. In fact, Zhejiang, Shanghai, and Jiangsu had relatively developed economies, requiring resources far exceeding the supply of ecosystems. Therefore, they need to pay a relatively large amount of ecological compensation. Anhui paid the least in ecological compensation because it was a relatively smaller economic force and required fewer resources than the other three provinces and cities.
The ecological compensation priority was determined as follows: Anhui, Zhejiang, Jiangsu, and Shanghai, with values of 2.09, 1.11, 0.72, and 0.14, respectively. Anhui Province had the highest priority for ecological compensation, indicating that paying ecological compensation had a significant impact on its development and would incur a significant cost. Therefore, priority payment for ecological compensation was not considered; Relatively speaking, the priority of ecological compensation in Zhejiang, Jiangsu, and Shanghai was relatively low, showing that these areas had an excellent rate of economic growth. After paying ecological compensation, the impact on their development was relatively small. Priority should be given to paying ecological compensation to coordinate the development balance between regions.
For the ecological overload index, it can be found that the values of the four provinces and cities were negative, indicating that the overall ecological supply and requirement was unbalanced, and ecological environment was severely overloaded, which was an unsustainable development state. After analyzing the situation, it is believed that the primary causes are the limited duration of policies and measures concerning regional and ecological integration in the Yangtze River Delta, which has not allowed sufficient time for their effects to manifest. In 2018, the national government implemented the integration of the Yangtze River Delta as a key policy, resulting in the establishment of an ecological integration demonstration zone in May 2019. In the meantime, the information utilized for this research was obtained in 2021. Over the course of two to three years, different regions and municipalities were still in the initial phase of exploring industrial structure modification and ecological environment development, and the immediate attainment of desired outcomes from corresponding policy measures was not feasible. Furthermore, by conducting data analysis, it was found that the percentage of the manufacturing sector in the provinces of Jiangsu, Zhejiang, Shanghai, and Anhui stood at 44.5%, 40.8%, 37.3%, and 41% correspondingly. The secondary sector, which is also a high energy-consuming and environmentally polluting industry, can have significant negative impacts on ecological systems, diminishing the production capacity of ecological resources and, to some degree, impeding the sustainable development of the ecological environment. Hence, in general, the present ecological burden in the Yangtze River Delta area was acceptable. By utilizing their geographical benefits and resources, the four provinces and cities can achieve ecological progress, gradually decrease the need for ecological compensation, and ultimately attain a sustainable ecological environment.
4 Conclusions, recommendations and limitations
4.1 Conclusions
(1) For the value of ecosystem services. First, the total worth of ecosystem services in the Yangtze River Delta amounted to 2,488.769 billion yuan. Jiangsu stood out as the top contributor, making up 44% of the total. Due to its expansive land area and abundant resources, Jiangsu played an undeniable role as the primary supplier of ecosystem service value in the Yangtze River Delta, considering the natural disparities between regions.
Second, based on the findings of ecosystem classifications, it becomes apparent that the three provinces and one city in the Yangtze River Delta display distinct features. However, in general, approximately 90% of the overall value of local services can be attributed to the combined worth of water, forest, and wetland services. This highlights their significance as crucial ecosystems that require protection. Nevertheless, it is essential for ecological conservation policies to consider the unique structure of the specific ecosystem in each region.
Third, based on the findings of ecosystem service functions, the dominant contributions of the three provinces and one city in the Yangtze River Delta to ecosystem services have consistently revolved around regulating services and their ancillary roles, including hydrological regulation, climate regulation, and environmental purification. This result once again confirmed the importance of water bodies, forests, and wetland ecosystems, but in fact, all ecosystems are a community and should be protected as a whole. In addition, the proportion of the market value of each province was much lower than that of non-market value. Therefore, when formulating ecological development plans in different areas, it is important to avoid excessive emphasis on the market and instead conduct a comprehensive assessment of the overall condition of the ecosystems to avoid damage and environmental deterioration.
(2) For the ecological profits and losses. First, In terms of ecological footprint, the Yangtze River Delta’s three provinces and one city ranked fossil energy land and cultivated land as the highest two. Regarding the ecological carrying capacity, cultivated land, forest land, and construction land were the main factors, collectively contributing more than 85%. Among them, cultivated land was the largest contributor to ecological carrying capacity in Jiangsu and Anhui, both exceeding 50%. This indicated that Jiangsu and Anhui also bear significant pressure on food production as major agricultural provinces when undertaking economic development tasks.
Second, the Yangtze River Delta was experiencing an ecological deficit, suggesting a significant imbalance between the availability and requirement of environmental resources in the region. In the meantime, additional investigation revealed that the ecological deficit in fossil energy land was the most severe, with cultivated land ranking second in terms of severity.
(3) For the ecological compensation. In the region of the Yangtze River Delta, ecological compensation was provided, with Zhejiang paying the highest amount of 12088.852 billion yuan, followed by Shanghai with 6825.596 billion yuan, Jiangsu with 6412.264 billion yuan, and Anhui with 3675.637 billion yuan. As for the payment order of compensation was: Shanghai, Jiangsu, Zhejiang and Anhui. Although Anhui had the highest priority for compensation, it had the lowest overall amount of ecological compensation in the region. And it was actually the region that needed to be paid, so the sum of compensation paid by Anhui can be suitably reduced in accordance with the situation, and the specific amount will be based on the results of coordination and negotiation between the government. As the dominant force in the Yangtze River Delta, Shanghai possesses the greatest overall capacity for economic growth, thus the compensation payment had minimal repercussions on its subsequent development. Furthermore, this payment order accurately reflects the current conditions of the three provinces and one city in the Yangtze River Delta, while also promoting a more balanced economic and environmental development across different regions.
4.2 Recommendations
In the Yangtze River Delta, the largest proportion of the ecological deficit is determined by fossil energy land and cultivated land. Hence, it is crucial to implement actions that modify the ecological state of these two categories of land in order to attain an ecological surplus.
For fossil energy land. First of all, the Yangtze River Delta’s three provinces and one city ought to uphold the approach of ecological integration, while enhancing financial and tax support for technology related to “energy preservation and emission reduction”. Each provincial and municipal government can set up special funds to fund universities and enterprises to carry out research on energy conservation technology, and give certain rewards to technological achievements of great significance to stimulate the motivation of research and innovation. Secondly, it is crucial to modify the industrial structure and give heed to the regulation of contaminants. Provincial and municipal governments can vigorously support the development of low-energy tertiary industries such as software communications, tourism and culture, and reduce their dependence on the heavily polluting secondary industry. At the same time, high energy-consuming enterprises are encouraged to introduce new technologies and reduce the emission of pollutants. In addition, when various provinces and cities carry out industrial transfer, they must require enterprises to complete technological transformation and equipment update, so as to avoid the formation of ecological governance of “hiding ears and stealing bells”. Finally, advocate the green concept, encourage green travel.
For cultivated land. On the one hand, it is indispensable to ensure the area of cultivated land. At present, the country’s land resources are limited, so the provincial and municipal governments in the Yangtze River Delta should formulate strict land protection measures, improve the land approval system, use remote sensing satellites to fully input ground images, monitor the land use situation in real time, and control the phenomenon of rural and urban land occupation at will. At the same time, it can repair the abandoned fish ponds, low-lying land, etc., thereby increasing the cultivated land area. On the other hand, it is certainly need to enhance the production efficiency of cultivated land and improve its ecological carrying capacity. Provincial and municipal governments should actively promote efficient planting models such as rotating tillage and straw returning to the field, while subsidizing the upgrading of agricultural production technology and implementing land trusteeship, so as to finally realize the mechanization and intensification of agricultural production and improve the cultivated land’s efficiency of use.
4.3 Limitations and prospects
Regional ecological compensation involves a lot of content, and in-depth exploration of it is also more complicated, so the article still has some limitations. First, in the computation of ecosystem services worth, the corresponding table of ecosystem services worth in Mainland China is employed (Xie et al., 2015). This investigation applies it in provinces, cities, and regions, which could potentially lead to discrepancies between the computed outcomes and the real outcomes. Second, while determining the ecological footprint, it is important to consider the equilibrium factors and yield factors of each province and city, which are relatively accurate. However, it is worth noting that these factor values were suggested by scholar Liu in 2010 (Liu and Li, 2010; Liu et al., 2010), making them somewhat outdated and potentially causing disparities between the overall ecological footprint and the current reality. Third, the focus of this paper is on three provinces and one city located in the Yangtze River Delta region. While the calculation of ecological compensation is determined for each province and city, it does not include a more specific distribution of compensation at the prefecture-level city, and further research is needed in the future.
Data availability statement
The original contributions presented in the study are included in the article/Supplementary Material. Further inquiries can be directed to the corresponding author.
Author contributions
JN: Conceptualization, Data curation, Investigation, Methodology, Resources, Software, Validation, Visualization, Writing – original draft, Writing – review & editing. CM: Conceptualization, Formal analysis, Project administration, Resources, Supervision, Validation, Writing – review & editing.
Funding
The author(s) declare financial support was received for the research, authorship, and/or publication of this article. This research was funded by the key project of National Social Science Foundation of China: 20AGL036.
Conflict of interest
The authors declare that the research was conducted in the absence of any commercial or financial relationships that could be construed as a potential conflict of interest.
Publisher’s note
All claims expressed in this article are solely those of the authors and do not necessarily represent those of their affiliated organizations, or those of the publisher, the editors and the reviewers. Any product that may be evaluated in this article, or claim that may be made by its manufacturer, is not guaranteed or endorsed by the publisher.
Supplementary material
The Supplementary Material for this article can be found online at: https://www.frontiersin.org/articles/10.3389/fevo.2024.1335761/full#supplementary-material
References
Chen R., Zhang D., Li B. (2020). Spatial-temporal calculation simulation of ecological footprint of resource and environmental pollution in green communication. Eurasip. J. Wirel. Commun. Netw. 1, 1–14. doi: 10.1186/s13638-020-01880-5
Costanza R., d’Arge R., Groot R. D., Farber S., Grasso M., Hannon B., et al. (1997). The value of the world’s ecosystem services and natural capital. Nature 387 (15), 253–260. doi: 10.1038/387253a0
Dai L., Liu Y., Luo X. (2021). Integrating the MCR and DOI models to construct an ecological security network for the urban agglomeration around Poyang Lake, China. Sci. Total. Environ. 754, 141868. doi: 10.1016/j.scitotenv.2020.141868
Daily G. C. (1997). Nature’s services: societal dependence on natural ecosystems. (Washington, DC: Island Press).
de Groot R., Brander L., van der Ploeg S., Costanza R., Bernard F., Braat L., et al. (2012). Global estimates of the value of ecosystems and their services in monetary units. Ecosyst. Serv. 1, 50–61. doi: 10.1016/j.ecoser.2012.07.005
Ding W., Jimoh S. O., Hou X., Shu X., Dong H., Bolormaa D., et al. (2022). Grassland ecological subsidy policy and livestock reduction behavior: a case study of herdsmen in northern China. Rangel. Ecol. Manage. 81, 78–85. doi: 10.1016/j.rama.2022.01.002
Dong H., Liu Y., Zhao Z., Tan X., Managi S. (2022). Carbon neutrality commitment for China: from vision to action. Sustain. Sci. 17, 1741–1755. doi: 10.1007/s11625-022-01094-2
Gao X., Shen J., He W., Sun F., Zhang Z., Zhang X., et al. (2019). Changes in ecosystem services value and establishment of watershed ecological compensation standards. Int. J. Environ. Res. Public. Health. 16 (16), 2951. doi: 10.3390/ijerph16162951
Gao Z., Wang X., Su J., Chen Z., Zheng M., Sun Y., et al. (2018). Ecological compensation of Dongjiang River basin based on evaluation of ecosystem service value. J. Ecol. Rural. Environ. 34, 563–570.
Gastineau P., Mossay P., Taugourdeau E. (2021). Ecological compensation: how much and where? Ecol. Econ. 190, 107191. doi: 10.1016/j.ecolecon.2021.107191
Guo J., Ren J., Huang X., He G., Shi Y., Zhou H. (2020). The dynamic evolution of the ecological footprint and ecological capacity of Qinghai Province. Sustainability 12 (7), 3065. doi: 10.3390/su12073065
Hang F. (2010). Research of the government’s environmental function under the perspective of inter-generational equity. J. Qinghai. Norm. Univ. 34, 8–12. doi: 10.16229/j.cnki.issn1000-5102.2010.03.002
Helliwell D. R. (1969). Valuation of wildlife resources. Reg. Stud. 3, 41–47. doi: 10.1080/09595236900185051
Hu M., Wang Y., Xia B., Jiao M., Huang G. (2020). How to balance ecosystem services and economicbenefits? a case study in the Pearl River Delta, China. J. Environ. Manage. 271, 110917. doi: 10.1016/j.jenvman.2020.110917
Jia Y., Liu Y., Zhang S. (2021). Evaluation of agricultural ecosystem service value in arid and semiarid regions of northwest China based on the equivalent factor method. Environ. Process. 8 (2), 713–727. doi: 10.1007/s40710-021-00514-2
Kang N., Hou L., Huang J., Liu H. (2022). Ecosystem services valuation in China: A meta-analysis. Sci. Total. Environ. 809, 151122. doi: 10.1016/j.scitotenv.2021.151122
Li J. (2002). Value accounting is the key to environmental accounting. China Popul. Resour. Environ. 3, 13–19.
Li X. (2017). Research on ecological compensation standards for cultivated land based on ecological value and payment capacity: A case study of Henan Province. Ecol. Econ. 33 (2), 151–155 + 161.
Li G., Sun F., Fu B., Deng L., Yang K., Liu Y., et al. (2021). How to promote the public participation in eco-compensation in transboundary river basins: a case from Planned Behavior perspective. J. Clean. Prod. 313, 127911. doi: 10.1016/j.jclepro.2021.127911
Liang J., Xu Y., Yao X. (2015). Quantitative study on ecological compensation standard of ordos city city based on ecological footprint. J.Inn. Mongolia. Norm. Univ. 44, 125–129.
Liu M., Bai Y., Su B. (2022). Analysis of the hotspots of ecological compensation research inChina in the past 20 Years based on a bibliometric study. J. Resour. Ecol. 13 (1), 80–92. doi: 10.5814/j.issn.1674-764x.2022.01.009
Liu M., Li W. (2010). Calculation of ecological footprint equilibrium factors in China based on net primary productivity. J. Ecol. Rural. Environ. 26 (5), 401–406.
Liu M., Li W., Xie G. (2010). Calculation of China’s Ecological footprint production factors based on net primary productivity. Chin. J. Ecol. 29 (3), 592–597. doi: 10.13292/j.1000-4890.2010.0097
Lu M. (2014). Research on county land remediation planning based on urban rural coordination. Huazhong. Univ. Sci. Tech. CHN.
Lu S., Lu W., Xu M., Taghizadeh-Hesary F., Tang Y. (2023). Water-energy-food security under green finance constraints in Southwest China. Energy. Econ. 118, 106478. doi: 10.1016/j.eneco.2022.106478
Mutandwa E., Grala R. K., Petrolia D. R. (2019). Estimates of willingness to accept compensation to manage pine stands for ecosystem services. Pol. Econ. 102, 75–85. doi: 10.1016/j.forpol.2019.03.001
Norgaard R. B., Jin L. (2008). Trade and governance of ecosystem services. Ecol. Econ. 66, 638–652. doi: 10.1016/j.ecolecon.2007.10.026
Ouyang Z., Wang X., Miao H. (1999). A Preliminary Study on the Service Functions and Eco economic Value of Terrestrial ecosystem in China. Acta. Ecol. Sin. 5, 19–25.
Rees W. E. (1992). Ecological footprints and appropriated carrying capacity: what urban economics leaves out. Environ. Urban. 4 (2), 121–130. doi: 10.1177/095624789200400212
Saboori B., Gholipour H. F., Rasoulinezhad E., Ranjbar O. (2022). Renewable energy sources and unemployment rate: Evidence from the US states. Energ. Policy. 168, 113155. doi: 10.1016/j.enpol.2022.113155
Silva J. D., Fernandes V., Limont M., Rauen W. B. (2020). Sustainable development assessment from a capitals perspective: Analytical structure and indicator selection criteria. J. Environ. Manage. 260, 110147. doi: 10.1016/j.jenvman.2020.110147
Solomon N., Segnon A. C., Birhane E. (2019). Ecosystem service values changes in response to land-use/land-cover dynamics in dry afromontane forest in northern Ethiopia. Int. J. Environ. Res. Public. Health. 16 (23), 4653. doi: 10.3390/ijerph16234653
Wackernagel M. (1999). Why sustainability analyses must include biophysical assessments. Ecol. Econ. 29, 13–15. doi: 10.1016/S0921-8009(98)00071-8
Wackernagel M., Monfreda C., Deumling D. (2002). Ecological footprint of nations 2002 update. Quellen. Und. Forsch. Aus. Italienischen. Archiven. Und. Bibliotheken. 91 (1), 1–29. doi: 10.1515/qfiab.2012.91.1.1
Wackernagel M., Rees W. E. (1997). Perceptual and structural barriers to investing in natural capital: Economics from an ecological footprint perspective. Ecol. Econ. 20 (1), 3–24. doi: 10.1016/s0921-8009(96)00077-8
Wang C., Li W., Sun M., Wang Y., Wang S. (2021). Exploring the formulation of ecological management policies by quantifying interregional primary ecosystem service flows in Yangtze River Delta region, China. J. Environ. Manage. 284, 112042. doi: 10.1016/j.jenvman.2021.112042
Wu A., Zhang J., Zhao Y., Shen H., Guo X. (2022). Simulation and optimization of supply and demand pattern of multiobjective ecosystem services-A case study of the beijing-tianjin-hebei region. Sustainability 14 (5), 2658. doi: 10.3390/su14052658
Xie G., Zhang C., Zhang C., Xiao Y., Lu C. (2015). The value of ecosystem services in China. Resour. Sci. 37, 1740–1746.
Xie G., Zhen L., Lu C., Xiao Y., Chen C. (2008). Expert knowledge based valuation method of ecosystem services in China. J. Nat. Resour. 23, 911–919.
Xu Z., Cheng G., Zhang Z. (2006). Theoretical analysis of ecological footprint method. China Popul. Resour. Environ. 6, 69–78.
Xu X., Zheng Y. (2017). Ecological compensation standard of Lhasa rural tourism destination based on tourism ecological footprint: A case study of Cijiolin Village. Econ. Geogr. 37 (4), 218–224. doi: 10.15957/j.cnki.jjdl.2017.04.027
Yang Y., Lu H., Liang D., Chen Y., Tian P., Xia J., et al. (2022). Ecological sustainability and its driving factor of urban agglomerations in the Yangtze River Economic Belt based on three-dimensional ecological footprint analysis. J. Clean. Prod. 330, 129802. doi: 10.1016/j.jclepro.2021.129802
Yu H., Chen C., Shao C. (2023). Spatial and temporal changes in ecosystem service driven by ecological compensation in the Xin’an River Basin, China. Ecol. Indic. 146, 109798. doi: 10.1016/j.ecolind.2022.109798
Yu X., Wu Z., Zheng H., Li M., Tan T. (2020). How urban agglomeration improve the emission efficiencyA spatial econometric analysis of the Yangtze River Delta urban agglomeration in China. J. Environ. Manage. 260, 110061. doi: 10.1016/j.jenvman.2019.110061
Yu H., Xie W., Yang L., Du A., Almeida C. M., Wang Y. (2020). From payments for ecosystem services to eco-compensation: Conceptual change or paradigm shift? Sci. Total. Environ. 700, 134627. doi: 10.1016/j.scitotenv.2019.134627
Zhang H., Fang B., Wei Q., Q, Y., Wang Q. (2015). Construction of a quantitative model for ecological value compensation of regional cultivated land: A case study of Jiangsu province. China. Land. Sci. 29, 63–70. doi: 10.13708/j.cnki.cn11-2640.2015.01.007
Zhang X., Hu Y., Lin Y. (2020). The influence of highway on local economy: evidence from China’s Yangtze River Delta region. J. Transport. Geogr. 82, 102600. doi: 10.1016/j.jtrangeo.2019.102600
Zhang X., Li F., Li X. (2021). Bibliometric analysis of ecological compensation and its application in land resources. Landsc. Ecol. Eng. 17, 527–540. doi: 10.1007/s11355-021-00471-w
Zhang B., Wang Y., Li J., Zheng L. (2022). Degradation or Restoration? The temporal-spatial evolution of ecosystem services and its determinants in the Yellow River Basin, China. Land 11, 863. doi: 10.3390/land11060863
Zhao L., Chau K. Y., Tran T. K., Sadiq M., Xuyen N. T. M., Phan T. T. H. (2022). Enhancing green economic recovery through green bonds financing and energy efficiency investments. Econ. Anal. Policy. 76, 488–501. doi: 10.1016/j.eap.2022.08.019
Zhao Y., Wu F., Li F., Chen X., Xu X., Shao Z. (2021). Ecological compensation standard of trans-boundary river basin based on ecological spillover value: A case study for the Lancang-Mekong River Basin. Int. J. Environ. Res. Public. Health. 18 (3), 1251. doi: 10.3390/ijerph18031251
Zhong S., Geng Y., Huang B., Zhu Q., Cui X., Wu F. (2020). Quantitative assessment of eco-compensation standard from the perspective of ecosystem services: a case study of Erhai in China. J. Clean. Prod. 263, 121530. doi: 10.1016/j.jclepro.2020.121530
Keywords: Yangtze River Delta, ecological compensation, ecosystem services value, ecological footprint, ecological sustainability
Citation: Mao C and Niu J (2024) Quantitative analysis of ecological compensation in the Yangtze River Delta region based on the value of ecosystem services and ecological footprint. Front. Ecol. Evol. 12:1335761. doi: 10.3389/fevo.2024.1335761
Received: 09 November 2023; Accepted: 22 January 2024;
Published: 07 February 2024.
Edited by:
Fernanda Michalski, Universidade Federal do Amapá, BrazilReviewed by:
Amod Mani Dixit, Universal Engineering and Science College (UESC), NepalYing Zhu, Xi’an University of Architecture and Technology, China
Copyright © 2024 Mao and Niu. This is an open-access article distributed under the terms of the Creative Commons Attribution License (CC BY). The use, distribution or reproduction in other forums is permitted, provided the original author(s) and the copyright owner(s) are credited and that the original publication in this journal is cited, in accordance with accepted academic practice. No use, distribution or reproduction is permitted which does not comply with these terms.
*Correspondence: Junjun Niu, bml1anVuanVuQGhodS5lZHUuY24=