 Hua Shen
 Chunting Feng1,2
 Wei Wang
95% of researchers rate our articles as excellent or good
Learn more about the work of our research integrity team to safeguard the quality of each article we publish.
Find out more
ORIGINAL RESEARCH article
Front. Ecol. Evol. , 21 May 2024
Sec. Conservation and Restoration Ecology
Volume 12 - 2024 | https://doi.org/10.3389/fevo.2024.1321974
This article is part of the Research Topic Biodiversity Conservation and Sustainable Development of Protected Areas View all 12 articles
Establishing protected areas (PAs) is a major measure of biodiversity conservation, and various methods have been explored to assess PAs’ effectiveness. However, those methods mainly compared the relative changes in land cover between treated samples inside the PAs and their matched samples outside the PAs, which would produce misjudgments, especially in some climax communities with a relatively steady state. Thus, in this study, we constructed an integrated framework through a series of assessments according to the state, trend, and relative change of each PA to explore the conservation effectiveness of PAs in the Three Parallel Rivers Region in China from 2000 to 2020. Here, “state” refers to the difference among samples from within and outside the PA, assessed through yearly sample mean comparison. “Trend” means linear regression of mean forest area of each PA throughout the assessment period. “Relative change” means the difference in the mean value of the slope of forest changes between the treated samples inside each PA and their matched control samples outside of PAs. The entire forest area within all PAs in the Three Parallel Rivers Region showed a significant increasing trend from 2000 to 2020 (R2 = 0.919, P<0.05). Among all the PAs, twelve (86%) had a positive effect on protecting the forest ecosystem, and two had a nonsignificant effect. Among the factors affecting the state and relative change in PAs’ forests, the annual total precipitation was the most important, followed by distance to the nearest road. Moreover, the management-level variable was an essential factor in the state of PAs’ forest ecosystems, which indicated that national PAs (nature reserves and natural parks) were in a better state than local (provincial- and county-level) nature reserves. Overall, the conservation effectiveness of forests in PAs was assessed at a regional scale in the Three Parallel Rivers Region, implying that our framework would be additional useful in regions with high biodiversity and steady ecosystems. This framework better avoids underestimating conservation effectiveness assessment tasks than traditional methods do. Thus, we posit that this framework is suitable for future global or country-level assessments.
Establishing protected areas (PAs) is the main method of defending against biodiversity loss because it conserves vital ecosystems, wildlife, and habitats (Gaston et al., 2008; Stolton and Dudley, 2010). By May 2021, at least 22.5 million km2 (16.64%) of land and inland water ecosystems were within PAs and Other Effective area-based Conservation Measures (OECMs) (UNEP-WCMC, and IUCN, 2021). Except for fulfilling the quantitative coverage target, it is also important to know whether existing PAs are effectively protecting biodiversity features. For instance, 71.4% of PAs worldwide helped prevent forest loss, without PAs, forest loss within the boundaries of 287 PAs would have increased by 77,857 km2 between 2000 and 2015 (Yang et al., 2021). With the escalation of environmental crises, evaluating PAs’ conservation effectiveness is necessary to guarantee benefits to humankind and ensure that PAs can maintain positive mechanisms to achieve their diverse objectives and realize their full potential (Watson et al., 2014; Di Minin and Toivonen, 2015). The Kunming-Montreal Global Biodiversity Framework, adopted by the 15th Conference of the Parties to the Convention on Biological Diversity, further emphasizes the effectiveness of PAs (UN Environment programme, 2022). Notably, methods have been adopted to assess the effectiveness of PAs, such as “before-after” comparison (Gaveau et al., 2007), “inside-outside” comparison (Wang et al., 2015), these comparisons are often influenced by environmental factors and are not sufficiently scientific. Thus, “matching” methods are gradually being applied to scientifically assess the conservation effectiveness of PAs by eliminating the effects of environmental factors (Ren et al., 2015; Geldmann et al., 2019).
Because of the absence of annual continuous land cover data, previous studies have mostly adopted the method of subtracting two years when making “before-after” comparison to explore the effectiveness of PAs (Bowker et al., 2017; Chen et al., 2017; Geldmann et al., 2019; Mammides, 2020). Studies have mainly assessed PAs’ conservation effectiveness by comparing changes in land cover (e.g., forest ecosystems) between treated samples inside PAs and their matched samples outside PAs (Gaveau et al., 2009). In this way, the relative increase of treated samples inside PAs compared to their matched samples outside PAs in land cover (natural vegetation) were able to represent a positive conservation effectiveness. However, few studies have focused on the initial status of conservation effectiveness evaluation. Without initial status, PAs with high human-pressure baselines may appear more effective than those with low baselines under equally stringent pressure conditions (Feng et al., 2022). And when forest area is used to assess conservation effectiveness of PAs, the results may be biased because natural vegetation cannot increase continuously, especially when the forest becomes a climatic community with a dynamic steady state (Meng et al., 2023). In such cases, PAs’ conservation effectiveness might be judged as negative, based merely on the relatively stable forest coverage inside PAs being compared with that of the forest ecosystem outside PAs.
The outcomes of conservation effectiveness assessments rely on the available data on PAs (Pereira et al., 2013), and data limitations lead to incomplete results and restrict the potential applicability of previous methods. Nowadays, with the development of remote sensing and monitoring techniques, additional precise and continuous data have been generated, such as forest changes from annual remote sensing datasets (Hansen et al., 2013; Yang and Huang, 2021), making it possible to identify PAs’ conservation effectiveness by integrating the state and change in land cover (e.g., forest ecosystems) in a series of periods. According to previous studies, “states” represents the baseline throughout the entire assessment period, refers to the difference of assessment indicators among samples from within and outside the PA (Feng et al., 2022). “Trends” here specifically means whether significant changes occur within the PA throughout the assessment period. And the depiction of conservation effectiveness concerning temporal changes corresponds to “relative changes”, which refers to the differences in slopes derived from sample changes within PA relative to those outside over the assessment period (Meng et al., 2023). Related studies have also emphasized the importance of an integrated framework which considers both the basic condition and dynamic comparison (Meng et al., 2023), which could increase the accuracy of conservation effectiveness assessments of PAs.
In this study, we selected the Three Parallel Rivers Region (TPRR) as our study area. The TPRR is one of the global biodiversity and cultural hotspots and a biodiversity epicenter in China and has the richest biodiversity among temperate areas worldwide (United Nations Educational Scientific and Cultural Organization (UNESCO), 2003). Fifteen PAs have been established in the TPRR, namely different levels of nature reserves and natural parks. As forests are the major ecosystem in the TPRR, which is also the basis for realizing the value of PAs and other ecosystem services, assessing conservation effectiveness is necessary to achieve long-term protection goals (Lopoukhine et al., 2012; Wang et al., 2021). Using the Annual China Land Cover Dataset (CLCD) (2000–2020) produced by the Google Earth Engine (Yang and Huang, 2021), we calculated the forest area for each year in the TPRR and every PA established from 2000 to 2020. We then constructed a framework that combined the state, trend, and relative change in forest area to assess the conservation effectiveness of each PA since 2000. Here, “state” refers to the difference among samples from within and outside the PA, assessed through yearly sample mean comparison. “Trend” means linear regression of mean forest area of each PA throughout the assessment period. And “relative change” means the difference in the mean value of the slope of forest changes between the treated samples inside each PA and their matched control samples outside of PAs. Finally, we attempted to identify the critical factors and their influence on the state and changes in forest areas in each PA. Our aim for creating this framework was that it would improve the accuracy of PA conservation effectiveness assessments and thus be adopted in future global or country-level assessments.
The TPRR is in the northwest of Yunnan, China (25°30′–29°00′ N, 98°00′–101°31′ E), with a total area of 45,000 km2. The three rivers are the Yangtze (Jinsha), Mekong (Lancang River), and Nu-Salween, which run parallel from north to south. The region is in the southern part of the Hengduan Mountains, and its topography is characterized by extremely high mountain ranges and deep valleys (Lin et al., 2016). The TPRR contains subtropical, temperate, cold temperate, cold mountain, dry-hot valley, wetland, and aquatic vegetation types (Zhang et al., 2013), which are vital for the regional-global ecology. In 2003, the TPRR was listed as a World Heritage Site for its outstanding biodiversity, geology, landscape, and rare and endangered species (United Nations Educational Scientific and Cultural Organization (UNESCO), 2003). In 2010, the UNESCO World Heritage Center adopted a minor modification to the TPRR’s boundaries (Yunnan Province, 2012).
There are fifteen PAs in the TPRR, including different levels of nature reserves and parks (Table 1). One of the PAs, the Gaoligongshan National Nature Reserve, is divided into three parts (northern, middle, and southern subregions) as three PAs in our study based on geographical location and climate; these parts are managed by different districts and counties. Notably, we excluded wetland PAs, such as the Lashihai Plateau Wetland Provincial Nature Reserve and Qinghuadian National Wetland Park. Thus, in this study, we analyzed forest changes in 14 PAs.
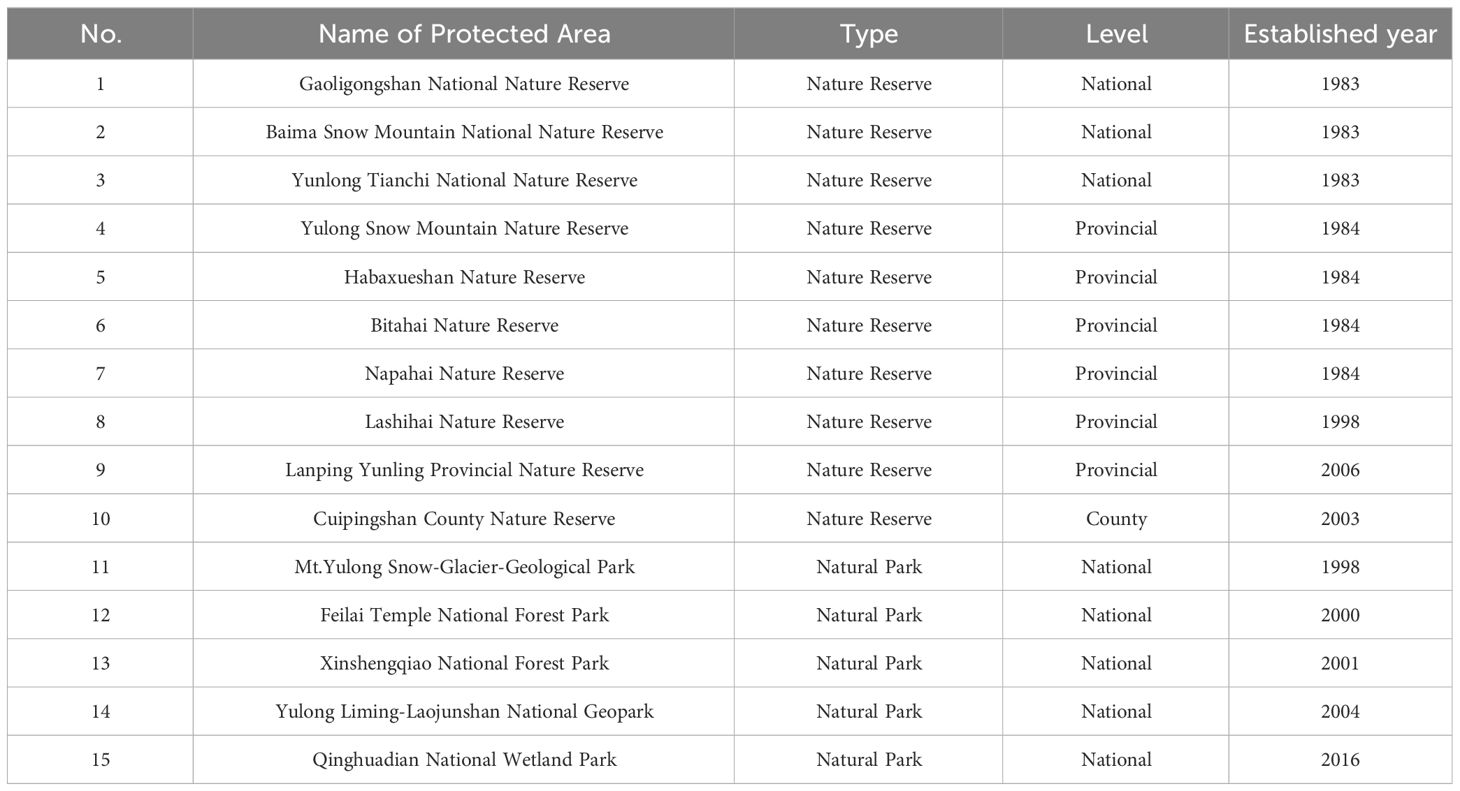
Table 1 List of all protected areas in the Three Parallel Rivers Region and their year of establishment.
In this calculation, we used the 30 m annual land cover dataset in China, the first Landsat-derived CLCD produced by the Google Earth Engine, with 79.31% overall accuracy and 85.49% accuracy for the forest category (Yang and Huang, 2021). The classification system for this dataset includes nine major land covers, which are cropland, forest, shrub, grassland, water, snow and ice, barren, impervious, and wetland. Forests include wooded land (>30% cover), open woodland, and tracks, excluding new young woodland and forest belts that are not recognizable from remote sensing imagery (Liu et al., 2003, Liu et al., 2018). We extracted forest area data from the CLCD in the TPRR for 20 consecutive years (2000–2020). We also calculated the forest area of all PAs for each year from 2000 to 2020 by overlaying the vector boundary of all PAs with the forest cover layer from the CLCD. All related spatial analyses were performed using ArcGIS 10.6. Next, we fitted a linear regression to the relationship between time on the x-axis and forest area on the y-axis. According to the results of the linear regression, the trend of the mean forest area (2000–2020) of each PA (FAtrend) was increasing (P<0.05), steady (P>0.05), and decreasing (P<0.05).
For this study area, we selected areas inside and outside the PAs as the treated and control sites. We created 1 km2 grids of the entire TPRR and assigned the grids inside and outside PAs with values of 1 and 0, respectively. We used propensity score matching (PSM) to eliminate the influence of differences in environmental factors on the sites, 6195 pairs of sites were matched. PSM is a matching method that calculates the propensity score, which is the conditional probability of assignment to a particular treatment given a vector of observed covariates, to control for bias and achieve equalization (Rosenbaum and Rubin, 1983). Here, based on major geographic and anthropogenic factors that may have an impact on matching, five control variables were considered covariates: elevation, slope, soil, distance to the nearest road, and distance to the nearest settlement. We calculated the values of these five variables at the treated and control sites in ArcGIS 10.6 by using Zonal Statistics, and completed the matching. PSM was accomplished in R version 4.3.0 with the ‘MatchIt’ package, the ‘nearest’ method was selected, and the caliper value was set to 0.2 (Cuenca et al., 2016). Therefore, the control sites outside the PAs could be counterfactual areas of the PAs, as matched unprotected areas, because there are no unprotected blank control samples of the same time period (Ferraro, 2009). Owing to the large north-south span of the TPRR, we selected control sites within a 10–50 km buffer region around each PA to avoid the spillover effect of PAs on their unprotected adjacent surroundings (Fuller et al., 2019) and removed grids that were overlaid by other PAs or their 0–10 km buffer regions.
We calculated the forest area of the treated and control sites in ArcGIS 10.6 by using Zonal Statistics from 2000 to 2020. For each PA, we compared the differences in the mean forest area for each year between the treated grids inside each PA and their matched control grids to test the state of the PA (FAstate). Because the forest areas as the dependent variable are correlated, we chose a mixed linear model (tested using “lme4” in R) to compare the differences of matched samples for each PAs. We chose mixed linear model because this model does not require a normal distribution as well as independence between samples, and also takes into account the correlation between years and groups. We set forest area as the response variable, inside and outside sample groups as fixed effects, and year as a random effect. According to the results of linear mixed model, PAs were in a good state when the mean value of the forest area of the treated grids was significantly higher than that of the matched control grids (P<0.05); in a moderate state when the mean value of the forest area of the treated grids showed no significant difference compared with that of the matched control grids (P>0.05); and in a bad state when the mean value of the forest area of the treated grids was significantly lower than that of the matched control grids (P<0.05).
For the relative change in each PA (FAchange), we compared the difference in the mean value of the slope of forest changes (2000–2020) between the treated grids inside each PA and their matched control grids. According to the Wilcoxon signed ranks test in R version 4.3.0, those PAs were increasing when the slope of forest changes in treated grids was significantly higher than that of the matched control grids (P<0.05); relatively steady when the slope of forest changes in treated grids showed no significant difference compared with that of the matched control grids (P>0.05); and decreasing when the slope of the forest changes in the treated grids was significantly lower than that of the matched control grids (P<0.05).
We developed a comprehensive framework by integrating the status, trends, and relative changes in the forest area of natural reserves, aiming to explore the assessment of natural reserve effectiveness in protecting forest ecosystems (Figure 1). This framework consists of three primary steps, each entailing distinct assessments that could impact the final outcome. Initially, the first step entails categorizing the baseline conditions of natural reserves into three distinct states (i.e., good, moderate, and bad) (Figure 1A). Subsequently, the second step involves determining the trajectory of natural reserves under various conditions (i.e., increasing, steady, and decreasing), resulting in nine possible scenarios (see Figure 1B). Lastly, the third step entails categorizing the outcomes of relative changes based on the situations identified in the preceding steps. Each gray arrow in the figure denotes the test results of relative changes corresponding to their respective categories, resulting in a total of 27 scenarios (see Figure 1C). In summary, each step entails the categorization of test results.
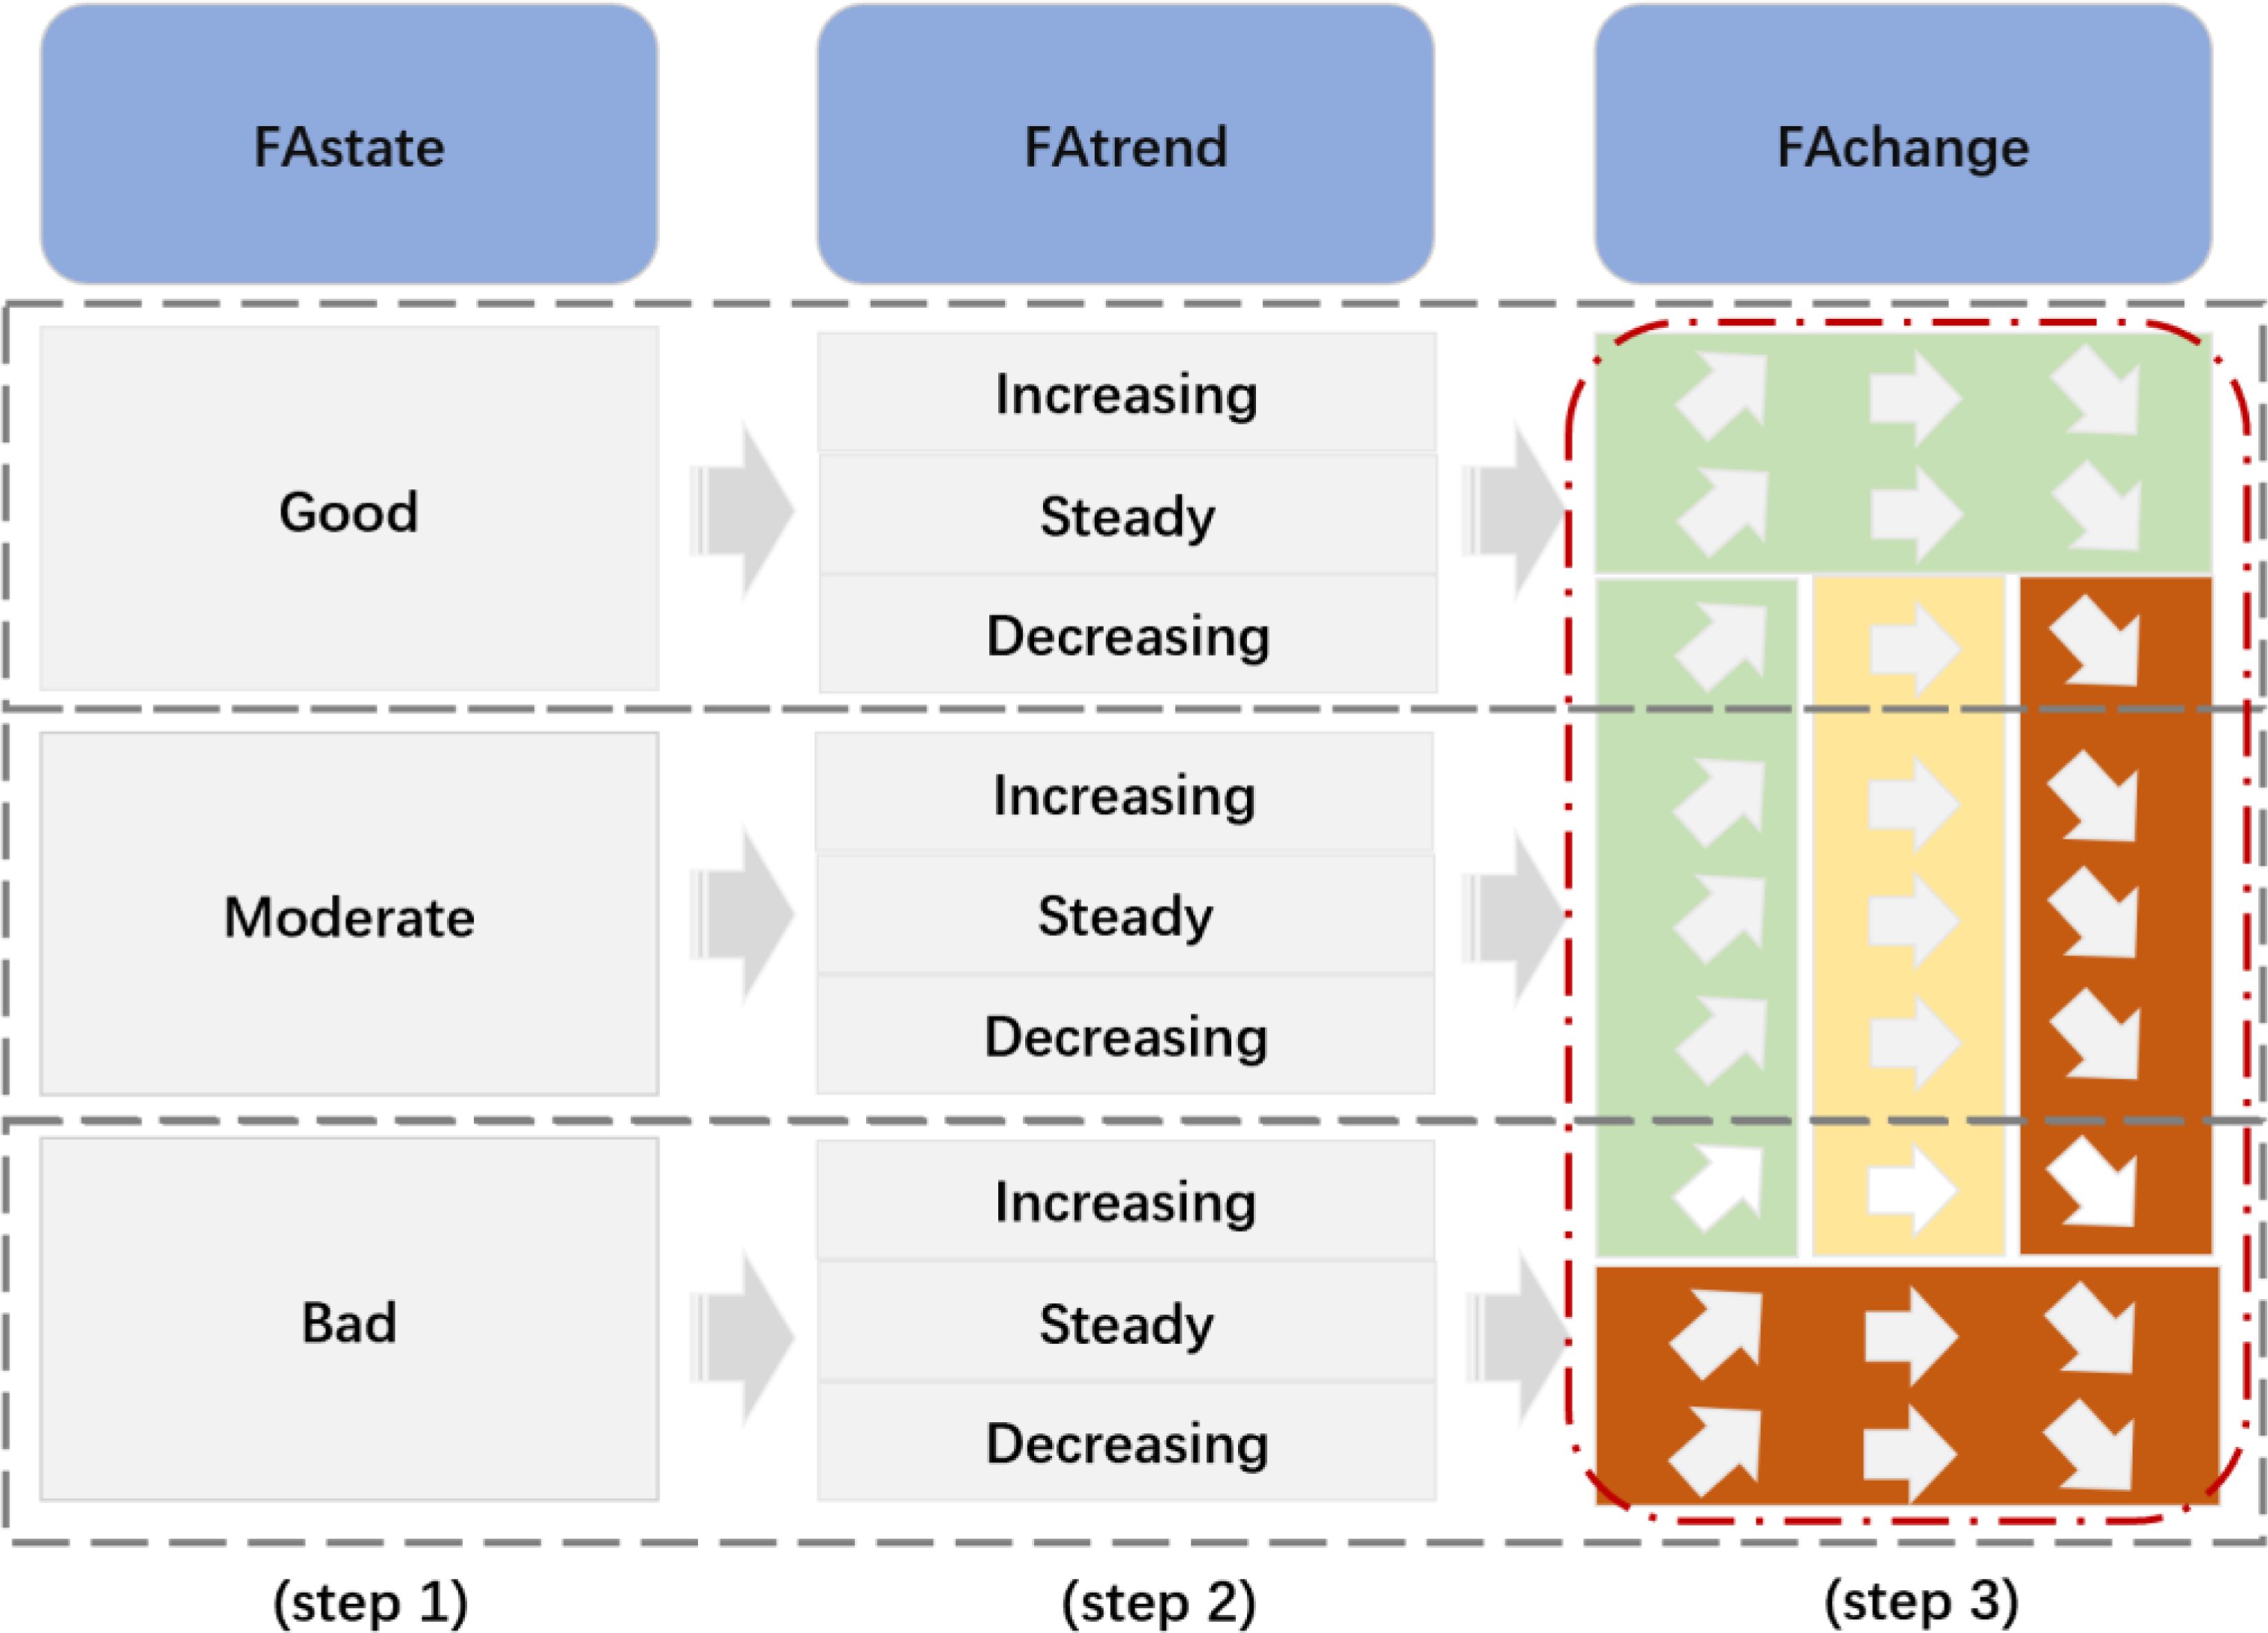
Figure 1 The framework of conservation effectiveness assessment by integrating the state, trend, and relative change in forest area of PAs. FAstate refers to the state of the forest area; FAtrend refers to the forest trend; FAchange refers to the relative change in the forest area. Step 1 divides the states into three types: good, moderate, and bad. Step 2 identifies the trend of PAs: increasing, steady, and decreasing. Step 3 explores conservation effectiveness by making judgments according to the relative change in PAs in different situations. Inside the dotted red border, the three types of gray arrows represent the results of relative change, the upward arrow represents a relative increasing change, horizontal arrows represent a relative steady change, and downward arrows represent a relative decreasing change. The three colors of the background denote the results of the conservation effectiveness situation: green, positive; orange, nonsignificant; and red, negative.
Our framework differs from previous studies in two ways. When PAs with good states showed an increasing or steady trend, they were considered to have positive impacts, regardless of the relative changes found. When PAs with bad states showed a decreasing or steady trend, they were considered to have negative impacts, regardless of the relative changes found. The remaining PAs in other situations were considered to have positive, nonsignificant, or negative impacts according to commonly used methods in the literature (Ren et al., 2015; Bowker et al., 2017; Liu et al., 2022): PAs with relative increasing forest areas had positive impacts, PAs with relatively steady forest changes had nonsignificant impacts, and PAs with relative decreasing forest areas had negative impacts (Figure 1C).
To explore possible factors influencing the conservation effectiveness of PAs and the extent of their influence, the state and relative changes in PAs were treated as independent variables. We take the 6,195 treated samples inside PAs from the previous matched samples as objects. Then we assigned the dependent variable a value of 1 for positively significant, 0 for non-significant, and -1 for negatively significant, based on the results of the tests for each PA in terms of state and relative change, separately. We selected several factors affecting the states and relative changes from natural factors, human interference, and management levels as dependent variables Natural factors included elevation, slope, mean annual temperature, and total annual precipitation. Human interference included the distance to the nearest road, change in distance to the nearest road, initial population density (2000), and changes in population density. Management level was a categorical variable with ranks of 1 (national nature reserves), 2 (provincial- and county-level nature reserves), and 3 (national natural parks). We then used the random forest regression model in R version 4.3.0 to identify the major factors (Cao et al., 2021). The percentage increase in the mean squared error was used to compare the importance of these factors. Partial dependence analyses were used to identify the relationships between major and independent variables.
For the entire region of the TPRR, the total area of the forest ecosystem was 34,700 km2 in 2020, and forest coverage was 76.8%. From 2000 to 2020, this trend showed a significant increase (R2 = 0.753, P<0.05) (Figure 2A) of 2%. During the first seven years (2000–2006), the forest area showed substantial growth and reached its first peak in 2006. The growth trends fluctuated. From 2015 to 2020, the forest area resumed a steady growth trend.
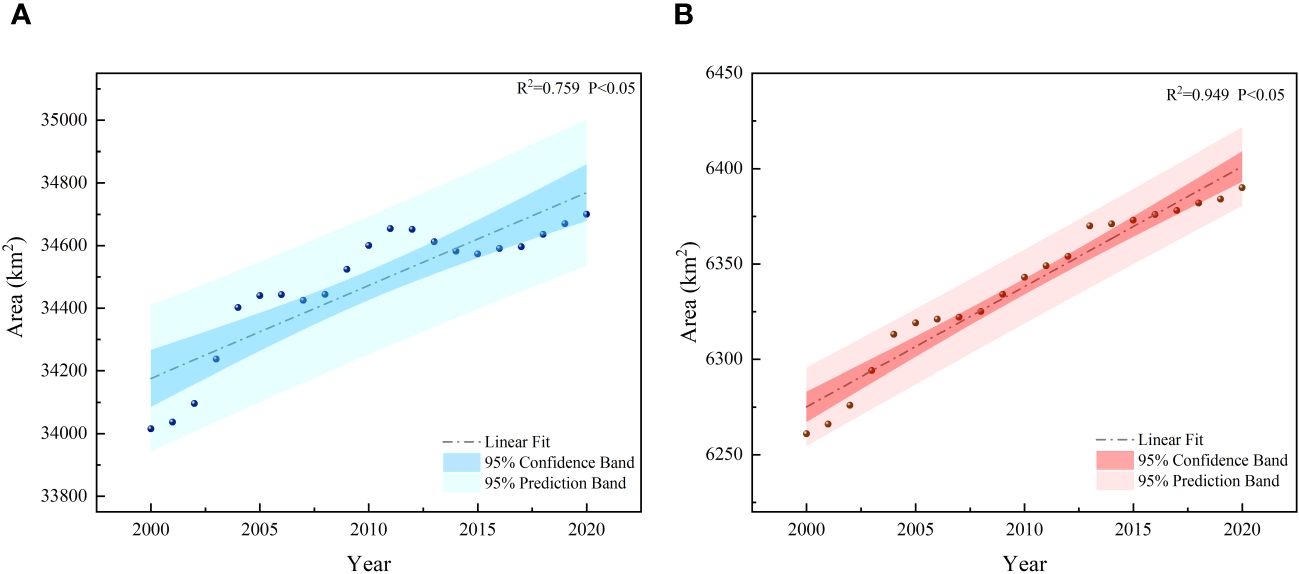
Figure 2 (A) Changes in forest area in TPRR, 2000–2020. (B) Changes in forest area in PAs, 2000–2020.
For all PAs in the TPRR, changes in forest area also showed a significant increase (R2 = 0.919, P<0.05) (Figure 2B). By the end of 2020, the forest area was 6,390 km2 in the PAs, a 2% increase from 2000. There was a large increase from 2000 to 2006 in all PAs, similar to the trends observed in the entire region. However, in contrast with the TPRR, the growth trends of the forest area from 2007 to 2012 were close to the fitted curve. After 2012, the magnitude of change in forest area in PAs gradually increased. Most PAs (n=13) in the TPRR have shown significant increasing trends over the past 20 years, (Figures 3A–M) except for the Yulong Liming-Laojunshan National Geopark, which had a stable tendency (Figure 3N).
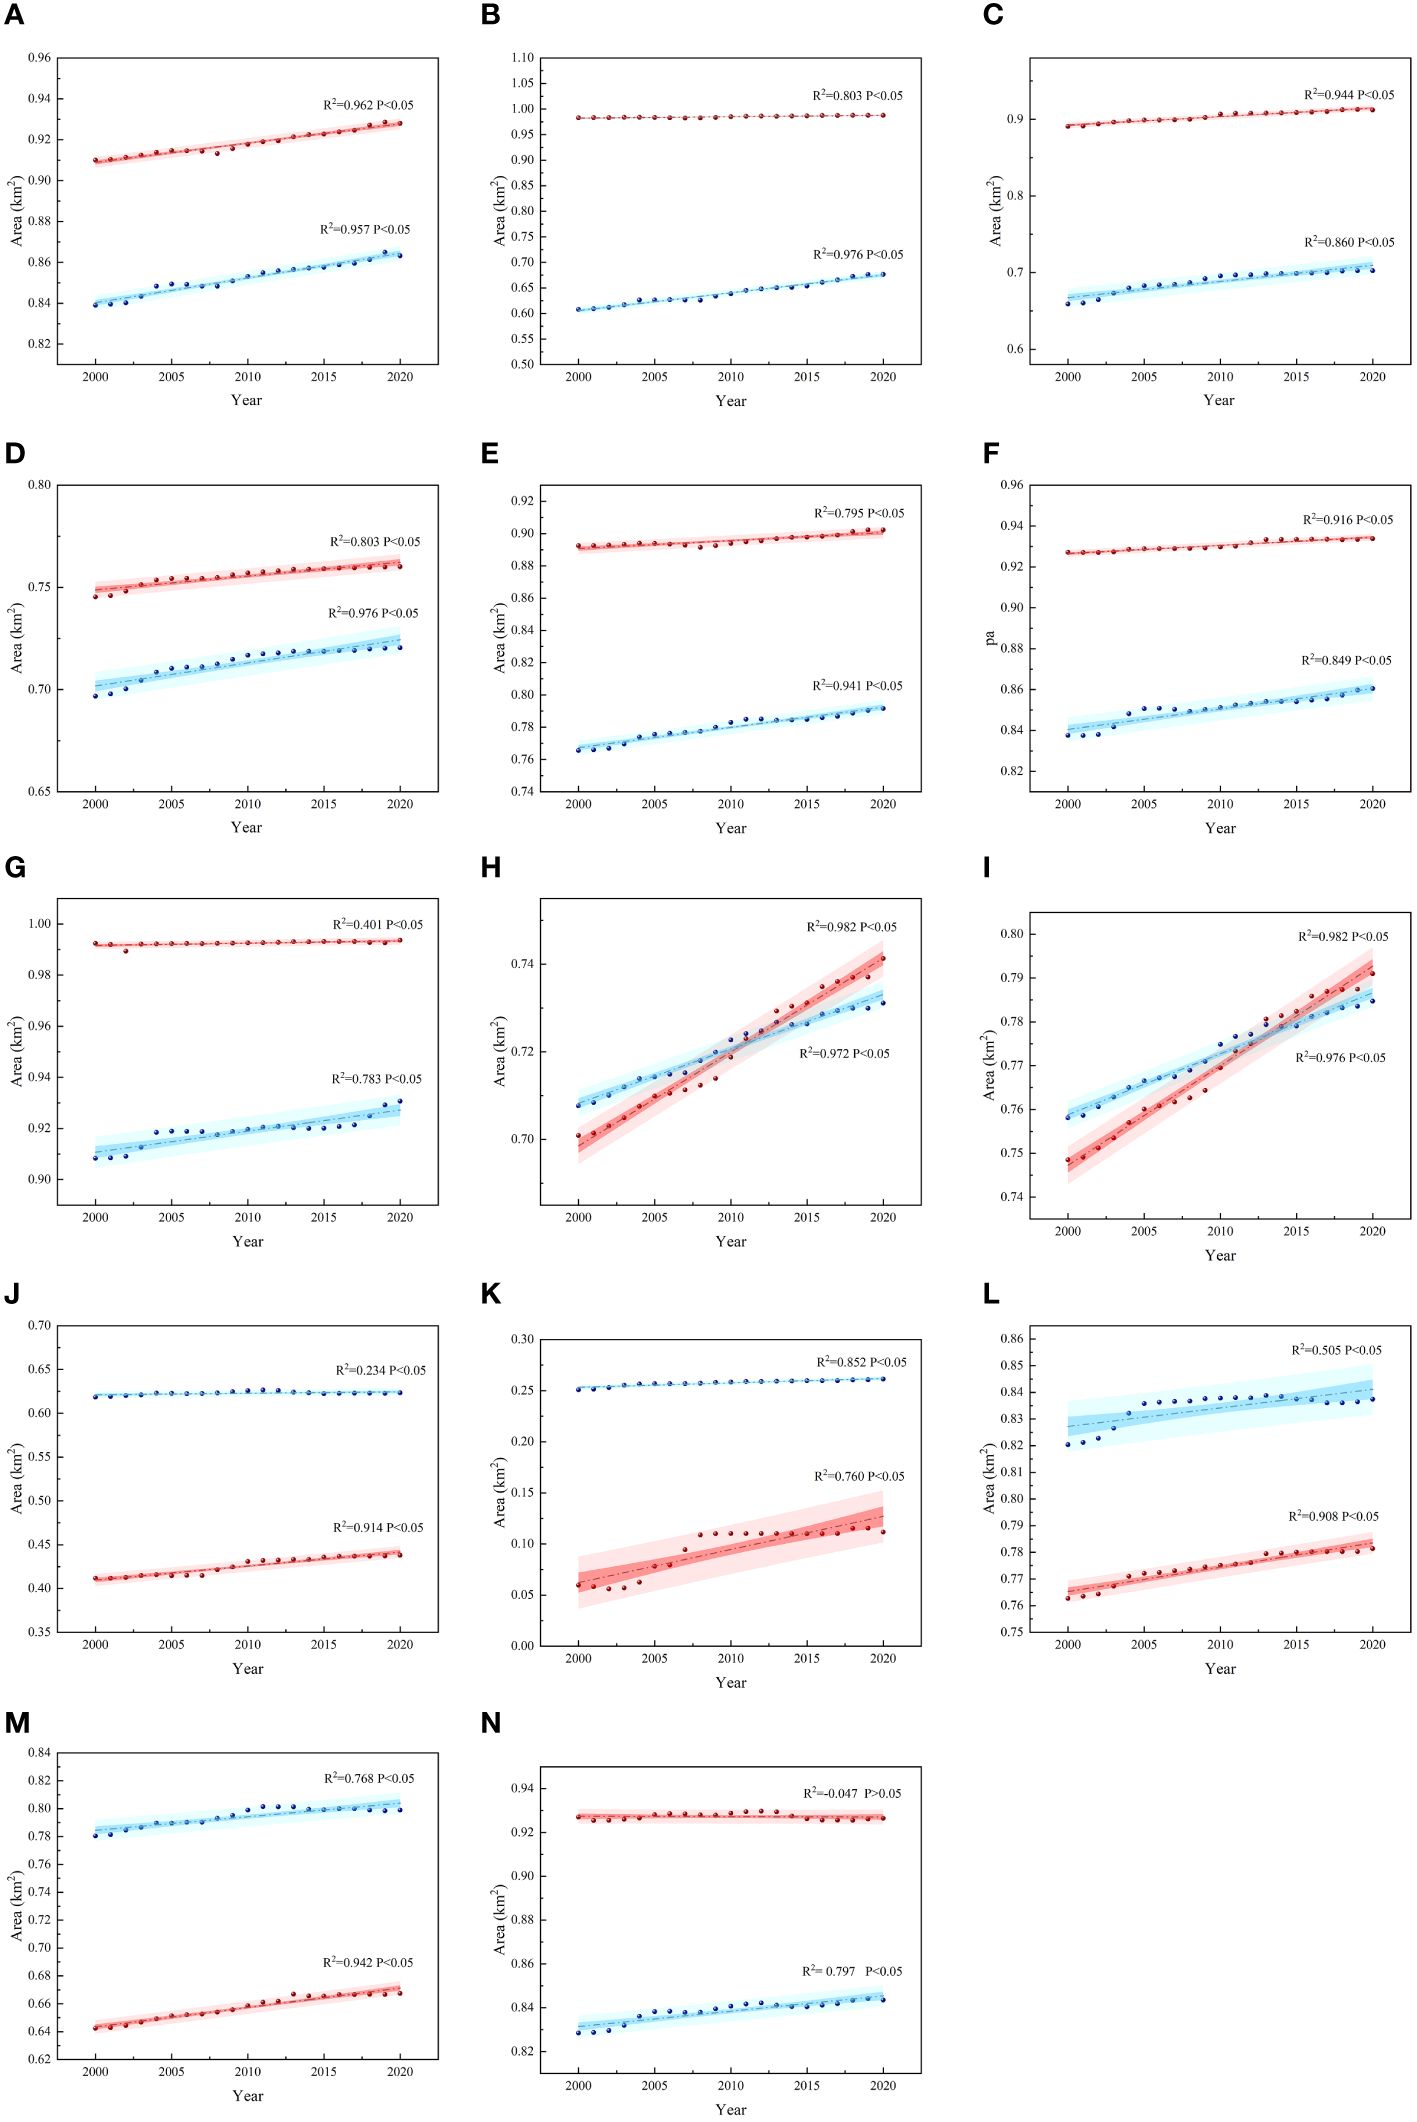
Figure 3 Average area of forest in matched treated grids of PAs and matched control grids of the outside, 2000–2020. (A) Cuipingshan County Nature Reserve; (B) Xinshengqiao National Forest Park; (C) Bitahai Nature Reserve; (D) Baima Snow Mountain National Nature Resrve; (E) Lanping Yunling Provincial Nature Reserve; (F) Middle Section of Gaoligongshan National Nature Reserve; (G) Southern Section of Gaoligongshan National Nature Reserve; (H) Mt.Yulong Snow-Glacier-Geological Park; (I) Yulong Snow Mountain Nature Reserve; (J) Feilai Temple National Forest Park; (K) Napahai Nature Reserve; (L) Northern Section of Gaoligongshan National Nature Reserve; (M) Habaxueshan Nature Reserve; (N) Yulong Liming-Laojunshan National Geopark. Red points refer to matched treated grids in each PA; blue points refer to matched control grids outside each PA.
The results of the Wilcoxon tests indicated that of the forest ecosystems of the fourteen PAs, eight were in a good state, where the mean values of the forest area of the treated grids were significantly higher than those of the matched control grids (P<0.05) over the past 20 years; one was in a moderate state; and five were in a bad state. For relative changes in forest areas, of the fourteen PAs, four PAs showed a relative increase in the slope of forest changes in their treated grids, which was significantly higher than that of the matched control grids (P<0.05); four PAs showed relatively nonsignificant changes, and 6 PAs showed relatively decreasing trends from 2000 to 2020 (Table 2). According to the framework of conservation effectiveness assessment, by integrating the state, trend, and relative change in the PAs’ forest areas (Figure 1), of the fourteen PAs, we identified twelve PAs with positive effects and two PAs with nonsignificant effects (Figure 4).
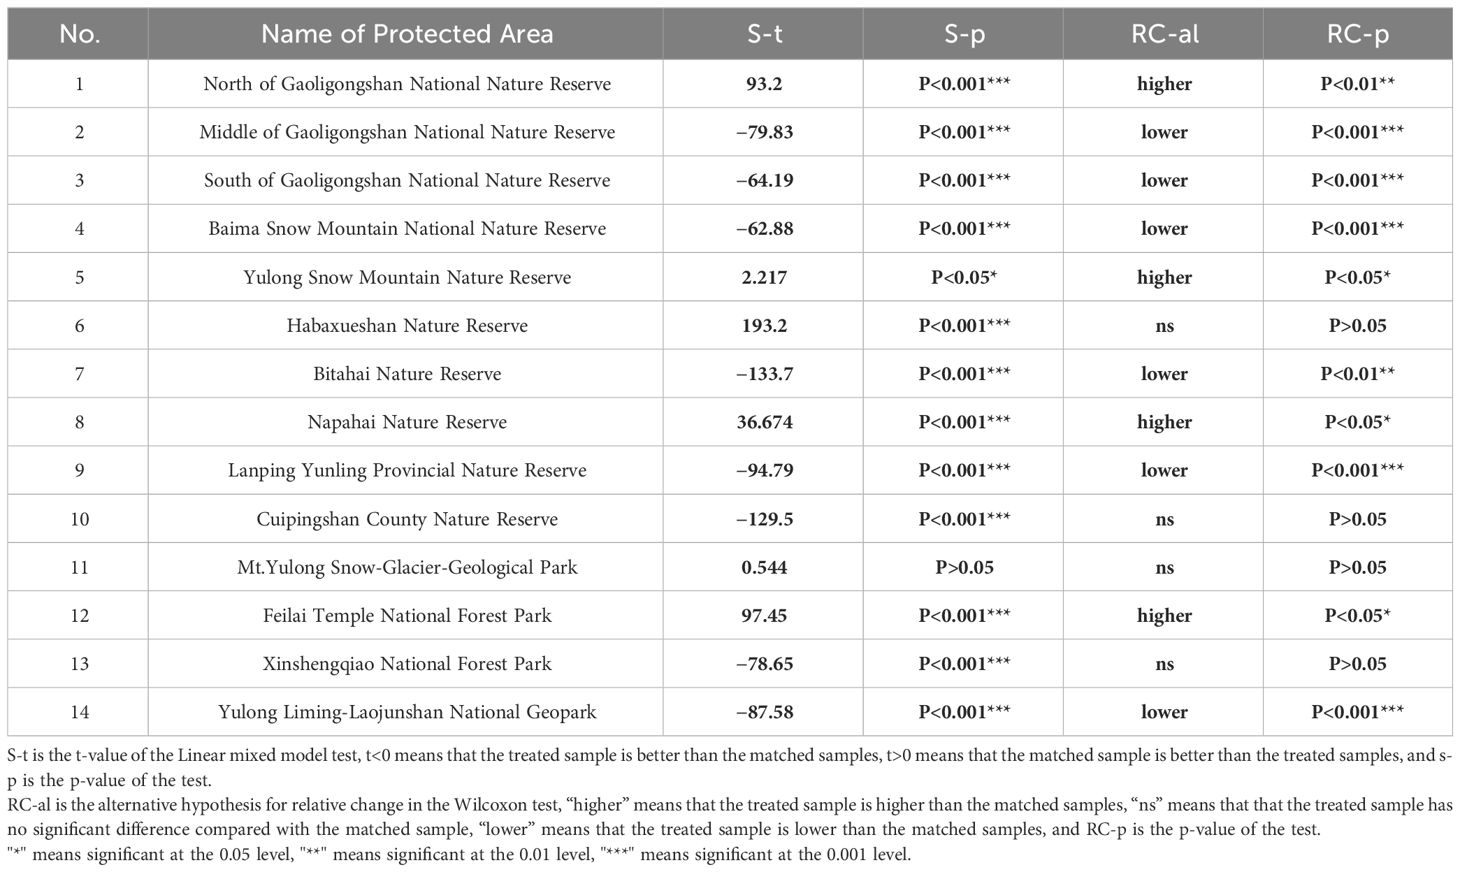
Table 2 Linear mixed model test results for state and the Wilcoxon signed ranks test results for relative change.
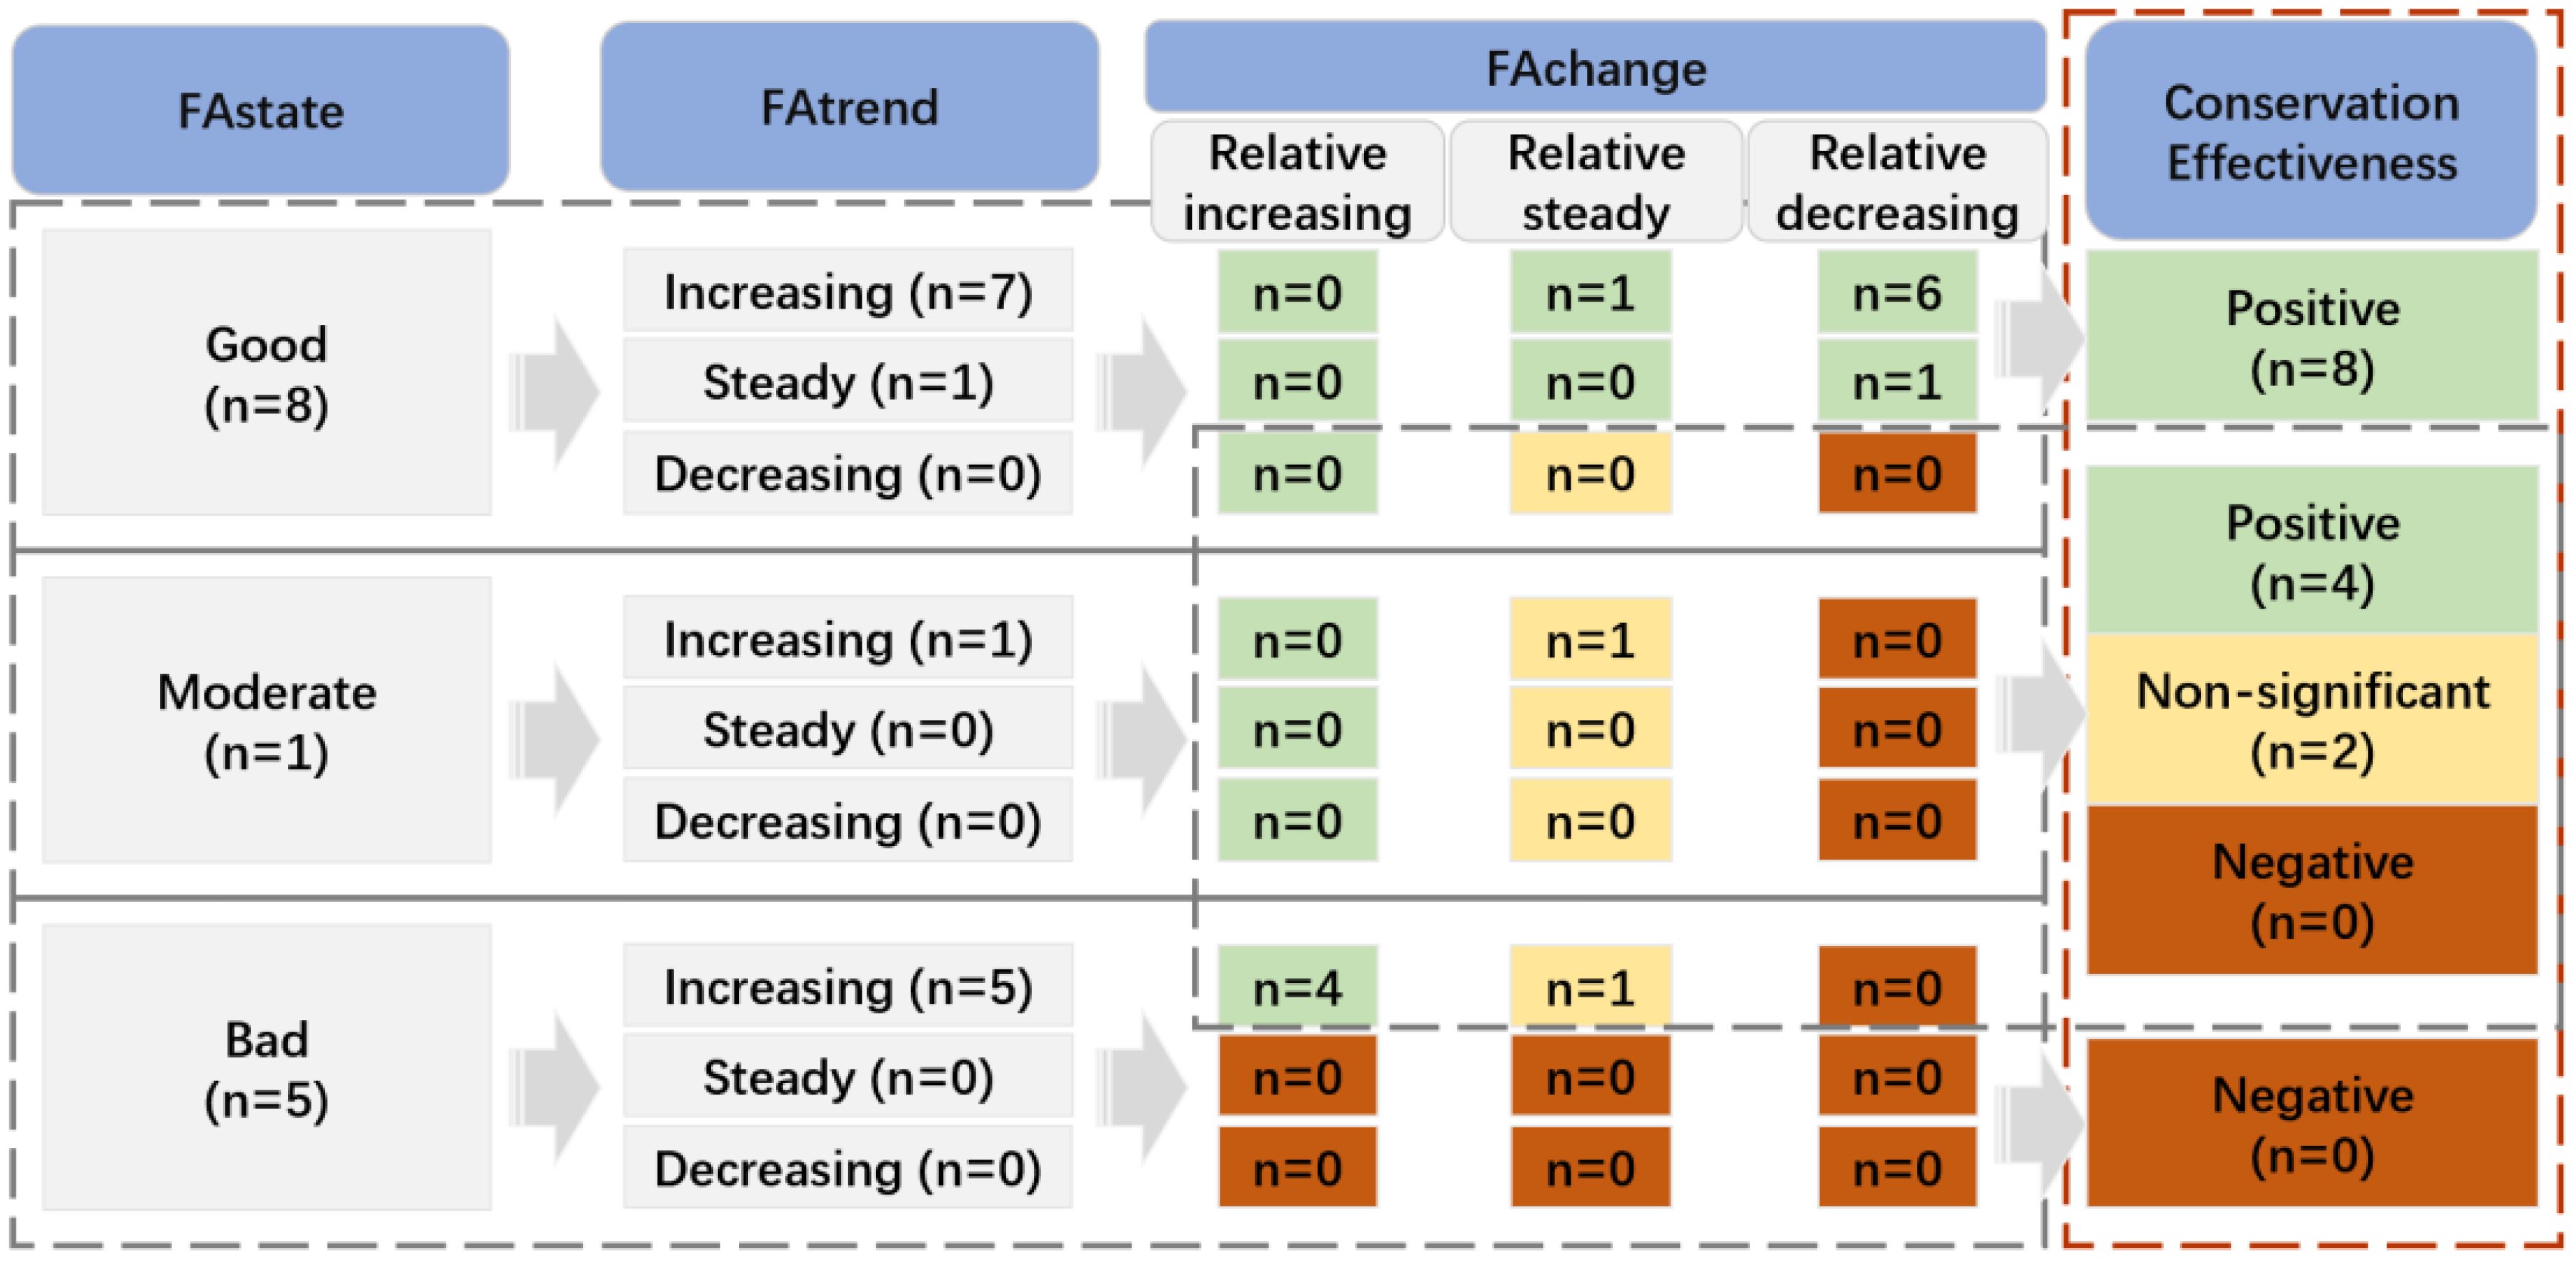
Figure 4 Results of judgments under the framework of conservation effectiveness assessment by integrating the state, trend, and relative change in forest area of PAs in TPRR. FAstate refers to the state of the forest area; FAtrend refers to the trend of the forest trend; FAchange refers to the relative change in the forest area. The results of the conservation effectiveness were summarized by the classifications of FAstate, FAtrend, and FAchange. The three colors of the background denote the results of the conservation effectiveness situation: green, positive; orange, nonsignificant; and red, negative.
All PAs (n=13) except for one that showed a steady trend showed significant increasing trends. Notably, we only identified the major factors affecting the states and relative changes in PAs.
Random forest regression analysis showed that all independent variables were relevant factors affecting the state of the forest, with an explanatory rate of 96.09% (Figure 5A). Among the nine factors, annual total precipitation was the most important. The partial dependence plots showed that the forest ecosystems of PAs were maintained in the best state when the annual total precipitation ranged from 600 to 700 mm and from 1100 to 1200 mm (Figure 5B). The distance to the nearest road was the most important factor, and the best range should be from 0 to 20 km to maintain a good state in PAs (Figure 5C). Change in distance to the nearest roads was the third most important factor, and PAs’ forests were in a good state when they were close to zero (Figure 5D). Notably, the results also showed that management level was an important factor for the dependent variable, which indicated that national PAs (nature reserves and natural parks) were in a better state than local (provincial- and county-level) nature reserves (Figure 5E). The remaining independent variables also contribute to some extent (Figures 5F–J).

Figure 5 (A) The main factors influencing the state indicators of PAs in the random forest model are denoted by the percentage increase in the mean squared error (%IncMSE). Pre: Annual total precipation; DTNR: Distance to the nearest road; CDTNR: Change in the distance to the nearest road; MR: Management rank; Temp: Annual mean temperature; IPopD: Initial population density; PopDC: population density change. (B–J) Response functions of state. Each panel shows the response of a conservation effectiveness indicator across a single variable while holding the other variables constant. Change in distance to the road is expressed as the rate of change in distance to the road from 2000 to 2020. For management rank, 1 denotes the national nature reserves, 2 denotes local nature reserves, and 3 denotes the national natural park.
Random forest regression analysis showed that all parameters were important factors affecting the relative change in the forest areas of PAs, with an explanatory rate of 95.19% (Figure 6A). Similar to the factors affecting the state of PAs’ forests, annual total precipitation was the most important factor. The partial dependence plots showed that the relative changes in forest areas of PAs increased when the annual total precipitation increased from 600 to 1000 mm and kept in relative steady when the annual total precipitation was higher than 1000 mm (Figure 6B). The distance to the nearest road was the second most important factor, and the relative changes in forest areas of PAs increased when the distance to the nearest road increased from 20 to 40 km and remained in relative steady when the distance to the nearest road was greater than 40 km (Figure 6C). The change in distance to the nearest roads was the third most important factor, and PAs’ forests were relatively decreasing when it close to 0 (Figure 6D). PAs’ forests showed a relatively decreasing trend when the mean annual temperature increased from 0 to 15°C (Figure 6E). Our results showed that management level had less impact on the dependent variable (Figure 5E). The remaining independent variables also contribute to some extent (Figures 6F–J).
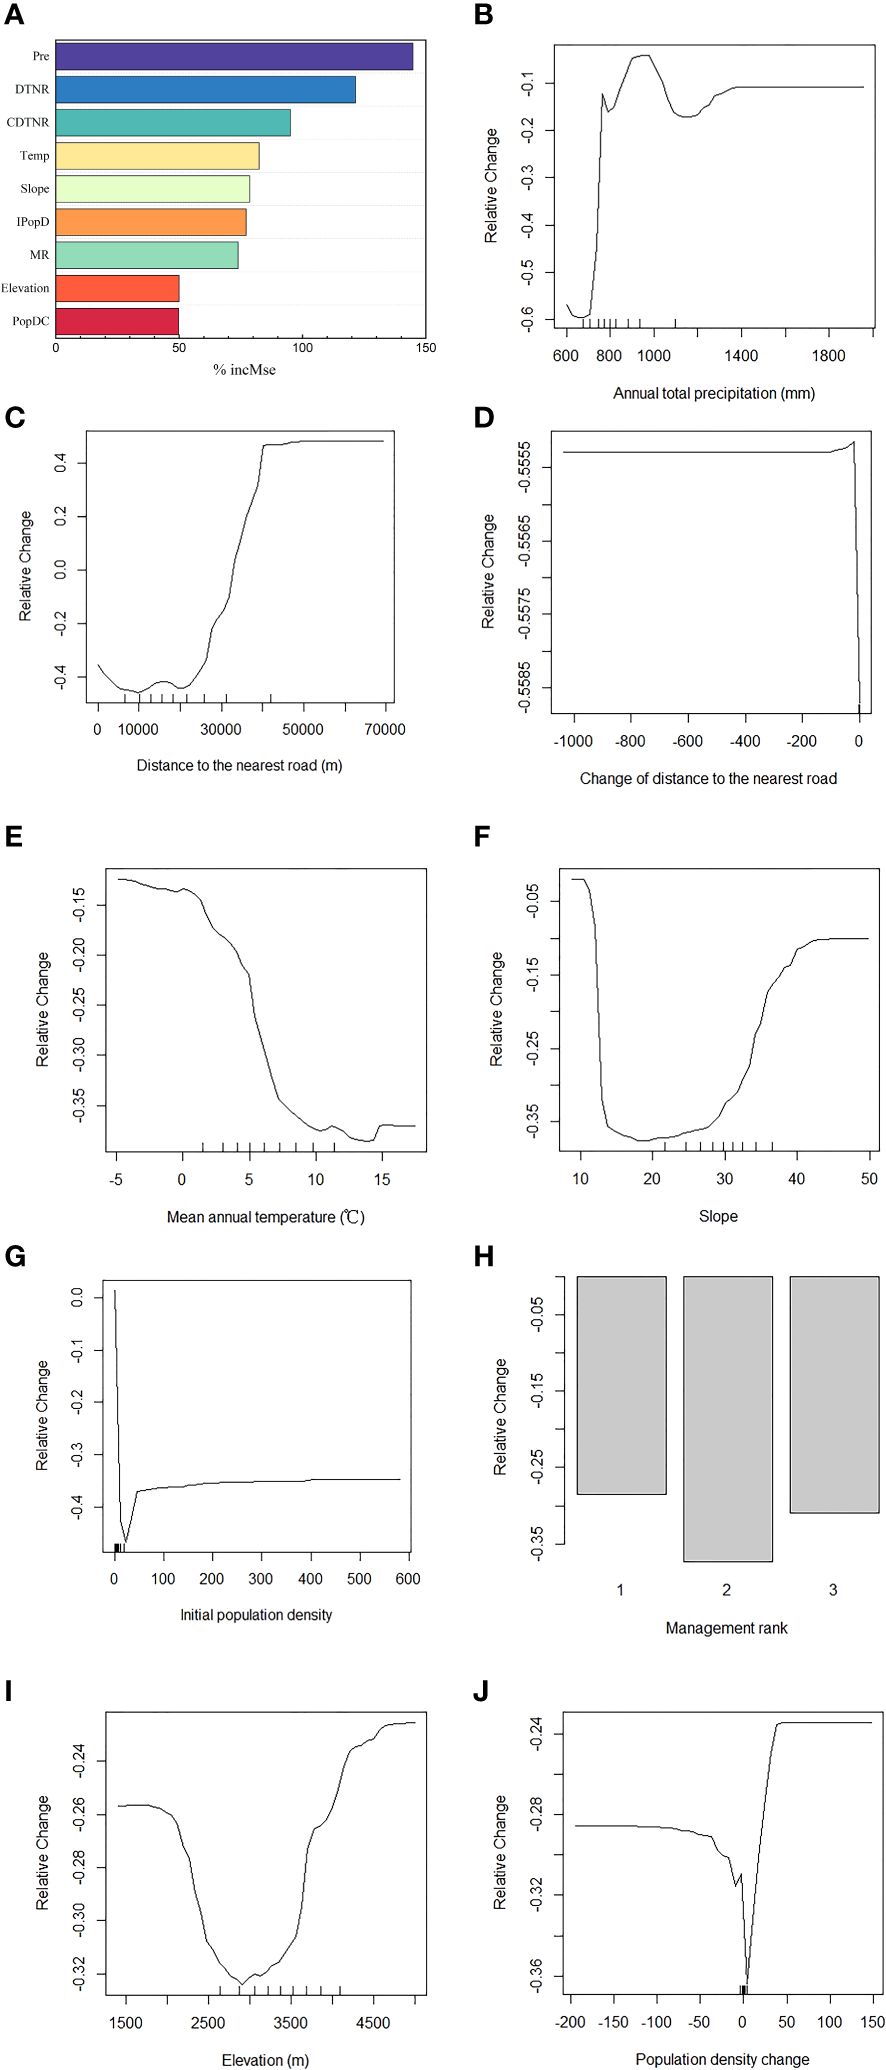
Figure 6 (A) The main factors influencing the change indicators of PAs in the random forest model denoted by the percentage increase in the mean squared error (%IncMSE). Pre: Annual total precipation; DTNR: Distance to the nearest road; CDTNR: Change in the distance to the nearest road; MR: Management rank; Temp: Annual mean temperature; IPopD: Initial population density; PopDC: population density change. (B–J) Response functions of relative change. Each panel shows the response of a conservation effectiveness indicator across a single variable while holding the other variables constant. Change in distance to the road is expressed as the rate of change in distance to the road from 2000 to 2020. For management rank, 1 denotes the national nature reserves, 2 denotes the local nature reserves, and 3 denotes the national natural park.
This study constructed a framework for assessing conservation effectiveness by classifying the results of the state, trend, and relative change in forest areas in PAs by a three-step process. Other studies have assessed the effectiveness of conservation based on relative changes in one or more indicators (Jones et al., 2018; Young et al., 2020; Graham et al., 2021; Zheng et al., 2021). This study also integrated three dimensions from the perspective of time to avoid misjudging conservation effectiveness. Because of the stabilization of forests’ ecosystems after the climax community (Huo et al., 2012; Zhang et al., 2018), when PAs are in a good state (better than the matched unprotected areas) and show increasing or steady trends during the study period, they could be considered to have positive effects in protecting forests regardless of the relative changes found. By contrast, merely comparing deforestation rates within PAs with rates in matched unprotected areas to represent conservation effectiveness may ignore the steady situation and underestimate some positive results (Wolf et al., 2021). Our results revealed that 12 (86%) of the PAs had a positive effect, and two had a nonsignificant effect. Among these twelve PAs, the 50% (n=7) with a relative decrease would be considered to have a negative effect according to the traditional method. Notably, if, in this study, we only assessed the conservation effectiveness according to the results of relative change, as performed in the literature, our conclusion would be misjudged (Wade et al., 2020; Rahman and Islam, 2021). Our methods avoid underestimation and facilitate suitable judgment specifically aimed at PAs that may achieve a climax community.
Overall, forest area in the TPRR and all the PAs showed a volatile increase since 2000, revealing a generally increasing trend that may be closely related to obtaining membership in the World Nature Heritage Site in 2003 (United Nations Educational Scientific and Cultural Organization (UNESCO), 2003). Except the rapid growth in 2003, another peak was probably associated with the minor boundary modification inscribed in 2010 that acquired approval from the State Council in 2012 (Yunnan Province, 2012), which stimulated the conservation of the entire region. Studies have also confirmed that policy changes were able to be attributed to a series of factors affecting forest area change dynamics (Feng et al., 2021), and changes in the surrounding landscape affect biodiversity and ecosystem functions (Marques et al., 2022), indicating that a holistic protection policy on a regional scale, particularly in biodiversity hotspots, is essential and effective.
The analysis of potential factors that affect PAs’ conservation effectiveness demonstrated that annual total precipitation was the most important factor for the dependent variables of state and relative change. PAs with annual total precipitation from 600 to 700 mm and higher than 1000 mm were additionally likely to be in a good state and have a relatively increasing trend, that is, a positive effect. Temperature is also a major factor in PAs’ conservation effectiveness and is the most important factor affecting vegetation growth (Pan et al., 2015; Li et al., 2020). However, from 10 to 15°C, annual temperature showed different impacts on the states and relative changes in PAs. The reason for these differences may be the variation in topography and elevation among PAs, where growing reasons vary (e.g., high elevation in the Baima Snow Mountain National Nature Reserve and low mountain areas in Xinshengqiao National Forest Park). Studies have also shown that meteorological factors, such as precipitation and temperature, are major factors affecting the effectiveness of PAs in maintaining ecosystem services (Cao et al., 2021).
Human impacts, such as road construction and management, also play influential roles in PAs’ conservation effectiveness to some extent. Regarding distance to the nearest road, different impacts were found on the states and relative changes in PAs. PAs 0–20 km from the nearest road were more likely to be in a good state, and PAs 20–40 km from the nearest road were more likely to show a relatively increasing trend. Thus, surrounding roads are conducive to the state of PAs’ forests within a certain range because roads within or near PAs might facilitate patrolling. It has also been shown that species richness increases with elevation and distance from the edge of the protected area, and that species assemblage categories differ by distance, supporting the differences in the impact of roads on conservation effectiveness (Ji et al., 2022). That deforestation declined as the distance from the road increased (Barber et al., 2014; Milien et al., 2021) illustrates that the relative change in PAs’ forest areas would be higher when the distance to the nearest road was longer than 40 km. At the management level, nature reserves are commonly assumed to be lands with higher levels of protection and management compared to natural park. However, the states of local (provincial- and county-level) nature reserves performed worse than national natural parks. This finding may be similar to that in the literature that the threat level of national PAs is lower than that of local PAs in the TPRR (Ye et al., 2015). We suggest that local administration departments focus on the threats of provincial- and county-level nature reserves and enhance improvement initiatives. Therefore, the overall conservation of World Heritage Sites is promoted by this type of effectiveness assessment (Allan et al., 2017).
In this study, we established a framework through a series of judgments according to the states, trends, and relative changes in PAs’ forested areas. A case study of the TPPR implied that the framework would be more useful in regions with high biodiversity and steady ecosystems. This framework can better avoid underestimation in conservation effectiveness assessment tasks than traditional methods can. Thus, we posit that this framework is suitable for future global or country-level assessments.
The original contributions presented in the study are included in the article/Supplementary Material. Further inquiries can be directed to the corresponding author.
HS: Conceptualization, Formal analysis, Methodology, Writing – original draft. CF: Methodology, Software, Writing – original draft. JT: Methodology, Software, Writing – original draft. LF: Methodology, Software, Writing – original draft. MC: Methodology, Software, Writing – original draft. WW: Funding acquisition, Methodology, Project administration, Writing – review & editing.
The author(s) declare financial support was received for the research, authorship, and/or publication of this article. This study was supported by the National Natural Science Foundation of China (Grant No. 32171664).
Author LF is employed by Zhengzhou University Environmental Technology Consulting Engineering Co., Ltd.
The remaining authors declare that the research was conducted in the absence of any commercial or financial relationships that could be construed as a potential conflict of interest.
All claims expressed in this article are solely those of the authors and do not necessarily represent those of their affiliated organizations, or those of the publisher, the editors and the reviewers. Any product that may be evaluated in this article, or claim that may be made by its manufacturer, is not guaranteed or endorsed by the publisher.
The Supplementary Material for this article can be found online at: https://www.frontiersin.org/articles/10.3389/fevo.2024.1321974/full#supplementary-material
Allan J. R., Venter O., Maxwell S., Bertzky B., Jones K., Shi Y., et al. (2017). Recent increases in human pressure and forest loss threaten many Natural World Heritage Sites. Biol. Conserv. 206, 47–55. doi: 10.1016/j.biocon.2016.12.011
Barber C. P., Cochrane M. A., Souza C. M., Laurance W. F. (2014). Roads, deforestation, and the mitigating effect of protected areas in the Amazon. Biol. Conserv. 177, 203–209. doi: 10.1016/j.biocon.2014.07.004
Bowker J. N., De Vos A., Ament J. M., Cumming G. S. (2017). Effectiveness of Africa’s tropical protected areas for maintaining forest cover. Conserv. Biol. 31, 559–569. doi: 10.1111/cobi.12851
Cao M., Li J., Wang W., Xia J., Feng C., Fu G., et al. (2021). Assessing the effectiveness of water retention ecosystem service in Qinling National Nature Reserve based on InVEST and propensity score matching model. biodiversity science 29, 617–628. doi: 10.17520/biods.2020271
Chen B., Liu F., Zhang Y., Du J., Wang W., Li J. (2017). Assessment of forest conservation in the Cangshan Nature Reserve based on propensity score matching. biodiversity science 25, 999–1007. doi: 10.17520/biods.2017086
Cuenca P., Arriagada R., Echeverría C. (2016). How much deforestation do protected areas avoid in tropical Andean landscapes? Environ. Sci. Policy 56, 56–66. doi: 10.1016/j.envsci.2015.10.014
Di Minin E., Toivonen T. (2015). Global protected area expansion: Creating more than paper parks. BioScience 65, 637–638. doi: 10.1093/biosci/biv064
Feng C. T., Cao M., Liu F. Z., Zhou Y., Du J. H., Zhang L. B., et al. (2022). Improving protected area effectiveness through consideration of different human-pressure baselines. Conserv. Biol. 36, e13887. doi: 10.1111/cobi.13887
Feng C., Cao M., Wang W., Wang H., Liu F., Zhang L., et al. (2021). Which management measures lead to better performance of China’s protected areas in reducing forest loss? Sci. Total. Environ. 764, 142895. doi: 10.1016/j.scitotenv.2020.142895
Ferraro P. J. (2009). Counterfactual thinking and impact evaluation in environmental policy. New Dir. Eval. 2009, 7584. doi: 10.1002/ev.297
Fuller C., Ondei S., Brook B. W., Buettel J. C. (2019). First, do no harm: A systematic review of deforestation spillovers from protected areas. Glob. Ecol. Conserv. 18, e00591. doi: 10.1016/j.gecco.2019.e00591
Gaston K. J., Jackson S. F., Cantú-Salazar L., Cruz-Piñón G. (2008). The ecological performance of protected areas. Annu. Rev. Ecol. Evol. Syst. 39, 93–113. doi: 10.1146/annurev.ecolsys.39.110707.173529
Gaveau D. L. A., Epting J., Lyne O., Linkie M., Kumara I., Kanninen M., et al. (2009). Evaluating whether protected areas reduce tropical deforestation in Sumatra. J. Biogeogr. 36, 2165–2175. doi: 10.1111/j.1365–2699.2009.02147.x
Gaveau D. L. A., Wandono H., Setiabudi F. (2007). Three decades of deforestation in southwest Sumatra: Have protected areas halted forest loss and logging, and promoted re-growth? Biol. Conserv. 134, 495–504. doi: 10.1016/j.biocon.2006.08.035
Geldmann J., Manica A., Burgess N. D., Coad L., Balmford A. (2019). A global-level assessment of the effectiveness of protected areas at resisting anthropogenic pressures. Proc. Natl. Acad. Sci. U. S. A. 116, 23209–23215. doi: 10.1073/pnas.1908221116
Graham V., Geldmann J., Adams V. M., Negret P. J., Sinovas P., Chang H. C. (2021). Southeast Asian protected areas are effective in conserving forest cover and forest carbon stocks compared to unprotected areas. Sci. Rep. 11, 23760. doi: 10.1038/s41598–021-03188-w
Hansen M. C., Potapov P. V., Moore R., Hancher M., Turubanova S. A., Tyukavina A., et al. (2013). High-resolution global maps of 21st-Century forest cover change. Science 342, 850–853. doi: 10.1126/science.1244693
Huo C., Lu X., Cgeng G. (2012). Parameter identification and simulation verifying of Southwestern Forest succession model. J. Northeast For. Univ. 40, 78–83. doi: 10.13759/j.cnki.dlxb.2012.10.034
Ji Y., Baker C. C. M., Popescu V. D., Wang J., Wu C., Wang Z., et al. (2022). Measuring protected-area effectiveness using vertebrate distributions from leech iDNA. Nat. Commun. 13, 1555. doi: 10.1038/s41467–022-28778–8
Jones K. R., Venter O., Fuller R. A., Allan J. R., Maxwell S. L., Negret P. J., et al. (2018). One-third of global protected land is under intense human pressure. Science 360, 788–791. doi: 10.1126/science.aap9565
Li M., Du J., Li W., Li R., Wu S., Wang S. (2020). Global vegetation change and its relationship with precipitation and temperature based on GLASS-LAI in 1982–2015. Sci. Geol. Sin. 40, 823–832. doi: 10.13249/j.cnki.sgs.2020.05.017
Lin S., Wu R., Hua C., Ma J., Wang W., Yang F., et al. (2016). Identifying local-scale wilderness for on-ground conservation actions within a global biodiversity hotspot. Sci. Rep. 6, 25898. doi: 10.1038/srep25898
Liu F., Feng C., Zhou Y., Zhang L., Du J., Huang W., et al. (2022). Effectiveness of functional zones in National Nature Reserves for the protection of forest ecosystems in China. J. Environ. Manage. 308, 114593. doi: 10.1016/j.jenvman.2022.114593
Liu J., Ning J., Kuang W., Xu X., Zhang S., Yan C., et al. (2018). Spatiotemporal patterns and characteristics of land-use change in China during 2010–2015. Acta Geol. Sin. 73, 789–802. doi: 10.11821/dlxb201805001
Liu J.-y., Zhang Z.-x., Zhuang D.-f., Wang Y.-m., Zhou W.-c., Zhang S.-w., et al. (2003). A study on the spatial-temporal dynamic changes of land- use and driving forces analyses of China in the 1990s. Geogr. Res. 22, 1–12. doi: 10.11821/yj2003010001
Lopoukhine N., Crawhall N., Dudley N., Figgis P., Karibuhoye C., Laffoley D., et al. (2012). Protected areas: Providing natural solutions to 21st century challenges. Sapiens 5, 117–131.
Mammides C. (2020). A global assessment of the human pressure on the world’s lakes. Glob. Environ. Change 63, 102084. doi: 10.1016/j.gloenvcha.2020.102084
Marques N. C. S., MaChado R. B., Aguiar L. M. S., Mendonça-Galvão L., Tidon R., Vieira E. M., et al. (2022). Drivers of change in tropical protected areas: Long-term monitoring of a Brazilian biodiversity hotspot. Perspect. Ecol. Conserv. 20, 69–78. doi: 10.1016/j.pecon.2022.02.001
Meng J., Li Y., Feng Y., Hua F., Shen X., Li S., et al. (2023). Anthropogenic vulnerability assessment of global terrestrial protected areas with a new framework. Biol. Conserv. 283, 110064. doi: 10.1016/j.biocon.2023.110064
Milien E. J., Rocha K. D. S., Brown I. F., Perz S. G. (2021). Roads, deforestation and the mitigating effect of the Chico Mendes extractive reserve in the southwestern Amazon. Trees, Forests and People 0.0 3, 100056. doi: 10.1016/j.tfp.2020.100056
Pan X., Wu X., Shen Y., Liu F., Zhang C. (2015). Responses of vegetation coverage changes to climate factors in the source regions of three parallel rivers. Mt Res. Dev. 33, 218–226. doi: 10.16089/j.cnki.1008–2786.000028
Pereira H. M., Ferrier S., Walters M., Geller G. N., Jongman R. H. G., Scholes R. J., et al. (2013). Essential biodiversity variables. Science 339, 277–278. doi: 10.1126/science.1229931
Rahman M. F., Islam K. (2021). Effectiveness of protected areas in reducing deforestation and forest fragmentation in Bangladesh. J. Environ. Manage. 280, 111711. doi: 10.1016/j.jenvman.2020.111711
Ren G., Young S. S., Wang L., Wang W., Long Y., Wu R., et al. (2015). Effectiveness of China’s National Forest Protection Program and nature reserves. Conserv. Biol. 29, 1368–1377. doi: 10.1111/cobi.12561
Rosenbaum P., Rubin D. (1983). The central role of the propensity score in observational studies for causal effects. Biometrika 70, 41–55. doi: 10.1093/biomet/70.1.41
Stolton S., Dudley N. (2010). Arguments for protected areas: Multiple benefits for Conservation and Use (London Washington, DC: Earthscan).
UN Environment programme (2022) Kunming-Montreal Global Biodiversity Framework. Convention on Biological Diversity. Available online at: https://www.cbd.int/gbf/.
UNEP-WCMC, and IUCN (2021). Protected Planet Report 2020 (Cambridge UK; Gland, Switzerland: UNEP-WCMC and IUCN).
United Nations Educational Scientific and Cultural Organization (UNESCO) (2003). Three Parallel Rivers of Yunnan Protected Areas (Paris, France: UNESCO World Heritage Centre). Available at: https://whc.unesco.org/en/list/1083/.
Wade C. M., Austin K. G., Cajka J., Lapidus D., Everett K. H., Galperin D., et al. (2020). What is threatening forests in protected areas? A global assessment of deforestation in protected areas 2001–2018. Forests 11, 539. doi: 10.3390/f11050539
Wang C., Wang J., Cui X., Wei Y., Sun J., Naudiyal N., et al. (2021). Spatio-temporal change in vegetation patterns and its climatic drivers in the core region of Three Parallel Rivers in southeast Tibet. Geogr. Res. 40, 3191–3207. doi: 10.11821/dlyj020201123
Wang H., Lü Z., Gu L., Wen C. (2015). Observations of China’s forest change, (2000–2013) based on Global Forest Watch dataset. Sheng. Wu. Duo. Yang. Xing. 23, 575–582. doi: 10.17520/biods.2015122
Watson J. E. M., Dudley N., Segan D. B., Hockings M. (2014). The performance and potential of protected areas. Nature 515, 67–73. doi: 10.1038/nature13947
Wolf C., Levi T., Ripple W. J., Zárrate-Charry D. A., Matthew G. ,. B. (2021). A forest loss report card for the world’s protected areas. Nat. Ecol. Evol. 5, 520–529. doi: 10.1038/s41559–021-01389–0
Yang H., Viña A., Winkler J. A., Chung M. G., Huang Q., Dou Y., et al. (2021). A global assessment of the impact of individual protected areas on preventing forest loss. Sci. Total. Environ. 777, 145995. doi: 10.1016/j.scitotenv.2021.145995
Yang J., Huang X. (2021). The 30 m annual land cover dataset and its dynamics in China from 1990 to 2019. Earth Syst. Sci. Data 13, 3907–3925. doi: 10.5194/essd-13–3907-2021
Ye X., Liu G., Li Z., Wang H., Zeng Y. (2015). Assessing local and surrounding threats to the protected area network in a biodiversity hotspot: the hengduan mountains of Southwest China. PloS One 10, e0138533. doi: 10.1371/journal.pone.0138533
Young N. E., Evangelista P. H., Mengitsu T., Leisz S. (2020). Twenty-three years of forest cover change in protected areas under different governance strategies: A case study from Ethiopia’s southern highlands. Land. Use Policy 91, 104426. doi: 10.1016/j.landusepol.2019.104426
Yunnan Province (2012). The State Council approves the master plan of the Three Parallel Rivers Scenic Area (Revised) (Kunming, Yunnan: Department of Housing and Urban-Rural Development of Yunnan Province). Available at: https://zfcxjst.yn.gov.cn/zhengfuxinxigongkai/guihuaxinxi8780/286040.html.
Zhang R., Wu N., An K., Li S. (2018). Investigation and protection of botanical diversity for semi-humid evergreen broad-leaved forest of central yunnan at succession stages. For. Inventory. Plann. 43, 34–38. doi: 10.3969/j.issn.1671-3168.2018.01.007
Zhang Y., Zhang Z., Geng Y., Ou X., Peng S., Wang W., et al. (2013). Priority plant communities for conservation in Northwest Yunnan. Sheng. Wu. Duo. Yang. Xing. 21, 296–305. doi: 10.3724/SP.J.1003.2013.10207
Keywords: conservation effectiveness, integrated framework, natural park, nature reserve, northwest Yunnan
Citation: Shen H, Feng C, Tian J, Fan L, Cao M and Wang W (2024) Effectiveness assessment of protected areas based on the states, trends, and relative changes in forest ecosystem: a case study in the Three Parallel Rivers Region, China. Front. Ecol. Evol. 12:1321974. doi: 10.3389/fevo.2024.1321974
Received: 15 October 2023; Accepted: 03 May 2024;
Published: 21 May 2024.
Edited by:
Jie Liang, Hunan University, ChinaReviewed by:
Viorel Dan Popescu, Columbia University, United StatesCopyright © 2024 Shen, Feng, Tian, Fan, Cao and Wang. This is an open-access article distributed under the terms of the Creative Commons Attribution License (CC BY). The use, distribution or reproduction in other forums is permitted, provided the original author(s) and the copyright owner(s) are credited and that the original publication in this journal is cited, in accordance with accepted academic practice. No use, distribution or reproduction is permitted which does not comply with these terms.
*Correspondence: Wei Wang, d2FuZy53ZWlAY3JhZXMub3JnLmNu
†Present address: Jing Tian, Inner Mongolia Autonomous Region Forestry and Grassland Science and Technology Innovation Center, Inner Mongolian Academy of Forestry Sciences, Hohhot, China
Luqiong Fan, EIA Department, Zhengzhou University Environmental Technology Consulting Engineering Co., Ltd, Zhengzhou, Henan, China
Disclaimer: All claims expressed in this article are solely those of the authors and do not necessarily represent those of their affiliated organizations, or those of the publisher, the editors and the reviewers. Any product that may be evaluated in this article or claim that may be made by its manufacturer is not guaranteed or endorsed by the publisher.
Research integrity at Frontiers
Learn more about the work of our research integrity team to safeguard the quality of each article we publish.