 Ellie Lo1,2
 Rui-E Nie
 Alfried P. Vogler
94% of researchers rate our articles as excellent or good
Learn more about the work of our research integrity team to safeguard the quality of each article we publish.
Find out more
ORIGINAL RESEARCH article
Front. Ecol. Evol. , 01 May 2024
Sec. Phylogenetics, Phylogenomics, and Systematics
Volume 12 - 2024 | https://doi.org/10.3389/fevo.2024.1305898
Introduction: DNA barcoding in insects has progressed rapidly, with the ultimate goal of a complete inventory of the world’s species. However, the barcoding effort to date has been driven by a few national campaigns and leaves much of the world unsampled. This study investigates to what degree the current barcode data cover the species diversity across the globe, using the leaf beetle family Chrysomelidae as an example.
Methods: A recent version (June 2023) of the Barcode-of-Life database was subjected to test of sampling completeness using the barcode-to-BIN ratio and sampling coverage (SC) metric. All barcodes were placed in a phylogenetic tree of ~600 mitochondrial genomes, applying phylogenetic diversity (PD) and metrics of community phylogenetics to national barcode sets to test for sampling completeness at clade level and reveal the global structure of species diversity.
Results: The database included 73342 barcodes, grouped into 5310 BINs (species proxies) from 101 countries. Costa Rica contributed nearly half of all barcode sequences, while nearly 50 countries were represented by less than ten barcodes. Only five countries, Costa Rica, Canada, South Africa, Germany, and Spain, had a high sampling completeness, although collectively the barcode database covers most major taxonomic and biogeographically confined lineages. PD showed moderate saturation as more species diversity is added in a country, and community phylogenetics indicated clustering of national faunas. However, at the species level the inventory remained incomplete even in the most intensely sampled countries, and the sampling was insufficient for assessment of global species richness patterns.
Discussion: The sequence-based inventory in Chrysomelidae needs to be greatly expanded to include more areas and deeper local sampling before reaching a knowledge base similar to the existing Linnaean taxonomy. However, placing the barcodes into a backbone phylogenetic tree from mitochondrial genomes, a taxonomically and biogeographically highly structured pattern of global diversity emerges into which all species can be integrated via their barcodes.
Taxonomic identifications increasingly rely on DNA data, which may aid the global efforts of recording and monitoring biodiversity, especially for highly diverse and poorly known lineages such as tropical insects. The wide use of DNA barcodes (Hebert et al., 2003) and the global efforts to sequence the genomes of all eukaryotes (Lewin et al., 2022) thus have the potential to supplant the existing morphological classification, as initially proposed under the notion of DNA taxonomy (Tautz et al., 2003). However, our knowledge of species diversity on Earth has accumulated slowly over time through the efforts of generations of taxonomists and naturalists, and generating a similar database on the molecular level will be a formidable task. Since it was first applied as a new tool in taxonomy some 20 years ago, DNA barcoding has progressed rapidly through the efforts of national and international campaigns of sampling and sequencing, e.g. leading to a compilation of sequence data for some 69,000 species of insects (Chesters, 2020).
To date, DNA barcoding efforts have been haphazard in their taxonomic and geographic scope, mainly driven by national funding programs and efforts by individual researchers focused on particular regions or taxa of interest, without considering the representation of all species and coverage at the global level. This approach undoubtedly has left major gaps in the DNA barcode database, resulting in high sampling density in some areas and no records at all in others (Chesters, 2020). Geographically uneven sampling density has the effect that endemic species and lineages are missing which, depending on the magnitude of the unsampled areas and the biogeographic structure of species distributions, may lead to the omission of entire clades of the tree-of-life. This effect is exacerbated if the majority of barcode data comes from the north-temperate zones, which are less species rich and less finely structured geographically than the presumed ancestral tropical lineages from which most of them are derived (Quintero et al., 2023). The lack of completeness also limits the use of these data to assess global biodiversity patterns of richness and turnover, to which barcodes can make a major contribution (Seymour et al., 2022).
In the short term it will be impossible to sample all regions on Earth comprehensively at the species level. However, species diversity is distributed non-randomly and can be split into approximately seven biogeographic realms and further subregions within these, which harbour particular clades of various phylogenetic depth (Holt et al., 2013; Feijó et al., 2022). Thus the biogeographic structure of biodiversity may be used to address the question about sampling completeness at deeper levels, i.e. the sampling of clades and regionally distributed radiations, rather than individual species. We can now ask if we have captured the main phylogenetic and biogeographic lineages even without comprehensive sampling at the species level, and in which region of the world and at what geographic scale (grain) do we need to sample for such a lower-resolution map of diversity. To do this kind of analysis, we require a sufficiently accurate phylogenetic tree that places the existing, albeit undersampled barcodes into a framework of biogeographically confined deeper lineages.
Given high rates of nucleotide change, the power of barcodes such as the COI (cytochrome c oxidase subunit I) mitochondrial barcode in animals lies at or near the species level. It is thus used primarily for species recognition against validated libraries of identified reference sequences and for the preliminary delimitation of species entities from sequence similarity clustering, e.g. with the algorithm that creates the Barcode Index Numbers (BINs) as a species proxy (Ratnasingham and Hebert, 2013). Barcodes are therefore grouped into species-level clusters locally or on a national level (e.g. Creedy et al., 2020), or across a wider distributional range to detect species boundaries (Bergsten et al., 2012). At higher taxonomic levels, barcodes are generally considered insufficiently informative due to their short sequence length and high levels of homoplasy (DeSalle and Goldstein, 2019), which would preclude their use in phylogenetic studies of biogeography. However, barcodes may be informative locally in the tree in conjunction with other markers that sample the tree less densely but have greater phylogenetic power (Talavera et al., 2022; Letsch and Beran, 2023). Mitochondrial genomes thus provide a scaffold to the relationships inferred by COI barcodes.
Here, we assess the completeness of the currently available barcodes at species, phylogenetic, and biogeographic levels, using the Barcode of Life Datasystem (BOLD) database and the family Chrysomelidae (leaf beetles) as our focal group. Chrysomelids are one of a few highly diverse lineages of the Coleoptera with approximately 40,000 described species. They are herbivorous in the larval and adult stages, which makes them of great interest to agriculture (De Heij and Willenborg, 2020), biocontrol (Sánchez-Restrepo et al., 2023), conservation (Hewson, 2005; Wendorff and Schmitt, 2019), and as bioindicators (Chowdhury et al., 2023). They are regularly caught by hand and in passive traps, and they are well represented in barcoding and metabarcoding studies, including the Global Malaise Trap Program (GMP) (Geiger et al., 2016; Seymour et al., 2022) and the SITE-100 initiative (Bian et al., 2022), and thus they are representative of numerous other lineages obtained in these campaigns. In addition, a recent mitogenome phylogeny of some 600 species covered the main clades within the family and showed their biogeographic confinement to particular regions and deep splits of New World and Old World lineages (Nie et al., 2020, 2024). Chrysomelids therefore can be used to address questions about the sampling completeness both at species and phylogenetic levels. Mirroring the situation of most taxonomic groups in the barcode databases, the sampling intensity of chrysomelids differs greatly between countries around the world, which raises the question, what is the necessary sampling depth to estimate completeness and total diversity? In addition, given the difficulty of obtaining comprehensive inventories at the species level, we may instead want to consider the level of completeness of biogeographically confined deeper lineages, which can be tested using tree-based measures such as Phylogenetic Diversity (PD) (Faith, 1992). If membership in widespread lineages is confirmed, the data from the most highly sampled countries may fill the gaps in sampling elsewhere and thus we may reach a level of completion sooner by considering phylogenetic diversity than species diversity. Ultimately these analyses should be able to address questions about the true structure of biodiversity on Earth from knowledge about the richness and biogeographic distribution of species and lineages, but this is only possible if we can estimate the sampling completeness in the existing data. Identifying the gaps in sampling therefore will help to prioritise geographic regions and taxonomic groups for future study towards a mostly complete barcode inventory in highly diverse but taxonomically poorly known lineages.
The analysis used all COI barcodes of Chrysomelidae available at the Barcode of Life Data System (Ratnasingham and Hebert, 2007) in June 2023 (Supplementary Table 1) and the BIN groups generated from these sequences at the same time (Supplementary Table 2). The longest nucleotide sequence within each unique BIN was chosen as a representative for the construction of the phylogenetic tree. BINs were used independently of their assignment to Linnaean names, leading to a number of cases where both classifications were inconsistent. The sequences representing each BIN were added to an existing aligned dataset of mitochondrial genomes of 622 species of Chrysomelidae (Nie et al., 2024), of which 58 incomplete mitogenome sequences lacking the COI region were removed. The BIN representative sequences were aligned to the corresponding barcode region of the mitogenome sequences with MAFFT v. 7 (Katoh and Standley, 2013). Phylogenetic tree searches were conducted on the COI barcode region with RAxML v. 8.2.12 on the nucleotide sequences under the GTRCAT model and 100 rapid bootstrap replicates (Stamatakis, 2014). The best tree generated by Nie et al. (2024) was used as a backbone constraint during tree searches.
Sample completeness, i.e. the ratio of observed species (BIN) richness to the true richness, in a given country was assessed in two ways. First, we assessed sample completeness from the number of barcode sequences per BIN (Barcodes-to-BIN ratio). This criterion is based on the assumption that, as additional specimens are sequenced, the new barcodes mostly pertain to BINs already sampled previously and thus no longer lead to the discovery of new BINs. The Barcodes-to-BINs ratio therefore indicates the degree of completeness to which an area’s BINs have been sampled. Second, we used sample coverage (SC) employing the method of Chao and Jost (2012). The method uses an asymptotic approach to approximate the true sample coverage. Unlike traditional rarefaction methods, SC establishes sample completeness by standardising the samples to equal coverage rather than equal sample size. This reduces the problem of assessing sample completeness across countries that differ in total species richness, where a given number of barcode sequences may be sufficient to characterise a species-poor but not a species-rich community. The SC was calculated for each country to estimate the sample completeness using the R package iNEXT (Hsieh et al., 2016; Chao et al., 2023).
Expected values for total species diversity in a country were established by extrapolation, using asymptotic estimators to predict the level of diversity in each country if it were censused completely (Roswell et al., 2021). The chosen rarefaction and extrapolation methods used to estimate the expected values for species richness and Faith’s PD of each country were obtained based on Hill diversity (Hill, 1973), which was used with q = 0 for calculating species (and PD) richness, while species abundances were not considered. PD for a given country was calculated on the global phylogenetic tree after pruning all taxa except for species observed in this country. Analyses were performed with the iNEXT and iNEXTPD2 packages for species richness and PD, respectively. Expected phylogenetic diversity and species richness were derived from the horizontal asymptote.
For each country, besides PD, four different phylogenetic metrics of community composition were calculated. The Mean Pairwise Distance (MPD) and the Net Relatedness Index (NRI) derived from it represent a measure of the mean interspecies distance in a set. The Mean Nearest Taxon Distance (MNTD) and the derived Nearest Taxon Index (NTI) are measures of the mean shortest distance between a species and any of the others (nearest neighbour). In the framework of (Tucker et al., 2016), MPD and NRI are considered as measures of divergence, and MNTD and NTI as measures of regularity. These metrics were obtained with the R package picante. However, the package does not directly provide NRI and NTI values, so they were determined by implementing the following calculations on the standardised effect sizes (SES) of MPD and MNTD provided by picante:
Thus, for NRI and NTI significant positive values indicate phylogenetic clustering whilst significant negative values indicate overdispersion. To account for varied country areas, where required, all computed values were divided by log10 of their respective country sizes in km2 as a method of normalisation (Qian et al., 2023).
The extraction of COI barcodes from BOLD vs.4 using the search term “Chrysomelidae’’ yielded 73342 barcodes, of which 44303 had been generated by the Centre for Biodiversity Genomics and 16993 barcodes were mined from Genbank, with the remainder contributed by some 10 institutions notably from Germany, USA, China, Indonesia, and Finland. Of those, 62372 barcodes (85%) were assigned to a BIN, representing 5310 unique BINs from 101 countries. Preliminary phylogenetic analyses revealed 4 barcodes not closely related to other chrysomelids, which were removed, resulting in a final set of 5306 BINs. For each BIN we recorded their associated Linnaean name(s), country (countries) of origin, and the number of barcode sequences assigned to each BIN (Supplementary Table 2). After further removing records from countries with less than 10 barcodes, entries for 53 countries were retained with a total of 62112 (84.7%) barcodes and 4854 BINs. Subsequent analyses of BIN abundance and geographical distributions were carried out on this set, while a representative sequence for each of the full set of BINs was included in the phylogenetic analyses.
We first constructed a phylogenetic tree of BIN representative sequences together with 574 mitogenome sequences of Nie et al. (2024) on the COI region of the combined total of 5870 terminals, applying a backbone constraint from the previous mitogenome analysis (Figure 1). The tree included representatives of all 12 currently recognised subfamilies (Zhang et al., 2022), all of which were monophyletic, and their relationships were consistent with the constraint tree. The species diversity at subfamily level also was broadly correlated with the known species numbers, especially showing the prevalence of Galerucinae (15000 known species), Eumolpinae (7000 species), Cryptocephalinae (5300 species) and Chrysomelinae (3000 species) represented here by 3420, 580, 532 and 286 BINS, respectively. Only the small subfamily Synetinae with 12 described species was represented by a higher than expected 16 BINs (Figure 1).
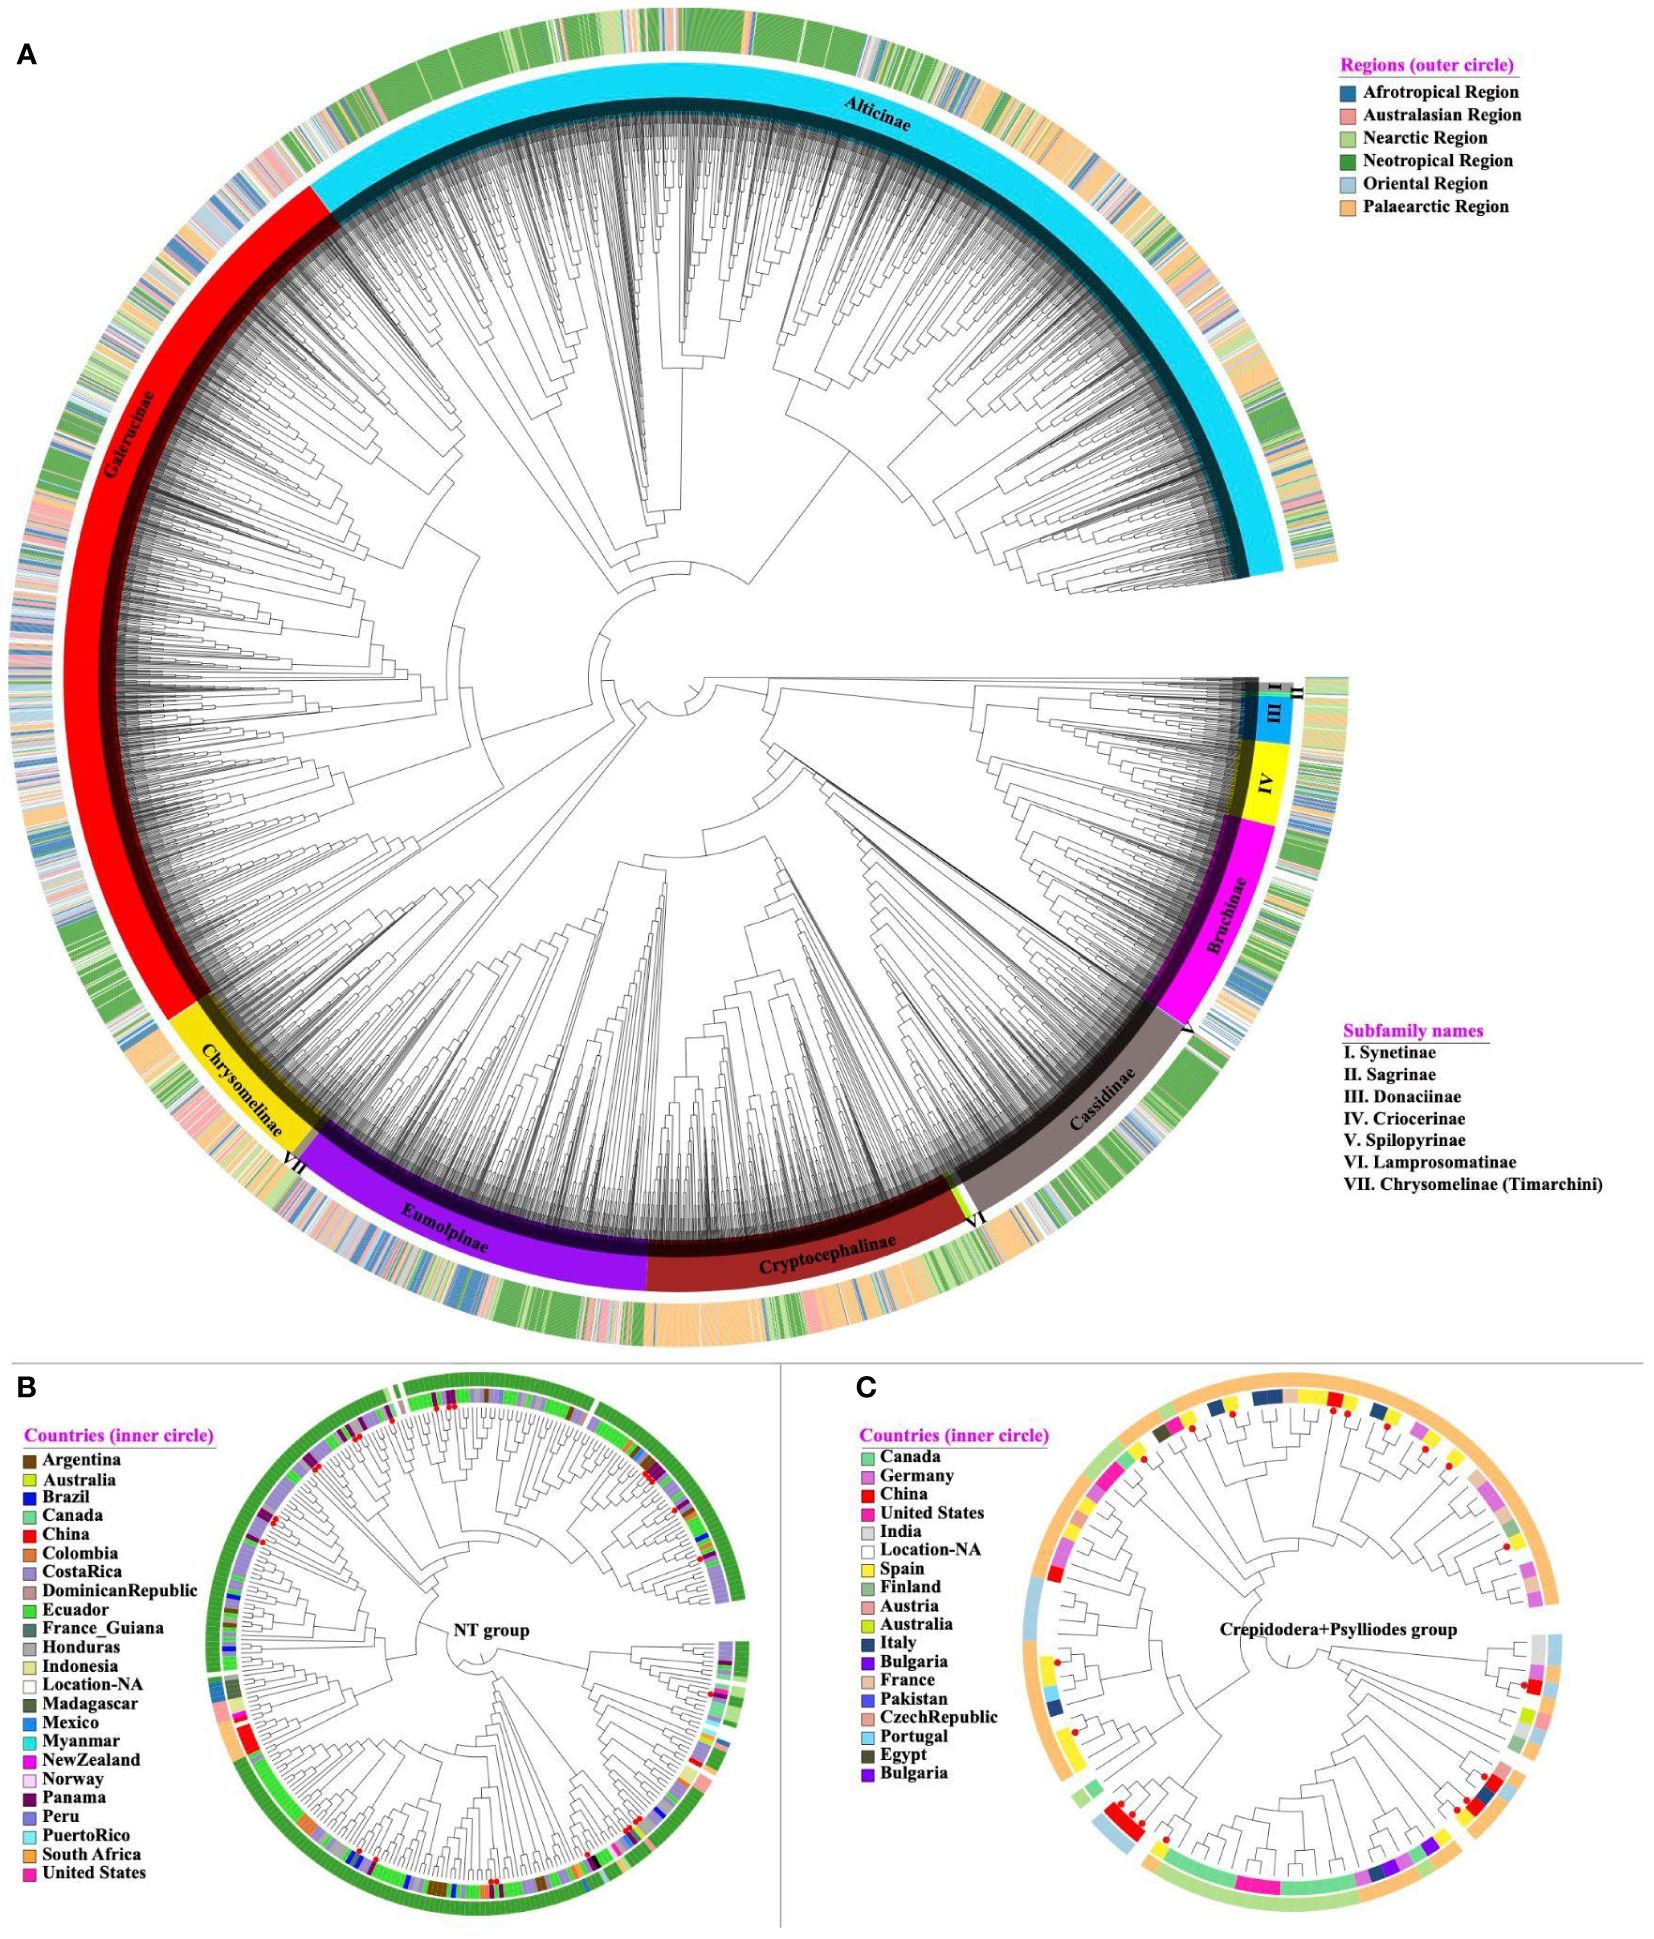
Figure 1 (A) The best-scoring ML tree of Chrysomelidae. Each tip either represents a unique BIN or mitogenome. The tree (5870 terminals; logL -982983.90) was constructed from the barcode region alone, under a backbone constraint of a tree from 564 mostly complete mitogenomes (Nie et al., 2024). The tree is presented in a circular format with branch lengths equalised. Each terminal has been assigned to a subfamily based on their morphological identification or placement in the tree, and label colours were assigned for each subfamily (inner circle) and biogeographic realm (outer circle), as shown in the legend on the right. (B, C) show a subtree for the NT and Crepidodera + Psylloides species groups of Alticinae with their biogeographic realm (outer circle) and country (inner circle) of collection locality, illustrating the phylogenetic conservation of biogeography representing a mainly New World and Old World lineage. Red circular symbols mark taxa with full mitochondrial genomes used to generate the backbone tree. Most of these sequences were obtained by ‘site-based’ sampling in Panama and Spain, respectively. The detailed tree is available in Newick format in the Supplementary Material S1.
Based on their phylogenetic placement, the tree grouped each barcode into one of the subfamilies and, in the case of Galerucinae and Alticinae (flea beetles), placed them into subtribes (Galerucinae) and species groups (Alticinae) recently refined by Nie et al. (2024). Linnean names had been assigned to numerous barcodes, mostly from north-temperate species, which were generally found to be consistent with the placement on the tree at the level of subfamilies and species groups, and also generally were monophyletic at the genus level. For example, the 100 representatives of the mostly Palearctic alticine genus Longitarsus, with the exception of one distant outlier, formed a monophyletic group that also included BINs from other continents that had not been named. Likewise the 24 identified BINs of Aphthona of Palaearctic species formed a monophyletic group with the inclusion of unnamed species from elsewhere in the Old World, although a separate cluster of four species was also recovered. Some of the large genera also were paraphyletic for other genera; for example a clade of 49 named representatives of Chrysolina also included the members of Oreina, the 146 representatives of Cryptocephalus included several small genera, and the 74 representatives of Cephaloleia included the genus Callispa. Across all 5306 BINs, 2196 BINS (41.4%) had a species name attributed, and of those, 2011 had only 1 species classification, which left a small proportion of 85 BINs (3.9%) that either included specimens of more than one Linnaean species (lumping) or had been identified inconsistently. (This count ignored the fact that 100 of these BINs also included specimens without identification.) Vice versa, out of 1759 species names that were attributed to a BIN, 1432 names were unique to a single BIN (including BINs without identification), with the remaining 327 (18.6%) of the names attributed to multiple BINs (splitting), i.e. a much greater proportion than those potentially affected by lumping.
The phylogenetic position of BINs further allowed a preliminary taxonomic assignment of the large number of tropical samples assigned to an anonymous BIN number and not to species or genus names, unlike their temperate-zone counterparts. This was achieved by defining the parent nodes for each of the taxonomic lineages (subfamilies, subtribes, species groups) and assigning each OTU to the most recent parent node with a given taxonomy (Supplementary Table 2). These taxonomically defined lineages generally showed strong geographic structure at the subtribe or species group level, e.g. being confined mainly to the Neotropical or Palaearctic regions as exemplified by the NT group and the Crepidodera + Psylliodes groups, respectively (although less so on the level of the entire subfamily; see Figure 1A). In the large sample of Galerucinae, placement of BINs into one of the subtribes and species groups was also generally consistent with the biogeographic distributions of subclades established by Nie et al. (2024) that defined deep lineages mostly to be confined to one of the major biogeographic realms of the world. For example, the newly established NT group of Nie et al. (2024), restricted to the Neotropics based on the mitochondrial genome phylogeny, was represented by 294 additional BINs, almost all of which were confined to countries of South and Central America, except for a small clade extending into North America and a second clade of some 20 BINs from various areas in the Old World (Figure 1B). Similarly, the clade of the Crepidodera + Psylliodes groups represented in Nie et al. (2024) by a community from Spain, was almost entirely represented by barcode records from the Palaearctic, except for a small clade of Nearctic species (Figure 1C).
Sampling of species across countries differed greatly due to the largely independent efforts of national barcoding initiatives. Nearly half of chrysomelid barcode sequences were from Costa Rica (31451 sequences), followed by smaller sets from South Africa, Canada, Spain, Germany, and China with 2000-5000 sequences each, while most other countries contributed <500 sequences (Table 1). A world map displaying sampling effort illustrates the large areas that remain unsampled, in particular in Africa outside of the RSA (Figure 2 top). The number of BINs followed a similar trajectory, with 758 BINs found in Costa Rica and approximately half this number in each of the next four countries (Figure 2 bottom). The number of barcode sequences per BIN (Barcodes-to-BIN ratio) was taken as a measure of sample completeness. The ratio was 41.6 for Costa Rica, then dropped to 12-15 for the next three countries and to much lower values after that (Table 1).
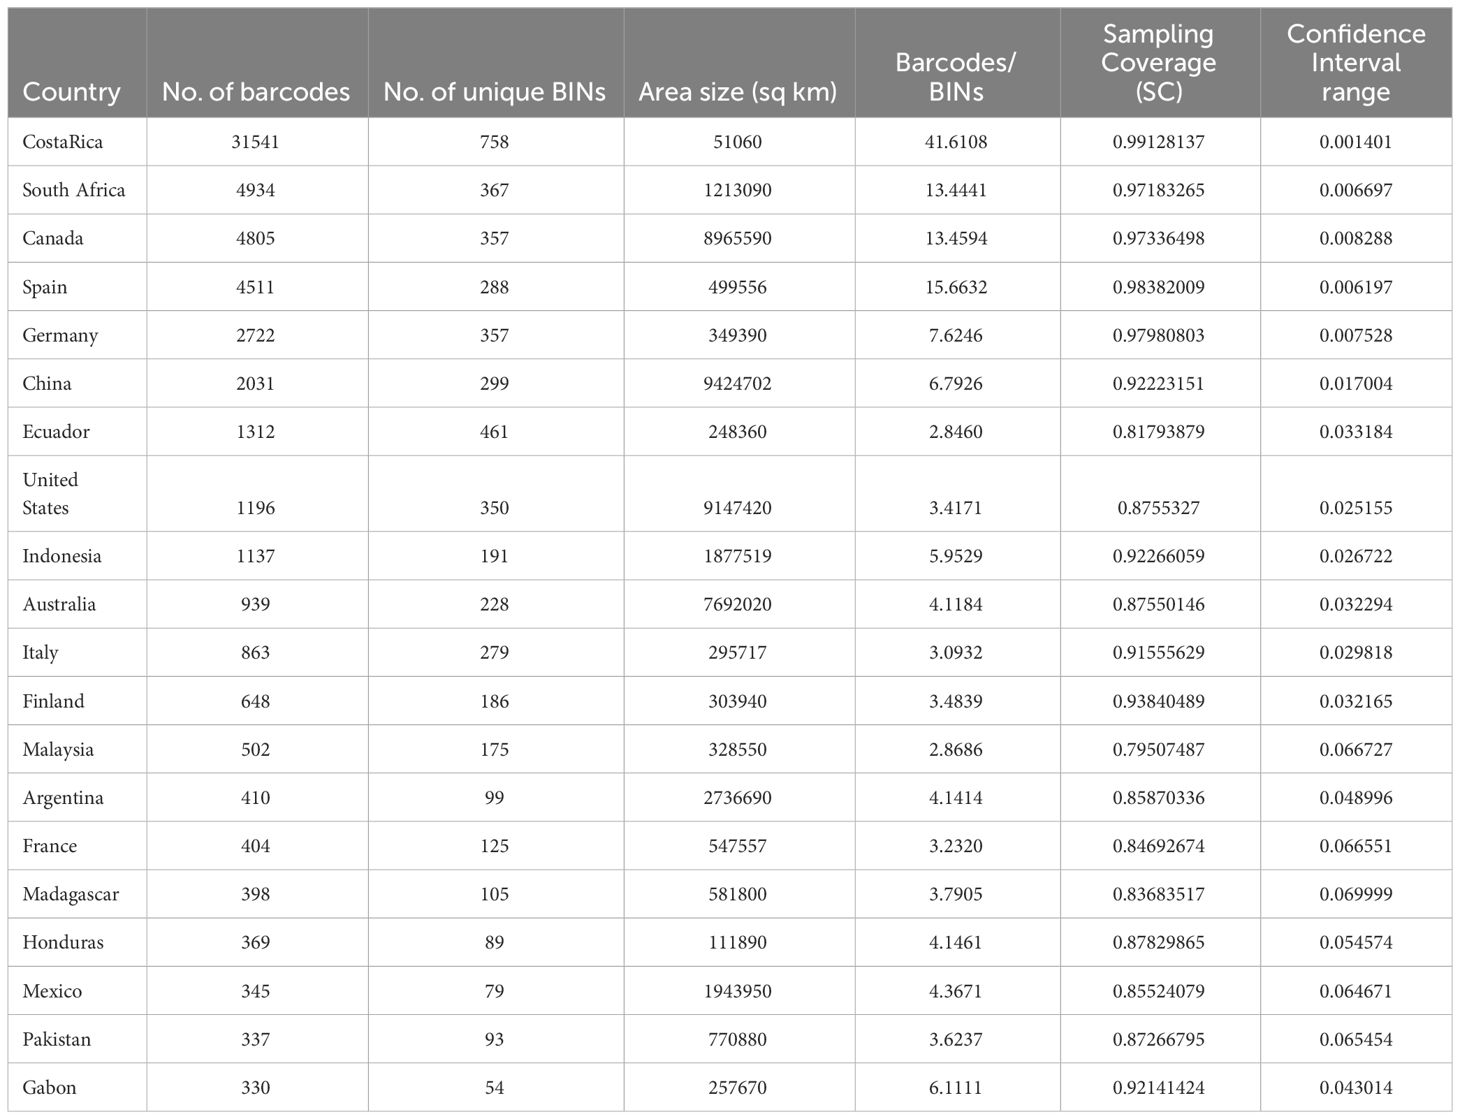
Table 1 Top 20 countries by number of barcodes (sample size), the number of unique BINs and two measures of sampling completeness.
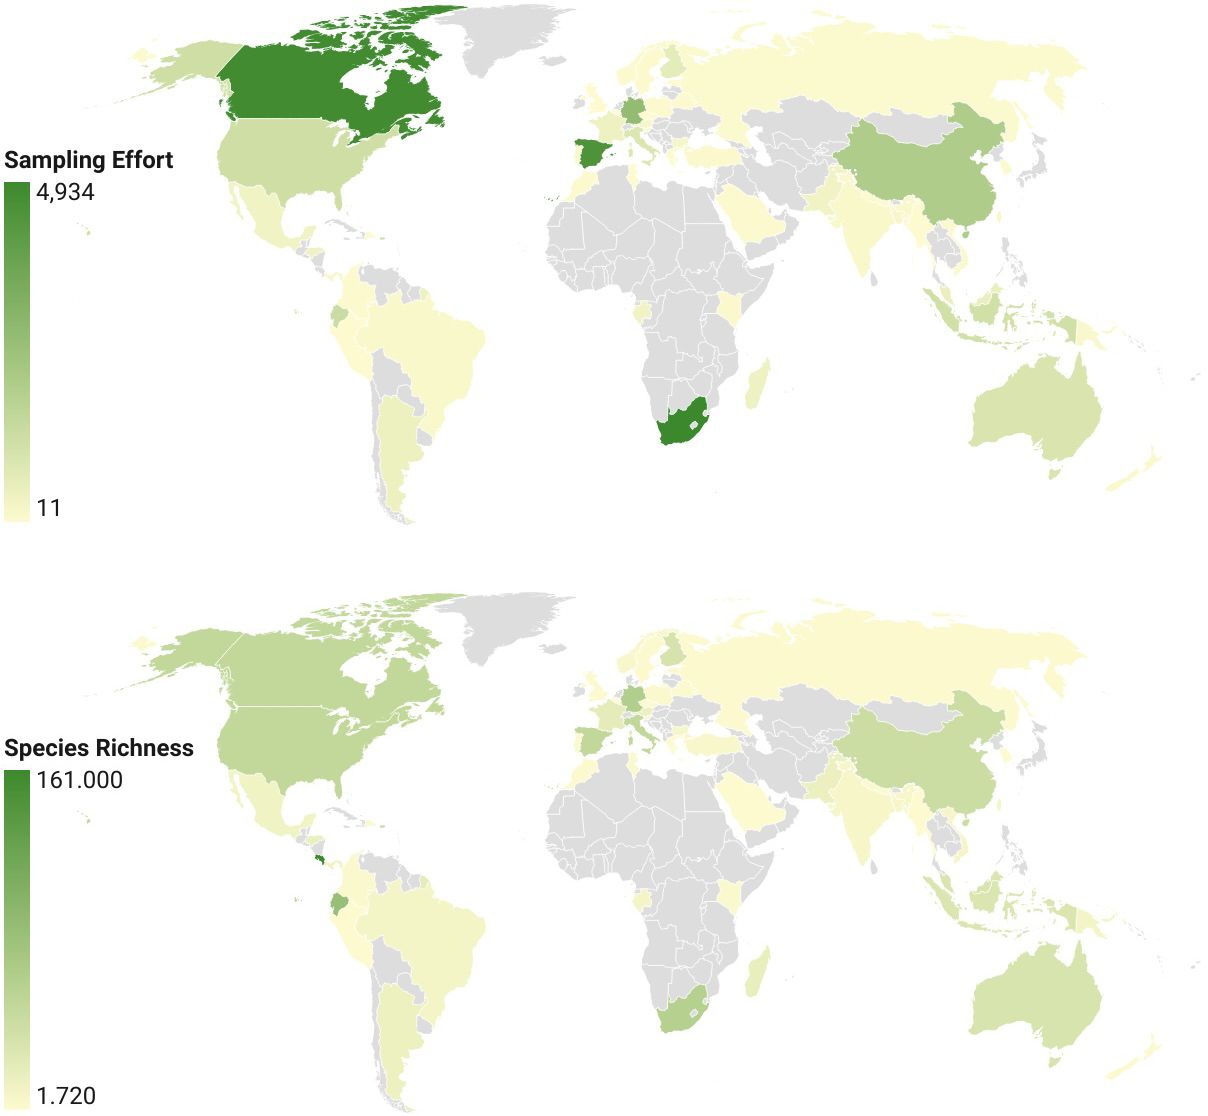
Figure 2 Global map of (top) the number of barcode sequences, a measure of sampling effort for countries with >10 available barcodes, and (bottom) species richness. The plot of barcode counts left out the high values for Costa Rica to obtain better gradation of the scale. Values for species richness are BIN numbers normalised for different country area sizes.
Sampling completeness was also assessed using the sampling coverage (SC) metric of Chao and Jost (2012) that estimates the probability that a species has already been observed in the sample. SC was highest again in Costa Rica with 99.8%, followed by Spain, Germany, Canada, and South Africa with >97% probability (Table 1, Supplementary Figure 1). A clear drop in SC was observed for all other countries, at best reaching 93.8% in Finland, but generally below 90%. At the same time the confidence interval of SC estimated by asymptotic approximation was narrow in the highly sampled countries, within a range of 1% especially in Costa Rica and also for Spain, Germany, Canada and South Africa (Table 1), but the confidence intervals of the SC became wider rapidly with lower SC (rho = -0.841). Finally, the SC was strongly correlated with the Barcode-to-BIN ratios (rho = 0.899), i.e. both measures of sample completeness agree on the minimum sampling intensity required (Figure 3). The top five countries performed well on both parameters suggesting the need for a minimum of ~5000 sequences per country to ensure high sampling coverage and a desired sampling effort of ~10 barcodes per species (BIN) on average (Figure 3).
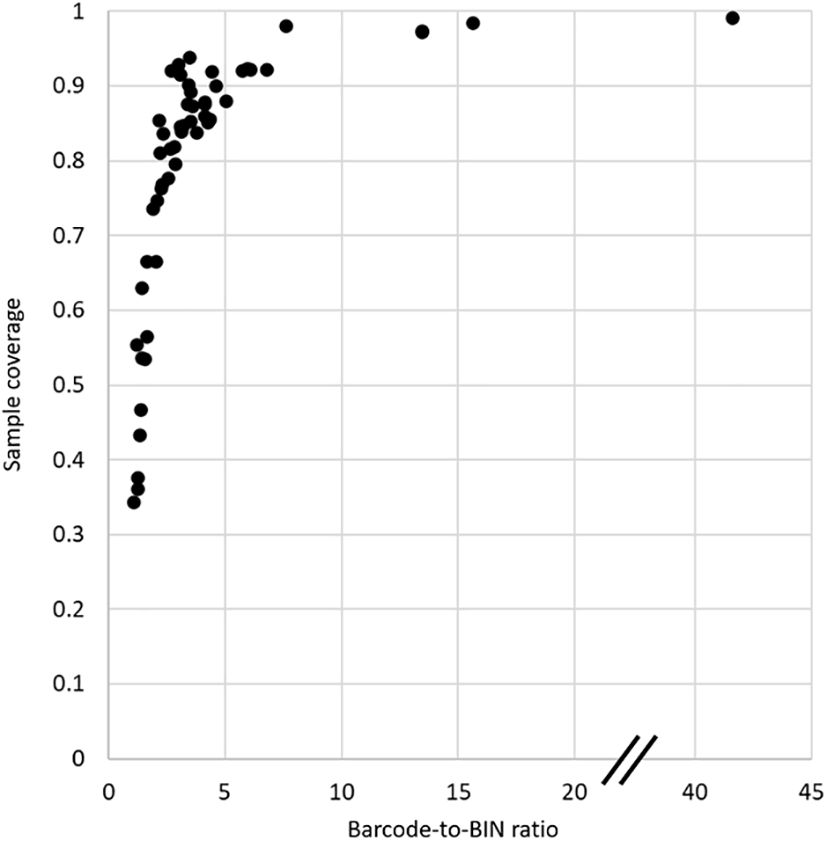
Figure 3 Plot of Sampling Coverage (SC) against the Barcode-to-BIN ratio, comparing the result from the two principal measures of sampling completeness.
We used species accumulation curves to predict the expected full number of species in a country under comprehensive sampling. Only countries with high completeness (rather than high numbers of BINs) were included. Expected richness was highest for Costa Rica at 1173 species, followed by South Africa and Canada with 542 and 539 species. When species numbers were normalised for the land area, Costa Rica again stood out with numbers nearly three times as high as the next-most diverse country (Table 2). The proportion of observed versus estimated species numbers was highest for Germany (92.4%; 357 observed vs. 386.6 estimated species) and Spain (75.2%), but lower for the other three countries (Table 2). Species richness extrapolations were clearly incorrect for samples of lower coverage (Supplementary Figure 2).
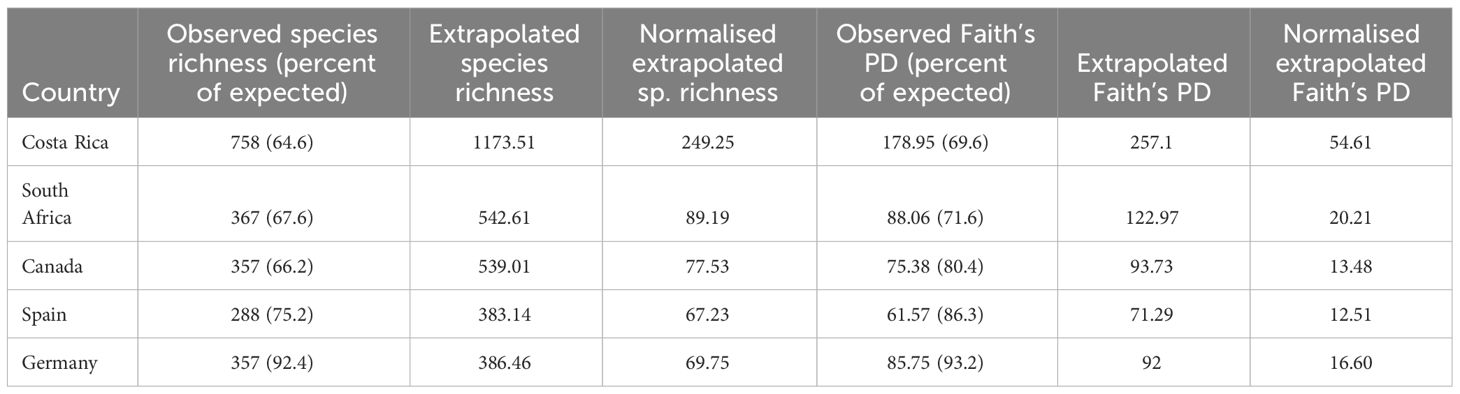
Table 2 Observed and expected richness at species and phylogenetic levels.
Diversity was also assessed at the phylogenetic level using Faith’s PD. The total PD of the tree was 6260.64, and maximum PD for individual countries was 178.95 for Costa Rica, which again stood out and surpassed all other countries by at least twice the amount of PD (Table 2). Across all 53 countries in the analysis, Faith’s PD was strongly correlated with species richness (rho = 0.984) (Figure 4), and both species richness and PD were highly correlated with the sampling effort (number of barcode sequences) in each country (rho = 0.939 and rho = 0.908 respectively) (Supplementary Figure 3). Yet, the relationship of sampling effort with species diversity or PD was complicated, as it was apparently overlain by true differences in the species and phylogenetic composition. For example, Ecuador was ranked 7th by sampling effort but was placed 2nd highest for both species richness and PD, after Costa Rica, possibly reflecting the huge species diversity in this country that was evident despite the relative undersampling.
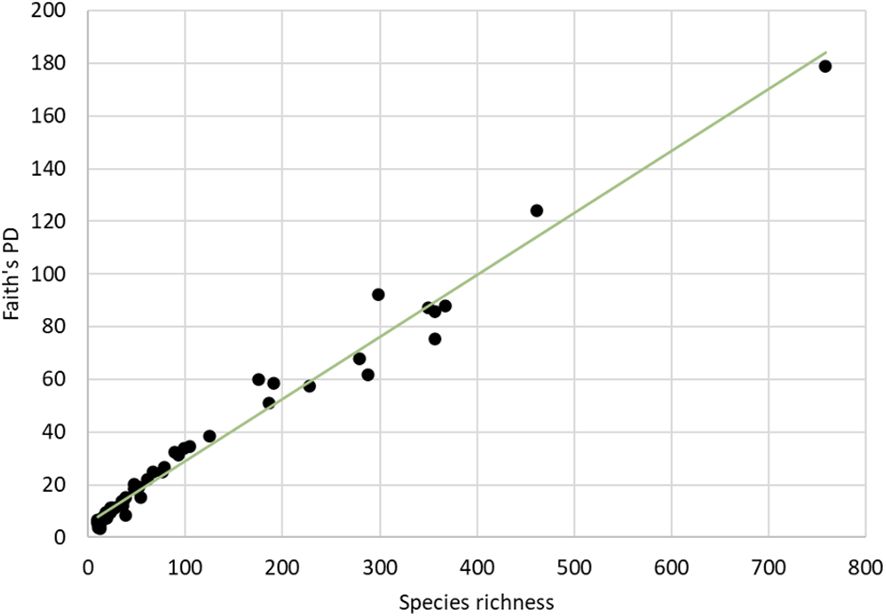
Figure 4 Correlations of Faith’s PD and the number of species (BINs) for all countries with >10 available barcodes.
Next, we generated PD accumulation curves for the five most highly sampled countries (Figure 5). The predicted total PD indicated that the observed PD was substantially underestimated (Table 2). However, the observed PD as a proportion of the expected PD was higher than in the same analysis of species diversity, suggesting that sampling completeness at phylogenetic level was achieved sooner than at species level (Table 2).
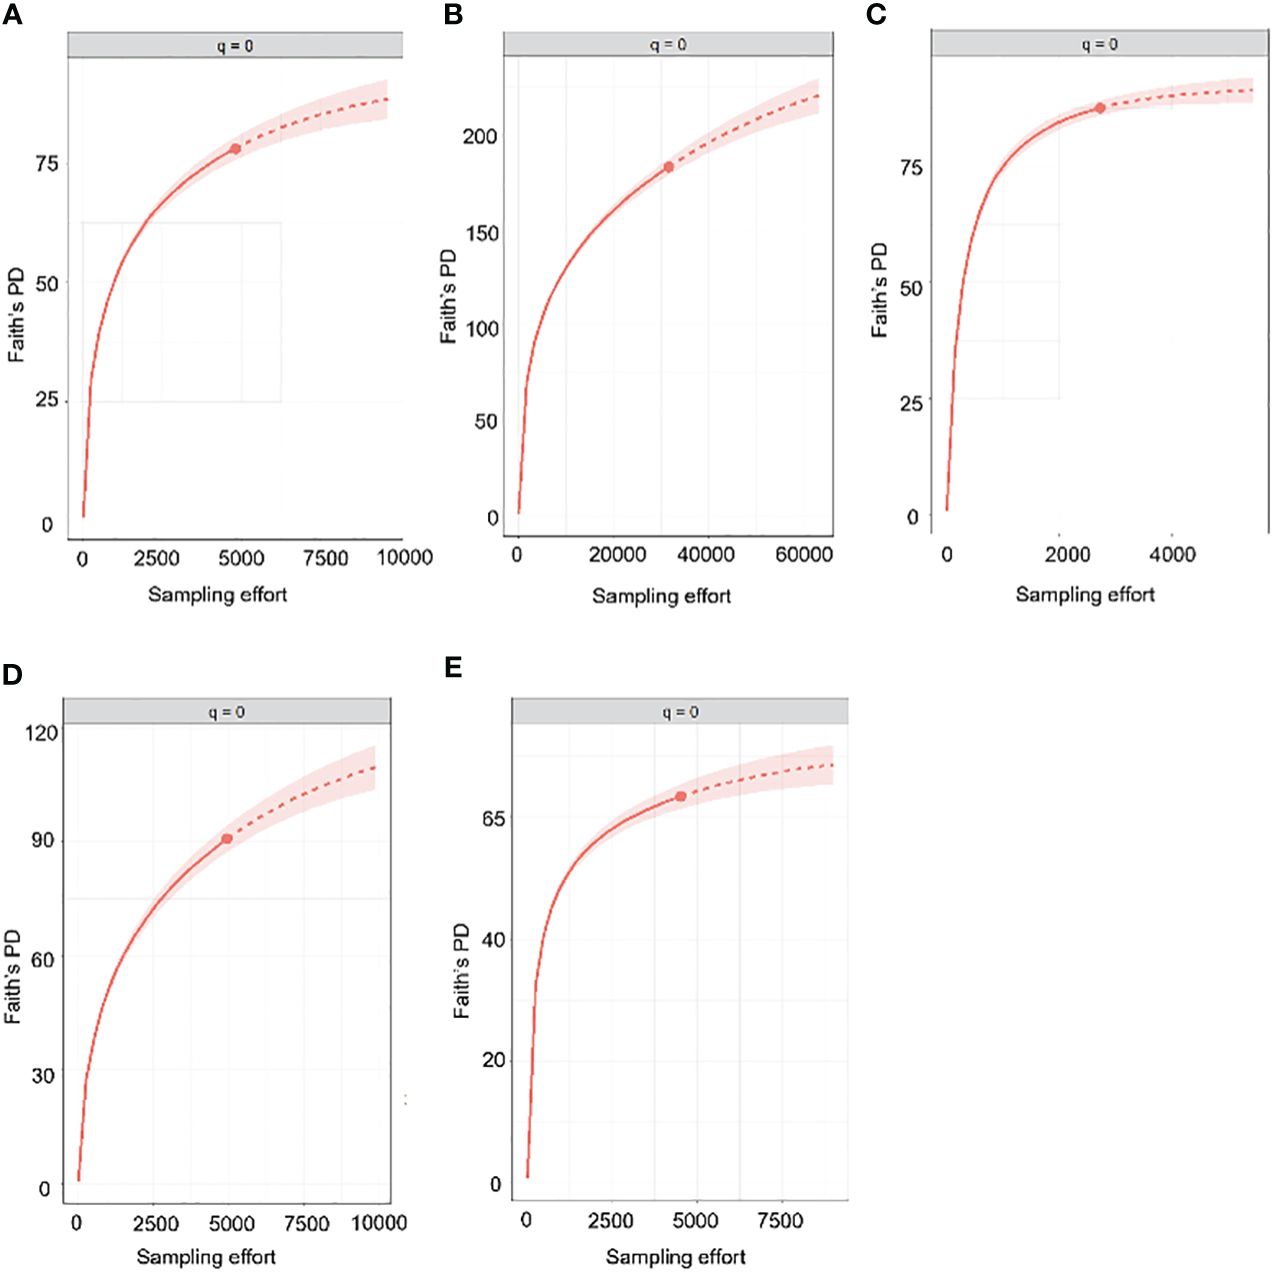
Figure 5 Estimated PD accumulation curves of countries with sample coverage (SC) greater than 95%. The uninterrupted line represents rarefaction while the dotted line represents extrapolation. (A) Canada, (B) Costa Rica, (C) Germany, (D) South Africa, (E) Spain.
Finally, studies at individual nation level found overlapping species records, especially in samples from various European countries representing the Palaearctic biogeographic realm (Figure 1, Supplementary Figure 4). Combining the records from all 23 countries assigned to the Palaearctic resulted in 950 different BINs compared to 1680 BINs when summing the numbers detected in each of the countries. This increased the Barcode-to-BIN ratio to >10 and SC >97%, i.e. the sampling was sufficient for a meaningful extrapolation of total species numbers, which resulted in a total of just over 1000 species for the Palaearctic (Supplementary Figure 4). None of the other biogeographic realms were sampled at this level of completeness, including the Neotropical region, despite the higher number of barcodes contributing to the species count.
The phylogenetic community structure was assessed using measures of overall phylogenetic relatedness of the local communities relative to the total phylogenetic diversity of the global dataset. The NRI, as a measure of overall phylogenetic relatedness, was positive for most countries, which suggested that lineages at the deep level were more closely related than if drawn at random (Figure 6). The highest values were generally found in biogeographically isolated countries, including Australia, Madagascar, and South Africa, while various European countries had low positive or slightly negative values, showing that at deep levels they were not as unique, and phylogenetically similar sets were also present in the tree due to their detection in adjacent countries. The NRI of Costa Rica was inconspicuous, as it probably comprised a lot of deep lineages, mirroring its high species numbers drawn from many lineages (see Figure 4 for the correlation of species diversity and PD), and therefore made up a large proportion of the tree, i.e. it was not closely clustered relative to the total lineage diversity. The NRI values for countries below a certain sampling effort had mixed, albeit mostly positive values, indicating the stochastic nature of the small samples drawn from the wider tree-of-life in these countries.
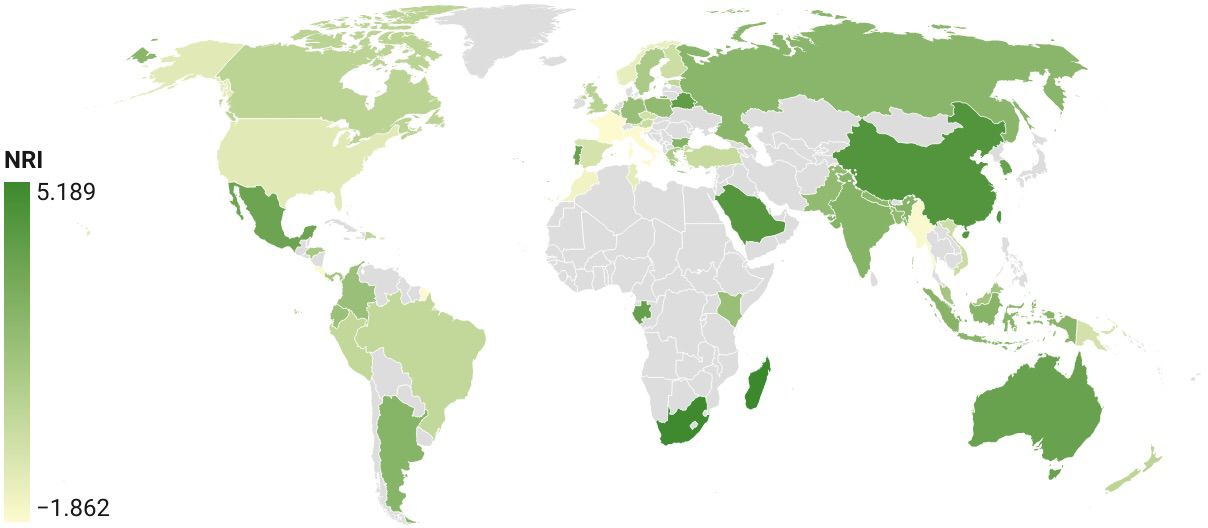
Figure 6 NRI of national barcode sets plotted for each country.
The NTI, a measure derived from the distances to the nearest relatives, was highly positive especially in the highly sampled countries (Supplementary Table 3, Supplementary Figure 5), suggesting that each country-level community holds phylogenetically close sets of species with respect to the global community represented in the entire database. The NTI decreased with decreasing sampling intensity, i.e. species were more distant from each other, and thus the taxon sampling will mostly sample internal branches of close relatives, thus reducing the distance between species.
This study establishes the current status of the publicly available library of COI barcodes in a large family of insects. The Chrysomelidae, like many other super-diverse groups of invertebrates, remain insufficiently known in their overall species diversity, evolutionary history and biogeographic distribution. DNA barcoding is a promising route for improving the state of knowledge, especially if linked to whole mitochondrial genomes that provide the phylogenetic framework in which to place the short barcode sequences, as shown here. However, our study reveals that despite great efforts over the past two decades, the completeness of sampling at species level is low for most of the world, and the bulk of existing data can be ascribed to a handful of national campaigns mostly in the north-temperate zone, besides the outstanding effort in Costa Rica. This limits the power of these data for the analysis of global biodiversity patterns.
We used two independent measures of sampling completeness of national faunas, the sampling coverage (SC) (Chao and Jost, 2012) and the Barcode-to-BIN ratio. The latter was used here as a metric of sampling completeness of a country at the species level normalised for sampling effort. Both measures were in strong agreement about the required sampling depth in a given country and show the challenge of generating sufficiently deep sampling of SC of >95% and a minimum required Barcode-to-BIN ratio of ~10. Even at this level, sampling remains incomplete. For example, in Germany as the most intensely sampled area based on the high proportion observed to extrapolated species, the 383 extrapolated species from barcoding compare to some 534 species of Chrysomelidae recorded in the literature (Hendrich et al., 2015), i.e. even the fairly dense barcode sampling in this country still does not detect the full extent of known diversity. Presumably this is due to the great rarity and regionally restricted distribution of many species (Schmitt and Rönn, 2011), and the fact that in recent decades many species seem to have disappeared from the area entirely (Wendorff and Schmitt, 2019). In Canada, at similarly high SC and barcode-to-BIN ratios, the completeness was lower, recording 357 species observed against 539 species expected from extrapolations. This compares to 595 species known from the country, plus an estimated 40 to 170 undescribed or as yet unrecorded species (Brunke et al., 2019). Sampling of Coleoptera in Germany involved a concerted effort by naturalists and academics to collect specimens in a wide range of habitats and locations (Hendrich et al., 2015), which amounted to the dataset with the greatest completeness of the faunal inventory, even if SC and Barcode-to-BIN ratio were comparatively modest. In Canada, sampling efforts were also quite extensive, but mostly involved dedicated campaigns focused on nature reserves with standardised collecting methods (Hebert et al., 2016). Without the targeted search for rare or specialised taxa the effort apparently missed major lineages, including several families of Coleoptera (Brunke et al., 2019). Sampling in Spain largely resulted from a single transect of natural areas targeting Chrysomelidae in some 20 sites (Baselga et al., 2013a), which was unlikely to represent the full diversity of the country. These deficiencies of the primary sampling efforts cannot be overcome by simply sequencing more specimens from similar locations and traps, but instead the completeness depends on the primary sampling effort in the field. In the case of Costa Rica, most specimens have been obtained using Malaise traps which are known to select for a subset of species with prone behaviour to enter these devices.
The study of barcode completeness thus revealed the difficulty of sampling to a level necessary for meaningful estimates of local species diversity. Specifically, the intense barcoding in Costa Rica highlights a general problem of assessing completeness of sampling, given the existing taxonomic knowledge of the target group. True species numbers in most tropical areas are not known, in contrast to available checklists or other resources available in many well studied Northern Hemisphere countries. These lists could be compared to the species recovered in the global barcoding efforts for an assessment of completeness, and after some taxonomic reconciliation might provide a validated DNA-based reference set for a given group and country that corresponds closely to the conventional species lists (e.g. Creedy et al., 2020). In some cases, the DNA reference sets may be completed by using museum specimens to include rare or declining species (Prosser et al., 2016). This work may be underpinned by more detailed studies of species limits and their congruence with DNA barcode clusters (see Baselga et al., 2013b, for an example in Chrysomelidae). However, this approach is not generally applicable for the diversity of tropical species which remain incompletely inventoried at species level, while the barcode sequences are mainly from unidentified specimens, as the current BOLD database clearly shows. This precludes the direct comparison of DNA-based groups with a reference list for tropical regions. In the case of Costa Rica, it is therefore unclear if the extrapolated 2-3x higher species number of Costa Rica compared to other countries is anywhere near the true diversity and to what degree this represents an accurate comparison between tropical and temperate leaf beetle communities. Ultimately a more complete coverage requires a comprehensive selection of different biomes, latitudinal ranges, climatic zones, etc., across a broader range of countries in the poorly sampled tropics.
In addition, the global barcode library ultimately needs to be constructed following biological criteria, not national boundaries. Even if mostly conducted at national level, barcoding campaigns may complement each other, especially for widespread species and species at the edge of their range that may be detected in neighbouring countries. For example, many species recorded as rare in Germany represent the range boundaries of eastern and southern European lineages that can be detected readily elsewhere, and we already find overlapping species records in the samples from various European countries (Supplementary Figure S4). However, lumping these records may miss intraspecific variation and possibly weakly differentiated species, and thus a more nuanced analysis of geographical and ecological lineage differentiation (e.g. Ottati et al., 2022; Noguerales et al., 2023). Equally this type of variation is important for formal species delimitation, which clearly needs to be addressed in numerous cases, especially where BIN groups from adjacent European countries were attributed to the same Linnaean species name (Supplementary Table 1). The general trend of BIN delimitation to split Linnaean species more often than to lump multiple Linnaean species into a single BIN (see above) suggests the presence of cryptic or unrecognised species to be formalised by detailed taxonomic studies. The uncertainty about species boundaries adds to the problem of measuring the sampling completeness of barcoding campaigns against checklists or other lists of species names based on the Linnaean taxonomy.
At the largest spatial scale, we found the diversity of Chrysomelidae is differentiated according to the major biogeographical realms of the world, both at species and clade levels (Figures 1B, C, Supplementary Table 1). We therefore applied the tests of sample completeness for each of the seven realms (Supplementary Figure 4), which provided a first glimpse at the completeness of sampling across the world at the continental scale. In regards to independent BIN records, the Palaearctic was the most densely sampled region with some 1680 BINs summed over the 23 countries with available records. However, when all country records were combined they produced only 950 different BINs, demonstrating the high overlap in species detection in adjacent countries, which indicates the easy recovery of widespread and locally common species at multiple sites. Yet, numerous species were captured only in a single site and thus the sampling completeness at the regional level was not very high based on the SC and barcode-to-BIN ratio. The sampling completeness in all other realms was even lower, and hence the extrapolated values are far from representing the true differences in species numbers across regions of the world. This again testifies that the current barcode data are far from sufficient as an approximation of overall diversity of Chrysomelidae, in particular given that the sampling remains highly uneven geographically.
In contrast, at the clade level the barcode sampling provides an increasingly complete representation of the higher-level lineage diversity. The phylogenetic analysis of the barcode database combined with existing mitochondrial genome sequences revealed the representation of all major subfamilies, tribes and species groups (Nie et al., 2024). The combined barcode and mitogenome data thus could be used to assign many unidentified, anonymous barcodes to particular taxonomic groupings, as a preliminary classification beyond the family level of their current assignments. Second, the global composition of the barcode database revealed the strong geographical structure of phylogenetic lineages at the level of the major biogeographical realms. This provided independent support for the proposed phylogenetic placement of the unnamed tropical species. In addition, this analysis can provide information on the range sizes and areas of endemicity at the level of species and lineages of various phylogenetic depth, which may be useful for the refined regionalisation of the world’s biotas. Vice versa, several species were found in two or even three realms, usually embedded in clades with limited ranges. These barcodes were almost invariably assigned to widely dispersed pest species such as Lema daturaphila (Three-lined Potato Beetle feeding on Solanaceae), Chrysolina quadrigeminata (invasive species feeding on Hypericum), Aulacophora abdominalis (Plain Pumpkin Beetle), Paropsisterna m-fuscum (invasive on Blue Gum), Phyllotreta striolata (Striped Flea Beetle, pest of Brassicaceae), Diabrotica virgifera (Corn Rootworm), and several others. They also include widely introduced biocontrol agents, such as Longitarsus jacobaeae feeding on tansy ragwort, or Lilioceris cheni for the control of air potato. Detecting these biogeographic outliers is possible even with a database that is highly incomplete at the species level if the barcodes can be placed into a phylogenetic system that is increasingly complete for deeper clades.
The increased completeness at clade level compared to the species (BIN) level was also confirmed by the analysis of phylogenetic diversity (PD). PD and species diversity were closely correlated (Figure 4), but in all of the top-sampled countries the observed diversity is more complete (based on the SC metric) and the total predicted diversity (based on extrapolations) increases less over the observed diversity than at the species level (Table 2). This suggests that the sampling deficit tends to affect close relatives which each would contribute only limited amounts of PD. Second, we assessed phylogenetic community composition in different parts of the world. We find that virtually all country-level communities were strongly clustered with respect to the full tree of global diversity, especially based on the tip-weighted NTI that measures the distance among close relatives. The value was strongly correlated with sampling completeness (Supplementary Table 3), indicating that more intense sampling mainly adds lineages that are already detected at low coverage, i.e. close relatives. The NRI estimates as a measure of clustering or overdispersion of total phylogenetic diversity in communities were more complex (Figure 6). High values (clustering) were observed mainly in geographically isolated countries or countries in otherwise unsampled regions such as Australia, South Africa and China, which suggests the presence of unique lineages in these places that lead to clustering of the local faunas. In other cases, the clustering may be reduced because neighbouring countries are also sampled that contribute lineages present regionally, thus reducing a country’s unique diversity in spite of the high sampling completeness, e.g. in Canada adjacent to the well sampled USA, or in the various European countries. Finally, as these values are calculated with respect to the entire tree, the possibility for the presence of unique lineages is reduced in the highly sampled countries that make up the main part of the tree itself, which affects especially the highly sampled Costa Rica that exhibited only low (positive) NRI values. Yet, despite these data complexities, the overall evidence points to a highly structured composition of chrysomelid species composition globally in particular at the tip level, i.e. there is substantial endemicity at the levels of species and deeper lineages. Thus, while most subfamilies and major lineages are widely distributed and readily found in each country, and up to 93% of the PD in individual countries have been sampled already, the low completeness of sampling at the level of the biogeographical realms and the high NTI/NRI values obtained for most country-level communities suggest the need for extensive sampling beyond the countries and ecosystems targeted so far.
The barcode database is rapidly growing, but it is far from complete as a representation of the species of Chrysomelidae. As it stands after 20 years of national and international barcoding initiatives, we are a long way from achieving the equivalent of the existing knowledge base of the Linnean taxonomy, let alone improve on this trove of information, as has been hoped initially (Tautz et al., 2003), although due to large-scale barcoding our perspective of the total species diversity has greatly changed (Hebert et al., 2016). The existing taxonomic information has been accumulated by generations of dedicated collectors who travelled and sampled in the most remote places of the world, frequently in ecosystems that no longer exist. Apart from the comprehensive sequencing of museum collections, the breadth of the barcode database cannot match the existing taxonomy in full, although it may facilitate the inclusion of lineages and regions not previously studied by revealing numerous new ‘dark taxa’. More importantly, as this study shows, even if incomplete, barcodes can still greatly contribute to overcoming the ‘taxonomic impediment’, i.e. the difficulty for studying global biodiversity due to incomplete or inaccessible taxonomic knowledge. Barcodes are valuable at the species level for identification and species delimitation, and here were valuable to cross-reference specimens among national sampling campaigns (and incidentally revealing biogeographic variation and possibly the need for taxonomic changes). In addition, the barcode database can be exploited for studying biodiversity patterns, given the ease with which barcode data can be attached to a phylogeny generated from mitochondrial genomes. The large tree composed of nearly 6000 terminals shows the biogeographic distribution of major lineages and their richness (Figure 1), placing each species into a taxonomic and biogeographic framework, and in doing so revealing the traits associated with each species in a clade, for example determining its ecology and functional role or possibly its global spread and pest status. Thus, placement on a tree greatly enhances the value of a barcode, especially in poorly known faunas with limited reference libraries, as it not only provides an approximate identification but also provides the key traits and biogeographic information about species lacking primary biological observations.
The datasets presented in this study can be found in online repositories. The names of the repository/repositories and accession number(s) can be found in the article/Supplementary Material.
EL: Writing – original draft, Formal analysis, Investigation, Methodology, Visualization. RN: Conceptualization, Data curation, Resources, Writing – review & editing. APV: Conceptualization, Supervision, Writing – original draft, Writing – review & editing.
The author(s) declare that no financial support was received for the research, authorship, and/or publication of this article.
This study is based on the Final Year Research Project by EL as part of a BSc Biochemistry at Imperial College London. We are grateful for bioinformatics support and data compilation by Thomas Creedy, Sarawut Ounjay, James Evans and other members of the Vogler lab. We also thank numerous contributors to the Barcode-of-Life database whose effort made this study possible.
The authors declare that the research was conducted in the absence of any commercial or financial relationships that could be construed as a potential conflict of interest.
All claims expressed in this article are solely those of the authors and do not necessarily represent those of their affiliated organizations, or those of the publisher, the editors and the reviewers. Any product that may be evaluated in this article, or claim that may be made by its manufacturer, is not guaranteed or endorsed by the publisher.
The Supplementary Material for this article can be found online at: https://www.frontiersin.org/articles/10.3389/fevo.2024.1305898/full#supplementary-material
Supplementary Text 1 | Full tree of Chrysomelidae from mitogenomes and DNA barcodes in Newick format.
Supplementary Text 2 | COI sequences (barcodes and corresponding portion of mitogenomes) used in this study in fasta format.
Supplementary Table 1 | Barcodes and associated data obtained from BOLD.
Supplementary Table 2 | Summary of BIN groups, listing the representative barcode, the taxonomy including the species name, the taxonomic grouping based on the phylogenetic placement, the number of barcodes represented by this BIN, and the BIN’s geographic distribution.
Supplementary Table 3 | Community ecology measures for each country.
Baselga A., Fujisawa T., Crampton-Platt A., Bergsten J., Foster P. G., Monaghan M. T., et al. (2013a). Whole-community DNA barcoding reveals a spatio-temporal continuum of biodiversity at species and genetic levels. Nat. Commun. 4, 1892. doi: 10.1038/ncomms2881
Baselga A., Gómez-Rodríguez C., Novoa F., Vogler A. P. (2013b). Rare failures of DNA barcodes to separate morphologically distinct species in a biodiversity survey of Iberian leaf beetles. PLoS One 8, e74854. doi: 10.1371/journal.pone.0074854
Bergsten J., Bilton D. T., Fujisawa T., Elliott M., Monaghan M. T., Balke M., et al. (2012). The effect of geographical scale of sampling on DNA barcoding. Syst. Biol. 61, 851–869. doi: 10.1093/sysbio/sys037
Bian X., Garner B. H., Liu H., Vogler A. P. (2022). The SITE-100 Project: Site-based biodiversity genomics for species discovery, community ecology, and a global Tree-of-Life. Front. Ecol. Evol. 10. doi: 10.3389/fevo.2022.787560
Brunke A. J., Bouchard P., Douglas H. B., Pentinsaari M. (2019). Coleoptera of Canada. Zookeys. 819, 361–376. doi: 10.3897/zookeys.819.24724
Chao A., Jost L. (2012). Coverage-based rarefaction and extrapolation: standardizing samples by completeness rather than size. Ecology 93, 2533–2547. doi: 10.1890/11-1952.1
Chao A., Thorn S., Chiu C.-H., Moyes F., Hu K.-H., Chazdon R. L., et al. (2023). Rarefaction and extrapolation with beta diversity under a framework of Hill numbers: The iNEXT.beta3D standardization. Ecol. Monogr. e1588. doi: 10.1002/ecm.1588
Chesters D. (2020). The phylogeny of insects in the data-driven era. Syst. Entomol. 45, 540–551. doi: 10.1111/syen.12414
Chowdhury S., Dubey V. K., Choudhury S., Das A., Jeengar D., Sujatha B., et al. (2023). Insects as bioindicator: A hidden gem for environmental monitoring. Front. Environ. Sci. Eng. China 11. doi: 10.3389/fenvs.2023.1146052
Creedy T. J., Norman H., Tang C. Q., Qing Chin K., Andujar C., Arribas P., et al. (2020). ). A validated workflow for rapid taxonomic assignment and monitoring of a national fauna of bees (Apiformes) using high throughput DNA barcoding. Mol. Ecol. Resour. 20, 40–53. doi: 10.1111/1755-0998.13056
De Heij S. E., Willenborg C. J. (2020). Connected carabids: Network interactions and their impact on biocontrol by carabid beetles. Bioscience 70, 490–500. doi: 10.1093/biosci/biaa039
DeSalle R., Goldstein P. (2019). Review and interpretation of trends in DNA barcoding. Front. Ecol. Evol. 7. doi: 10.3389/fevo.2019.00302
Faith D. P. (1992). Conservation evaluation and phylogenetic diversity. Biol. Conserv. 61, 1–10. doi: 10.1016/0006-3207(92)91201-3
Feijó A., Ge D., Wen Z., Cheng J., Xia L., Patterson B. D., et al. (2022). Mammalian diversification bursts and biotic turnovers are synchronous with Cenozoic geoclimatic events in Asia. Proc. Natl. Acad. Sci. U. S. A. 119, e2207845119. doi: 10.1073/pnas.2207845119
Geiger M. F., Moriniere J., Hausmann A., Haszprunar G., Wägele W., Hebert P. D. N., et al. (2016). Testing the Global Malaise Trap Program - How well does the current barcode reference library identify flying insects in Germany? Biodivers Data J., e10671. doi: 10.3897/BDJ.4.e10671
Hebert P. D. N., Cywinska A., Ball S. L., deWaard J. R. (2003). Biological identifications through DNA barcodes. Proc. Biol. Sci. 270, 313–321. doi: 10.1098/rspb.2002.2218
Hebert P. D. N., Ratnasingham S., Zakharov E. V., Telfer A. C., Levesque-Beaudin V., Milton M. A., et al. (2016). Counting animal species with DNA barcodes: Canadian insects. Philos. Trans. R. Soc Lond. B Biol. Sci. 371, 20150333. doi: 10.1098/rstb.2015.0333
Hendrich L., Morinière J., Haszprunar G., Hebert P. D. N., Hausmann A., Köhler F., et al. (2015). A comprehensive DNA barcode database for Central European beetles with a focus on Germany: adding more than 3500 identified species to BOLD. Mol. Ecol. Resour. 15, 795–818. doi: 10.1111/1755-0998.12354
Hewson N. (2005) Conservation biology of rare leaf beetles (Coleoptera: Chrysomelidae) (University of Leeds). Available online at: https://ethos.bl.uk/OrderDetails.do?uin=uk.bl.ethos.432389 (Accessed August 20, 2023).
Hill M. O. (1973). Diversity and evenness: A unifying notation and its consequences. Ecology 54, 427–432. doi: 10.2307/1934352
Holt B. G., Lessard J.-P., Borregaard M. K., Fritz S. A., Araújo M. B., Dimitrov D., et al. (2013). An update of Wallace’s zoogeographic regions of the world. Science 339, 74–78. doi: 10.1126/science.1228282
Hsieh T. C., Ma K. H., Chao A. (2016). iNEXT: an R package for rarefaction and extrapolation of species diversity (H ill numbers). Methods Ecol. Evol. 7, 1451–1456. doi: 10.1111/2041-210X.12613
Katoh K., Standley D. M. (2013). MAFFT multiple sequence alignment software version 7: improvements in performance and usability. Mol. Biol. Evol. 30, 772–780. doi: 10.1093/molbev/mst010
Letsch H., Beran F. (2023). Jumping to new hosts: the diversification of flea beetles (Coleoptera: Chrysomelidae: Alticini) in the context of their host plant associations. Insect Systematics Diversity 7, 2. doi: 10.1093/isd/ixad019
Lewin H. A., Richards S., Lieberman Aiden E., Allende M. L., Archibald J. M., Bálint M., et al. (2022). The earth bioGenome project 2020: Starting the clock. Proc. Natl. Acad. Sci. U. S. A. 119, e2115635118. doi: 10.1073/pnas.2115635118
Nie R.-E., Andújar C., Gómez-Rodríguez C., Bai M., Xue H.-J., Tang M., et al. (2020). The phylogeny of leaf beetles (Chrysomelidae) inferred from mitochondrial genomes. Syst. Entomol. 45, 188–204. doi: 10.1111/syen.12387
Nie R.-E., Li L.-L., Feijó A., Yang M.-X., Bai M., Creedy T. J., et al. (2024). Phylogenetic origin of an insect fauna at the boundary of the Palaearctic and Oriental realms: Evidence from “site-based“ mitogenomics. J. Biogeogr. doi: 10.1111/jbi.14821
Noguerales V., Meramveliotakis E., Castro-Insua A., Andújar C., Arribas P., Creedy T. J., et al. (2023). Community metabarcoding reveals the relative role of environmental filtering and spatial processes in metacommunity dynamics of soil microarthropods across a mosaic of montane forests. Mol. Ecol. 32, 6110–6128. doi: 10.1111/mec.16275
Ottati S., Eberle J., Rulik B., Köhler F., Ahrens D. (2022). From DNA barcodes to ecology: Meta-analysis of central European beetles reveal link with species ecology but also to data pattern and gaps. Ecol. Evol. 12, e9650. doi: 10.1002/ece3.9650
Prosser S. W. J., deWaard J. R., Miller S. E., Hebert P. D. N. (2016). DNA barcodes from century-old type specimens using next-generation sequencing. Mol. Ecol. Resour. 16, 487–497. doi: 10.1111/1755-0998.12474
Qian H., Zhang J., Jiang M. (2023). Global patterns of taxonomic and phylogenetic diversity of flowering plants: Biodiversity hotspots and coldspots. Plant Divers. 45, 265–271. doi: 10.1016/j.pld.2023.01.009
Quintero I., Landis M. J., Jetz W., Morlon H. (2023). The build-up of the present-day tropical diversity of tetrapods. Proc. Natl. Acad. Sci. U. S. A. 120, e2220672120. doi: 10.1073/pnas.2220672120
Ratnasingham S., Hebert P. D. N. (2007). BOLD: the barcode of life data system (http://www.barcodinglife.org). Mol. Ecol. Notes 7, 355–364. doi: 10.1111/j.1471-8286.2007.01678.x
Ratnasingham S., Hebert P. D. N. (2013). A DNA-based registry for all animal species: the barcode index number (BIN) system. PLoS One 8, e66213. doi: 10.1371/journal.pone.0066213
Roswell M., Dushoff J., Winfree R. (2021). A conceptual guide to measuring species diversity. Oikos 130, 321–338. doi: 10.1111/oik.07202
Sánchez-Restrepo A. F., Reche V. A., Cabrera N., Pan X., Pratt P., Sosa A. J. (2023). What distribution models of alligator weed in its native and invaded ranges tell us about its invasion story and biological control. Entomol. Exp. Appl. doi: 10.1111/eea.13353
Schmitt M., Rönn T. (2011). Types of geographical distribution of leaf beetles (Chrysomelidae) in Central Europe. Zookeys, 131–158. doi: 10.3897/zookeys.157.1798
Seymour M., Roslin T., deWaard J., Perez K., D’Souza M., Ratnasingham S., et al. (2022). Arthropod beta-diversity is spatially and temporally structured by latitude. Res. Square. doi: 10.21203/rs.3.rs-2180975/v1
Stamatakis A. (2014). RAxML version 8: a tool for phylogenetic analysis and post-analysis of large phylogenies. Bioinformatics 30, 1312–1313. doi: 10.1093/bioinformatics/btu033
Talavera G., Lukhtanov V., Pierce N. E., Vila R. (2022). DNA barcodes combined with multilocus data of representative taxa can generate reliable higher-level phylogenies. Syst. Biol. 71, 382–395. doi: 10.1093/sysbio/syab038
Tautz D., Arctander P., Minelli A., Thomas R. H., Vogler A. P. (2003). A plea for DNA taxonomy. Trends Ecol. Evol. 18, 70–74. doi: 10.1016/S0169-5347(02)00041-1
Tucker C. M., Shoemaker L. G., Davies K. F., Nemergut D. R., Melbourne B. A. (2016). Differentiating between niche and neutral assembly in metacommunities using null models of β-diversity. Oikos 125, 778–789. doi: 10.1111/oik.02803
Wendorff A., Schmitt M. (2019). Leaf beetle decline in Central Europe (Coleoptera: Chrysomelidae s.l.)? Zookeys 856, 115–135. doi: 10.3897/zookeys.856.32564
Keywords: DNA barcoding, taxonomy, insects, phylogeny, phylogenetic diversity (PD), biodiversity, sampling fraction, Costa Rica
Citation: Lo E, Nie R-E and Vogler AP (2024) The geographic and phylogenetic structure of public DNA barcode databases: an assessment using Chrysomelidae (leaf beetles). Front. Ecol. Evol. 12:1305898. doi: 10.3389/fevo.2024.1305898
Received: 02 October 2023; Accepted: 10 April 2024;
Published: 01 May 2024.
Edited by:
Marko Mutanen, University of Oulu, FinlandReviewed by:
Dirk Ahrens, Zoological Research Museum Alexander Koenig (LG), GermanyCopyright © 2024 Lo, Nie and Vogler. This is an open-access article distributed under the terms of the Creative Commons Attribution License (CC BY). The use, distribution or reproduction in other forums is permitted, provided the original author(s) and the copyright owner(s) are credited and that the original publication in this journal is cited, in accordance with accepted academic practice. No use, distribution or reproduction is permitted which does not comply with these terms.
*Correspondence: Alfried P. Vogler, YS52b2dsZXJAbmhtLmFjLnVr
Disclaimer: All claims expressed in this article are solely those of the authors and do not necessarily represent those of their affiliated organizations, or those of the publisher, the editors and the reviewers. Any product that may be evaluated in this article or claim that may be made by its manufacturer is not guaranteed or endorsed by the publisher.
Research integrity at Frontiers
Learn more about the work of our research integrity team to safeguard the quality of each article we publish.