 Tim Brandler1,2Nayden Chakarov2,3*
- 1Department of Paleontology, GeoZentrum Nordbayern, Friedrich-Alexander University, Erlangen, Germany
- 2Department of Animal Behaviour, Bielefeld University, Bielefeld, Germany
- 3Joint Institute for Individualisation in a Changing Environment (JICE), University of Münster and Bielefeld University, Bielefeld, Germany
Endosymbiotic organelles, such as mitochondria and plastids, contain own remnant genomes (nucleoids), whose variable abundance in cells may be adaptive to the physiological necessities and functions of the cells. Unicellular apicomplexan parasites contain one mitochondrium and one apicoplast with variable genome copy numbers. We measured the abundance of mitochondrial, apicoplast and nuclear genome copies in a set of avian blood samples infected with haemosporidian blood parasites, belonging to the three main genera Plasmodium, Haemoproteus and Leucocytozoon. We designed general primers suitable for qPCR, amplifying fragments of the mitogenome, plastome and nuclear genomes of avian malaria and related haemosporidian parasites. We measured the amplification of these fragments in 153 samples of 23 avian host species and infected with 33 parasitic lineages. We estimate on average several hundred mitochondrial genome copies and several tens of apicoplast copies per haploid gametocyte cell with substantial variation among samples. Host species appeared to differ in their mitogenome abundance while parasitic lineages differed in plastome abundance per cell (per nuclear copy signal). We did not find consistent differences between parasite genera or higher avian taxa. Parasite lineages and host bird species did not differ consistently in infection intensity, estimated from parasite to host nuclear signals, which may indicate that samples were taken at different stages of infection. However, this and similar results remain to be cross-validated with in-situ imaging techniques. The novel molecular tools introduced here offer avenues for the characterization of nucleoid abundance of haemosporidian parasites over environmental conditions and parasitic developmental stages. Such measures will improve our understanding of parasite physiology, ecology, the coadaptation and coevolution with hosts and suggest possible augmentations to standard methods in the research field.
Introduction
Organelle activity is a key feature of eukaryotic cells, necessary for the fulfilment of cellular functions (Cerveny et al., 2007; Choubey et al., 2019). Several organelles of endosymbiotic origin, such as mitochondria and plastids, contain own remnant genomes, which allow them to fulfil their cellular functions (Margulis, 1970). Despite the potential for selfish dynamics in conflict with nuclear genome copies, cells generally regulate organelle numbers and activity in response to external and intracellular stimuli (Marshall, 2007; Havird et al., 2019). For example, a growing field of research describes how mitochondrial abundance and activity in vertebrates may be regulated to fit the energetic needs of tissues and individuals (Cerveny et al., 2007; Salmón et al., 2023). While the mitochondrial system in plants is less well studied, these are models for plastid dynamics, leading to models for the simultaneous fluctuation of extranuclear genome copies in cell populations (Johnston, 2019).
The Black queen hypothesis predicts that the evolutionary dynamics between multiple (sub-)genomes within a super-organism, including some host-parasite associations, leads to losing or outsourcing of essential genes to the main nuclear genome and a following complete dependence i.e. endosymbiosis (Morris et al., 2012; Mas et al., 2016). Nevertheless, organelle genomes still contain a number of essential genes. In some phyla, cells have fixed numbers of some organelles, but even there their activity and genome copy number may vary to match physiological and developmental needs (Cole, 2016). Additionally, in unicellular organisms the inter-individual variation in organelle abundance, activity and genome copy numbers may be under stronger selection and more tightly linked to the environment than in multicellular ones, where services can be transferred between cells (Cole, 2016). Thus, through different abundance, activity and/or genome copy numbers of organelles, different lineages of unicellular eukaryotes may achieve different ecological specialization, e.g. advantages at colonizing more respiration-prone or sun-lit environments. We propose that the ratios of between-organelle and organelle-nuclear genome copies in unicellular organisms may help to characterize and understand the ecology of closely related cell populations and the differentiation of their life-histories and stages.
Haemosporidian blood parasites (hereafter also reffered to as blood parasites) are an order of the phylum of unicellular eukaryotes Apicomplexa (Haemosporida, Apicomplexa). Members of this group are malaria-causing Plasmodium species but also members of several other genera such as Haemoproteus and Leucocytozoon (Valkiūnas, 2005). Group members are best studied in humans and rodents, but most species infect blood cells of diverse vertebrates such as reptiles, bats, the greatest diversity being studied in avian hosts (Bensch et al., 2009). Haemosporidians are obligate vector-transmitted parasites with great parts of the life cycle and several important developmental stages, including sexual reproduction, fulfilled in dipteran insect hosts (Santiago-Alarcon et al., 2012). Like other apicomplexans, haemosporidians contain mitochondria and apicoplasts, the latter derived through secondary endosymbiosis from red algae, both organelles having their own genomes (nucleoids, the mitogenome and plastome, correspondingly)(McFadden, 2011; McFadden and Yeh, 2017). The apicoplast is a synapormorphy of Apicomplexa, being an exclusive characteristic of the group (Grattepanche et al., 2018). It has received attention as a possible target for vaccines and treatment against malaria (Low et al., 2018). Evidence accumulated over the last two decades indicates that in apicomplexans, each cell has a single mitochondrium and a single apicoplast (Okamoto et al., 2009; Seeber et al., 2020). In diverse parasitic life stages, changes in organelle shape, extent and structure indicate a potential for substantial variation in mitogenome and plastome abundance (Matsuzaki et al., 2001). The linear mitogenome unit is around 6 kb large, contains only 3 functional genes and is typically arranged in tandem repeat formation. The circular plastome is around 30 kb large and contains typically more than 30 genes (Imura et al., 2014; Cepeda et al., 2021). While the mitogenome and plastome of haemosporidians encode for links in several essential pathways, including joint chimerical pathways, predominant parts of the organellar proteomes are imported from the cytosol of the parasite cell (Sheiner et al., 2013). Thus, the organelles of this group appear as suitable, very minimalistic models to explore the above premise of potentially adaptive variation in nucleoid abundance.
In this work, we compare several haemosporidian lineages in their mitogenome and plastome abundance. To achieve this, we performed qPCRs with newly-designed general primers targeting haemosporidian apicoplast, mitochondrial and nuclear sequences and combined them with available primers targeting a single-copy gene in the avian host nucleus. Avian nuclear and haemosporidian mitochondrial-targeting primers have so far been typically used for molecular estimation of infection intensity. We utilized samples of infected avian blood from our collection, to span much of the phylogenetic diversity of haemosporidian parasites and searched for phylogenetic factors explaining the estimated organelle genome copy numbers.
Materials and methods
The set of haemosporidian infections used in this study consisted of blood samples gathered from different bird species during field studies in Europe. Thus, the dominating parasitic stages analyzed in this sample set are presumably gametocytes even though for most species no information about their developmental stage is available. The sampling was approved and performed in accordance with the local legislation and institutional requirements. All used samples were identified as infected by a single haemosporidian genus through multiplex PCR following Ciloglu et al. (2019). The lineage-defining cyt B fragment was amplified through nested PCR as described in Hellgren et al. (2004); Bensch et al. (2009) and Chakarov et al. (2020) and bi-directional Sanger sequencing was performed on an ABI 3730 Analyzer (Applied Biosystems, Waltham, MA, USA) at the Bielefeld Center for Biotechnology (CeBiTec) with BigDye Terminator v1.1 cycle sequencing kit (Thermo Fisher Scientific) using the respective internal primers. Raw sequences were edited and aligned in Geneious 8.1.9 and compared with sequences in the MalAvi database (Bensch et al., 2009, August 2023). Lack of mixed peaks in separate samples was interpreted as infection with one lineage or an infection strongly dominated by a single lineage and thus suitable for the purposes of this study. This resulted in a dataset of 33 lineages already listed in the MalAvi databank in 153 samples of 23 host species (Figures 1, 2).
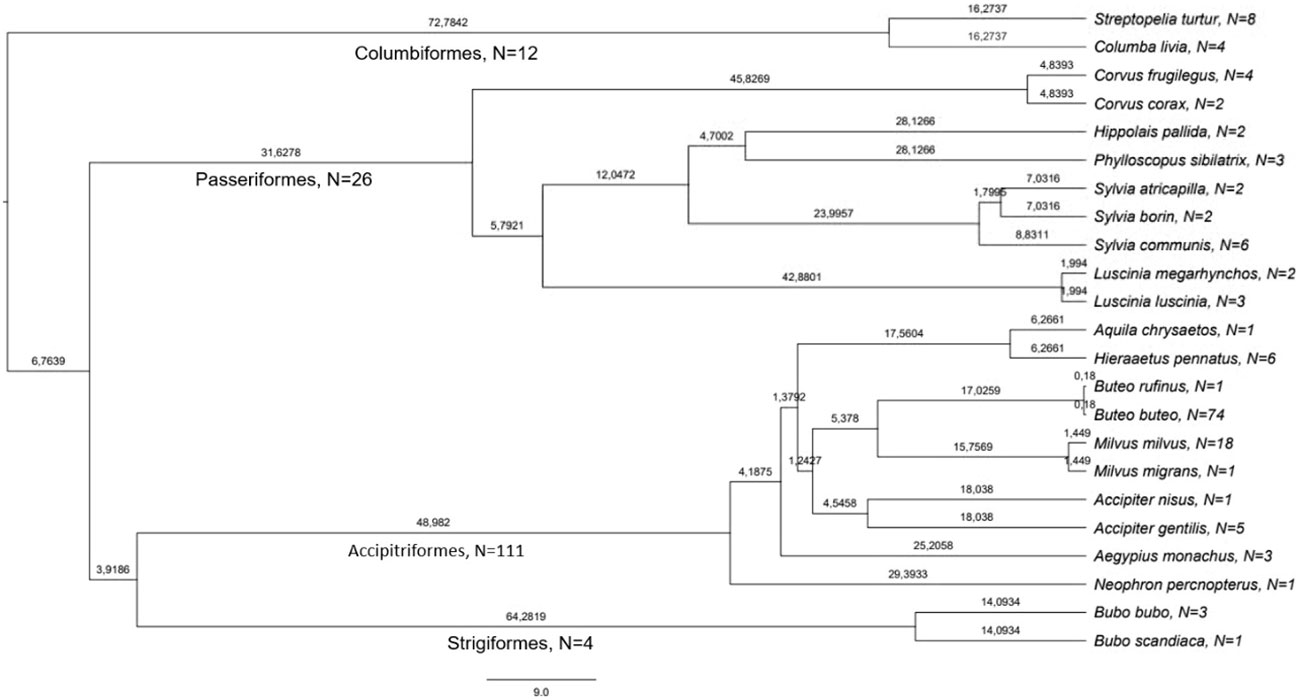
Figure 1 Phylogeny and number of samples of bird species used in this study. The values on the branches are million years since last divergence, derived from birdtree.org (Jetz et al., 2014). The number of used samples per species is given after the name of species and order.
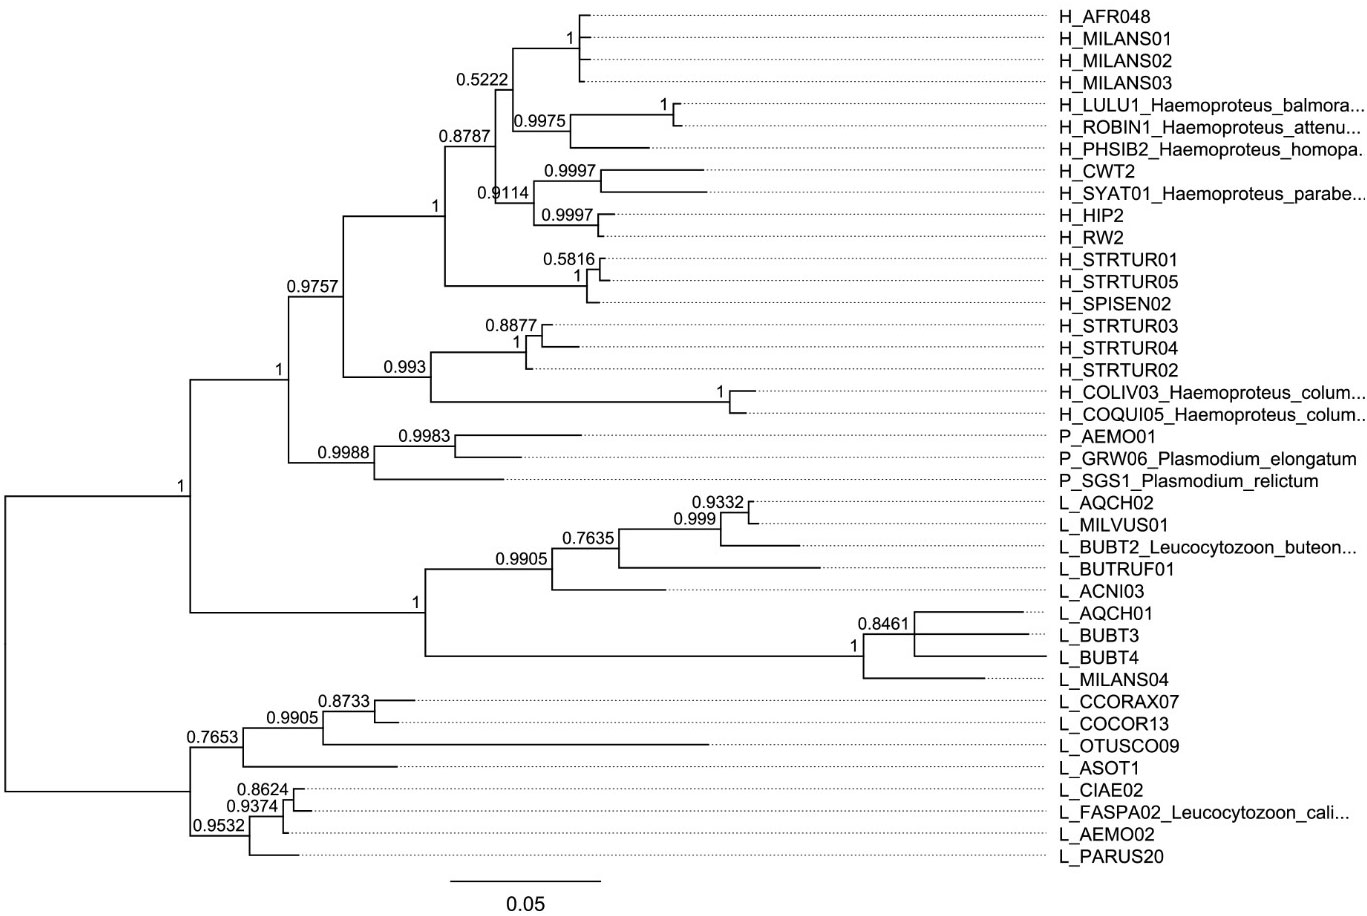
Figure 2 Bayesian phylogenetic hypothesis of infecting haemosporidian lineages used in this work. Additional lineages have been added for reference. The posterior probability values calculated with MrBayes version 3.2.7 are indicated at each node.
Four qPCR assays were performed in parallel on all the samples where a single infecting lineage was identified through Sanger sequencing (N=153). Four different pairs of primers were used in four separate reactions, targeting different nuclear or organelle genome fragments, expected in an infected population of blood cells (Table 1). While SFSR3 has been previously established and used in several studies to amplify a conserved gene fragment from bird genomes (Asghar et al., 2011; Rattiste et al., 2015; Huang et al., 2018), three sets of primers were newly designed to quantify haemosporidian mitochondrial, apicoplast and nuclear genomes. The primer design was based on consensus regions derived from genomes of the respective organelle or nucleus belonging to lineages representative of different haemosporidian genera (Figure 3). Available genome sequences of Plasmodium, Haemoproteus tartakovskyi, Haemoproteus columbae, Leucocytozoon cauylerii were downloaded from Genbank (Omori et al., 2008; Imura et al., 2014; Bensch et al., 2016; Cepeda et al., 2021). Additional unpublished draft genomic sequences from our lab from several raptor lineages were used as references for Leucocytozoon and the probable subgenus of BUBT1 Haemoproteus multivacuolatus (Harl et al., 2024). Geneious 8.1.9 was used to make alignments, identify consensus regions and design consensus primers targeting 100-150 bp fragments in these regions (Table 1, Figure 3). For apicoplast and mitochondrial genomes, conserved regions of the desired length were found between haemosporidian genera and could be targeted by primers without primer degeneracy. For the haemosporidian nuclear genomes, only regions with a maximum consensus of 88.5% and 89.7% were found (for forward and reverse primers, respectively), thus necessitating ambiguous nucleotides in the designed primers. The primers were then tested for functionality with test samples where every parasite genus and bird order were represented along with 2 negative controls (ddH2O and uninfected bird sample).
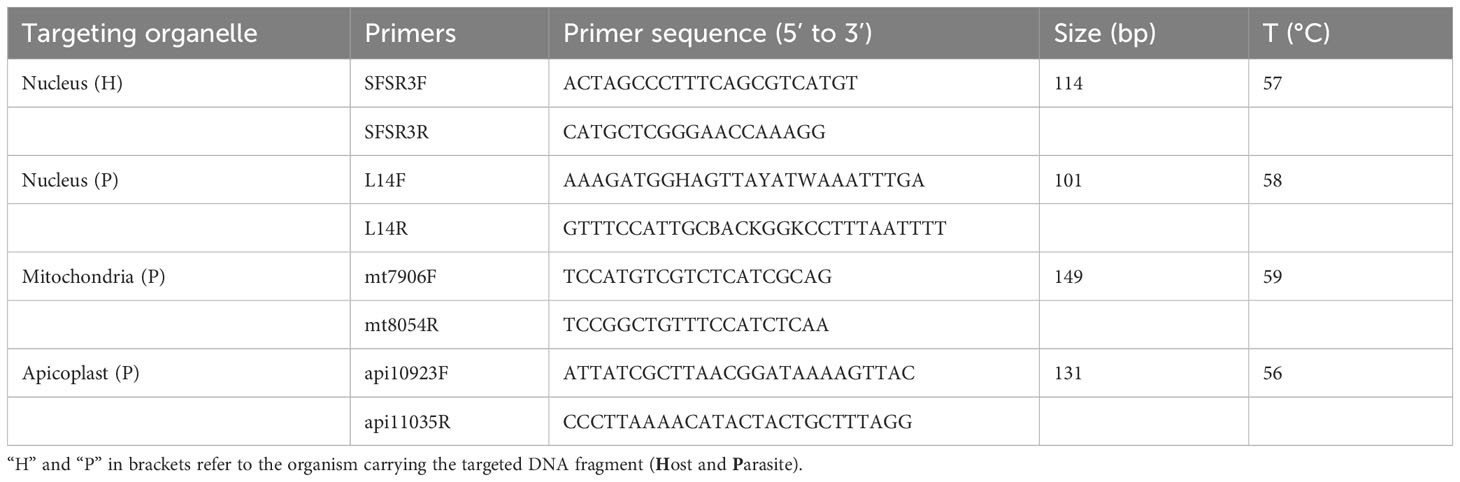
Table 1 Sequences, amplified fragment size and annealing temperature of primers used for qPCR.
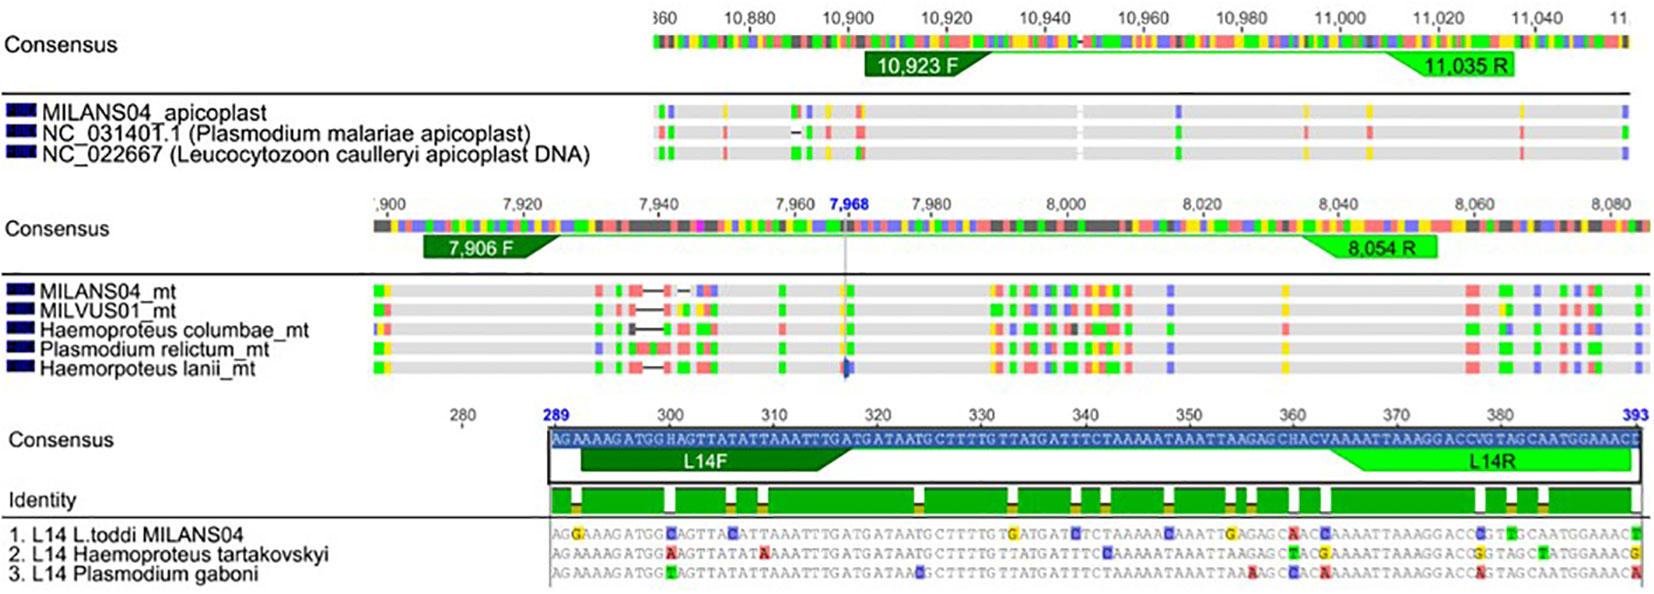
Figure 3 Primer design of new primers used in this study. Alignments of the genetic code of apicoplasts, mitochondria and nucleus of reference haemosporidian blood parasites. Under the consensus sequences for each genomic/nucleoid fragment, the lineage specific code is depicted with differences to consensus being highlighted in base specific colouring (Thymine-green, Adenine-red, Cytosine-blue, Guanin-yellow). Figure produced with Geneious 8.1.9.
All qPCR assays were performed with an CFX Connect™ real-time qPCR instrument using EvaGreen DNA-binding dye (my-Budget 5x EvaGreen QPCR-Mix II, Bio-Budget Technologies GmbH), with annealing temperatures as listed in Table 1. The thermal profile started with an incubation step at 50°C for 5 min and 94°C for 3 min, followed by 41 thermal cycles (30s at 94°C for, 10s at annealing T and 30s at 72°C). Each reaction well included 2 µl of diluted DNA (10 μM), 1.25 µl of each primer (10 μM), 2 µl EvaGreen master mix, and 3.5 µl ddH2O (10µ total). For every plate of 96 wells, 26 samples were run in triplicate along with a 5-fold dilution series of an infected bird sample with known concentrations of host and parasite DNA used as standard (25 μM, 5 μM, 1 μM, 0.2 μM, 0.04 μM) and a “golden sample” (gs) which should always deliver the same primer-specific Ct-values (cycle threshold). Both the standard dilution samples and the golden sample were infected with the Leucocytozoon lineage MILANS04. Amplification curves were inspected after the runs to verify the Ct of each sample. Default settings were used to calculate the plate-specific threshold cycle, indicating amplification-caused fluorescence to exceed background noise (Asghar et al., 2011). qPRC plates producing standard curves outside 100 ± 10% qPCR efficiency were discarded and then re-run. We assumed comparable amplification efficiency between parasite lineages and DNA amplification targets in different organelles. To calculate the relative quantities (RQ) for each sample, the formula, RQ = 2aCTi_, was used with a being the primer-specific slope of the standard dilution row i.e., the log2 of the 5-fold standard concentrations against the Ct-values measured for these concentrations. The formula is based on Livak and Schmittgen (2001) formula to calculate relative qPCR data. Ratios of RQ of mitochondrial and nuclear templates were calculated to estimate mitogenome abundance per cell (M/N). Ratios of RQ of apicoplast and nuclear templates were calculated to estimate plastome density per cell (A/N). For most samples, no blood smear was available. Therefore, we refrained from producing interspecific standard curves, matching Ct-values and microscopic parasitemia.
For the used haemosporidian lineages, a bayesian phylogenety was produced with MrBayes version 3.2.7 based on the sequences of the MalAvi cytochrome b fragment. A HKY85+gamma model and L_MILANS04 as an outgroup was used and run for 1.1 million cycles with 100k as burn-in. Lineages from MalAvi which were not measured with qPCR were added for reference. Phylogenetic trees for avian hosts were derived from birdtree.org. All statistical analyses were done in R version 4.1.3. Pearson correlation tests were used to assess the correlation between estimates of genomic copies (raw data is available in Supplementary Information).
To assess the influence of taxonomy on relative genomic copy estimates, linear mixed effects regression models (lmer) were performed using the “lme4” package (De Boeck et al., 2011). Taxon levels, such as order and family, were included as nested random effects. To retrieve test statistics, single-factorial ANOVAs were performed comparing models missing either the complete nested taxonomy of hosts or parasites and adding the tested taxonomic group as random factor, starting from the highest taxonomic level, and stepwise adding the lower ones. To correct for differences between qPCR runs “plate” was also included in the mixed effects models but proved to not significantly explain variance.
Results
Based on the relative quantities (RQ) derived from qPCR measurements for each template, we estimate on average several hundred mitogenome copies per haploid haemosporidian gametocytic cell (M/N, mean=1252, median=267, range 0.78-21263, std. dev= 2906, Figure 4A). In contrast, there were 6-7 times fewer estimated apicoplast genome copies per haploid gametocyte (A/N, mean=165, median=42, range 0.80-4590, std. dev= 456, Figure 4B). The average infection intensity among the analyzed samples, estimated from RQ of parasite nuclear copies relative to host nuclear copies (times 2, as host cells are diploid and parasite gametocytes are haploid) was 0.9% of blood cells infected (mean=0.889%, median=0.022%, range=0.001-24.93%, std. dev=2.865, Figure 4C).
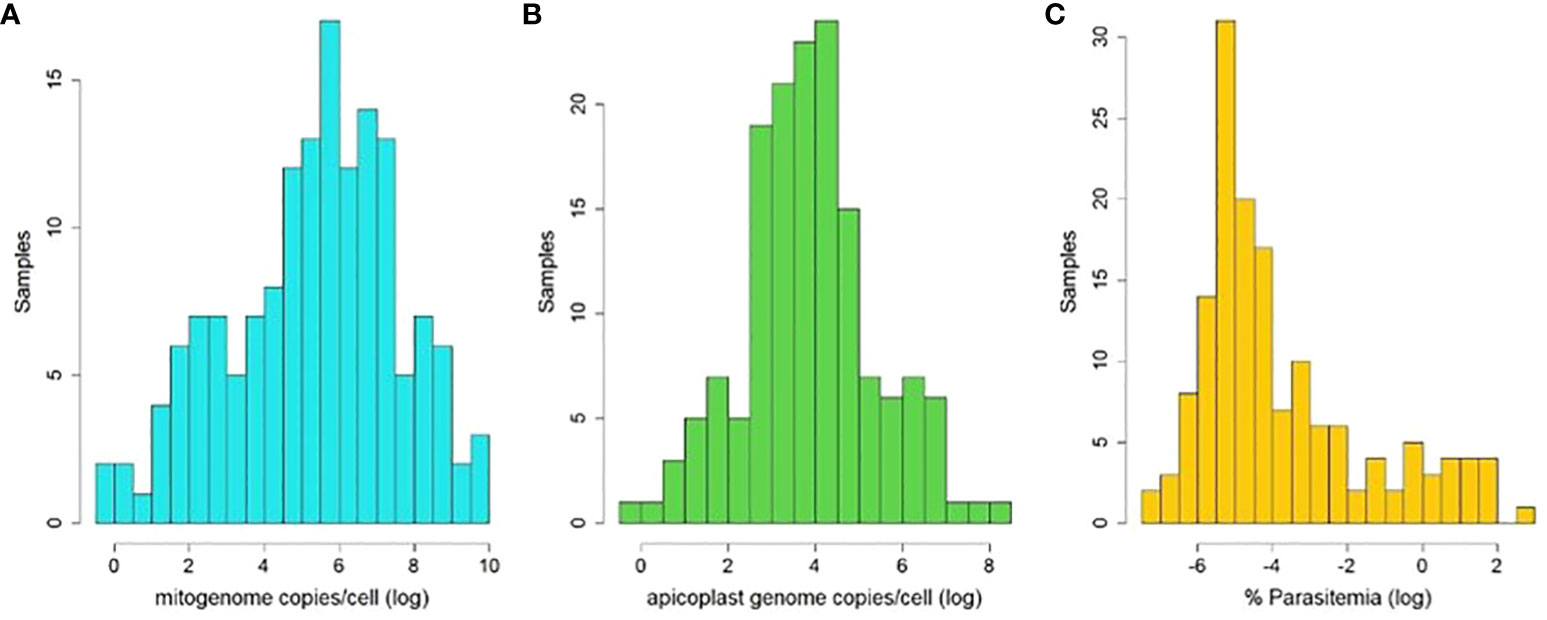
Figure 4 Histograms of estimated organelle genome copy abundances per haemosporidian cell (logn-transformed) and estimated parasitemia of used samples (logn-transformed). Abundances were calculated as ratios of relative quantities (RQ) of mitogenome templates to parasite nuclear templates (A), apicoplast templates to parasite nuclear templates (B) and parasite nuclear to host nuclear templates (C) amplified via qPCR.
Overall, the amplification of parasite nuclear templates correlated well with the amplification of parasite mitogenome templates (r²=0.50, Figure 5A) and plastome template copies (r²=0.61, Figure 5B) for the complete sample set. Parasite apicoplast and mitochondrial signals also correlated strongly between each other (r²=0.66, Figure 5C). Varying levels of parasitemia for the combined sample set were indicated by the absence of a significant correlation between signals of host and parasite nuclear copies (r²=0.012, Figure 5D).
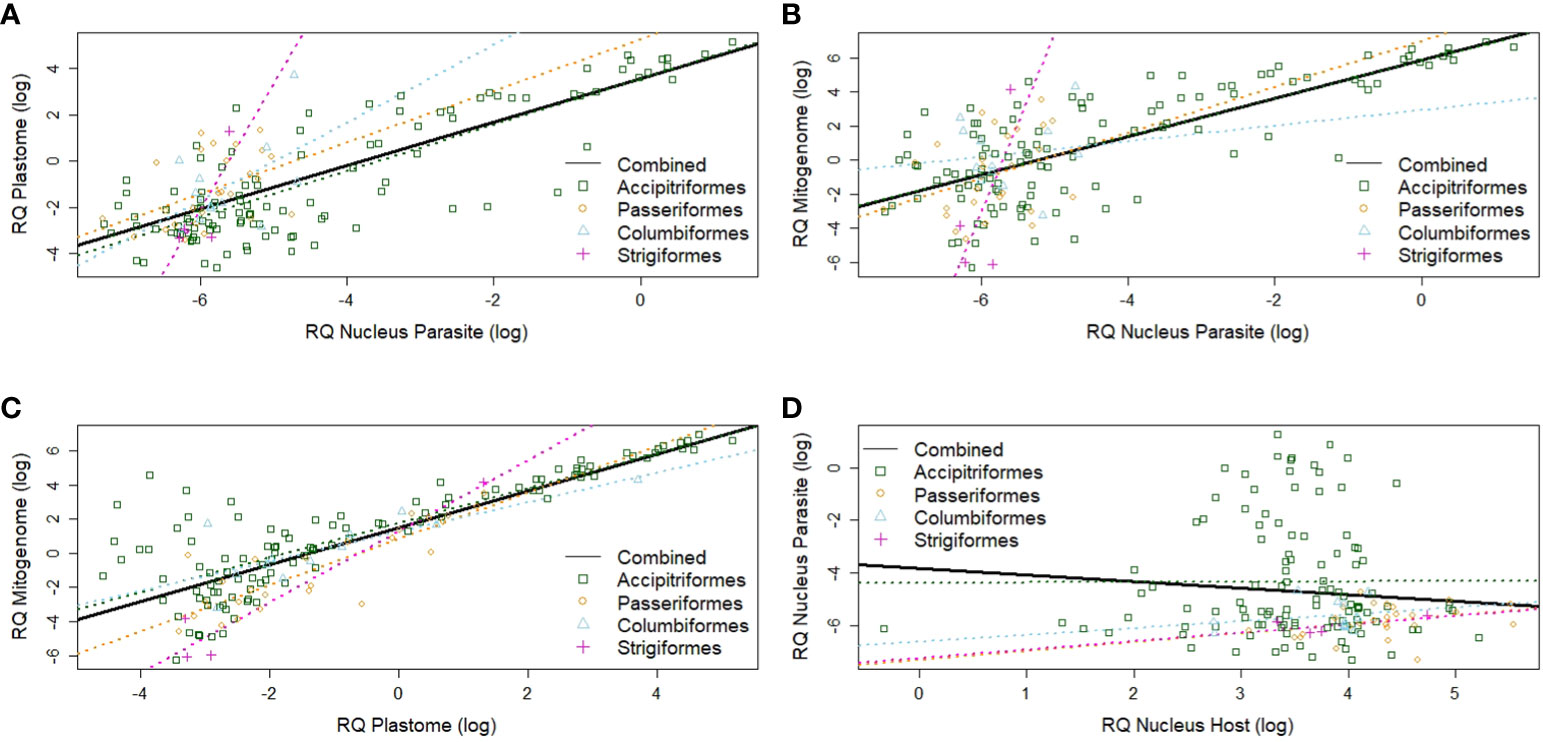
Figure 5 Scatter diagrams of organelle- and nuclear-derived DNA signals based on qPCR. (A) Apicoplast (plastome) vs. haemosporidian nuclear-derived signals. (B) Haemosporidian mitochondrial (mitogenome) vs. haemosporidian nuclear-derived signals. (C) Haemosporidian mitochondrial (mitogenome) vs. haemosporidian apicoplast (plastome)-derived signals. (D) Haemosporidian nuclear-derived vs. host nuclear-derived signal. Black lines are overall regressions. Colorized dots and dotted lines indicate avian order-specific regressions. The log2 of the relative quantities (RQ) is used for all data. RQ is measured in relative units.
Among avian order-specific correlations, estimated mitogenome and nuclear copies had a weak correlation for all orders, being statistically significant only in Accipitriformes. In comparison, copy numbers of plastome and parasite nucleus genomes correlated from moderately (in Passeriformes and Columbiformes) to strongly (in Strigiformes, and Accipitriformes). However, these correlations were only statistically significant for both most strongly represented orders - Accipitriformes and Passeriformes. Nuclear genome copies of host and parasite had no significant correlations (Table 2).
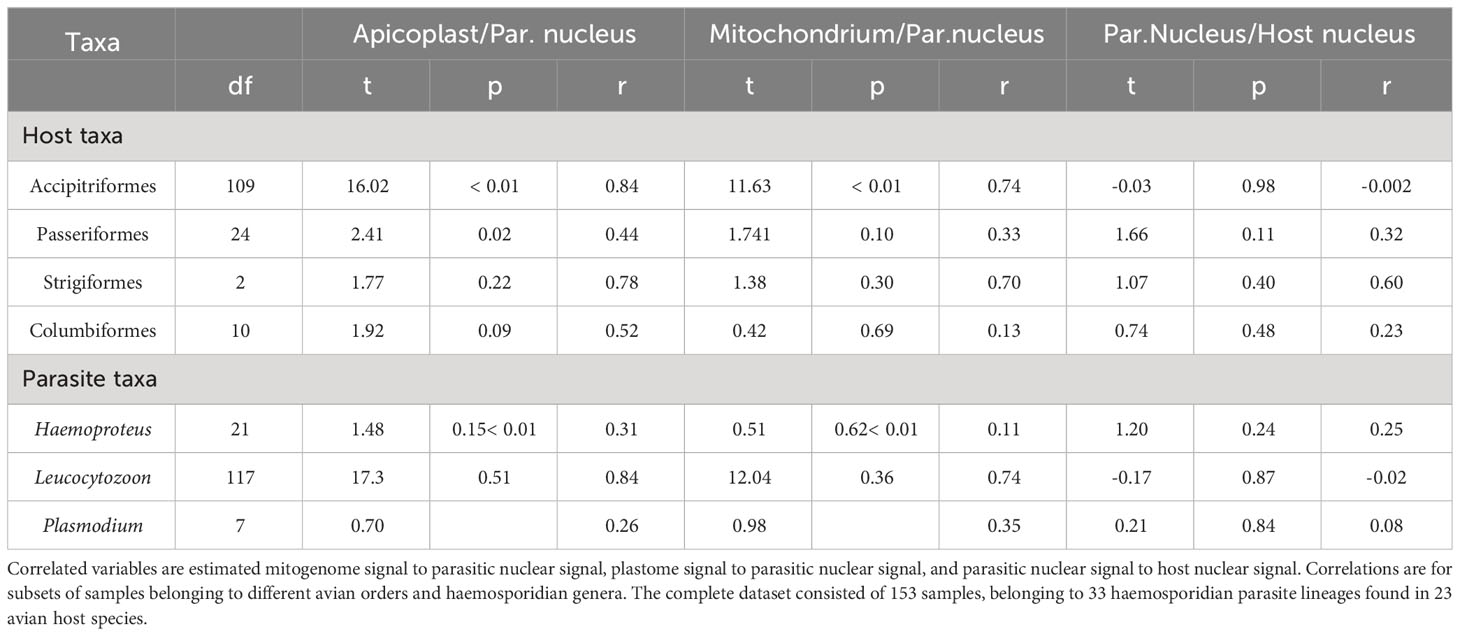
Table 2 Test statistics of Pearson correlations.
For parasite-genus-specific correlations, estimates of mitogenome and parasite nuclear copies had low correlations for Haemoproteus, moderate for Plasmodium and high correlations for Leucocytozoon, only the latter one being statistically significant (Table 2). In comparison, estimates of plastome and parasite nuclear genomes copies correlated strongly for Leucocytozoon and moderately for Haemoproteus and Plasmodium. Nuclear copies of host and parasite overall showed no significant correlation for any parasite genus.
All taxonomic groups of both host and parasite had significant correlations between mitochondria and plastid genome copies with strong correlations (r ranging between 0.79 and 0.97, Figure 6).
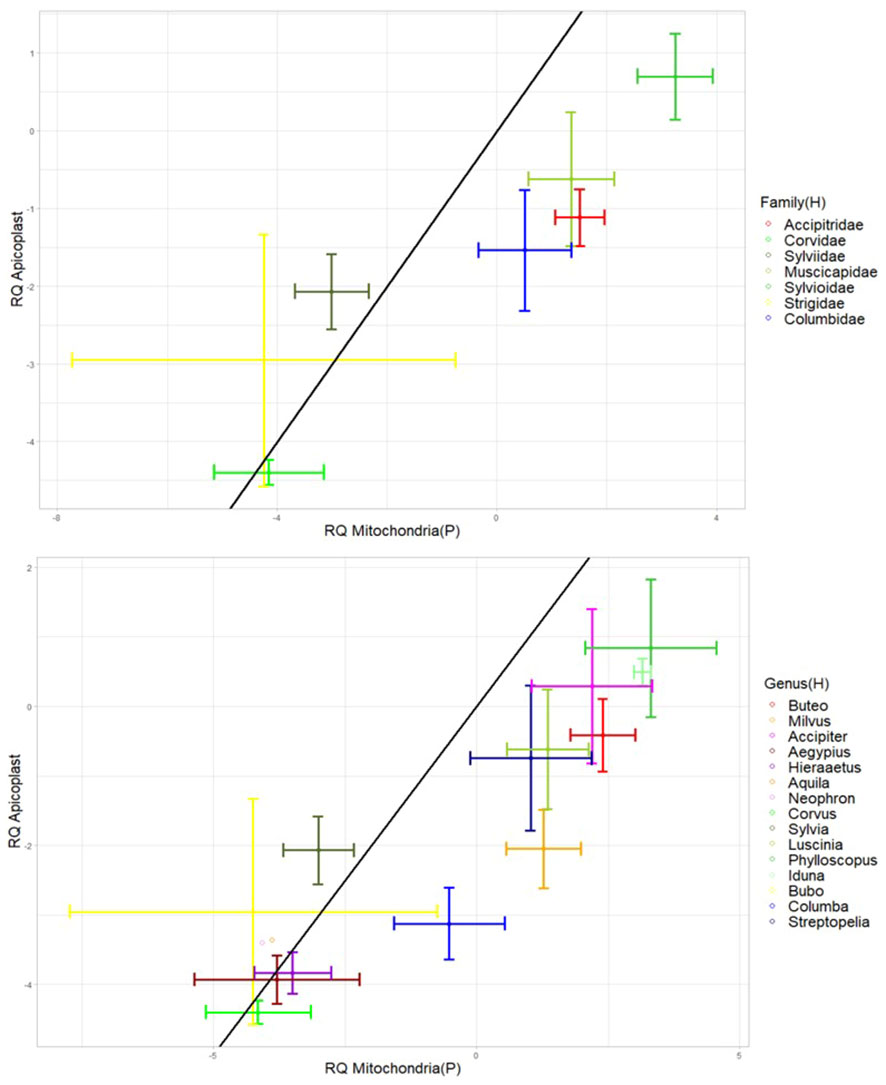
Figure 6 Bi-directional-error-bar plots showing the relative abundance of apicoplasts plotted against the relative abundance of parasite mitochondria for each avian host family (top plot) and each avian host genus (bottom plot). The black line corresponds to a 1 to 1 ratio of mitochondria to apicoplasts. The natural log of the relative quantities (RQ) was used for all data. RQ is measured in relative units. “H” and “P” in brackets refer to the organism carrying the organelle (Host and Parasite).
In order to detect potential effects of host or parasite taxonomic group, the ratio of organelle- and nucleus-derived amplification signal and thus the per-cell abundance of nucleoids were tested for differences between host and parasite taxa. The explanatory power increased with lower levels of taxonomy. For the quantified copy ratio of M/N, host species had a significant explanatory effect (p=0.02, Table 3, Figure 7). There were no significant differences in M/N ratio between parasite lineages, genera, host families and orders. The estimated A/N was only explained by parasite lineage (p<0.001). The estimated parasite-nucleus to host-nucleus ratio (i.e. infection intensity) was not significantly explained neither by parasite, nor by host taxonomy.
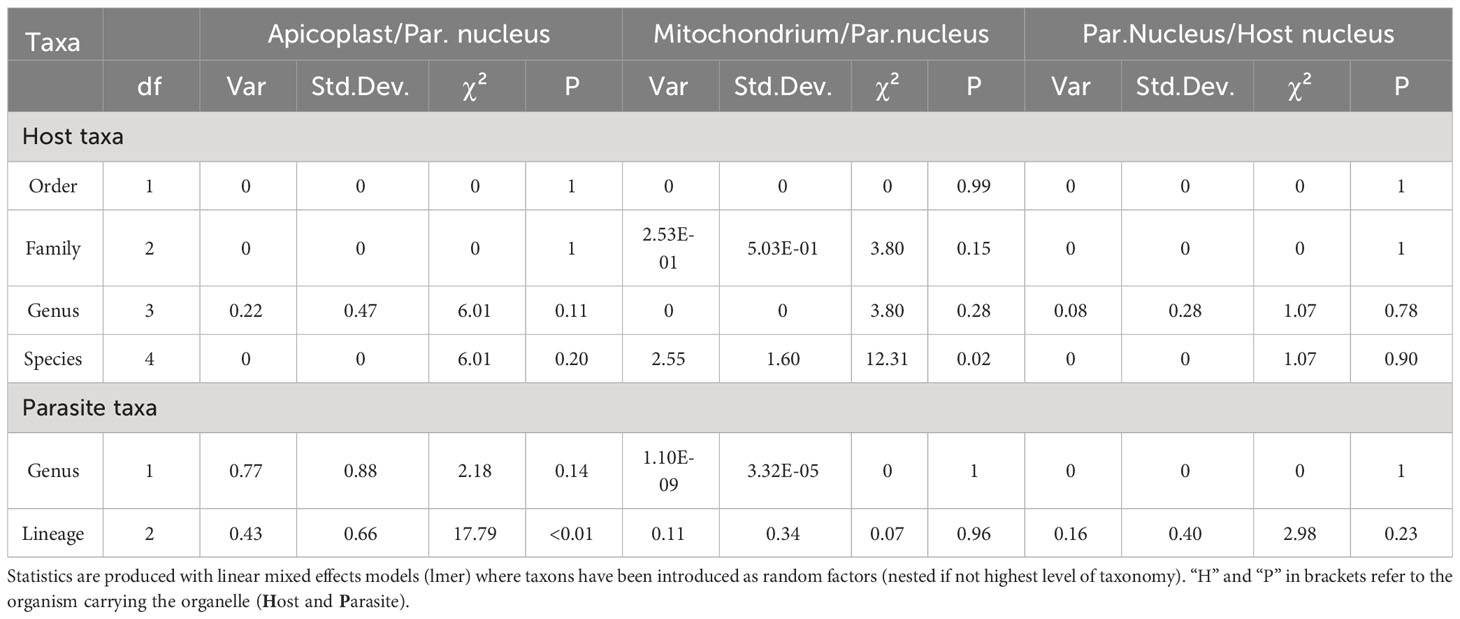
Table 3 Test statistics showing the explanatory power of different taxon levels to the correlations of estimated mitogenome signal to parasitic nuclear signal, plastome signal to parasitic nuclear signal, and parasitic nuclear signal to host nuclear signal.
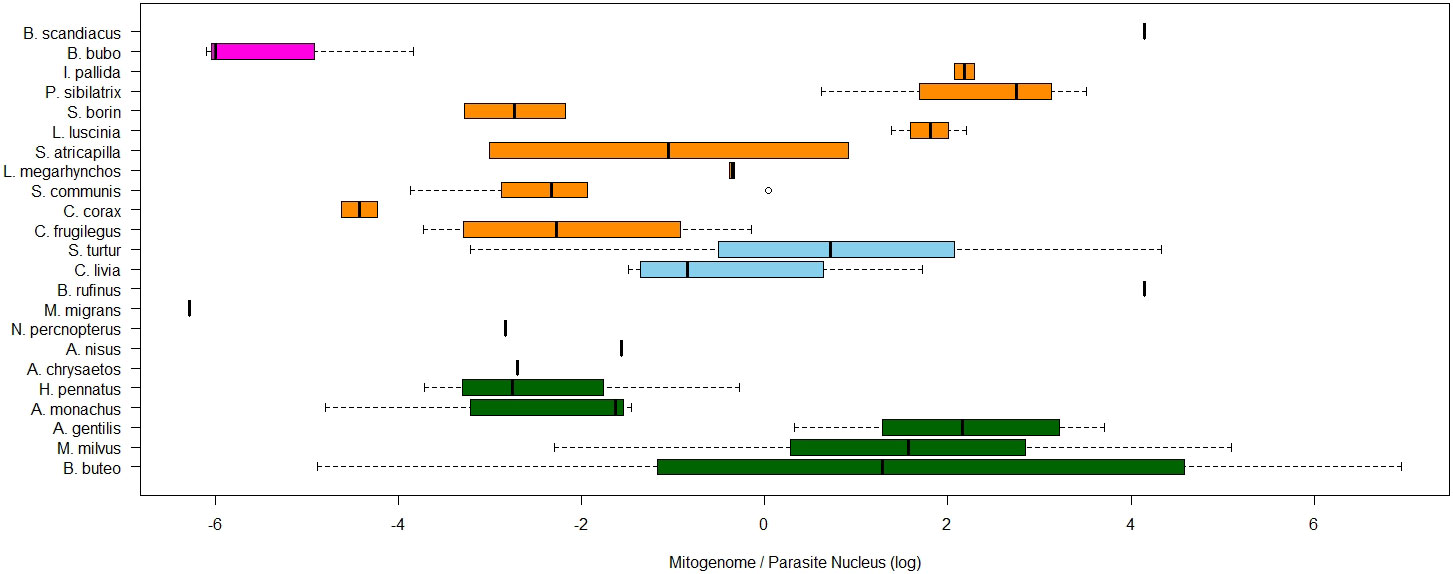
Figure 7 Boxplots of ratios of estimated mitogenome abundance (M/N), compared between avian hosts species. The natural log of the relative quantities (RQ) was used for all data. RQ is measured in relative units. Colours of boxplots represent different bird orders.
Discussion
We found that organelle genome abundance per haemosporidian blood parasite cell, estimated through qPCR, appears to be several orders of magnitude higher than the presumable single nuclear copy per haploid gametocytic cell. Mitogenome copies appeared to be several times more common than plastome copies. Additionally, there was substantial variation in mitogenome and plastome abundance between samples. For plastomes this was partly explained by parasite lineage identity but not by higher order parasite taxonomical group or host taxonomy. However, for mitogenomes, the variation seems to be partly explained by host species but not by higher order host taxa or parasite taxonomy. Among the used samples, infection intensity, i.e. the ratio of parasite to host nuclear templates was neither explained by host nor parasite taxonomy and might be more strongly influenced by the stage of infection during the time of sampling.
There was substantial variation of nucleoid abundance even between samples but, despite presumably continuing to have a single mitochondrium and apicoplast per cell, different factors appeared to explain the variation in abundance for both nucleoids. Interestingly, host species was the only significant factor explaining any variation in mitogenome abundance while parasite lineage was the only factor explaining variation found in plastome copy abundance. This indicates that the different functions of both organelles may lead to their genome copy numbers and activity to be regulated by different factors - more environmental in the case of mitochondria and more inherited in case of apicoplasts. This is partly congruent with previous point estimates from few Plasmodium species (Berná et al., 2021). Future studies along this avenue would have to test this notion and provide further support for our suggestion that such variation in nucleoid copies may be adapted to different physiological and ecological necessities, life histories and host environments of the parasite population and individual parasites. However, no higher level taxonomic group explained any of the variation. This suggests that the nucleoid abundances are possibly much more variable, possibly even adaptable, and react to changes much smaller than accumulated over evolutionary timescales. Further studies analyzing how nucleoid abundances within a single lineage fluctuate over the course of a single infection, host lifetime, change with infection intensity and between different parasite stages, should be of great interest. Indeed, the stages adapted to insect vectors some of which are diploid - zygotes, ookinetes, oocysts, and sporozoites, can be expected to have very different physiology and thus demand for different organellar activity and nucleoid copies (Valkiūnas, 2005). However, these stages have far lower overall numbers, are difficult to isolate from small insect vectors and will remain very challenging to purify for separate analyses (Chagas et al., 2019). Single-cell sequencing techniques may open new horizons in this avenue, once combined with studies on infected vectors. Microscopic in-situ staining studies will also be needed to follow in detail the processes in different parasitic species. So far, these steps have been only performed in few Plasmodium species.
A particularly interesting case of difference in genome copy variation between parasitic stages is the exflagellation. Then, eight microgametes are produced and emerge from a microgametocyte, lacking a mitochondrium and an apicoplast, but resulting from three serial nuclear divisions fulfilled is a very short time (Okamoto et al., 2009). This process is sometimes fulfilled within few or even one minute in Leucocytozoon-infected samples exposed to air (Valkiūnas, 2005). Such divisions do not take place in macrogametocytes. Thus, when given sufficient time for exflagellation, sometimes comparable with the time needed to take a blood sample, an increase of nuclear signals will be achieved. This has been actively used to get some of the few samples suitable for whole-nuclear genome sequencing of haemosporidians from wild hosts, albeit to the partial detriment of mitochondrial and apicoplast sequences (Bensch et al., 2016, Chakarov et al. in prep.). Thus, the extent of strengthening of the nuclear signal may be indicative to the gametocyte ratio (micro- to macrogametocytes) in a sample (West et al., 2001). Until this effect is sufficiently characterized, however, it mostly indicates a reason for comparative measurements to be made in samples, which have been fixed swiftly, before exposure to air and thus have low added noise by exflagellation effects. Additionally, it would be advisable for samples used in comparative qPCR measurements, including molecular estimations of parasitemia to be RNAase-treated. This is not yet standard in the field of haemosporidian qPCR measurements and the current study also did not incorporate this purification step. Unpublished data from single RNAase-treated whole-genome-sequenced samples suggests that the proportions of mitogenome and plastome abundances are indeed in the order of magnitude found in the current study. In the future, the standard use of RNAase in all used samples would secure that pure DNA abundances are measured rather than a mix of DNA and RNA signals (Chakarov et al. in prep).
A conclusion, directly relating to our results, concerns typical molecular methods for estimation of parasitemia, i.e. infection intensity. These are typically based on the ratio between qPCR-derived host nuclear to parasite mitochondrial signal, some studies comparing the signal between host species, parasite lineages and even genera. These were the only quantifiable targets available to date and the mitogenome is the strongest possible signal of the usually highly underrepresented parasitic cells. Nevertheless, our results suggest that assuming the same ratio of mitogenome to nuclear signal, i.e. comparability of mitogenome signal strength, between host species, parasite genera, lineages or even infection developmental stages, might not be warranted without further controls and can distort estimates of parasitemia. The variation of mitogenome and plastid per parasite nuclear signal should be further investigated in order to establish some of the main determinants of this variation. We suggest that, qPCR studies analyzing parasitemia should preferentially use parasite nuclear targets to compare with host nuclear targets, if the sample-specific parasitemia is high enough to make estimates based on parasitic nuclear signals reliable. However, the parasitemia levels at which nuclear qPCRs are still reliable should be established before the main measurement.
We used standard protocols to identify samples with infections, appearing to be dominated by a single parasitic lineage. This suggests that the signals we measured were not strongly intermixed with secondary lineages infecting the sample. Nevertheless, it should be noticed that standard PCR detection procedures tend to strongly underestimate the prevalence of mixed infections. More high-throughput sequencing approaches will be needed to estimate the true extent of mixed infections (including by members of the same genus) and corresponding infection intensities of co-infectors within samples (Bernotienė et al., 2016; Barrow et al., 2019).
For this study, we needed to design general primers for mitochondrial, apicoplast and nuclear haemosporidian genomic DNA targets. Тhere are currently many published haemosporidian mitogenomes and numerous published primer designs for larger mitochondrial fragments, aimed at sequencing of lineage-defining fragments (Bensch et al., 2009; Pacheco et al., 2018). Diverse primer designs have been also published for qPCR amplification of haemosporidian mitogenome fragments (Asghar et al., 2011; Bell et al., 2015; Huang et al., 2018; Huang et al., 2020). However, the efficiency of these assays varies and sometimes they are not aimed to be general (e.g. Ciloglu et al., 2019; Huang et al., 2020). A substantial challenge was the design of general primers for apicoplast and particularly nuclear targets, as there are very few published whole apicoplast and nuclear sequences for haemosporidians outside of Plasmodium (Imura et al., 2014; Bensch et al., 2016; Cepeda et al., 2021). Suitable sequences from Leucocytozoon in both categories have not been published apart from the apicoplast sequence of Leucocytozoon caulleryi, a lineage which does not root within the main clade of Leucocytozoon (Omori et al., 2008; Imura et al., 2014; Harl et al., 2024). Additionally, few nuclear sequences of haemosporidians appear to be conserved enough to allow primer design in the needed size range for qPCR. To close this gap, we made use of the whole genome sequencing data analysed in our laboratory (in prep.) of both nuclear and apicoplast sequences of Leucocytozoon and of the potentially separate subgenus or genus of Haemoproteus multivacuolatus (Harl et al., 2024). We managed to design primers which appear to fit diverse haemosporidians, including Leucocytozoon as one of the most diverse haemosporidian genera. As more deeply separated clades of the haemosporidian phylogeny are being discovered and tested, some primers designed to be general often prove unable to amplify parasites of certain clades. Such is the case even with the most established and popular primers in the research field (see Harl et al., 2024). Thus, the sufficient generality of used or newly designed primers needs to be verified for each specific study. The methods presented here also remain to be tested with controlled experimental infections under lab conditions, where the number of infecting lineages, age and stage of infection are set, as well as the represented parasite stages in each sample.
A potential constraint when comparing PCR amplification signals from different genomic fragments may arise from the differences in GC-ratios between haemosporidian genomes (Videvall, 2018). Severe AT-bias is known for some haemosporidian parasites and tends to decrease PCR amplification efficiency (Aird et al., 2011). This bias may make the whole genome sequencing of haemosporidian parasites even more challenging than previously believed (Palinauskas et al., 2013). In the case of our chosen targets, plastomes and mitogenomes appeared to have rather conserved AT/GC content of approximately 12-15% GC and 30% GC, respectively. Variation in nuclear genomes was considerably higher with approximately 20% GC known for many Plasmodium, 15 to 26% GC observed in the rare instances of Haemoproteus nuclear sequences and 25 to 45% GC observed in Leucocytozoon nuclear sequences (Bensch et al., 2016; Videvall, 2018, Chakarov et al. in prep). These biases suggest that especially in Leucocytozoon, the apicoplast and mitochondrial signal should be weaker in relation to the nuclear signals, compared to Plasmodium and Haemoproteus where the difference in GC content between nucleoid and nuclear genomes is less expressed. However, no such systematic pattern with weaker nucleoid signals for Leucocytozoon could be observed, indicating that the amplification bias may be lower than the overall estimation error (Figure 8). Nevertheless, testing the assumption of comparable amplification efficiency between parasite lineages and DNA amplification targets through multiple control dilution rows with samples infected by different genera, in situ-hybridization staining and imaging techniques would be adequate future steps (e.g. Himmel et al., 2019).
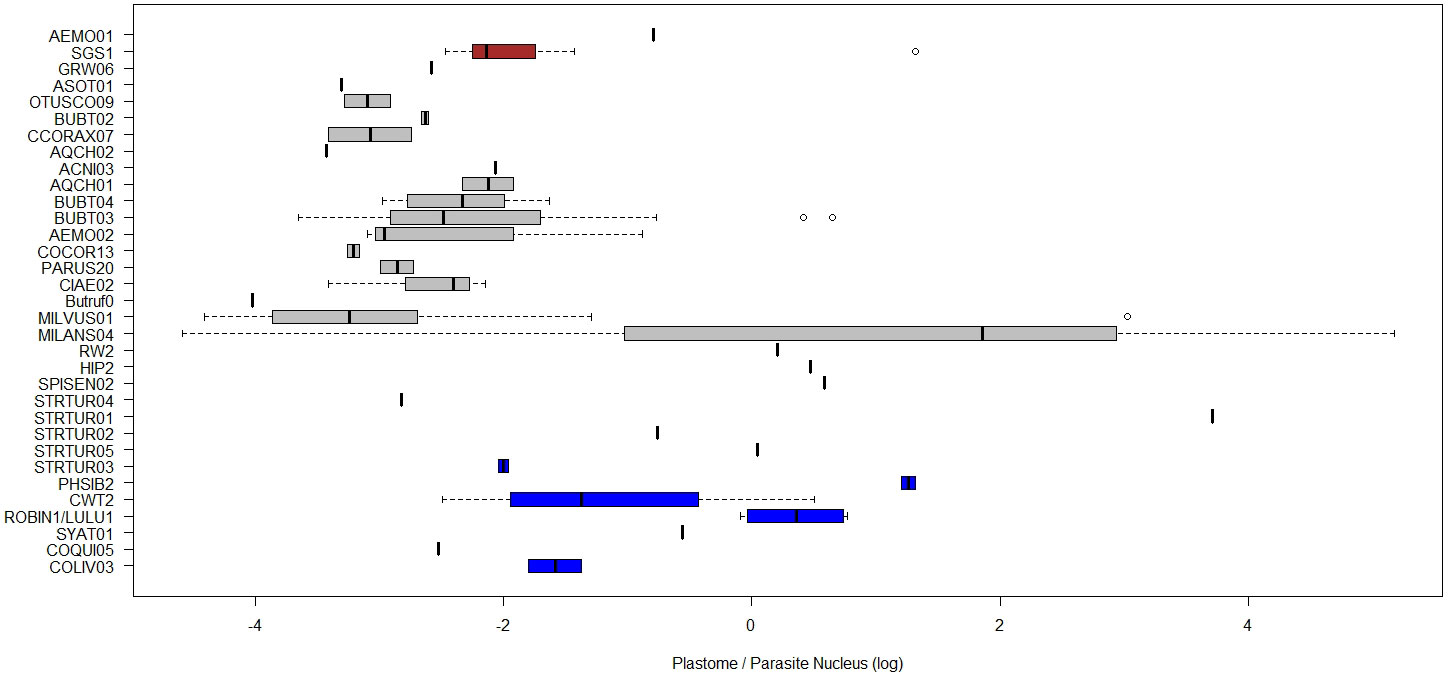
Figure 8 Boxplots of ratios of estimated plastome abundance (A/N), compared between blood parasite lineages. The natural log of the relative quantities (RQ) was used for all data. RQ is measured in relative units. Colour of boxplots represent different haemosporidian genera.
To our knowledge, this is the first study to compare amplification signals from different genomic units within haemosporidian cells and across lineages. This may be a useful avenue in the characterization of haemosporidian diversity, especially since it can be performed with typical avian blood samples collected in the field. The findings along this road can be made with commonly available qPCR methods and will become additionally testable with accumulating whole genome sequencing data of parasite-infected samples in the close future. Despite many possible pitfalls, we believe that considering these distinct physiological and evolutionary units simultaneously can reveal hidden biological patterns as well as unsuspected potential for methodological improvements in an already prolific research field.
Data availability statement
The original contributions presented in the study are included in the article/Supplementary Material, further inquiries can be directed to the corresponding author.
Ethics statement
The animal study was approved by Bielefeld University Animal Welfare Committee. The study was conducted in accordance with the local legislation and institutional requirements.
Author contributions
TB: Data curation, Formal analysis, Investigation, Visualization, Writing – original draft, Writing – review & editing. NC: Conceptualization, Investigation, Methodology, Resources, Supervision, Writing – original draft, Writing – review & editing.
Funding
The author(s) declare that financial support was received for the research, authorship, and/or publication of this article. We acknowledge the financial support of the German Research Foundation (DFG) and the Open Access Publication Fund of Bielefeld University for the article processing charge. This work was supported by the DFG, as part of the SFB TRR 212 (NC3) – Project numbers 316099922 and 396780709; DFG project number 398434413; and DFG project number 433069365. The funding body played no role in the design of the study and collection, analysis, interpretation of data, and in writing the manuscript.
Acknowledgments
We would like to thank Elke Hippauf, Ann-Christin Polikeit and Prisca Viehoever for help in the lab. We are most grateful to Peter Shurulinkov, Oliver Krüger, Guillermo Blanco and many other collaborators who have contributed to the sample collections partly used in this study. We are grateful to three reviewers for helpful comments on the manuscript of this paper.
Conflict of interest
The authors declare that the research was conducted in the absence of any commercial or financial relationships that could be construed as a potential conflict of interest.
Publisher’s note
All claims expressed in this article are solely those of the authors and do not necessarily represent those of their affiliated organizations, or those of the publisher, the editors and the reviewers. Any product that may be evaluated in this article, or claim that may be made by its manufacturer, is not guaranteed or endorsed by the publisher.
Supplementary material
The Supplementary Material for this article can be found online at: https://www.frontiersin.org/articles/10.3389/fevo.2024.1305418/full#supplementary-material
References
Aird D., Ross M. G., Chen W.-S., Danielsson M., Fennell T., Russ C., et al. (2011). Analyzing and minimizing PCR amplification bias in Illumina sequencing libraries. Genome Biol. 12, 1–14. doi: 10.1186/gb-2011-12-2-r18
Asghar M., Hasselquist D., Bensch S. (2011). Are chronic avian haemosporidian infections costly in wild birds? J. Avian Biol. 42, 530–537. doi: 10.1111/j.1600-048X.2011.05281.x
Barrow L. N., Allen J. M., Huang X., Bensch S., Witt C. C. (2019). Genomic sequence capture of haemosporidian parasites: methods and prospects for enhanced study of host–parasite evolution. Mol. Ecol. Resour. 19, 400–410. doi: 10.1111/1755-0998.12977
Bell J. A., Weckstein J. D., Fecchio A., Tkach V. V. (2015). A new real-time PCR protocol for detection of avian haemosporidians. Parasites Vectors 8, 383. doi: 10.1186/s13071-015-0993-0
Bensch S., Canbäck B., De Barry J. D., Johansson T., Hellgren O., Kissinger J. C., et al. (2016). The genome of Haemoproteus tartakovskyi and its relationship to human malaria parasites. Genome Biol. Evol. 8, 1361–1373. doi: 10.1093/gbe/evw081
Bensch S., Hellgren O., Pérez-Tris J. (2009). MalAvi: a public database of malaria parasites and related haemosporidians in avian hosts based on mitochondrial cytochrome b lineages. Mol. Ecol. Resour. 9, 1353–1358. doi: 10.1111/j.1755-0998.2009.02692.x
Berná L., Rego N., Francia M. E. (2021). The elusive mitochondrial genomes of Apicomplexa: where are we now? Front. Microbiol. 12, 751775. doi: 10.3389/fmicb.2021.751775
Bernotienė R., Palinauskas V., Iezhova T., Murauskaitė D., Valkiūnas G. (2016). Avian haemosporidian parasites (Haemosporida): a comparative analysis of different polymerase chain reaction assays in detection of mixed infections. Exp. Parasitol. 163, 31–37. doi: 10.1016/j.exppara.2016.01.009
Cepeda A. S., Pacheco M. A., Escalante A. A., Alzate J. F., Matta N. E. (2021). The apicoplast of Haemoproteus columbae: a comparative study of this organelle genome in Haemosporida. Mol. Phylogenet. Evol. 161, 107185. doi: 10.1016/j.ympev.2021.107185
Cerveny K. L., Tamura Y., Zhang Z., Jensen R. E., Sesaki H. (2007). Regulation of mitochondrial fusion and division. Trends Cell Biol. 17, 563–569. doi: 10.1016/j.tcb.2007.08.006
Chagas C. R. F., Bukauskaitė D., Ilgūnas M., Bernotienė R., Iezhova T., Valkiūnas G. (2019). Sporogony of four Haemoproteus species (Haemosporida: Haemoproteidae), with report of in vitro ookinetes of Haemoproteus hirundinis: phylogenetic inference indicates patterns of haemosporidian parasite ookinete development. Parasites Vectors 12, 1–16. doi: 10.1186/s13071-019-3679-1
Chakarov N., Kampen H., Wiegmann A., Werner D., Bensch S. (2020). Blood parasites in vectors reveal a united blackfly community in the upper canopy. Parasites Vectors 13, 309. doi: 10.1186/s13071-020-04177-0
Choubey S., Das D., Majumdar S. (2019). Cell-to-cell variability in organelle abundance reveals mechanisms of organelle biogenesis. Phys. Rev. E 100, 022405. doi: 10.1103/PhysRevE.100.022405
Ciloglu A., Ellis V. A., Bernotienė R., Valkiūnas G., Bensch S. (2019). A new one-step multiplex PCR assay for simultaneous detection and identification of avian haemosporidian parasites. Parasitol. Res. 118, 191–201. doi: 10.1007/s00436-018-6153-7
Cole L. W. (2016). The evolution of per-cell organelle number. Front. Cell Dev. Biol. 4, 85. doi: 10.3389/fcell.2016.00085
De Boeck P., Bakker M., Zwitser R., Nivard M., Hofman A., Tuerlinckx F., et al. (2011). The estimation of item response models with the lmer function from the lme4 package in R. J. Stat. Software 39, 1–28. doi: 10.18637/jss.v039.i12
Grattepanche J., Walker L. M., Ott B. M., Paim Pinto D. L., Delwiche C. F., Lane C. E., et al. (2018). Microbial diversity in the eukaryotic SAR clade: Illuminating the darkness between morphology and molecular data. BioEssays 40, 1700198. doi: 10.1002/bies.201700198
Harl J., Fauchois A., Puech M. P., Gey D., Ariey F., Izac B., et al. (2024). Novel phylogenetic clade of avian Haemoproteus parasite (Haemosporida, Haemoproteidae) from Accipitridae raptors, with description of a new Haemoproteus species. Parasite.
Havird J. C., Forsythe E. S., Williams A. M., Werren J. H., Dowling D. K., Sloan D. B. (2019). Selfish mitonuclear conflict. Curr. Biol. 29, R496–R511. doi: 10.1016/j.cub.2019.03.020
Hellgren O., Waldenström J., Bensch S. (2004). A new PCR assay for simultaneous studies of Leucocytozoon, Plasmodium, and Haemoproteus from avian blood. J. Parasitol. 90, 797–802. doi: 10.1645/GE-184R1
Himmel T., Harl J., Kübber-Heiss A., Konicek C., Fernández N., Juan-Sallés C., et al. (2019). Molecular probes for the identification of avian Haemoproteus and Leucocytozoon parasites in tissue sections by chromogenic in situ hybridization. Parasites Vectors 12, 1–10. doi: 10.1186/s13071-019-3536-2
Huang X., Ellis V. A., Jönsson J., Bensch S. (2018). Generalist haemosporidian parasites are better adapted to a subset of host species in a multiple host community. Mol. Ecol. 27, 4336–4346. doi: 10.1111/mec.14856
Huang X., Huang D., Liang Y., Zhang L., Yang G., Liu B., et al. (2020). A new protocol for absolute quantification of haemosporidian parasites in raptors and comparison with current assays. Parasites Vectors 13, 1–9. doi: 10.1186/s13071-020-04195-y
Imura T., Sato S., Sato Y., Sakamoto D., Isobe T., Murata K., et al. (2014). The apicoplast genome of Leucocytozoon caulleryi, a pathogenic apicomplexan parasite of the chicken. Parasitol. Res. 113, 823–828. doi: 10.1007/s00436-013-3712-9
Jetz W., Thomas G. H., Joy J. B., Redding D. W., Hartmann K., Mooers A. O. (2014). Global distribution and conservation of evolutionary distinctness in birds. Curr. Biol. 24, 919–930. doi: 10.1016/j.cub.2014.03.011
Johnston I. G. (2019). Tension and resolution: dynamic, evolving populations of organelle genomes within plant cells. Mol. Plant 12, 764–783. doi: 10.1016/j.molp.2018.11.002
Livak K. J., Schmittgen T. D. (2001). Analysis of relative gene expression data using real-time quantitative PCR and the 2– ΔΔCT method. methods 25, 402–408. doi: 10.1006/meth.2001.1262
Low L. M., Stanisic D. I., Good M. F. (2018). Exploiting the apicoplast: apicoplast-targeting drugs and malaria vaccine development. Microbes Infection 20, 477–483. doi: 10.1016/j.micinf.2017.12.005
Margulis L. (1970). Origin of eukaryotic cells: evidence and research implications for a theory of the origin and evolution of microbial, plant, and animal cells on the Precambrian earth.
Marshall W. F. (2007). Stability and robustness of an organelle number control system: modeling and measuring homeostatic regulation of centriole abundance. Biophys. J. 93, 1818–1833. doi: 10.1529/biophysj.107.107052
Mas A., Jamshidi S., Lagadeuc Y., Eveillard D., Vandenkoornhuyse P. (2016). Beyond the black queen hypothesis. ISME J. 10, 2085–2091. doi: 10.1038/ismej.2016.22
Matsuzaki M., Kikuchi T., Kita K., Kojima S., Kuroiwa T. (2001). Large amounts of apicoplast nucleoid DNA and its segregation in Toxoplasma gondii. Protoplasma 218, 180–191. doi: 10.1007/BF01306607
McFadden G. I., Yeh E. (2017). The apicoplast: now you see it, now you don’t. Int. J. Parasitol. 47, 137–144. doi: 10.1016/j.ijpara.2016.08.005
Morris J. J., Lenski R. E., Zinser E. R. (2012). The Black Queen Hypothesis: evolution of dependencies through adaptive gene loss. MBio 3, 10–1128. doi: 10.1128/mBio.00036-12
Okamoto N., Spurck T. P., Goodman C. D., McFadden G. I. (2009). Apicoplast and mitochondrion in gametocytogenesis of Plasmodium falciparum. Eukaryotic Cell 8, 128–132. doi: 10.1128/EC.00267-08
Omori S., Sato Y., Hirakawa S., Isobe T., Yukawa M., Murata K. (2008). Two extra chromosomal genomes of Leucocytozoon caulleryi; complete nucleotide sequences of the mitochondrial genome and existence of the apicoplast genome. Parasitol. Res. 103, 953–957. doi: 10.1007/s00436-008-1083-4
Pacheco M. A., Matta N. E., Valkiunas G., Parker P. G., Mello B., Stanley C. E. Jr., et al. (2018). Mode and rate of evolution of haemosporidian mitochondrial genomes: timing the radiation of avian parasites. Mol. Biol. Evol. 35 (2), 383–403. doi: 10.1093/molbev/msx285
Palinauskas V., Krizanauskiene A., Iezhova T. A., Bolshakov C. V., Jonsson J., Bensch S., et al. (2013). A new method for isolation of purified genomic DNA from haemosporidian parasites inhabiting nucleated red blood cells. Exp. Parasitol. 133, 275–280. doi: 10.1016/j.exppara.2012.12.003
Rattiste K., Klandorf H., Urvik J., Sepp T., Asghar M., Hasselquist D., et al. (2025). Skin pentosidine and telomere length do not covary with age in a long-lived seabird. Biogerontology 16, 435–441.
Salmón P., Dawson N. J., Millet C., Selman C., Monaghan P. (2023). Mitochondrial function declines with age within individuals but is not linked to the pattern of growth or mortality risk in zebra finch. Aging Cell 22, e13822. doi: 10.1111/acel.13822
Santiago-Alarcon D., Palinauskas V., Schaefer H. M. (2012). Diptera vectors of avian Haemosporidian parasites: untangling parasite life cycles and their taxonomy. Biol. Rev. 87, 928–964. doi: 10.1111/j.1469-185X.2012.00234.x
Seeber F., Feagin J. E., Parsons M., van Dooren G. G. (2020). “Chapter 11 - The apicoplast and mitochondrion of Toxoplasma gondii,” in Toxoplasma gondii, 3rd ed. Eds. Weiss L. M., Kim K. (Academic Press), 499–545. doi: 10.1016/B978-0-12-815041-2.00011-6
Sheiner L., Vaidya A. B., McFadden G. I. (2013). The metabolic roles of the endosymbiotic organelles of Toxoplasma and Plasmodium spp. Curr. Opin. Microbiol. 16, 452–458. doi: 10.1016/j.mib.2013.07.003
Valkiūnas G. (2005). Avian malarial parasites and other Haemosporidia (Boca Raton, Florida, USA: CRC Press).
Videvall E. (2018). Plasmodium parasites of birds have the most AT-rich genes of eukaryotes. Microbial Genomics 4. doi: 10.1099/mgen.0.000150
Keywords: genome copy abundance, chloroplasts, mitochondria, gametocyte sex ratio, avian malaria, endosymbiosis, black queen, apicomplexa
Citation: Brandler T and Chakarov N (2024) Mitochondrial and apicoplast genome copy abundances of haemosporidian parasites are explained by host species and parasitic lineage. Front. Ecol. Evol. 12:1305418. doi: 10.3389/fevo.2024.1305418
Received: 01 October 2023; Accepted: 24 January 2024;
Published: 07 February 2024.
Edited by:
Gregor Christa, University of Wuppertal, GermanyReviewed by:
Yukita Sato, Iwate University, JapanIngrid Lotta, National University of Colombia, Colombia
Mariana Fonseca Rossi, Juiz de Fora Federal University, Brazil
Copyright © 2024 Brandler and Chakarov. This is an open-access article distributed under the terms of the Creative Commons Attribution License (CC BY). The use, distribution or reproduction in other forums is permitted, provided the original author(s) and the copyright owner(s) are credited and that the original publication in this journal is cited, in accordance with accepted academic practice. No use, distribution or reproduction is permitted which does not comply with these terms.
*Correspondence: Nayden Chakarov, nayden.chakarov@uni-bielefeld.de