 Kevin W. Barnes
 Luke B. Toso2
 Neal D. Niemuth
- 1United States Fish and Wildlife Service, Habitat and Population Evaluation Team, Hadley, MA, United States
- 2United States Fish and Wildlife Service, Ecological Services, Bismarck, ND, United States
- 3United States Fish and Wildlife Service, Habitat and Population Evaluation Team, Bismarck, ND, United States
Species distribution models are useful conservation planning tools for at-risk species, especially if they are linked to planning efforts, conservation delivery, and a changing environment. The Dakota skipper (Hesperia dacotae) is an endemic butterfly of mixed and tallgrass prairie of the northern Great Plains that is listed as federally threatened in the United States and Canada. We modeled broad-scale habitat suitability for the Dakota skipper by relating occurrence observations collected via non-probabilistic population surveys and a stratified sample of pseudo-absences to environmental predictors using a machine learning approach (i.e. Random Forest classification model). Predictors were summarized at two local scales and one landscape scale to reflect a potential spatial hierarchy of settlement responses. We used recursive feature elimination to select the top 25 covariates from a suite of predictor variables related to climate, topography, vegetation cover, biomass, surface reflectance, disturbance history, and soil characteristics. The top model included six bioclimatic, one soil, and 18 local- and landscape-scale vegetation variables and indicated an association with undisturbed grasslands with higher perennial grass and forb cover and biomass. The model performed well, with kappa and AUC estimates of 0.92 and 0.99, respectively, for 20% of data withheld for validation. To understand how climate change might affect Dakota skipper distribution, we applied the model using future 30-year bioclimatic predictions. Predicted suitable habitat declined and the climate envelope associated with Dakota skipper occurrence shifted north into Canada. While it is unknown to what degree the bioclimatic relationships in the model are biologically meaningful or are simply correlative with our non-probabilistic sample of occurrences, our results present an urgency to improve data collection for Dakota skipper populations and better understand climatic relationships, as climate change could have profound effects on populations and conservation planning. Regardless of climate or model uncertainty, our results demonstrate the importance of maintaining sufficient quantities and quality of grass on the landscape to support populations of Dakota skipper.
Introduction
The Dakota skipper (Hesperia dacotae) butterfly is endemic to mixed- and tallgrass prairies of central North America and has experienced severe and continued population declines throughout portions of its historic range. Population declines may have been the result of a suite of factors but are primarily attributed to the degradation and loss of native grassland habitat to row crop agriculture. Subsequently, it has been listed as threatened under the Species at Risk Act in Canada and the Endangered Species Act in the United States. Estimated grassland loss from historic levels varies with grassland type and location but ranges from 70% to 99% in mixed- and tallgrass prairie ecosystems (Samson and Knopf, 1994; Lark et al., 2015; Niemuth et al., 2022). Grassland conversion is expected to continue as technology, agricultural subsidies, new crop varieties, and altered climate enable conversion of additional previously uncultivated lands (GAO (Government Accountability Office), 2007; Stephens et al., 2008; Rashford et al., 2011; Lark et al., 2015; Otto et al., 2018). Habitat is also being lost and fragmented by energy development, expansion of human infrastructure, and altered disturbance regimes and ecosystem processes (Augustine et al., 2021; Post van der Burg et al., 2022). Agricultural intensification, especially widespread use of pesticides such as neonicotinoid insecticides, also contributes to habitat degradation and declines in arthropod populations (Krupke et al., 2017; Stanton et al., 2018; Longing et al., 2020; Main et al., 2020). Climate change may also be contributing to Dakota skipper population declines. Changes in temperature and precipitation are modifying the climate envelope for prairie vegetation, which is essential for Dakota skipper survival (Barnett and Facey, 2016). These changes are also altering the phenology of Dakota skipper emergence and flight period, which will affect Dakota skipper detection, distribution, and persistence (Dearborn and Westwood, 2014; Barnett and Facey, 2016; Post van der Burg et al., 2020; Vasiliev and Greenwood, 2021).
With ongoing declines of grasslands and grassland-dependent species, numerous programs have been instituted to conserve grasslands in the North American central grasslands occupied by Dakota skipper. For example, the U.S. Fish and Wildlife Service currently spends >$50 million (USD) annually on acquisition of easements in the U.S. northern Great Plains, which have perpetually protected >1.2 million ha of grasslands and small wetlands (Niemuth et al., 2014; USFWS (U.S. Fish and Wildlife Service), 2019). The primary focus of these efforts is migratory bird conservation and a variety of spatial models and decision-support tools related to migratory birds are used to assess and prioritize parcels for acquisition (Reynolds et al., 2006; Niemuth et al., 2017). The process used to prioritize parcels for acquisition also considers species other than migratory birds, particularly those listed under the Endangered Species Act (USFWS (U.S. Fish and Wildlife Service), 2016). Combined with other conservation efforts, these programs could provide significant benefits to Dakota skipper populations if these efforts are targeted precisely. However, our lack of comprehensive understanding on past and present patterns of Dakota skipper occupancy makes it difficult to focus conservation efforts to best benefit this species.
The historic and current distribution of the Dakota skipper has been challenging to define because this butterfly is small (wingspan 2.4-3.2 cm; Royer and Marrone, 1992), difficult to distinguish from other similarly small skippers, appears to have limited dispersal capabilities, and is only identifiable as an adult during a single short flight period lasting two to four weeks from mid-June through early July (Dana, 1983; USFWS (U.S. Fish and Wildlife Service), 2014; USFWS (U.S. Fish and Wildlife Service), 2018a). Historically, the Dakota Skipper is known to have occurred in the states of Illinois, Iowa, Minnesota, South Dakota, and North Dakota in the United States and the provinces of Manitoba and Saskatchewan in Canada (USFWS (U.S. Fish and Wildlife Service), 2018a). The Dakota skipper is believed to be extirpated from Illinois and Iowa and occupied habitat within the remainder of its range is greatly reduced, with some estimates suggesting only 2% of the original Dakota skipper habitat remains (Dana, 1991). With reductions in range, population size, and genetic diversity, many populations have high likelihood of extirpation (USFWS (U.S. Fish and Wildlife Service), 2018a). These factors are exacerbated by apparent limited dispersal capabilities; consequently, this species has a small effective population size and substantial genetic structuring because of isolation and low effective immigration rates (Britten and Glasford, 2002; USFWS (U.S. Fish and Wildlife Service), 2018a). Limited dispersal and small effective population size amplify the effects of habitat loss and fragmentation on Dakota skipper populations and highlight the need for comprehensive conservation strategies that consider the spatial context of Dakota skipper habitat and populations. Spatial structuring of populations is especially important considering climate change, which is projected to alter land use (Niemuth et al., 2014), vegetation species composition and structure (Klemm et al., 2020), timing and volume of precipitation (Dore, 2005), and biological life functions such as the timing of emergence (Dearborn and Westwood, 2014). All these factors will likely influence the size, persistence, and conservation of Dakota skipper populations (Cochrane and Delphy, 2002; Vasiliev and Greenwood, 2021).
Past conservation efforts for Dakota skipper were constrained by a limited understanding of Dakota skipper population distribution. Prior to 2014, the range of the Dakota skipper was assumed to be well defined but shrinking (Royer et al., 2008; USFWS (U.S. Fish and Wildlife Service), 2014). However, surveys conducted from 2014-2022 revealed numerous new populations in what was believed to be suitable habitat that was not previously surveyed and in marginal habitat at the limits of the species known range; these discoveries expanded the range of this species beyond what was previously understood (USFWS (U.S. Fish and Wildlife Service), 2018a; North Dakota Natural Resources Trust, 2022). Understanding the spatial distribution of habitat and subpopulations is critical to Dakota skipper management as the species is a resident with limited dispersal ability. To address the uncertainty with the distribution of the Dakota skipper, and subsequently target conservation for this species, several efforts have been conducted to model potential Dakota skipper habitat in the United States and Canada. These modeling efforts largely focused on soil types and have been constrained by factors such as small sample sizes, limited types of environmental predictor variables, or small geographic modeling extents (Post van der Burg et al., 2020; Seidle et al., 2020; Dearborn et al., 2022).
To build on previous modeling efforts and better inform Dakota skipper conservation in the US portion of Dakota skipper range, we developed a species distribution model by relating a suite of environmental predictor variables to Dakota skipper observations in Minnesota, North Dakota, and South Dakota. The goal of this effort was to develop a high-resolution species distribution model that could be used for targeted conservation planning and delivery. Applications of this model include prioritizing areas for protection, restoration or enhancement; avoidance and mitigation planning for energy development; informing recovery planning (i.e. future surveys, population monitoring, and species reintroductions); or attracting partners and funding. Finally, this model would allow future analyses that could help optimize specific conservation goals, such as increasing connectivity, or better understanding the effects climate change or land cover changes within or near suitable habitats.
Methods
Study area
We based the study area on four adaptive capacity units established in the Dakota Skipper Species Status Assessment and Recovery Plan (USFWS (U.S. Fish and Wildlife Service), 2018a; USFWS (U.S. Fish and Wildlife Service), 2021; Figure 1). Adaptive capacity units are planning unit boundaries that represent various environmental conditions and a species’ ability to adapt to changes within these systems given their distribution, genetic diversity, and other population characteristics (USFWS (U.S. Fish and Wildlife Service), 2018a). We restricted our analysis to the US portion of these units north of 43° 30' N latitude. The study area includes portions of North Dakota, South Dakota, and Minnesota. We did not include southern portions of the adaptive capacity units in Iowa, southeastern South Dakota, and Illinois due to a lack of recent observations or designated critical habitat, and to avoid model extrapolation. We did not include the Canada portion of the adaptive capacity units because an environmental predictor dataset used in the analysis (i.e., Rangeland Analysis Platform layers) has not been made publicly available there.
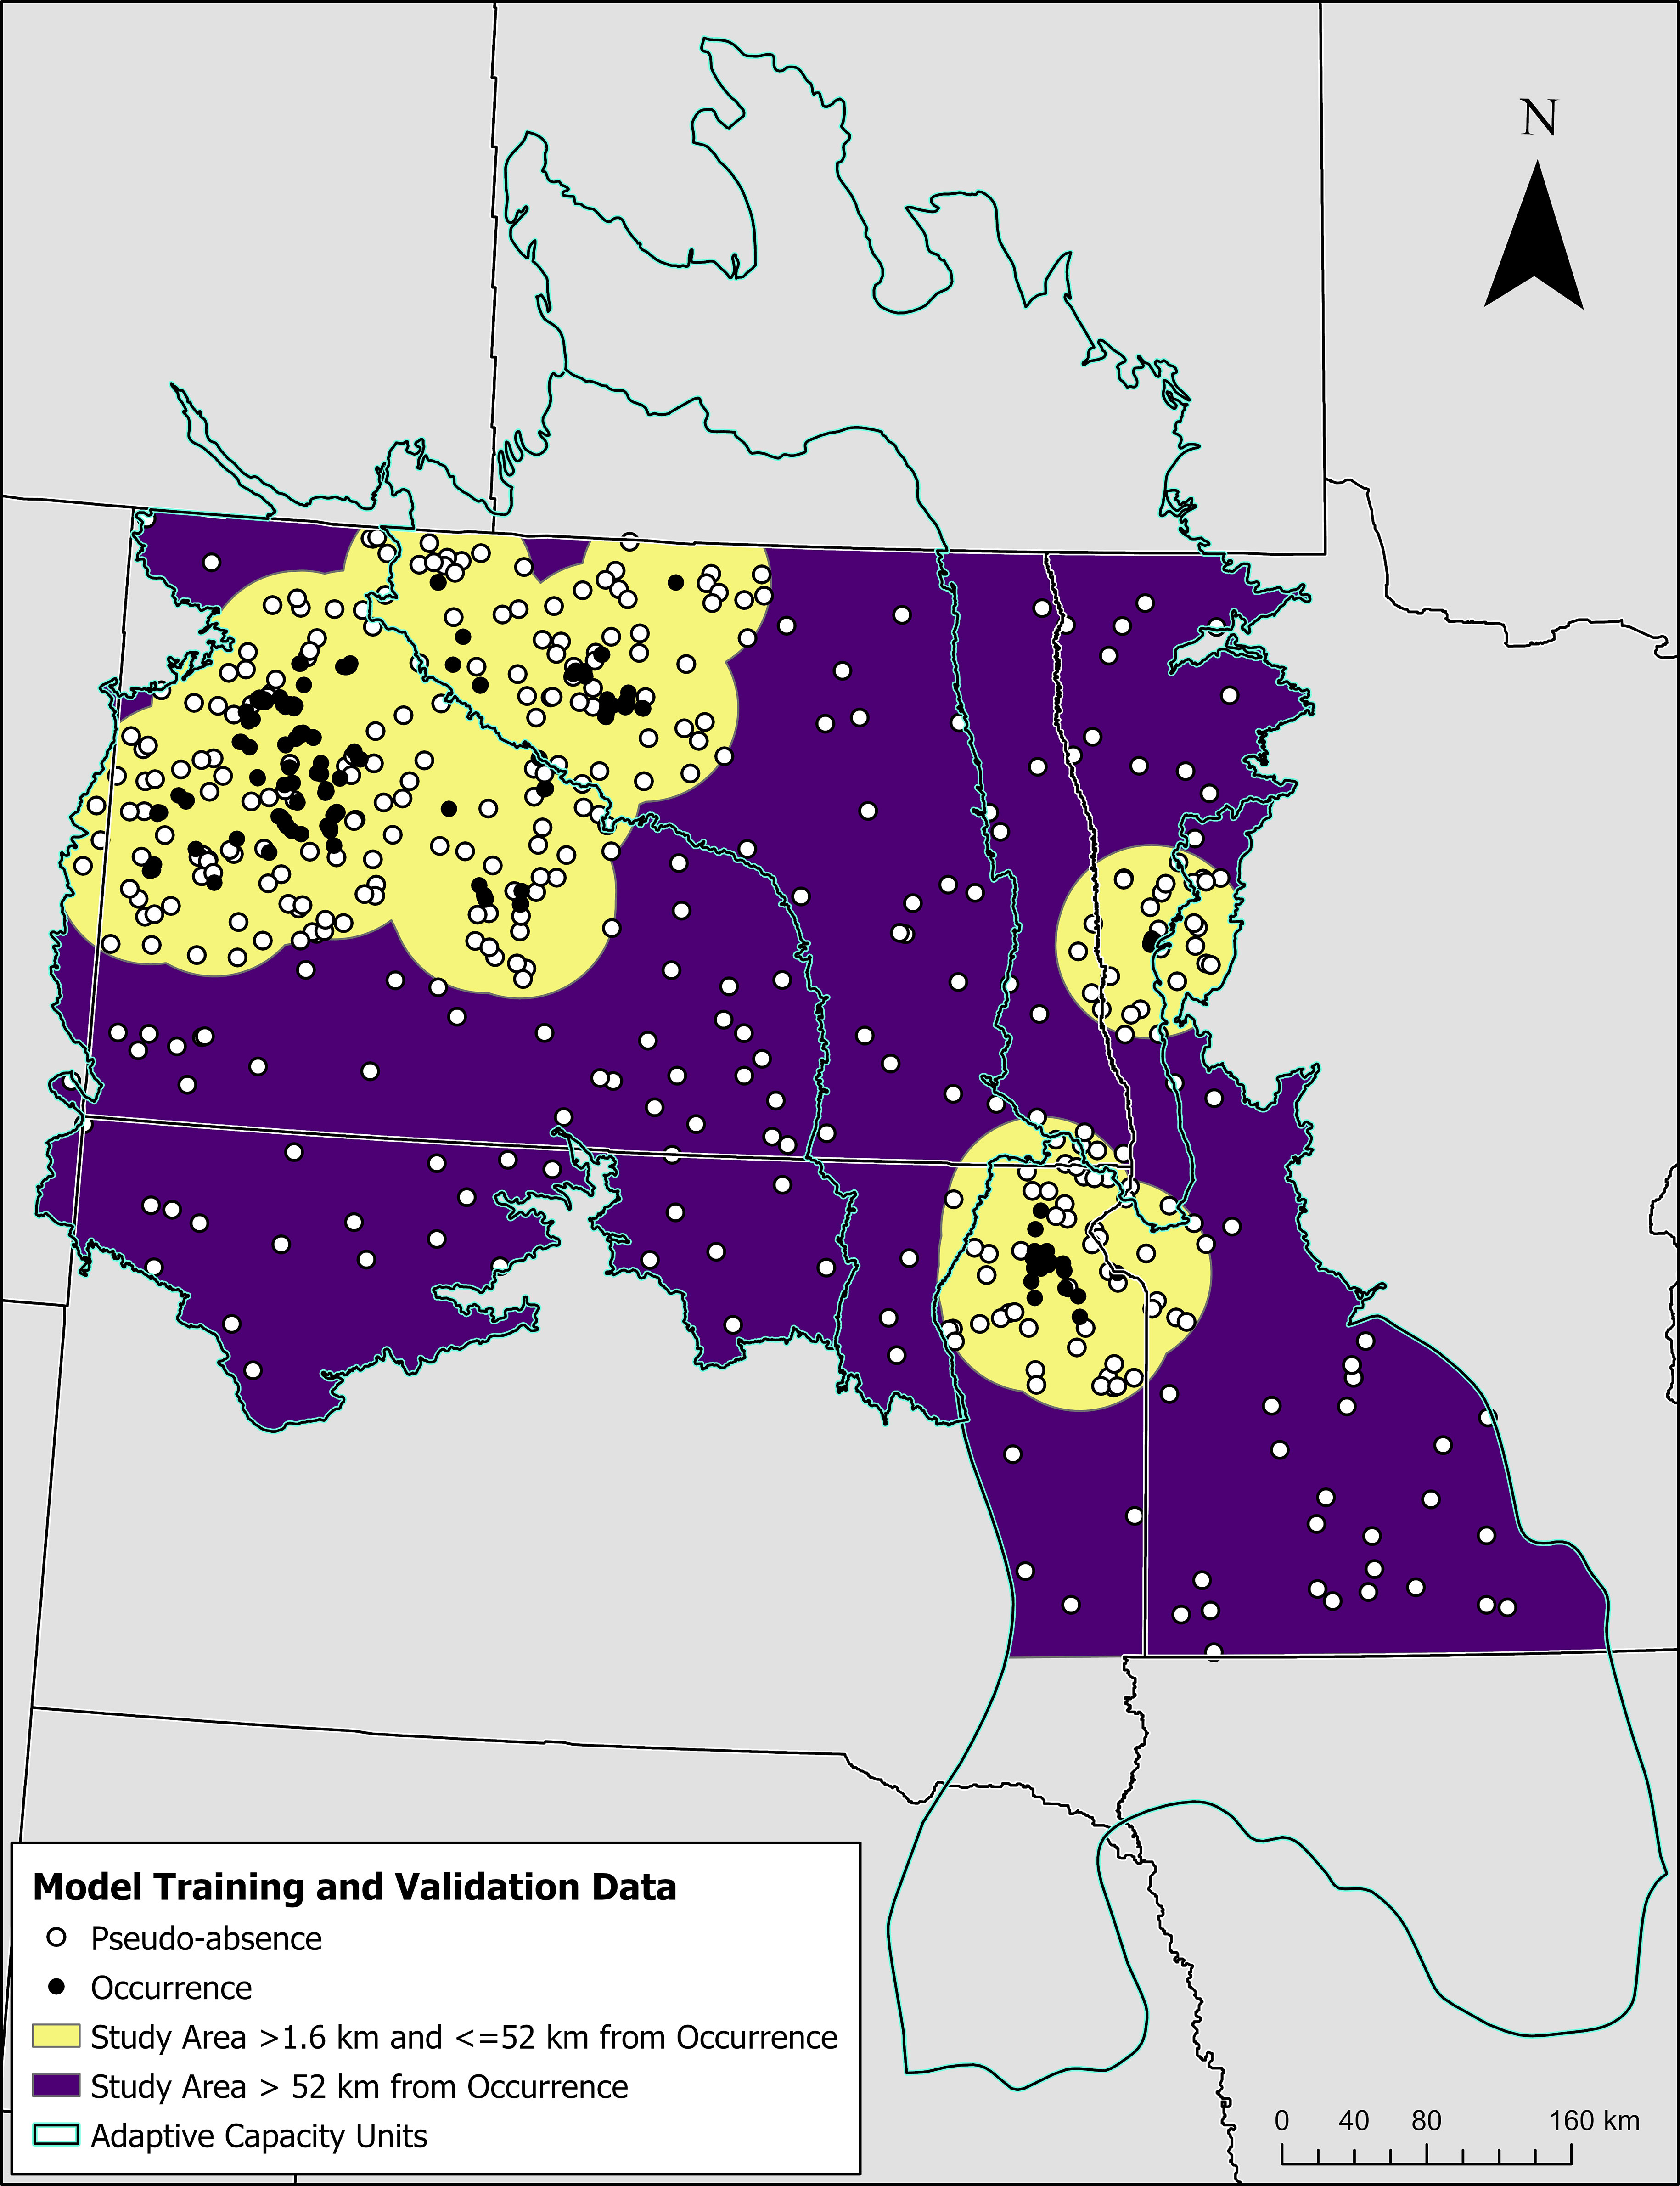
Figure 1 Map showing the locations of training and validation data (i.e., occurrence and pseudo-absences) used to generate a distribution model that predicts suitable habitat for the Dakota skipper across the study area. The study area is symbolized according to distance-based sampling strata for pseudo-absences (i.e., yellow and purple regions) and shown in relation to adaptive capacity units (i.e., cyan polyline) used in recovery planning.
The study area is composed primarily of cropland, with moderate amounts of managed pasture and hay, and remnant native prairie (USDA-NRCS (United States Department of Agriculture, Natural Resources Conservation Service), 2022). The area includes numerous pothole wetlands (USDA-NRCS (United States Department of Agriculture, Natural Resources Conservation Service), 2022). It has flat topography however there are some areas with greater topographic relief in the western portion (e.g., badlands; Bluemle, 1991). Climate trends predominantly vary east to west, with drier conditions in the west and wetter conditions in the east (Bluemle, 1991). Cropland is less dominant in the west, especially where topographic relief is restrictive, and here is where the most remnant native mixed grass prairie remains (USDA-NRCS (United States Department of Agriculture, Natural Resources Conservation Service), 2022). Cropland and tree cover are more dominant in the eastern portion of the study area and little native tall grass prairie remains (USDA-NRCS (United States Department of Agriculture, Natural Resources Conservation Service), 2022).
Response variables
We used Dakota skipper occurrence data to develop spatial models identifying potentially suitable habitat (Figure 1). We obtained occurrence data from 2010-2022 Dakota skipper survey observations conducted by trained biologists using standardized protocols consisting of a modified Pollard walk through grassland habitat believed to support the Dakota skipper (USFWS (U.S. Fish and Wildlife Service), 2018b). These data are a more geographically precise subset of the United States Fish and Wildlife Service’s Dakota skipper occurrence dataset used in the Species Status Assessment and Recovery Plan (USFWS (U.S. Fish and Wildlife Service), 2018a; USFWS (U.S. Fish and Wildlife Service), 2021). Surveys were conducted by meandering within parcels and recording occurrence locations for every Dakota skipper observation. Absence data were not recorded along the surveyor’s course of travel; however, parcels that were surveyed and lacked a single detection were recorded as absent. Occurrence point locations had an accuracy of <1 m – 30 m, depending on the GPS device used. There was a total of 1,272 occurrence observations spread throughout the study extent, with the majority of observations being disjunct clusters of observations (Figure 1). These were predominantly in northwest North Dakota, with additional clusters in South Dakota on the Prairie Coteau, and in Minnesota just northeast of Fargo, North Dakota. To reduce spatial autocorrelation and pseudo-replication, we spatially thinned these data using an algorithm from the R package BiodiversityR (Kindt and Coe, 2005). The algorithm determined distances between occurrence locations less than 100 m and randomly removed occurrences from the dataset until all occurrences were greater than 100 m apart. Spatial thinning resulted in 408 occurrence locations.
We ran a separate algorithm to establish pseudo-absences, or locations that were available to Dakota skippers but occurrence is unknown. Pseudo-absence data are important for defining the environmental conditions that are available to the species for comparison to where they were observed and are often used to create species distribution models under a use-available framework (Manly et al., 2007; Barbet-Massin et al., 2012). While we could have used absence data from parcels that were surveyed where the species was not found, we did not include these data because the survey methods were not conducive for spatial modeling; surveys were not randomly stratified across ecological settings or environmental conditions, nor were they conducted in a fashion that would allow for the estimation of detection probability for this cryptic species. We obtained 408 pseudo-absences using a random selection of points that were geographically and environmentally stratified (Barbet-Massin et al., 2012). We generated 20,000 random pseudo-absences with a minimum distance of 100 m between points across the study area. Within two strata, we randomly selected pseudo-absences where 66% were located >1.6 km and <52 km from any occurrence, and 33% were located ≥ 52 km from an occurrence (Figure 1). This was done to increase the sensitivity of model predictions by including more pseudo-absence data in regions near occurrences where conditions should be more similar, while providing a subset of points that can account for more coarse scale associations across the region where conditions should be less similar. For both strata, points were randomly selected proportional to estimated landcover within the strata to ensure we were accounting for the various environmental conditions that were present. For example, if half the strata were composed of cropland, half the pseudo-absences were randomly selected in cropland regions. To determine environmental strata, we used land cover classes from 2019 National Land Cover Database (Dewitz and U.S. Geological Survey (USGS), 2021) where some classes were aggregated; cover classes included open water (class 11), development (classes 21-24), bare ground (class 31), forest (classes 41-44, and 95), shrub (class 52), grass (classes 71, 81, and 90), and crop (class 82).
Predictor variables
With occurrence and pseudo-absence data defined, we explored a variety of covariates to identify relationships with Dakota Skipper occurrence. We developed 207 predictor variables for model selection that were derived from six raster datasets in Google Earth Engine (Gorelick et al., 2017; Table 1; Supplementary Table 1). These were selected based on several known associations. For example, the Dakota skipper is often found in native undisturbed grasslands with perennial forbs and grasses (McCabe, 1981; Royer et al., 2008). We included a dataset that classified disturbed and potentially undisturbed landcover (PUDL; Fields and Barnes, 2019), and another that estimated percent cover and net primary productivity (NPP) for several vegetation functional groups, such as perennial grasses and forbs (i.e., Rangeland Analysis Program layers; Jones et al., 2021). We included several topographic and edaphic variables given their importance in other predictive models (Dearborn et al., 2022; Post van der Burg et al., 2020; Seidle et al., 2020); these included topographic indices from Geomorpho90 (Amatulli et al., 2020) and soil properties from Soils Grids 2.0 (Poggio et al., 2021). We included other exploratory variables that were intended to help define the species’ climate envelope and any unique spectral characteristics related to vegetation cover where they were observed; these included several bioclimatic indices from AdaptWest Project downscaled PRISM and CMIP6 climate models (Wang et al., 2016; AdaptWest Project, 2022; Mahony et al., 2022), and a suite of Sentinel-2 remote sensing indices, respectively. Bioclimatic indices were also available as future 30-year predictions under different climate scenarios, which makes their inclusion appealing for better understanding current associations and predictions, and how those predictions might change in the future under different climate scenarios. There has been little investigation of landscape-scale associations for the Dakota Skipper; therefore, we used a multi-scale approach where we included predictor variables at their native scale or summarized their values using moving window analysis within two smaller local areas of potential use (e.g., 15 m or 90 m radius circles) and at one larger landscape-scale (e.g., 810 m radius circle). We extracted predictor values at response variable point locations and split the dataset by strata using 80% to train the model and 20% to validate model performance. We resampled all predictor variable rasters to a final resolution of 30 m for model application.
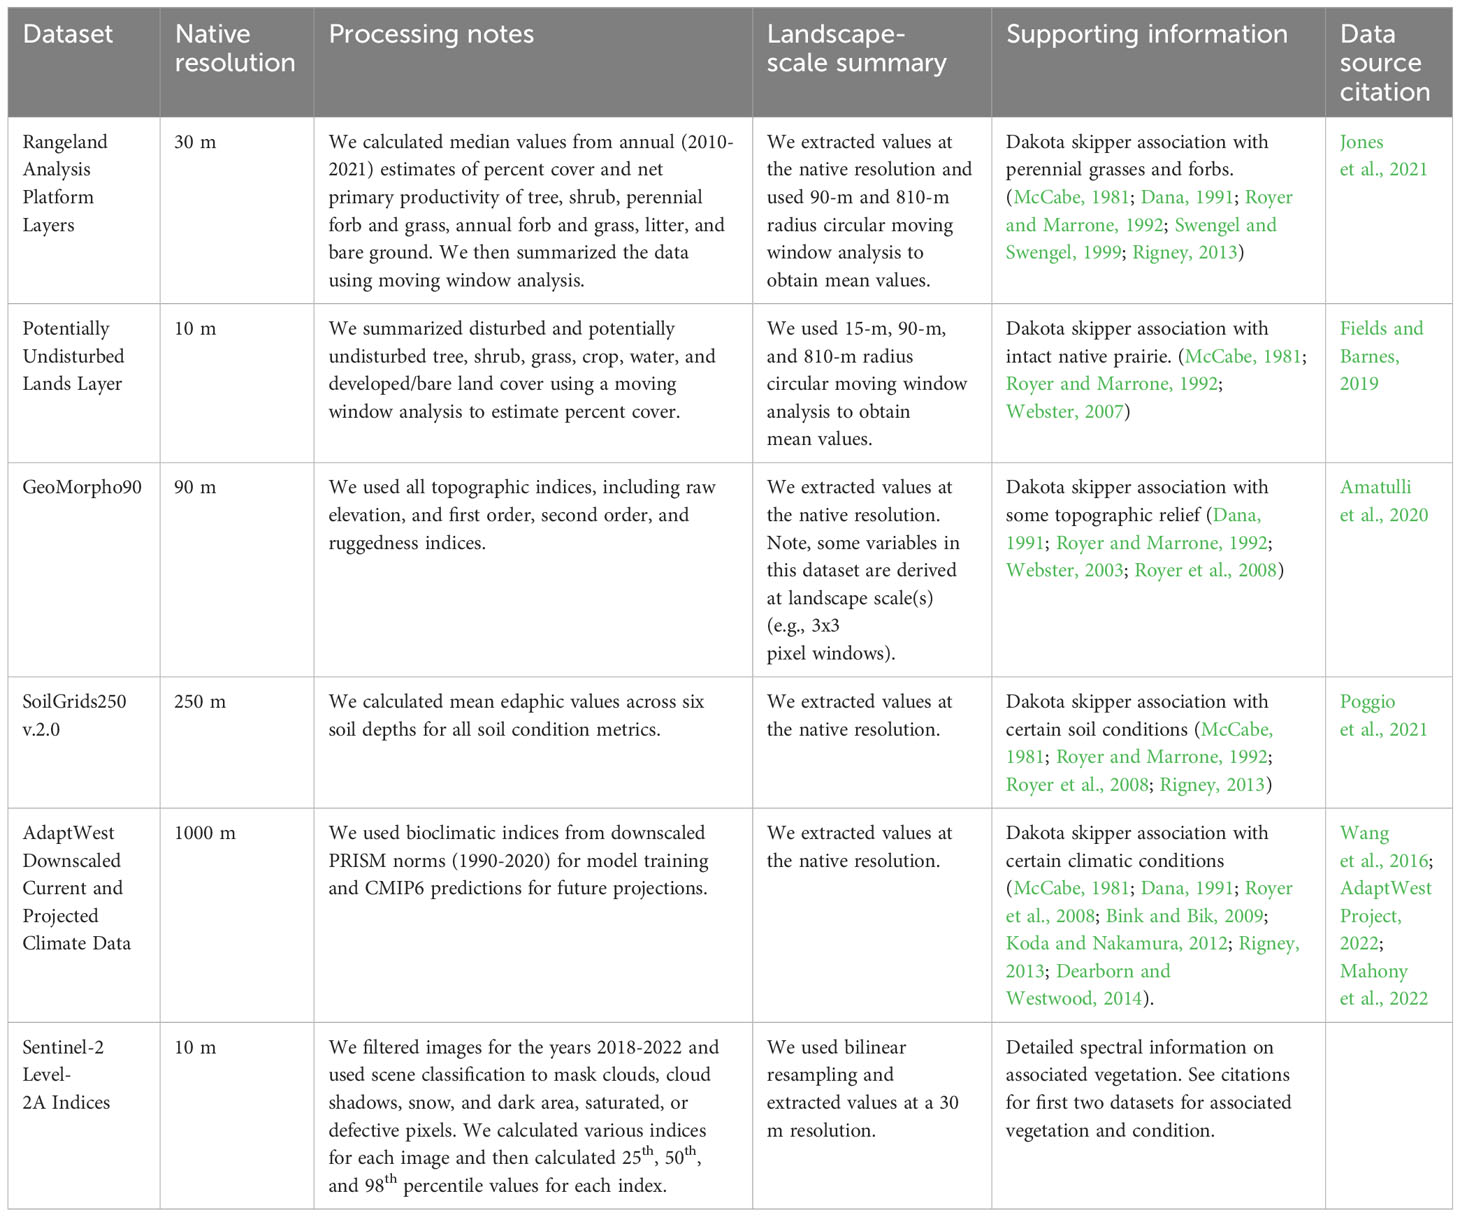
Table 1 Datasets used to derive predictor variables for a distribution model that predicts suitable habitat for the Dakota skipper.
While predictor variables are representative of the period Dakota skipper data were obtained (i.e., 2010-2022) we did not temporally match observations and predictor variables. This is important to note because cropland expansion was high during this period (Fields and Barnes, 2019). However, all occurrences in our training and validation datasets were within grasslands, as represented by the land cover data we used (Fields and Barnes, 2019). These land cover predictions were based on 2016-2018 Sentinel-2 imagery (Fields and Barnes, 2019), and the Rangeland Analyses Program data were summarized using median annual estimates over 2010-2021. This could mean that model predictions are not representative of current land cover or vegetation conditions.
Model development and validation
We developed a distribution model that predicts suitable habitat for the for the Dakota skipper using a Random Forest classification model (Breiman, 2001). The model was trained by relating occurrences and pseudo-absences to a suite of predictor variables. We then applied the model spatially to obtain habitat suitability predictions across the study area. The classification model generated two types of predictions: 1) a habitat suitability index prediction based on the percentage of suitable habitat classification votes across the ensemble of decisions trees; and 2) a binary classifier of suitable and unsuitable habitat determined by the majority vote across the ensemble of decision trees. To train a parsimonious model, we used a recursive feature elimination (“rfe”) algorithm from the R package caret to identify a subset of predictor variables (Kuhn, 2022; R Core Team, 2022). This algorithm fits a model with all predictor variables and the variables are ranked by importance and model performance is assessed using area under the receiver operating characteristics curve (AUC); another model is then fit with a subset of the top-ranking variables, and again model performance is assessed and variables are ranked by importance. We tested 25-, 15-, 10-, and 5-variable model subsets. We ran this algorithm using 10-fold cross validation with 10 repeats to incorporate variation due to feature selection and reduce selection bias (Ambroise and McLachlan, 2002), and retained variables from the subset with the highest out-of-bag AUC (i.e. 25 variable subset). We then used the caret package to determine the optimal number of variables per split. Again, we used 10-fold cross validation with 10 repeats and performance assessed using AUC. We tested 10 different variables per split by denoting a ‘tunelength’ of 10 (i.e., 2,4, 7, 9, 12, 14, 17, 19, 22, and 25), and determined the number of variables per split that had the highest AUC. We then used the randomForest package to train a model with the retained subset of variables, 1,000 trees, and the optimal number of variables per split (i.e., four), and then assessed model performance, variable associations, and variable importance (Liaw and Wiener, 2002). We retrained the model with randomForest instead of using the trained model from caret because we ultimately used Google Earth Engine to train and spatially apply the model; the randomForest algorithm is more like the algorithm used in Google Earth Engine than the repeated 10-fold cross validation methods used with caret for variable selection and tunning. We used R instead of Google Earth Engine for model validation given the greater flexibility and availability of functions for validation analysis. We report validation metrics including accuracy, AUC, kappa, and F1 scores, from 20% validation data that were held out. We visually inspected plots of model residuals for spatial autocorrelation using a spline correlogram function from the ncf package (Bjornstad, 2022) to calculate spatial dependence (i.e., covariance) as a continuous function of distance up to 200 km. We visually inspected plots of residuals to assess if they were randomly distributed around zero by plotting absolute residuals versus fitted values, residuals versus row id, and a histogram of residuals. To better understand associations between occurrence and predictor variables, we calculated accumulated local effects of occurrence (Apley and Zhu, 2020) for each variable using the DALEX package in R and plotted the response (Biecek, 2018; Biecek and Burzykowski, 2021; Biecek and Baniecki, 2023). We assessed variable importance using model generated estimates of node purity (Gini index; Breiman, 2001; Liaw and Wiener, 2002), and two model-agnostic metrics of variable importance including the standard deviation of accumulated local effects of occurrence and the change in overall model accuracy (AUC) when the values of a variable of interest are permuted (Biecek, 2018; Biecek and Burzykowski, 2021; Biecek and Baniecki, 2023).
Climate analysis
We evaluated the impact of climate variables and climate change on predicted habitat suitability for the Dakota skipper from the geography we sampled by spatially applying the model to future predictions of bioclimatic variables. We spatially applied the model using current non-climatic related covariate rasters and future bioclimatic covariate raster predictions. We used mean bioclimatic predictions from an ensemble of eight global climate models for the shared socioeconomic pathway SSP2-4.5 and the time periods 2011-2040 and 2041-2070. These are near-future predictions based on a middle-of-the-road pathway where emissions remain at current levels and start to fall mid-century but do not reach net zero by 2100. We evaluated changes more broadly and generally by creating spatial marginal effects of bioclimatic variables, which we will henceforth refer to as climate envelopes. The current climate envelope was generated by spatially applying the classification model to bioclimatic covariate rasters (i.e., 1991-2020 climate normals) while holding all other covariates at their median values (i.e., rasters with constant median values). We generated future climate envelopes using future bioclimatic predictions from eight individual global climate models, for the shared socioeconomic pathways SSP2-4.5 and three time periods (2011-2040, 2041-2070, and 2071-2100). We again derived these climate envelopes by applying the model to future bioclimate covariate rasters while holding all other covariates at their median values. All models were spatially applied at a coarse scale (1000 m) that matched the resolution of bioclimatic variables and were extrapolated to a bounding box extending beyond the study area. The bounding box was determined by applying the model to North America in Google Earth Engine at a coarse scale, and delineating an area that captured the shifting envelope but not extending too far north into forested regions. This bounding box was then used to constrain the output when downloading the results.
Results
The model subset that had the highest AUC had 25 predictor variables, however all model subsets were competitive (Supplementary Table 2). The model contained 18 land cover variables across multiple scales (30-m, 180-m, 1610-m window), six bioclimatic variables, and one soil variable (Table 2). An analysis of performance based on 20% validation data that were withheld from training the model indicated good overall model performance (accuracy: 0.96; AUC: 0.99; kappa: 0.92; average F1: 0.96) and class performance (class 1: precision= 0.94, recall=: 0.99, F1 = 0.96; class 0: precision= 0.99, recall= 0.94, F1 = 0.96). Model diagnostics indicated low spatial autocorrelation of residuals, low deviance from a random distribution of residuals around zero, and moderately higher residuals at predicted mid-point values (Supplementary Figure 1). Across all variable importance metrics, perennial forbs and grass (% & NPP) and crop (%) ranked high (Figure 2). Most bioclimatic variables ranked moderate to high, with degree days less than 18°C generally ranking high across all variable importance metrics (Figure 2). There was a positive association with undisturbed grass and shrub (%) and perennial forbs and grass (% & NPP) across local and large landscape scales (30-m, 180-m, 1620-m; Figure 3). There was a positive association with shrub (%) and tree cover (NPP) at a large landscape scale (1620-m), where there was a weak effect above low values (Figure 3). There was a negative association with disturbed land and cropland (%) at local to large landscape scales (180-m and 1620-m), and a negative association with previously disturbed grassland (e.g., restored grass %) and annual forbs and grass (% & NPP) at local scales (30-m and 180-m; Figure 3). There were quadratic associations with bioclimatic and soil variables where occurrence was generally highest at mid-point values (Figure 3).

Table 2 Covariates used in a distribution model that predicts suitable habitat for the Dakota Skipper.
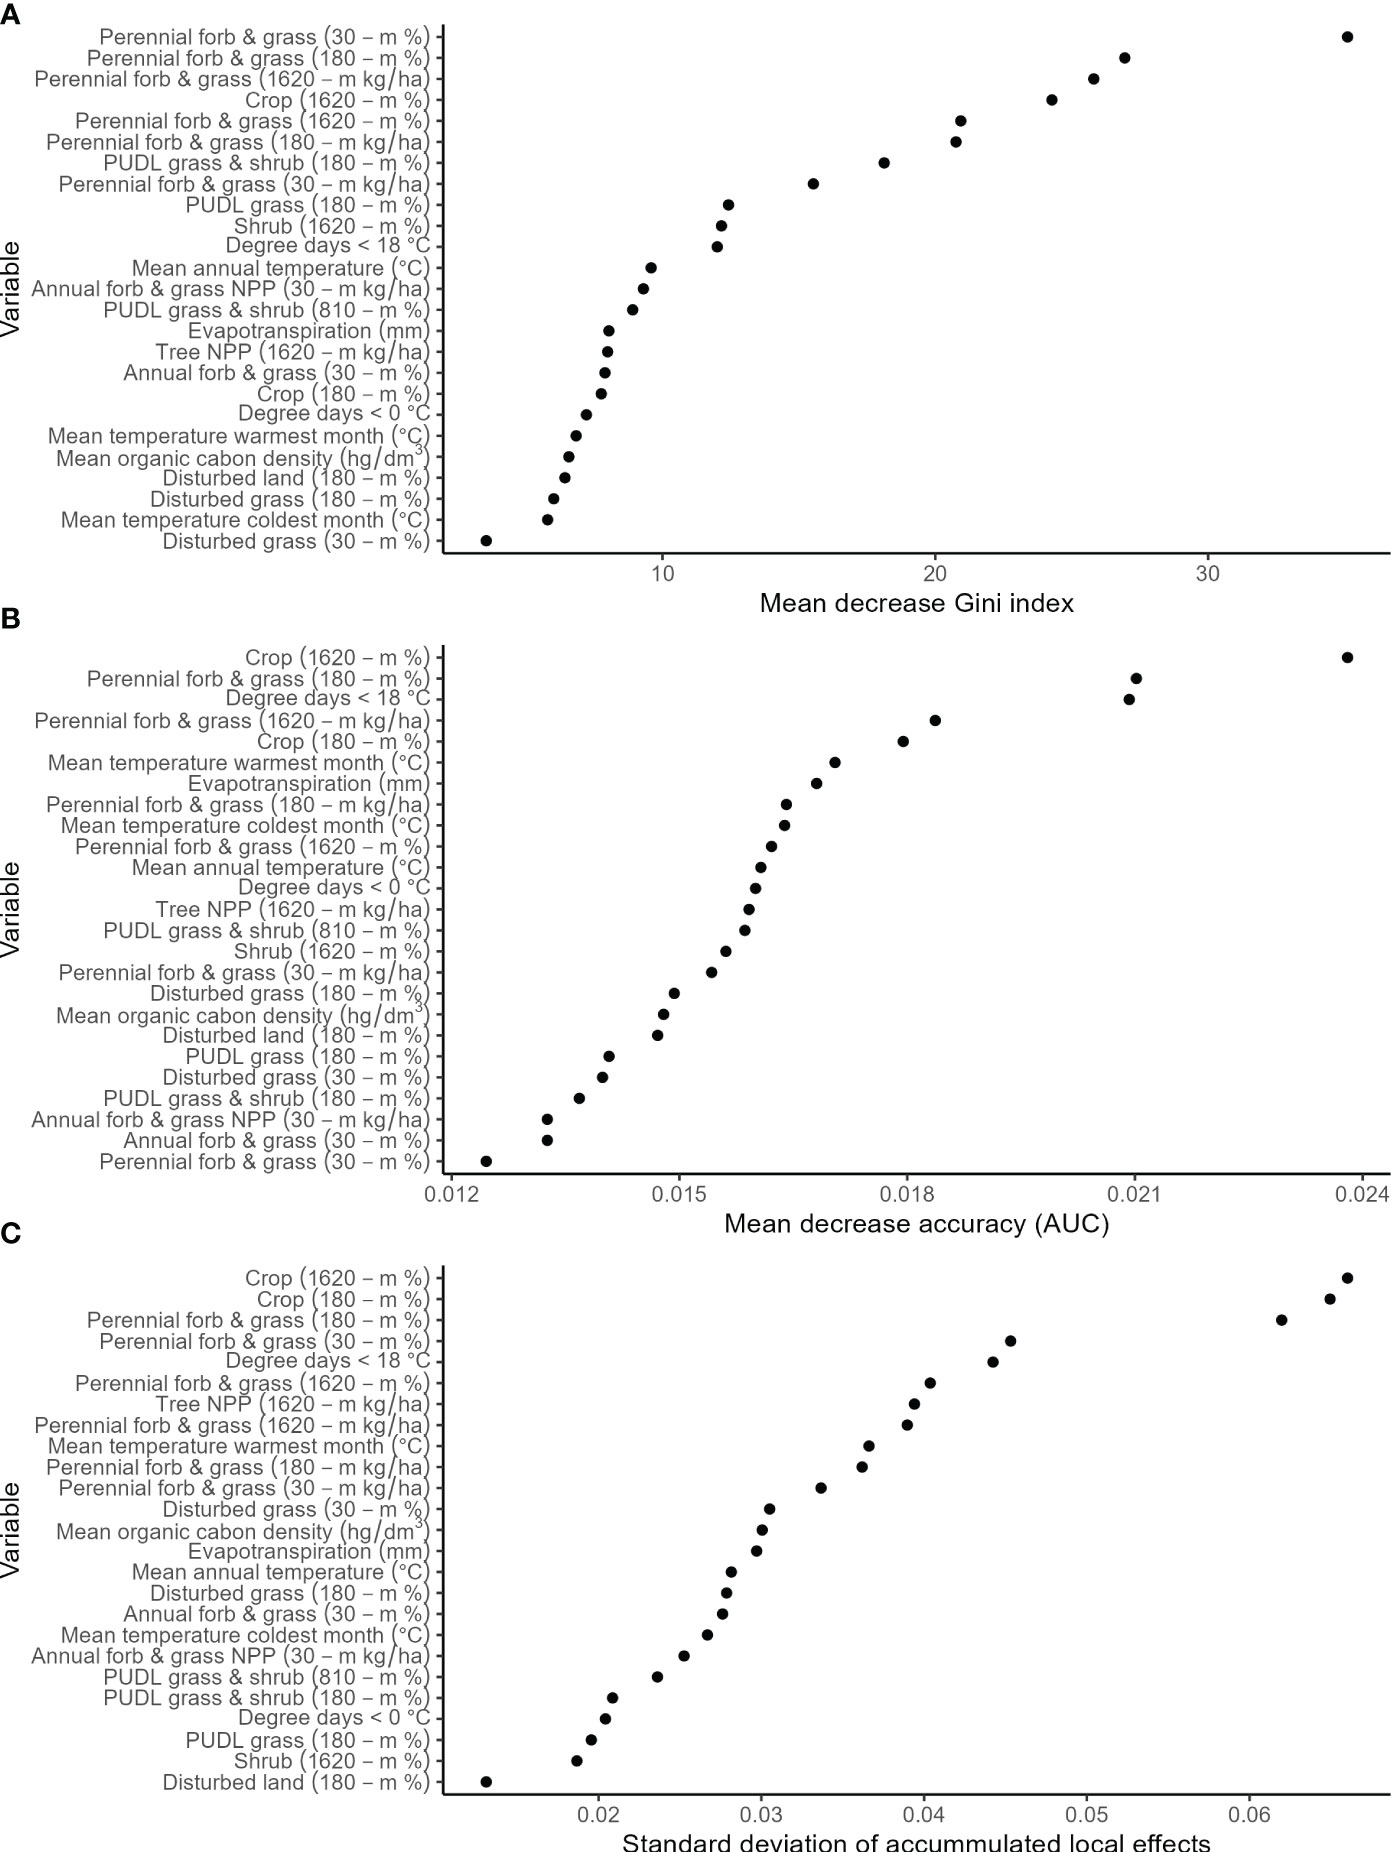
Figure 2 Variable importance plots according to three different metrics that characterize the relative contributions of predictor variables (in descending order of contribution) from a distribution model that predicts suitable habitat for the Dakota skipper. Metrics include decrease node purity (i.e., Gini index; A), decrease accuracy (i.e., area under the curve [AUC]; B), and standard deviation of accumulated local effects of occurrence (C).
Figure 3 Accumulated local effects plots, characterizing the average influence that each predictor variable has in a distribution model that predicts suitable habitat for the Dakota skipper, arranged in descending order of magnitude (i.e., standard deviation of accumulated local effects of Dakota skipper occurrence). Vertical lines within plots along the x-axes indicate data points (short lines) and deciles (long lines).
When the model was spatially applied using mean bioclimatic predictions from an ensemble of eight global climate models under the shared socioeconomic pathway SSP2-4.5 and 2011-2040 time period, habitat suitability index values decreased extensively in the south and classifications were restricted to northern North Dakota and Minnesota (Figure 4). When the model was applied under the shared socioeconomic pathway SSP2-4.5 and 2041-2070 time period, habitat suitability index values were further reduced and classifications were restricted to the foothill grasslands of the north central North Dakota and northeastern Minnesota (Figure 4).
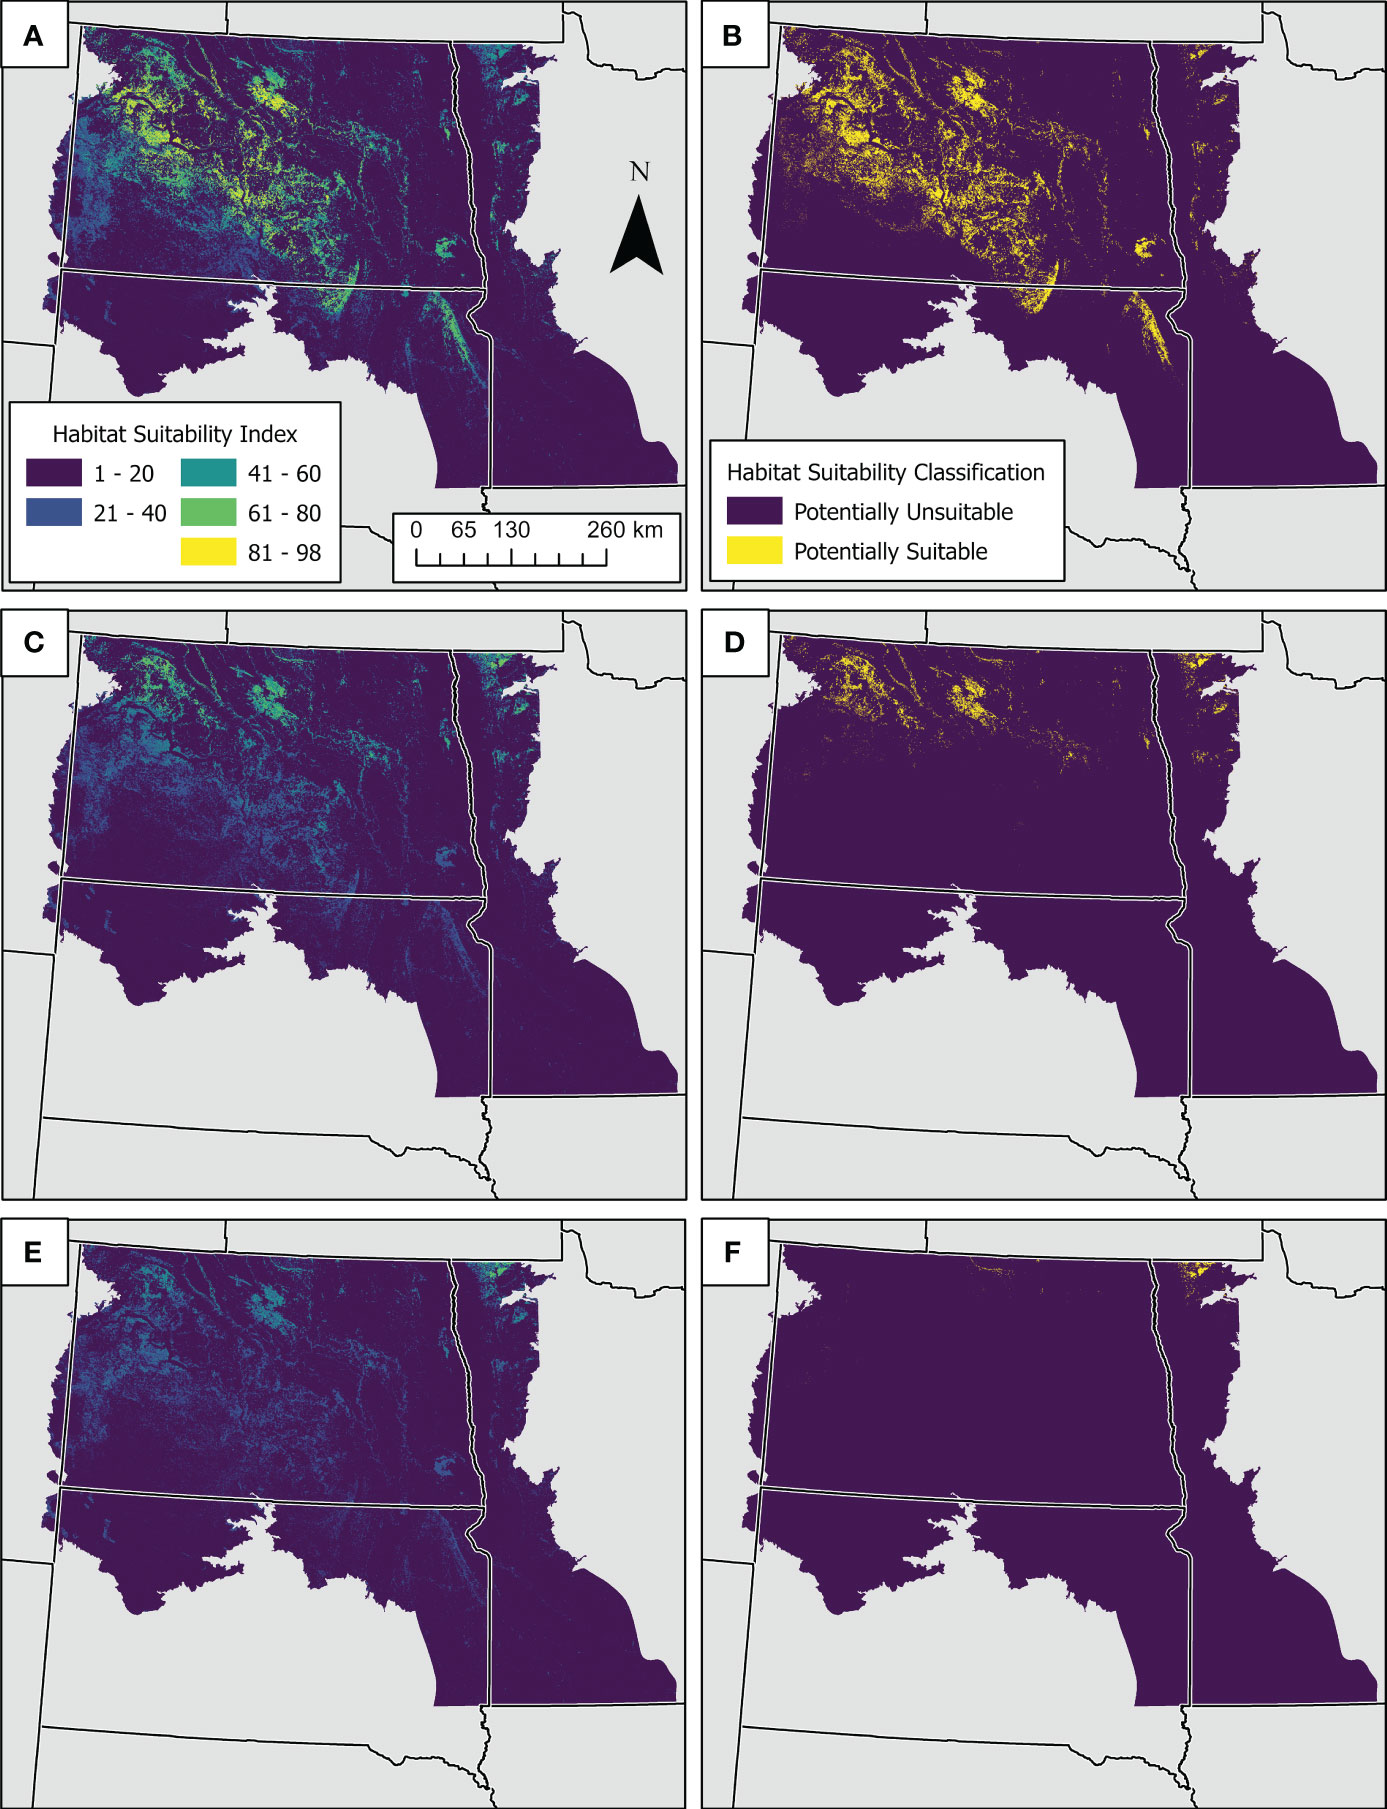
Figure 4 Maps showing predicted suitable habitat for Dakota skipper under current and future climate conditions. Current predictions were derived by spatially applying a Random Forest classification model across the study area to the full suite of current biotic and abiotic predictor variables used in model development (A, B). Future predictions were derived by applying the model (ceteris paribus) to bioclimatic indices from future climate predictions for the shared socioeconomic pathway and radiative forcing scenario SSP2-4.5 and time periods 2041-2070 (C, D) and 2071-2100 (E, F). Figure panels on the left are habitat suitability index estimates based on the percentage of suitable habitat classifications across the ensemble of decision trees, and figures on the right represent model classifications of suitable or unsuitable habitat based on majority vote across the ensemble of decision trees.
The current climate envelope for Dakota skippers included in our analysis extended from northwestern to southeastern North Dakota and then east across Minnesota and Wisconsin (Figure 5). All future climate envelopes across eight global climate models shifted to the north into northern Minnesota, North Dakota, Ontario, Manitoba, and Saskatchewan (Figure 5). There was moderate overlap between current and future climate models in 2011-2041 but little overlap for current and future climate envelopes by 2071-2100 (Figure 5).
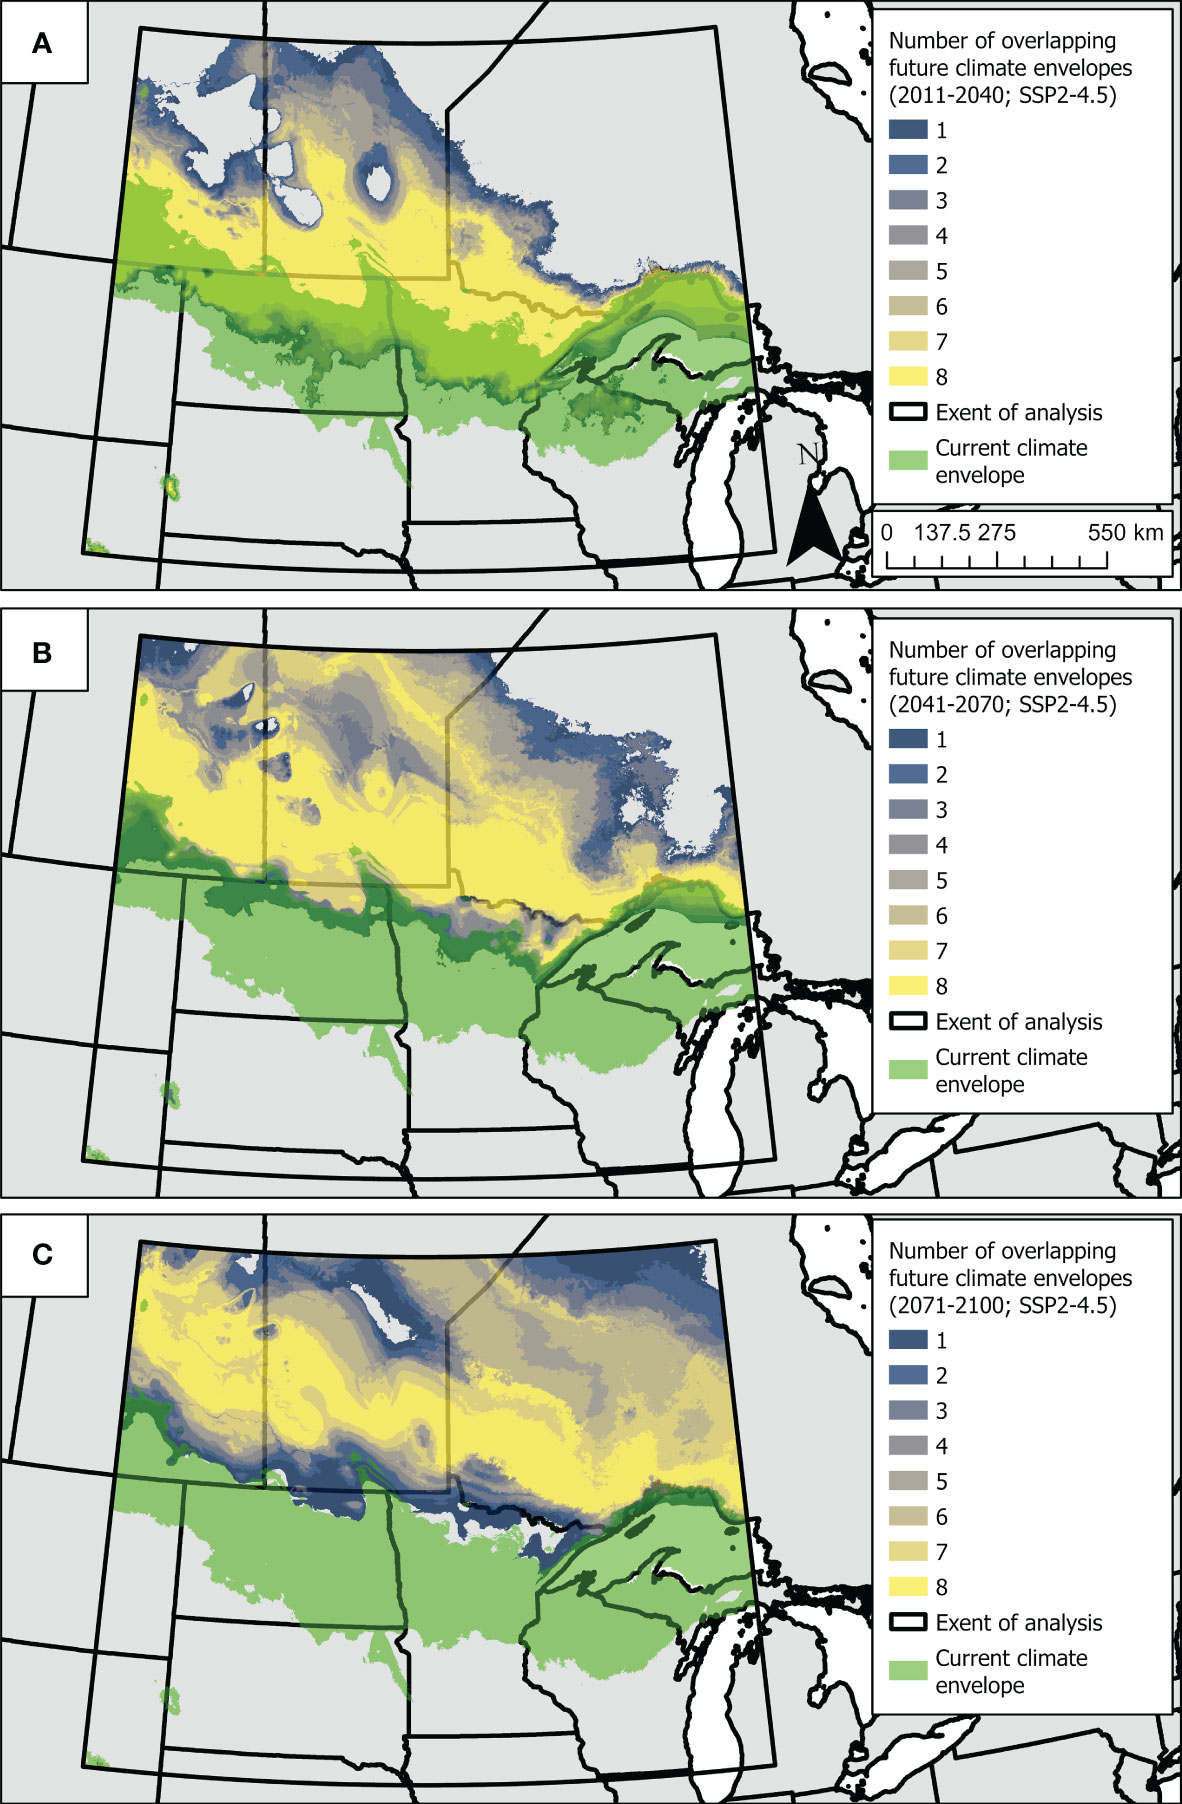
Figure 5 Maps depicting the current predicted Dakota skipper climate envelope in relation to future predicted climate envelopes. Climate envelopes were estimated by spatially applying a Random Forest classification model that predicts suitable or unsuitable habitat for the Dakota skipper. The current climate envelope (i.e., green area) was determined by applying the model to current bioclimatic predictor variables while holding all other non-climatic predictor variables at their median values (A–C). Future climate envelopes were determined by applying the model (ceteris paribus) to bioclimatic predictor variables from future climate predictions for eight global climate models under the shared socioeconomic pathway and radiative forcing scenario SSP2-4.5 and the time periods 2011-2040 (A), 2041-2070 (B), and 2071-2100 (C). The amount of agreement or overlap across future climate envelope predictions (i.e. gradient from green to yellow, or low to high agreement) could indicate locations with greater potential for the climate to be suitable for Dakota skipper in the future.
Discussion
Our results provide a useful framework for guiding Dakota skipper conservation in the study extent. This includes conservation planning and delivery, design of future research and surveys, and understanding potential effects of climate change on the Dakota skipper. Model results generally agree with known Dakota skipper ecology and previous Dakota skipper habitat models. The model shows strong positive associations with potentially undisturbed grass with high percent cover and NPP of perennial grasses and forbs at multiple spatial scales; it also shows a negative response to cultivated lands and substantial influences of temperature and precipitation (Figures 2, 3). The positive association with shrub and tree cover at large scales was unexpected but might reflect lower amounts of trees and shrubs in agriculture-dominated landscapes typical of pseudo-absence points as well as succession of woody vegetation due to limited disturbance, particularly fire, on most land parcels in the region (Figure 3; Grant et al., 2009). Our model did not find a strong influence of soil properties or topography, unlike previously published work (Post van der Burg et al., 2020; Seidle et al., 2020; Dearborn et al., 2022). However, that is likely due to differences in the suite of predictor variables we considered relative to those considered in previous efforts, which emphasized soil properties and topography as a relatively invariant proxy for vegetation types. Strong influences of vegetation in our model may reflect proximate or ultimate selection by Dakota skipper, whereas strong influences of soil type and topography in previous models likely reflect conditions that have allowed native prairie—and therefore Dakota skipper—to persist.
We made several decisions during model development that could affect model prediction and interpretation. One decision was to develop a “range-wide” model instead of several local models for geographic clusters of occurrences. This allowed us to assess the range of conditions under which Dakota skippers are known to exist in the US and characterize habitat suitable across conservation planning units, providing a common framework for conservation planning. In addition, it enabled the estimation of a more complete climate envelope and enhanced our understanding of how future climate conditions could impact habitat suitability. Developing several local models would likely have provided more insight into fine-scale regional habitat associations, given that occurrence and training data would have been confined to smaller groups from similar environments (Chefaoui and Lobo, 2008; VanDerWal et al., 2009; Hanberry et al., 2012). However, these models tend to have constrained predictions and can under-predict suitable habitat, especially when predicting across large regions or extrapolating outside of predictor space (Chefaoui and Lobo, 2008; VanDerWal et al., 2009; Hanberry et al., 2012). For example, the model could under-predict suitable habitat that exists farther from a perceived climate envelope and would be less useful for potentially identifying new populations between known populations. A range-wide model, where pseudo-absence points were randomly distributed across a large space, can have inflated performance because occurrences and pseudo-absences are from less similar environments (Chefaoui and Lobo, 2008; VanDerWal et al., 2009; Hanberry et al., 2012). These models can better capture coarse-scale general associations across a few predictors and will tend to over-predict suitable habitat, especially closer to occurrences (Chefaoui and Lobo, 2008; VanDerWal et al., 2009; Hanberry et al., 2012). To balance these competing considerations, we geographically and environmentally stratified pseudo-absences to capture more fine-scale regional associations and improve predictions across the entire extent; this is important from a conservation standpoint, as identifying “new” populations would better guide conservation actions. However, model results indicated that these implications were not fully overcome, as evidenced by the high AUC achieved with a small model subset (Supplementary Table 2).
Another decision was constraining the number of predictor variables in a model to a maximum of 25. Model selection generally has the goal of finding parsimonious models that best approximate “truth” by balancing bias and variance (Burnham and Anderson, 2002). While the increase in performance for the model with 25 variables was minimal relative to the model containing only five variables, the AUC did increase with larger subsets, and we decided (Supplementary Table 2) to proceed with the more complex model or a few reasons. First, given our pseudo-absence sampling methods, we expected the majority of variance would be explained by a few more general predictors, such as those that characterize cropland versus grassland systems. By including a larger suite of predictors, we could capture more fine-scale associations characterizing suitable habitat within grassland systems. Second, by including a larger suite of variables we were better able to characterize a climate envelope and its subsequent shift, as well as provide impetus for further investigation of the suite of model associations. For example, investigating and defining climate thresholds that are limiting to Dakota skipper life functions, or investigating why restored grasslands have a negative association (e.g. inadequate seed mixes, deleterious management, etc.). Third, including a lager suite of covariates helped evaluate which groups of covariates proved most useful for predicting suitable habitat (i.e., landcover, spectral, climate, topography, or soils data), which can help guide future modeling efforts.
Spatial output from our model (Figure 4) has current and future applications for conservation of Dakota skipper across their entire US range. Working in conjunction with the North Dakota Natural Resources Trust, the model has already informed parcel selection for survey efforts and helped identify a previously unknown Dakota skipper population during surveys in 2023 (North Dakota Natural Resources Trust, in production). The model has also been used to identify potentially suitable habitat that should be avoided by development. Because of its designation as a federally listed species, the spatial model for Dakota skipper can be included in parcel assessment for acquisition of perpetual grassland easements in the US Prairie Pothole Region (USFWS (U.S. Fish and Wildlife Service), 2016). Importantly, the model can be combined with other data layers showing risk of conversion (e.g., Niemuth et al., 2022) or biological value for other species to increase the value of conservation acquisitions. Management can also be optimized by considering factors that influence presence and persistence of pollinator populations such as patch size, inter-patch distances, and site-level management (Britten and Glasford, 2002; McIntire et al., 2007; Dover and Settele, 2009; Niemuth et al., 2021); these considerations are integral to recovery planning efforts, which emphasize habitat size and connectivity when determining population health and the overall status of the species (USFWS (U.S. Fish and Wildlife Service), 2021).
The climate envelope analysis developed from our model suggests that climatic conditions associated with Dakota skipper populations that we analyzed may shift north even under a conservative climate scenario; however, there are several considerations that could affect model predictions (Figures 4, 5). First, as mentioned previously, inferences from our modeling effort may be biased because of the limited and non-probabilistic sample of data; such biases would be reduced with additional data from consistent, designed surveys. Second, some of the positive observations used in our model fell outside of the current climate envelope. This might indicate model misspecification and poor characterization of the climate envelope (Araújo and Peterson, 2012), but also could indicate that local vegetation and microsites can temper species’ response to climate, allowing them to persist outside the envelope (Denney et al., 2020; Vasiliev and Greenwood, 2021). Third, incorporating observations from a broader geography would likely change current and future predictions. This again points towards the need for consistent, designed surveys that would allow better estimation of Dakota skipper climate envelope and response to landscape composition. Equally important, though, is that conservation planners begin to strategize conservation actions relative to climate change, possibly within the resist, accept, or redirect framework (Thompson et al., 2021). Given projected changes in the Dakota skipper climate envelope, conservation efforts in core areas in northern latitudes may be necessary to account for climate change effects on Dakota skipper populations.
Dakota skipper response to a shifting climate envelope will be influenced by the limited dispersal ability of skippers, realized changes in temperature and precipitation, and resultant changes in vegetation, land use, and management. Previous research shows that isolation by distance was common to Dakota skipper populations, although reduced genetic diversity might be caused in part by the short flight window and sampling period (Britten and Glasford, 2002). However, isolation is an important predictor of occurrence and population persistence for many pollinator species (Dover and Settele, 2009), suggesting that enhancing connectivity through land protection and management may be an important strategy for conservation, especially as climate change moves the geographic climate envelope. Increased habitat connectivity has been shown to increase densities of other habitat restricted butterfly species (Haddad and Baum, 1999). Given the extent of cultivated agricultural land in the study region, it is important to understand Dakota skipper response to prairie restoration. This is reinforced by the need for connectivity, whether continuous or in the form of habitat “stepping stones”.
The influences of temperature and precipitation on Dakota skipper occurrence demonstrated by our model have substantial implications for climate change, as climate influences multiple aspects of Dakota skipper life history. For example, emergence and flight period have been correlated with temperature and degree days (Bink and Bik, 2009; Rigney, 2013; Selby, 2006) and increased temperatures or humidity might affect larvae development and survival (Royer et al., 2008). Temperature and precipitation also influence land use, as lands previously unsuitable for tillage agriculture due to inadequate climate may become more suitable with warming temperatures and higher precipitation (Stephens et al., 2008). This could result in native prairie suitable for Dakota skipper being converted to tillage agriculture. In addition, vegetation species composition, vegetation structure, and grazing intensity– which influences vegetation structure and species composition—also are influenced by temperature and precipitation (Olson et al., 1985; Guretzky et al., 2016; Grant et al., 2020). The spatial data we used to characterize future climate came from multi-model ensembles, which generally have higher accuracy, reliability, and consistency than single-model projections (Tebaldi and Knutti, 2007; Slingo and Palmer, 2011). However, future temperature and precipitation will almost certainly vary in magnitude and location relative to predictions, so monitoring and conservation planning for Dakota skipper will need to be adaptive to accommodate climate-related changes. For example, occurrence of invasive cool-season grasses, smooth brome (Bromus inermis) and Kentucky bluegrass (Poa pratensis), are expected to increase in portions of the Dakota skipper’s range due to climate change and related land management changes (Dekeyser et al., 2015; Grant et al., 2020). Dakota skipper larvae will feed on these invasive grass species, but this can negatively impact their survival, time to adulthood, and mass relative to feeding on native grass species (Nordmeyer et al., 2021). Climate change also might influence other aspects of Dakota skipper biology that can be addressed through management. For example, increased cattle numbers, which are influenced by climate variability (Klemm and Brisket, 2021), might result in high grazing intensity that alters site suitability for Dakota skipper (Selby, 2006; Royer et al., 2008). This can include the reduction of quality larval food plants (e.g., little bluestem [Schizachyrium scoparium)]) or nectar sources (e.g., purple coneflower [Echinacea angustifolia]) and increase lower quality vegetation (e.g., Kentucky bluegrass; Dekeyser et al., 2015), as well as impact larvae and pupae through trampling or the alteration microhabitats, although information about grazing effects is limited (Selby, 2006; Royer et al., 2008). For all these reasons, adaptive conservation planning and management may be necessary to provide suitable vegetation, microclimates, and refugia (Denney et al., 2020; Seidle et al., 2020; Vasiliev and Greenwood, 2021) to help Dakota skipper populations persist.
Our model also highlights needs for future research. The negative association with restored grassland (i.e, previously cultivated lands planted to grassland) suggests that structure, management, or species composition of restored grasslands might not be suitable for Dakota skipper; it may also be due to a lack of survey effort in restored grassland areas. Given interest in restoration of grasslands and Dakota skipper, evaluation of Dakota skipper response to different seed mixes and management practices will be important to future restoration efforts. In the past, most surveys for Dakota skipper were conducted by a limited group of surveyors focusing on areas already known to harbor Dakota skippers (Royer et al., 2008; USFWS (U.S. Fish and Wildlife Service), 2014); consequently, our model may have biases that reflect the limited and inconsistently collected data available to develop the model. Inconsistent data and small sample sizes are common in Dakota skipper models with Seidle et al. (2020) using 26 positive observations over 15 years; Post van der Burg et al. (2020) using 366 positive observations over 113 years; and Dearborn et al. (2022) using 90 presence observations over 19 years. Increased effort using designed surveys over an expanded geography would provide a larger sample size and broader range of variation in predictor variables, which would increase power of the analysis to accurately characterize effects of environmental predictors on occurrence of Dakota skipper. Expanded, designed surveys would provide additional benefits, as identification of sites with and without populations of Dakota skipper would enable analysis of effects of proximity to known populations on Dakota skipper occurrence. Landscape composition and habitat connectivity are important to maintaining genetic diversity of Dakota skipper (Britten and Glasford, 2002); our model could provide a foundation for identifying potential sample sites for surveys and directed research efforts. The number of new survey points or additional occurrence data necessary to answer these questions is unknown and will depend on the goals of the new model, as well as Dakota skipper prevalence and the location of observations relative to environmental predictors and other populations. In addition, the realized number of survey points will be influenced by funding and availability of qualified surveyors. Better understanding effects of habitat amount and isolation on Dakota skipper populations would strengthen our ability to deliver conservation more effectively for maintaining grass, restoring grass, and increasing connectivity, all of which are important factors in Dakota skipper conservation. Many factors influencing Dakota skipper populations relative to vegetation structure and composition occur at finer-resolution scales than our model and spatial data depict, so targeted research may be necessary to understand effects of host-plant presence, grazing, interseeding, and invasion by cool-season mat-forming grassland species. Resulting findings can be combined with our model to plan and manage in a hierarchical manner, where the model is used to assess landscape characteristics and fine-grained information guides site-level management.
As with any model, results of our analysis are influenced by data characteristics and are dependent on a variety of assumptions. Our call for collection of additional data collected in designed surveys using consistent protocols echoes similar calls resulting from earlier analysis (i.e., Post van der Burg et al., 2020; Seidle et al., 2020; Dearborn et al., 2022), which reinforces the importance of improved future data collection. Future survey efforts should also focus on a range of variation in geographic location, vegetation composition, patch size, and distance from occupied patches, which would strengthen the inferential capability of future analyses. A broader geographic range, even outside of the current climate envelope, would also help refine estimates of the effects of precipitation, temperature, and geographic location on Dakota skipper distribution and density. Survey protocols that would allow the inference of absences would also be beneficial. Use of pseudo-absences has long been successfully used to develop species distribution models but known/assumed absences would be helpful because criteria used to select pseudo-absences can influence model results (Manly et al., 2007; Phillips et al., 2009).
As our work and the results of others shows, understanding of Dakota skipper biology and population status is limited. Many grassland conservation programs are active within the range of the Dakota skipper; we suggest that our understanding of Dakota skipper biology and population status can best be enhanced through a program of iterative, active adaptive management (NEAT (National Ecological Assessment Team), 2006; McCarthy and Possingham, 2007). Under this framework, strategic implementation of conservation actions is coupled with designed research and monitoring with the goals of addressing uncertainty, accelerating information gain, and optimizing conservation decisions. Priority status of Dakota skipper and ongoing conservation actions provide both impetus and resources for improving our understanding and the conservation of Dakota skipper populations. Our spatial model can guide landscape-level assessment and conservation delivery for Dakota skipper, which, when combined with site-level evaluation and management, can advance understanding and conservation of this rare and declining species.
Data availability statement
The datasets presented in this study can be found in online repositories. The names of the repository/repositories and accession number(s) can be found below: https://ecos.fws.gov/ServCat/Reference/Profile/159874.
Ethics statement
Ethical approval was not required for the study involving animals in accordance with the local legislation and institutional requirements because ethical approval is not required in the US for butterfly surveys, however all surveyors passed USFWS training criteria for Dakota skipper surveys.
Author contributions
KB: Conceptualization, Data curation, Formal analysis, Investigation, Methodology, Software, Validation, Visualization, Writing – original draft, Writing – review & editing. LT: Conceptualization, Data curation, Investigation, Methodology, Writing – original draft, Writing – review & editing. NN: Conceptualization, Investigation, Methodology, Writing – original draft, Writing – review & editing.
Funding
The author(s) declare that no financial support was received for the research, authorship, and/or publication of this article.
Acknowledgments
The authors thank M.E. Estey, D. N. Becker, and A.A. Bass for supporting this effort, as well as M. E. Estey, H. M. Hagy, and two reviewers, whose comments greatly improved the manuscript.
Conflict of interest
All authors were employed by the company U.S. Fish and Wildlife Service.
Publisher’s note
All claims expressed in this article are solely those of the authors and do not necessarily represent those of their affiliated organizations, or those of the publisher, the editors and the reviewers. Any product that may be evaluated in this article, or claim that may be made by its manufacturer, is not guaranteed or endorsed by the publisher.
Author disclaimer
The findings and conclusions in this article are those of the authors and do not necessarily represent the views of the U.S. Fish and Wildlife Service.
Supplementary material
The Supplementary Material for this article can be found online at: https://www.frontiersin.org/articles/10.3389/fevo.2024.1304748/full#supplementary-material
References
AdaptWest Project. (2022). Gridded current and projected climate data for North America at 1km resolution, generated using the ClimateNA v7.30 software (T. Wang et al. 2022). (Adaptwest). Available at: adaptwest.databasin.org.
Amatulli G., McInerney D., Sethi T., Strobl P., Domisch S. (2020). Geomorpho90m, empirical evaluation and accuracy assessment of global high-resolution geomorphometric layers. Sci. Data 7, 1–18. doi: 10.1038/s41597-020-0479-6
Ambroise C., McLachlan G. J. (2002). Selection bias in gene extraction on the basis of microarray gene-expression data. Proc. Natl. Acad. Sci. 99, 6562–6566. doi: 10.1073/pnas.102102699
Apley D. W., Zhu J. (2020). Visualizing the effects of predictor variables in black box supervised learning models. J. R. Stat. Soc. Ser. B 82, 1059–1086. doi: 10.1111/rssb.12377
Araújo M. B., Peterson A. T. (2012). Uses and misuses of bioclimatic envelope modeling. Ecology 93, 1527–1539. doi: 10.1890/11-1930.1
Augustine D., Davidson A., Dickinson K., Van Pelt B. (2021). Thinking like a grassland: challenges and opportunities for biodiversity conservation in the Great Plains of North America. Rangeland. Ecol. Manage. 78, 281–295. doi: 10.1016/j.rama.2019.09.001
Barbet-Massin M., Jiguet F., Albert C. H., Thuiller W. (2012). Selecting pseudo-absences for species distribution models: how, where and how many? Methods Ecol. Evol. 3, 327–338. doi: 10.1111/j.2041-210X.2011.00172.x
Barnett K. L., Facey S. L. (2016). Grasslands, invertebrates, and precipitation: a review of the effects of climate change. Front. Plant Sci. 7, 1196. doi: 10.3389/fpls.2016.01196
Biecek P. (2018). DALEX: explainers for complex predictive models in R. J. Mach. Learn. Res. 19, 1–5. doi: 10.5555/3291125.3309646
Biecek P., Baniecki H. (2023) ingredients: effects and importances of model ingredients. R package version 2.3.0. Available at: https://CRAN.R-project.org/package=ingredients.
Biecek P., Burzykowski T. (2021). Explanatory Model Analysis (New York: Chapman and Hall/CRC). Available at: https://pbiecek.github.io/ema/.
Bink F. A., Bik J. D. (2009). Climate window and required heat in relation to the occurrence of poikilothermic animals (Lepidoptera). Entomol. Generalis. 31, 301–315. doi: 10.1127/entom.gen/31/2008/301
Bjornstad O. N. (2022) ncf: spatial covariance function. R package version 1.3-2. Available at: https://CRAN.R-project.org/package=ncf.
Bluemle J. P. (1991). The face of North Dakota. North Dakota Geological Survey Educational Series 21. (Bismarck, ND: North Dakota Geological Survey).
Britten H. B., Glasford J. W. (2002). Genetic population structure of the Dakota skipper (Lepidoptera: Hesperia dacotae): a North American native prairie obligate. Conserv. Genet. 3, 363–374. doi: 10.1023/A:1020576732699
Burnham K. P., Anderson D. R. (2002). Model selection and multimodel Inference: a practical information-theoretical approach. 2nd edition (New York: Springer-Verlag).
Chefaoui R. M., Lobo J. M. (2008). Assessing the effects of pseudo-absences on predictive distribution model performance. Ecol. Model. 210, 478–486. doi: 10.1016/j.ecolmodel.2007.08.010
Cochrane J. F., Delphy P. (2002). Status assessment and conservation guidelines: Dakota skipper [Hesperia dacotae (Skinner)], (Lepidoptera: Hesperiidae): Iowa, Minnesota, North Dakota, South Dakota, Manitoba, and Saskatchewan (Washington, DC: U.S. Fish and Wildlife Service, Twin Cities Field Office), 77.
Dana R. (1983). The Dakota skipper: a now rare prairie butterfly. Natural Areas. J. 3, 31–34. Available at: https://www.jstor.org/stable/43910760.
Dana R. P. (1991). Conservation management of the prairie skippers Hesperia dacotae and Hesperia ottoe: basic biology and threat of mortality during prescribed burning in spring (St. Paul, MN: Minnesota Agricultural Experiment Station Bulletin no. 594-1991 AD-SB-5511_S). Available at: https://conservancy.umn.edu/bitstream/handle/11299/139544/1/SB594.pdf.
Dearborn K., Westwood R. (2014). Predicting adult emergence of Dakota skipper and Poweshiek skipperling (Lepidoptera: Hesperiidae) in Canada. J. Insect Conserv. 18, 875–884. doi: 10.1007/s10841-014-9695-8
Dearborn K. D., Murray C., Westwood R. (2022). Ground validation reveals limited applicability of species distribution models for Dakota skipper (Hesperia dacotae, Lepidoptera: Hesperiidae) recovery efforts in Canada. Environ. Entomol. 51, 1249–1261. doi: 10.1093/ee/nvac084
Dekeyser E. S., Dennhardt L. A., Hendrickson J. (2015). Kentucky bluegrass (Poa pratensis) invasion in the northern Great Plains: a story of rapid dominance in an endangered ecosystem. Invasive. Plant Sci. Manage. 8, 255–261. doi: 10.1614/IPSM-D-14-00069.1
Denney D. A., Jameel M. I., Bemmels J. B., Rochford M. E., Anderson J. T. (2020). Small spaces, big impacts: contributions of micro-environmental variation to population persistence under climate change. AoB. Plants 12, plaa005. doi: 10.1093/aobpla/plaa005
Dewitz J., U.S. Geological Survey (USGS). (2021). National Land Cover Database (NLCD) 2019 Products (ver. 2.0, June 2021). (Reston, VA: U.S. Geological Survey data). doi: 10.5066/P9KZCM54
Dore M. H. I. (2005). Climate change and changes in global precipitation patterns: what do we know? Environ. Int. 31, 1167–1181. doi: 10.1016/j.envint.2005.03.004
Dover J., Settele J. (2009). The influence of landscape structure on butterfly distribution and movement: a review. J. Insect Conserv. 13, 3–27. doi: 10.1007/s10841-008-9135-8
Fields S. P., Barnes K. W. (2019). Grassland Assessment of North American Great Plains Migratory Bird Joint Ventures (Great Falls, MT: Prairie Pothole Joint Venture). Available at: https://ppjv.org/assets/docs/Great_Plains_Grassland_Assessment_Final_Report.pdf.
GAO (Government Accountability Office) (2007). Farm program payments are an important factor in landowners’ decisions to convert grassland to cropland. (Washington, DC: United States Government Accountability Office Report, GAO-07-1054).
Gorelick N., Hancher M., Dixon M., Ilyushchenko S., Thau D., Moore R. (2017). Google Earth Engine: Planetary-scale geospatial analysis for everyone. Remote Sens. Environ. 202, 18–27. doi: 10.1016/j.rse.2017.06.031
Grant T. A., Flanders-Wanner B., Shaffer T. L., Murphy R. K., Knutsen G. A. (2009). An emerging crisis across northern prairie refuges: prevalence of invasive plants and a plan for adaptive management. Ecol. Restor. 27, 58–65. doi: 10.3368/er.27.1.58
Grant T. A., Shaffer T. L., Flanders B. (2020). Patterns of smooth brome, Kentucky bluegrass, and shrub invasion in the Northern Great Plains vary with temperature and precipitation. Natural Areas. J. 40, 11–22. doi: 10.3375/043.040.0103
Guretzky J. A., Dunn C., Hillhouse H. (2016). Long-term Sandhills prairie responses to precipitation, temperature, and cattle stocking rate. Plant Ecol. 217, 969–983. doi: 10.1007/s11258-016-0622-9
Haddad N. M., Baum K. A. (1999). An Experimental test of corridor effects on butterfly densities. Ecol. Appl. 9, 623–633. doi: 10.1890/1051-0761(1999)009[0623:AETOCE]2.0.CO;2
Hanberry B. B., He H. S., Palik B. J. (2012). Pseudoabsence generation strategies for species distribution models. PloS One 7, e44486. doi: 10.1371/journal.pone.0044486
Jones M. O., Robinson N. P., Naugle D. E., Maestas J. D., Reeves M. C., Lankston R. W., et al. (2021). Annual and 16-day rangeland production estimates for the western United States. Rangeland. Ecol. Manage. 77, 112–117. doi: 10.1016/j.rama.2021.04.003
Kindt R., Coe R. (2005). Tree diversity analysis. A manual and software for common statistical methods for ecological and biodiversity studies. (Nairobi, Kenya: World Agroforestry Centre (ICRAF)). Available at: http://www.worldagroforestry.org/output/tree-diversity-analysis.
Klemm T., Brisket D. D. (2021). Retrospective assessment of beef cow numbers to climate variability throughout the U.S. Great Plains. Rangeland. Ecol. Manage. 78, 273–280. doi: 10.1016/j.rama.2019.07.004
Klemm T., Briske D. D., Reeves M. C. (2020). Potential natural vegetation and NPP responses to future climates in the U.S. Great Plains. Ecosphere 11, e03264. doi: 10.1002/ecs2.3264
Koda K., Nakamura H. (2012). Effects of temperature on the development and survival of an endangered butterfly, Lycaeides argyrognomon (Lepidoptera: Lycaenidea) with estimation of optimal and threshold temperatures using linear and nonlinear models. Entomol. Sci. 15, 162–170. doi: 10.1111/j.1479-8298.2011.00508.x
Krupke C. H., Holland J. D., Long E. Y., Eitzer B. D. (2017). Planting of neonicotinoid-treated maize poses risks for honey bees and other non-target organisms over a wide area without consistent crop yield benefit. J. Appl. Ecol. 54, 1449–1458. doi: 10.1111/1365-2664.12924
Kuhn M. (2022) caret: Classification and Regression Training. R package version 6.0-93. Available at: https://CRAN.R-project.org/package=caret.
Lark T. J., Salmon J. M., Gibbs H. K. (2015). Cropland expansion outpaces agricultural and biofuel policies in the United States. Environ. Res. Lett. 10, 44003. doi: 10.1088/1748-9326/10/4/044003
Longing S. D., Peterson E. M., Jewett C. T., Rendon B. M., Discua S. A., Wooten K. J., et al. (2020). Exposure of foraging bees (Hymenoptera) to neonicotinoids in the U.S. Southern High Plains. Environ. Entomol. 49, 528–535. doi: 10.1093/ee/nvaa003
Mahony C. R., Wang T., Hamann A., Cannon A. J. (2022). A global climate model ensemble for downscaled monthly climate normals over North America. Int. J. Climatol. 42, 5871–5891. doi: 10.1002/joc.7566
Main A. R., Hladik M. L., Webb E. B., Goyne K. W., Mengel D. (2020). Beyond neonicotinoids—wild pollinators are exposed to a range of pesticides while foraging in agroecosystems. Sci. Total. Environ. 742, 140436. doi: 10.1016/j.scitotenv.2020.140436
Manly B. F. J., McDonald L. L., Thomas D. L., McDonald T. L., Erickson W. P. (2007). Resource selection by animals: statistical design and analysis for field studies (New York: Kluwer Academic Publishers).
McCabe T. L. (1981). The Dakota skipper, Hesperia dacotae (Skinner): range and biology, with special reference to North Dakota. J. Lepidopterists’. Soc. 35, 179–193.
McCarthy M. A., Possingham H. P. (2007). Active adaptive management for conservation. Conserv. Biol. 21, 956–963. doi: 10.1111/j.1523-1739.2007.00677.x
McIntire E. J. B., Schultz C. B., Crone E. E. (2007). Designing a network for butterfly habitat restoration: where individuals, populations, and landscapes interact. J. Appl. Ecol. 44, 725–736. doi: 10.1111/j.1365-2664.2007.01326.x
NEAT (National Ecological Assessment Team) (2006). Strategic Habitat Conservation: Final Report of the National Ecological Assessment Team (Washington, D.C: U.S. Fish and Wildlife Service). Available at: https://digitalmedia.fws.gov/digital/collection/document/id/904/.
Niemuth N. D., Barnes K. W., Tack J. D., Iovanna R. (2022). Past is prologue: historic landcover patterns predict contemporary grassland loss in the U.S. northern Great Plains. Landscape Ecol. 37, 3011–3027. doi: 10.1007/s10980-022-01528-3
Niemuth N. D., Estey M. E., Fields S. P., Wangler B., Bishop A. A., Moore P. J., et al. (2017). Developing spatial models to guide conservation of grassland birds in the U.S. Northern Great Plains. Condor 119, 506–525. doi: 10.1650/CONDOR-17-14.1
Niemuth N. D., Fleming K. L., Reynolds R. R. (2014). Waterfowl conservation in the US Prairie Pothole Region: confronting the complexities of climate change. Public Library. Sci. One 9, e100034. doi: 10.1371/journal.pone.0100034
Niemuth N. D., Wangler B., LeBrun J. J., Dewald D., Larson S., Schwagler T., et al. (2021). Conservation planning for pollinators in the U.S. Great Plains: considerations of context, treatments, and scale. Ecosphere 12, e03556. doi: 10.1002/ecs2.3556
Nordmeyer C. S., Runquist E., Stapleton S. (2021). Invasive grass negatively affects growth and survival of an imperiled butterfly. Endangered. Species. Res. 45, 301–314. doi: 10.3354/esr01136
North Dakota Natural Resources Trust (2022). The North Dakota Natural Resources Trust 2022 Dakota Skipper Survey Campaign (Bismarck, ND: A Report to the U.S. Fish and Wildlife Service, North Dakota Resources Trust).
Olson K. C., White R. S., Sindelar B. W. (1985). Response of vegetation of the Northern Great Plains to precipitation amount and grazing intensity. J. Range Manage. 38, 357–361. doi: 10.2307/3899422
Otto C. R. V., Zheng H., Gallant A. L., Iovanna R., Carlson B. L., Smart M. D., et al. (2018). Past role and future outlook of the Conservation Reserve Program for supporting honey bees in the Great Plains. Proc. Natl. Academies. Sci. 115, 7629–7634. doi: 10.1073/pnas.1800057115
Phillips S. J., Dudík M., Elith J., Graham C. H., Lehmann A., Leathwick J., et al. (2009). Sample selection bias and presence-only distribution models: implications for background and pseudo-absence data. Ecol. Appl. 19, 181–197. doi: 10.1890/07-2153.1
Poggio L., de Sousa L. M., Batjes N. H., Heuvelink G. B. M., Kempen B., Ribeiro E., et al. (2021). SoilGrids 2.0: producing soil information for the globe with quantified spatial uncertainty. SOIL 7, 217–240. doi: 10.5194/soil-7-217-2021
Post van der Burg M., Austin J. E., Wiltermuth M. T., Newton W., MacDonald G. (2020). Capturing spatiotemporal patterns in presence-absence data to inform monitoring and sampling designs for the threatened Dakota skipper (Lepidoptera: Hesperiidae) in the Great Plains of the United States. Environ. Entomol. 49, 1252–1261. doi: 10.1093/ee/nvaa081
Post van der Burg M., Symstad A. J., Igl L. D., Mushet D. M., Larson D. L., Sargeant G. A., et al. (2022). “Potential effects of energy development on environmental resources of the Williston Basin in Montana, North Dakota, and South Dakota—Species of conservation concern,” in U.S. Geological Survey Scientific Investigations Report 2017–5070–D. (Reston, VA: United States Geological Survey), 41. doi: 10.3133/sir20175070D
Rashford B. S., Walker J. A., Bastian C. T. (2011). Economics of grassland conversion to cropland in the Prairie Pothole Region. Conserv. Biol. 25, 276–284. doi: 10.1111/j.1523-1739.2010.01618.x
R Core Team (2022). R: A language and environment for statistical computing. (Vienna, Austria: R Foundation for Statistical Computing). Available at: https://www.R-project.org/.
Reynolds R. E., Shaffer T. L., Loesch C. R., Cox J. R.R. (2006). The farm bill and duck production in the prairie pothole region: increasing the benefits. Wildlife. Soc. Bull. 34, 963–974. doi: 10.2193/0091-7648(2006)34[963:TFBADP]2.0.CO;2
Rigney C. L. (2013). Habitat characterization and biology of the threatened Dakota skipper (Hesperia dacotae) in Manitoba (Winnipeg, Manitoba, Canada: Masters of Science. The University of Winnipeg), 259.
Royer R. A., Marrone G. M. (1992). Conservation Status of The Dakota Skipper (Hesperia dacotae) in North and South Dakota (Denver CO: U.S. Department of the Interior, Fish & Wildlife Service).
Royer R. A., McKenney R. A., Newton W. E. (2008). A characterization of non-biotic environmental features of prairies hosting the Dakota Skipper (Hesperia dacotae, hesperiidae) across its remaining U.S. range. J. Lepidopterist’. Soc. 62, 1–17.
Samson F., Knopf F. (1994). Prairie conservation in North America. BioScience 44, 418–421. doi: 10.2307/1312365
Seidle K. M., Kiss J., Attanayake A. U., DeVink J. M., Bedard-Haughn A., Westwood R., et al. (2020). Extent of Dakota skipper, Hesperia dacotae, distribution in southeastern Saskatchewan, Canada. J. Insect Conserv. 24, 1073–1081. doi: 10.1007/s10841-020-00276-6
Selby G. (2006). Effects of grazing on the Dakota skipper buttefly: prairie butterfly status surveys 2003-2005 (St. Paul: Minnesota Department of Natural Resources). Available at: http://files.dnr.state.mn.us/eco/nongame/projects/consgrant_reports/2006/2006_selby.pdf.
Slingo J., Palmer T. (2011). Uncertainty in weather and climate prediction. Philos. Trans. R. Soc. A. 369, 4751–4767. doi: 10.1098/rsta.2011.0161
Stanton R. L., Morrissey C. A., Clark R. G. (2018). Analysis of trends and agricultural drivers of farmland bird declines in North America: a review. Agricult. Ecosyst. Environ. 254, 244–254. doi: 10.1016/j.agee.2017.11.028
Stephens S. E., Walker J. A., Blunck D. R., Jayaraman A., Naugle D. E., Ringelman J. K., et al. (2008). Predicting risk of habitat conversion in native temperate grasslands. Conserv. Biol. 22, 1320–1330. doi: 10.1111/j.1523-1739.2008.01022.x
Swengel A. B., Swengel S. R. (1999). Observation of prairie skippers (Oarisma poweshiel, Hesperia dacotae, H. ottoe, H. leonardus, and Atryone argos iowa) (Lesisoptera: Hesperiidae) in Iowa, Minnesota, and North Dakota during 1988-1997. Great. Lakes. Entomol. 32, 267–292. doi: 10.22543/0090-0222.2001
Tebaldi C., Knutti R. (2007). The use of the multi-model ensemble in probabilistic climate projections. Philos. Trans. R. Soc. A. 365, 2053–2075. doi: 10.1098/rsta.2007.2076
Thompson L. M., Lynch A. J., Beever E. A., Engman A. C., Falke J. A., Jackson S. T., et al. (2021). Responding to ecosystem transformation: resist, accept, or direct? Fisheries 46, 8–21. doi: 10.1002/fsh.10506
USDA-NRCS (United States Department of Agriculture, Natural Resources Conservation Service) (2022). “Land resource regions and major land resource areas of the United States, the Caribbean, and the Pacific Basin,” in U.S. Department of Agriculture, Agriculture Handbook (Washington, DC: USDA-NRCS), 296.
USFWS (U.S. Fish and Wildlife Service) (2014). Threatened status for the Dakota skipper and endangered species status for the Poweshiek skipperling Vol. 79 (Washington, DC: United States Federal Register), 63672–63748.
USFWS (U.S. Fish and Wildlife Service) (2016). Administrative and enforcement procedures for FWS easements within the Prairie Pothole Region. 3rd ed. (Denver, CO, USA: U.S. Department of the Interior, Fish and Wildlife Service, Midwest Region, Bloomington, MN, and Mountain-Prairie Region).
USFWS (U.S. Fish and Wildlife Service) (2018a). Species status assessment report for the Dakota skipper (Hesperia dacotae) (Washington, DC: United States Fish and Wildlife Service), 97. Available at: https://ecos.fws.gov/ServCat/DownloadFile/155865.
USFWS (U.S. Fish and Wildlife Service) (2018b). 2018 Dakota Skipper (Hesperia dacotae) North Dakota survey protocol (Denver, CO: United State Fish and Wildlife Service Mountain-Prairie Region, Region). Available at: https://ecos.fws.gov/ServCat/DownloadFile/168145?Reference=114142.
USFWS (U.S. Fish and Wildlife Service) (2019). U.S. Fish and Wildlife Service annual report of lands 2019 (Washington, D.C., USA: U.S. Fish and Wildlife Service). Available at: www.fws.gov/refuges/land/landreport.html.
USFWS (U.S. Fish and Wildlife Service) (2021). Recovery Plan for the Dakota Skipper (Hesperia dacotae). September 2021 (Great Lakes Region, Bloomington, Minnesota: U.S. Fish and Wildlife Service), 13.
VanDerWal J., Shoo L. P., Graham C., Williams S. E. (2009). Selecting pseudo-absence data for presence-only distribution modelling: how far should you stray from what you know? Ecol. Model. 220, 589–594. doi: 10.1016/j.ecolmodel.2008.11.010
Vasiliev D., Greenwood S. (2021). The role of climate change in pollinator decline across the Northern Hemisphere is underestimated. Sci. Total. Environ. 775, 145788. doi: 10.1016/j.scitotenv.2021.145788
Wang T., Hamann A., Spittlehouse D., Carroll C. (2016). Locally downscaled and spatially customizable climate data for historical and future periods for North America. PloS One 11, e0156720. doi: 10.1371/journal.pone.0156720
Webster R. (2007). Dakota skipper, Hesperia dacotae (Skinner), surveys in southeast Saskatchewan and southwest Manitoba during 2007 (Edmonton AB: Canadian Wildlife Service).
Keywords: butterfly, conservation, Dakota skipper, grassland loss, pollinator, species distribution model
Citation: Barnes KW, Toso LB and Niemuth ND (2024) Dakota skipper distribution model for North Dakota, South Dakota, and Minnesota aids conservation planning under changing climate scenarios. Front. Ecol. Evol. 12:1304748. doi: 10.3389/fevo.2024.1304748
Received: 29 September 2023; Accepted: 18 January 2024;
Published: 02 February 2024.
Edited by:
Max Post van der Burg, United States Department of the Interior, United StatesReviewed by:
William Wyatt Hoback, Oklahoma State University, United StatesKatherine Dearborn, University of Winnipeg, Canada
Copyright © 2024 Barnes, Toso and Niemuth. This is an open-access article distributed under the terms of the Creative Commons Attribution License (CC BY). The use, distribution or reproduction in other forums is permitted, provided the original author(s) and the copyright owner(s) are credited and that the original publication in this journal is cited, in accordance with accepted academic practice. No use, distribution or reproduction is permitted which does not comply with these terms.
*Correspondence: Kevin W. Barnes, S2V2aW5fQmFybmVzQGZ3cy5nb3Y=