 Amalia Bogri
 Saria Otani
 Frank M. Aarestrup
 Christian Brinch
- Research Group for Genomic Epidemiology, National Food Institute, Technical University of Denmark, Copenhagen, Denmark
The steep rise of infections caused by bacteria that are resistant to antimicrobial agents threatens global health. However, the association between antimicrobial use and the prevalence of resistance is not straightforward. Therefore, it is necessary to quantify the importance of additional factors that affect this relationship. We theoretically explore how the prevalence of resistance is affected by the combination of three factors: antimicrobial use, bacterial transmission, and fitness cost of resistance. We present a model that combines within-host, between-hosts and between-populations dynamics, built upon the competitive Lotka-Volterra equations. We developed the model in a manner that allows future experimental validation of the findings with single isolates in the laboratory. Each host may carry two strains (susceptible and resistant) that represent the host’s commensal microbiome and are not the target of the antimicrobial treatment. The model simulates a population of hosts who are treated periodically with antibiotics and transmit bacteria to each other. We show that bacterial transmission results in strain co-existence. Transmission disseminates resistant bacteria in the population, increasing the levels of resistance. Counterintuitively, when the cost of resistance is low, high transmission frequencies reduce resistance prevalence. Transmission between host populations leads to more similar resistance levels, increasing the susceptibility of the population with higher antimicrobial use. Overall, our results indicate that the interplay between bacterial transmission and strain fitness affects the prevalence of resistance in a non-linear way. We then place our results within the context of ecological theory, particularly on temporal niche partitioning and metapopulation rescue, and we formulate testable experimental predictions for future research.
1. Introduction
Antimicrobial resistance is recognised as a major threat to global health (WHO, 2021). Infections caused by bacteria that are resistant to multiple or all drugs directly led to more than one million deaths in 2019 (Antimicrobial Resistance Collaborators et al., 2022). Earlier projections have also predicted a mortality of more than 10 million persons per year by 2050 (O’Neill, 2016). This devastating increase in antimicrobial resistance was foreseen already in the 1940s when the first antibiotics became available (Rosenblatt-Farrell, 2009). Despite the early alarms against imprudent use, the human and animal consumption of antimicrobial agents has been increasing dramatically ever since (Tiseo et al., 2020; Browne et al., 2021). This has resulted in an anticipated rise in infections by resistant bacteria (Van De Sande-Bruinsma et al., 2008; Andersson et al., 2020).
The association between antimicrobial use and resistance burden is, however, not straightforward. On the one hand, a clear evolutionary arms race is expected: antimicrobial compounds pose a selective pressure onto microbial communities, which allows for the selection of resistance determinants (Gullberg et al., 2011). Based on this, a series of mathematical models have been employed to describe or predict the outcome of antimicrobial use (reviews by Austin and Anderson, 1999; Blanquart, 2019; Tetteh et al., 2020). Such models often focus on the within-host dynamics of antimicrobial treatment in search of the optimal frequency and intensity to minimise resistance (e.g., Bonhoeffer et al., 1997; Levin et al., 1997; Colijn and Cohen, 2015; Marrec and Bitbol, 2018, 2020). Other models focus on between-host dynamics, and on how to decrease antimicrobial resistance in a human population (e.g., Massad et al., 1993; Austin et al., 1997; Levin et al., 1997; Colijn and Cohen, 2015). On the other hand, empirical data showed that dosing strategies and prudent use of antimicrobial agents do not always lead to the expected reduction of infections with resistant bacteria in the examined populations (Goossens et al., 2005; Van De Sande-Bruinsma et al., 2008; Olesen et al., 2018). Additionally, it has been challenging to theoretically reproduce the stable co-existence of resistant and susceptible strains in host populations (Blanquart, 2019). Therefore, whilst antimicrobial use is undoubtedly responsible for the rise of resistance, additional factors may contribute to the maintenance of resistance.
Recent studies have shown that the ecological context, namely different socioeconomic, anthropological, developmental, environmental, health and nutrition factors, may contribute largely to the increase in antimicrobial resistance (Collignon et al., 2018; Hendriksen et al., 2019). Most of these factors are likely associated with increased bacterial transmission between people and populations. The relationship between antimicrobial use and resistance prevalence within an examined population may be concealed due to bacterial transmission between populations (Krieger et al., 2020; Olesen et al., 2020). Transmission of bacteria in humans is usually horizontal and takes place either directly, from host to host through social contact, or indirectly from the environment, through vectors or fomites (Robinson et al., 2019; Sarkar et al., 2020).
Bacterial transmission can promote co-existence between resistant and susceptible strains of the same bacterial species within a host (Davies et al., 2019). However, most epidemiological models on antimicrobial resistance do not account for the possible co-colonisation of a host by both strains. Only recent modelling efforts touch upon this, suggesting mechanisms for the persistent co-occurrence of pathogenic strains (e.g., Colijn et al., 2010; Colijn and Cohen, 2015; Blanquart et al., 2017; Cobey et al., 2017). The opportunity of non-pathogenic commensal strains to co-colonise a host (e.g., Austin et al., 1997, 1999a,b; Blanquart et al., 2018; Davies et al., 2019) and the effect on resistance levels are much less explored.
Primarily non-pathogenic strains, such as pathobionts and commensals, are not the target of antimicrobial treatment, yet they are exposed to it as bystanders, often at subinhibitory concentrations, which can result in resistance (Andersson and Hughes, 2014; Tedijanto et al., 2018; Andersson et al., 2020). Whilst the dissemination of resistant non-pathogenic strains does not directly lead to untreatable infections, it is still a cause of concern, as their resistance determinants can spread through horizontal gene transfer to pathogens (Holmes et al., 2016). Conversely, non-pathogenic susceptible strains are better competitors as they lack costly resistance (Andersson and Hughes, 2010; Andersson et al., 2020); thus, their circulation may curb the amount of resistance in a population. Therefore, it is necessary to identify and quantify the importance of bacterial transmission in relation to resistance prevalence in a population. However, it is challenging to validate models on the transmission of resistance due to the lack of experimental data and the complexity of observational population data (Blanquart, 2019).
The purpose of our study is to develop a transmission model that can be validated experimentally in vitro with single isolates. Because of this, we explicitly include within-host, between-hosts and between-populations dynamics, unlike the existing models on antimicrobial resistance that usually focus only on one of these levels. Our aim was to theoretically explore, through simulations, how commensal bacterial transmission affects the evolutionary selection for resistance under different fitness costs of resistance and antimicrobial use frequencies (Figure 1). Our goal was to identify an appropriate parameter space to validate the simulation results experimentally.
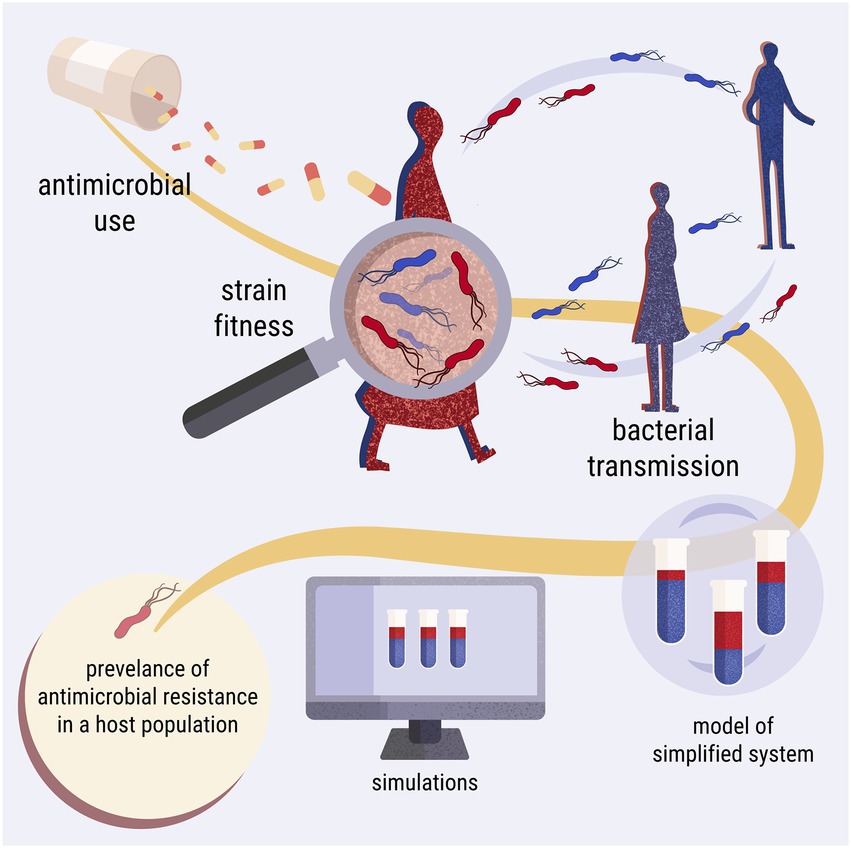
Figure 1. Graphical overview of the simulation study. The model describes a population of hosts, carrying two bacterial strains, one susceptible (blue) and one resistant (red) to an antimicrobial agent. The aim of the study is to theoretically investigate how three key processes (antimicrobial use, strain fitness, and bacterial transmission) affect the prevalence of antimicrobial resistance in this population.
Thus, we present a digital twin model of a laboratory experimentation setup, which is built upon the competitive Lotka-Volterra equations. The objectives of the study were to explore the prevalence of resistance in the case of:
i. periodic antimicrobial treatments in regards to different fitness costs conferred by resistance within one host,
ii. periodic antimicrobial treatments in regards to different fitness costs conferred by resistance in a population of hosts with daily bacterial transmission,
iii. periodic antimicrobial treatments in regards to different levels of periodic bacterial transmission within a population of hosts, and
iv. periodic antimicrobial treatments in regards to different levels of periodic bacterial transmission between two populations of hosts.
Our results show that periodic antimicrobial treatments promoted strain co-existence within the hosts. Additionally, bacterial transmission between hosts led predominantly to the persistence of resistance in the host population. However, when the fitness cost of resistance was low, high transmission frequencies could result in attenuated resistance levels. Finally, host populations had more similar levels of resistance when they interacted with high frequency due to the decrease of resistance in the population that received more frequent antimicrobial treatments. We discuss our results within the context of ecological theory, particularly on temporal niche partitioning and metapopulation rescue. We identify a parameter range that should be explored experimentally in the future, and we put our results in the broader context of antimicrobial resistance surveillance and mitigation.
2. Methods
2.1. Model summary
The model simulates a laboratory competition experiment and comprises three levels of complexity: within host, between hosts and between populations (Figure 2). Starting from within-host simulations, a tube represents a host. The hypothetical tube contains a population of cultured Escherichia coli, which serves as the commensal microbiome of the host. A host may contain two isogenic strains of E. coli; one resistant and one susceptible to an antimicrobial agent, competing with each other. The host is treated with the antimicrobial agent periodically. The growth of the E. coli culture, representing the bystander microbiome, is impacted as collateral damage by sub-inhibitory levels of the antimicrobial agent. For between-hosts simulations, the experimental setup was expanded to include multiple test tubes, which represent a simplified population of hosts. The content of the tubes is mixed periodically, mimicking bacterial transmission between hosts. At the last complexity level, the model scales up to between-population simulations, wherein bacterial transmission between hosts of different populations is allowed. The simulations were built upon the Lotka-Volterra model of competition between two species (Figure 3; Supplementary Code).
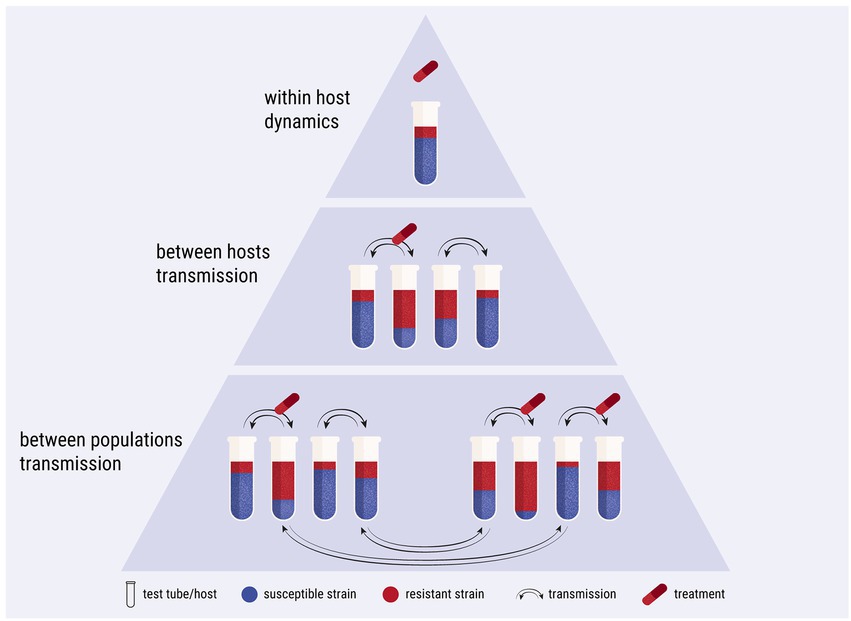
Figure 2. Diagrammatic representation of the three levels of complexity of the study. The first level explores the within-host dynamics of the system. The second level focuses on between-hosts dynamics and bacterial transmission. The third level is expanded to include two host populations with transmission between them.
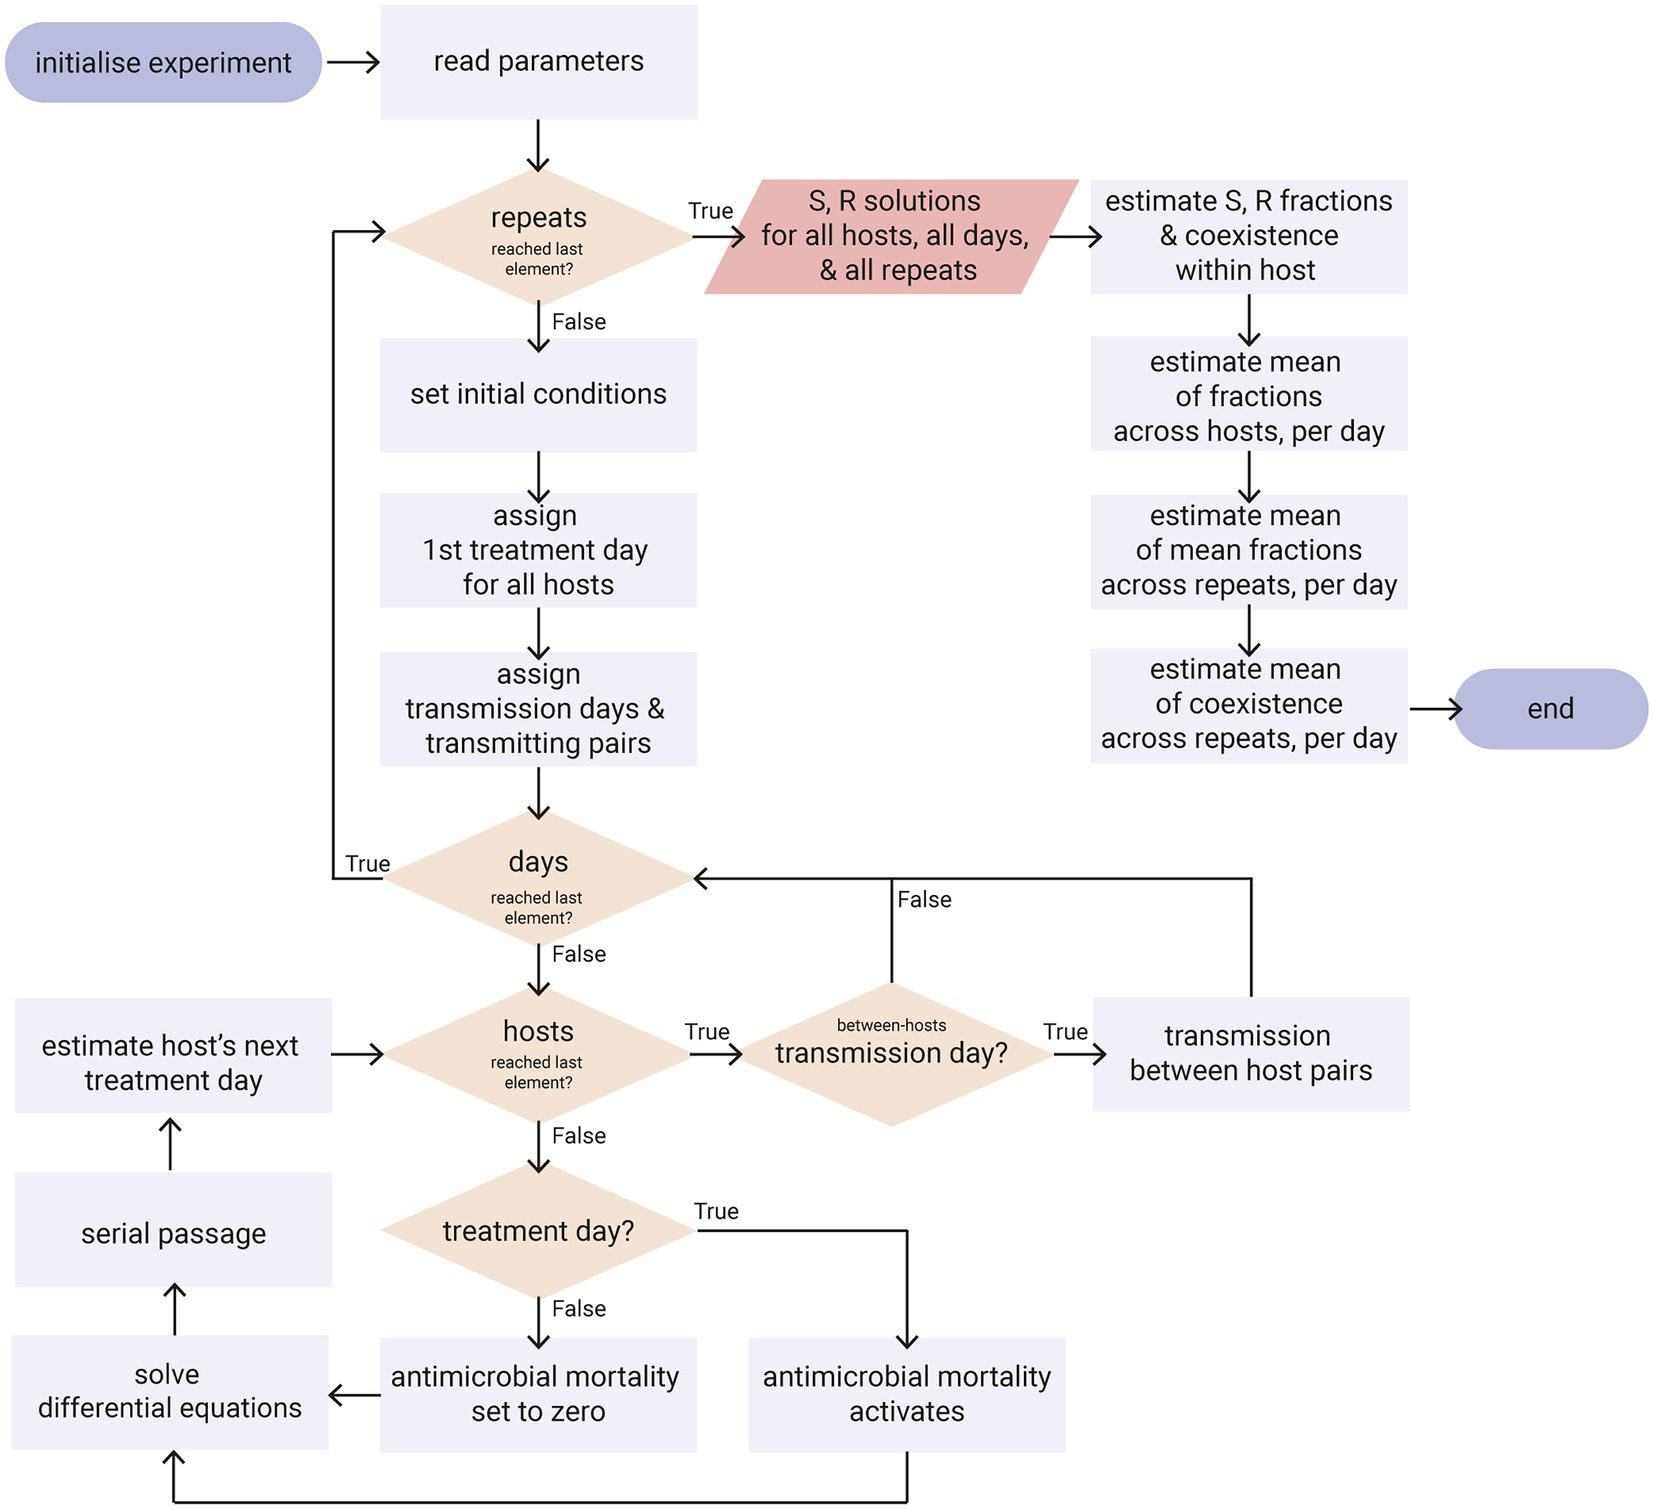
Figure 3. Flowchart diagram of the simulations. Only the key points of the algorithm are shown, such as the implementation of antimicrobial treatment, the multiple days of the serial passage, the multiple hosts of a population and the transmission between hosts. Ovals: start/end point; rectangles: process; parallelogram: output; diamonds: decision. Refer to Supplementary Code for the python code.
2.2. Model description and parameterisation
2.2.1. Growth of an Escherichia coli culture
The growth of a liquid Escherichia coli culture in 1 day broadly follows a logistic function. Soon after the initial bacterial inoculation, the culture starts growing exponentially. As the bacterial population grows, nutrient availability declines, waste products accumulate, and spatial limitations set in. This means that the growth rate of the population decreases as the population grows. Eventually, the growth rate becomes zero, and the culture reaches a stationary phase as the system approaches its carrying capacity (Dykhuizen, 1990).
The logistic growth is described by the ordinary differential equation (Otto and Day, 2007):
with denoting the concentration of bacterial cells at time , the intrinsic growth rate of the bacterial strain, and the carrying capacity of the system. The growth rate of the population is not constant but dependent on the bacterial concentration ; it is maximum when is very small and becomes zero as approaches . Whilst more precise logistic models have been developed to describe bacterial growth (e.g., Fujikawa et al., 2004), the logistic growth equation adequately describes the growth of a single E. coli isolate for the simulations of this study (McKendrick and Pai, 1912; Pearl, 1927; Marrec and Bitbol, 2020).
At conditions of optimal growth (37°C, aeration, pH of 7.0) in liquid Luria-Bertani broth medium, E. coli has a doubling time of approximately 20 min during the exponential phase (Fujikawa et al., 2004). The culture reaches the stationary phase at approximately 10 h (depending on inoculum size and condition), and it can achieve an overnight cell density of approximately 109 cfu/ml of culture (Fujikawa et al., 2004; Sezonov et al., 2007; Tuttle et al., 2021). In our simulations, the experiment begins with an initial inoculum of cfu/mL (Marcusson et al., 2009) and a carrying capacity set to cfu/mL (Fujikawa et al., 2004).
2.2.2. Competition between two isogenic strains
To represent a community with two competing isogenic isolates in a single culture, we defined two state variables for our system: for the susceptible strain concentration and for the resistant concentration. The Lotka-Volterra model of competition assumes that each individual of population experiences competition as if its own population had a size of (Otto and Day, 2007). However, the competition coefficient can be disregarded in this case, as the two strains are isogenic, i.e., . Thus, the growth rate of the two strains is a function of the concentration of both the susceptible and the resistant strain. For the susceptible strain, the growth rate became , and for the resistant strain it became . When the concentration of the resistant and the susceptible strains is low in the combined culture, their growth rate approaches maximum. As their combined concentration reaches the system’s carrying capacity, their growth rate becomes zero.
The intrinsic growth rate depends on the characteristics of each modelled strain. The intrinsic growth rate of the susceptible strain was set to 50 per day (i.e., 2.1 h−1 24 h, Fujikawa et al., 2004). We assume that there is a decrease in relative fitness in the resistant strain, as the carriage of resistance determinants is costly in the absence of antimicrobial treatment (Andersson and Hughes, 2010; Andersson et al., 2020). Thus, we define the relative fitness of the resistant strain as , and we refer to ‘high relative fitness of the resistant strain’ as ‘low fitness cost of resistance’ and vice versa. The intrinsic growth rate of the isogenic resistant strain, , was estimated by multiplying the resistant strain’s relative fitness, , with the susceptible strain’s intrinsic growth rate, . We explore a large range of relative fitness values, between 0.4 and 1.0. Most of the mutations that confer antimicrobial resistance to E. coli result in a relative fitness within the range of 0.9 to 1.0 according to the meta-analysis by Melnyk et al. (2015), but resistant E. coli strains with much lower relative fitness also exist (e.g., 0.6 in Marcusson et al., 2009). When < , the resistant strain reaches carrying capacity slower than the susceptible strain.
2.2.3. Effect of antimicrobial treatment on growth rate
In the event of antimicrobial treatment, the growth of the bacterial populations would be affected. We assume that an antimicrobial agent that affects bacterial growth rate is used, such as a fluoroquinolone like ciprofloxacin. Fluoroquinolones act bacteriostaticly at sub-inhibitory concentrations (Hawkey, 2003; Silva et al., 2011), suppressing cell division and reducing population growth (Coates et al., 2018). At concentrations higher than the minimum inhibitory, fluoroquinolones act bactericidally, with a different mechanism of action that induces cell death (Hawkey, 2003; Silva et al., 2011).
The decrease in the intrinsic growth rate due to the antimicrobial treatment is noted as for the susceptible strain and for the resistant strain. Sub-inhibitory concentrations (bacteriostatic) would mean that , whereas inhibitory concentrations (bactericidal) would mean that . The and parameters are set to zero when there is no antimicrobial treatment, and they are activated when treatment is given.
In the majority of the simulations in our study, we examine sub-inhibitory, non-lethal, concentrations of the antimicrobial agent to imitate the bystander effect of the commensal microbiome (Tedijanto et al., 2018). Thus, unless stated otherwise, we set at and . This way, the susceptible strain would grow at 20% of its normal growth rate, i.e., at a rate of 0.42 h−1 24 h. This decreased growth rate corresponds to 0.5 of the minimum inhibitory concentration for ciprofloxacin in rich growth medium (Berryhill et al., 2022). The resistant strain is only slightly affected by the treatment, as its minimum inhibitory concentration would be much higher than the susceptible’s (Marcusson et al., 2009; Coates et al., 2018; Berryhill et al., 2022). If the host carries both strains, the susceptible will be a bad competitor under antimicrobial treatment, which gives the competitive advantage to the resistant strain.
2.2.4. Final set of equations
We note that there is no explicit mortality rate term included in this model, as the intrinsic growth rate and the density dependence terms account for the net growth (births and deaths) rate of the population (Otto and Day, 2007). The model does not include a clearance rate (e.g., mortality due to the host’s immune system), as we consider the strains to be commensal and not pathogenic.
The final set of differential equations for the two competing strains is:
for the susceptible strain,
and:
for the resistant strain.
A summary of all the parameters and their values is presented in Table 1.
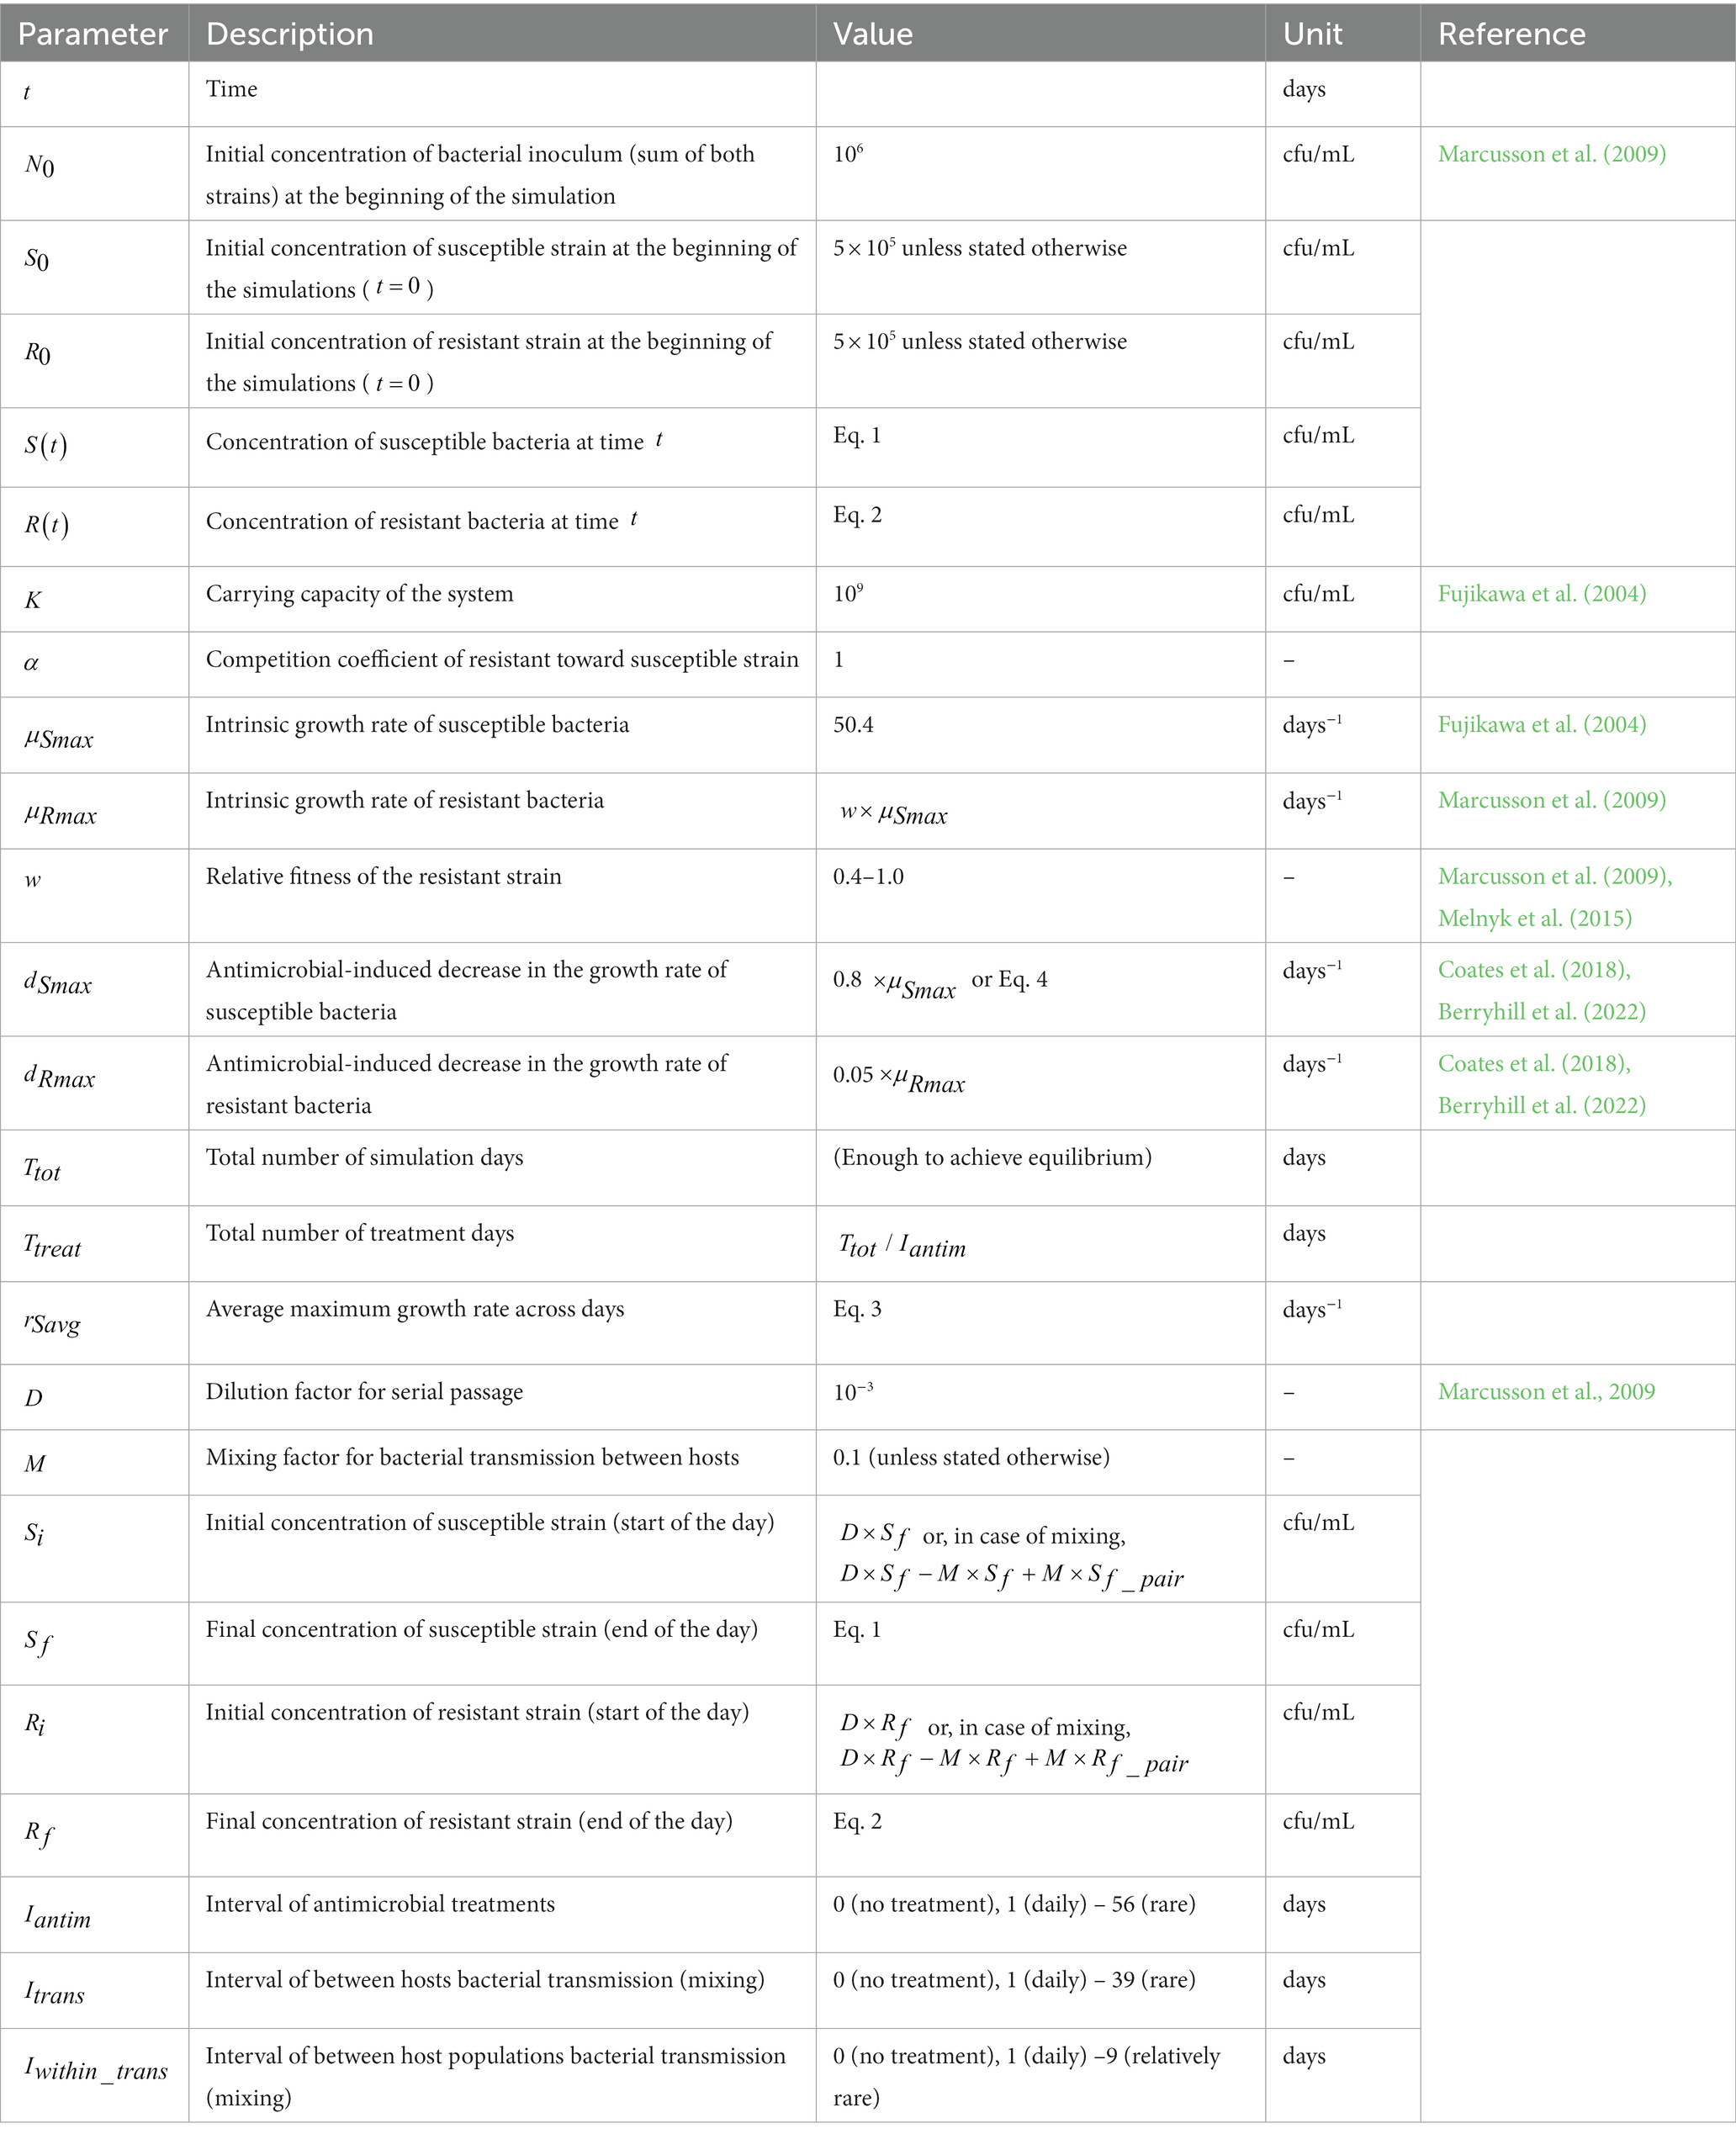
Table 1. Glossary of parameters.
2.2.5. Simulation of serial passage in batch culture
The mathematical model describes the competition between the two strains in 1 day, but a competition experiment in the laboratory runs for several days to declare the outcome of the competition (e.g., Marcusson et al., 2009). Bacteria go through multiple growth cycles through a process called serial passage. Every day, a sample is taken from the stationary phase of the previous day’s growth cycle and is inoculated (i.e., diluted) into fresh growth medium. A new growth cycle then begins, the culture reaches the stationary phase, and another passage takes place the next day; the process is repeated until the end of the experiment. It is assumed that the culture in the test tube is homogeneous and that the sampled inoculum is representative of the tube’s strain composition.
The passing of days during the serial passage was implemented computationally as a for-loop (Figure 3; Supplementary Code). Each iteration of the loop represents a day. Every day, the set of differential equations is solved. To start a new day and set the initial conditions for the equations, we imitate the serial passage. The size of the initial susceptible population each day, , is given by multiplying the size of the final susceptible population of the previous day, , by the dilution factor, . Likewise, the initial size of the resistant population, , is given by multiplying the size of the final resistant population, , by the dilution factor, . We set the dilution factor at as in Marcusson et al. (2009). This way, a host that contains cfu/mL and cfu/mL at the end of the day, would have cfu/mL and cfu/mL as the initial conditions for the next day. If a strain within a host is close to extinction and there is less than 1 cfu/ml of it after the passage, we set it to zero. This dilution process is thus deterministic and does not account for evolutionary bottlenecks. We note that the above procedure remains the same even if the culture does not reach carrying capacity within the host; this may happen if a host contains only the susceptible strain when it receives antimicrobial treatment.
2.2.6. Simulation of periodic antimicrobial treatment
During the competition experiment, the host is treated with antimicrobials periodically (Figure 3; Supplementary Code). The duration of each treatment event is 1 day. We assumed that there is no carry-over of the antimicrobial agent during the passage to the next day. The frequency of the treatment events is provided as the interval between the treatments, i.e., the antimicrobial-free days. The first day of the treatment is chosen randomly from a discrete uniform distribution of integers ranging from the first day of the experiment to the interval between treatments, . For example, if the treatment interval is set to days, the first antimicrobial treatment will happen between the first and the tenth day of the experiment. Subsequently, antimicrobial treatment will happen every 10 days until the end of the simulation. We explored a wide range of treatment intervals, ranging from daily ( day) to more and more rare (from days and up to days in some cases), as well as the case of no treatment ( ).
Every day of the experiment, an if-statement checks whether that is a treatment day. If not, the antimicrobial growth decreasing rates, and , are set to zero. If yes, antimicrobial treatment is delivered by switching and to their non-zero values. A brief example of the serial passage with one antimicrobial treatment event is provided in Supplementary Figure S1.
2.2.6.1. Scenario 1: Fixed decrease in growth rate across treatment frequencies
As mentioned above (Section 2.2.3), the majority of the simulations were run with days−1 (Berryhill et al., 2022). This way, if we compare two simulations with a duration of 100 days, we can see that a daily treatment, day, would correspond to 100 treatment events, whereas less frequent treatment would correspond to less treatment events (e.g., days corresponds to 50 treatment events). Thus, the less frequent the treatment, the higher the average growth rate of the susceptible strain across the experiment ( ), and the better the expected outcome for the susceptible strain. The average growth rate was calculated as:
with indicating the total number of days of the experiment and the number of days with antimicrobial treatment. For the estimation of the average growth rate, , at different treatment intervals, , refer to Supplementary Table S1.
2.2.6.2. Scenario 2: Adjusted decrease in growth rate across treatment frequencies
We examined a second scenario, where we kept stable across experiments of different treatment frequencies. To achieve this, we adjusted the decrease in the growth rate of the susceptible strain ( ) by the treatment interval ( (similarly to Letten et al., 2021). In effect, frequent treatments were milder as they had lower ; this corresponds to concentrations lower than half of the inhibitory for the susceptible strain. On the other hand, rarer treatments were harsher, as they had higher . Rare treatments could even reach bactericidal levels, corresponding to concentrations above the minimum inhibitory. The value of at each respective treatment frequency was estimated with the average growth rate fixed at day−1, and was calculated by:
For a more comprehensive explanation of the relationship between the treatment intervals, and the decrease in growth rate, , please refer to Supplementary Table S1.
2.2.7. Simulating multiple hosts
Up to this point, the model imitated a batch culture selection experiment in the laboratory for only one host of two bacterial strains. The model was then expanded to include multiple hosts and between-hosts dynamics (Figures 2, 3). This was implemented as a nested for-loop; every day, the equations are solved for all hosts (Figure 3; Supplementary Code). We keep track of the concentration of susceptible and resistant bacteria of each host, across all days of the selection experiment. All hosts of the experiment receive treatment with the same frequency, but not simultaneously, as the first treatment day for each host is decided randomly as explained in Section 2.2.6.
To imitate a small host community, we ran initial simulations with 100 and 1,000 hosts. The simulations with more hosts resulted in damper oscillations in time, but with the same equilibrium values and overall pattern (Supplementary Figure S2). Thus, due to computational restraints, the rest of the simulations were run with 100 hosts.
We tested two sets of initial conditions at the beginning of the simulations. In the first set, resistance was broadly disseminated in the host population, with all of the hosts carrying resistant bacteria as 50% of their content, i.e., cfu/mL and cfu/mL. In the second set, where resistance was not as disseminated, 90% of the hosts did not contain any resistant bacteria ( cfu/mL and cfu/mL), and only 10% of the hosts carried resistant bacteria that comprised 50% of their content ( cfu/mL and cfu/mL). We find that, in the presence of any transmission, these sets of initial conditions did not affect the system’s equilibrium, which acted as an attractor. The initial conditions did affect the time required to reach equilibrium; when resistance was already disseminated in the population, the majority of the systems arrived at equilibrium faster (Supplementary Figure S3).
2.2.8. Simulating periodic bacterial transmission between hosts
Bacterial transmission between hosts was implemented through the process of mixing (Figure 3; Supplementary Code). Transmission happens between pairs of hosts that exchange a small percentage of their bacterial load with each other. We assumed that the host cultures are homogeneous and that the transferred amounts are representative of their host’s composition of the susceptible and resistant strains. This means that if a host contains both susceptible and resistant bacteria, both strains will be transmitted during the mixing. Additionally, even if a host already contains both strains already, a mixing event with another host may still influence the ratio between the two strains. We note that there was no transmission cost for either strain, transmission is adequate for host invasion and colonisation for both strains, and stochastic invasion dynamics are not considered. The parameterisation of the mixing amount to a realistic value is not possible due to the simplification of the transmission process in the model. We set the amount of mixing at a relatively high level of 10%, but we have tested the effect of larger and smaller mixing amounts at Supplementary Figure S4.
In the simulations, mixing takes place right after the serial passage dilution. For example, let us assume that if the initial conditions for a pair of transmitting hosts are cfu/mL, cfu/mL for the one host and cfu/mL, cfu/mL for the second host. To find the mixing amount during transmission, we multiply these initial conditions with the mixing factor , which corresponds to 10% of the bacterial load of each host. This way, the first host would transfer to the second host cfu/mL and cfu/mL, and the second host would transfer to the first host cfu/mL and cfu/mL. Thus, the initial conditions of these two hosts for the next day would become cfu/mL, cfu/mL for the first host and cfu/mL, cfu/mL for the second host. If a strain within a host is close to extinction and there is less than 1 cfu/ml after the mixing, we set it to zero; there is no stochasticity on whether the strain would get extinct at small concentrations.
Transmission happens periodically, at regular intervals. For example, if the interval of transmission, , is set to 10 days, then the hosts mix every 10 days. We explored a wide range of transmission intervals, ranging from daily ( day) to more and more rare (from days and up to days in some cases), as well as the case of no transmission ( ). All the pairs of transmitting hosts mix simultaneously. The pairs of transmitting hosts formed are chosen randomly from the host population without replacement; transmission between any two hosts is thus equally likely. This means that a host can transmit only with a single other host at a transmission event, but that (usually) different pairs are formed for each transmission event.
2.2.9. Simulating two host populations
Finally, we examine the case of between-populations dynamics (Figure 2). Here we aim to understand how transmission between host populations affects their respective levels of resistance. For the sake of simplicity and computation time, we only consider two host populations. It is, however, possible to simulate more host populations, and it would be interesting to explore scenarios that are more complex in the future. We keep track of the susceptible and resistant strain concentrations for all hosts of the two populations by solving two sets of equations instead of one.
We assume that the host populations have the same size, with 100 hosts each. Regarding the initial conditions at the beginning of the simulations, we examined a case where the hosts of one population carried only susceptible bacteria ( cfu/mL and cfu/mL) and the hosts of the other population carried 50% susceptible and 50% resistant bacteria ( cfu/mL and cfu/mL). We also examined the case where the hosts of both populations carried 50% susceptible and 50% resistant bacteria ( cfu/mL and cfu/mL), which is the case in most of our simulations in this study.
In any case, we set the within-population transmission frequency as daily for both populations ( day), and the relative fitness of the resistant strain to high ( ). The two host populations varied in their treatment frequency. One population was treated every 6 days ( days). The other population was treated less frequently. We examined different treatment intervals for the second population, , ranging between 8 and 14 days. The more dissimilar the treatment interval of the two host populations, the more dissimilar we expect their resistance levels to be, even in the presence of transmission.
Transmission between hosts of different populations happens in a similar manner as the mixing between hosts of the same population, described in the previous section. As transmission between populations should be, by definition, lower than the transmission within a population, only 50% of each population can mix with the other, per population transmission event. In order to investigate the impact of between-populations transmission on the prevalence of resistance, we examined a range of between-population transmission intervals, from daily transmission ( day) to sparse ( days), and none ( .
2.2.10. Summarising the output of the simulations
The output of the differential equations is the concentration of each strain, in each host, for each day. We then converted the concentrations of susceptible and resistant bacteria into ratios, i.e., and , which take values from zero to one. From this, we calculated the arithmetic mean of the ratio of each strain across all hosts of a population. This estimates the daily average level of susceptibility and resistance in a host population. As these levels oscillate in time, we present the average equilibrium values of the system. We note that all simulations were run long enough for the system to reach the oscillating equilibrium. We found the average ratios at equilibrium by averaging the daily values over a few oscillation periods after the system reached equilibrium. We compare the result of different experiments by plotting the equilibrium values on a heatmap. For a summary of all the parameters explored and their values, refer to Supplementary Table S2. We also kept track of the co-existence of susceptible and resistant bacteria within each host. From this, we calculated the number of hosts that carry both strains. As before, we present the number of co-colonised hosts at equilibrium by averaging the values over a few oscillation-periods. We found that the co-existence heatmaps closely follow the heatmaps of the average level of susceptibility and resistance (Supplementary Figure S5).
2.2.11. The effect of stochastic processes in the simulations
The bacterial dynamics (at within-host level) of the model are deterministic. However, the model is partly stochastic. There are three processes that introduce randomness in the system: the first antimicrobial treatment day is random for each host, the pairs of transmitting hosts are random without replacement, and, when only a percentage of a population transmits (i.e., in the between-populations simulations), the chosen hosts are random. This means that the same experiment can produce different results but overall the same pattern. It is possible to summarise the dynamics through a deterministic mathematical model; yet, this falls outside the scope of our study, which aims to closely twin an in vitro experiment.
To ensure reproducibility, we ran each simulation several times, usually in three replicates. Then, we calculated the arithmetic mean of the susceptibility, resistance, and co-existence levels across the repeats. Increasing the number of repeats resulted in more damped oscillations in equilibrium but with the same average values. Less, or even no, repeats combined with a larger host population size resulted in a similar dampening of the oscillations, again with the same pattern for the average values (Supplementary Figure S2). Finally, we note that the model conserves structural neutrality, as the two strains are treated equally in all the processes of the model, putting aside the biological differences between the two strains (Lipsitch et al., 2009).
3. Results
3.1. The effect of periodic antimicrobial treatment within a host
The effect of antimicrobial treatment frequency on the prevalence of resistance was first explored at the level of a single host. All the experiments were initiated with equal numbers of resistant and susceptible bacteria within the host. Within-host dynamics can be explained purely by the competition between the two strains. When resistance bore a fitness cost, the susceptible strain always outcompeted the resistant one in the absence of antimicrobial agents, as illustrated on the top row of Figures 4A,B. Conversely, under antimicrobial treatment, the resistant strain became competitive due to the decrease in the growth rate of the susceptible strain.
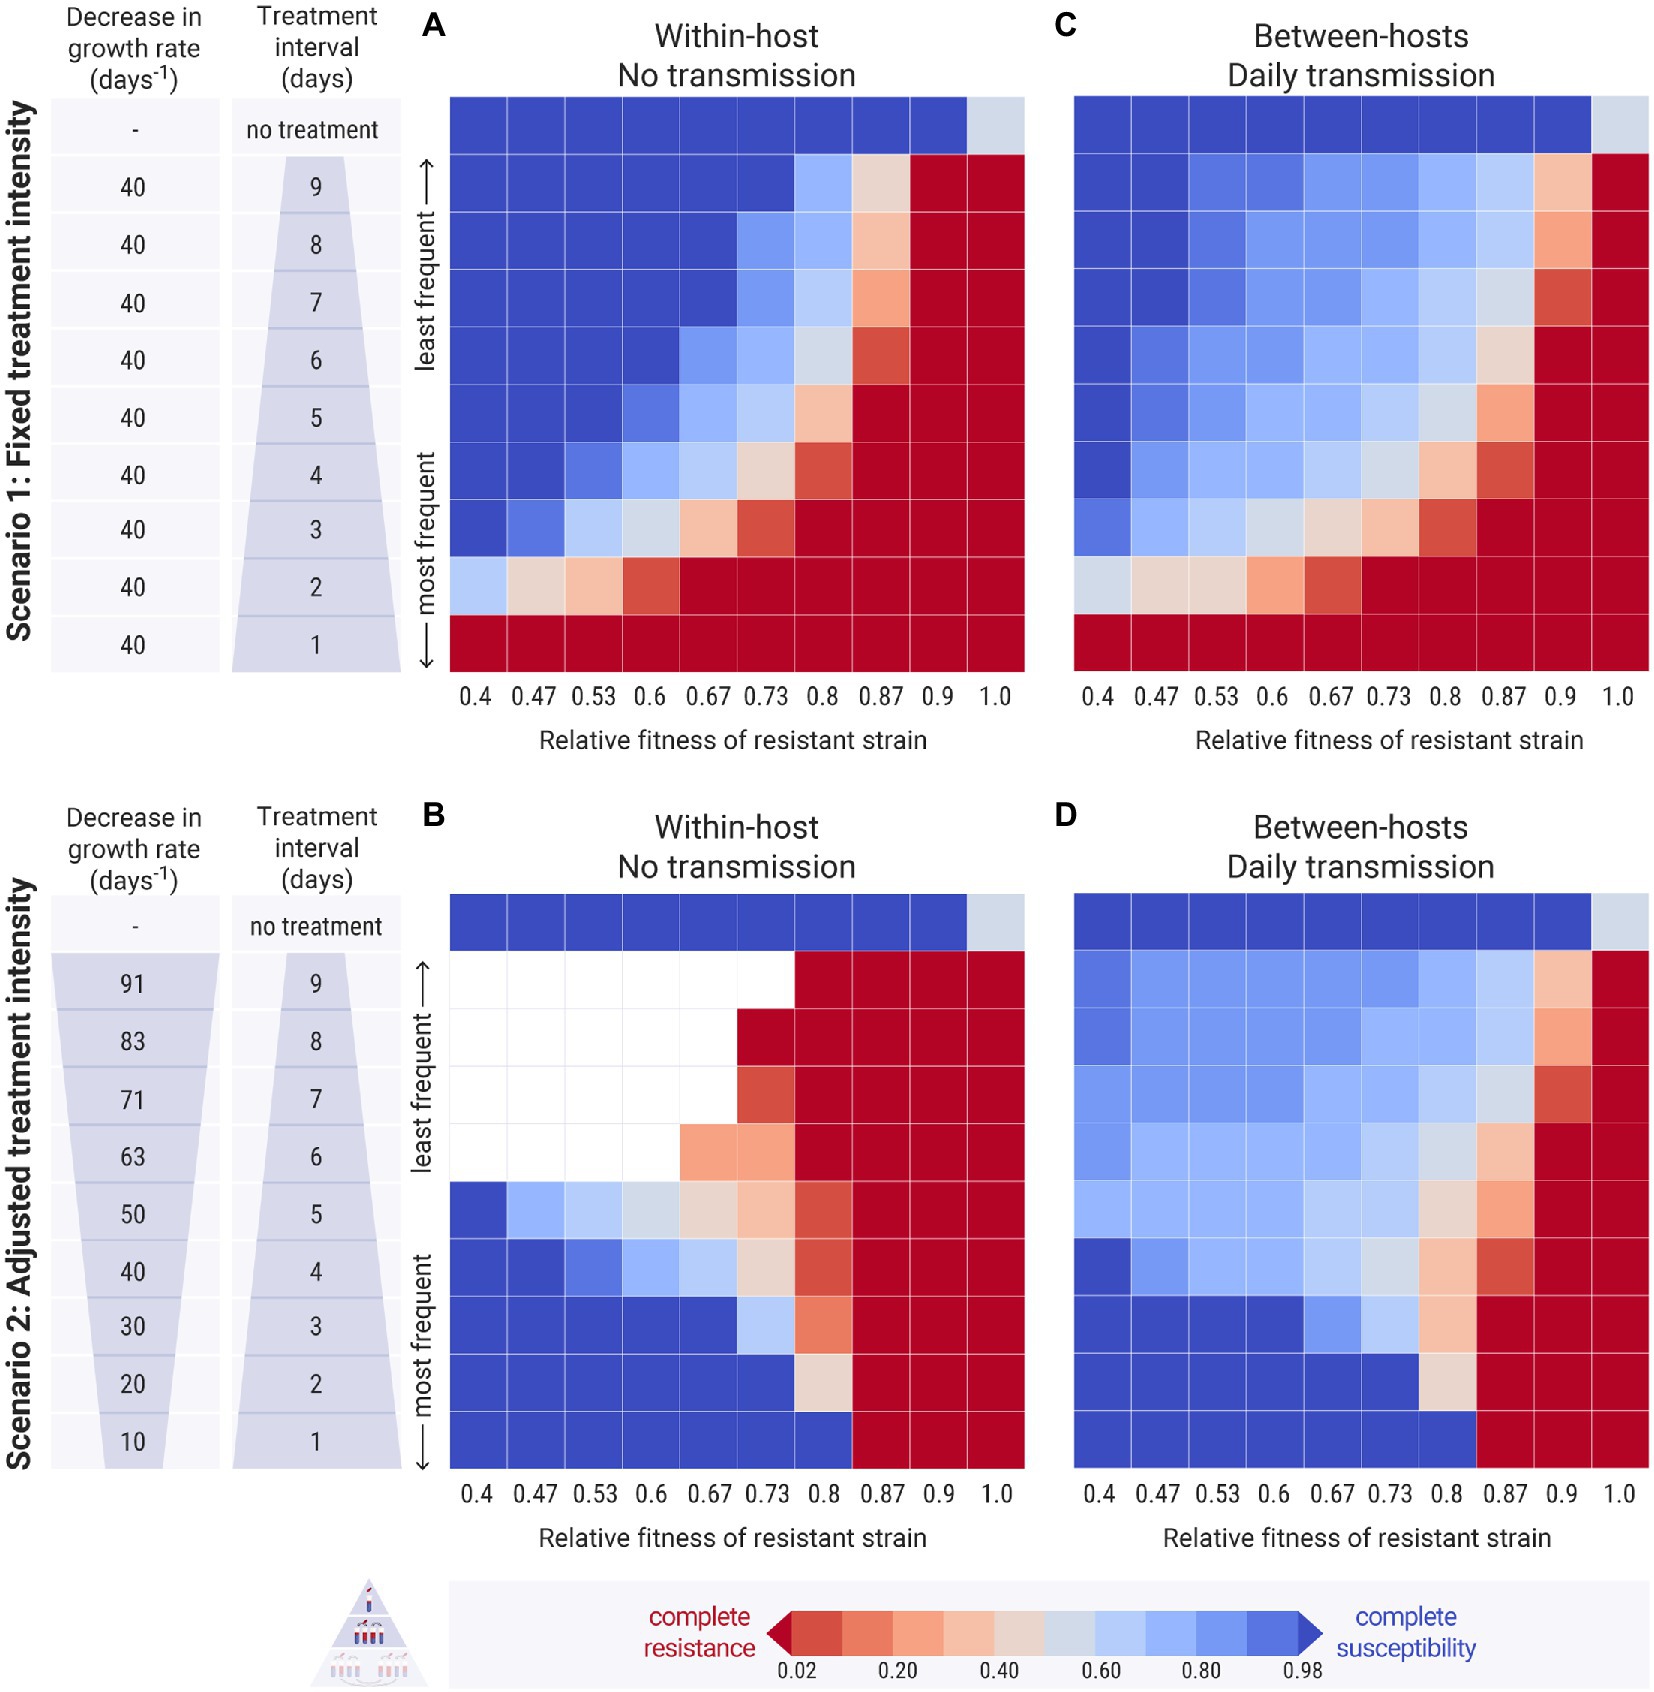
Figure 4. Results of the simulations across different treatment intervals ( , y-axis) and relative fitness of the resistant strain (w, x-axis). Each cell of the heatmap represents the equilibrium values of one experiment. The colour bar represents the average equilibrium ratio of susceptible bacteria in the host or in the host population. (A,C) Scenario 1, where the decrease in the intrinsic growth rate due to the antimicrobial treatment is fixed across experiments at day−1. (B,D) Scenario 2, where the decrease in the growth rate due to the antimicrobial treatment, , is adjusted by the treatment interval, and takes values between 10 and 91 day−1 (see Supplementary Table S1 for calculation). (A,B) Within-host simulations (no transmission). (C,D) Between-host simulations (with daily transmission).
3.1.1. Narrow windows of periodic treatment support strain co-existence
In the first scenario, we examined how different frequencies of antimicrobial treatment affected the prevalence of resistance within the host. As expected, less frequent treatments benefited the susceptible bacteria on the account that longer antimicrobial-free intervals provided more time for them to recover (Figure 4A). Daily antimicrobial treatment allowed the establishment of the resistant strain within the host and the eradication of the susceptible one (Figure 4A: bottom row). When the relative fitness of the resistant strain was low, the susceptible strain could persevere even at extremely frequent antimicrobial treatments (Figure 4A: left columns). As the resistance cost decreased, the resistant strain became more competitive and could outcompete the susceptible one even at infrequent treatments (Figure 4A: right columns). At any specific relative fitness of the resistant strain, there was a small range of antimicrobial fluctuation that allowed for the co-existence of the two strains within the host. In these cases, the interval between treatments was not long enough for the susceptible bacteria to outcompete the resistant ones, but it was adequate for them to recover and to not be completely depleted by the next antimicrobial treatment.
3.1.2. Infrequent and intense treatments eliminate the susceptible strain
A different pattern emerged in the second scenario, where the treatment’s decrease in growth rate, , was adjusted with respect to the treatment’s frequency. Here, frequent and mild treatments benefited the susceptible strain more than rare harsh treatments (Figure 4B: bottom vs. top rows). This is because, at frequent but mild antimicrobial pulses, the susceptible bacteria could outcompete the resistant ones when the resistance cost was high enough. On the other hand, infrequent harsh treatments led to the extinction of the susceptible strain, as signified the susceptible population’s decline. The resistant strain was able to establish when it had a high relative fitness (Figure 4B: top right red cells). When the resistant strain had a low fitness however, both strains got extinct (Figure 4B: top left empty cells).
In both scenarios, when antimicrobial treatment was applied periodically, there was a limited potential for strain co-existence. It was only possible to coexist under conditions that balanced the decrease in the growth rate that was inflicted on the susceptible strain by the treatment and the decreased growth rate of the resistant strain due to the fitness cost of resistance.
3.2. The outcome of between-hosts transmission
3.2.1. The immediate effect of daily bacterial transmission
The two scenarios above were scaled up from a single host to a population of hosts. The simulations were initiated with all hosts carrying equal amounts of susceptible and resistant bacteria. The case of the minority of hosts carrying the resistant strain is examined in Supplementary Figures S3, S6. When there was no transmission between the hosts, the resulting pattern in the multi-host simulations was similar to the single-host ones (Supplementary Figure S7). Daily bacterial transmission was then applied to the two scenarios of between-hosts simulations. Comparing these results with the previous simulations without transmission, we found that a wider range of conditions could now support intermediate levels of resistance and strain co-existence (Figures 4A,B vs. Figures 4C,D).
3.2.1.1. Daily bacterial transmission increased strain co-existence
In the first scenario, with fixed antimicrobial decrease of the growth rate across experiments, transmission generally benefited the resistant strain, reducing the levels of susceptibility even under conditions of high cost of resistance and infrequent treatments (Figure 4C: light blue cells). Conversely, transmission also slightly benefited the susceptible strain, which was able to persist even at conditions of lower resistance cost, where it was entirely eradicated in the absence of transmission (Figure 4C: light red cells). In the second scenario, with adjusted decrease in the growth rate across experiments, transmission very clearly benefited the susceptible strain with the prevalence of resistance declining in most experiments (Figure 4D: light blue cells). Additionally, the bacterial culture did not go extinct at harsh treatment and low relative fitness of the resistant strain (Figure 4D: left light blue cells). This happened because the daily transmission kept replenishing the susceptible bacteria within the hosts that were treated with harsh antimicrobials infrequently, allowing them to recover in the antimicrobial-free intervals. In fact, susceptibility levels were higher when the antimicrobial-free interval was longer, despite the harsher treatment (Figure 4D: top left cells).
3.2.2. The effect of different bacterial transmission frequencies
We then explored the effect of different transmission and treatment frequencies on the prevalence of resistance, keeping the relative fitness of the resistant strain fixed (Figures 5, 6). We examined cases where the cost of resistance was high, i.e., when the relative fitness of the resistant strain was only 0.4 to 0.7 of the susceptible’s (Figures 5A,B; Supplementary Figures S8A–C, S9A-C), and cases where the cost of resistance was low, which we defined as the relative fitness of the resistant strain being at 0.8 to 0.95 of the susceptible’s (Figures 5C, 6; Supplementary Figures S8D–F, S4, S9D).
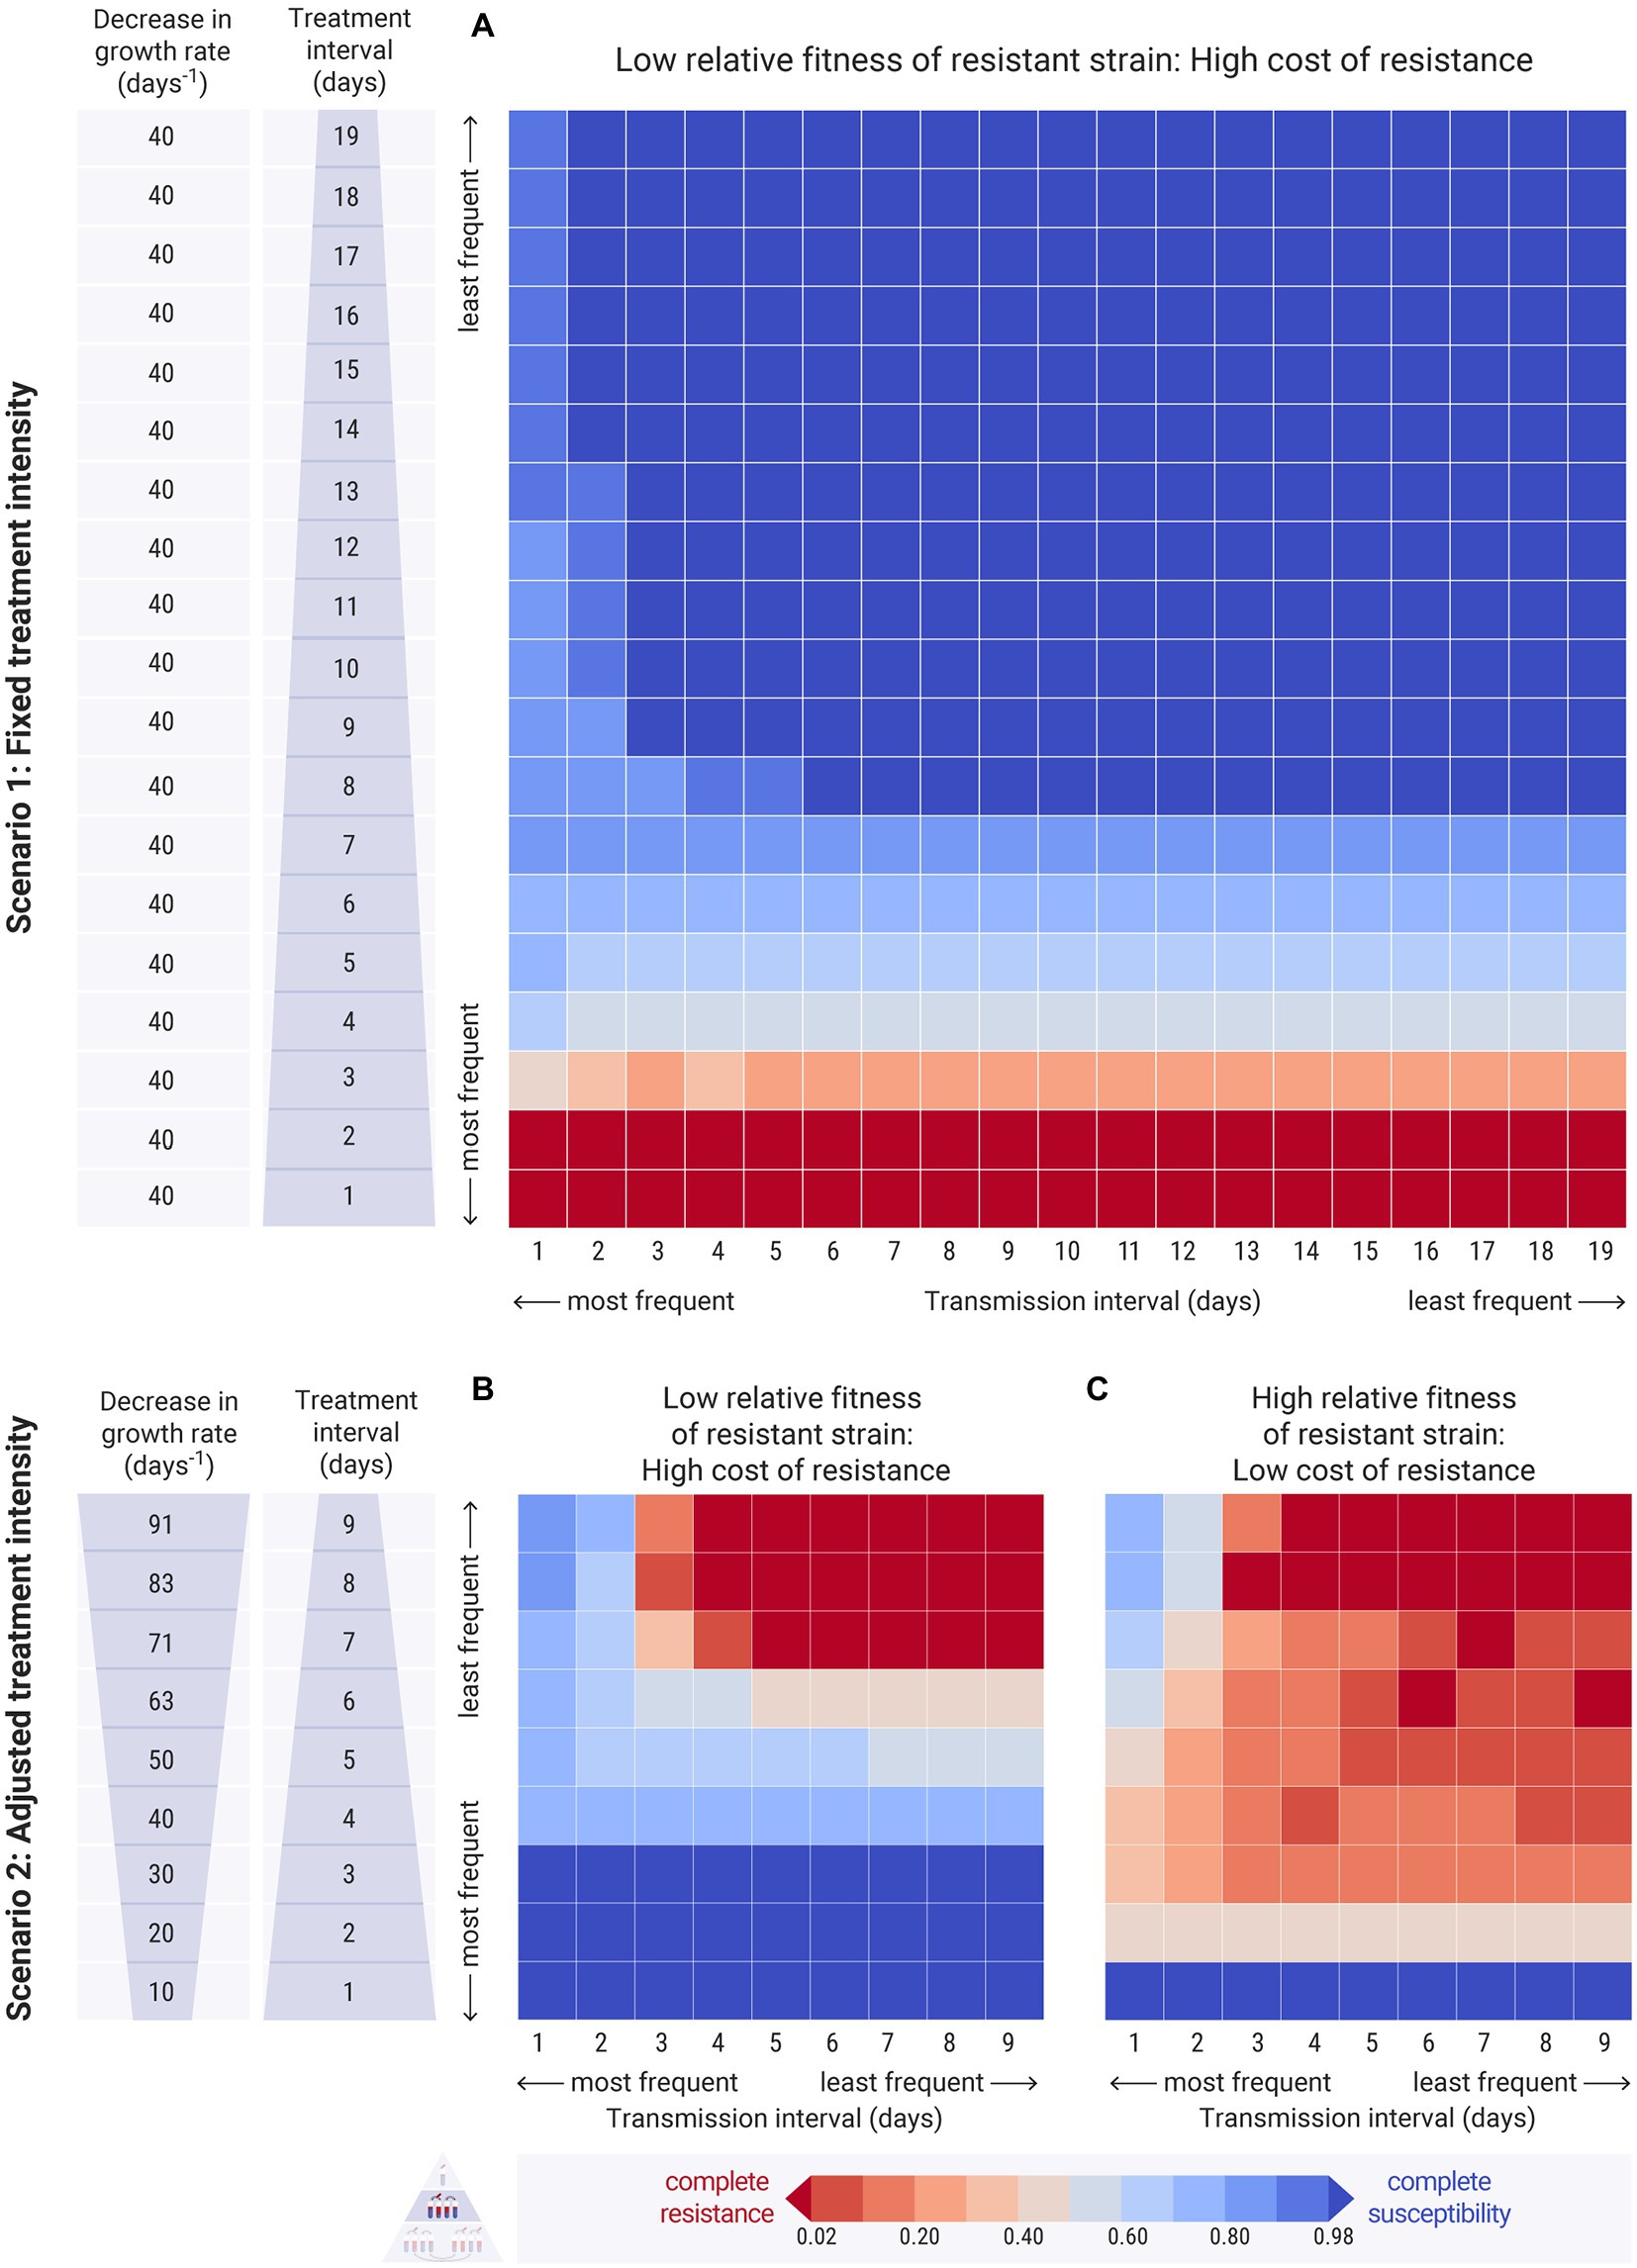
Figure 5. Results of the between-hosts simulations across different treatment intervals ( , y-axis) and transmission intervals ( , x-axis). Each cell of the heatmap represents the equilibrium values of one experiment. The colour bar represents the average equilibrium ratio of susceptible bacteria in the host population. (A) Scenario 1, where the decrease in the intrinsic growth rate due to the antimicrobial treatment is fixed across experiments at day−1. The relative fitness of the resistant strain is set to a low level, at , indicating a high cost of resistance. For the results on refer to Supplementary Figures 4, 8 (B,C) Scenario 2, where the decrease in the growth rate due to the antimicrobial, , is adjusted by the treatment interval, and takes values between 10 and 91 day−1 (see Supplementary Table S1 for calculation). (B) The relative fitness of the resistant strain is set to a low level, at , indicating a high cost of resistance. (C) The relative fitness of the resistant strain is set to a higher level, at , indicating a lower cost of resistance. For the results on different values of refer to Supplementary Figure 9.
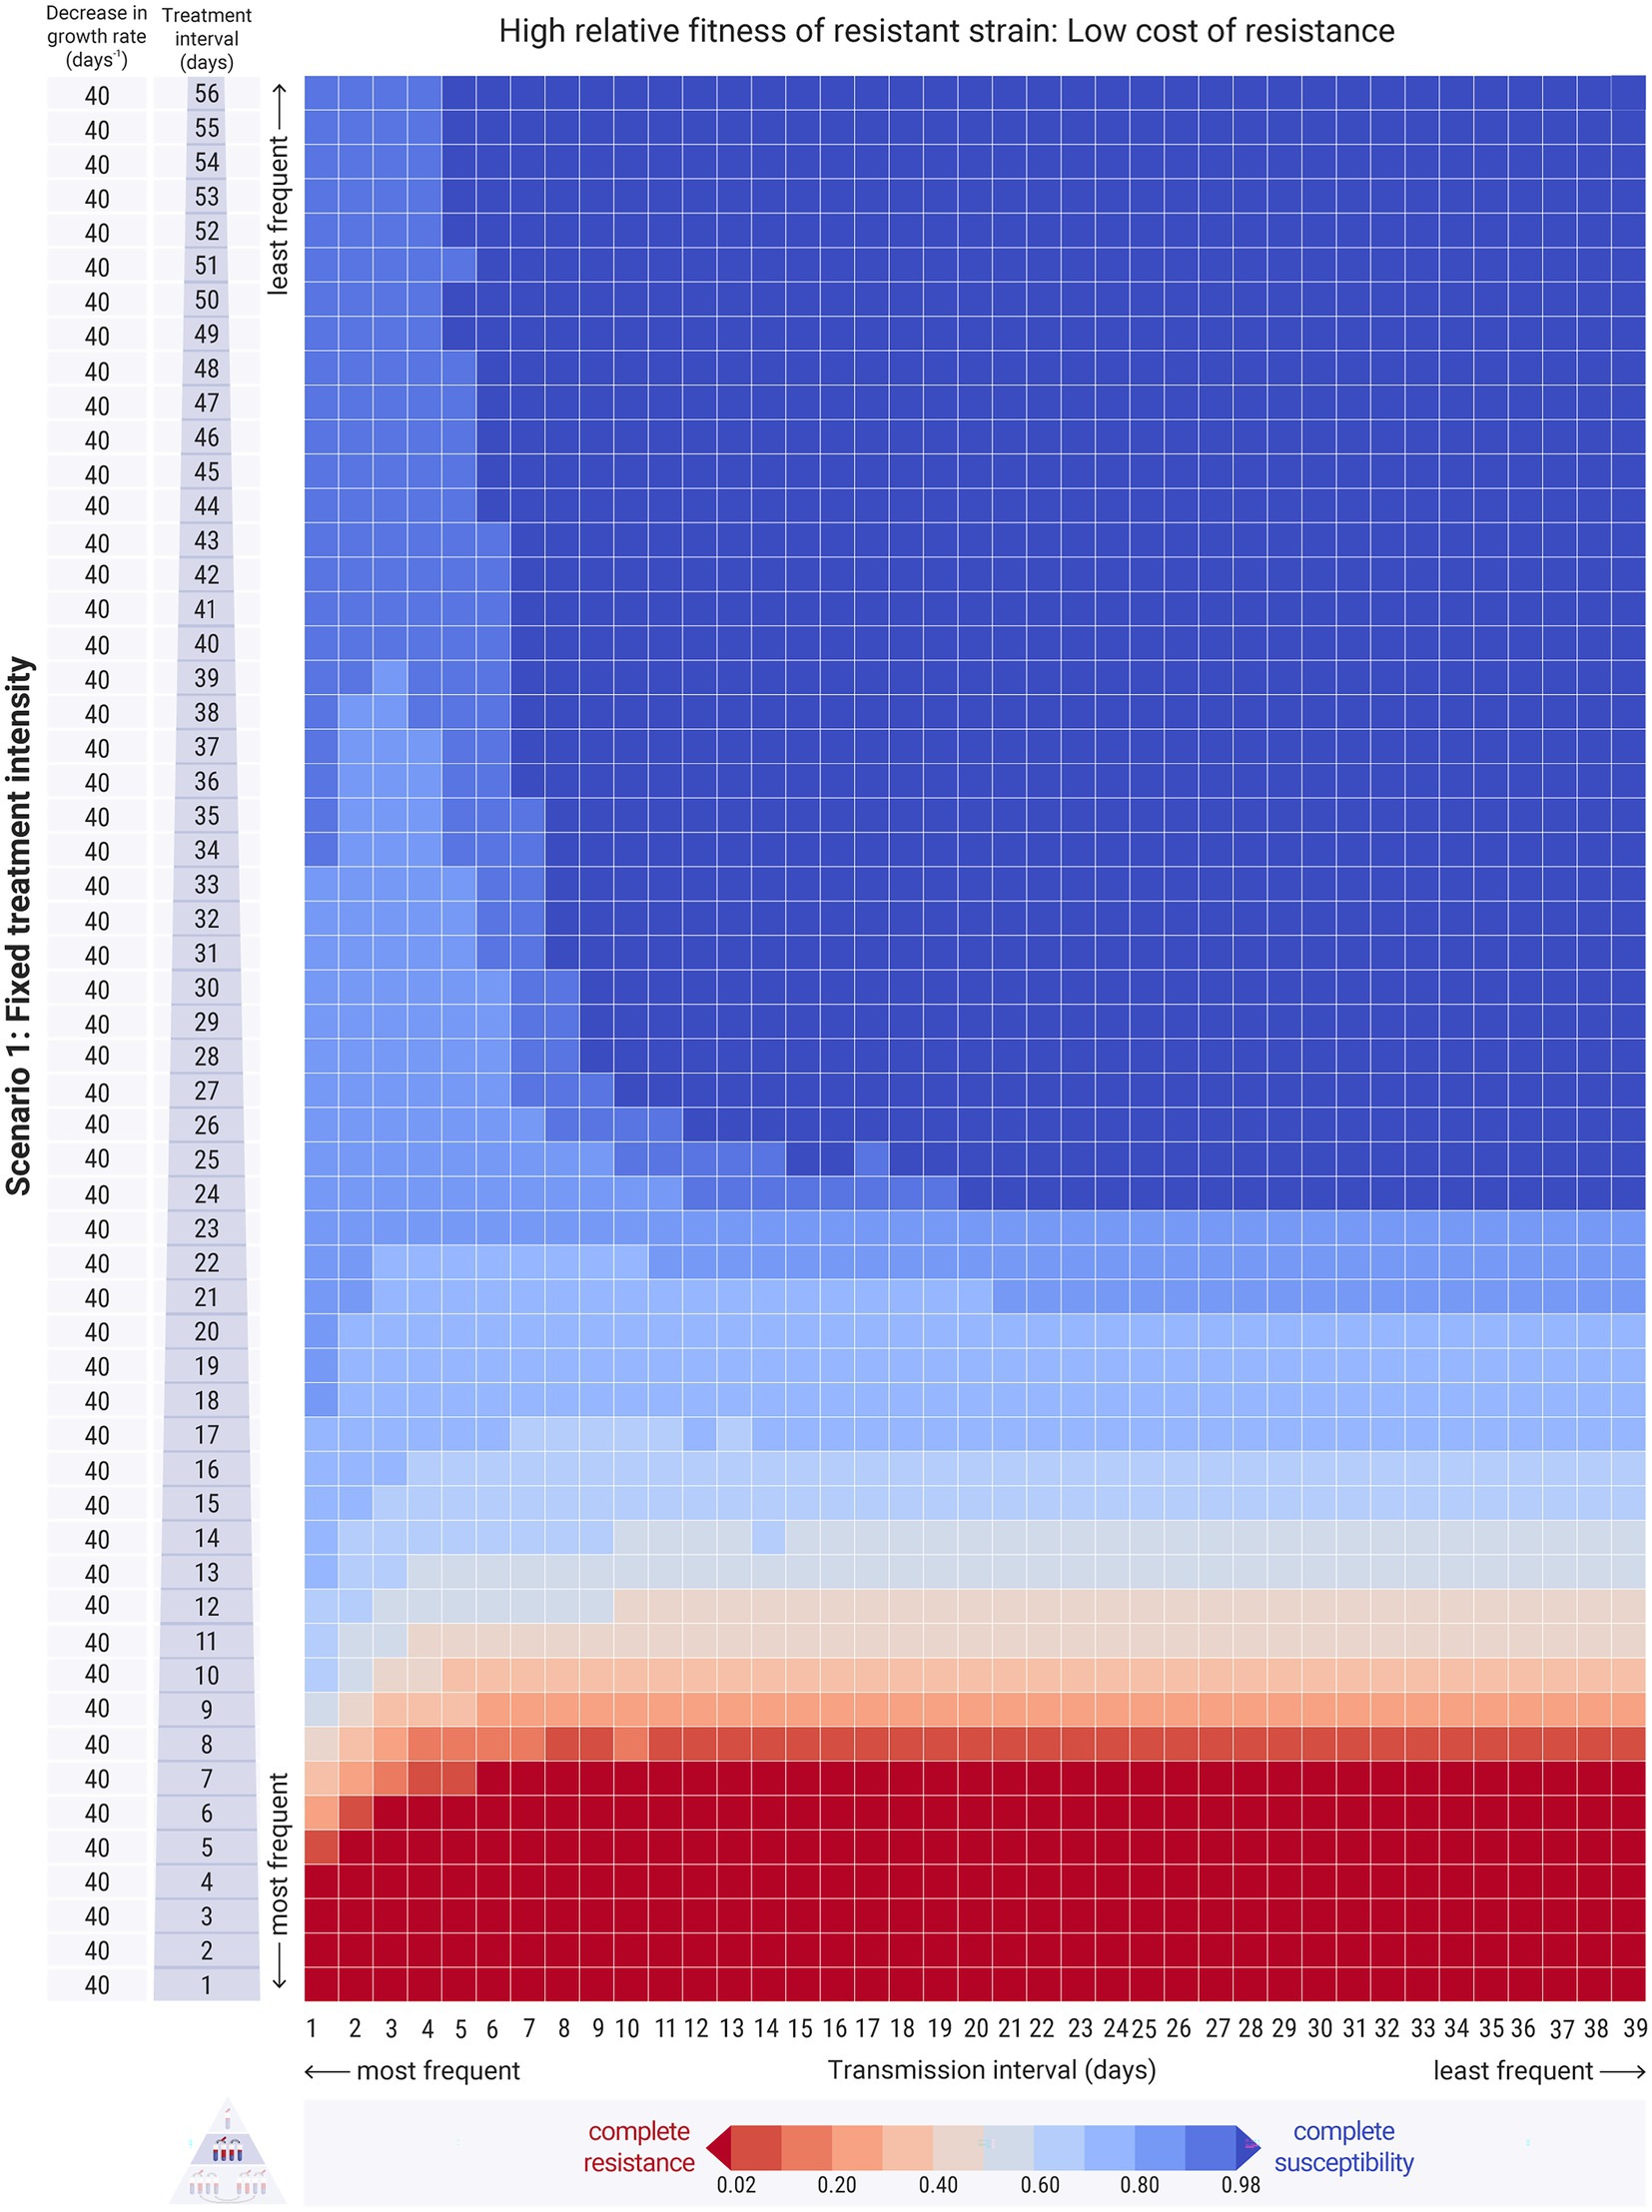
Figure 6. Results of the between-hosts simulations across different treatment intervals ( , y-axis) and transmission intervals ( , x-axis). Each cell of the heatmap represents the equilibrium values of one experiment. The colour bar represents the average equilibrium ratio of susceptible bacteria in the host population. Scenario 1, where the decrease in the intrinsic growth rate due to the antimicrobial treatment is fixed across experiments at day−1. The relative fitness of the resistant is set to strain a higher level, at , indicating a low cost of resistance. For the results on refer to Supplementary Figures 4,8.
3.2.2.1. High transmission frequency increases resistance
We begin from the first scenario of fixed antimicrobial intensity. When the relative fitness of the resistant strain was low, the resistant strain could only dominate in the host population at extremely frequent treatment levels, irrespective of transmission frequency (Figure 5A: dark red bottom rows). Transmission frequency, however, played an essential role in the persistence of resistance under less frequent treatment conditions. High transmission frequencies maintained low levels of resistance even at infrequent treatments (Figure 5A: light blue cells). Decreased transmission frequencies paired with infrequent treatment resulted in the persistence of the susceptible strain and the eradication of the resistant strain (Figure 5A: dark blue cells).
3.2.2.2. High transmission frequency may decrease resistance when cost of resistance is low
When the relative fitness of the resistant strain was high, the resistant strain entirely outcompeted the susceptible strain in most cases of relatively frequent antimicrobial treatment, as expected (Figure 6: red bottom rows). High transmission frequencies resulted in increased strain co-existence and overall intermediate levels of resistance in the host population (Figure 6: left columns). Specifically, frequent transmission led to persisting low levels of resistance even when the treatment was infrequent (Figure 6: left columns - upper cells). Interestingly, frequent transmission also facilitated the persistence of the susceptible strain even at relatively frequent treatment conditions, as it allowed its replenishment during the antimicrobial-free intervals (Figure 6: left columns - lower cells). With less frequent transmission events, susceptible bacteria were not replenished adequately, and thus resistant bacteria could outcompete them (Figure 6: right columns - lower cells). Therefore, whilst transmission did increase the spread of resistant bacteria amongst hosts, under certain conditions, it also benefited the susceptible strain. This effect was more pronounced when the mixing factor, was higher (Supplementary Figure S4).
3.2.2.3. High transmission frequency may decrease resistance at infrequent and harsh treatments
In the second scenario, with treatment intensity adjusted by frequency, we observed a similar pattern for both high and low cost of resistance (Figures 5B,C). Of course, the resistant strain is benefited when its relative fitness is high. In both cases, frequent transmission led to higher levels of susceptible bacteria compared to infrequent transmission, especially when the treatment was harsh and infrequent (Figures 5B,C: left columns - upper cells).
3.3. Between-populations transmission results in more similar resistance levels
Bacterial transmission between two host populations had an impact on the prevalence of resistance within the populations (Figure 7). As expected, when a host population that did not carry any resistant bacteria, mixed with a population with resistant bacteria, its resistance levels would rise (Figure 7A: middle panel), rendering the two populations more similar (Figure 7A: bottom panel).
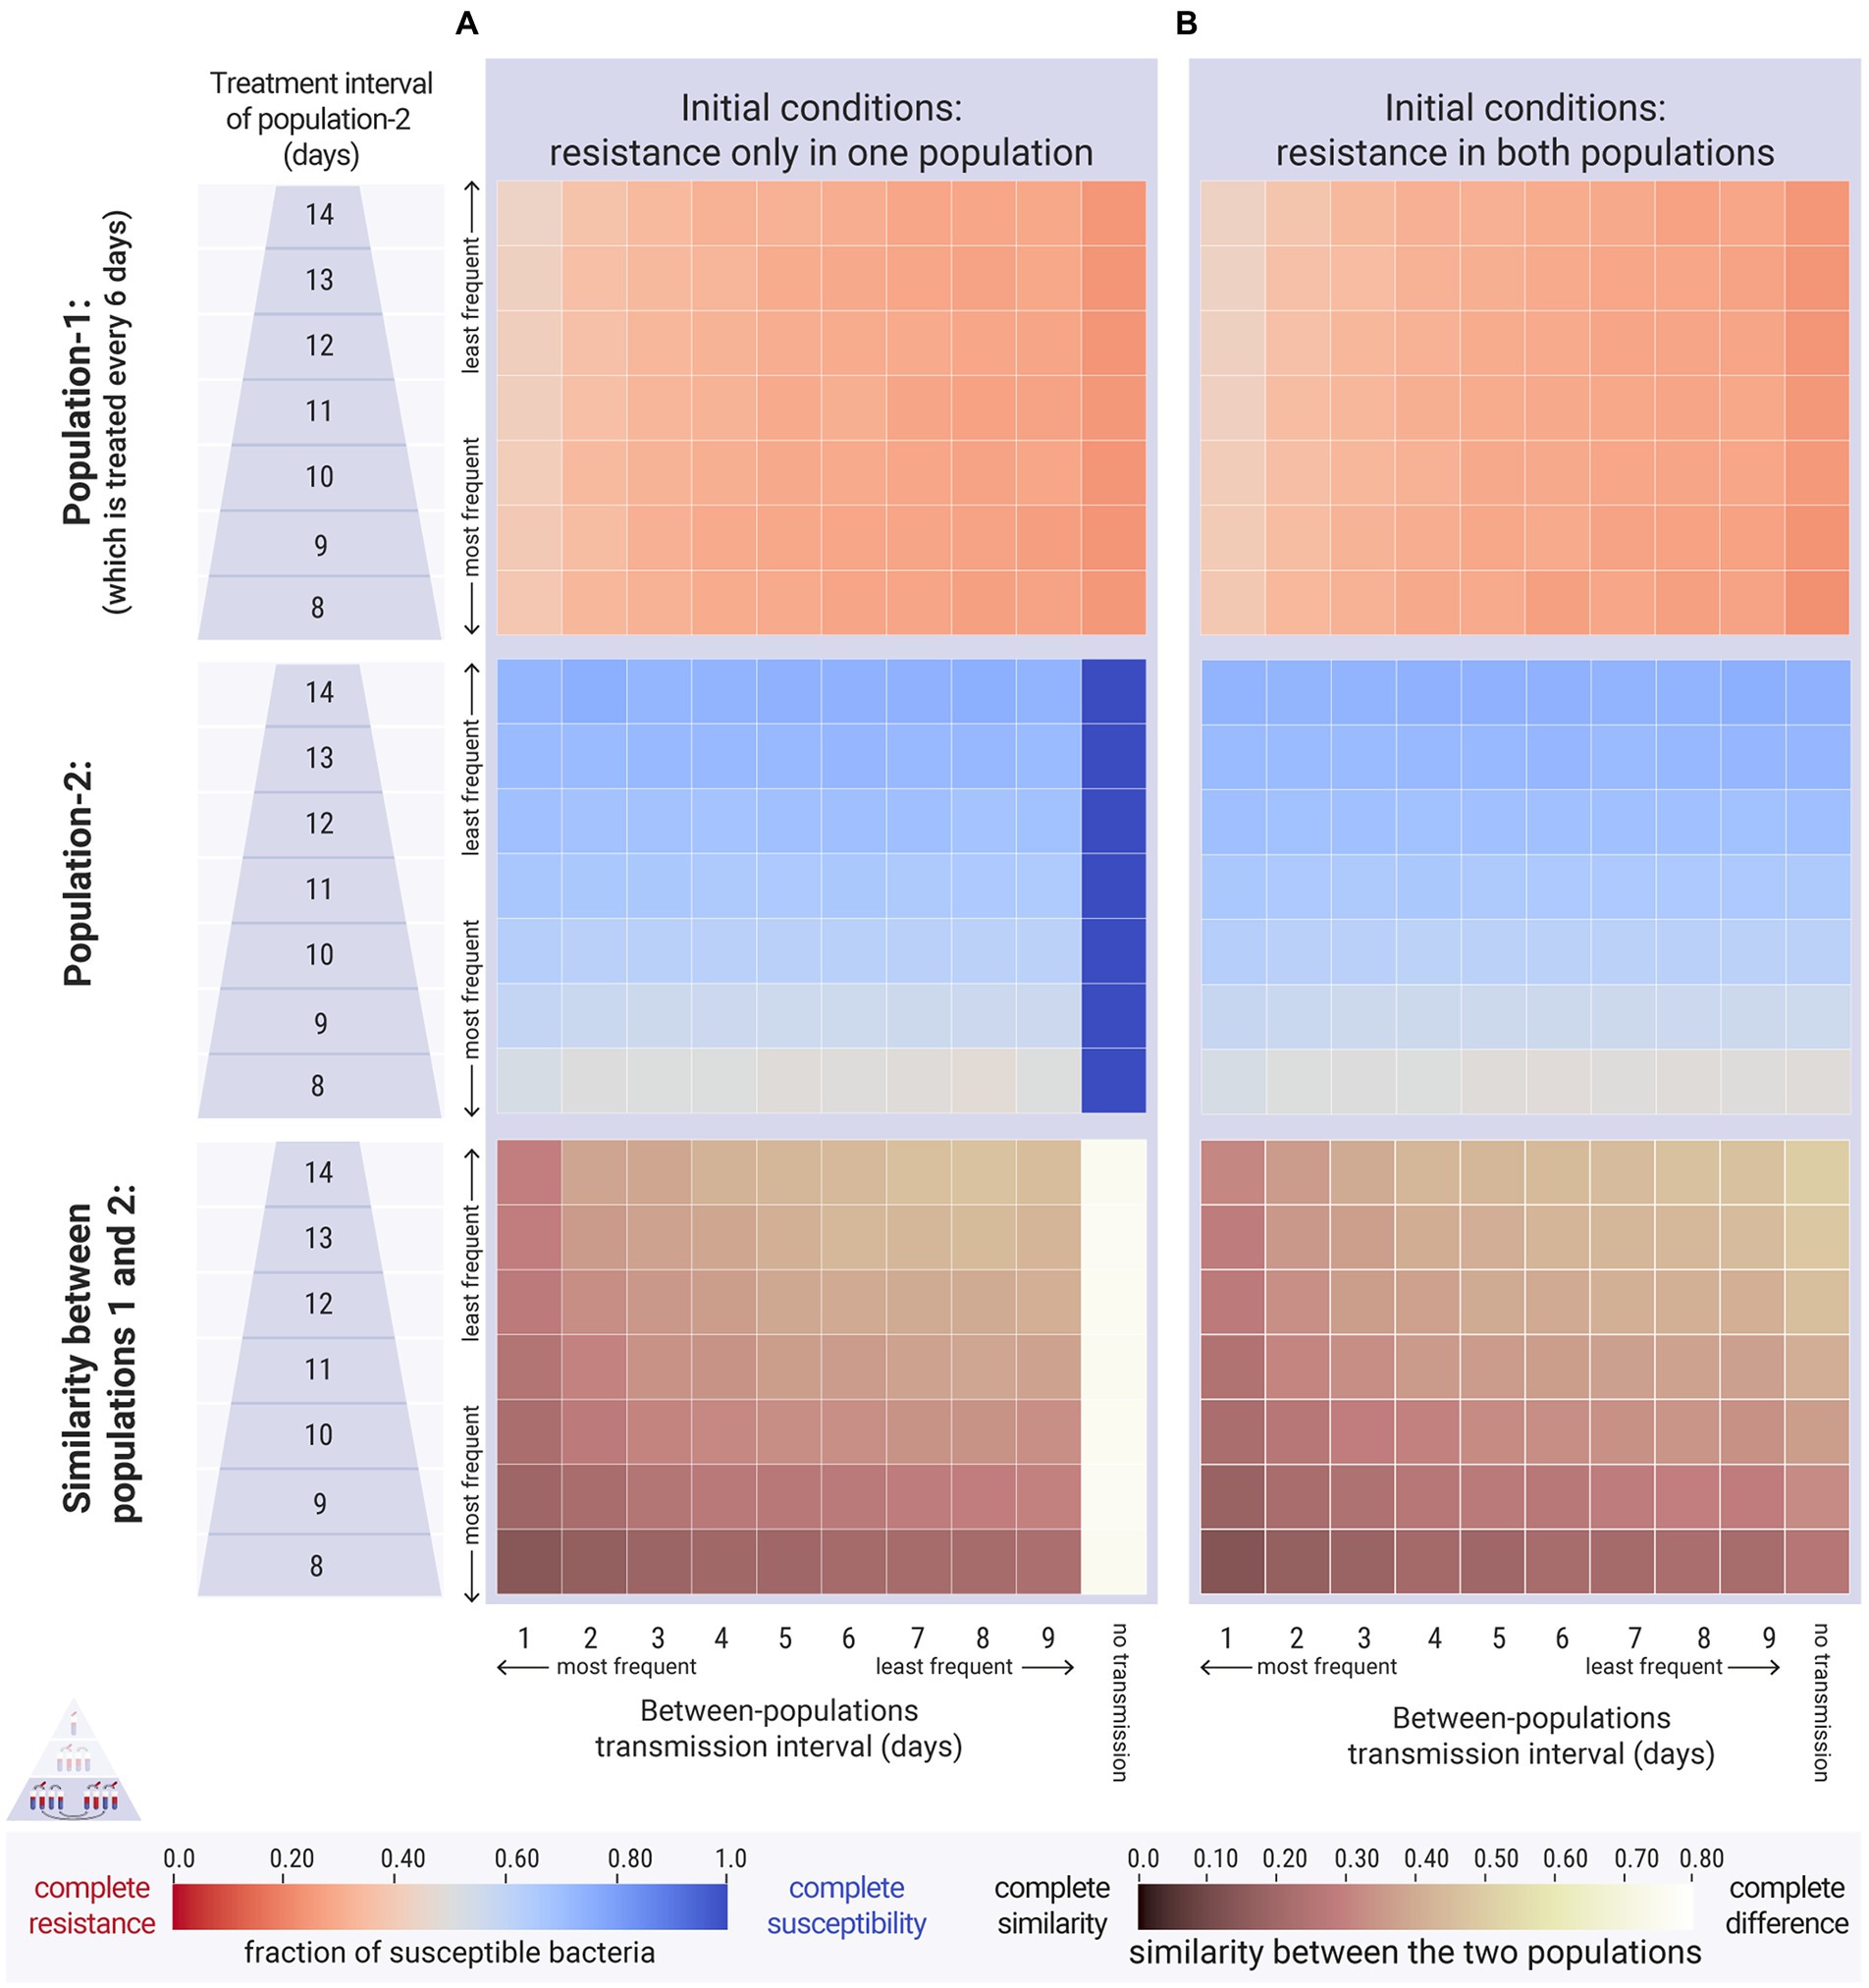
Figure 7. Results of the between-populations simulations. The first population was treated every 6 days ( days). The second population was treated less often across a range of treatment intervals ( , y-axis), ranging from 8 to 14 days. Within-population transmission was daily for both populations ( day). We vary the between-populations transmission ( , x-axis). The relative fitness of the resistant strain is set to a high level, at , indicating a low cost of resistance. Top and middle panels: each cell represents the average equilibrium ratio of susceptible bacteria in the two populations. Bottom panel: each cell represents the difference in susceptibility between the two populations. (A) Case 1, the second population did not carry resistant bacteria at the beginning of the simulations ( cfu/mL and cfu/mL). (B) Case 2, both populations carried the same amount of resistant bacteria at the beginning of the simulations (both: cfu/mL and cfu/mL).
When both host populations carried resistant bacteria, between-populations transmission also made the two populations more similar (Figure 7B: bottom panel). Surprisingly though, frequent transmission also attenuated resistance levels (Figure 7: top panels). Specifically, when a population receiving frequent antimicrobial treatments mixed with a population receiving less frequent antimicrobial treatments, the former saw a decrease in resistance levels compared to the respective scenario without any between-populations transmission. This was due to the replenishment of the susceptible reserves in the frequently treated population. No increase in resistance was observed in the infrequently treated host population due to bacterial transmission from the other host population (Figure 7B: middle panel). The spread of resistant bacteria into this host population had no impact, as they were outcompeted by the susceptible bacteria during the antimicrobial-free intervals.
4. Discussion
4.1. Temporal storage effect allows strain co-existence
Periodic antimicrobial treatment facilitates the co-existence of the susceptible and the resistant strain due to temporal niche partitioning, which creates a temporal storage effect (Chesson and Huntly, 1997). This result is in agreement with the within-host findings of Letten et al. (2021). When the niche of two strains completely overlaps, in space or time, co-existence is only possible if the two strains have exactly the same competitive ability. Otherwise, if their fitness is different, only one strain will prevail.
In antimicrobial-free conditions, the susceptible strain will outcompete the resistant, as the resistance cost lowers the resistant strain’s competitive ability. In conditions of constant antimicrobial treatment, the resistant strain will win, if the fitness of the susceptible is impacted by the excess decrease in its growth rate. Essentially, antimicrobial treatment leads to competitive release for the resistant strain (Davies et al., 2019). When antimicrobial treatment is fluctuating, the temporal variability in the conditions of the system conditions decreases the temporal niche overlap of the two strains. The susceptible bacteria profit from the antimicrobial-free intervals, and the resistant bacteria under antimicrobial treatment. The resulting temporal niche partitioning allows the two strains to coexist stably in time, whilst their population size fluctuates temporally. This co-existence, however, can only be achieved during a narrow window of treatment frequencies, in agreement with the findings of the epidemiological model in Austin et al. (1997). In the cases of infrequent harsh treatment, not only co-existence was not achieved due to the elimination of the susceptible strain, in agreement with Cobey et al. (2017), but also both strains could become extinct.
4.2. The dual effect of transmission on the prevalence of resistance
4.2.1. Frequent transmission can be beneficial to the susceptible strain
Whilst transmission should always lead to an increase in resistance in a host population according to traditional models of antimicrobial resistance (Blanquart, 2019), we show that this is not always the case. For example, transmission was beneficial to the susceptible strain under certain conditions: in the first scenario at high relative fitness of the resistant strain and relatively frequent treatments (Figure 6), and in the second scenario at relatively infrequent but harsh treatments regardless of fitness cost (Figures 5B,C). This happened because transmission events that occurred frequently during the antimicrobial-free intervals replenished the susceptible bacteria that were impacted by the treatment. Alternatively, less frequent transmission was not sufficient for the susceptible strain to recover during the antimicrobial-free intervals, and thus led to higher levels of resistance in the host population. This effect was less prominent when we examined cases of low relative fitness of the resistant strain (Figure 5A). When resistant strains are bad competitors, they require very frequent antimicrobial treatments to establish in the host population. Hence, there were not enough transmission events within the antimicrobial-free intervals for the susceptible bacteria to replenish and recover.
4.2.2. Frequent transmission overall increases strain co-existence
Despite the dual effect of transmission on the prevalence of resistance, we observe that overall the transmission of bacteria between hosts facilitates the co-colonisation of hosts by both strains, which is in agreement with Davies et al. (2019). This, on top of the fluctuating environmental conditions, further promotes the co-existence of the two strains within a host and evens out the amount of resistance in the host population. According to our results, transmission averages the level of susceptibility and resistance to the benefit of the less dominant strain. This means that, in conditions where the susceptible strain would dominate if there were no transmission, with any transmission, the resistant strain will benefit. Similarly, in conditions where the resistant strain would normally monopolise the hosts, bacterial transmission can increase its co-existence with the susceptible strain.
4.2.3. Metapopulation theory can explain the dual effect of transmission
This pattern can be explained through metapopulation theory, wherein metapopulation connectivity can lead to stock replenishment and population rescue (Brown and Kodric-Brown, 1977; Pulliam, 1988; Sarkar et al., 2020). Consider that each host carries metapopulations of the bacterial strains, and that bacterial transmission is equivalent to immigration between these metapopulations (Baquero, 2017). Under conditions of infrequent antimicrobial treatment, the less fit resistant strain could become extinct, but is rescued thanks to small fractions of resistant bacteria being transmitted from the remaining resistant strain metapopulations within other hosts. In a similar manner, when a host receives antimicrobial treatment, its susceptible population is depleted. Transmission of bacteria from another host can replenish the stock of susceptible bacteria in the original host, thereby rescuing the susceptible population, as long as it is given a chance to recover during antimicrobial-free intervals. The more frequent the transmission is, the more susceptible bacteria can be spread and replenished between treatment events.
We suggest that metapopulation rescue may adequately explain how a strain may benefit from bacterial transmission when it is rarer in the population. Davies et al. (2019) attribute this pattern solely to negative frequency-dependent selection, which is a type of balancing selection whereby a strain profits more by colonising hosts in which it is rare, which could be a complementary mechanism outside the scope of our study.
4.3. Sharing antimicrobial treatments may increase resistance levels
When we simulated experiments of the first scenario (fixed decrease in growth rate) we compared host populations with different frequencies of antimicrobial use. There it was clear that the more infrequent the antimicrobial use, the less the resistance in the host population. In the second scenario, however, we adjusted the harshness of treatment by its frequency. Extrapolating from the treatment frequency, we may calculate how many hosts were treated per day of the experiment (Supplementary Table S1). For example, for a simulation with duration of 100 days and a population of 100 hosts, a daily treatment ( day) would mean that 100 hosts are treated every day, whereas less frequent treatment corresponds to less hosts getting treated per day (e.g., for days, only 50 hosts per day). Thus, in the second scenario, more hosts were treated per day when the treatment intensity was mild, and the fewest hosts were treated per day when the treatment was harsh. Experiments with frequent mild treatments could represent populations where hosts do not adhere to their treatment plan, sharing their antibiotics with their community and thus decreasing their effectiveness. Similarly, experiments with rarer harsh treatments may represent populations where hosts do not share their antibiotics and adhere to the full treatment.
We can thus re-examine Figure 4D under this new lens. When the relative fitness of the resistant strain is low, the mild frequent treatments do not give enough of an evolutionary advantage for the resistant strain to persist (Figure 4D: bottom rows - dark blue cells). Intermediate sharing of antimicrobials had the worst outcome in our results, for each examined fitness cost. No sharing of antimicrobials, where few hosts take the harshest treatment, led to lower amounts of resistance (Figure 4D: top rows). Both cases, i.e., antibiotics being shared or taken as prescribed, resulted in better outcomes at higher transmission frequencies (Figures 5B, C). When antimicrobial treatments were not shared between hosts, even less frequent transmission events were adequate to replenish the susceptible bacterial populations. At intermediate levels of sharing, more frequent transmission events were required for the same result. Overall, high levels of antibiotic sharing can lead to full resistance if the fitness of the resistant strain is high, whereas taking antibiotics as prescribed (not shared) leads to much lower amounts of resistance in the population.
4.4. Transmission of established resistant strains between populations may be inconsequential
Our findings showed that when two host populations mix with each other, their levels of resistance become more similar, in agreement with the modelling and empirical results by Olesen et al. (2020) (Figures 7A,B: bottom panels). The reason behind the increased similarity, however, is different between ours and Olesen’s simulation results. In Olesen et al. (2020), the levels of resistance became more average for both populations: their control population (higher antimicrobial use) saw a decrease in resistance after mixing with the intervened population (lower antimicrobial use), and the intervened population saw an increase in resistance due to mixing with the control. On the other hand, our results suggest that the two populations became more similar because the prevalence of resistance was attenuated in the population that received more frequent antimicrobial treatment. The other population, which received less frequent treatment, was not affected negatively (Figure 7B: middle panel). These findings indicate that if a resistant strain is already present in a host population with low antimicrobial use, external input of the same strain from other host populations would not lead to a further increase. This is because the metapopulations of resistant bacteria in the host population that receives less treatment act as ‘sinks’ (Pulliam, 1988), and the supply of external resistant bacteria is never sufficient to rescue them (Blanquart, 2019). Of course, in the case where a new resistant strain is transmitted to a host population, then this population would naturally undergo an increase in the prevalence of resistance and in the co-existence of the two strains (Figure 7A: middle panel) which is in agreement with modelling studies on structured populations (e.g., Smith et al., 2004; Cobey et al., 2017; Blanquart et al., 2018; Krieger et al., 2020).
4.5. Translation to a more practical timescale and applicability to real-word cases
We examined a large range of frequencies of antimicrobial treatment and transmission events. To evaluate which parameters are relevant to a more realistic depiction of a host population, it is necessary to translate the model laboratory timescale into a more practical microbiome and bacterial community timescale. In a laboratory experiment, and thus in our simulations, a daily passage with 10−3 dilution results in 10 E. coli generations per day. On the other hand, human gut bacteria are renewed approximately every 40 h, i.e., one generation every 1.7 days, or 214 generations per year (Levin et al., 1997). Therefore, 1 day in the model would correspond to 17 days in microbiome time.
The average person receives antimicrobial treatment twice a year (Levin et al., 1997). For example, the total human consumption of antimicrobials in Denmark in 2011 was 19 DID (Defined Daily Dose per 1,000 inhabitants), which corresponds to 19 DDD / 1,000 inhabitants 365 days = 7 doses per year ≈ 2 treatments per person per year, and in 2020 it was 14 DID, which corresponds to approximately 1.5 treatments per person per year (Duarte et al., 2020). With two antimicrobial treatments per year, the gut bacterial community would be treated every 107 generations. Translating this back to the laboratory timescale in the simulation, the host should be treated with antibiotics every 11 days to imitate human consumption (Supplementary Table S1). If we were to examine the consumption of a single antimicrobial agent, then the treatment would be even more infrequent. For example, in 2020, penicillin consumption was 8.14 DID, corresponding to approximately 1 treatment per year per person, and thus every 22 days in the simulations (Duarte et al., 2020).
It is important to note that due to the structure of the model, it was only possible for the hosts to transmit bacteria at the end of their daily growth cycle. Therefore, a daily E. coli mixing in the simulation would correspond to bacterial transmission every 17 days, which is unrealistically infrequent. Whilst this does not change the conclusions of our study, it is possible that if more frequent transmission was possible, the dual effect of transmission would become even more pronounced.
By focusing on the appropriate range of treatment frequency in the model, for example between every 10 and 30 days, we can see that the dual effect of transmission remains relevant (Figure 6). When the relative fitness of the resistant strain is low (high cost of resistance), frequent transmission events lead to the co-existence of the two strains in the population; thus, measures that could ensure infrequent transmission (e.g., better sanitation), could facilitate the persistence of the susceptible strain. On the other hand, when the relative fitness of the resistant strain is high (low cost of resistance), frequent microbial transmission could ensure lower levels of resistance in the population. Therefore, depending on the fitness of the strains and the antimicrobial use conditions, microbial transmission between hosts can have two separate effects, which should be taken into account for future interventions against the spread of resistance determinants.
Finally, in this study, we evaluated the prevalence of resistance after the system has reached equilibrium. The duration of the transient phase would undoubtedly be of interest, especially when estimating how fast a new strain can invade a population or how fast an intervention will show results. Unfortunately, we cannot make quantitative predictions on the timeline of transmission spread. This is partly because the frequency and magnitude of transmission are difficult to parameterise accurately. Additionally, the transient period depends on the specific initial prevalence conditions of each host population. Even with observational data, it is difficult to determine these conditions or whether a host population is already in equilibrium, especially in the case of commensal strains. Nevertheless, our findings qualitatively indicate that when transmission is high, either in frequency, in mixing bacterial amounts or in number of transmitting hosts, the transient time is shorter.
4.6. Model limitations
Modelling simulations aim to capture the main processes and dynamics of a system, and thus they represent a simplified version of reality and are developed based on certain assumptions. We simplified the microbiome of the host down to a two strain model, in order to focus on the three target processes, namely antimicrobial use, strain fitness and bacteria transmission. We chose to model the system as a batch culture competition experiment for the potential of a future in vitro validation of the simulation results, which is an identified challenge in the field (Blanquart, 2019). We did not adopt the ‘host as a chemostat’ set-up of Letten et al. (2021), as it would be strenuous to scale for a population of hosts in the laboratory, but we recognise that it could be more realistic.
For the simulation of the experiments, we assumed that the cultures are kept in ideal-growth conditions and that E. coli growth will follow the logistic function. The model is based on resistance being conferred by a chromosomal mutation, already existing in the resistant strain. It does not allow for new chromosomal mutations that could appear under sub-inhibitory antimicrobial levels and or evolutionary bottleneck effects due to the serial passage (e.g., Wahl and Gerrish, 2001; Marrec and Bitbol, 2018, 2020; Bansept et al., 2019; Alexander and MacLean, 2020). The stochastic evolutionary bottlenecks are undoubtedly important when rare resistant mutations arise and when within-host dynamics are explored. In our case, such bottlenecks would not impact the resulting patterns of resistance, as we focus on an already established resistant strain and we present the average results of the host population (and not of individual hosts) across multiple days after the equilibrium. The models also does not account for horizontal exchange of mobile genetic elements that confer resistance.
Finally, it is assumed that resistance confers a fitness cost, but that bacterial transmission bears no cost, and it always leads to host invasion and colonisation. The process of bacterial transmission is simplified down to a bacterial mixing between hosts, and it does not discriminate between direct host contact, or environmental, food-borne, or vector-borne transmission of the hosts’ microbiome. Despite the limitations, our model achieved our aim to explore how the three target parameters (antimicrobial frequency, bacterial transmission, and relative fitness of the resistant strain) affect the prevalence of antimicrobial resistance.
4.7. Relevance of the modelling results
In this study, we focus on the dynamics of two commensal strains of bacteria that represent the commensal microbiome. The effect of transmission of commensal bacteria on the levels of resistance in host populations has not been adequately explored in the literature, as only few modelling studies explicitly focus on commensal strains (e.g., Austin et al., 1997; Davies et al., 2019; Letten et al., 2021) or on facultative pathogens (e.g., Levin et al., 1997; Blanquart et al., 2018). This is noteworthy, because the measure of success of the outcome of the treatment differs: when the strains are commensal, achieving a high ratio of susceptible bacteria in the host population is positive. In contrast, when the modelled strains are pathogenic and can cause infection, the decline or elimination of both strains before resistance emerges is the ultimate goal (e.g., Marrec and Bitbol, 2018, 2020; Bansept et al., 2019). To achieve this, lethal concentrations of the antimicrobial agents are used that may completely eradicate (or stop the growth of) the susceptible pathogenic strain in a host (e.g., Massad et al., 1993; Austin et al., 1997 (commensal bacteria); Levin et al., 1997 (commensal bacteria); Bonhoeffer et al., 1997; Cobey et al., 2017; Marrec and Bitbol, 2018, 2020; Bansept et al., 2019; Davies et al., 2019 (commensal bacteria)). A few models also explore the effect of sub-inhibitory concentrations of the antimicrobial agent aiming to measure the selection for rare newly emerged resistant mutants (e.g., Marrec and Bitbol, 2020). This differs from our choice to use sub-inhibitory antimicrobial concentrations to mimic the bystander effect of the commensal microbiome, which allows the susceptible strain populations to recover.
As the between-hosts models on pathogenic bacteria aim to treat the infected/colonised patients, they selectively treat the hosts that carry the strains (e.g., Massad et al., 1993; Bonhoeffer et al., 1997; Bansept et al., 2019). Some of these models also explore the possibility of asymptomatic infection that does not receive treatment (e.g., Bansept et al., 2019). In our case, the treatment frequency is completely independent of the carriage of the two commensal strains (e.g., Austin et al., 1997; Cobey et al., 2017; Blanquart et al., 2018). On a similar note, many of the models on pathogenic bacteria include host immunity after an infection/vaccination, which consequently limits strain transmission (e.g., Bansept et al., 2019). As we focus on commensal strains, we do not include any effect of immunity in the simulations.
The modelling of resistance in commensal bacteria requires the consideration of both the susceptible and the resistant strains. This was not always the case, as the first epidemiological models, often in hospital settings, did not account for the existence of susceptible strains and considered the hosts either colonised with the resistant strain or un-colonised (e.g., Austin et al., 1999a,b). When it was clear from observational population data that there is a stable co-existence of susceptible and resistant pathogenic strains in human populations, there were efforts to capture it in models (see Blanquart, 2019 for review). Whilst including both strains, earlier models did not allow the co-colonisation of the host by both strains (e.g., Massad et al., 1993; Austin et al., 1997; Bonhoeffer et al., 1997). Models that did allow the co-colonisation of the host often did not conserve structural neutrality (e.g., Cobey et al., 2017), a concept developed by Lipsitch et al. (2009) (e.g., Colijn et al., 2010; Davies et al., 2019). In our model, we allow the co-colonisation of hosts by the two strains and re-colonisation of a host with the same strain, as we conserve structural neutrality.
Because of these differences, our results provide new insights on the selection for resistance in host populations due to the transmission of commensal bacteria. Whilst antimicrobial use is the leading driver of resistance prevalence, the interplay between strain fitness and bacterial transmission affects the levels of resistance in a non-linear, and often counterintuitive, manner. We show that co-existence can be maintained by two complementary mechanisms. On the one hand, periodic antimicrobial treatment can support a narrow window of within-host co-existence of the susceptible and resistant strains due to temporal niche partitioning. Thus, we confirm the result in Letten et al. (2021), and we show that it is applicable for both scenarios of antimicrobial treatment (fixed vs. adjusted decrease in growth rate). On the other hand, the level of co-existence greatly expands when we introduce transmission in a population of hosts, confirming the results in Cobey et al. (2017) and Davies et al. (2019). We then look deeper into this process, and we demonstrate the dual effect of transmission on the levels of resistance. Bacterial transmission can increase the level of resistance in the population; yet, high transmission frequencies may decrease the levels of resistance through the spread of the commensal susceptible bacteria. Thus, we conclude that transmission facilitates the least abundant strain due to strain metapopulation dynamics. Finally, by expanding this to a between-populations framework, we provide an additional mechanism to Olesen et al. (2020), on why populations that transmit bacteria with each other exhibit a higher similarity in their resistance prevalence.
4.8. Applicability of the model for in vitro transmission experiments
Whilst the topic of antimicrobial resistance transmission has been explored theoretically in previous mathematical models, validation of the results is lagging (Blanquart, 2019). The effects of transmission on resistance levels are quite challenging to interpret in observational studies of populations, due to the multitude of confounding factors (Meuli and Dick, 2018). Additionally, the majority of data on the prevalence of resistance concerns the monitoring of resistant pathogenic or facultative pathogenic strains when they cause infection, and not of resistance in the commensal microbiome. Thus only the pathogenic resistant strain data are available for model validation (e.g., Austin et al., 1999a,b; Blanquart et al., 2017), and are used to validate even models of commensal strains (e.g., Blanquart et al., 2018; Davies et al., 2019; Olesen et al., 2020). This is why experimental data with controlled variables could be a valuable first step in validating the theoretical models. Indeed, in vitro validation has been possible for many within-host models (e.g., Alexander and MacLean, 2020; Frenkel et al., 2021); yet, this is not the case for between-host models. It is laborious, time-consuming and expensive to reproduce a population of hosts in the laboratory, and therefore it is critical to establish the range of values that should be explored (or not) for each parameter beforehand.
Thus, the motivation behind our study was to develop a model that would permit validation of the results, with the intension to identify the relevant parameter space for the in vitro experiments. The simulations allowed us to design an experimental set-up to achieve the optimal balance between validating the in silico equilibrium results of the current study whilst decreasing the manual labour. For example, we have established that we can get adequate results by running the in vitro experiments for 15 days with a population of 10 hosts, with initial conditions of 50% resistant and 50% susceptible bacteria (data not included). Then, knowing the relative fitness of the chosen E. coli strains (Marcusson et al., 2009), the simulations of our model have allowed us to choose the appropriate frequencies of treatment and of transmission to be examined in vitro.
Antimicrobial resistance is an urgent threat for human and animal health and it is important to provide efficient guidance for interventions that can efficiently reduce resistance other than simply reducing antimicrobial use (Aarestrup, 2012; Boeckel et al., 2017). Reducing transmission is seen as an important intervention through epidemiological, modelling and practical studies (Hendriksen et al., 2019). However, to ensure acceptance and predict the efficacy of such measures it is important to know whether any reduction in transmission will lead to a linear reduction of antimicrobial resistance or whether there are certain tipping points. Since it is not practically feasible to explore this through large-scale epidemiological studies, we choose to study this through a modelling approach that can subsequently be verified with laboratory experiments and animal models before eventually being tested under real-life conditions.
4.9. Future directions
Mathematical models and in vitro experiments are simplified versions of reality. Therefore, the next step would be to explore whether our conclusions can be verified experimentally in simple animal populations, such as social insects that transmit bacteria to their nestmates (Sarkar et al., 2020). It is possible that observational studies of livestock animals (Sapountzis et al., 2021) in countries with well-regulated antimicrobial prescriptions (e.g., Denmark, Duarte et al., 2020) would provide some further clarity on how commensal microbial transmission may select for resistance. Finally, after confirming the main drivers behind the selection for resistance, we could validate the conclusions on a human population level using data from global sewage surveillance studies (Hendriksen et al., 2019) or other microbiome studies (Bengtsson-Palme et al., 2015). For all these cases, metagenomics analyses are required in order to detect resistance genes and to identify the members of the bacterial communities (Bengtsson-Palme et al., 2017). Thus, it would be beneficial if subsequent mathematical models would take into account an additional level of complexity, namely the transmission of antimicrobial resistance genes (Baquero, 2017; Bengtsson-Palme et al., 2021). At this level, more realistic models can be developed to include multiple strains, the possibility of de novo mutations and horizontal gene transfer, as well as environmental disturbances, to evaluate how such factors may contribute to the prevalence of resistance and the diversity of resistance genes.
Data availability statement
The original contributions presented in the study are publicly available. This data can be found here: Amalia Bogri, Saria Otani, Frank M Aarestrup, and Christian Brinch. (2023). Interplay between strain fitness and transmission frequency determines prevalence of antimicrobial resistance [Data set]. https://doi.org/10.3389/fevo.2023.981377, https://zenodo.org/record/7643226#.Y-zT1HbP1PZ.
Author contributions
AB, SO, FA, and CB contributed to conception and design of the study. AB developed the model, carried out the analyses, created the visualizations and the figures, and wrote the manuscript. CB contributed to the model development and analysis. SO, FA, and CB commented on the manuscript. All authors contributed to manuscript revision, read, and approved the submitted version.
Funding
The work is supported by The Novo Nordisk Foundation (NNF16OC0021856: Global Surveillance of Antimicrobial Resistance).
Acknowledgments
We are grateful to the reviewers for their comments and suggestions to improve the manuscript.
Conflict of interest
The authors declare that the research was conducted in the absence of any commercial or financial relationships that could be construed as a potential conflict of interest.
Publisher’s note
All claims expressed in this article are solely those of the authors and do not necessarily represent those of their affiliated organizations, or those of the publisher, the editors and the reviewers. Any product that may be evaluated in this article, or claim that may be made by its manufacturer, is not guaranteed or endorsed by the publisher.
Supplementary material
The Supplementary material for this article can be found online at: https://www.frontiersin.org/articles/10.3389/fevo.2023.981377/full#supplementary-material
SUPPLEMENTARY TABLE S1
Contains conversions between simulation timescale and ‘microbiome’ timescale, explanation of the antimicrobial decrease in the growth rate values for Scenario 1 and 2, and estimation of the number of treated hosts.
SUPPLEMENTARY TABLE S2
Contains a summary of the values used for all the simulations included in this study.
SUPPLEMENTARY FIGURES 1-9
Illustrating additional analyses and brief explanations of their results.
SUPPLEMENTARY CODE
Contains an example of the script we created in Python (Jupyter Notebook). The example comes from figure 5A.
References
Alexander, H. K., and MacLean, R. C. (2020). Stochastic bacterial population dynamics restrict the establishment of antibiotic resistance from single cells. P. Natl. Acad. Sci. U. S. A. 117, 19455–19464. doi: 10.1073/pnas.1919672117
Andersson, D. I., and Hughes, D. (2010). Antibiotic resistance and its cost: is it possible to reverse resistance? Nat. Rev. Microbiol. 8, 260–271. doi: 10.1038/nrmicro2319
Andersson, D. I., and Hughes, D. (2014). Microbiological effects of sublethal levels of antibiotics. Nat. Rev. Microbiol. 12, 465–478. doi: 10.1038/nrmicro3270
Andersson, D. I., Patin, S. M., Nilsson, A. I., and Kugelberg, E. (2020). The biological cost of antibiotic resistance “Enzyme-mediated Resistance to Antibiotics ” John Wiley & Sons, Ltd.; Hoboken, NJ, 339–348.
Antimicrobial Resistance CollaboratorsMurray, C. J., Ikuta, K. S., Sharara, F., Swetschinski, L., Aguilar, G. R., et al. (2022). Global burden of bacterial antimicrobial resistance in 2019: a systematic analysis. Lancet 399, 629–655. doi: 10.1016/s0140-6736(21)02724-0
Austin, D. J., and Anderson, R. M. (1999). Studies of antibiotic resistance within the patient, hospitals and the community using simple mathematical models. Philos. Trans. R. Soc. Lond. B Biol. Sci. 354, 721–738. doi: 10.1098/rstb.1999.0425
Austin, D. J., Bonten, M. J. M., Weinstein, R. A., Slaughter, S., and Anderson, R. M. (1999a). Vancomycin-resistant enterococci in intensive-care hospital settings: transmission dynamics, persistence, and the impact of infection control programs. Proc. Natl. Acad. Sci. 96, 6908–6913. doi: 10.1073/pnas.96.12.6908
Austin, D. J., Kakehashi, M., and Anderson, R. M. (1997). The transmission dynamics of antibiotic resistant bacteria: the relationship between resistance in commensal organisms and antibiotic consumption. Proc. R. Soc. Lond. B. Biol. Sci. 264, 1629–1638. doi: 10.1098/rspb.1997.0227
Austin, D. J., Kristinsson, K. G., and Anderson, R. M. (1999b). The relationship between the volume of antimicrobial consumption in human communities and the frequency of resistance. Proc. Natl. Acad. Sci. 96, 1152–1156. doi: 10.1073/pnas.96.3.1152
Bansept, F., Marrec, L., Bitbol, A., and Loverdo, C. (2019). Antibody-mediated crosslinking of gut bacteria hinders the spread of antibiotic resistance. Evolution 73, 1077–1088. doi: 10.1111/evo.13730
Baquero, F. (2017). Transmission as a basic process in microbial biology. Lwoff award prize lecture. FEMS Microbiol. Rev. 41, 816–827. doi: 10.1093/femsre/fux042
Bengtsson-Palme, J., Angelin, M., Huss, M., Kjellqvist, S., Kristiansson, E., Palmgren, H., et al. (2015). The human gut microbiome as a transporter of antibiotic resistance genes between continents. Antimicrob. Agents Chemoth. 59, 6551–6560. doi: 10.1128/aac.00933-15
Bengtsson-Palme, J., Jonsson, V., and Heß, S. (2021). What is the role of the environment in the emergence of novel antibiotic resistance genes? A modeling approach. Environ. Sci. Technol. 55, 15734–15743. doi: 10.1021/acs.est.1c02977
Bengtsson-Palme, J., Larsson, D. G. J., and Kristiansson, E. (2017). Using metagenomics to investigate human and environmental resistomes. J. Antimicrob. Chemoth. 72, 2690–2703. doi: 10.1093/jac/dkx199
Berryhill, B. A., Gil-Gil, T., Manuel, J. A., Smith, A. P., Margollis, E., Baquero, F., et al. (2022). What’s the matter with MICs: the contribution of nutrients and limiting resources to the pharmacodynamics of antibiotics and bacteria. bioRxiv. [Preprint]. doi: 10.1101/2022.09.30.510422
Blanquart, F. (2019). Evolutionary epidemiology models to predict the dynamics of antibiotic resistance. Evol. Appl. 12, 365–383. doi: 10.1111/eva.12753
Blanquart, F., Lehtinen, S., and Fraser, C. (2017). An evolutionary model to predict the frequency of antibiotic resistance under seasonal antibiotic use, and an application to Streptococcus pneumoniae. Proc. R. Soc. B. Bio. Sci. 284:20170679. doi: 10.1098/rspb.2017.0679
Blanquart, F., Lehtinen, S., Lipsitch, M., and Fraser, C. (2018). The evolution of antibiotic resistance in a structured host population. J. R. Soc. Interface 15:20180040. doi: 10.1098/rsif.2018.0040
Boeckel, T. P. V., Glennon, E. E., Chen, D., Gilbert, M., Robinson, T. P., Grenfell, B. T., et al. (2017). Reducing antimicrobial use in food animals. Science 357, 1350–1352. doi: 10.1126/science.aao1495
Bonhoeffer, S., Lipsitch, M., and Levin, B. R. (1997). Evaluating treatment protocols to prevent antibiotic resistance. Proc. Natl. Acad. Sci. 94, 12106–12111. doi: 10.1073/pnas.94.22.12106
Brown, J. H., and Kodric-Brown, A. (1977). Turnover rates in insular biogeography: effect of immigration on extinction. Ecology 58, 445–449. doi: 10.2307/1935620
Browne, A. J., Chipeta, M. G., Haines-Woodhouse, G., Kumaran, E. P. A., Hamadani, B. H. K., Zaraa, S., et al. (2021). Global antibiotic consumption and usage in humans, 2000–18: a spatial modelling study. Lancet Planet. Health 5, e893–e904. doi: 10.1016/s2542-5196(21)00280-1
Chesson, P., and Huntly, N. (1997). The roles of harsh and fluctuating conditions in the dynamics of ecological communities. Am. Nat. 150, 519–553. doi: 10.1086/286080
Coates, J., Park, B. R., Le, D., Şimşek, E., Chaudhry, W., and Kim, M. (2018). Antibiotic-induced population fluctuations and stochastic clearance of bacteria. elife 7:e32976. doi: 10.7554/elife.32976
Cobey, S., Baskerville, E. B., Colijn, C., Hanage, W., Fraser, C., and Lipsitch, M. (2017). Host population structure and treatment frequency maintain balancing selection on drug resistance. J. R. Soc. Interface 14:20170295. doi: 10.1098/rsif.2017.0295
Colijn, C., and Cohen, T. (2015). How competition governs whether moderate or aggressive treatment minimizes antibiotic resistance. elife 4:e10559. doi: 10.7554/elife.10559
Colijn, C., Cohen, T., Fraser, C., Hanage, W., Goldstein, E., Givon-Lavi, N., et al. (2010). What is the mechanism for persistent coexistence of drug-susceptible and drug-resistant strains of Streptococcus pneumoniae? J. R. Soc. Interface 7, 905–919. doi: 10.1098/rsif.2009.0400
Collignon, P., Beggs, J. J., Walsh, T. R., Gandra, S., and Laxminarayan, R. (2018). Anthropological and socioeconomic factors contributing to global antimicrobial resistance: a univariate and multivariable analysis. Lancet Planet. Health 2, e398–e405. doi: 10.1016/s2542-5196(18)30186-4
Davies, N. G., Flasche, S., Jit, M., and Atkins, K. E. (2019). Within-host dynamics shape antibiotic resistance in commensal bacteria. Nat. Ecol. Evol. 3, 440–449. doi: 10.1038/s41559-018-0786-x
Duarte, A.S.R., Høg, B.B., Korsgaard, H.B., Attauabi, M., Boel, J., Dalby, T., et al. (2020). DANMAP 2020 – Use of antimicrobial agents and occurrence of antimicrobial resistance in bacteria from food animals, food and humans in Denmark. DANMAP.
Dykhuizen, D. E. (1990). Experimental studies of natural selection in bacteria. Annu. Rev. Ecol. Syst. 21, 373–398. doi: 10.1146/annurev.es.21.110190.002105
Frenkel, N., Dover, R. S., Titon, E., Shai, Y., and Rom-Kedar, V. (2021). Bistable bacterial growth dynamics in the presence of antimicrobial agents. Antibiotics 10:87. doi: 10.3390/antibiotics10010087
Fujikawa, H., Kai, A., and Morozumi, S. (2004). A new logistic model for Escherichia coli growth at constant and dynamic temperatures. Food Microbiol. 21, 501–509. doi: 10.1016/j.fm.2004.01.007
Goossens, H., Ferech, M., Stichele, R. V., and Elseviers, M., ESAC Project Group (2005). Outpatient antibiotic use in Europe and association with resistance: a cross-national database study. Lancet 365, 579–587. doi: 10.1016/s0140-6736(05)17907-0
Gullberg, E., Cao, S., Berg, O. G., Ilbäck, C., Sandegren, L., Hughes, D., et al. (2011). Selection of resistant bacteria at very low antibiotic concentrations. PLoS Pathog. 7:e1002158. doi: 10.1371/journal.ppat.1002158
Hawkey, P. M. (2003). Mechanisms of quinolone action and microbial response. J. Antimicrob. Chemoth. 51, 29–35. doi: 10.1093/jac/dkg207
Hendriksen, R. S., Munk, P., Njage, P., Van Bunnik, B., McNally, L., Lukjancenko, O., et al. (2019). Global monitoring of antimicrobial resistance based on metagenomics analyses of urban sewage. Nat. Commun. 10:1124. doi: 10.1038/s41467-019-08853-3
Holmes, A. H., Moore, L. S. P., Sundsfjord, A., Steinbakk, M., Regmi, S., Karkey, A., et al. (2016). Understanding the mechanisms and drivers of antimicrobial resistance. Lancet 387, 176–187. doi: 10.1016/s0140-6736(15)00473-0
Krieger, M. S., Denison, C. E., Anderson, T. L., Nowak, M. A., and Hill, A. L. (2020). Population structure across scales facilitates coexistence and spatial heterogeneity of antibiotic-resistant infections. PLoS Comput. Biol. 16:e1008010. doi: 10.1371/journal.pcbi.1008010
Letten, A. D., Hall, A. R., and Levine, J. M. (2021). Using ecological coexistence theory to understand antibiotic resistance and microbial competition. Nat. Ecol. Evol. 5, 431–441. doi: 10.1038/s41559-020-01385-w
Levin, B. R., Lipsitch, M., Perrot, V., Schrag, S., Antia, R., Simonsen, L., et al. (1997). The population genetics of antibiotic resistance. Clin. Infect. Dis. 24, S9–S16. doi: 10.1093/clinids/24.supplement_1.s9
Lipsitch, M., Colijn, C., Cohen, T., Hanage, W. P., and Fraser, C. (2009). No coexistence for free: neutral null models for multistrain pathogens. Epidemics 1, 2–13. doi: 10.1016/j.epidem.2008.07.001
Marcusson, L. L., Frimodt-Møller, N., and Hughes, D. (2009). Interplay in the selection of fluoroquinolone resistance and bacterial fitness. PLoS Pathog. 5:e1000541. doi: 10.1371/journal.ppat.1000541
Marrec, L., and Bitbol, A.-F. (2018). Quantifying the impact of a periodic presence of antimicrobial on resistance evolution in a homogeneous microbial population of fixed size. J. Theor. Biol. 457, 190–198. doi: 10.1016/j.jtbi.2018.08.040
Marrec, L., and Bitbol, A.-F. (2020). Resist or perish: fate of a microbial population subjected to a periodic presence of antimicrobial. PLoS Comput. Biol. 16:e1007798. doi: 10.1371/journal.pcbi.1007798
Massad, E., Lundberg, S., and Yang, H. M. (1993). Modeling and simulating the evolution of resistance against antibiotics. Int. J. Biomed. Comput. 33, 65–81. doi: 10.1016/0020-7101(93)90060-j
McKendrick, A., and Pai, M. (1912). XLV.—the rate of multiplication of micro-organisms: a mathematical study. Proc. R. Soc. Edinb. 31, 649–653. doi: 10.1017/S0370164600025426
Melnyk, A. H., Wong, A., and Kassen, R. (2015). The fitness costs of antibiotic resistance mutations. Evol. Appl. 8, 273–283. doi: 10.1111/eva.12196
Meuli, L., and Dick, F. (2018). Understanding confounding in observational studies. Eur. J. Vasc. Endovasc. 55:737. doi: 10.1016/j.ejvs.2018.02.028
Olesen, S. W., Barnett, M. L., MacFadden, D. R., Brownstein, J. S., Hernández-Díaz, S., Lipsitch, M., et al. (2018). The distribution of antibiotic use and its association with antibiotic resistance. elife 7:e39435. doi: 10.7554/elife.39435
Olesen, S. W., Lipsitch, M., and Grad, Y. H. (2020). The role of “spillover” in antibiotic resistance. Proc. Natl. Acad. Sci. 117, 29063–29068. doi: 10.1073/pnas.2013694117
Otto, S. P., and Day, T. (2007). A Biologist’s Guide to Mathematical Modeling in Ecology and Evolution. New Jersey, United States: Princeton University Press.
Pulliam, H. R. (1988). Sources, sinks, and population regulation. Am. Nat. 132, 652–661. doi: 10.1086/284880
Robinson, C. D., Bohannan, B. J., and Britton, R. A. (2019). Scales of persistence: transmission and the microbiome. Curr. Opin. Microbiol. 50, 42–49. doi: 10.1016/j.mib.2019.09.009
Rosenblatt-Farrell, N. (2009). The landscape of antibiotic resistance. Environ. Health. Persp. 117, A244–A250. doi: 10.1289/ehp.117-a244
Sapountzis, P., Teseo, S., Otani, S., Aarestrup, F. M., Forano, E., Suen, G., et al. (2021). FI: the Fecobiome initiative. Foodborne Pathog. Dis. 19, 441–447. doi: 10.1089/fpd.2021.0082
Sarkar, A., Harty, S., Johnson, K. V.-A., Moeller, A. H., Archie, E. A., Schell, L. D., et al. (2020). Microbial transmission in animal social networks and the social microbiome. Nat. Ecol. Evol. 4, 1020–1035. doi: 10.1038/s41559-020-1220-8
Sezonov, G., Joseleau-Petit, D., and D’Ari, R. (2007). Escherichia coli physiology in Luria-Bertani broth. J. Bacteriol. 189, 8746–8749. doi: 10.1128/jb.01368-07
Silva, F., Lourenço, O., Queiroz, J. A., and Domingues, F. C. (2011). Bacteriostatic versus bactericidal activity of ciprofloxacin in Escherichia coli assessed by flow cytometry using a novel far-red dye. J. Antibiot. 64, 321–325. doi: 10.1038/ja.2011.5
Smith, D. L., Dushoff, J., Perencevich, E. N., Harris, A. D., and Levin, S. A. (2004). Persistent colonization and the spread of antibiotic resistance in nosocomial pathogens: resistance is a regional problem. Proc. Natl. Acad. Sci. 101, 3709–3714. doi: 10.1073/pnas.0400456101
Tedijanto, C., Olesen, S. W., Grad, Y. H., and Lipsitch, M. (2018). Estimating the proportion of bystander selection for antibiotic resistance among potentially pathogenic bacterial flora. Proc. Natl. Acad. Sci. 115, E11988–E11995. doi: 10.1073/pnas.1810840115
Tetteh, J. N. A., Matthäus, F., and Hernandez-Vargas, E. A. (2020). A survey of within-host and between-hosts modelling for antibiotic resistance. Biosystems 196:104182. doi: 10.1016/j.biosystems.2020.104182
Tiseo, K., Huber, L., Gilbert, M., Robinson, T. P., and Boeckel, T. P. V. (2020). Global trends in antimicrobial use in food animals from 2017 to 2030. Antibiotics 9:918. doi: 10.3390/antibiotics9120918
Tuttle, A. R., Trahan, N. D., and Son, M. S. (2021). Growth and maintenance of Escherichia coli laboratory strains. Curr. Protoc. 1:e20. doi: 10.1002/cpz1.20
Van De Sande-Bruinsma, N., Grundmann, H., Verloo, D., Tiemersma, E., Monen, J., Goossens, H., et al. (2008). Antimicrobial drug use and resistance in Europe. Emerg. Infect. Dis. 14, 1722–1730. doi: 10.3201/eid1411.070467
Wahl, L. M., and Gerrish, P. J. (2001). The probability that beneficial mutations are lost in populations with periodic bottlenecks. Evolution 55, 2606–2610. doi: 10.1111/j.0014-3820.2001.tb00772.x
WHO (2021). Antimicrobial resistance. Available at: https://www.who.int/news-room/fact-sheets/detail/antimicrobial-resistance (Accessed February 4, 2022).
Keywords: Lotka-Volterra competition equations, selection, fitness cost, co-existence, ecological modelling, simulations, antibiotics
Citation: Bogri A, Otani S, Aarestrup FM and Brinch C (2023) Interplay between strain fitness and transmission frequency determines prevalence of antimicrobial resistance. Front. Ecol. Evol. 11:981377. doi: 10.3389/fevo.2023.981377
Edited by:
Martin Drechsler, Helmholtz Association of German Research Centres (HZ), GermanyReviewed by:
Hans-Hermann Thulke, Helmholtz Association of German Research Centres (HZ), GermanyKristina Kadlec, Independent researcher, Wunstorf, Germany
Copyright © 2023 Bogri, Otani, Aarestrup and Brinch. This is an open-access article distributed under the terms of the Creative Commons Attribution License (CC BY). The use, distribution or reproduction in other forums is permitted, provided the original author(s) and the copyright owner(s) are credited and that the original publication in this journal is cited, in accordance with accepted academic practice. No use, distribution or reproduction is permitted which does not comply with these terms.
*Correspondence: Amalia Bogri, YW1hYm9nQGZvb2QuZHR1LmRr
†ORCID: Amalia Bogri, https://orcid.org/0000-0002-9127-6146
Saria Otani, https://orcid.org/0000-0002-2538-8086
Frank M. Aarestrup, https://orcid.org/0000-0002-7116-2723
Christian Brinch, https://orcid.org/0000-0002-5074-7183