 Fenglian Tan
 Zhaoyan Lu1,2
95% of researchers rate our articles as excellent or good
Learn more about the work of our research integrity team to safeguard the quality of each article we publish.
Find out more
ORIGINAL RESEARCH article
Front. Ecol. Evol. , 17 January 2024
Sec. Environmental Informatics and Remote Sensing
Volume 11 - 2023 | https://doi.org/10.3389/fevo.2023.1342766
This article is part of the Research Topic Territorial Spatial Evolution Process and its Ecological Resilience View all 15 articles
Introduction: This study aims to investigate the factors influencing ecosystem service trade-offs/synergies (TOSs) in major agricultural production areas in the southern hilly region and to propose optimization strategies to promote ecosystem sustainability in agricultural areas.
Methods: The study used a geographical detector to analyze the determinants influencing the ecosystem service trade-offs as well as correlation analysis, geographically weighted regression (GWR), and a geographical detector to analyze the spatial and temporal evolution of ecosystem service and TOS relationships from 2000 to 2020 in Hunan Province.
Results: The results showed that the comprehensive value of ecosystem services in Hunan Province showed an increasing trend from 2000 to 2020. With spatial heterogeneity, the areas with high values were mainly distributed in the hilly areas in the west, south, and east of Hunan Province, and the areas with low values were mainly distributed in the Dongting Lake Plain and the Xiangzhong Hilly Basin. There was a trade-off relationship between food production (FP) and all other ecosystem services, of which FP has the strongest trade-off effect with habitat quality (HQ). The synergy effect between HQ, water yield (WY), carbon storage (CS), and soil conservation (SC) shows an increasing trend. Gross domestic product (GDP) and SLOPE are the dominant factors for the strength of trade-offs between food supply and other ecosystem services, and Digital Elevation Model (DEM) and Normalized Difference Vegetation Index (NDVI) are the dominant factors for the strength of synergy effects among ecosystem services. The strength of TOS effects of ecosystem services is determined by interactions or co-influences between the two services rather than by a single component.
Discussion: The results of this study can provide a reference basis for the enhancement of ecosystem services and the sustainable planning of agricultural landscapes in the southern hilly areas.
Ecosystem services (ESs) are provisioning (e.g., raw materials and food), regulating (e.g., climate and gases), supporting (e.g., biodiversity and soil conservation), and cultural (e.g., outdoor recreation and aesthetic landscapes) services that are directly or indirectly provided by ecosystem structures, processes, and functions, and that link ecosystems to human wellbeing (Costanza et al., 1998; Ouyang et al., 2021a). However, the increasing demand for food as well as agricultural land over the past decades has had important impacts on biodiversity, water resources, carbon cycle, etc., leading to TOS mutual gains among ecosystem services (Li et al., 2020; Zhang et al., 2023). Coordinating the multi-objective conflicts of ecosystem management and mitigating the trade-off relationships and intensity among ecosystem services are now unavoidable choices for achieving the diversification of ecosystem services and high-quality regional agriculture development. Therefore, it is of great significance to explore the spatial and temporal changes of ecosystem services and the characteristics of the TOS relationship, and to propose spatially differentiated ecosystem service optimization countermeasures to enhance the synergies and mitigate the trade-offs, in order to maximize the comprehensive benefits of ecosystem services.
There are synergy relationships (simultaneous increase or decrease of two services) and trade-off relationships (increase of one service leads to decrease of another) among ecosystem services (Bennett et al., 2010). Currently, the existing studies form a variety of revealing ES and TOS relationships. Among them, ES TOS relationship methods include spatiotemporal correlation analysis (Xu et al., 2017) for quantifying ES TOS relationships in time and spatial, while using a geographically weighted regression and binary spatial autocorrelation analyses to reflect spatial TOS relationships (Zhang et al., 2020). The analysis of ecosystem service trade-offs and synergy relationships is a prerequisite for improving the level of ecosystem service provision. Currently, many scholars have focused on the quantification of ecosystem service TOS relationships at a single spatial scale, lacking multi-scale analyses. In addition to the analysis of ES TOS relationships, it is important and challenging to use ES-related results to enlighten territorial spatial planning. Most of the existing studies focus on administrative or physical geographic scales such as county or watershed (Gong et al., 2022; Liu et al., 2019), and there are fewer studies using grids as zoning units, which is not conducive to small-area scale studies and refined management. In addition, the analysis of ecosystem service TOSs and influencing factors for the subregion is relatively lacking, which cannot effectively provide recommendations for subregional management. Thus, research on how to better integrate spatiotemporal changes in ecosystem services and TOSs at many scales to explicitly assist spatial planning remains unrepresentative despite the advancements in spatiotemporal and cross-scale assessments of ecosystems. There is an urgent need to explicitly link ES information to policy development, regional planning, and implementation. Numerous and intricate elements affect TOSs (Feng et al., 2021). TOSs are influenced by a multitude of natural and anthropogenic factors, including DEM, slope, temperature, precipitation, population growth, urban expansion, economic development, and planning policies (Ouyang et al., 2023).
The southern hilly region accounts for 13% of China’s national land area and is the southern hilly and mountainous belt in the “two screens and three belts” of the national main ecological function zoning, which is an important part of the national ecological security pattern (Shao et al., 2023). In the process of urbanization in China, significant natural resource plunder and extensive ecological destruction have occurred in the pursuit of development. This has resulted in a significant conflict between ecological conservation and utilization in the southern hilly and mountainous regions. The consequences include severe water pollution, degraded forest quality, encroachment of urbanization on ecological spaces, loss of ecological functionality in certain areas, as well as issues such as soil and water erosion, rocky desertification, and more. Hunan Province, serving as a crucial developmental axis in the central region, also grapples with similar challenges, with soil pollution being a particularly pressing issue. Most studies on ecosystem services and TOS relationships in the southern hilly areas are currently conducted from a single static ecosystem service dimension, and lack quantitative geo-spatial information in long time series, making it difficult to apply in China’s territorial spatial planning. In view of this, this paper reveals the spatial and temporal evolution of TOSs between five ecosystem services—food production, water yield, carbon storage, soil conservation, and habitat quality—over the period 2000–2020 and selects the factors influencing them with the use of a geographical detector. This study’s main contributions are as follows: First, we quantified the major ESs to identify areas for ecological concerns. Next, we used GWR and Spearman’s correlation to quantify TOSs between ES. Finally, we investigated into the grid scale contributions of the TOS components. Based on this, the ecosystem management measures are put forward, in order to promote the southern hilly area ecosystem service differentiation control and the modern development of harmonious coexistence between man and nature.
The southern hilly region is the area south of the Qinling Mountains, east of the Yunnan-Guizhou Plateau, and north of the Leizhou Peninsula in China, covering seven provinces, namely, Zhejiang, Fujian, Jiangxi, Hunan, Guangdong, Guangxi, and Guizhou, with a total land area of approximately 1,276,000 km2 (Shao et al., 2023), constituting one of the important components of China’s “two screens and three belts” ecological pattern (see Figure 1). The region is interspersed with mountains, hills, and plains, with a variety of ecosystems and the largest and most well-preserved middle-subtropical forest ecosystem in the same latitude band. Hunan Province is located in the central part of the southern mountainous and hilly region, with geographical coordinates of 24°38’–30°08’N, 108°47’–114°15’E. Hunan Province has a humid subtropical monsoon climate, with an average annual temperature of 16–19°C. The average annual precipitation is 1,200–1,800 mm, and the change of seasons is obvious, which is suitable for human habitation and the growth of crops and green plants.
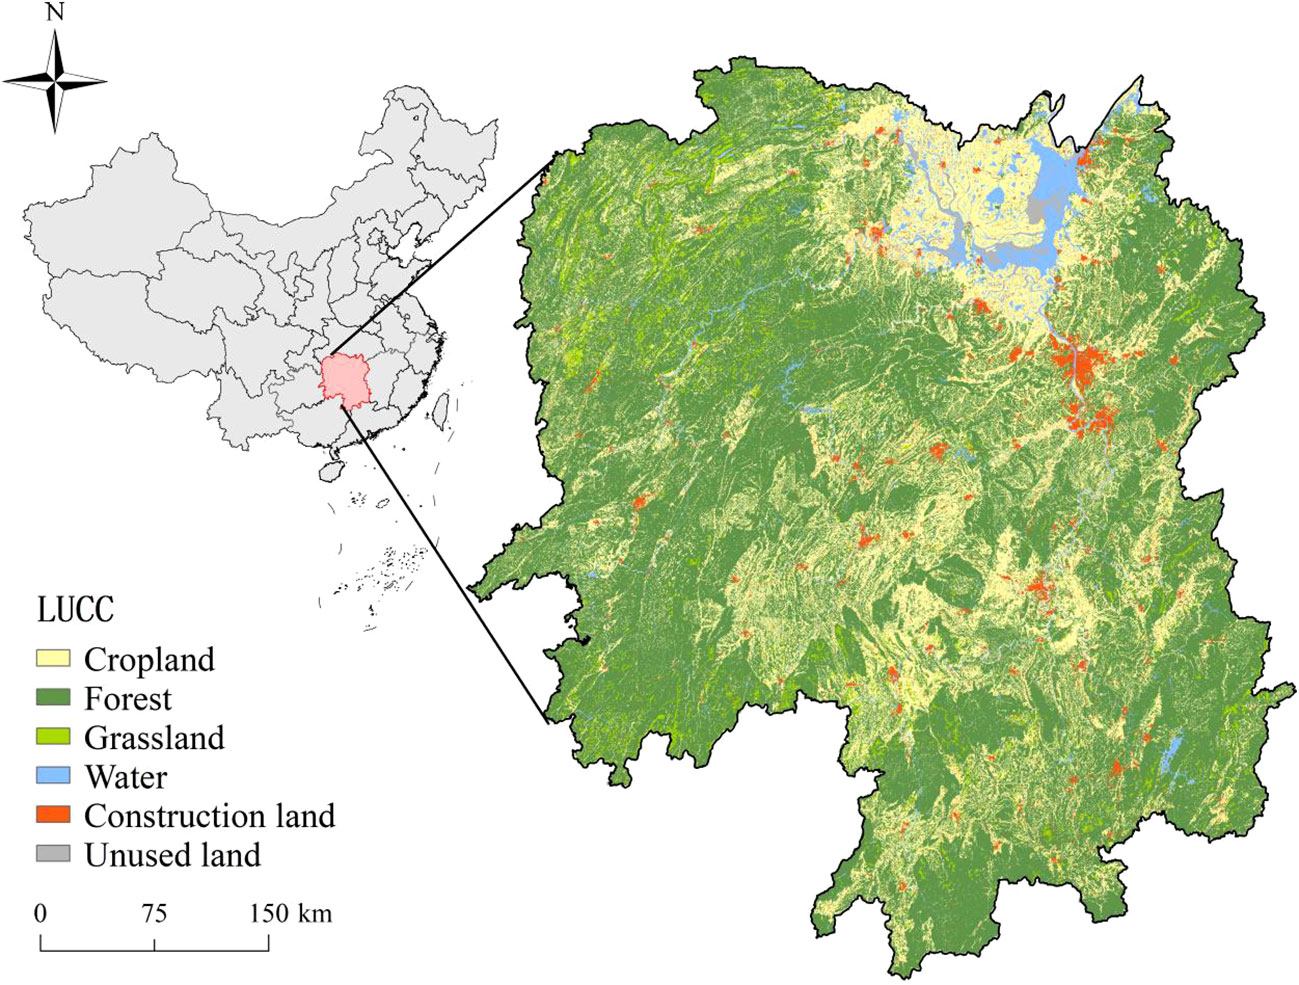
Figure 1 Location diagram of Hunan Province.
The InVEST model and the ArcGIS software were utilized in this study to quantitatively evaluate five ecosystem services: food production, water yield, carbon storage, soil conservation, and habitat quality. The precise formulas are provided (see Ouyang et al., 2023). The results of the above five ecosystem service types were used to normalize the extremes and then averaged to measure the ESV.
Pearson’s non-parametric correlation analysis was used in this study to determine trade-offs or synergy relationships between different ecosystem service groups. A positive correlation implies a synergy relationship, while a negative correlation is a trade-off relationship (Gou et al., 2021). Pearson correlation analyses of five ecosystem service bundles at three time scales, 2000, 2010, and 2020, and at grid scale were performed using the “corrplot” package in R4.3.1 software. Between 2000 and 2020, Hunan Province’s urbanization experienced rapid development, resulting in notable ecological changes. At the same time, 2000, 2010, and 2020 were selected considering the periodicity of ecological change.
In addition to the general synergies and trade-offs obtained through correlation analyses, in order to gain a more in-depth understanding of the patterns in the spatial distribution of these types of ecosystem services, this study used GWR to define the spatial interaction correlations of TOSs. The GWR model modifies the traditional regression framework to detect spatial non-stationarity in the relationships between samples (Xue et al., 2023). The strength and direction of the relationship between the dependent variable and its predictors may change in response to changes in the environmental components in the GWR, which fits with one of the mechanisms that generate ecosystem service trade-offs (common drivers affecting multiple ecosystem services simultaneously). In addition, common drivers contribute to the spatial heterogeneity and spatial non-stationarity of ecosystem service TOSs. Since we only use ecosystem service variables as independent and dependent variables, there is no problem of multicollinearity. The GWR model (Equation 1) is formulated as follows:
where (μi, vi) is the spatial location of the point, p is the number of independent variables, yi is the dependent variable, Xjk is the independent variable, ϵi represents the random error, β0(μi, vi) represents the intercept at i point, and βk(μi, vi) represents the regression coefficient. Positive regression coefficients indicate spatial synergies and negative regression coefficients indicate spatial trade-offs.
A geographical detector (GD) is used to detect the strength of the effect of a single factor and the interaction of two factors on the dependent variable, and to avoid the problem of multivariate covariance (Wang et al., 2016). The GD model (Equation 2) is formulated as follows:
where q is the influence of factors, K and Kh are the number of the grids, L is the number of index samples, w2 and is the discrete variance of the resilience of the study area and grid h.
We used each influencing factor as an independent variable and the strength of ecosystem service trade-offs as the dependent variable in this study. To analyze the degree of influence of each driving factor and factor combinations on the spatial heterogeneity of the degree of ecosystem service trade-offs, we selected the “factor detection” and “interaction detection” in geographical detector. Specific influencing factors are shown in Table 1; Figure 2.
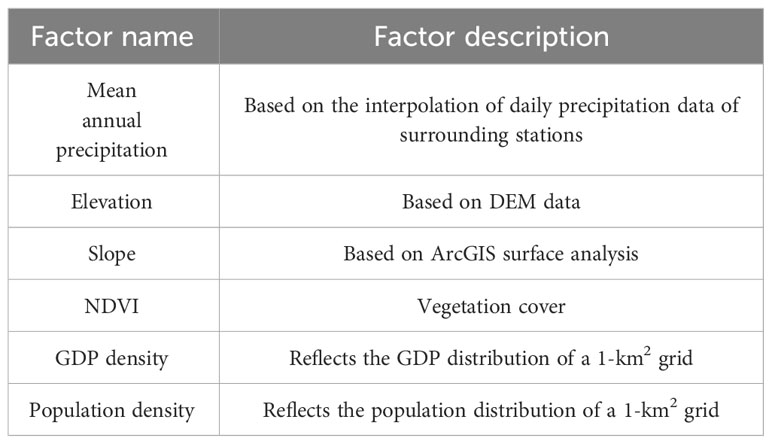
Table 1 The influencing factors selected for this study.
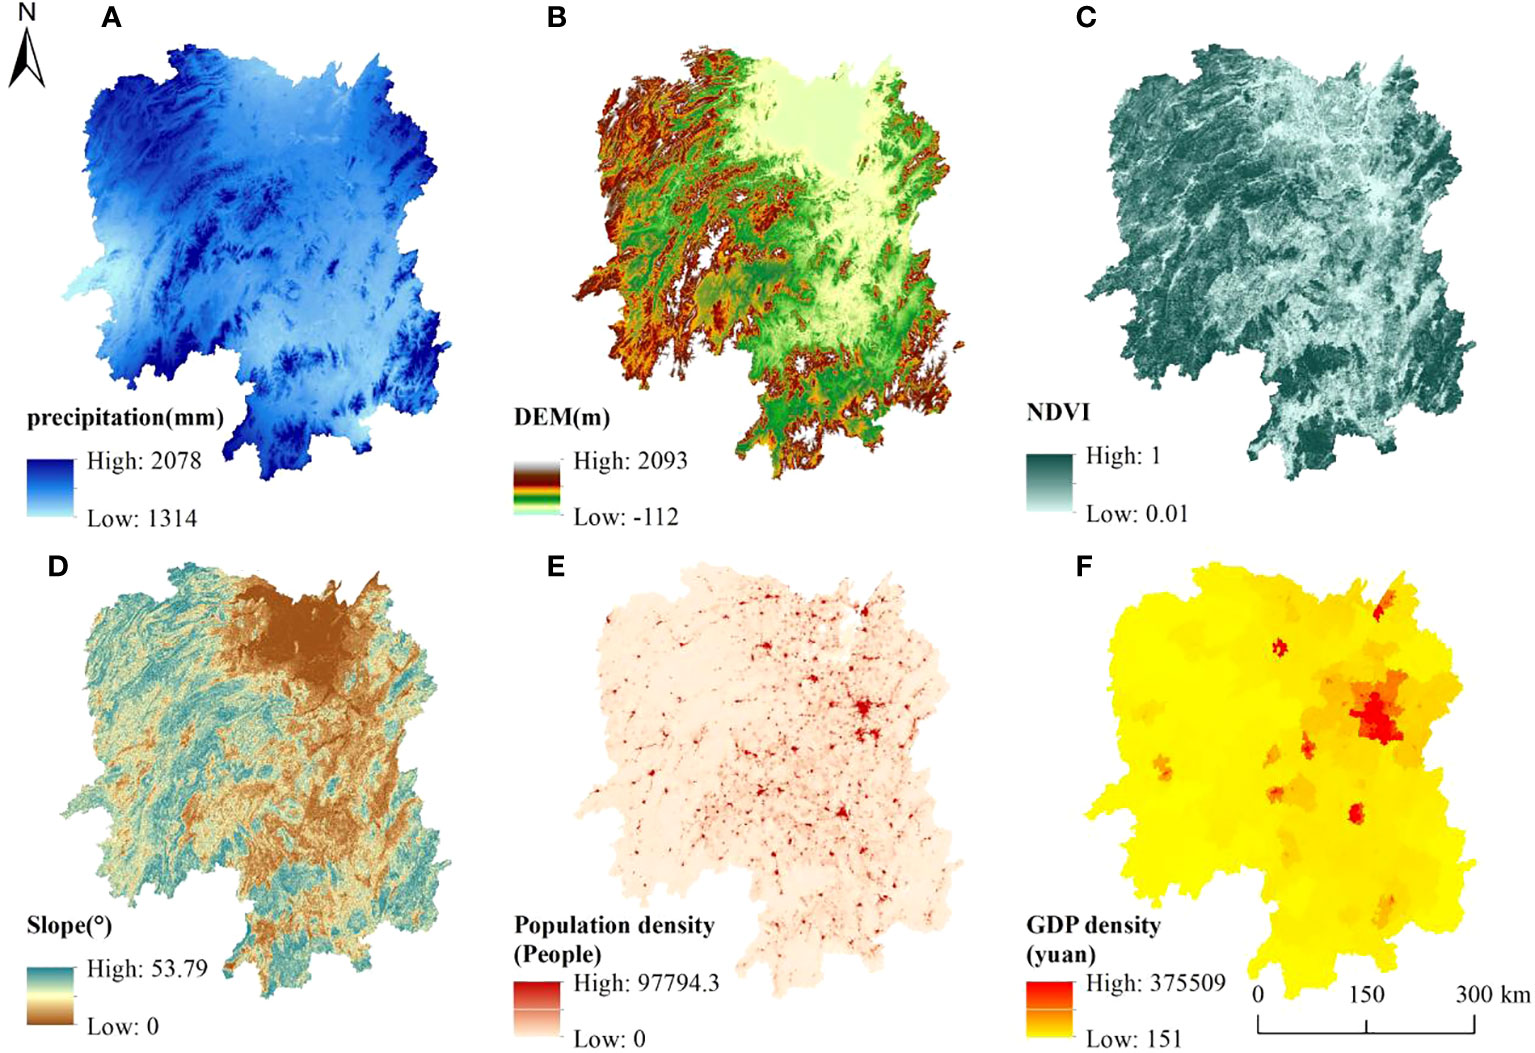
Figure 2 The spatial of influencing factors. (A) Precipitation, (B) DEM; (C) DEM; (D) Slope; (E) Population density and (F) GDP density.
Land use data: The land use data from 2000 to 2020 were from the Resource and Environmental Science Data Center of the Chinese Academy of Sciences (www.resdc.cn), with a spatial resolution of 30 m. Vegetation type data: MODIS13Q1 NDVI was derived from the NASA Earth Data Center (www.earthdata.nasa.gov) with a spatial resolution of 250 m. Digital Elevation Model (DEM) data: from the geospatial data cloud, spatial resolution of 30 m; GDP density and POP density are derived from the Resource and Environmental Science Data Center of the Chinese Academy of Sciences (www.resdc.cn), with a spatial resolution of 1 km. Grain production: from 2000–2020, “Hunan Statistical Yearbook” and “Hunan Rural Statistical Yearbook”. Finally, the resolution resampling of each factor raster data is unified to 1 km, and the projection coordinate system is unified by WGS_1984_Albers.
The trend of integrated services in Hunan Province from 2000 to 2020 exhibited an overall upward trajectory. Specifically, the average values of integrated ecosystem services at the provincial grid scale in 2000, 2010, and 2020 were 0.533, 0.528, and 0.613, respectively. From a spatial perspective, areas with high integrated ecosystem service values at the provincial grid scale were predominantly located in the western, southern, and eastern hilly regions of Hunan Province. These areas boasted low population density and high vegetation coverage rates, as depicted in Figure 3. On the other hand, the areas with low values are mainly distributed in the Dongting Lake Plain and Xiangzhong Hilly Basin, in which the built-up areas of cities with intensive human activities have the lowest integrated ecosystem services, due to the flat terrain, high proportion of surrounding farmland, high population density, and the high degree of interference with the natural ecosystems, which leads to the low integrated ecosystem services in these areas.
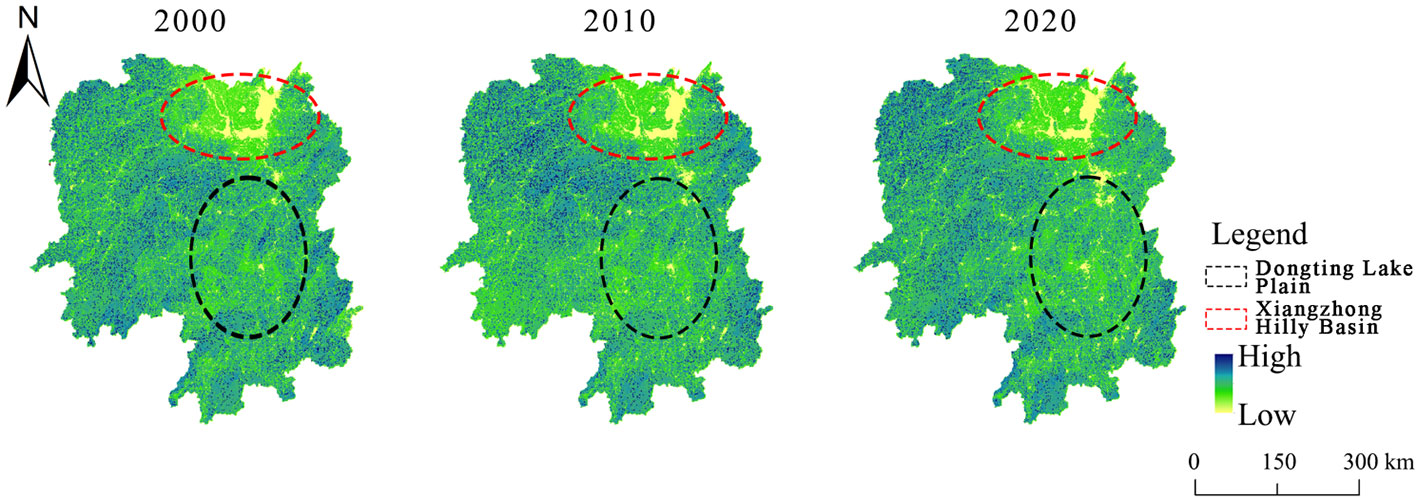
Figure 3 Integrated services of grid ecosystems in Hunan Province, 2000–2020.
From the temporal dimension (Figure 4A), in 2000, HQ and SC, HQ and CS, and SC and CS in Hunan Province were highly positively correlated, with correlation coefficients of 0.67, 0.93, and 0.63, respectively. These three ecosystem service pairs passed the significance test of 0.001, indicating that there was a strong synergy effect between them. Similarly, there was a strong positive correlation between HQ and WY, WY and SC, and WY and CS, with correlation coefficients of 0.11, 0.24, and 0.19, respectively, which also passed the significance test of 0.001. FP and HQ, FP and WY, FP and SC, and FP and CS showed strong negative correlations, with correlation coefficients of −0.53, −0.04, −0.47, and −0.46, respectively. Among them, FP vs. HQ, FP vs. CS, and FP vs. SC passed the significance test of 0.001, indicating a strong trade-off effect between them.
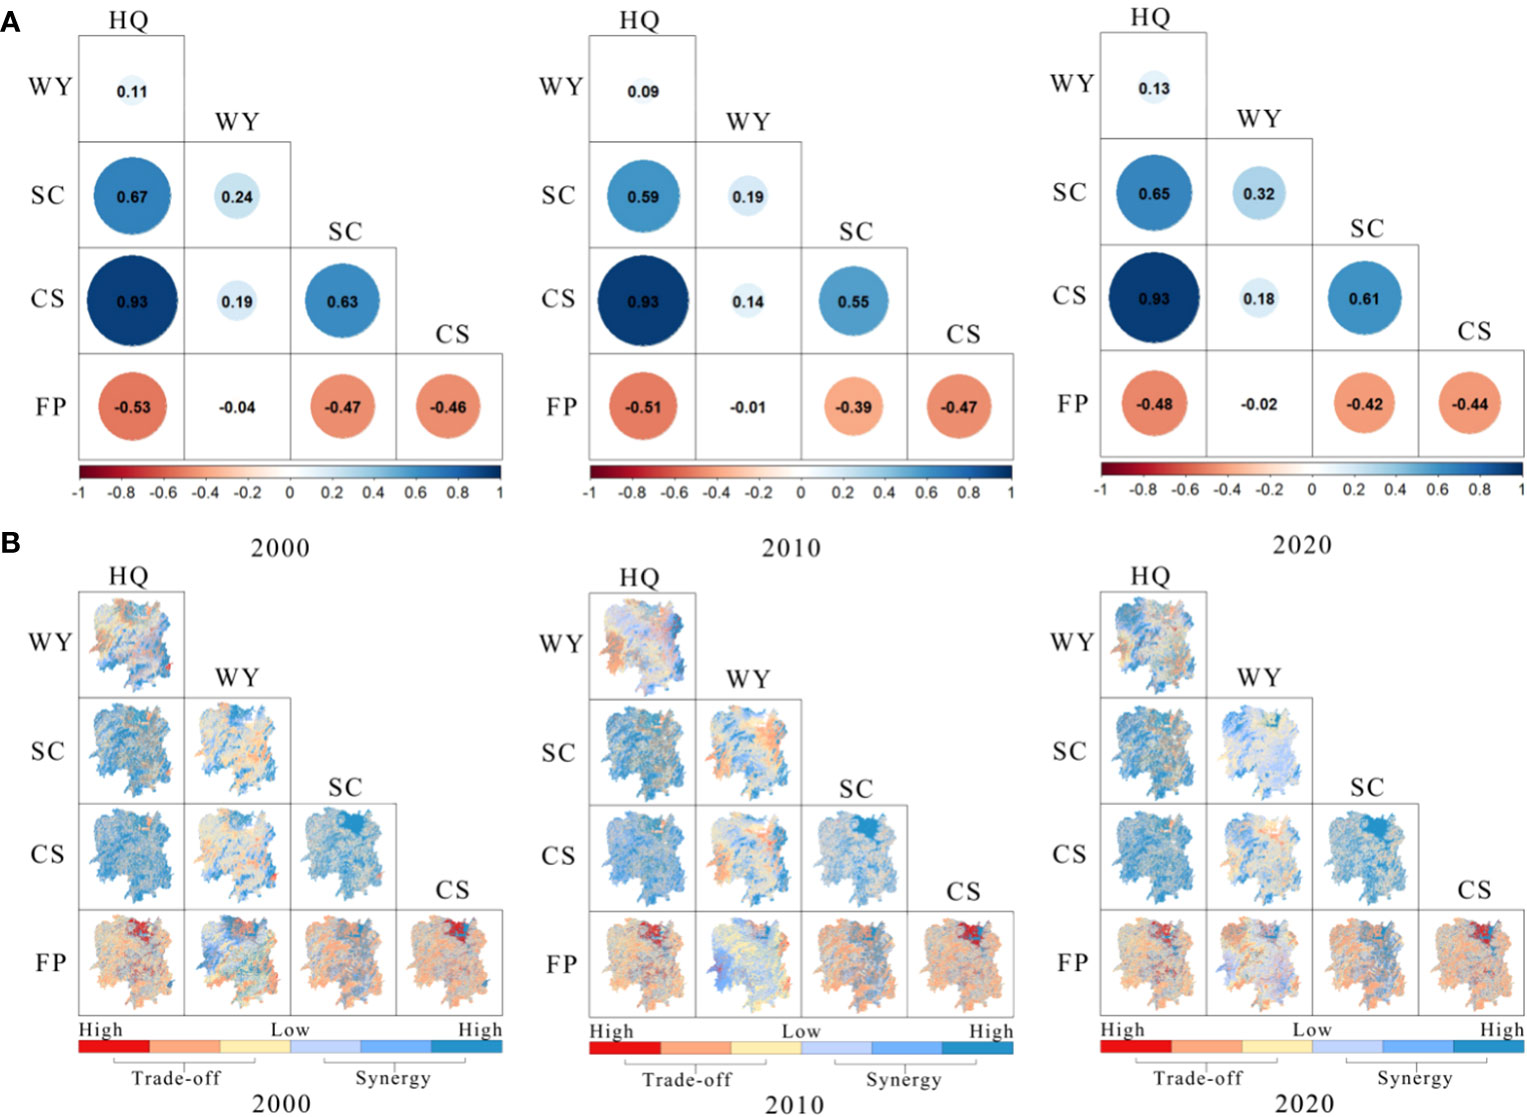
Figure 4 Changes in trade-offs and synergies of ecosystem services at grid scale in Hunan province. (A) Temporal dimension and (B) spatial dimension.
In 2010, HQ and SC, HQ and CS, SC and CS, HQ and WY, WY and SC, and WY and CS still maintained strong spatial synergy effects, with correlation coefficients of 0.59, 0.93, 0.55, 0.09, 0.19, and 0.14, respectively. The spatial trade-off effects of FP and HQ, FP and WY, and FP and SC diminished, with correlation coefficients of −0.51, −0.01, and −0.39.
In 2020, a strong synergy relationship was still maintained among the six ecosystem service pairs consisting of HQ, WY, CS, and SC in Hunan Province. The highest correlation coefficient of 0.93 was found between HQ and CS, and strong synergy effects were also found between HQ and WY, HQ and SC, WY and SC, WY and CS, and SC and CS, with correlation coefficients of 0.13, 0.65, 0.93, 0.32, 0.18, and 0.61, respectively. The correlation coefficients between HQ-WY, WY-CS, WY-SC, CS-SC, and HQ-SC showed a significant increasing trend at the grid scale of 2000–2020. However, FP-HQ and FP-SC showed a decreasing trend.
From the spatial dimension (Figure 4B), the proportion of spatial synergies between HQ, WY, CS, and SC at the grid scale in Hunan Province was significantly higher than the proportion of spatial trade-offs, indicating that the spatial relationships among these four types of ecosystem services were dominated by synergy relationships. The areas with strong spatial synergies were mainly distributed in the hilly areas of southern Hunan Province (e.g., HQ-CS, WY-HQ, and CS-SC) and western Hunan Province (e.g., SC-WY, WY-HQ, and CS-SC). In contrast, the areas of spatial trade-offs between FP and other ecosystem services were mainly concentrated in the western (FP-WY and FP-CS), southern (FP-HQ, FP-WY, FP-CS, and FP-SC), and northern (FP-HQ, FP-CS, and FP-SC) regions of Hunan Province.
At the grid scale, GDP has the highest degree of influence on the trade-off effects of FP-CS, FP-HQ, FP-SC, and FP-WY, as well as the highest degree of influence on the synergy effects of HQ-WY. SLOPE has the second highest degree of influence on the trade-off effects of FP-CS, FP-HQ, and FP-SC, and PRE has the lowest degree of influence (see Figure 5).
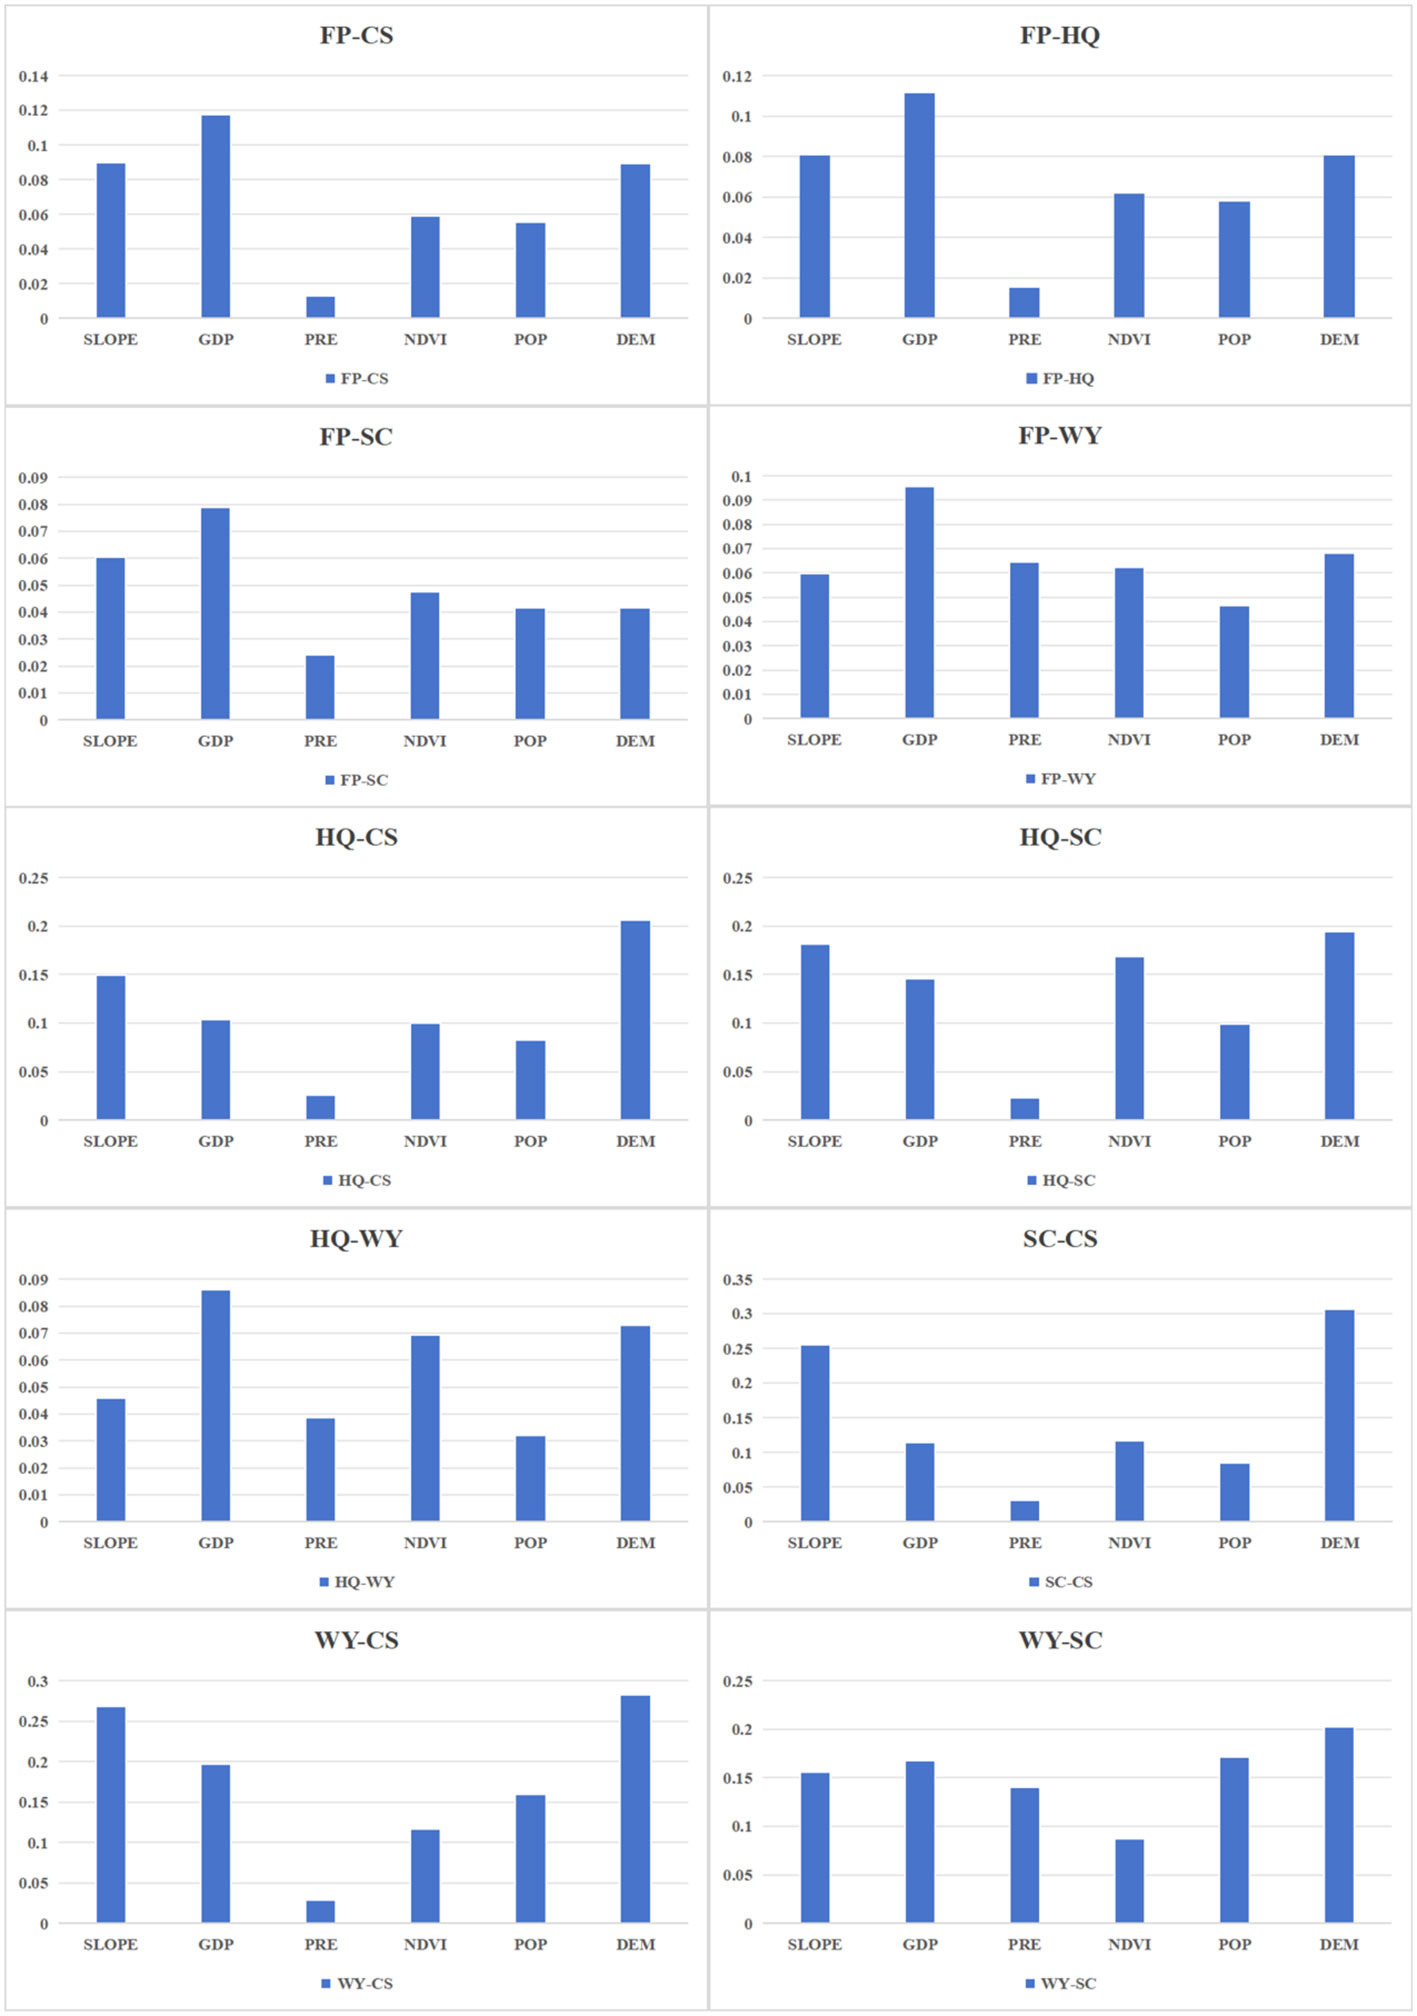
Figure 5 Correlation coefficient of different factors and ES.
In the results of the synergy effects of FP-WY, GDP has the highest degree of influence with a q-value of 0.10, which is slightly higher than DEM and PRE, followed by NDVI and SLOPE, and POP is the lowest with a q-value of 0.05. In the results of the synergy effects of SC-CS, the degree of influence of DEM is much higher than that of other factors, with a q-value of 0.31, followed by SLOPE with a q-value of 0.26. This indicates that in the synergy relationship between SC-CS, the altitudinal position and topographic conditions have a greater influence. NDVI and GDP both had q-values of 0.12, while POP was lower than 0.08, and PRE was the lowest at 0.03.
In the results of the synergy influence of HQ-CS, DEM has the highest degree of influence with a q-value of 0.21, followed by SLOPE with a q-value of 0.15, while GDP, POP, and NDVI have q-values of 0.10, 0.08, and 0.10, respectively, and PRE is the lowest at 0.03. In the results of the synergy effect of the influence of HQ-SC, DEM, SLOPE, NDVI, GDP, POP, and PRE had q-values of 0.19, 0.18, 0.17, 0.15, 0.10, and 0.02, respectively. In the synergy effect impact results of HQ-WY, GDP, DEM, NDVI, SLOPE, PRE, and POP had q-values of 0.09, 0.07, 0.07, 0.05, 0.04, and 0.03, respectively.
In the synergy effect impact results of WY-CS, the q-values of DEM, SLOPE, GDP, POP, NDVI, and PRE are 0.28, 0.27, 0.20, 0.16, 0.12, and 0.03, respectively. In the synergy effect impact results of WY-SC, the q-values of DEM, POP, GDP, SLOPE, PRE, and NDVI are 0.20, 0.17, 0.17, 0.16, 0.14, and 0.09, respectively.
At the 1-km grid scale of interaction detection results in Table 2, the interaction results among the factors were more balanced compared to the city and county levels. With a score of 0.54, 0.53, 0.52, 0.54, 0.55, 0.56, and 0.55, respectively, NDVI has the largest influence among them in the trade-off interaction detection of FP-SC, FP-HQ, FP-SC, FP-WY, HQ-SC, HQ-CS, and HQ-WY, while the GDP had the highest amount of influence in the synergistic detection of SC-CS, WY-CS, and WY-SC, with detections of 0.53, 0.80, and 0.64, respectively.
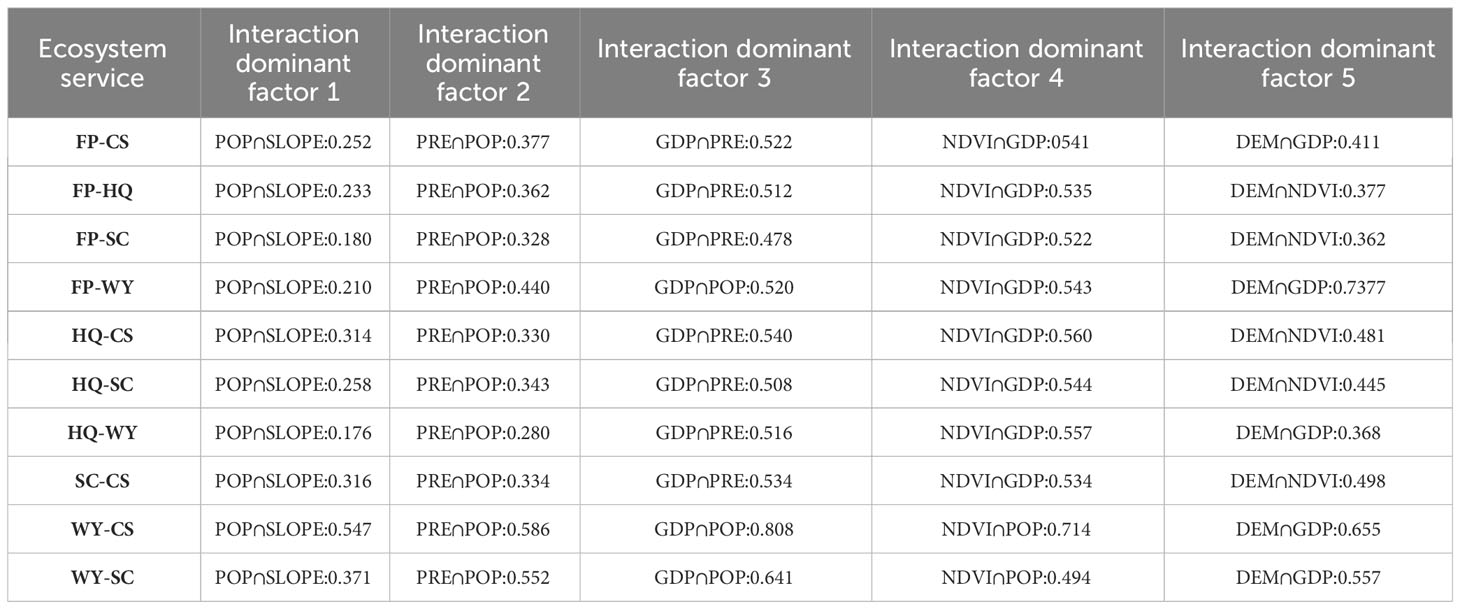
Table 2 Interactive influence coefficients of different factors and ES.
During the study period, the value of integrated ecosystem services showed an increasing trend over time and heterogeneity in space, which has important implications for decision-making related to sustainable development, environmental protection, and regional planning. There was an overall trade-off relationship between FP and any other ecosystem services, with the strongest trade-off effect between FP and HQ, which was spatially distributed mainly in the hilly and mountainous regions of the western part of the Xiangxi region, which have favorable environmental conditions. The synergy effect between HQ, WY, CS, and SC generally showed an increasing trend during the study period (Shen et al., 2023). The GD can then explore how the selected drivers affect TOSs at the gird scale, and also investigate if there are any nonlinear effects between the drivers on TOSs (Ouyang et al., 2023). TOSs were influenced by a combination of natural conditions, socio-economic, and other factors. Among them, GDP and slope factors had the greatest influence on food production, along with other influencing factors. Economic development led to a corresponding decrease in the area of arable land, which, in turn, caused a decline in food production services. However, the impact of human management activities on agriculture can have a positive effect on food production. The more economically developed the region, the higher the cost and management inputs in the agricultural production process, leading to a higher intensity of agricultural management measures such as agricultural fertilizers, farmland irrigation, and agricultural machinery. These measures can effectively increase crop yields and enhance food production services.
This study analyzed the relationship between ecosystem services, which can help to form spatially oriented strategies to improve ecosystem service relationships and promote the sustainable development of social–ecological systems. However, there are limitations to the study, as only five representative ecosystem services were analyzed. The study’s mapping results may be less uncertain if these ecological indicators are improved, data quality is raised, and the spatially explicit models used to calculate ecosystem supply and demand are updated. These actions may also have further policy and planning impacts. Considering how the socio-ecological drivers of ecosystem service TOSs evolve over time and scale is a next step to be taken in this study.
Despite some shortcomings, this study provides an attempt to gain a deeper understanding of the various influences of socio-ecological determinants on TOSs between ecological settings. Firstly, spatially explicit details of the TOSs among ESs are mapped as opposed to traditional correlation analyses that only provide statistical results. In addition, a technique for quantifying the degree of TOSs among ESs is suggested. In conclusion, many connections between ESs and potential drivers have been revealed and their spatial differentiation has been explored. The analysis then explores the spatial implications of different drivers and offers more theoretical and practical recommendations for local policymakers. Furthermore, the study’s methodology and data are applied to other places, making it a useful case study and resource for ecological management in the hilly southern regions. (Li et al., 2019; Li et al., 2022). Additionally, a technique is proposed to quantify the extent of TOSs among ESs. In summary, this study identifies numerous connections between ESs and potential drivers, and examines their spatial variability. The analysis then explores the spatial implications of different drivers and offers more theoretical and practical recommendations for local policymakers. Furthermore, the study’s methodology and data are applied to other places, making it a useful case study and resource for ecological management in the hilly southern regions (Xia et al.,2023).
This study quantitatively assessed the temporal and spatial change characteristics of five ecosystem services in Hunan Province from 2000 to 2020, including water production, soil conservation, carbon storage, habitat quality, and food production. We measured the TOS relationships among these ecosystem services using correlation analysis and GWR. Additionally, we identified the primary influencing factors and factor combinations for the degree of trade-offs in ecosystem services by applying a geographical detector. The comprehensive value of ecosystem services in Hunan Province showed an increasing trend from 2000 to 2020, with high values mainly distributed in the hilly areas in the west, south, and east of Hunan Province, while low values were mainly distributed in the Dongting Lake Plain and the Xiangzhong Hilly Basin.
There was a trade-off relationship between FP and all other ecosystem services, with the strongest trade-off effect found between FP and HQ. The synergy effect among HQ, WY, CS, and SC showed an increasing trend. GDP and slope were the dominant factors for the strength of trade-offs between food supply and other ecosystem services, while DEM and NDVI were the dominant factors for the strength of synergies among ecosystem services. Therefore, the strength of trade-offs and synergies between ecosystem services was not affected by a single factor. The interactions or the driving of common influencing factors between the two services determined the relationship.
The raw data supporting the conclusions of this article will be made available by the authors, without undue reservation.
FT: Conceptualization, Data curation, Formal analysis, Methodology, Software, Supervision, Writing – original draft. ZL: Data curation, Methodology, Software, Writing – original draft. FZ: Funding acquisition, Supervision, Validation, Writing – original draft.
The author(s) declare financial support was received for the research, authorship, and/or publication of this article. The Major Bidding Project of Hunan Social Science Fund, "Research and Interpretation of the Spirit of the 6th Plenary Session of the 19th National Congress of the Communist Party of China and the Spirit of the 12th Party Congress of Hunan Province" (22ZDA020), and the Youth Project of Hunan Social Science Fund, "Model Selection and Efficiency Optimization of Effective Connection between Poverty Alleviation and Rural Revitalization in Ethnic Areas of Hunan.
The authors declare that the research was conducted in the absence of any commercial or financial relationships that could be construed as a potential conflict of interest.
All claims expressed in this article are solely those of the authors and do not necessarily represent those of their affiliated organizations, or those of the publisher, the editors and the reviewers. Any product that may be evaluated in this article, or claim that may be made by its manufacturer, is not guaranteed or endorsed by the publisher.
Bennett E. M., Peterson G. D., Gordon L. J. (2010). Understanding relationships among multiple ecosystem services. Ecol. Lett. 12 (12), 1394–1404. doi: 10.1111/j.1461-0248.2009.01387.x
Costanza R., Arge R., De G R. (1998). The value of the world’s ecosystem services and natural capital. Ecol. Economics 25 (1), 3–15. doi: 10.1016/S0921-8009(98)00020-2
Feng R., Wang F., Wang K., Xu S. (2021). Quantifying influences of anthropogenic-natural factors on ecological land evolution in mega-urban agglomeration: A case study of Guangdong-Hong Kong-Macao greater Bay area. J. Cleaner Production 283, 125304. doi: 10.1016/j.jclepro.2020.125304
Gong J., Jin T., Liu D., Zhu Y., Yan L. (2022). Are ecosystem service bundles useful for mountainous landscape function zoning and management? A case study of Bailongjiang watershed in western China. Ecol. Indic. 134, 108495. doi: 10.1016/j.ecolind.2021.108495
Gou M., Li L., Ouyang S., Wang N., La L., Liu C., et al. (2021). Identifying and analyzing ecosystem service bundles and their socioecological drivers in the Three Gorges Reservoir Area. J. Cleaner Production 307, 127208. doi: 10.1016/j.jclepro.2021.127208
Li T., Lü Y. H., Fu B. J., Hu W. Y., Comber A. J. (2019). Bundling ecosystem services for detecting their interactions driven by large-scale vegetation restoration: enhanced services while depressed synergies. Ecol. Indic. 99, 332–342. doi: 10.1016/j.ecolind.2018.12.041
Li W., Xiong W., Yang W. B., Wang T., Lian H. L., Liu Y. L., et al. (2022). Poplar trees do not always act as a water pump: evidence from modeling deep drainage in a low-coverage-mode shelterbelt in China. J. Of Hydrology 605, 127383. doi: 10.1016/j.jhydrol.2021.127383
Li Z., Deng X., Jin G., Mohmmed A., Arowolo A. O. (2020). Tradeoffs between agricultural production and ecosystem services: A case study in Zhangye, Northwest China. Sci. Total Environ. 707, 136032. doi: 10.1016/j.scitotenv.2019.136032
Liu Y., Li T., Zhao W., Wang S., Fu B. (2019). Landscape functional zoning at a county level based on ecosystem services bundle: Methods comparison and management indication. J. Environ. Manage. 249, 109315. doi: 10.1016/j.jenvman.2019.109315
Ouyang X., Tang L.-S., Wei X., Li Y.-H. (2021a). Spatial interaction between urbanization and ecosystem services in Chinese urban agglomerations. Land Use Policy 109, 105587. doi: 10.1016/j.landusepol.2021.105587
Ouyang X., Wei X., Wei G., Wang K. (2023). The expansion efficiency of urban land in China’s urban agglomerations and its impact on ecosystem services. expansion efficiency of urban land in China’s urban agglomerations and its impact on ecosystem services. Habitat Int. 141, 102944. doi: 10.1016/j.habitatint.2023.102944
Shao Y., Xiao Y., Kou X., Sang W. (2023). Sustainable land use scenarios generated by optimizing ecosystem distribution based on temporal and spatial patterns of ecosystem services in the southern China hilly region. Ecol. Inf. 78, 102275. doi: 10.1016/j.ecoinf.2023.102275
Shen J., Li S., Wang H., Wu S., Liang Z., Zhang Y., et al. (2023). Understanding the spatial relationships and drivers of ecosystem service supply-demand mismatches towards spatially-targeted management of social-ecological system. J. Cleaner Production 406, 136882. doi: 10.1016/j.jclepro.2023.136882
Wang J., Zhang T., Fu B. (2016). A measure of spatial stratified heterogeneity. Ecol. Indic. 67, 250–256. doi: 10.1016/j.ecolind.2016.02.052
Xia H., Yuan S., Prishchepov A. V. (2023). Spatial-temporal heterogeneity of ecosystem service interactions and their social-ecological drivers: Implications for spatial planning and management. Resources Conserv. Recycling 189, 106767. doi: 10.1016/j.resconrec.2022.106767
Xu S., Liu Y., Wang X., Zhang G. (2017). Scale effect on spatial patterns of ecosystem services and associations among them in semi-arid area: A case study in Ningxia Hui Autonomous Region, China. Sci. Total Environ. 598, 297–306. doi: 10.1016/j.scitotenv.2017.04.009
Xue C., Chen X., Xue L., Zhang H., Chen J., Li D. (2023). modelling the spatially heterogeneous relationships between TOSs among ecosystem services and potential drivers considering geographic scale in Bairin Left Banner, China. Sci. Total Environ. 855, 158834. doi: 10.1016/j.scitotenv.2022.158834
Zhang Z., Liu Y., Wang Y., Liu Y., Zhang Y., Zhang Y. (2020). What factors affect the synergies and tradeoff between ecosystem services, and how, from a geospatial perspective? J. Cleaner Production 257, 120454. doi: 10.1016/j.jclepro.2020.120454
Keywords: ecosystem services, trade-offs effect, geographical detector, influencing factors, hilly areas of southern China
Citation: Tan F, Lu Z and Zeng F (2024) Study on the trade-off/synergy spatiotemporal benefits of ecosystem services and its influencing factors in hilly areas of southern China. Front. Ecol. Evol. 11:1342766. doi: 10.3389/fevo.2023.1342766
Received: 22 November 2023; Accepted: 14 December 2023;
Published: 17 January 2024.
Edited by:
Xiao Ouyang, Hunan University of Finance and Economics, ChinaReviewed by:
Siyun Chen, Hunan University of Finance and Economics, ChinaCopyright © 2024 Tan, Lu and Zeng. This is an open-access article distributed under the terms of the Creative Commons Attribution License (CC BY). The use, distribution or reproduction in other forums is permitted, provided the original author(s) and the copyright owner(s) are credited and that the original publication in this journal is cited, in accordance with accepted academic practice. No use, distribution or reproduction is permitted which does not comply with these terms.
*Correspondence: Fusheng Zeng, emVuZ2Z1c2hlbmdAMTYzLmNvbQ==
Disclaimer: All claims expressed in this article are solely those of the authors and do not necessarily represent those of their affiliated organizations, or those of the publisher, the editors and the reviewers. Any product that may be evaluated in this article or claim that may be made by its manufacturer is not guaranteed or endorsed by the publisher.
Research integrity at Frontiers
Learn more about the work of our research integrity team to safeguard the quality of each article we publish.