 Shuai Wu1,2
 Wei Wu3*
- 1Institute Of China Rural Studies, Central China Normal University, Wuhan, China
- 2School of Public Administration, Central China Normal University, Wuhan, China
- 3Mining College, Guizhou University, Guiyang, Guizhou, China
Land surface phenology plays a crucial role in accurately parameterizing interactions between land ecosystems and the atmosphere. Changes in autumn phenology directly impact the length of vegetation growing season and year-to-year changes in carbon uptake. Previous studies have often focused solely on the end of growing season when characterizing autumn phenology, neglecting the onset and duration of autumn. Here, we extracted the annual autumn phenological metrics, i.e., the start of brown-down phase (SOB), the end of brown-down phase (EOB), and the length of brown-down phase (LOB), for temperate China from 1982 to 2018 based on our self-developed global LSP dataset. We conducted a comparative analysis of SOB, EOB, and LOB in the field of their spatial distribution, temporal trends, and performance on various categories of vegetated regions (i.e., forests, grasslands, croplands, and vegetated areas in urban lands (V_Urban)). The results showed a significant negative correlation between the timing of autumn phenological metrics and latitude in temperate China. Between 1982 and 2018, there were significant positive increasing trends in EOB and LOB in V_Urban, as well as in LOB in forests in temperate China. However, the annual mean SOB, EOB, and LOB did not show significant trends across the entire study area. At the local pixel scale, SOB, EOB, and LOB exhibited a combination of advanced and delayed trends within various vegetated categories. The trends of the same phenological metric were not uniform across these diverse vegetated regions. For instance, the majority of pixels with significant trends in SOB exhibited delayed trends in forests and croplands, while displaying advanced trends in grasslands and V_Urban. In this study, employing three metrics (SOB, EOB, and LOB) to describe autumn phenology enhances our understanding of the impacts of global climate change on ecosystems, offering a more comprehensive and detailed perspective. In the future, satellite-based monitoring and phenological modeling should contemplate incorporating additional potential phenological metrics.
1 Introduction
Phenology is defined as recurring biological events influenced by environmental factors, such as leaf budding and flowering (Morisette et al., 2009; Liu et al., 2017; Liu et al., 2020). Land surface phenology (LSP) controls seasonal variations in land surface vegetation, governing photosynthesis and other ecosystem processes (Richardson et al., 2012). It also plays a key role in regulating feedbacks from the biosphere to the climate system (Richardson et al., 2018a). Moreover, LSP significantly influences carbon cycling, the water cycle, and the exchange of energy (White et al., 2009; Keenan et al., 2014; Seyednasrollah et al., 2019). Consequently, the dates of phenological events are frequently employed to assess the effects of global climate change on ecosystems (Korner and Basler, 2010; Bolton et al., 2020). To comprehend the effects of global climate change, it is imperative to closely examine the variation patterns of LSP (Liang et al., 2021; Li et al., 2023a).
Notably, a study highlighted the significance of leaf senescence date in determining the length of the vegetation growing season (Garonna et al., 2014). The start, end, and length of the autumn brown-down phase in vegetation all hold substantial implications for the annual variations in vegetation growth and carbon uptake (Piao et al., 2008; Wu et al., 2022). However, in comparison to spring phenology, autumn phenology is influenced by multiple factors such as temperature, precipitation, and photoperiod, requiring further observation and understanding (Archetti et al., 2013; Xie et al., 2018; Nagai et al., 2020; Shin et al., 2021a). Previous studies have employed various methods to observe autumn phenology of vegetation, including satellite-based observations (Garonna et al., 2014; Nagai et al., 2015; Wu et al., 2021; Tsutsumida et al., 2022), model simulations (Zhu et al., 2019; Gauzere et al., 2020; Shin et al., 2021b), visual assessments of trees (Klosterman and Richardson, 2017; Klosterman et al., 2018; Xie et al., 2018), fixed-point observations with phenology cameras (Nagai et al., 2018; Richardson et al., 2018b; Xie et al., 2018), near-ground observations with unmanned aerial vehicles (Klosterman and Richardson, 2017; Klosterman et al., 2018; Xie et al., 2018), and analysis of phenological information published on the Internet (Nagai et al., 2020; Tsutsumida et al., 2022) and social media (Shin et al., 2021a). However, most of these studies focus on the date of leaf fall or leaf color change, overlooking the duration from the onset of leaf color change to the end of the growing season.
Owing to the rapid advancement in remote sensing technology, the constraints in LSP studies at both spatial and temporal scales have consistently been overcome (White et al., 1997; Zhang et al., 2003; Piao et al., 2019). Comprehensive comprehension of the autumn phenology in terrestrial vegetation is unattainable without the support of high-quality LSP dataset. The MODIS LSP product (MCD12Q2) provides estimations of the dates of key phenophase across global terrestrial vegetation (Zhang et al., 2003). This product enjoys extensive utilization (Ganguly et al., 2010; Xin et al., 2015; Moon et al., 2019). Nevertheless, the MCD12Q2 product is limited to data from 2001 onwards and cannot support extended time-series phenology investigations. In our previous study, we independently developed a global annual LSP dataset (GLSP) using AVHRR land surface reflectance data (Wu et al., 2023). GLSP provides estimations of the dates of key phenophase, including the start of vegetation growing season (SOG), maturity, senescence, and the end of growing season (EOG). This dataset provides information for two vegetation growing seasons annually on a global scale, encompassing the period from 1982 to 2018. It incorporates outcomes from four phenology retrieval techniques that can be tailored to user requirements. In summary, it is imperative to examine the interplay between the start of the brown-down phase (SOB), the end of the brown-down phase (EOB), and the length of the brown-down phase (LOB) by utilizing extensive time series of remote sensing data. This analysis is vital for gaining a deeper insight into how autumn phenology responds to climate changes.
This study examines the extensive spatial and temporal changes in autumn phenology within temperate China (Figure 1) over an extended time period. Firstly, we extracted the annual SOB, EOB, and LOB for temperate China from 1982 to 2018 based on the GLSP dataset. Subsequently, we conducted an analysis of the spatial distribution of the mean SOB, EOB, and LOB from 1982 to 2018. Thirdly, we extracted the long-term trend patterns of SOB, EOB and LOB from 1982 to 2018. Finally, we quantified the long-term trends in autumn phenology across various categories of vegetated areas at a local pixel scale. Utilizing multiple phenological metrics has enhanced our understanding of the large-scale spatiotemporal changes in autumn phenology.
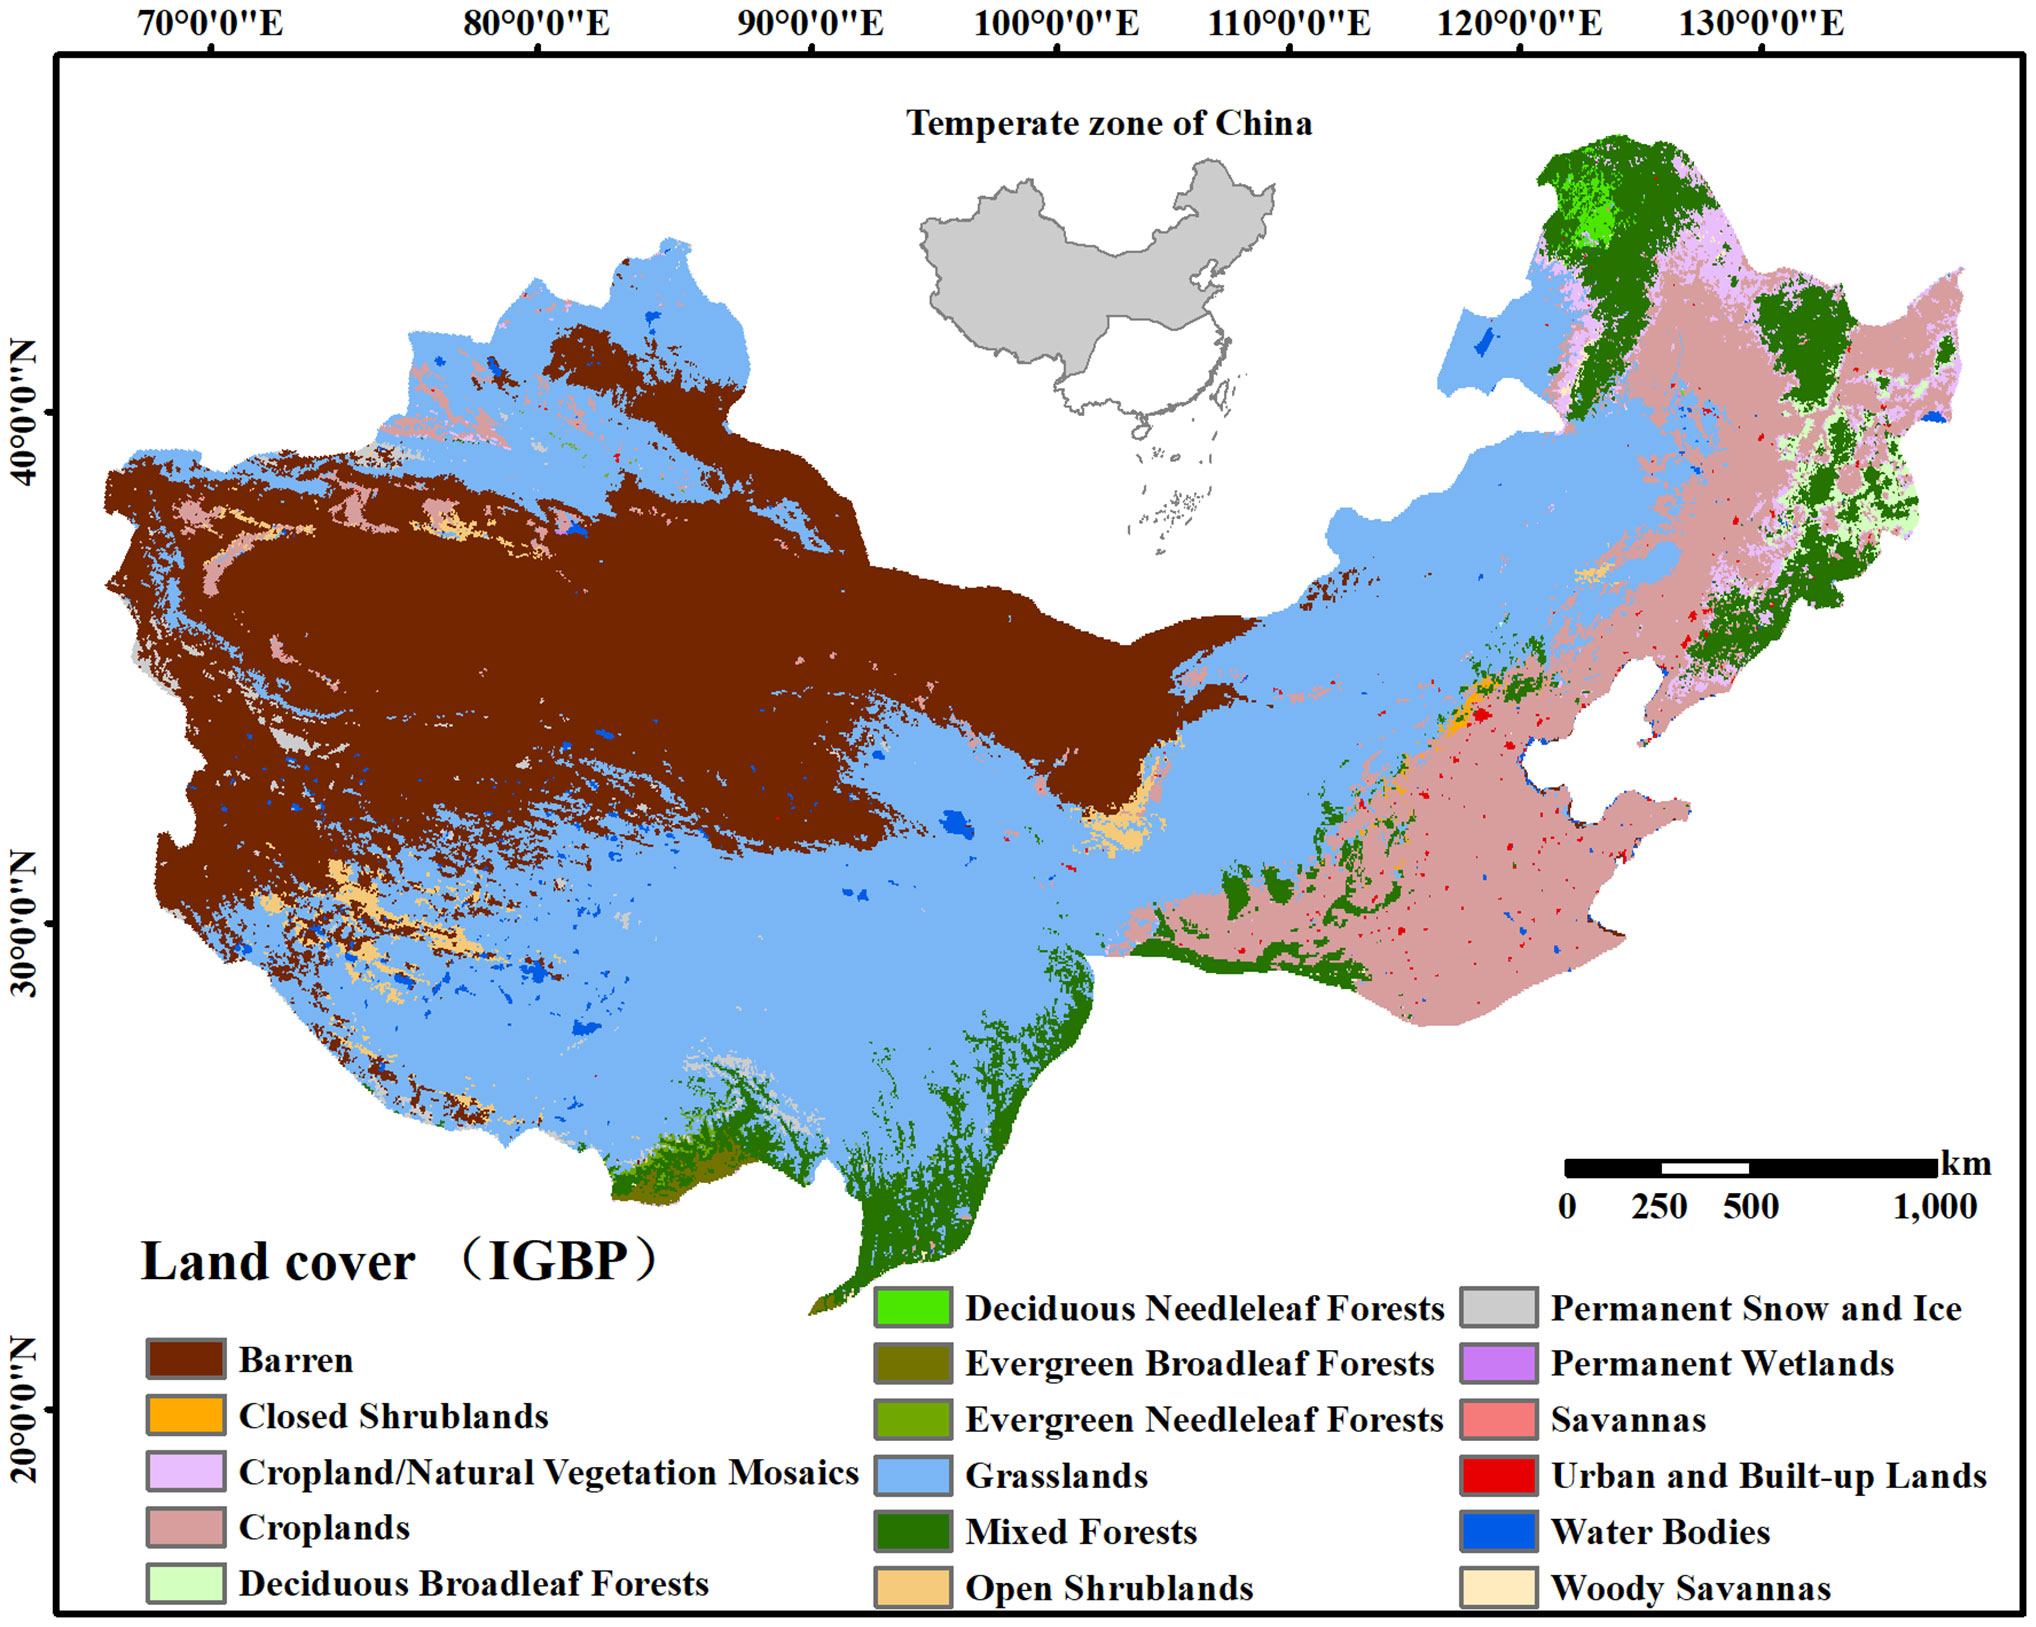
Figure 1 Land cover types in temperate China.
2 Materials and methods
2.1 Study area
We focused on temperate China as the designated study area (Figure 1). When conducting phenology retrieval research, temperate China offers several advantages, including well-defined seasons, a variety of land cover types, and satellite observations that are less influenced by solar zenith angle effects (Slayback et al., 2003; Piao et al., 2006). Therefore, the analysis of autumn phenology in this study excludes tropical and subtropical areas covered by evergreen vegetation.
2.2 Satellite data acquisition
In this study, we used an independently developed GLSP dataset (Wu et al., 2021; Wu et al., 2023). The dataset provides estimates for key phenophase dates, including SOG, maturity, senescence, and EOG. We utilized four phenology retrieving methods to extract phenological metrics from AVHRR 2-band enhanced vegetation index (EVI2) time series and evaluated the performances of different phenological metrics using ground-based phenological observations (including the USA National Phenology Network and the Pan European Phenology Database), flux tower data (including measured LAI time series and Harvard Forest phenological records) and remote sensing phenological observations (including MCD12Q2 and phenological metrics extracted based on Landsat images). This product provides science data sets that map global LSP metrics at a spatial resolution of 1/20 degrees and a yearly time interval. Users can flexibly choose the phenological metrics derived by different methods according to the actual situation.
Additionally, we utilized the Collection 6 MCD12Q1 product. This product delivers yearly land cover classifications with a spatial resolution of 500 meters and includes a total of five classification systems. We selected the International Geosphere Biosphere Programme (IGBP) classification scheme (Loveland and Belward, 1997), which defines seventeen land cover types, for extracting terrestrial vegetated regions.
2.3 Land surface autumn phenology extraction
The GLSP dataset provides multiple phenological metrics (namely, SOG, maturity, senescence, and EOG) for two growing seasons annually. As assessed by Wu et al. (2023), the timing of senescence and EOG, retrieved using the second-order derivative method (SOD), exhibited significant alignment with ground phenology network. In this study, we used senescence and EOG retrieved using SOD for the initial vegetation growth period in each year within the GLSP dataset. Autumn vegetation growth corresponds to a brown-down phase, which is a period during which the vegetation index time series monotonically decreases. Senescence represents the start of the brown-down phase (SOB), while EOG denotes the end of the brown-down phase (EOB). To improve the precision of phenology estimation, we employed a logistic function to characterize the vegetation brown-down phase. (Zhang et al., 2003; Wu et al., 2021; Wu and Xin, 2023). SOD is based on identifying points in the fitted curves where local slopes change at the fastest and slowest rates (Sakamoto et al., 2005) (Figure 2). Specifically, SOB is determined as the timing when the first local minimum occurs in the SOD curve during the brown-down phase. EOB is determined as the point when the first local maximum is reached in the SOD curve during the brown-down phase. The length of the brown-down phase (LOB) is computed as the time interval between EOB and SOB.

Figure 2 Principle of extracting autumn phenological metrics using the second-order derivative method.
2.4 Extraction of vegetated regions
As our primary focus was on the dynamics of autumn vegetation, we excluded regions lacking vegetative cover using the IGBP classification scheme. In addition, we straightforwardly classified vegetated regions within the study area into four distinct categories: forests, grasslands, croplands, and vegetated areas in urban lands (V_Urban), based on their land cover types. Subsequently, distinct analyses were carried out to investigate the spatial and temporal patterns of autumn phenology within each of these categories.
3 Results
3.1 Spatial distribution of autumn phenology
Figure 3 illustrates the spatial distribution of the mean SOB, EOB, and LOB in temperate China spanning the years 1982 to 2018, revealing some variability among them. SOB occurs relatively early (before Day of Year (DOY) 220) in the northwest, central, and northeast regions of the study area, but it takes place relatively late (after DOY 270) in the southern region of the study area (Figure 3A). EOB occurs relatively early (before DOY 280) in the northeastern region of the study area, but it happens relatively late (after DOY 320) in the northwest, central, and southwestern regions of the study area (Figure 3B). LOB is notably brief (less than 60 days) in the eastern and northeastern portions of the study area, while it is considerably extended (more than 80 days) in the northwestern and southwestern regions of the study area (Figure 3C).
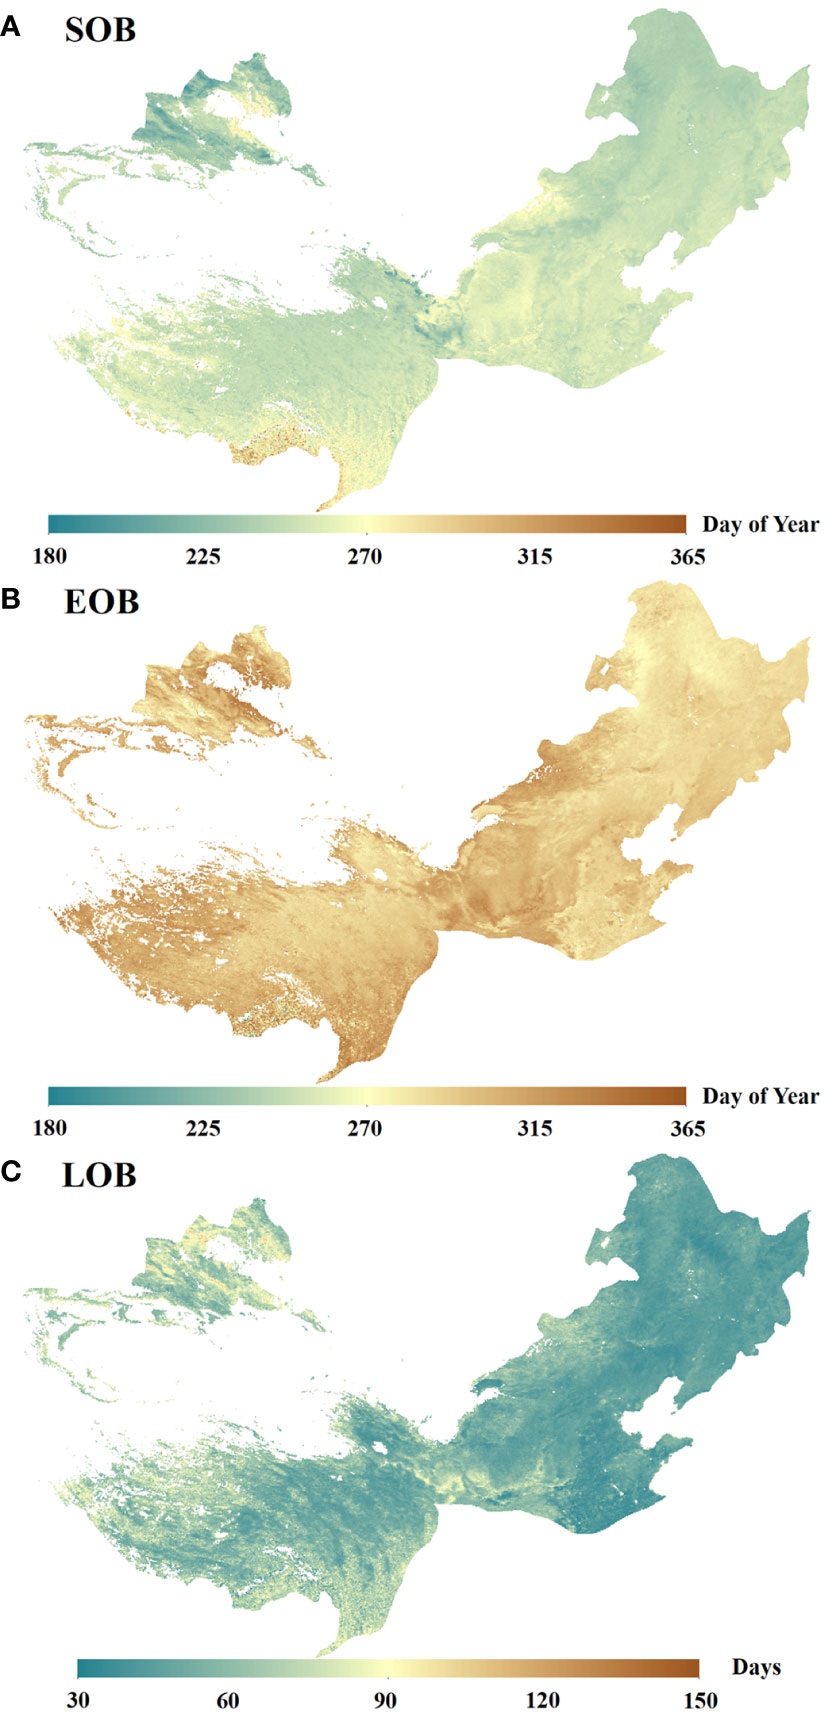
Figure 3 The mean SOB (A), EOB (B) and LOB (C) in temperate China from 1982 to 2018.
In terms of latitude, the mean SOB, EOB, and LOB all exhibit comparable trends from 1982 to 2018 (Figure 4). As latitude increases, both SOB and EOB demonstrate significantly advanced trends at rates of 1.365 days per degree (r = 0.866**, RMSE = 7.051 days) and 0.8557 days per degree (r = 0.845**, RMSE = 4.858 days), as indicated in Figures 4A, B, respectively. In Figure 4C, there is a notable trend of LOB significantly shortening with increasing latitude, at a rate of approximately 0.8336 days per degree (r = 0.839**, RMSE = 4.850 days).
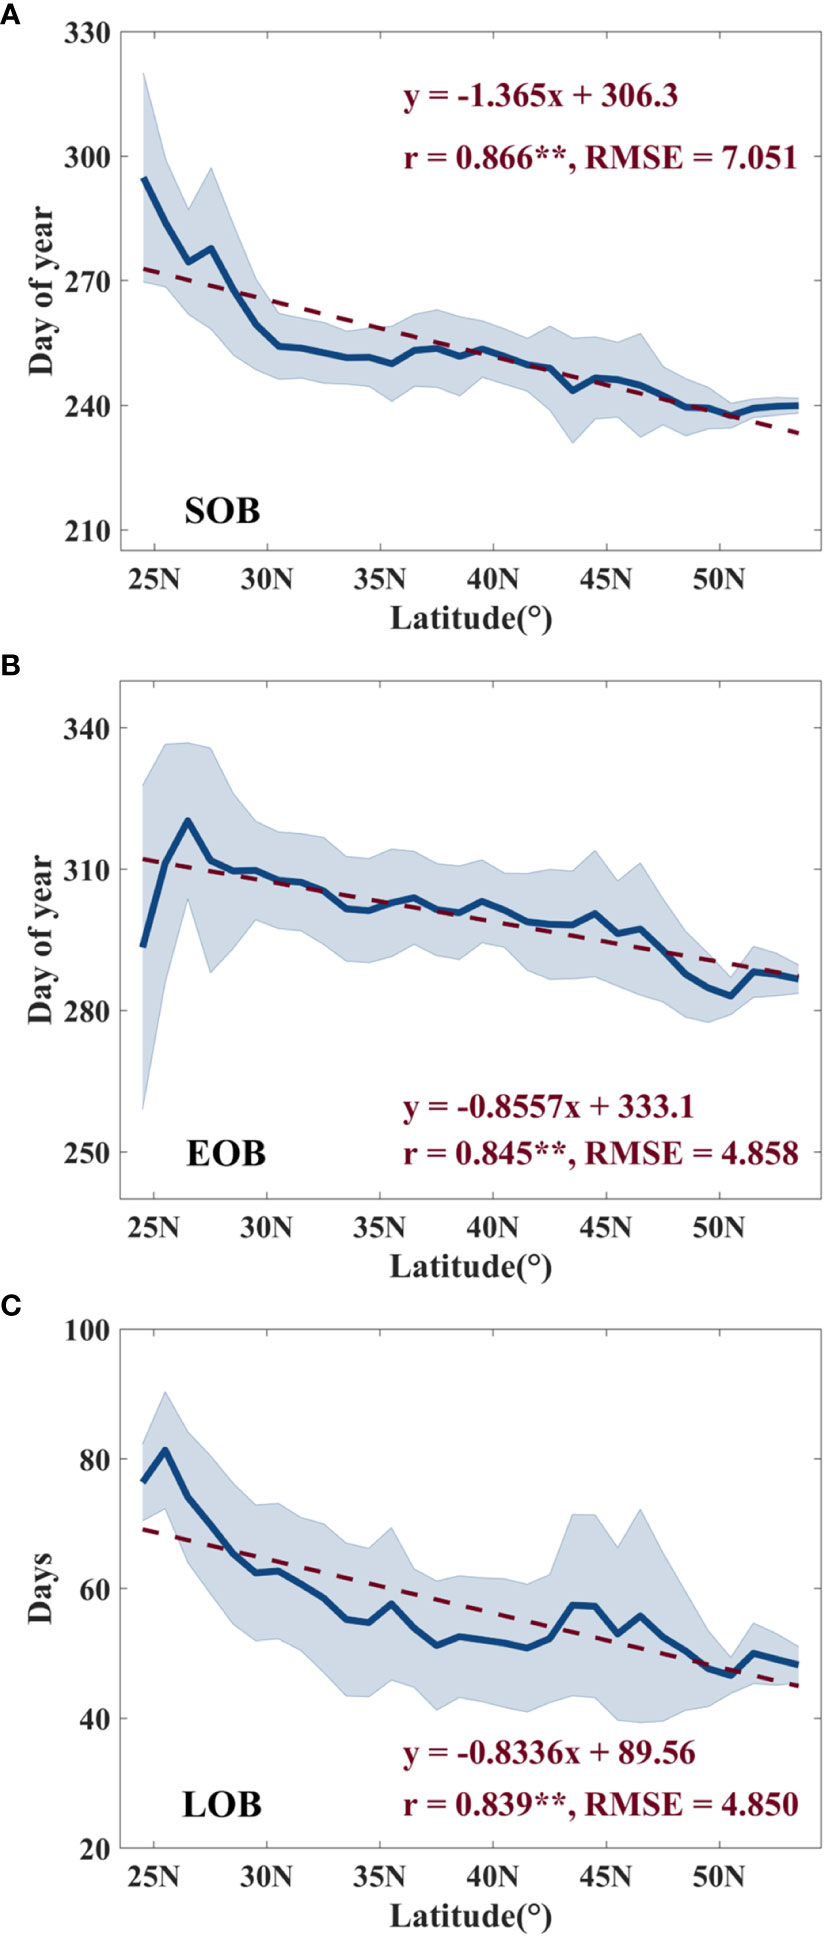
Figure 4 Distribution of mean SOB (A), EOB (B) and LOB (C) in the latitudinal direction. The light blue bar represents the standard deviation. ** indicates a significance level of p < 0.01.
3.2 Temporal trends analysis
Figure 5 presents the trends of the annual mean SOB, EOB, and LOB in temperate China from 1982 to 2018. From 1982 to 2018, the annual mean SOB and EOB exhibit insignificantly advanced trends (p > 0.05) of 0.061 days yr–1 and 0.0406 days yr–1, respectively (Figures 5A, B). The annual mean LOB shows an extended trend (0.0428 days yr–1, p > 0.05, Figure 5C).
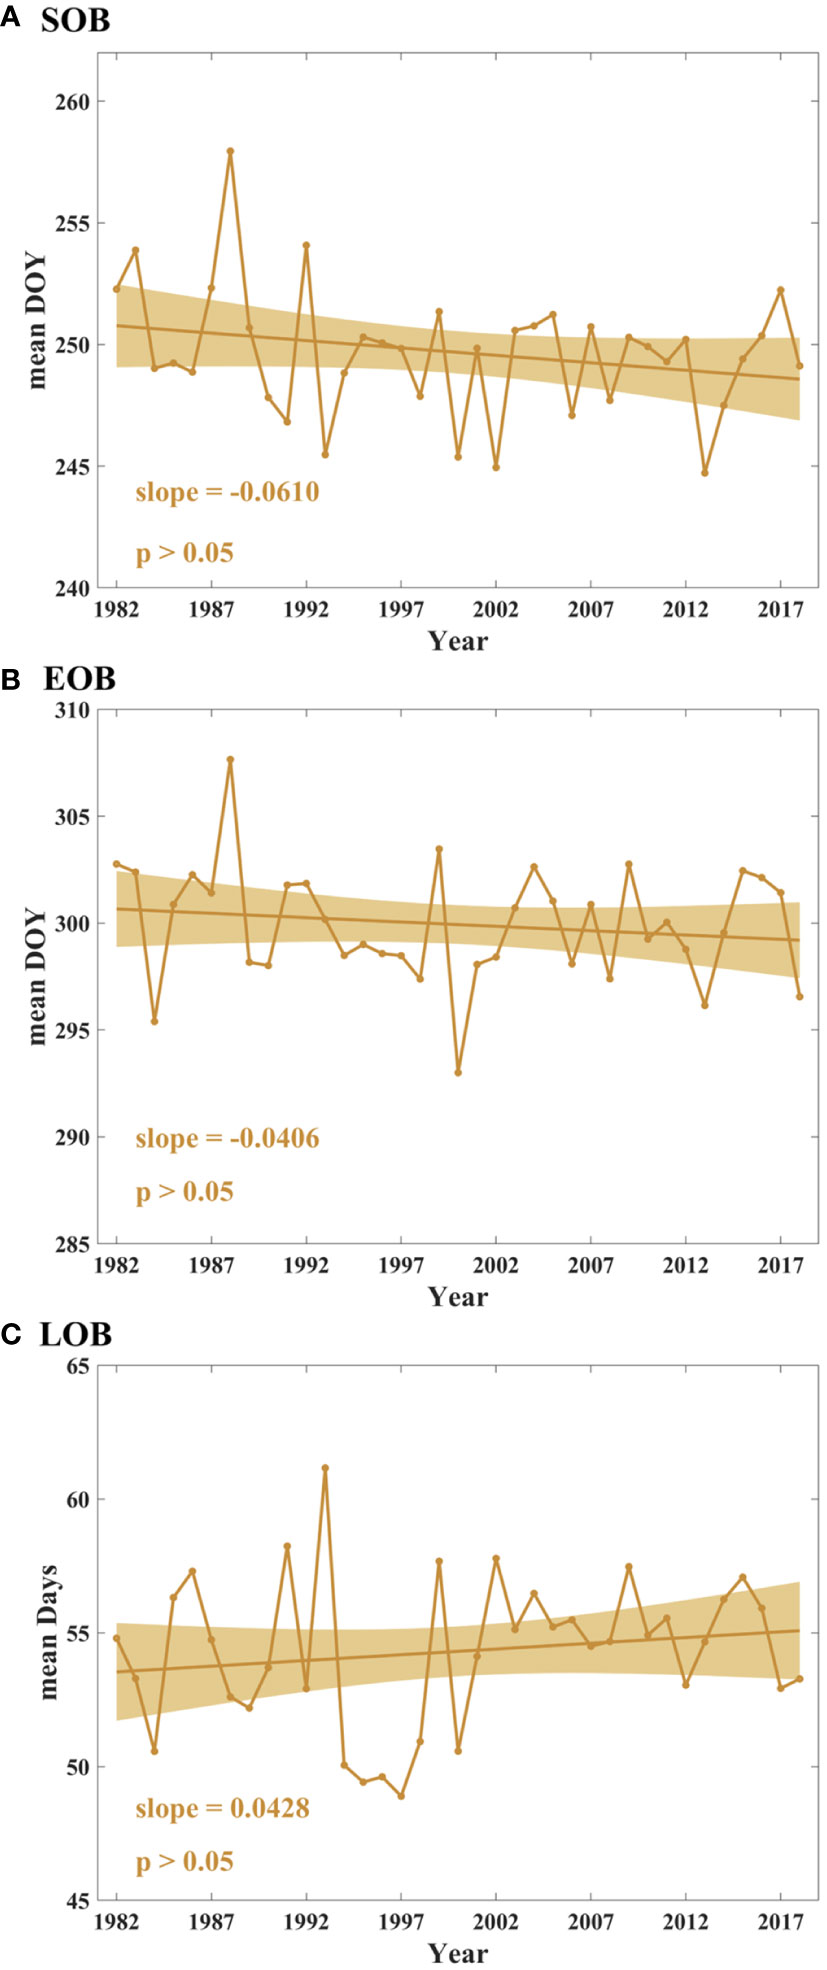
Figure 5 Temporal trends in SOB (A), EOB (B) and LOB (C) in the study area from 1982 to 2018. The colored solid lines denote the trend lines, and the colored bars represent 95% confidence intervals.
To further understand the trend variations in autumn phenology within the study area, we extracted the trends (1982–2018) of the annual mean SOB, EOB, and LOB for four categories of vegetated regions: forests, grasslands, croplands, and V_Urban (Figure 6). None of the four categories of vegetated regions exhibit statistically significant changes in SOB from 1982 to 2018 (Figure 6A). Figure 6B shows the trend in annual mean EOB across the four categories of vegetated regions from 1982 to 2018. Notably, in V_Urban, there is a statistically significant delayed trend in annual mean EOB, amounting to 0.1717 days yr–1 (p < 0.01). In forests, grasslands, and croplands, the annual mean EOB exhibits non-significant trends. Figure 6C illustrates the trend in annual mean LOB for the four categories of vegetated regions. Between 1982 and 2018, the annual mean LOB shows significantly extended trends of 0.1102 days yr–1 (p < 0.01) and 0.1798 days yr–1 (p < 0.05) in forests and V_Urban, respectively. However, annual mean LOB shows no statistically significant changes in grasslands and croplands.
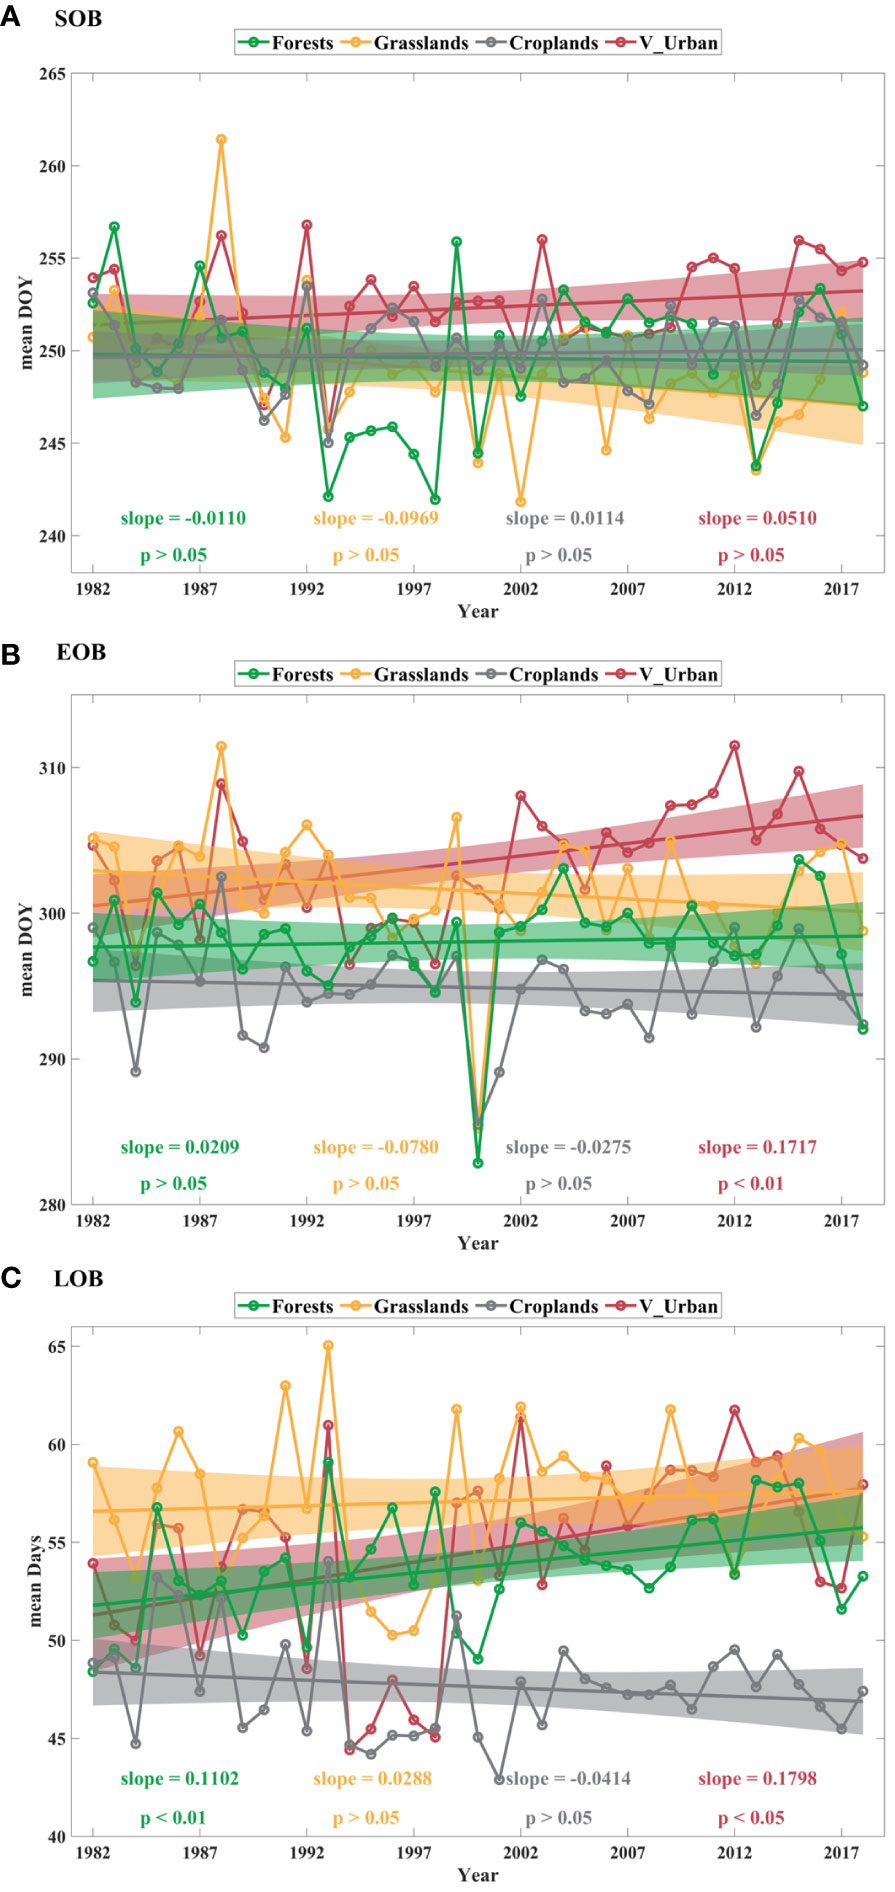
Figure 6 Temporal trends in annual mean SOB (A), EOB (B) and LOB (C) across the four categories of vegetated regions (forests, grasslands, croplands and V_Urban) from 1982 to 2018. The colored solid lines denote the trend lines, and the colored bars represent 95% confidence intervals.
Furthermore, we calculated the temporal trends of SOB, EOB, and LOB at each pixel for various vegetated regions in temperate China (Figure 7). From 1982 to 2018, autumn phenological metrics at the pixel level across the four categories of vegetated regions exhibited mixed local trends. As listed in Table 1, the autumn phenology in forests exhibits significant trends mainly in the southern, southwestern, northeastern, and central parts of temperate China. The autumn phenology in grasslands shows significant trends primarily in the southwestern, western, northwestern, northern, and central parts of the study area. The autumn phenology in croplands demonstrates significant trends mainly in the eastern, northwestern, northeastern, and central parts of temperate China. The autumn phenology in V_Urban manifests significant trends primarily in the eastern and northeastern parts of temperate China.
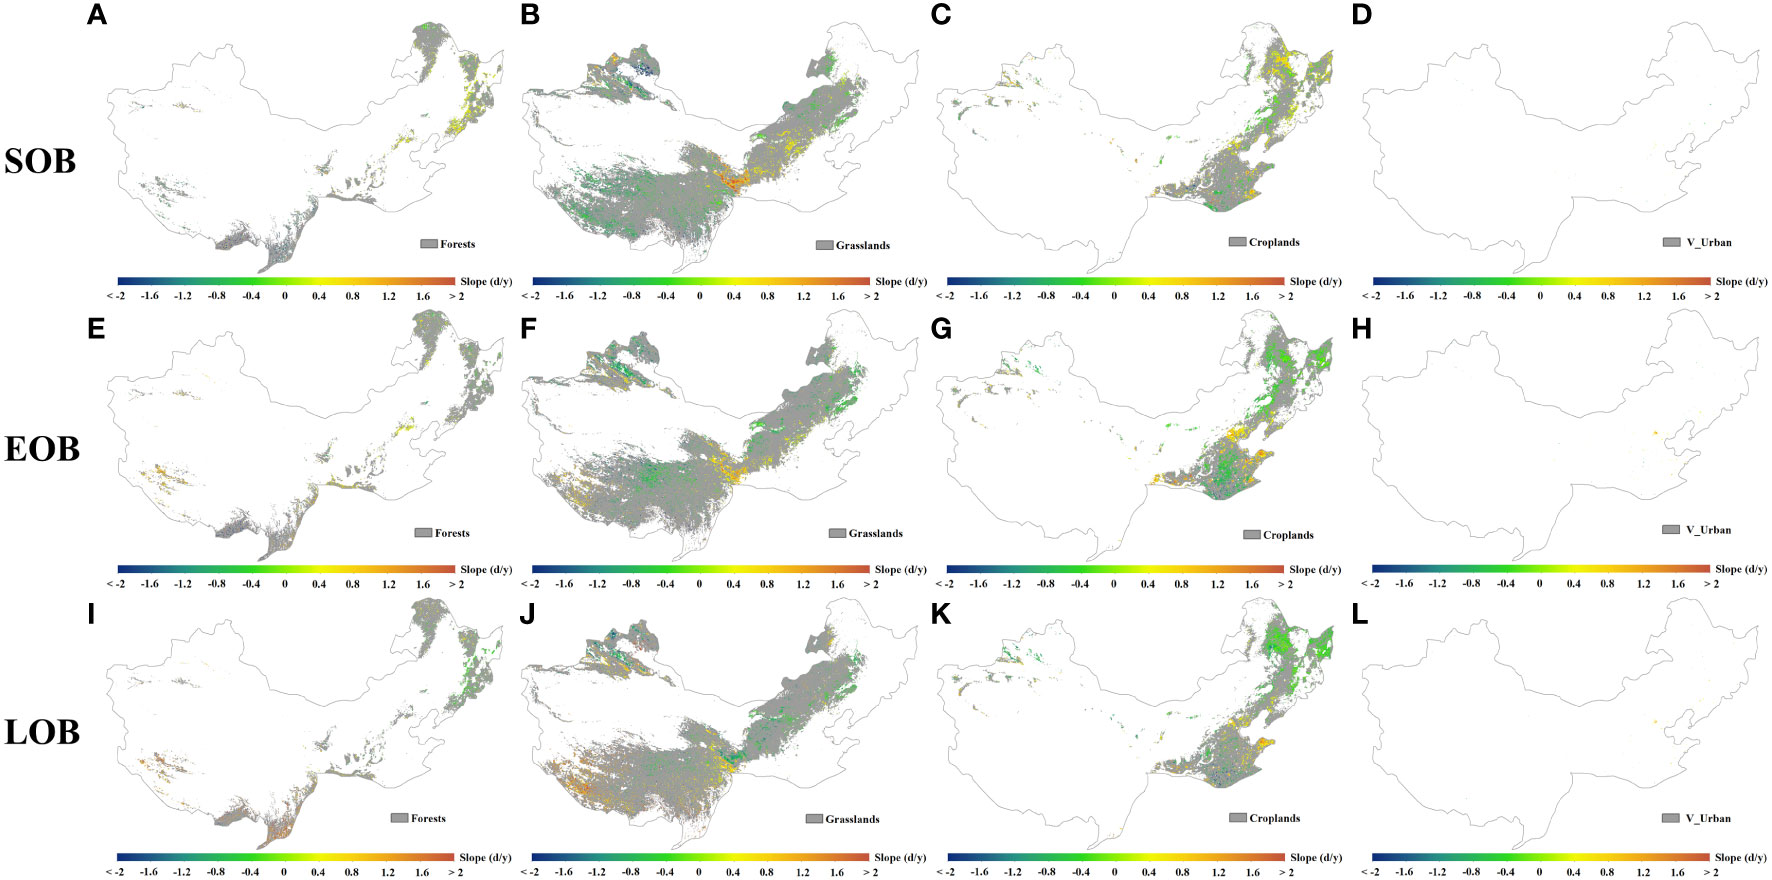
Figure 7 Temporal trends in SOB (A–D), EOB (E–H) and LOB (I–L) at pixel scale across the four categories of vegetated regions (forests, grasslands, croplands and V_Urban) from 1982 to 2018. Note that the trends in (A–L) are all significant at the 5% level.
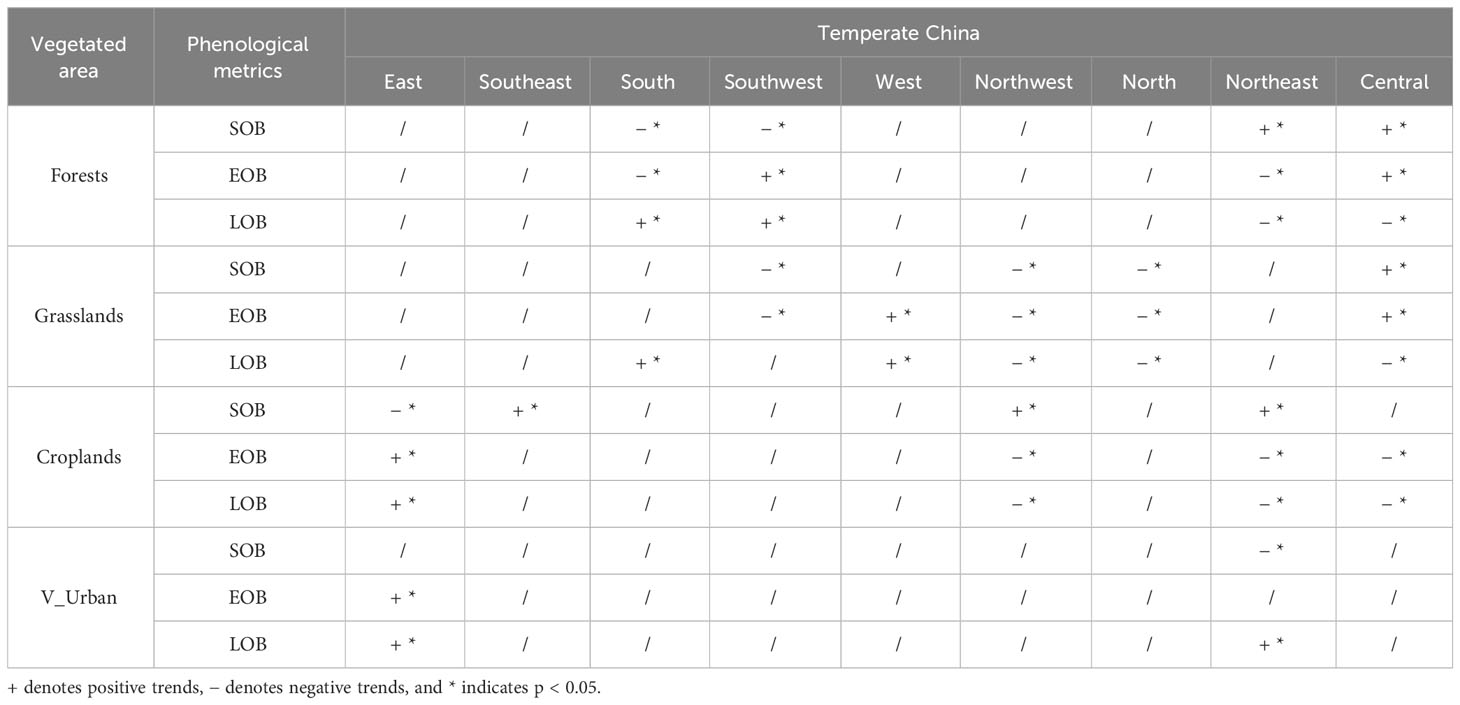
Table 1 Significance statistics of the temporal trends (1982–2018) for SOB, EOB and LOB across the study area.
To further quantify the localized trends in phenological metrics, we computed the percentage of pixels displaying significant trends in SOB, EOB, and LOB within various vegetated regions from 1982 to 2018 (Table 2). It was observed that the percentage of significantly delayed SOB_F (8.28%) and EOB_F (6.55%) pixels is nearly double that of significantly advanced SOB_F (4.24%) and EOB_F (3.47%) pixels, respectively. Furthermore, the percentage of significantly extended LOB_F (6.98%) pixels is greater than the percentage of significantly shortened LOB_F (5.26%) pixels. Conversely, in grasslands, SOB and EOB exhibited different trends compared to forests. The percentages of significantly advanced SOB_G (9.39%) and EOB_G (8.45%) pixels are nearly double those of significantly delayed SOB_G (4.31%) and EOB_G (4.32%) pixels, respectively. However, the results for LOB in grasslands are consistent with those in forests. The percentage of significantly extended LOB_G (6.06%) pixels exceeds the percentage of significantly shortened LOB_G (5.85%) pixels. In croplands, the percentage of significantly delayed SOB_C (11.19%) pixels is greater than the percentage of significantly advanced SOB_C (7.24%) pixels. Conversely, the percentage of significantly advanced EOB_C (17.48%) pixels is substantially greater than the percentage of significantly delayed EOB_C (7.55%) pixels. The percentage of significantly shortened LOB_C (16.98%) pixels is over three times higher than the percentage of significantly extended LOB_C (5.15%) pixels. In V_Urban, the percentage of significantly advanced SOB_U (6.49%) pixels is more than the percentage of significantly delayed SOB_U (5.90%) pixels. Conversely, the percentage of significantly delayed EOB_U (21.09%) pixels is significantly higher than the percentage of significantly advanced EOB_U (7.08%) pixels. The percentage of significantly extended LOB_U (13.57%) pixels exceeds the percentage of significantly shortened LOB_U (3.39%) pixels by more than four times.
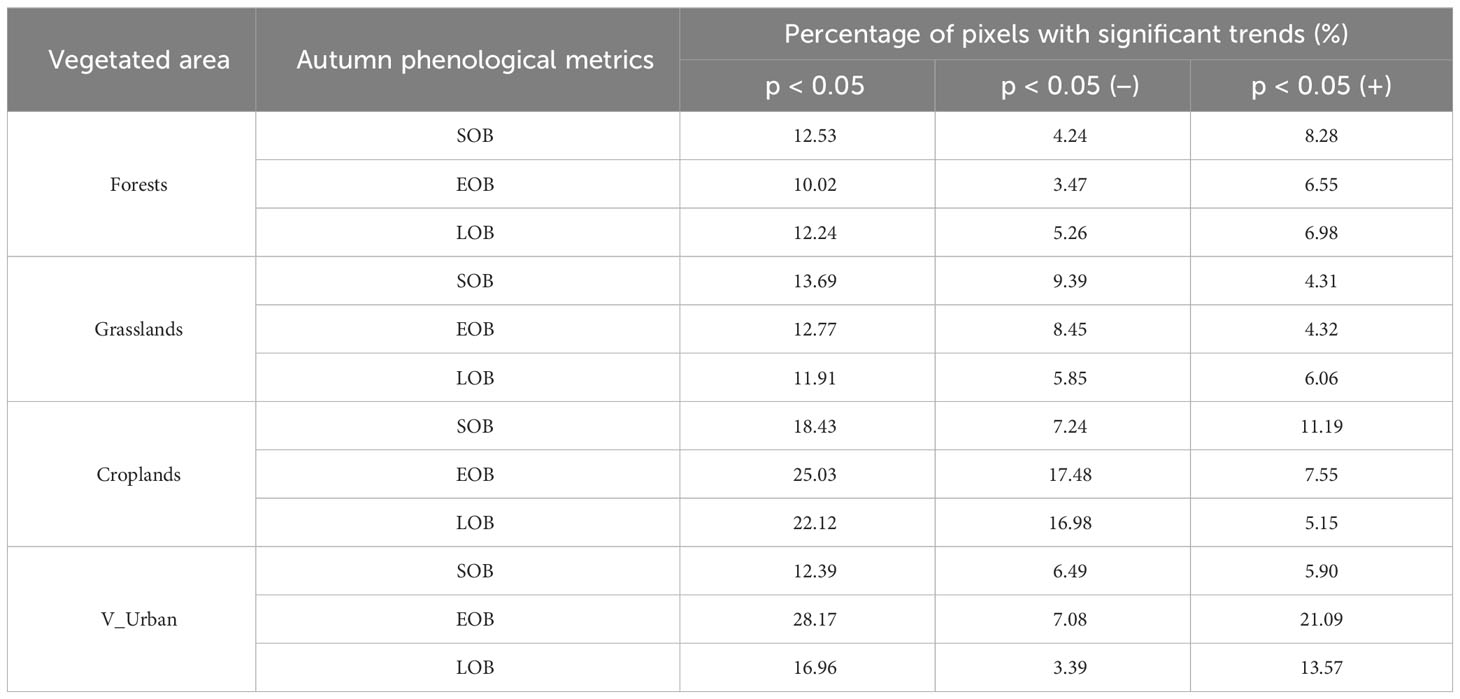
Table 2 Percentage of pixels with significant trends in SOB, EOB, and LOB across the four categories of vegetated regions.
4 Discussion
Recently, the examination of variations, attributions, and prediction related to autumn phenology has garnered significant attention in the realm of climate change research (Liu et al., 2016; Shen et al., 2020). The timing of EOG is frequently employed to account for autumn phenology (Wang et al., 2019; Xin et al., 2020). However, some studies have pointed out that the dates of senescence, in addition to the date of EOG, have important implications for vegetation growing season length and annual carbon uptake (Garonna et al., 2014; Garonna et al., 2016; Wu et al., 2022). Therefore, we recommend that the initiation, termination, and duration of the brown-down phase in vegetation should be collectively employed to characterize the autumn phenology of terrestrial vegetation. In this study, we utilized the GLSP dataset to extract annual SOB, EOB, and LOB data for temperate China spanning from 1982 through 2018. The spatial distributions of the mean SOB, EOB, and LOB (1982–2018) do not exhibit complete consistency. For instance, mean SOB exhibits relatively early timing in the northwest, northeast, and central regions of temperate China, whereas EOB is only relatively early in the northeast (Figures 3A, B). Furthermore, the mean LOB displays a spatial distribution pattern characterized by shorter duration in the east and longer duration in the west of temperate China (Figure 3C). Latitude, topography, and vegetation type are likely the key factors influencing the emergence of this spatial distribution pattern (Atkinson and Porter, 1996; White et al., 1997; Zhang et al., 2004; Piao et al., 2006). Along the latitudinal axis, all three metrics (i.e., mean SOB, EOB, and LOB) show significant negative trends as latitude increases. Note that there are fewer SOB and EOB pixels available for analysis in the low-latitude region (< 30°N), which contributes to larger errors (Figures 4A, B).
In recent decades, numerous studies have consistently reported a significant delay in autumn phenology, particularly EOG, in the Northern Hemisphere (Julien and Sobrino, 2009; Piao et al., 2019; Piao et al., 2020; Liang et al., 2021). However, the annual mean SOB, EOB and LOB for temperate China extracted in this study did not show significant trends from 1982 to 2018 (Figure 5). One possible explanation is the observed global warming hiatus between 1998 and 2012 (Medhaug et al., 2017; Wang et al., 2019). Given the variations in how different categories of vegetated regions respond to climate change, we also analyzed the trends in annual mean SOB, EOB, and LOB for the four categories of vegetated regions: forests, grasslands, croplands, and V_Urban, for the period from 1982 to 2018 (Figure 6). Our analysis revealed a significant delay in EOB for V_Urban at a rate of 0.1717 days yr–1 (p < 0.01, Figure 6B). Additionally, the LOB in V_Urban and forests extended significantly at a rate of 0.1798 days yr–1 (p < 0.05) and 0.1102 days yr–1 (p < 0.01), respectively (Figure 6C). No significant trend was observed in grasslands and croplands. However, a study suggests a long-term delay trend in grasslands in temperate China (Ma et al., 2022). One possible reason is the difference in vegetation indices and phenology retrieval methods used. It is worth noting that in specific regions, such as Inner Mongolia, Liu et al. (2016) found a long-term trend of early EOS in grasslands, similar to the results in this study (Figure 7F, Table 1). Furthermore, human activities play a crucial role in the long-term trends of autumn phenology, especially in urban and cropland areas. For instance, Li et al. (2017a) and Jia et al. (2021) noted that EOS in urban areas is later than surrounding regions, and an increase in urban size leads to a significant delay in autumn phenology. Li et al. (2017b) found a long-term delay trend of 0.5 days/year in EOS in urban areas. Liu et al. (2018) discovered a significant advance in wheat autumn phenology from 1981 to 2010 under the combined influence of climate change and crop management.
It is important to note certain limitations in this study. Firstly, we solely relied on a one-year land cover map to extract forests, grasslands, croplands, and V_Urban in temperate China. Long-term land use changes may adversely affect phenological analyses (Ma et al., 2022). Secondly, the spatial resolution of the remote sensing data used in this study is 0.05 degrees. Each pixel may encompass various types of vegetation, providing only a rough reflection of vegetation phenology within a certain region (Motohka et al., 2010; Shen et al., 2022; Li et al., 2023b). Particularly in urban areas, caution should be exercised in interpreting the acquired autumn phenological information. Future efforts should further enhance the use of high spatial resolution remote sensing data, such as 30m Landsat and 10m Sentinel-2 (Claverie et al., 2018; Bolton et al., 2020), as well as high-temporal-resolution remote sensing data, like observations every 10 minutes from Himawari-8 (Miura et al., 2019; Yan et al., 2019), to reduce the uncertainty in satellite-based phenological retrievals. Thirdly, the GLSD dataset used in this study lacks an evaluation of ground-based phenological observations in temperate China. Future research should utilize various available data sources, such as phenology cameras (Richardson et al., 2009; Nasahara and Nagai, 2015), in-situ phenological observations (Nagai et al., 2014; Nagai et al., 2017; Vitasse et al., 2018; Xin et al., 2020; Ruan et al., 2021), and internet-published phenological information (Nagai et al., 2020; Tsutsumida et al., 2022), to effectively assess satellite-retrieved phenological metrics.
In summary, there are significant variations in the autumn phenology across the different categories of vegetated regions. Therefore, future large-scale phenology studies should categorize and analyze data based on land cover types, instead of relying solely on statistical analysis within study areas. In addition, the spatial distributions and temporal trends of SOB, EOB, and LOB do not exhibit full consistency at both regional and pixel scales. To further understand global climate change and improve the accuracy of carbon and water flux modeling, it is imperative to incorporate SOB, EOB, and LOB collectively in future autumn phenology estimation.
5 Conclusions
This study extracted annual autumn phenological metrics, including SOB, EOB, and LOB, for temperate China from 1982 to 2018 using the self-developed GLSP phenology product. We conducted a comparative analysis of SOB, EOB, and LOB in relation to their spatial distribution, temporal trends, and various categories of vegetated regions. The following are our findings: (1) Despite that SOB, EOB, and LOB are not completely consistent in their spatial distribution, all of them show significant negative trends with increasing latitude. (2) From 1982 to 2018, annual mean SOB, EOB and LOB in temperate China do not exhibit significant trends. However, EOB and LOB in V_Urban, as well as LOB in forests, exhibit significant positive trends. (3) At the local pixel scale, SOB, EOB, and LOB exhibit mixed trends across various vegetated region categories. Note that the trends of the same phenological metric are not entirely consistent among different vegetated region categories.
In conclusion, this study examined the commonalities and disparities in autumn phenology among different categories of terrestrial vegetated regions. The interconnection and independence of the SOB, EOB, and LOB metrics drive the long-term changes and development of autumn phenology. The use of multiple phenological metrics enhances our comprehensive understanding of how autumn phenology responds to climate change. For future large-scale phenology estimation and numerical modeling, it is advisable to incorporate additional potential phenological metrics to explore the impacts of climate change on vegetation ecosystems.
Data availability statement
Publicly available datasets were analyzed in this study. This data can be found here: https://doi.org/10.6084/m9.figshare.20375394.v2.
Author contributions
SW: Conceptualization, Funding acquisition, Methodology, Writing – original draft. WW: Conceptualization, Methodology, Software, Visualization, Writing – original draft, Writing – review & editing.
Funding
The author(s) declare financial support was received for the research, authorship, and/or publication of this article. This research is supported by China Postdoctoral Science Foundation (grant no. 2023M731252) and Natural Science Special (Special Post) Scientific Research Fund Project of Guizhou University (Project No. Guizhou University Special Post (2023) 68).
Acknowledgments
We sincerely thank the researchers and investigators who are involved in collecting and sharing the land surface phenology dataset.
Conflict of interest
The authors declare that the research was conducted in the absence of any commercial or financial relationships that could be construed as a potential conflict of interest.
Publisher’s note
All claims expressed in this article are solely those of the authors and do not necessarily represent those of their affiliated organizations, or those of the publisher, the editors and the reviewers. Any product that may be evaluated in this article, or claim that may be made by its manufacturer, is not guaranteed or endorsed by the publisher.
References
Archetti M., Richardson A. D., O'Keefe J., Delpierre N. (2013). Predicting climate change impacts on the amount and duration of autumn colors in a New England forest. PLoS One 8, e57373. doi: 10.1371/journal.pone.0057373
Atkinson D., Porter J. R. (1996). Temperature, plant development and crop yields. Trends Plant Sci. 1, 119–124. doi: 10.1016/S1360-1385(96)90006-0
Bolton D. K., Gray J. M., Melaas E. K., Moon M., Eklundh L., Friedl M. A. (2020). Continental-scale land surface phenology from harmonized Landsat 8 and Sentinel-2 imagery. Remote Sens. Environ. 240, 111685. doi: 10.1016/j.rse.2020.111685
Claverie M., Ju J., Masek J. G., Dungan J. L., Vermote E. F., Roger J.-C., et al. (2018). The Harmonized Landsat and Sentinel-2 surface reflectance data set. Remote Sens. Environ. 219, 145–161. doi: 10.1016/j.rse.2018.09.002
Ganguly S., Friedl M. A., Tan B., Zhang X., Verma M. (2010). Land surface phenology from MODIS: Characterization of the Collection 5 global land cover dynamics product. Remote Sens. Environ. 114, 1805–1816. doi: 10.1016/j.rse.2010.04.005
Garonna I., de Jong R., Schaepman M. E. (2016). Variability and evolution of global land surface phenology over the past three decades, (1982-2012). Global Change Biol. 22, 1456–1468. doi: 10.1111/gcb.13168
Garonna I., de Jong R., de Wit A. J., Mucher C. A., Schmid B., Schaepman M. E. (2014). Strong contribution of autumn phenology to changes in satellite-derived growing season length estimates across Europe, (1982-2011). Global Change Biol. 20, 3457–3470. doi: 10.1111/gcb.12625
Gauzere J., Teuf B., Davi H., Chevin L. M., Caignard T., Leys B., et al. (2020). Where is the optimum? Predicting the variation of selection along climatic gradients and the adaptive value of plasticity. A case study on tree phenology. Evol. Lett. 4, 109–123. doi: 10.1002/evl3.160
Jia W., Zhao S., Zhang X., Liu S., Henebry G. M., Liu L. (2021). Urbanization imprint on land surface phenology: The urban-rural gradient analysis for Chinese cities. Global Change Biol. 27, 2895–2904. doi: 10.1111/gcb.15602
Julien Y., Sobrino J. A. (2009). Global land surface phenology trends from GIMMS database. Int. J. Remote Sens. 30, 3495–3513. doi: 10.1080/01431160802562255
Keenan T. F., Gray J., Friedl M. A., Toomey M., Bohrer G., Hollinger D. Y., et al. (2014). Net carbon uptake has increased through warming-induced changes in temperate forest phenology. Nat. Clim. Change 4, 598–604. doi: 10.1038/nclimate2253
Klosterman S., Melaas E., Wang J. A., Martinez A., Frederick S., O’Keefe J., et al. (2018). Fine-scale perspectives on landscape phenology from unmanned aerial vehicle (UAV) photography. Agric. For. Meteorol. 248, 397–407. doi: 10.1016/j.agrformet.2017.10.015
Klosterman S., Richardson A. D. (2017). Observing spring and fall phenology in a deciduous forest with aerial drone imagery. Sensors 17, 2852. doi: 10.3390/s17122852
Korner C., Basler D. (2010). Phenology under global warming. Science 327, 1461–1462. doi: 10.1126/science.1186473
Li C., Li Z., Zhang F., Lu Y., Duan C., Xu Y. (2023b). Seasonal dynamics of carbon dioxide and water fluxes in a rice-wheat rotation system in the Yangtze-Huaihe region of China. Agr. Water Manage. 275, 107992. doi: 10.1016/j.agwat.2022.107992
Li X., Zhou Y., Asrar G. R., Mao J., Li X., Li W. (2017a). Response of vegetation phenology to urbanization in the conterminous United States. Global Change Biol. 23, 2818–2830. doi: 10.1111/gcb.13562
Li X., Zhou Y., Asrar G. R., Meng L. (2017b). Characterizing spatiotemporal dynamics in phenology of urban ecosystems based on Landsat data. Sci. Total Environ. 605-606, 721–734. doi: 10.1016/j.scitotenv.2017.06.245
Li Z., Wu Y., Wang R., Liu B., Qian Z., Li C. (2023a). Assessment of climatic impact on vegetation spring phenology in northern China. Atmosphere 14 (1), 117. doi: 10.3390/atmos14010117
Liang L., Henebry G. M., Liu L., Zhang X., Hsu L. C. (2021). Trends in land surface phenology across the conterminous United States, (1982-2016) analyzed by NEON domains. Ecol. Appl. 31, e02323. doi: 10.1002/eap.2323
Liu Y., Chen Q., Ge Q., Dai J., Qin Y., Dai L., et al. (2018). Modelling the impacts of climate change and crop management on phenological trends of spring and winter wheat in China. Agric. For. Meteorol. 248, 518–526. doi: 10.1016/j.agrformet.2017.09.008
Liu Q., Fu Y. H., Zeng Z., Huang M., Li X., Piao S. (2016). Temperature, precipitation, and insolation effects on autumn vegetation phenology in temperate China. Global Change Biol. 22, 644–655. doi: 10.1111/gcb.13081
Liu Y., Hill M. J., Zhang X., Wang Z., Richardson A. D., Hufkens K., et al. (2017). Using data from Landsat, MODIS, VIIRS and PhenoCams to monitor the phenology of California oak/grass savanna and open grassland across spatial scales. Agric. For. Meteorol. 237, 311–325. doi: 10.1016/j.agrformet.2017.02.026
Liu Y., Wu C., Sonnentag O., Desai A. R., Wang J. (2020). Using the red chromatic coordinate to characterize the phenology of forest canopy photosynthesis. Agric. For. Meteorol. 285, 107910. doi: 10.1016/j.agrformet.2020.107910
Loveland T. R., Belward A. S. (1997). The IGBP-DIS global 1km land cover data set, DISCover: First results. Int. J. Remote Sens. 18, 3289–3295. doi: 10.1080/014311697217099
Ma R., Shen X., Zhang J., Xia C., Liu Y., Wu L., et al. (2022). Variation of vegetation autumn phenology and its climatic drivers in temperate grasslands of China. Int. J. Appl. Earth Obs. Geoinf. 114, 103064. doi: 10.1016/j.jag.2022.103064
Medhaug I., Stolpe M. B., Fischer E. M., Knutti R. (2017). Reconciling controversies about the 'global warming hiatus'. Nature 545, 41–47. doi: 10.1038/nature22315
Miura T., Nagai S., Takeuchi M., Ichii K., Yoshioka H. (2019). Improved characterisation of vegetation and land surface seasonal dynamics in Central Japan with Himawari-8 hypertemporal data. Sci. Rep. 9, 15692. doi: 10.1038/s41598-019-52076-x
Moon M., Zhang X., Henebry G. M., Liu L., Gray J. M., Melaas E. K., et al. (2019). Long-term continuity in land surface phenology measurements: A comparative assessment of the MODIS land cover dynamics and VIIRS land surface phenology products. Remote Sens. Environ. 226, 74–92. doi: 10.1016/j.rse.2019.03.034
Morisette J. T., Richardson A. D., Knapp A. K., Fisher J. I., Graham E. A., Abatzoglou J., et al. (2009). Tracking the rhythm of the seasons in the face of global change: phenological research in the 21st century. Front. Ecol. Environ. 7, 253–260. doi: 10.1890/070217
Motohka T., Nasahara K. N., Oguma H., Tsuchida S. (2010). Applicability of green-red vegetation index for remote sensing of vegetation phenology. Remote Sens. 2, 2369–2387. doi: 10.3390/rs2102369
Nagai S., Akitsu T., Saitoh T. M., Busey R. C., Fukuzawa K., Honda Y., et al. (2018). 8 million phenological and sky images from 29 ecosystems from the Arctic to the tropics: the Phenological Eyes Network. Ecol. Res. 33, 1091–1092. doi: 10.1007/s11284-018-1633-x
Nagai S., Inoue T., Ohtsuka T., Kobayashi H., Kurumado K., Muraoka H., et al. (2014). Relationship between spatio-temporal characteristics of leaf-fall phenology and seasonal variations in near surface- and satellite-observed vegetation indices in a cool-temperate deciduous broad-leaved forest in Japan. Int. J. Remote Sens. 35, 3520–3536. doi: 10.1080/01431161.2014.907937
Nagai S., Nasahara K. N., Yoshitake S., Saitoh T. M. (2017). Seasonality of leaf litter and leaf area index data for various tree species in a cool-temperate deciduous broad-leaved forest, Japan 2005–2014. Ecol. Res. 32, 297–297. doi: 10.1007/s11284-017-1452-5
Nagai S., Saitoh T. M., Miura T. (2020). Peak autumn leaf colouring along latitudinal and elevational gradients in Japan evaluated with online phenological data. Int. J. Biometeorol. 64, 1743–1754. doi: 10.1007/s00484-020-01953-6
Nagai S., Saitoh T. M., Nasahara K. N., Suzuki R. (2015). Spatio-temporal distribution of the timing of start and end of growing season along vertical and horizontal gradients in Japan. Int. J. Biometeorol. 59, 47–54. doi: 10.1007/s00484-014-0822-8
Nasahara K. N., Nagai S. (2015). Review: Development of an in situ observation network for terrestrial ecological remote sensing: the Phenological Eyes Network (PEN). Ecol. Res. 30, 211–223. doi: 10.1007/s11284-014-1239-x
Piao S., Ciais P., Friedlingstein P., Peylin P., Reichstein M., Luyssaert S., et al. (2008). Net carbon dioxide losses of northern ecosystems in response to autumn warming. Nature 451, 49–52. doi: 10.1038/nature06444
Piao S., Fang J., Zhou L., Ciais P., Zhu B. (2006). Variations in satellite-derived phenology in China's temperate vegetation. Global Change Biol. 12, 672–685. doi: 10.1111/j.1365-2486.2006.01123.x
Piao S., Liu Q., Chen A., Janssens I. A., Fu Y., Dai J., et al. (2019). Plant phenology and global climate change: Current progresses and challenges. Global Change Biol. 25, 1922–1940. doi: 10.1111/gcb.14619
Piao S., Wang X., Park T., Chen C., Lian X., He Y., et al. (2020). Characteristics, drivers and feedbacks of global greening. Nat. Rev. Earth Environ. 1, 14–27. doi: 10.1038/s43017-019-0001-x
Richardson A. D., Anderson R. S., Arain M. A., Barr A. G., Bohrer G., Chen G., et al. (2012). Terrestrial biosphere models need better representation of vegetation phenology: results from the North American Carbon Program Site Synthesis. Global Change Biol. 18, 566–584. doi: 10.1111/j.1365-2486.2011.02562.x
Richardson A. D., Hollinger D. Y., Dail D. B., Lee J. T., Munger J. W., O'Keefe J. (2009). Influence of spring phenology on seasonal and annual carbon balance in two contrasting New England forests. Tree Physiol. 29, 321–331. doi: 10.1093/treephys/tpn040
Richardson A. D., Hufkens K., Milliman T., Aubrecht D. M., Chen M., Gray J. M., et al. (2018b). Tracking vegetation phenology across diverse North American biomes using PhenoCam imagery. Sci. Data 5, 180028. doi: 10.1038/sdata.2018.28
Richardson A. D., Hufkens K., Milliman T., Aubrecht D. M., Furze M. E., Seyednasrollah B., et al. (2018a). Ecosystem warming extends vegetation activity but heightens vulnerability to cold temperatures. Nature 560, 368–371. doi: 10.1038/s41586-018-0399-1
Ruan Y., Zhang X., Xin Q., Sun Y., Ao Z., Jiang X. (2021). A method for quality management of vegetation phenophases derived from satellite remote sensing data. Int. J. Remote Sens. 42, 5801–5820. doi: 10.1080/01431161.2021.1931534
Sakamoto T., Yokozawa M., Toritani H., Shibayama M., Ishitsuka N., Ohno H. (2005). A crop phenology detection method using time-series MODIS data. Remote Sens. Environ. 96, 366–374. doi: 10.1016/j.rse.2005.03.008
Seyednasrollah B., Young A. M., Hufkens K., Milliman T., Friedl M. A., Frolking S., et al. (2019). Tracking vegetation phenology across diverse biomes using Version 2.0 of the PhenoCam Dataset. Sci. Data 6, 222. doi: 10.1038/s41597-019-0229-9
Shen M., Jiang N., Peng D., Rao Y., Huang Y., Fu Y. H., et al. (2020). Can changes in autumn phenology facilitate earlier green-up date of northern vegetation? Agric. For. Meteorol. 291, 108077. doi: 10.1016/j.agrformet.2020.108077
Shen X., Liu B., Henderson M., Wang L., Jiang M., Lu X. (2022). Vegetation greening, extended growing seasons, and temperature feedbacks in warming temperate grasslands of China. J. Clim. 35, 5103–5117. doi: 10.1175/JCLI-D-21-0325.1
Shin N., Maruya Y., Saitoh T. M., Tsutsumida N. (2021a). Usefulness of social sensing using text mining of tweets for detection of autumn phenology. Front. For. Global Change 4, 659910. doi: 10.3389/ffgc.2021.659910
Shin N., Saitoh T. M., Nasahara K. N. (2021b). How did the characteristics of the growing season change during the past 100 years at a steep river basin in Japan? PLoS One 16, e0255078. doi: 10.1371/journal.pone.0255078
Slayback D. A., Pinzon J. E., Los S. O., Tucker C. J. (2003). Northern hemisphere photosynthetic trends 1982–99. Global Change Biol. 9, 1–15. doi: 10.1046/j.1365-2486.2003.00507.x
Tsutsumida N., Shin N., Miura T. (2022). Evaluation of land surface phenology for autumn leaf color change based on citizen reports across Japan. Remote Sens. 14, 2017. doi: 10.3390/rs14092017
Vitasse Y., Signarbieux C., Fu Y. H. (2018). Global warming leads to more uniform spring phenology across elevations. Proc. Natl. Acad. Sci. U.S.A. 115, 1004–1008. doi: 10.1073/pnas.1717342115
Wang X., Xiao J., Li X., Cheng G., Ma M., Zhu G., et al. (2019). No trends in spring and autumn phenology during the global warming hiatus. Nat. Commun. 10, 2389. doi: 10.1038/s41467-019-10235-8
White M. A., de Beurs K. M., Didan K., Inouye D. W., Richardson A. D., Jensen O. P., et al. (2009). Intercomparison, interpretation, and assessment of spring phenology in North America estimated from remote sensing for 1982-2006. Global Change Biol. 15, 2335–2359. doi: 10.1111/j.1365-2486.2009.01910.x
White M. A., Thornton P. E., Running S. W. (1997). A continental phenology model for monitoring vegetation responses to interannual climatic variability. Global Biogeochem. Cycles 11, 217–234. doi: 10.1029/97GB00330
Wu W., Li Z., Zhang Z., Yan C., Xiao K., Wang Y., et al. (2023). Developing global annual land surface phenology datasets, (1982–2018) from the AVHRR data using multiple phenology retrieval methods. Ecol. Indic. 150, 110262. doi: 10.1016/j.ecolind.2023.110262
Wu C., Peng J., Ciais P., Peñuelas J., Wang H., Beguería S., et al. (2022). Increased drought effects on the phenology of autumn leaf senescence. Nat. Clim. Change 12, 943–949. doi: 10.1038/s41558-022-01464-9
Wu W., Sun Y., Xiao K., Xin Q. (2021). Development of a global annual land surface phenology dataset for 1982–2018 from the AVHRR data by implementing multiple phenology retrieving methods. Int. J. Appl. Earth Obs. Geoinf. 103, 102487. doi: 10.1016/j.jag.2021.102487
Wu W., Xin Q. (2023). Characterizing spring phenological changes of the land surface across the conterminous United States from 2001 to 2021. Remote Sens. 15, 737. doi: 10.3390/rs15030737
Xie Y., Wang X., Wilson A. M., Silander J. A. (2018). Predicting autumn phenology: How deciduous tree species respond to weather stressors. Agric. For. Meteorol. 250-251, 127–137. doi: 10.1016/j.agrformet.2017.12.259
Xin Q., Broich M., Zhu P., Gong P. (2015). Modeling grassland spring onset across the Western United States using climate variables and MODIS-derived phenology metrics. Remote Sens. Environ. 161, 63–77. doi: 10.1016/j.rse.2015.02.003
Xin Q., Li J., Li Z., Li Y., Zhou X. (2020). Evaluations and comparisons of rule-based and machine-learning-based methods to retrieve satellite-based vegetation phenology using MODIS and USA National Phenology Network data. Int. J. Appl. Earth Obs. Geoinf. 93, 102189. doi: 10.1016/j.jag.2020.102189
Yan D., Zhang X., Nagai S., Yu Y., Akitsu T., Nasahara K. N., et al. (2019). Evaluating land surface phenology from the Advanced Himawari Imager using observations from MODIS and the Phenological Eyes Network. Int. J. Appl. Earth Obs. Geoinf. 79, 71–83. doi: 10.1016/j.jag.2019.02.011
Zhang X. Y., Friedl M. A., Schaaf C. B., Strahler A. H. (2004). Climate controls on vegetation phenological patterns in northern mid- and high latitudes inferred from MODIS data. Global Change Biol. 10, 1133–1145. doi: 10.1111/j.1529-8817.2003.00784.x
Zhang X. Y., Friedl M. A., Schaaf C. B., Strahler A. H., Hodges J. C. F., Gao F., et al. (2003). Monitoring vegetation phenology using MODIS. Remote Sens. Environ. 84, 471–475. doi: 10.1016/S0034-4257(02)00135-9
Keywords: autumn phenology, the start of brown-down phase (SOB), the end of brown-down phase (EOB), the length of brown-down phase (LOB), temporal trends, temperate China
Citation: Wu S and Wu W (2024) Understanding spatio-temporal variation of autumn phenology in temperate China from 1982 to 2018. Front. Ecol. Evol. 11:1332116. doi: 10.3389/fevo.2023.1332116
Received: 02 November 2023; Accepted: 21 December 2023;
Published: 09 January 2024.
Edited by:
Xudong Zhu, Xiamen University, ChinaReviewed by:
Xiangjin Shen, Chinese Academy of Sciences (CAS), ChinaNagai Shin, Japan Agency for Marine-Earth Science and Technology, Japan
Binhui Liu, Northeast Forestry University, China
Cheng Li, Yangzhou University, China
Copyright © 2024 Wu and Wu. This is an open-access article distributed under the terms of the Creative Commons Attribution License (CC BY). The use, distribution or reproduction in other forums is permitted, provided the original author(s) and the copyright owner(s) are credited and that the original publication in this journal is cited, in accordance with accepted academic practice. No use, distribution or reproduction is permitted which does not comply with these terms.
*Correspondence: Wei Wu, d2VpdzA5MDNAMTYzLmNvbQ==