 Kajar Köster
 Heidi Aaltonen2
 Frank Berninger
 Jukka Pumpanen
94% of researchers rate our articles as excellent or good
Learn more about the work of our research integrity team to safeguard the quality of each article we publish.
Find out more
ORIGINAL RESEARCH article
Front. Ecol. Evol. , 03 January 2024
Sec. Interdisciplinary Climate Studies
Volume 11 - 2023 | https://doi.org/10.3389/fevo.2023.1331018
This article is part of the Research Topic Disturbance, Risk and Management of Soil Carbon Pool View all articles
Boreal forests are one of the most important biomes storing carbon (C). Wildfires burn yearly on average more than 1% of the boreal forest, and it is expected that the fire return intervals will shorten due to climate change. Fire is one of the most influential factors affecting soil organic matter quantity and quality, soil C pools, and presumably also the time C resides in the soil (soil C turnover time in years). We compared the potential effects of forest fire through post-fire succession on soil carbon dioxide (CO2) emission rates and soil C turnover time in two fire chronosequences, one with underlying permafrost soil and the other without permafrost. We found that fire had a significant effect on potential soil C turnover times, but surprisingly there was no significant difference in soil C turnover times between the permafrost and non-permafrost areas, although the soil CO2 emissions rates in permafrost areas are approximately three times higher compared to non-permafrost areas. In recently burned areas the potential soil C turnover times were two times longer compared to control areas located in forests burned more than 100 years ago. The longest potential soil C turnover times were recorded in mineral soil layers (30 cm) of permafrost soils, and the shortest potential soil C turnover times were recorded in humus layers of non-permafrost areas.
Boreal forests are one of the most important biomes storing carbon (C), as they represent approximately one-third of the world’s soil C pool (Pan et al., 2011). Boreal forests grow in the region of continuous and discontinuous permafrost soils (Helbig et al., 2016), and these soils store significant amounts of soil C in a frozen state – a pool that has been predicted to become vulnerable to decomposition as possibly one-fourth of permafrost might thaw by the end of this century (Davidson and Janssens, 2006). It has been estimated that 30–60 Pg of permafrost stored C could be lost by 2040 (Deluca and Boisvenue, 2012). Permafrost thaw is further enhanced by forest fires, which by burning the insulating soil organic layer and decreasing the albedo of the soil surface (by the destruction of vegetation and darkening of soil surface) increase soil temperatures (Jorgenson et al., 2010; French et al., 2016; Gibson et al., 2018).
Already today, global warming has increased the occurrence and severity of forest fires (Balshi et al., 2009; de Groot et al., 2013; Tyukavina et al., 2022) due to longer droughts, earlier snowmelt, and a longer fire season (Girardin et al., 2009; Boulanger et al., 2013). In Canada, around 18 471 km2 of forest burns annually, 92% of which is in the boreal region (Krezek-Hanes et al., 2011). Fires are vital for forest regeneration and biodiversity, but they also turn forests from C sinks to C sources for decades, as significant amounts of C are released into the atmosphere during the fire (Kurz and Apps, 1994), and in post-fire succession and decomposition processes. Depending on the fire intensity and severity, fires are found to burn about 15–35% of the aboveground and 37–70% of ground layer biomass (Yarie and Billings, 2002; van Leeuwen et al., 2014). Post-fire recovery of C pools depends on forest production rate, the decomposition rate of organic matter, and C losses due to natural disturbances (Kasischke et al., 1995; de Groot et al., 2003). The shortening of the fire return interval in boreal forests will lead to a reduction in stored C pools (Miquelajauregui et al., 2019), as due to the cold climate the recovery time of these ecosystems is still slow.
Turnover time of C, also called C residence time, describes the mean residence time of C in an ecosystem (Hakkenberg et al., 2008; Carvalhais et al., 2014) and is a useful measure to estimate soil C stability (Luo et al., 2019). Carbon turnover time is defined as the ratio of the total soil organic C pool to C outputs or C inputs assuming a steady state (Luo et al., 2019). However, in reality, it is difficult to find soils that are completely in the steady state because of natural and anthropogenic disturbances (e.g., fire and land-use change) and climate variability (Luo et al., 2019). The residence time of C can be determined from direct soil CO2 fluxes if C stocks, and both heterotrophic (originating from soil organisms and decomposition) and autotrophic respiration (originating from roots) are known (Kuzyakov, 2006). For this reason, field measurements of CO2 flux and incubation measurements are often simultaneously utilized, as they allow the separation of respiration components. Chamber measurements in field conditions measure the soil respiration (heterotrophic + autotrophic), whereas incubation experiments enable the determination of the heterotrophic component while living roots are removed from the incubated samples (therefore it is important to point out that these are potential heterotrophic respiration rates, not in situ rates). Turnover times are controlled by different factors, such as climatic stabilization, chemical recalcitrance, physical stabilization, and stabilization related to the decomposer community (Trumbore, 2009). Climatic stabilization relates to thermal and moisture conditions regulating decomposition (Schuur et al., 2008). Chemical recalcitrance refers to the degradability of the litter or soil organic matter (SOM) (Lützow et al., 2006), while physical stabilization largely depends on the interactions of soil organic C with the soil mineral matrix that forms strong chemical bonds or causes inaccessibility of the soil C to decompose organisms or their enzymes (Goh, 2004). Different plant species and parts decompose at different rates based on their chemical composition (Cornwell et al., 2008). For example, broadleaf litter is generally thought to have a higher decomposition rate than conifer litter (Prescott et al., 2000). As broadleaved species tend to dominate in early forest succession, giving way to conifers with increasing stand age, the degradability of litter also varies during the forest succession. Also, soil temperature affects microbial activity and thus decomposition rate and turnover time (Deluca and Boisvenue, 2012). In colder climates soil C is often more labile, but in these conditions climatic conditions limit decomposition, while in warmer climates soil C is more recalcitrant (Xu et al., 2015). However, typically the turnover time of C is longer in northern latitudes than closer to the equator, with northern latitudes averaging 255 and the tropics 15 years (Carvalhais et al., 2014). For example, Wang et al. (2018) reported in Chinese boreal soils C turnover times were around 75–80 years, and Köster et al. (2014) showed that in post-fire Finnish boreal soils C turnover times ranged from 60 to 117 years. In addition, different studies have reported high variation in values depending on the area and studied soil horizons (Carvalhais et al., 2014; Wang et al., 2018; Luo et al., 2019). Besides cold temperatures, the turnover times in the northern soils are further dominated by water-logging, permafrost, and interactions with soil organic C quality (Hobbie et al., 2000). In addition, the ground vegetation of these ecosystems is often dominated by slowly degrading vegetation such as mosses, and it has been suggested that the effect of substrate quality on decomposition rate can be even greater than the effect of temperature (Hobbie et al., 2000). Yet, temperature governs the activity of the microbial community and soil moisture conditions. The freezing point of soil water near 0°C is a threshold temperature, decreasing microbial activity noticeably (Monson et al., 2006; Schuur et al., 2008). Thus, the microbial activity in permafrost soil is inhibited by the presence of ice and cold temperatures, leading to longer C turnover times in northern latitudes (Frank et al., 2012).
The stability of soil organic C at the ecosystem level depends on two fluxes: incoming C via gross primary production and loss of C through respiration, export or loss in a fire, etc. (Carvalhais et al., 2014). In soils, these would be the input of C in litterfall, roots, and carcasses and the outputs would be through processes such as decomposition, leaching, run-off, or burning. The C in soils is traditionally divided into several pools with varying turnover times depending on their degradability. These pools are utilized by soil organic C models, such as RothC (Coleman et al., 1997) and Yasso (Liski et al., 2005), to determine C turnover times in soils. The division of soil C has also aroused criticism among the research community. It has been noted that the existing evidence does not support the formation of a large pool of stable organic matter in the soil, but rather that the SOM is a continuum of organic compounds in different stages of decomposition (Lehmann and Kleber, 2015).
Forest fires, insect outbreaks, and harvesting affect C turnover times on a regional scale (Kurz and Apps, 1994). Forest fires produce both partly and severely burned litter that ends up on the forest floor (Knicker, 2007). At the same time, fire may also consume the soil organic layer, causing a loss of degradable organic matter and leaving behind burned remains (Neff et al., 2005). The burned material, often referred to as pyrogenic matter, is recalcitrant (Certini, 2005; Knicker, 2007) and thus the post-fire C turnover time is affected by the addition of this slowly degradable material into the soil C pool. For example, it has been found that in the Canadian boreal forest, around 25% of the C affected by fire was turned into pyrogenic C (Santín et al., 2015). On the other hand, unburned litter from dying vegetation provides labile C for microbial activity.
Today, there are already quite a lot of studies dealing with the effects of fires on soil C dynamics, both on permafrost and non-permafrost soils (Walker et al., 2019; Andrieux et al., 2020; Han et al., 2021). But studies on how the residence time of soil C gradually returns to its baseline values after a fire are rare (Köster et al., 2014). We lack knowledge on how soil C turnover times change after forest fires in permafrost areas. Therefore, we aimed to compare the interactions of permafrost and recovery from the forest fire in two fire chronosequences: one with underlying permafrost and the other without permafrost effect. We hypothesized that permafrost protects SOM from decomposition and that permafrost thawing after a fire lead to markedly shorter residence times of soil C. At the same time, we expected fires to reduce the quality of SOM so that the potential C turnover time of fire-affected topsoil is longer shortly after the fire and decreases with forest succession.
The study areas were located in the permafrost and non-permafrost boreal forest regions of Canada. The permafrost areas were located along the Dempster Highway close to Eagle Plains in Yukon (66°22′N, 136°43′W) and Tsiigehtchic and Inuvik in Northwest Territories (67°26′N, 133°45′W). The non-permafrost areas were located close to Carmacs and Pelly Crossing in Yukon (62°50′N, 136°35′W) (Figure 1). These areas belong to the Taiga zone and the vegetation consists of shrubs (Rhododendron groenlandicum Oeder., Rubus chamaemorus L. and Vaccinium uliginosum L.), mosses and lichens (Sphagnum sp., Cladonia sp., Cladina sp.) and evergreen conifers such as black spruce (Picea mariana (Mill.) BSP) and some white spruce (Picea glauca (Moench) Voss.). The northern (permafrost) areas have an annual mean temperature and precipitation of −8.8°C and 248 mm, respectively (CCN, 2017), and soils are affected by cryoturbation. The soils are classified as cryosols (WRB, 2015), except for the youngest fire area which is a relict cryosol. In these areas, the soil texture is silt loam. The southern, non-permafrost areas have diurnal and seasonal temperature ranges and strong altitudinal temperature effects that vary with the seasons. The mean annual temperature is around −4°C (in January temperature is −27.9°C, while the mean temperature in July is 15.1°C) (NCE, 2011). The average precipitation in the area is around 298 mm, and approximately 1/3 of this precipitation falls as snow during the winter (NCE, 2011). The soils in these areas are mainly brunisols (Smith et al., 2004; Smith et al., 2011).
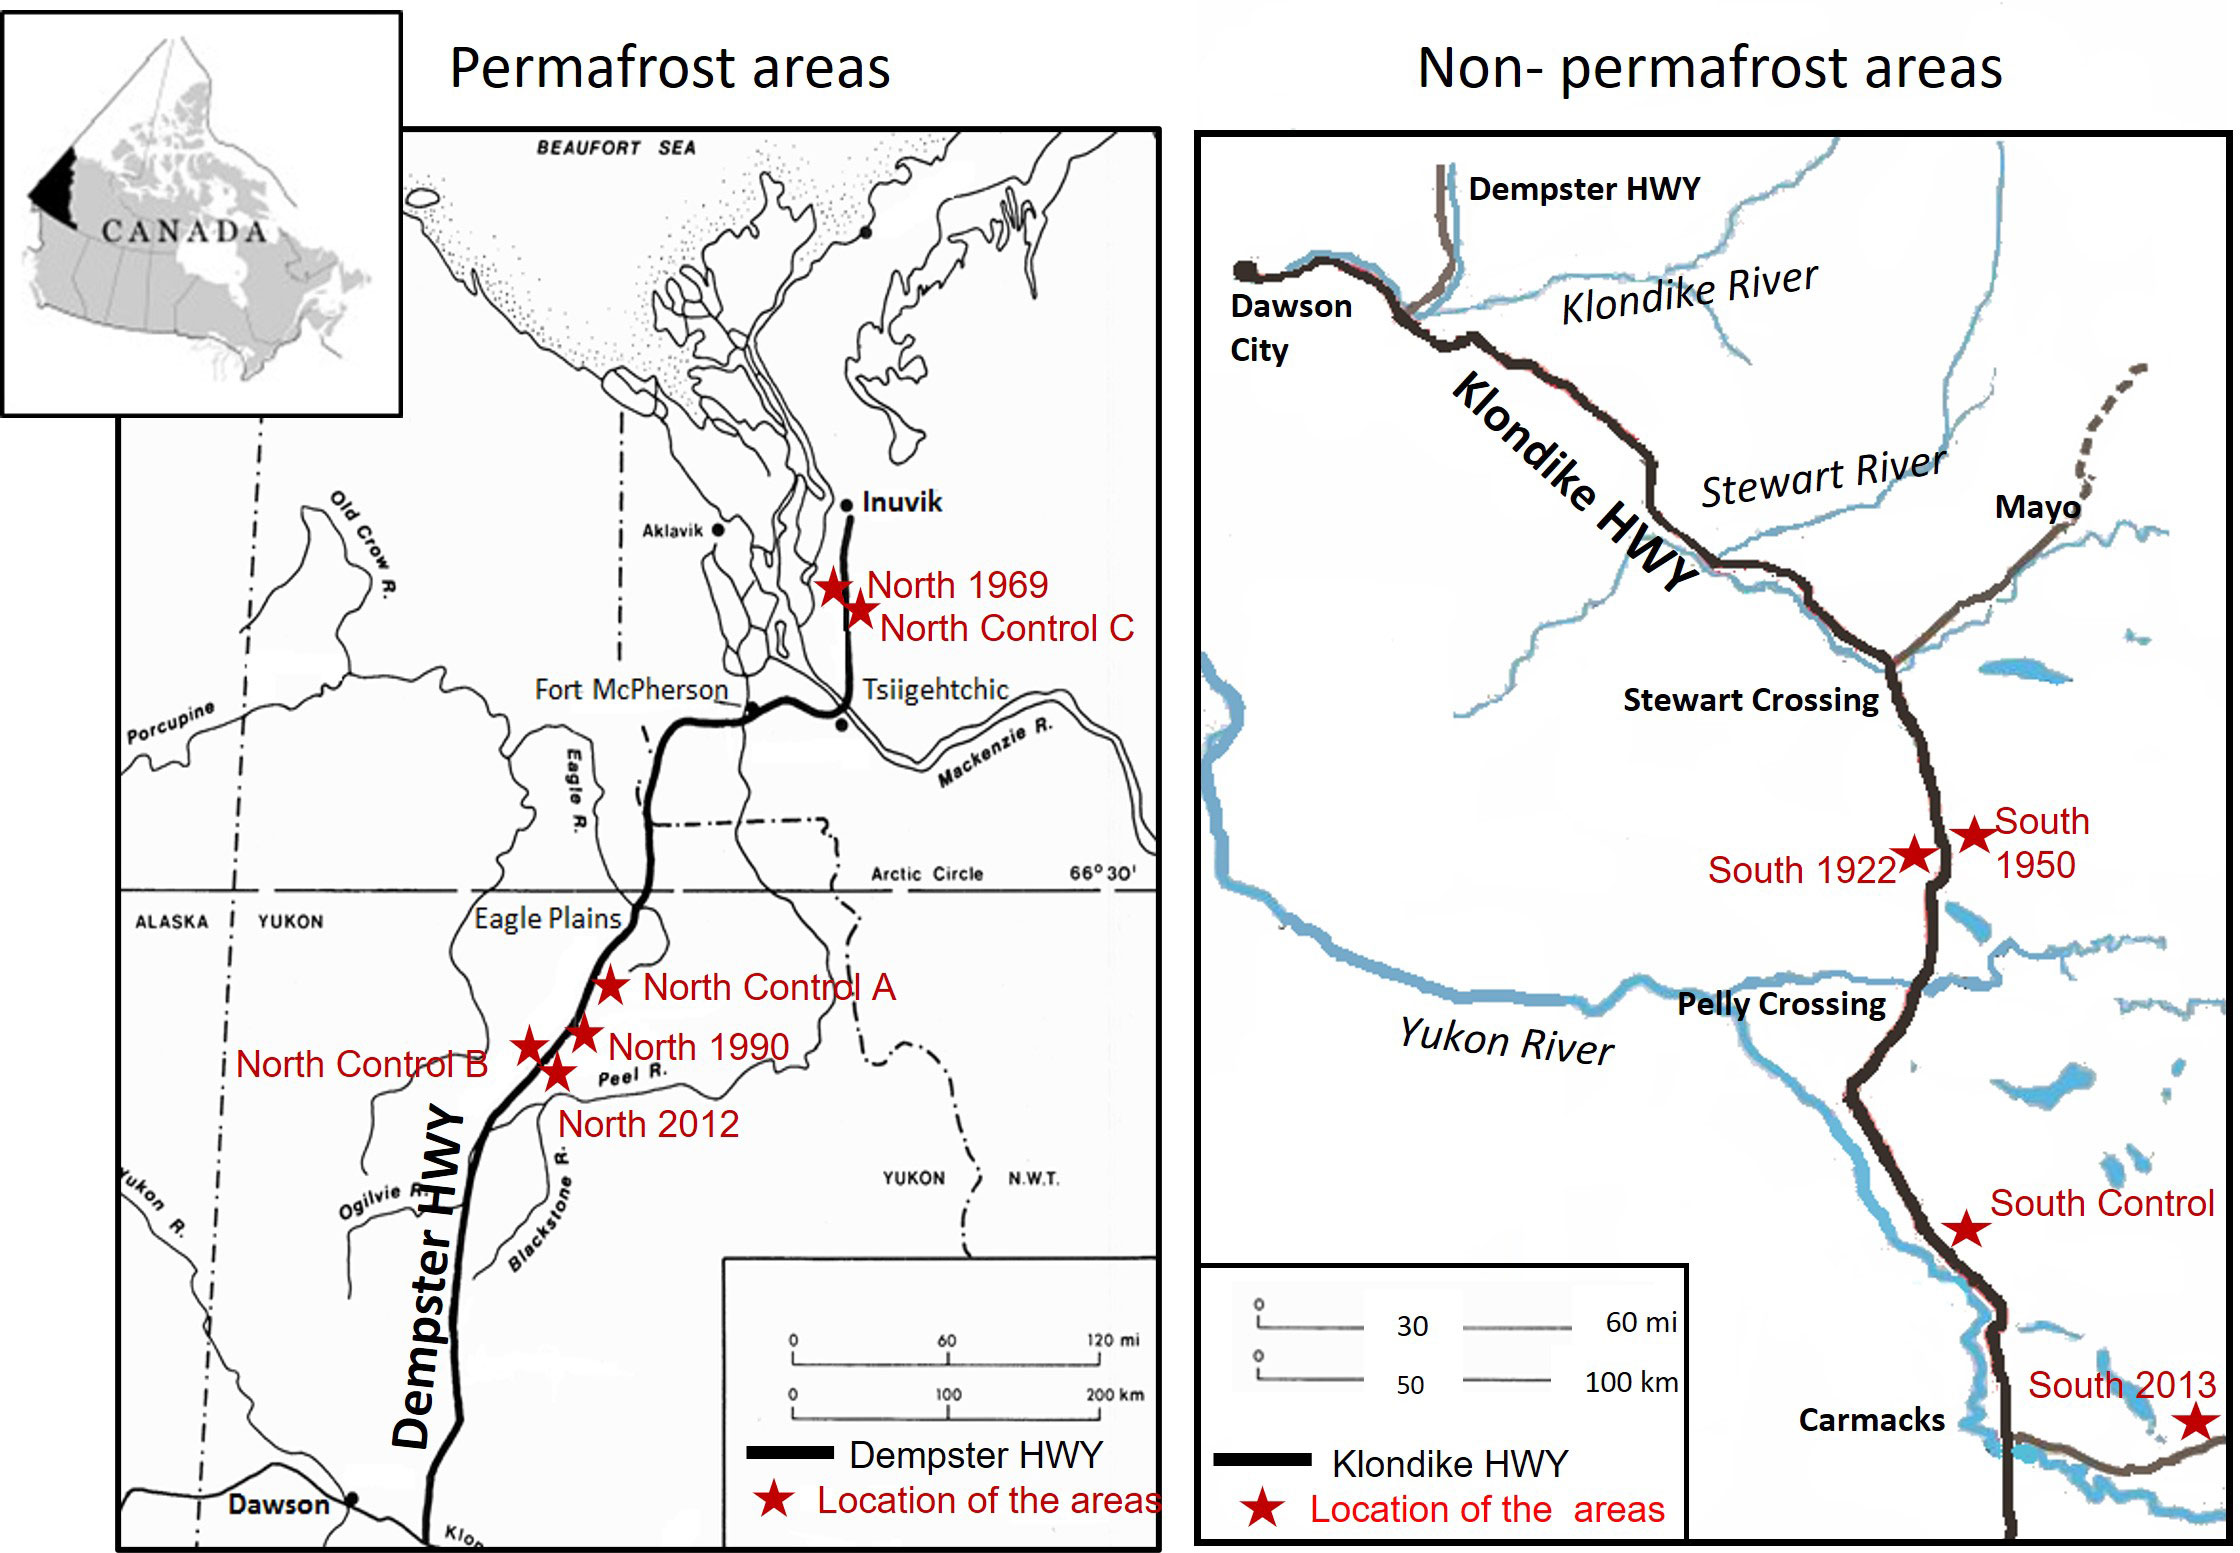
Figure 1 Location of the study areas.
In the summer of 2015, forest stands were chosen in permafrost and non-permafrost regions, so that they formed a fire chronosequence of stands at different times since the last forest fire. There were altogether four age classes in both northern (permafrost areas) and southern (non-permafrost areas) chronosequences. In the north, the areas were burnt 3, 25, 46, and >100 years ago (North 2012, North 1990, North 1969 and North Control respectively). In the south, areas were burnt 2, 65, 95 and >100 years ago (South 2013, South 1950, South 1922 and South Control respectively). In each forest stand, three 150-m-long sampling lines, with three sampling plots in each (n=9), were established. Control lines with nine plots in permafrost areas and nine plots in non-permafrost areas were established in areas with no fire occurrence within the last 100 years (Figure 1). In permafrost areas, the control lines (North Control A, North Control B and North Control C) were placed separately close to the fire areas (as the distances between different sample plots were big), while in non-permafrost areas all the control lines (South Control) were established in the same location (as the distances between the sample plots were not so big as in permafrost areas) (Figure 1). The study areas were chosen based on GIS maps of previously burnt areas and narrowed down by reachability and time since the last fire. The selected forests within permafrost and non-permafrost regions were similar in topography, soil type, and main tree species. The age of the trees was further calculated from tree rings (to confirm the time since the last stand-replacing fire). The fire in all areas has been stand-replacing, evident from the even-aged trees.
One soil pit was excavated in the middle of each sample plot (nine replicates per age class). Soil samples were collected from each sample plot by inserting a metal cylinder (Ø 6 cm, height 6 cm) into the vertical face of a soil pit. The samples were collected from three different walls of the soil pit. Samples were collected from litter and humus layer, and from the mineral soil at depths of 5, 10, and 30 cm (Köster et al., 2017). We also measured the soil temperature from the pit from every sampling depth and determined the active layer depth either from the pit or by estimation based on linear regression of soil temperature against soil depth (Table 1). Soil temperature was measured in the field from a 10 cm depth with a digital thermometer (P 300w temperature probe, Dostmann Electronic GmbH, Germany) (Köster et al., 2017). Simultaneously, soil water content measurements were made with soil moisture sensors at 5 cm depth (ThetaProbe ML3, Delta-T Devices Ltd, Cambridge, UK) connected to a data reader (HH2 moisture meter, Delta-T Devices Ltd, Cambridge, UK) (Köster et al., 2017). There were no strong fluctuations in weather conditions during the measurement period (comparable air temperatures and precipitation). In addition, soil temperature was measured continuously for one year at 5, 10 and 30 cm depth on all permafrost (northern) sample plots at four-hour intervals with iButton (model DS1921G-F5, precision: 0.5°C, accuracy: ±1.0°C) temperature sensors (Maxim Integrated, San Jose, California, USA). Temperature sensors were waterproofed with clear plastic tool dip (Plasti Dip, Plasti Dip International, Blaine, MN, USA) before installing them into the soil (Roznik and Alford, 2012). We interpolated hourly values from which we calculated daily mean temperatures for each plot. In non-permafrost areas (southern plots) we were not able to install the temperature sensors for continuous soil temperature measurements. Therefore, the daily mean temperatures for the non-permafrost areas were modelled. The modelling of daily mean temperature values for non-permafrost areas is described in section 2.4.
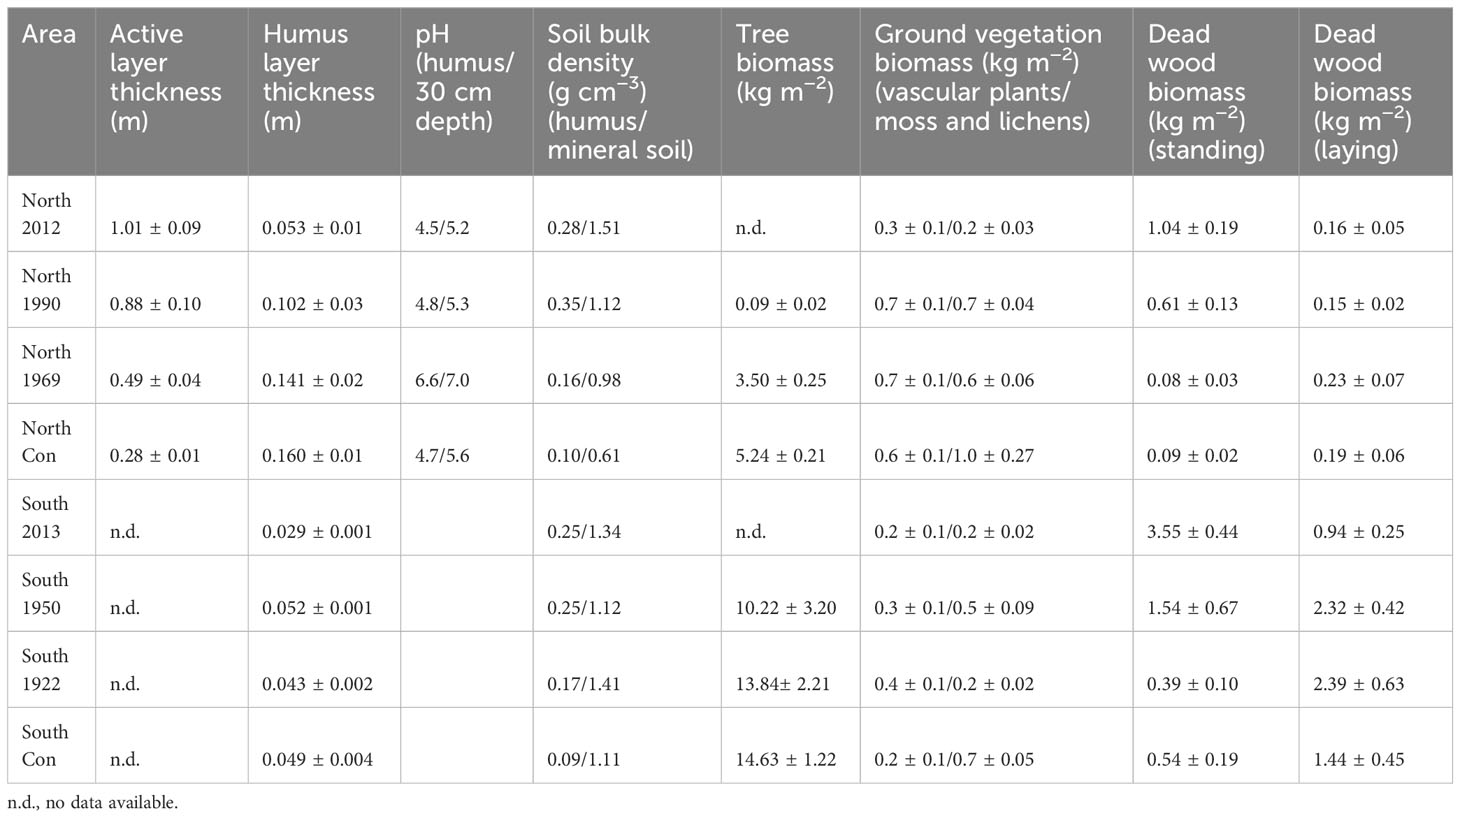
Table 1 The description of soil properties and stand characteristics of study sites.
In addition, tree and ground vegetation biomass was estimated from every plot. The biomass of ground vegetation (grasses and mosses/lichens separately) was determined from four 20 cm × 20 cm squares (Table 1). Tree characteristics were determined from a 400 m2 area (trees over 1 m high) and these included: stem diameter, the height of the tree, crown height, and crown diameter. Finally, the tree biomass was determined based on allometric functions (Wagner and Ter-Mikaelian, 1999; Lambert et al., 2005). All dead wood (both standing and lying) higher than 1.3 m and at least 10 cm in diameter were included as dead-wood biomass (Table 1).
The soil samples used for soil incubation and for soil C concentration measurements were stored at 4°C, until analyses. Prior to the analyses, roots and stones were separated from the soil. Soil pH was measured using a glass electrode (Standard pH meter, Radiometer Analytical, Lyon, France) in 35 ml soil suspensions, consisting of 10 ml of soil sample and 25 ml of ultrapure Milli-Q water (left to sit overnight after mixing).
For incubation, a subsample of soil was taken from collected samples (Ø 6 cm, height 6 cm), weighed and placed into a 500 ml glass bottle. Before the start of the incubation, and between every temperature change, the bottles were flushed with technical air that consists of 21% oxygen and 79% nitrogen (Technical air 320020, AGA, Finland) and closed with rubber caps. Blank bottles without soil samples were prepared similarly. We used four different temperatures for the incubation, while the incubation was performed in a climate chamber (WEISS WK11 340, Weiss Klimatechnik, Germany) at the temperatures of 1, 7, 13 and 19°C, following the method of Riikonen et al. (2017). Incubation time for each temperature was 24 h, and after each 24h incubation, gas samples (60 ml) were taken with a polypropylene syringe (BD Plastipak 60, BOC Ohmeda, Helsingborg, Sweden) through the rubber cap of the bottle and injected immediately into glass vials (12 ml Soda glass Labco Exetainer®, Labco Limited, UK) for storage and transportation. The gas samples were analyzed by an Agilent Gas Chromatograph (GC 7890A Agilent Technologies, USA) equipped with an autosampler. The system consisted of a flame ionization detector (FID) using helium as a carrier gas, and synthetic air (450 ml min−1) and hydrogen (40 ml min−1) as flame gases, with nitrogen gas (5 ml min−1) used as the make-up gas for the FID standard. Further, the CO2 concentrations were measured with a 4-point calibration curve, which was defined with 433, 750, 1067 and 1500 ppm standard gas concentrations (Oy AGA Ab, Espoo, Finland). The potential CO2 respiration rate (heterotrophic respiration) was calculated per hour as the difference between incubated soil and blank samples on an organic matter basis (μg CO2 g C−1 h−1). The soil temperature sensitivity (Q10) was determined for different soil horizons and different soil temperatures from the incubation flux data by fitting a model (Equation 1) (Ito et al., 2015):
where Rh is the heterotrophic respiration rate from incubation (mg CO2 g C−1 s−1) at temperature T (°C), and Rref is the reference respiration at the reference temperature Tref. The procedure of the incubation experiment and calculation of Q10 are described in more detail in Aaltonen et al. (2019a). The Q10 values used in further calculations (Equation 3) in this study are available from Supplementary Table 1.
At the end of the incubation experiment, incubated soil samples were dried at 105°C (for soil dry weight measurements) and analyzed for C/N content with an elemental analyser (Vario Max CN, Elementar Analysensysteme GmbH, Germany).
Soil C turnover time (Ty, years) is defined as the size (mass) of the C pool divided by the C loss through respiration (incubation) as in Lloyd (1999). The potential turnover time of total soil C was estimated from measurements of soil C outputs (heterotrophic respiration results from incubation study) and near steady-state soil C stocks in different soil horizons (Equation 2):
where Cs is the soil C stock (g C m−2) and Rann is the annual soil respiration (mg CO2 m−2 yr−1). Soil respiration rates were converted from the incubation experiment (incubations at temperatures of 1, 7, 13 and 19°C) to potential annual respirations (Rann) assuming that respiration is an exponential function of temperature (Equation 3):
where Tref is the reference temperature, a is the respiration rate at that reference temperature (incubations at temperatures of 1, 7, 13 and 19°C), Q10 is the respiratory temperature coefficient (Supplementary Table 1), T is soil temperature and t is time. While calculating the Rann different incubation results were used for different field-measured soil temperatures: in case of soil temperatures from <1°C to 4°C, values from incubation with 1°C were used; in case of soil temperatures from 4 to 10°C, values from incubation with 7°C were used; in case of soil temperatures from 10 to 16°C, values from incubation with 13°C were used; and in case of soil temperatures from 16°C to >19°C, values from incubation with 19°C were used.
Continuous soil temperature (T) throughout the entire year for permafrost areas was measured with (IButton) temperature sensors (temperature measurement after every two hours) installed at different soil horizons (5, 10 and 30 cm depth) at each fire chronosequence sites. Soil temperature for non-permafrost areas was modelled, and modelled values were controlled and approved by the soil temperature measurements (spot measurements) conducted during the field campaign in the summer of 2015. To model the soil temperature for all fire chronosequences in non-permafrost areas, we have used soil temperature, measured at 10 cm and 30 cm depth and air temperature values from Active Layer Network (Herman-Mercer, 2017). We averaged the temperature values from years 2011–2014, from two measuring points: (Dawson – north from our study areas, and Teslin – south from our study areas) (Herman-Mercer, 2017). The averaged values from Dawson and Teslin measured at 10 cm (TF10) and 30 cm (TF30) depths were used as bases for control plots (no fire occurrence in the last 100 years) (Supplementary Figure 1), and for areas where the last fire was in years 1950 and 1922 (as these are the areas where the vegetation has been completely recovering from the last forest fire event). For the other non-permafrost fire areas, we used the functional relations for air temperature and 20 cm ground temperatures at the forest site for spring, summer and winter generated by Burn (1998). For modelling the yearly soil temperature the year was divided into three seasons (spring, summer and winter) that lasted as follows: (a) winter, from mid-October to the end of March, when both air and ground temperatures are below 0°C; (b) spring, in April, when snowmelt occurs, and daily mean air temperatures rise above 0°C; (c) summer, from May to mid-October, when both air and 20 cm ground temperatures are above 0°C. The study areas of Burn (1998) were located around 150 km south of our study areas, thus they should in general represent nicely the conditions that one could expect also in our study areas. The functional relations for air temperature (Ta) and soil surface temperature (TFsurf) at the forest site (control, and fires in years 1922 and 1950) (Supplementary Figure 1) were modelled for different seasons (TFsurf (winter) (Equation 4), TFsurf (spring) (Equation 5), TFsurf (summer) (Equation 6)), following Burn’s (1998) equations:
It is known that the air and soil temperatures in newly burnt areas are usually higher compared to unburned areas. Burn (1998) found that in southern Yukon the air temperatures in the burnt area are consistently warmer than in the forest areas, by about 1.25°C, thus also the soil surface temperatures are warmer at burnt sites compared to those at forest sites.
To model the soil temperature values for newly burnt plots (forest fires in the year 2013) we used the relations between forest ground temperature (TFsurf) and ground temperature of burnt areas (TBsurf) for winter (Equation 8) and summer (Equation 7) provided by Burn (1998):
Based on Burn (1998), in winter there is a relatively small variation in deeper ground temperatures at the burnt site in comparison with undisturbed conditions in forested areas, thus in the deep soil layers the winter soil temperatures were kept similar between the study areas (Supplementary Figure 2). For calculating the deep layer soil temperatures (TB10 and TB30) for summer at the burnt areas, we calculated the coefficient based on our field measurements from the summer of 2015. In both soil horizons, the values measured from the burnt areas were 1.67 (in 30 cm depth) and 1.69 (in 10 cm depth) times higher than at control plots. All modelled soil temperatures from the non-permafrost area (both forested and burned areas) are in accordance with our own spot measurements from the summer of 2015 (Supplementary Figures 1, 2).
As all the soil temperatures for the non-permafrost area were modelled, we also performed a sensitivity test with Ty calculations, where we increased and decreased the soil temperatures by 1°C (an increase in soil temperatures means higher soil temperatures in summer and warmer soil temperatures in winter-time when the soil temperature dropped to minus degrees, and decrease means lower soil temperatures in summer and in winter-time). Following, Ty of the soil surface layers was calculated also with the new soil temperature values.
To see only the effect of SOM quality and time since the last forest fire on the potential soil C turnover times in soil samples collected from the fire chronosequences, we also performed the soil C turnover calculations with identical seasonal soil temperatures for all the fire chronosequences (both in permafrost and non-permafrost soils), to eliminate the differences coming from the use of different soil temperatures from different fire chronosequences. We used seasonal temperature data, measured continuously at 5, 10 and 30 cm depth from control plots from permafrost (northern) soils (Figure 2), but otherwise, the calculations were done similarly as described above.
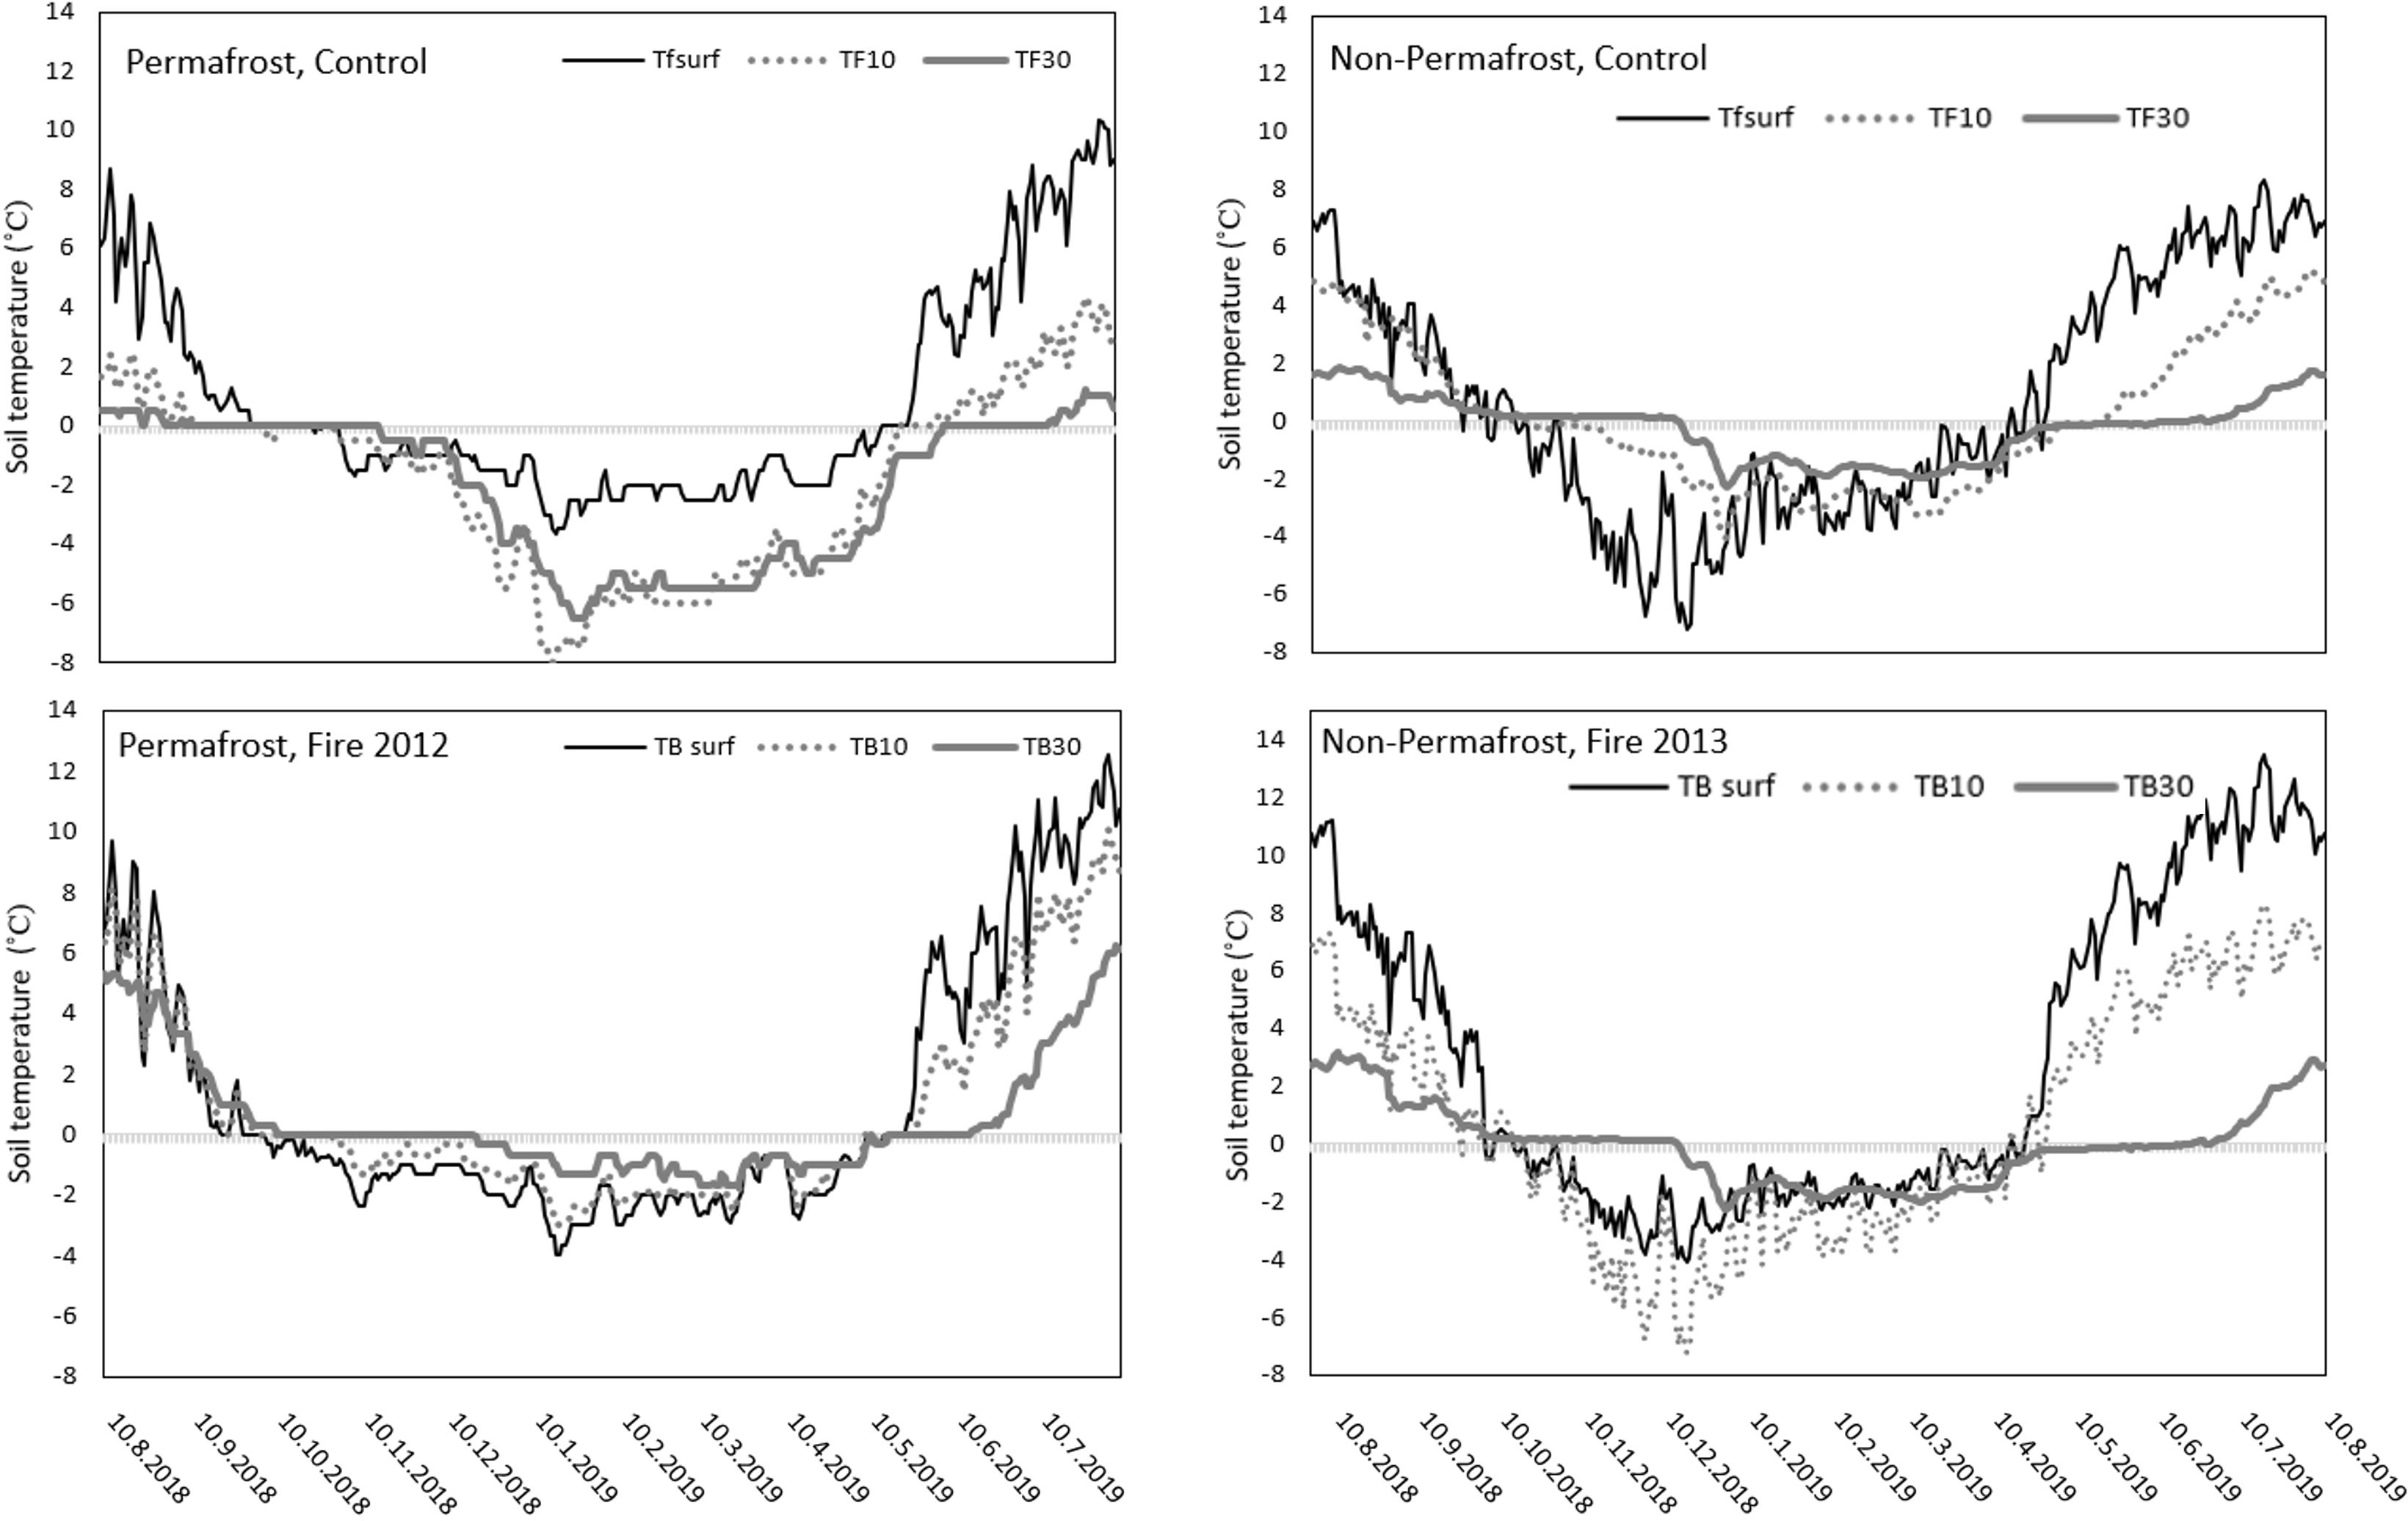
Figure 2 Daily average soil temperatures on control sites (TF), where the last forest fire was more than 100 years ago, and on newly burned sites (TB) in permafrost and non-permafrost areas. The fire occurred in 2012 in the permafrost area and 2013 in the non-permafrost area. Daily average soil temperatures are taken from the soil surface (in the humus layer – 5 cm depth) and at 10 cm, and 30 cm depth in the fire chronosequence in permafrost and non-permafrost areas.
Data were checked for normality using the Shapiro-Wilk test and a logarithmic transformation was performed for the values of soil turnover, soil C, soil bulk density, and living tree biomass. To test the hypothesis behind soil C turnover time and how different factors (area, soil horizon, ground vegetation biomasses, soil C stock, soil bulk density, tree biomass, and dead woody biomass) are affecting the variations in calculated turnover time, a mixed model (PROC MIXED) was used. Calculated potential soil C turnover time, soil horizon, area (permafrost or non-permafrost) and time since the last forest fire were included as fixed effects in the model. A Tukey’s HSD test was used for the comparison of means. The Pearson correlation coefficients were calculated between the potential soil C turnover times and explanatory effects (same covariates as in model) to evaluate the direction of different effects. All calculations and statistical analyses used the plot as the experimental unit and a significance level of α = 0.05. Statistical analyses were performed with SAS version 9.4 (SAS Institute Inc., Cary, NC, USA).
The highest daily average soil temperatures were observed during the summer months, being most pronounced in the surface soil layers (humus at 5 cm) of the newly burned areas, both in permafrost and non-permafrost areas (Figure 2). The deepest measured soil layer (30 cm) showed the most stable temperature values among the compared sites. In winter months, the lowest soil temperatures were observed at 30 cm depth in the permafrost areas (Figure 2). The active layer depth (measured in August) in the control sites of the permafrost areas was around 28 cm (Table 1), thus our measurements were taking place close to the permafrost surface. In the autumn and during the winter the active layer thickness decreased due to seasonal re-freezing of the layers closest to the permafrost surface. The soils in the permafrost area (control sites) were frozen most of the year, the humus layer 229 days and the 30 cm layer 316 days. The occurrence of fire changed these patterns slightly, as after the fire the frozen period was 237 in the humus and 240 days in the 30 cm layer. In the non-permafrost areas, the frozen period was even shorter, 216 in the humus layer and 262 days in 30 cm depth and fire decreased the frozen period to 188 and 250 days in the humus layer and 30 cm layers, respectively.
Soil C stock in both permafrost and non-permafrost areas was lowest in the most recent forest fire sites, where the forest fires occurred in the year 2012 (North 2012, three years after the fire) in permafrost areas, and in the year 2013 (South 2013, two years after fire) in non-permafrost areas (Figure 3). There were no significant changes in C stock in deeper soil horizons (mineral soil to 5 cm depth and mineral soil from 5 cm to 30 cm depth) in both permafrost and non-permafrost fire chronosequences (Figure 3). In permafrost areas, the average soil C stocks from first five centimeters in mineral soils were in average 2.19 ± 0.31 kg C m−2, and in mineral soil from five to thirty centimeters were in average 7.59 ± 1.15 kg C m−2. In non-permafrost areas, the average soil C stocks from first five centimeters in mineral soils were in average 1.26 ± 0.39 kg C m−2, and in mineral soil from five to thirty centimeters were in average 1.23 ± 0.19 kg C m−2. The significant changes in post-fire C stock were visible in the humus layer of the newly burnt sites (Figure 3), where the thickness (Table 1) and the C stock of the humus layer declined due to the combustion (Figure 3). Based on the long-term average soil C stock in the humus layer, the wildfire resulted in up to 62% of soil C losses in the humus layer of the permafrost areas(drop from about 8.2 ± 0.86 kg C m−2 to 2.61 ± 0.5 kg C m−2), whereas in non-permafrost areas the C loss in the humus layer was even higher, being 81% (drop from about 2.57 ± 0.46 kg C m−2 to 0.47 ± 0.13 kg C m−2). The total C stock of soils was almost three times smaller in the southern (non-permafrost) areas compared to the permafrost areas (Figure 3). We found a significant positive correlation (p < 0.0001) between the potential soil C turnover time and soil horizons – on deeper soil horizons the potential soil C turnover times were getting longer. There were also significant positive correlations between the potential soil C turnover time and soil bulk density (p < 0.0001). A significant negative correlation was found between the potential soil C turnover time and soil C stock (p = 0.0002), and between the potential soil C turnover time and the living tree biomass on the study areas (p = 0.0462).
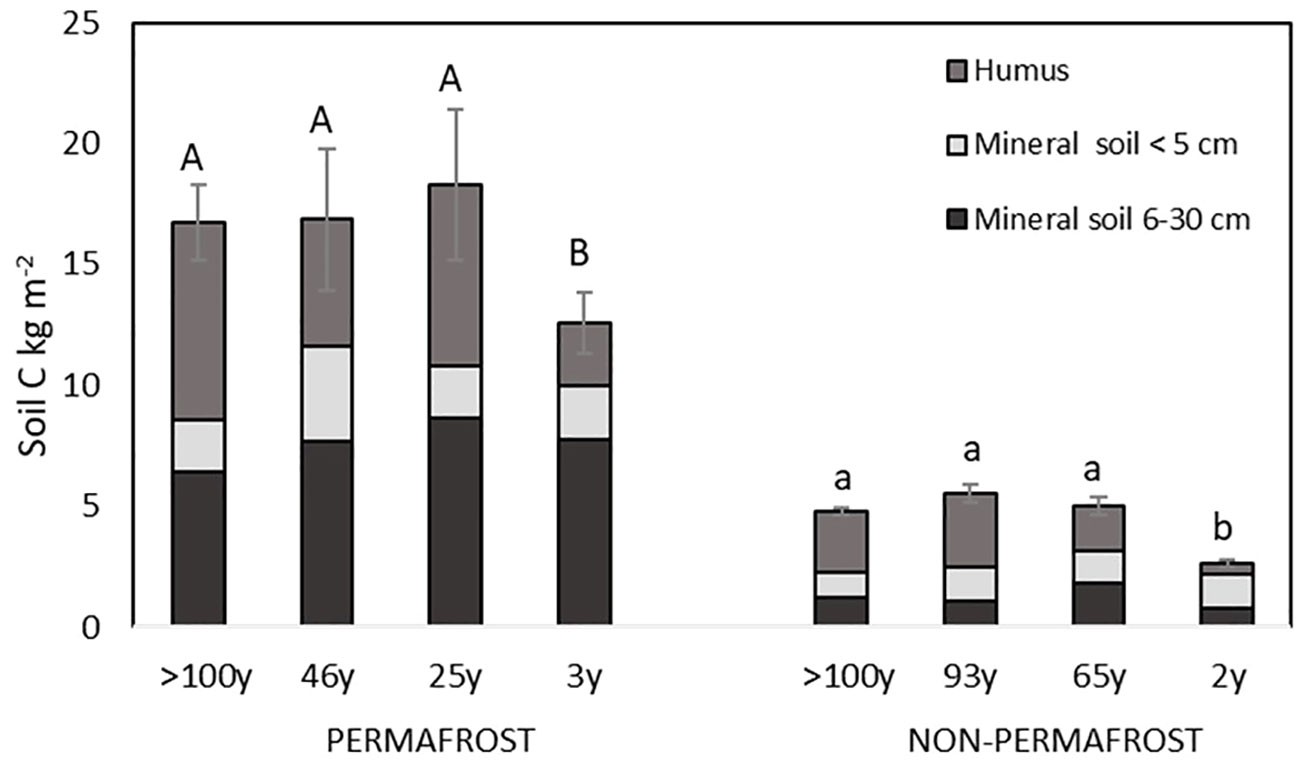
Figure 3 Soil C stock (kg m−2) in different layers (humus, mineral soil <5 cm, and mineral soil 5–30 cm depth) on a forest fire chronosequence in permafrost and non-permafrost areas. Error bars show standard errors of the entire soil C stock. Statistically significant differences are denoted by letters above the bars (separately for permafrost and non-permafrost areas).
The stand replacing fires in both permafrost and non-permafrost areas were killing all the trees, and therefore two years (South 2013, in non-permafrost area) and three years (North 2012, in permafrost area) after the fire there was no living tree biomass on the study sites (Table 1). On the same areas (soon after the fire) there was also significantly less ground vegetation biomass left on the areas and significantly more standing dead wood biomass on the areas (Table 1). The ground vegetation recovery was the fastest, as already on next fire chronosequences (North 1990 in permafrost areas and South 1950 in non-permafrost areas) the post-fire ground vegetation biomass was recovered to the conditions similar in control plots (Table 1).
The fire had a significant effect on calculated average soil C turnover times (in years) for each fire chronosequence (Figure 4), but there was no significant difference between the permafrost and non-permafrost areas. The potential average soil C turnover times (taking into account all the soil horizons) were two times longer in more recently burnt sites (in permafrost areas where the fires occurred 3 and 25 years ago, and in the non-permafrost area where the fire was 2 years ago) than in the control sites (fire >100 years ago) (Figure 4). Based on the mixed model the chronosequences (time since the last fire) (p < 0.0001) and soil horizon (p = 0.0282) had a significant effect on potential soil C turnover times.

Figure 4 Potential soil C turnover times in years (taking into account the humus layer, mineral soil up to 5 cm in depth and mineral soil 6–30 cm in depth) for fire chronosequence sites in permafrost and non-permafrost areas. Error bars show standard errors. Statistically significant differences are denoted by different letters above bars (separately for permafrost and non-permafrost areas).
The longest potential soil C turnover times were observed in the deeper layers (30 cm) of the permafrost areas, and the shortest in the humus layers of the non-permafrost areas (Table 2). In permafrost areas, the potential soil C turnover times in the deeper soil layers of the newly burned sites (fires 3 and 25 years ago) were almost two times longer compared with the sites where the last forest fires occurred 46 years ago and more than 100 years ago (control site) (Table 2). The potential soil C turnover times of the humus layer of permafrost areas were about 100 years, while the non-permafrost areas the values ranged between 40 and 80 years (Table 2). The exception was the humus layer soil C turnover time in the control site of non-permafrost soils, where it was more than 100 years (Table 2).
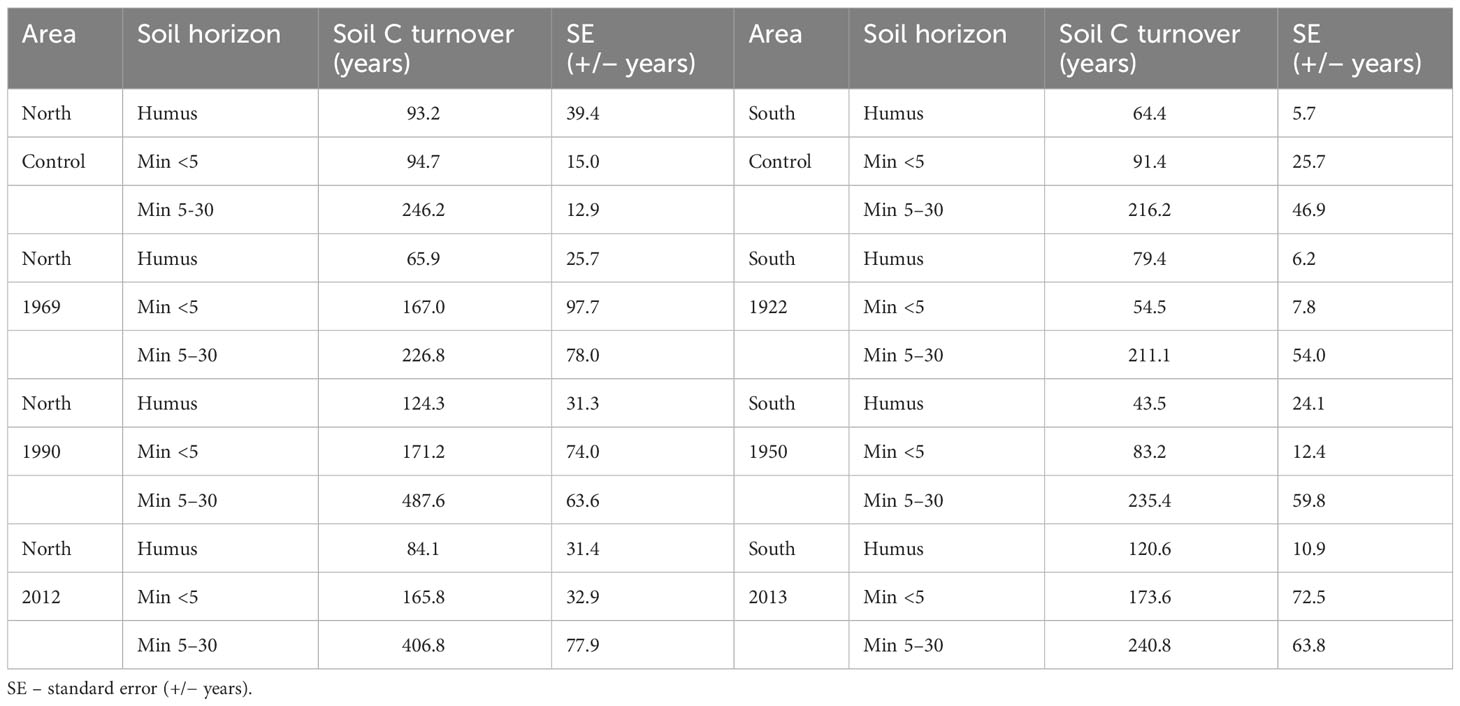
Table 2 Average soil C turnover times in different soil layers (H – humus layer, Min<5 – mineral soil up to 5 cm in depth, Min 6–30 – mineral soil 6–30 cm in depth) along fire chronosequences in permafrost (North) and non-permafrost (South) areas.
Although there was no significant difference in calculated average soil C turnover times when the permafrost and non-permafrost areas were compared, there was still a vast difference in soil C emission rates per year between the permafrost and non-permafrost areas. As the total C stock of soils was almost three times smaller in the southern (non-permafrost) areas compared to the permafrost areas (Figure 3), then with similar turnover times the permafrost areas emit approximately three times more C per year compared to the non-permafrost areas. The highest post-fire yearly soil C (kg C m−2 year−1) emission potentials were found on permafrost areas where the last forest fire was more than 100 years ago (North Control), where the yearly soil C emission potentials were on average 0.264 kg C m−2 year−1. The average yearly soil C emission potentials from other fire chronosequence areas from permafrost soils were 0.162 kg C m−2 year−1 in the area where the last forest fire was 46 years ago (North 1969), 0.091 kg C m−2 year−1 in the area where the last forest fire was 25 years ago (North 1990), and 0.054 kg C m−2 year−1 in the area where the last forest fire was 3 years ago (North 2012). At the same time, the average yearly soil C emission potentials from fire chronosequence areas from non-permafrost soils were 0.059 kg C m−2 year−1 in the area where the last forest fire was >100 years ago (South Control), 0.043 kg C m−2 year−1 in the area where the last forest fire was 93 years ago (South 1922), 0.067 kg C m−2 year−1 in the area where the last forest fire was 65 years ago (South 1950), and 0.014 kg C m−2 year−1 in the area where the last forest fire was 2 years ago (South 2013).
We simulated the effect of the soil temperature sensitivity test (increase or decrease of soil temperatures by 1°C) for Ty (Supplementary Table 2). The calculations showed the most apparent effect on the respiration of the humus layer of the newly burnt sites. In the recently burnt sites on the permafrost (fire three years ago – North 2012) a 1°C increase in soil temperatures resulted in a 10.5% decrease in the soil C turnover time of the humus layer, while a 1°C decrease in soil temperature increased the soil C turnover time by 11.7%. A similar trend was also observed at the most recent fire site in the non-permafrost areas (fire two years ago – South 2013), where a 1°C increase in soil temperatures decreased the potential turnover time of soil C in the humus layer by 9.1%, and a 1°C decrease increased the potential soil C turnover time by 10.0%. In general, the temperature sensitivity test showed, that changing temperature has more effect on the humus layers of different fire sites, as in the permafrost areas the increase/decrease of humus temperatures by 1°C changed the potential soil C turnover times from 9.0% (North 1969) to 11.7% (North 2012) and in non-permafrost areas from 5.9% (South Control) to 10.0% (South 2013), respectively. In deep soil layers (Min 6–30 cm), the temperature change of 1°C resulted in a 4.5–11.4% change in the potential soil C turnover times of the permafrost areas, and in the non-permafrost areas the changes in C turnover times ranged from 1.8 to 7.9%.
Based on the mixed model, time since the last fire had a significant effect (p < 0.0001) on the potential soil C turnover times. Therefore, we performed the soil C turnover calculations also with the same seasonal temperature curve for all different fire chronosequences to eliminate the differences coming from the use of different soil temperatures for different fire chronosequences. Based on these calculations, in permafrost areas fire affects mostly the potential soil C turnover times of the mineral soils (Supplementary Table 3). In permafrost areas, the potential soil C turnover times in mineral soil layers of the more recently burned sites (North 2012 and North 1990) were more than two times longer compared with the sites where the last forest fires occurred 46 years ago (North 1969) and more than 100 years ago (North Control). If we removed the chronosequence-dependent soil temperature from the calculations (used only the soil temperatures from northern control areas on all chronosequences), the potential soil C turnover times of the mineral soils in these areas were 15–38% longer, while in the humus layer, the change was less than 10% (Supplementary Table 3). In non-permafrost areas, the changes in the potential soil C turnover times were much smaller, and in some cases, mostly in the humus layer, the soil C turnover times were even shorter.
Our study showed that fires in boreal forests have a significant effect on the potential soil C turnover times, but at the same time, there was no major difference in the effect of fires on the turnover times of permafrost and non-permafrost areas in the surface and in mineral layers of the soils.
Previously it has been stated that the turnover time of soil C depends on the size of the C pool, its decomposition rate, and the amount of fresh C input into the soil (Dungait et al., 2012). While Luo et al. (2019) have observed that in general there is a positive correlation between soil C turnover time and soil organic C stock, then our study showed that forest fires, and changes caused by fires in different soil properties can have a reversing effect on this correlation. Within the studied fire chronosequences we observed a negative correlation between the total soil C stocks (different soil horizons combined) and between the potential soil C turnover time. Our study indicated that soil C stocks in both permafrost and non-permafrost areas were the lowest shortly after a forest fire. We found that fires reduced the C stock in the humus layer through combustion, and the C pool in the humus layer started to recover with post-fire succession. Only a small part of the heat generated during a forest fire is radiated to the soil, and its effect on the changes in soil depends on both the temperatures reached at different soil depths and the degree of heating that the different soil components can withstand before being altered (González-Pérez et al., 2004). All the fires in our study areas (both in permafrost and non-permafrost areas) were of high severity (stand-replacing crown fires), and presumably also of high intensity. Such fires have also an effect on soil properties, as part of the humus layer is usually combusted by fire. It is rare for fires to consume all SOM above the mineral horizon (Neff et al., 2005; Knicker, 2007). Still, it has been observed that the fractions of ground fuels burnt in wildfires in the boreal forests of Alaska can consume up to 60%–90% of the humus layer (Neff et al., 2005). Our results showed a significant post-fire loss of C from the humus layer – loss of C stocks in the humus layer of permafrost soils were up to 68%, and in non-permafrost soils up to 81% compared with the control sites where the last forest fire was more than 100 years ago. Other studies have also found that despite the high variability of the soil C pool in boreal forests, there is a decrease in soil C pool straight after the fire, and an overall trend of increasing C pool exists with increasing time since fire occurrence (Knicker, 2007; Bormann et al., 2008; Palviainen et al., 2020).
As stated by several studies (Jafarov et al., 2013; Gibson et al., 2018; Ribeiro-Kumara et al., 2020; Zhou et al., 2020), we also observed that the post-fire warmer soil temperatures have an effect on permafrost thawing, and a couple of years after the fire the active layer was much deeper compared to the sites with longer time since the last fire. In our control sites in the permafrost areas, the active layer thickness was on average 28 cm (measured in August), and the soil temperature measurements taken from 30 cm depth, were in some cases already inside the permafrost. As the winter approaches, the frozen soil table starts to rise (the active layer gets thinner), and most of our temperature sensors at 30 cm depth were inside the seasonally frozen soil. We observed that at this depth in the permafrost soils, the soil temperatures can be low during the winter, actually even lower than the surface soil temperatures. Post-fire permafrost recovery takes place as a result of the recovery of ground vegetation (especially mosses) and trees, and the consequent accumulation of SOM (Jafarov et al., 2013). However lately, it has been reported that due to the changes in climate larger portion of the permafrost of forest fire areas is unable to recover (Zhang et al., 2015). This phenomenon has been especially evident in the areas burnt after 1990, where the active layer gets steadily deeper until the disappearance of the permafrost (Zhang et al., 2015).
Different studies have reported that there is much variation in soil C turnover times in general, depending on the area and studied soil horizons, but typically the turnover time of C is longer in northern latitudes (Carvalhais et al., 2014; Wang et al., 2018; Luo et al., 2019). In the northern soils, the turnover times are affected by different factors (Hobbie et al., 2000), but usually, higher soil temperatures lead to shorter soil C turnover times (Luo et al., 2019). In fire-affected areas (especially shortly after the fire) the soil and soil surface temperatures are higher compared to unburned older forests (Burn, 1998) and have less vegetation coverage (both ground vegetation and trees) (Köster et al., 2014; Köster et al., 2017). We observed the same trend, while the soil surface temperatures in recently burnt areas were the highest. Such higher soil temperatures should in theory cause shorter soil C turnover times. On the other hand, it has been suggested that the effect of substrate quality on the decomposition rate can be greater than the effect of temperature (Hobbie et al., 2000). Ground vegetation of northern ecosystems is often dominated by slowly degrading moss species, and slowly decomposing litter. If we include in the system the fires that affect the activity of the microbial and bacterial community (Sun et al., 2016; Zhou et al., 2019; Rodriguez-Ramos et al., 2020; Zhou et al., 2020; Köster et al., 2021), burn away part of the labile C (Aaltonen et al., 2019a) and generate highly condensed and resilient pyrogenic materials into soils that increases the passive SOM pool (González-Pérez et al., 2004), we could expect very long soil C turnover times.
During combustion, wildfires release substantial quantities of C into the atmosphere, but at the same time they also convert part of the burnt biomass into pyrogenic organic matter (Santín et al., 2015). Study by Santín et al. (2015) revealed that nearly a third of the C in boreal biomass affected by wildfire could be transformed into pyrogenic matter. Of course, the conversion rates vary between the fuel components, as approximately half of the C in down wood and bark was converted into pyrogenic organic matter, whereas in case of forest floor (including ground vegetation, litter, duff and humidified organic material) only one quarter was converted into pyrogenic organic matter (Santín et al., 2015). The conversion rates differ also with different fire characteristics (intensity and severity). In our study areas, immediately after the fire, we could see a proportional decrease in the size of the labile SOM fraction in the burned soils and increase in the size of recalcitrant fraction; while labile C was lost in fire through combustion, pyrogenic C was stored in the soils (Aaltonen et al., 2019a), and this thermally altered organic matter (pyrogenic C) that displays relatively longer turnover times compared to unburned C pools (Pingree and DeLuca, 2017) could be one of the reasons why we were able to see the negative correlation between the between the total soil C stocks (different soil horizons combined) and between the potential soil C turnover time. The humus layer in boreal forests is usually covered with a poorly decomposed litter layer, and the degree of the decomposition of the humus increases with depth (Deluca and Boisvenue, 2012). Fires burn most of the litter layer and often also some of the upper parts of the humus layer. The SOM in the litter layer is usually easily decomposable, but fires can decrease SOM quality by burning the easily decomposable litter and leaving the recalcitrant humus on the site (Aaltonen et al., 2019a). Thus, we expected fires to reduce the quality of SOM so that the C turnover time of fire-affected topsoils would be longer shortly after the fire and decreases with forest succession. We recorded the longest soil C turnover times in mineral soil layers (30 cm), and the potential soil C turnover times from these mineral soil horizons of the newly burned sites were almost two times longer compared with the sites where the fires occurred a longer time ago. The potential soil C turnover times of the surface (humus) layer were the shortest, and there was also a clear difference between the sites burnt for a short or a long time ago. Earlier studies from the same sample plots as our permafrost sites and dealing with SOM quality (Aaltonen et al., 2019a) and temperature sensitivity (Q10) of the SOM decomposition (Aaltonen et al., 2019b), have shown that the effect of fires on SOM quality and Q10 was mostly expressed for the surface soil. Initially, after the fire, the surface soil SOM quality was reduced and soils in these areas seemed to be more recalcitrant. The formed recalcitrant SOM is considered to have higher temperature sensitivity than labile SOM (Karhu et al., 2010; Aaltonen et al., 2019b). The Q10 plays an important role in turnover time calculations and fire has been found to increase the temperature sensitivity of soil respiration; an effect which is reflected in turnover times via Q10 (Muñoz-Rojas et al., 2016; Aaltonen et al., 2019b). Aaltonen et al. (2019a) found that in our northern study sites that were located on permafrost soils, the fire increased the Q10 of respiration in the surface (5 cm) and in the mineral soil layer (30 cm) of the newly burned area compared to the 25- and more than 100-year-old areas. Therefore, the temperature sensitivity Q10 is surely also affecting our results, and we assumed that its effect would be more significant than that of the soil temperature.
We modelled soil temperatures for the non-permafrost areas in our study as there was no continuous temperature data available for those areas. To study the effect of temperature used in the turnover calculations we performed a sensitivity analysis by increasing and decreasing the soil surface temperatures by 1°C when calculating the annual respiration by Equation 3. The soil temperature sensitivity test confirmed our assumption, that in the case of soil C turnover time calculations, Q10 values are playing a more significant role than soil temperature values. We observed that the possible temperature change would have the biggest effect on the humus layer of the newly burned areas (the increase or decrease of the soil C turnover time would be biggest there), while the deep soil layers would have proportionally smaller changes. Thus, in mineral permafrost soils the C turnover time seems to be governed by the recalcitrance of soil organic matter, rather than by the soil temperature.
Lately, there have been studies that have modelled the soil C turnover times in different world ecosystems (Todd-Brown et al., 2013; Luo et al., 2016; Wang et al., 2018; Luo et al., 2019). Luo et al. (2019) have stated that the global average turnover time of soil C in the mineral soil layers (0.3–1 m) is more than 1000 years, and in boreal areas, the average soil C turnover time is even longer (around 2017 years). These values are about 10 times higher than those observed by us, but our measurements are taking into account only the top layer of the soils (humus layer and the first 30 cm of the mineral soils), while Luo et al. (2019) focus on the deeper soil layers (0.3–1 m). All in all, it has been found that in the deeper soil layers soil C may be quite stable with turnover times of hundreds or even thousands of years (Luo et al., 2019). We hypothesized that permafrost protects SOM from decomposition, but post-fire permafrost thawing leads to markedly shorter residence times of soil C in these areas, we found that there was no major difference in the effect of fires on the potential turnover times of permafrost and non-permafrost soils in the surface but also in mineral layers of the soils. Although, there was no difference in calculated average soil C turnover times when the permafrost and non-permafrost areas were compared, we can confirm that the permafrost and non-permafrost areas are acting similarly when the talk is about C dynamics. As the total C stock of soils was almost three times smaller in the southern (non-permafrost) areas compared to the permafrost areas, then with similar turnover times the permafrost areas potentially emit approximately three times more C per year compared to the non-permafrost areas. Aaltonen et al. (2019a) showed in their study that the SOM in these permafrost soils is mostly recalcitrant, and in case of disturbance caused permafrost thaw, the scale and rate of C emission potentials from the upland mineral permafrost soils could be limited. The determination of C turnover time in this study relies mostly on Q10 values, and thus it also takes into consideration different factors such as the timing of fire occasion for our studied fire chronsoequences, different soil horizons, etc., that are used to calculate the Q10. Despite deeper soils are assumed to have higher Q10 values (Karhu et al., 2010) as they store further processed SOM than in upper horizons, where the SOM is more recalcitrant, some exceptions have also been noted. For example, the Q10 of mineral-associated organic matter may be masked by aggregate protection, meaning that in clay and silt soils the Q10 may be lower than in topsoil due to micro- and macroaggregate protection from decomposers (Gillabel et al., 2010). In the current study, we also observed that contradicting with our expectations soil C turnover times for the permafrost and non-permafrost soils were similar. This similarity could be explained either by the similarities in the quality of organic matter stored in permafrost and non-permafrost soils or by the turnover time being affected through Q10 values that may, in turn, be affected by aggregate protection of soil minerals.
In the current study, the potential C turnover times are estimated based on the steady-state assumption. In reality, such conditions rarely happen, and C turnover times are constantly affected by environmental conditions and C input fluxes for the C cycling. There have been different studies that have suggested that forest age is a critical factor determining ecosystem C storage and fluxes (Bradshaw and Warkentin, 2015), thus may affect also C turnover times (Wang et al., 2018). Time since the last fire has been found to affect the post-fire C stocks (Palviainen et al., 2020) and soil CO2 fluxes (Köster et al., 2016; Köster et al., 2018; Ribeiro-Kumara et al., 2022). We also found that the time since the last fire had a significant effect on the potential soil C turnover times in our study areas. To eliminate the soil temperature effects originating from different fire chronosequences, and to see only the site (time since the last fire) effects, we performed the soil C turnover calculations also with the same seasonal temperature curve for all different fire chronosequences. Our results showed that in permafrost areas fire affects mostly the soil C turnover time of the mineral soils, as the potential soil C turnover times of the mineral soils in these areas were 15–38% longer, while in the humus layer, the change was less than 10% (Supplementary Table 3). In non-permafrost areas, the changes in the potential soil C turnover times were much smaller, and in some cases, mostly in the humus layer, the soil C turnover times were even shorter. Thus, our findings show that even if the potential soil C turnover times in this study relied mostly on Q10 values, then at least in permafrost areas (especially in the top layers of the mineral soils) also soil temperature plays an important role in determining the soil C turnover times.
As a consequence of changing climate, fire return intervals in boreal forests are expected to become shorter and the forest rotation time is decreasing. This is leading these ecosystems towards the situation, where less C is being stored in their soils. Labile C is lost in fires, and pyrogenic C is accumulated in the soil, affecting soil organic matter quantity and quality, soil C pools and also the time C resides in the soil. Our study demonstrates that forest fires have a profound influence on soil C recovery and soil C turnover both on permafrost and non-permafrost soils. In recently burnt areas the potential soil C turnover times were two times longer than in control areas (fire >100 years ago). The effect of fires on soil C turnover times lasted up to 25 years after the fire (in permafrost areas). Also, the depth of the soil horizon (surface organic layer, or mineral soils from different depths) had a significant effect on the potential soil C turnover time. Although average soil C turnover times were similar in post-fire permafrost and non-permafrost soils, the soil C emissions rates in permafrost areas are approximately three times higher compared to non-permafrost areas. This all may have implications on the estimations of the long-term changes in the boreal forest C balance.
The datasets presented in this study can be found in online repositories. The names of the repository/repositories and accession number(s) can be found below: https://figshare.com/s/09d875bef9ba97c3b6c5.
KK: Conceptualization, Formal analysis, Funding acquisition, Investigation, Methodology, Resources, Visualization, Writing – original draft, Writing – review & editing. HA: Formal analysis, Investigation, Writing – review & editing. EK: Formal analysis, Investigation, Writing – review & editing. FB: Investigation, Methodology, Writing – review & editing. JP: Funding acquisition, Investigation, Methodology, Resources, Writing – review & editing.
The author(s) declare financial support was received for the research, authorship, and/or publication of this article. This work was supported by the Academy of Finland (project numbers 294600, 307222, 327198 286685 and 326818) and the EU H2020 (Grant Agreement No. 730938) INTERACT TNA project PERMAFIRE.
The authors declare that the research was conducted in the absence of any commercial or financial relationships that could be construed as a potential conflict of interest.
The author(s) declared that they were an editorial board member of Frontiers, at the time of submission. This had no impact on the peer review process and the final decision.
All claims expressed in this article are solely those of the authors and do not necessarily represent those of their affiliated organizations, or those of the publisher, the editors and the reviewers. Any product that may be evaluated in this article, or claim that may be made by its manufacturer, is not guaranteed or endorsed by the publisher.
The Supplementary Material for this article can be found online at: https://www.frontiersin.org/articles/10.3389/fevo.2023.1331018/full#supplementary-material
Aaltonen H., Köster K., Köster E., Berninger F., Zhou X., Karhu K., et al. (2019a). Forest fires in Canadian permafrost region: the combined effects of fire and permafrost dynamics on soil organic matter quality. Biogeochemistry 143, 257–274. doi: 10.1007/s10533-019-00560-x
Aaltonen H., Palviainen M., Zhou X., Köster E., Berninger F., Pumpanen J., et al. (2019b). Temperature sensitivity of soil organic matter decomposition after forest fire in Canadian permafrost region. J. Environ. Manage. 241, 637–644. doi: 10.1016/j.jenvman.2019.02.130
Andrieux B., Paré D., Beguin J., Grondin P., Bergeron Y. (2020). Boreal-forest soil chemistry drives soil organic carbon bioreactivity along a 314-year fire chronosequence. SOIL 6, 195–213. doi: 10.5194/soil-6-195-2020
Balshi M. S., McGuire A. D., Duffy P., Flannigan M., Walsh J., Melillo J. (2009). Assessing the response of area burned to changing climate in western boreal North America using a Multivariate Adaptive Regression Splines (MARS) approach. Global Change Biol. 15, 578–600. doi: 10.1111/j.1365-2486.2008.01679.x
Bormann B. T., Homann P. S., Darbyshire R. L., Morrissette B. A. (2008). Intense forest wildfire sharply reduces mineral soil C and N: The first direct evidence. Can. J. For. Res. 38, 2771–2783. doi: 10.1139/X08-136
Boulanger Y., Gauthier S., Gray D. R., Le Goff H., Lefort P., Morissette J. (2013). Fire regime zonation under current and future climate over eastern Canada. Ecol. Appl. 23, 904–923. doi: 10.1890/12-0698.1
Bradshaw C. J. A., Warkentin I. G. (2015). Global estimates of boreal forest carbon stocks and flux. Global Planetary Change 128, 24–30. doi: 10.1016/j.gloplacha.2015.02.004
Burn C. R. (1998). The response, (1958-1997) of permafrost and near-surface ground temperatures to forest fire, Takhini River valley, southern Yukon Territory. Can. J. Earth Sci. 35, 184–199. doi: 10.1139/e97-105
Carvalhais N., Forkel M., Khomik M., Bellarby J., Jung M., Migliavacca M., et al. (2014). Global covariation of carbon turnover times with climate in terrestrial ecosystems. Nature 514, 213–217. doi: 10.1038/nature13731
CCN (2017). Canadian climate normals. Available at: https://climate.weather.gc.ca/climate_normals/ [Accessed March 12, 2022].
Certini G. (2005). Effects of fire on properties of forest soils: A review. Oecologia 143, 1–10. doi: 10.1007/s00442-004-1788-8
Coleman K., Jenkinson D. S., Crocker G. J., Grace P. R., Klír J., Körschens M., et al. (1997). Simulating trends in soil organic carbon in long-term experiments using RothC-26.3. Geoderma 81, 29–44. doi: 10.1016/S0016-7061(97)00079-7
Cornwell W. K., Cornelissen J. H. C., Amatangelo K., Dorrepaal E., Eviner V. T., Godoy O., et al. (2008). Plant species traits are the predominant control on litter decomposition rates within biomes worldwide. Ecol. Lett. 11. 1065–1071. doi: 10.1111/j.1461-0248.2008.01219.x
Davidson E. A., Janssens I. A. (2006). Temperature sensitivity of soil carbon decomposition and feedbacks to climate change. Nature 440, 165–173. doi: 10.1038/nature04514
de Groot W. J., Bothwell P. M., Carlsson D. H., Logan K. A. (2003). Simulating the effects of future fire regimes on western Canadian boreal forests. J. Veg. Sci. 14, 355–364. doi: 10.1111/j.1654-1103.2003.tb02161.x
de Groot W. J., Flannigan M. D., Cantin A. S. (2013). Climate change impacts on future boreal fire regimes. For. Ecol. Manage. 294, 35–44. doi: 10.1016/j.foreco.2012.09.027
Deluca T. H., Boisvenue C. (2012). Boreal forest soil carbon: distribution, function and modelling. Forestry: Int. J. For. Res. 85, 161–184. doi: 10.1093/forestry/cps003
Dungait J. A. J., Hopkins D. W., Gregory A. S., Whitmore A. P. (2012). Soil organic matter turnover is governed by accessibility not recalcitrance. Global Change Biol. 18, 1781–1796. doi: 10.1111/j.1365-2486.2012.02665.x
Frank D. A., Pontes A. W., McFarlane K. J. (2012). Controls on soil organic carbon stocks and turnover among North American ecosystems. Ecosystems 15, 604–615. doi: 10.1007/s10021-012-9534-2
French N. H. F., Whitley M. A., Jenkins L. K. (2016). Fire disturbance effects on land surface albedo in Alaskan tundra. J. Geophys. Res.Biogeosci. 121, 841–854. doi: 10.1002/2015JG003177
Gibson C. M., Chasmer L. E., Thompson D. K., Quinton W. L., Flannigan M. D., Olefeldt D. (2018). Wildfire as a major driver of recent permafrost thaw in boreal peatlands. Nat. Commun. 9, 3041–3041. doi: 10.1038/s41467-018-05457-1
Gillabel J., Cebrian-Lopez B., Six J., Merckx R. (2010). Experimental evidence for the attenuating effect of SOM protection on temperature sensitivity of SOM decomposition. Global Change Biol. 16, 2789–2798. doi: 10.1111/j.1365-2486.2009.02132.x
Girardin M. P., Ali A. A., Carcaillet C., Mudelsee M., Drobyshev I., Hely C., et al. (2009). Heterogeneous response of circumboreal wildfire risk to climate change since the early 1900s. Global Change Biol. 15, 2751–2769. doi: 10.1111/j.1365-2486.2009.01869.x
Goh K. M. (2004). Carbon sequestration and stabilization in soils: Implications for soil productivity and climate change. Soil Sci. Plant Nutr. 50, 467–476. doi: 10.1080/00380768.2004.10408502
González-Pérez J. A., González-Vila F. J., Almendros G., Knicker H. (2004). The effect of fire on soil organic matter - A review. Environ. Int. 30, 855–870. doi: 10.1016/j.envint.2004.02.003
Hakkenberg R., Churkina G., Rodeghiero M., Börner A., Steinhof A., Cescatti A. (2008). Temperature sensitivity of the turnover times of soil organic matter in forests. Ecol. Appl. 18, 119–131. doi: 10.1890/06-1034.1
Han C.-L., Sun Z.-X., Shao S., Wang Q.-B., Libohova Z., Owens P. R. (2021). Changes of soil organic carbon after wildfire in a Boreal forest, Northeast CHINA. Agronomy 11, 1925. doi: 10.3390/agronomy11101925
Helbig M., Pappas C., Sonnentag O. (2016). Permafrost thaw and wildfire: Equally important drivers of boreal tree cover changes in the Taiga Plains, Canada. Geophysical Res. Lett. 43, 1598–1606. doi: 10.1002/2015GL067193
Herman-Mercer N. M. (2017). Active Layer Data from the Yukon River Basin. In Alaska and Canada: U.S. Geological Survey data release. doi: 10.5066/F7NC5ZFM [Accessed March 12, 2022]
Hobbie S. E., Schimel J. P., Trumbore S. E., Randerson J. R. (2000). Controls over carbon storage and turnover in high-latitude soils. Global Change Biol. 6, 196–210. doi: 10.1046/j.1365-2486.2000.06021.x
Ito E., Ikemoto Y., Yoshioka T. (2015). Thermodynamic implications of highQ10 of thermoTRP channels in living cells. BIOPHYSICS 11, 33–38. doi: 10.2142/biophysics.11.33
Jafarov E. E., Romanovsky V. E., Genet H., McGuire A. D., Marchenko S. S. (2013). The effects of fire on the thermal stability of permafrost in lowland and upland black spruce forests of interior Alaska in a changing climate. Environ. Res. Lett. 8, 035030. doi: 10.1088/1748-9326/8/3/035030
Jorgenson M. T., Romanovsky V., Harden J., Shur Y., O’Donnell J., Schuur E. A. G., et al. (2010). Resilience and vulnerability of permafrost to climate changeThis article is one of a selection of papers from the dynamics of change in Alaska’s boreal forests: resilience and vulnerability in response to climate warming. Can. J. For. Res. 40, 1219–1236. doi: 10.1139/X10-060
Karhu K., Fritze H., Tuomi M., Vanhala P., Spetz P., Kitunen V., et al. (2010). Temperature sensitivity of organic matter decomposition in two boreal forest soil profiles. Soil Biol. Biochem. 42, 72–82. doi: 10.1016/j.soilbio.2009.10.002
Kasischke E. S., Christensen N. L. Jr., Stocks B. J. (1995). Fire, global warming, and the carbon balance of boreal forests. Ecol. Appl. 5, 437–451. doi: 10.2307/1942034
Knicker H. (2007). How does fire affect the nature and stability of soil organic nitrogen and carbon? A review. Biogeochemistry 85, 91–118. doi: 10.1007/s10533-007-9104-4
Köster K., Aaltonen H., Berninger F., Heinonsalo J., Köster E., Ribeiro-Kumara C., et al. (2021). Impacts of wildfire on soil microbiome in boreal environments. Curr. Opin. Environ. Sci. Health 22, 100258. doi: 10.1016/j.coesh.2021.100258
Köster K., Berninger F., Lindén A., Köster E., Pumpanen J. (2014). Recovery in fungal biomass is related to decrease in soil organic matter turnover time in a boreal fire chronosequence. Geoderma 235–236, 74–82. doi: 10.1016/j.geoderma.2014.07.001
Köster E., Köster K., Berninger F., Aaltonen H., Zhou X., Pumpanen J. (2017). Carbon dioxide, methane and nitrous oxide fluxes from a fire chronosequence in subarctic boreal forests of Canada. Sci. Total Environ. 601–602, 895–905. doi: 10.1016/j.scitotenv.2017.05.246
Köster E., Köster K., Berninger F., Prokushkin A., Aaltonen H., Zhou X., et al. (2018). Changes in fluxes of carbon dioxide and methane caused by fire in Siberian boreal forest with continuous permafrost. J. Environ. Manage. 228, 405–415. doi: 10.1016/j.jenvman.2018.09.051
Köster K., Köster E., Orumaa A., Parro K., Jogiste K., Berninger F., et al. (2016). How time since forest fire affects stand structure, soil physical-chemical properties and soil CO2 efflux in hemiboreal scots pine forest fire chronosequence? Forests 7, 201. doi: 10.3390/f7090201
Krezek-Hanes C., Ahern F., Cantin A., M.D. F. (2011). Trends in large fires in Canada 1959-2007. Canadian Biodiversity: Ecosystem Status and Trends 2010 (Ottawa, Ontario: Technical Thematic Report Natural Resources Canada, Canadian Forest Service, Northern Forestry Centre, Edmonton, Alberta, and Canadian Councils of Resource Ministers).
Kurz W. A., Apps M. J. (1994). The carbon budget of Canadian forests: A sensitivity analysis of changes in disturbance regimes, growth rates, and decomposition rates. Environ. pollut. 83, 55–61. doi: 10.1016/0269-7491(94)90022-1
Kuzyakov Y. (2006). Sources of CO2 efflux from soil and review of partitioning methods. Soil Biol. Biochem. 38, 425–448. doi: 10.1016/j.soilbio.2005.08.020
Lambert M. C., Ung C. H., Raulier F. (2005). Canadian national tree aboveground biomass equations. Can. J. For. Res. 35, 1996–2018. doi: 10.1139/x05-112
Lehmann J., Kleber M. (2015). The contentious nature of soil organic matter. Nature 528, 60–68. doi: 10.1038/nature16069
Liski J., Palosuo T., Peltoniemi M., Sievänen R. (2005). Carbon and decomposition model Yasso for forest soils. Ecol. Model. 189, 168–182. doi: 10.1016/j.ecolmodel.2005.03.005
Lloyd J. (1999). The CO2 dependence of photosynthesis, plant growth responses to elevated CO2 concentrations and their interaction with soil nutrient status, II. Temperate and boreal forest productivity and the combined effects of increasing CO2 concentrations and increased nitrogen deposition at a global scale. Funct. Ecol. 13, 439–459. doi: 10.1046/j.1365-2435.1999.00350.x
Luo Y., Ahlström A., Allison S. D., Batjes N. H., Brovkin V., Carvalhais N., et al. (2016). Toward more realistic projections of soil carbon dynamics by Earth system models. Global Biogeochemical Cycles 30, 40–56. doi: 10.1002/2015GB005239
Luo Z., Wang G., Wang E. (2019). Global subsoil organic carbon turnover times dominantly controlled by soil properties rather than climate. Nat. Commun. 10, 3688. doi: 10.1038/s41467-019-11597-9
Lützow M.V., Kögel-Knabner I., Ekschmitt K., Matzner E., Guggenberger G., Marschner B., et al. (2006). Stabilization of organic matter in temperate soils: mechanisms and their relevance under different soil conditions – a review. Eur. J. Soil Sci. 57, 426–445. doi: 10.1111/j.1365-2389.2006.00809.x
Miquelajauregui Y., Cumming S. G., Gauthier S. (2019). Sensitivity of boreal carbon stocks to fire return interval, fire severity and fire season: A simulation study of black spruce forests. Ecosystems 22, 544–562. doi: 10.1007/s10021-018-0287-4
Monson R. K., Lipson D. L., Burns S. P., Turnipseed A. A., Delany A. C., Williams M. W., et al. (2006). Winter forest soil respiration controlled by climate and microbial community composition. Nature 439, 711–714. doi: 10.1038/nature04555
Muñoz-Rojas M., Lewandrowski W., Erickson T. E., Dixon K. W., Merritt D. J. (2016). Soil respiration dynamics in fire affected semi-arid ecosystems: Effects of vegetation type and environmental factors. Sci. Total Environ. 572, 1385–1394. doi: 10.1016/j.scitotenv.2016.02.086
NCE (2011). Pelly crossing landscape hazards: geological mapping for climate change adaptation planning (Whitehorse: Yukon Research Centre), 48 p.
Neff J. C., Harden J. W., Gleixner G. (2005). Fire effects on soil organic matter content, composition, and nutrients in boreal interior Alaska. Can. J. For. Res. 35, 2178–2187. doi: 10.1139/x05-154
Palviainen M., Laurén A., Pumpanen J., Bergeron Y., Bond-Lamberty B., Larjavaara M., et al. (2020). Decadal-scale recovery of carbon stocks after wildfires throughout the boreal forests. Global Biogeochemical Cycles 34, e2020GB006612. doi: 10.1029/2020GB006612
Pan Y., Birdsey R. A., Fang J., Houghton R., Kauppi P. E., Kurz W. A., et al. (2011). and persistent carbon sink in the world’s forests. Science 333, 988–993. doi: 10.1126/science.1201609
Pingree M. R. A., DeLuca T. H. (2017). Function of wildfire-deposited pyrogenic carbon in terrestrial ecosystems. Front. Environ. Sci. 5, 53. doi: 10.3389/fenvs.2017.00053
Prescott C. E., Zabek L. M., Staley C. L., Kabzems R. (2000). Decomposition of broadleaf and needle litter in forests of British Columbia: influences of litter type, forest type, and litter mixtures. Can. J. For. Res. 30, 1742–1750. doi: 10.1139/x00-097
Ribeiro-Kumara C., Köster E., Aaltonen H., Köster K. (2020). How do forest fires affect soil greenhouse gas emissions in upland boreal forests? A review. Environ. Res. 184, 109328. doi: 10.1016/j.envres.2020.109328
Ribeiro-Kumara C., Santín C., Doerr S. H., Pumpanen J., Baxter G., Köster K. (2022). Short- to medium-term effects of crown and surface fires on soil respiration in a Canadian boreal forest. Can. J. For. Res 52, 591–604. doi: 10.1139/cjfr-2021-0354
Riikonen A., Pumpanen J., Mäki M., Nikinmaa E. (2017). High carbon losses from established growing sites delay the carbon sequestration benefits of street tree plantings – A case study in Helsinki, Finland. Urban Forestry Urban Greening 26, 85–94. doi: 10.1016/j.ufug.2017.04.004
Rodriguez-Ramos J. C., Cale J. A., Cahill J. F. Jr., Simard S. W., Karst J., Erbilgin N. (2020). Changes in soil fungal community composition depend on functional group and forest disturbance type. New Phytol. 229, 1105–1117. doi: 10.1111/nph.16749
Roznik E. A., Alford R. A. (2012). Does waterproofing Thermochron iButton dataloggers influence temperature readings? J. Thermal Biol. 37, 260–264. doi: 10.1016/j.jtherbio.2012.02.004
Santín C., Doerr S. H., Preston C. M., González-Rodríguez G. (2015). Pyrogenic organic matter production from wildfires: a missing sink in the global carbon cycle. Global Change Biol. 21, 1621–1633. doi: 10.1111/gcb.12800
Schuur E. A. G., Bockheim J., Canadell J. G., Euskirchen E., Field C. B., Goryachkin S. V., et al. (2008). Vulnerability of permafrost carbon to climate change: implications for the global carbon cycle. BioScience 58, 701–714. doi: 10.1641/B580807
Smith C. A. S., Meikle J. C., Roots C. F. (2004). “Ecoregions of the Yukon Territory: Biophysical properties of Yukon landscapes,” in PARC technical bulletin. Eds. Smith C. A. S., Meikle J. C., Roots C. F. (Summerland, British Columbia: Agriculture and Agri-Food Canada), 313.
Smith C. A. S., Webb K. T., Kenney E., Anderson A., Kroetsch D. (2011). Brunisolic soils of Canada: Genesis, distribution, and classification. Can. J. Soil Sci. 91, 695–717. doi: 10.4141/cjss10058
Sun H., Santalahti M., Pumpanen J., Köster K., Berninger F., Raffaello T., et al. (2016). Bacterial community structure and function shift across a northern boreal forest fire chronosequence. Sci. Rep. 6, 32411. doi: 10.1038/srep32411
Todd-Brown K. E. O., Randerson J. T., Post W. M., Hoffman F. M., Tarnocai C., Schuur E. A. G., et al. (2013). Causes of variation in soil carbon simulations from CMIP5 Earth system models and comparison with observations. Biogeosciences 10, 1717–1736. doi: 10.5194/bg-10-1717-2013
Trumbore S. (2009). Radiocarbon and soil carbon dynamics. Annu. Rev. Earth Planet. Sci. 37, 47–66. doi: 10.1146/annurev.earth.36.031207.124300
Tyukavina A., Potapov P., Hansen M. C., Pickens A. H., Stehman S. V., Turubanova S., et al. (2022). Global trends of forest loss due to fire from 2001 to 2019. Front. Remote Sens. 3, 825190. doi: 10.3389/frsen.2022.825190
van Leeuwen T. T., van der Werf G. R., Hoffmann A. A., Detmers R. G., Rücker G., French N. H. F., et al. (2014). Biomass burning fuel consumption rates: a field measurement database. Biogeosciences 11, 7305–7329. doi: 10.5194/bg-11-7305-2014
Wagner R. ,. G., Ter-Mikaelian M. ,. T. (1999). Comparison of biomass component equations for four species of northern coniferous tree seedlings. J. Ann. For. Sci. 56, 193–199. doi: 10.1051/forest:19990301
Walker X. J., Baltzer J. L., Cumming S. G., Day N. J., Ebert C., Goetz S., et al. (2019). Increasing wildfires threaten historic carbon sink of boreal forest soils. Nature 572, 520–523. doi: 10.1038/s41586-019-1474-y
Wang J., Sun J., Xia J., He N., Li M., Niu S. (2018). Soil and vegetation carbon turnover times from tropical to boreal forests. Funct. Ecol. 32, 71–82. doi: 10.1111/1365-2435.12914
WRB I. W. G. (2015). World Reference Base for Soil Resources 2014, update 2015 International soil classification system for naming soils and creating legends for soil maps. World Soil Resources Reports No. 106 (Rome: FAO).
Xu G., Chen J., Berninger F., Pumpanen J., Bai J., Yu L., et al. (2015). Labile, recalcitrant, microbial carbon and nitrogen and the microbial community composition at two Abies faxoniana forest elevations under elevated temperatures. Soil Biol. Biochem. 91, 1–13. doi: 10.1016/j.soilbio.2015.08.016
Yarie J., Billings S. (2002). Carbon balance of the taiga forest within Alaska: present and future. Can. J. For. Res. 32, 757–767. doi: 10.1139/x01-075
Zhang Y., Wolfe S. A., Morse P. D., Olthof I., Fraser R. H. (2015). Spatiotemporal impacts of wildfire and climate warming on permafrost across a subarctic region, Canada. J. Geophysical Research: Earth Surface 120, 2338–2356. doi: 10.1002/2015JF003679
Zhou X., Sun H., Pumpanen J., Sietiö O.-M., Heinonsalo J., Köster K., et al. (2019). The impact of wildfire on microbial C:N:P stoichiometry and the fungal-to-bacterial ratio in permafrost soil. Biogeochemistry 142, 1–17. doi: 10.1007/s10533-018-0510-6
Keywords: soil carbon turnover, forest fire, boreal forest, permafrost soils, non-permafrost soils
Citation: Köster K, Aaltonen H, Köster E, Berninger F and Pumpanen J (2024) Post-fire soil carbon emission rates along boreal forest fire chronosequences in northwest Canada show significantly higher emission potentials from permafrost soils compared to non-permafrost soils. Front. Ecol. Evol. 11:1331018. doi: 10.3389/fevo.2023.1331018
Received: 31 October 2023; Accepted: 05 December 2023;
Published: 03 January 2024.
Edited by:
Jinxin Cong, Chinese Academy of Sciences (CAS), ChinaReviewed by:
Chuanyu Gao, Chinese Academy of Sciences (CAS), ChinaCopyright © 2024 Köster, Aaltonen, Köster, Berninger and Pumpanen. This is an open-access article distributed under the terms of the Creative Commons Attribution License (CC BY). The use, distribution or reproduction in other forums is permitted, provided the original author(s) and the copyright owner(s) are credited and that the original publication in this journal is cited, in accordance with accepted academic practice. No use, distribution or reproduction is permitted which does not comply with these terms.
*Correspondence: Kajar Köster, a2FqYXIua29zdGVyQHVlZi5maQ==
Disclaimer: All claims expressed in this article are solely those of the authors and do not necessarily represent those of their affiliated organizations, or those of the publisher, the editors and the reviewers. Any product that may be evaluated in this article or claim that may be made by its manufacturer is not guaranteed or endorsed by the publisher.
Research integrity at Frontiers
Learn more about the work of our research integrity team to safeguard the quality of each article we publish.