- 1Key Laboratory of Lower Yellow River Channel and Estuary Regulation, Ministry of Water Resources (MWR), Yellow River Institute of Hydraulic Research, Yellow River Conservancy Commission (YRCC), Zhengzhou, China
- 2North China University of Water Resources and Electric Power, School of Water Conservancy, Zhengzhou, China
- 3School of Water Resources and Transportation, Zhengzhou University, Zhengzhou, China
The secondary suspended river increases the probability of the occurrence of “Heng river”, “Xie river” and “Gun river” in the lower Yellow River, and is the main factor threatening the safety of human life and property in the Yellow River levee and beach area. Here, the Dongbatou–Gaocun section of the severe secondary suspended river in the lower Yellow River was taken as the research object. The trend and periodicity of the evolution characteristics of the secondary suspended river in the study area from 1960–2021 were systematically analyzed using the Theil-Sen estimator and wavelet analysis, and the factors influencing its development were quantitatively explored. Over the past 62 years, development of secondary suspended rivers can be divided into four stages: initial formation (1960–1973), slow development (1974–1986), rapid development (1987–1999) and stable (2000–2021) periods. The evolution period of the beach transverse gradient differed significantly before and after operation of Xiaolangdi Reservoir commenced, prior to which there was a first main period of 31 years followed by a second main period of 21 years. Development of secondary suspended rivers was primarily related to floodplain flooding and human activity. When the inflow sediment coefficient of a floodplain flood (ζ) was < 0.04 and the floodplain coefficient was < 1.29, the secondary suspended river was relieved; when ζ > 0.04 or ζ < 0.04 and the floodplain coefficient was > 1.29, the secondary suspended river was intensified. The production levees have exacerbated development of secondary suspended rivers to some extent.
1 Introduction
The Yellow River has characteristics such as a small amount of water and a large amount of sediment”, various sources of water and sediment, and inconsistent water-sediment relationships (Liao, 2003). The lower Yellow River is in a strong siltation state because of the large amount of sediment (Hu and Zhang, 2006), and with annual average elevation of 0.05–0.10 m, the current riverbed is generally 4–6 m higher than the ground on both sides of the back river. Hence, the lower Yellow River has become a world-renowned “suspended river” (Jiang et al., 2003; Sun et al., 2008). Since the 1960s, with construction and operation of Sanmenxia Reservoir and construction of production levees (Gao et al., 2004; Yan et al., 2006), the water-sediment relationship in the lower Yellow River has become extremely disharmonious, and the downstream riverbed has continued to reduce in size. The main river channel gradually rises above the beach near the levee, forming a secondary suspended river with a high channel, low beach, and low levee root (Figure 1). Since the middle to late 1980s, the Yellow River has been in a relatively dry season. Downstream runoff has decreased, industrial and agricultural water use has increased significantly, the probability of deluge has decreased, the flood floodplain has reduced beach siltation, and the process of low flow has greatly increased. This changed the horizontal siltation distribution of the sediment that occurs under natural conditions, and the elevation difference between the beaches and channels further reduced; thus, the secondary suspended river is extremely severe.

Figure 1 Schematic diagram of the secondary suspended river in the lower Yellow River: ① Main channel; ② beach area; ③ beach lip; ④ production levee; ⑤ channel at the root of the levee; ⑥ secondary suspended river; ⑦ primary suspended river; ⑧ ground behind levee.
Since operation of Xiaolangdi Reservoir commenced in 2000, significant changes have occurred in the process of water and sediment entering the downstream area. Sedimentation of the downstream has been reduced; however, the situation of high channel, low beach, and low levee root remains. The most severely affected river section extends from Dongbatou–Taochengpu (Shan and Wang, 2021). The entire river water and sediment regulation with Xiaolangdi Reservoir as the core has slowed development of the secondary suspended river to a certain extent. However, there are problems such as insufficient subsequent momentum in the water and sediment regulation of Xiaolangdi Reservoir (Zhang et al., 2021). After the sediment retention capacity of Xiaolangdi Reservoir is reached, without the use of other backbone projects, the lower Yellow River will once again be severely silted and raised (YRCC, 2013) and the secondary suspended river will develop rapidly. In the event of a deluge, when the horizontal slope of the river beach is much greater than the vertical slope, the overflow ratio in the beach area will increase, which will directly threaten the safety of the Yellow River levee and human lives and property in the beach area. Therefore, there is an urgent need to study the evolution mechanism of secondary suspended rivers.
Since the early 1970s, secondary suspended rivers have formed in the lower Yellow River, and extensive research has been conducted on the causes, which are believed to be closely related to changes in the inflow, sediment, and boundary conditions of the river (Hu and Zhang, 2006). In terms of incoming water and sediment conditions, the amount of water and sediment entering the downstream has decreased due to human activities (Duanmu and Zhang, 2003; Liu, 2020), particularly with reductions in peak flow and flood frequency, which greatly reduces the probability of floodplain floods with a siltation beach and scouring channel. Furthermore, long-term low flow causes sedimentation and a reduction in size of the riverbed and accelerates development of secondary suspended rivers (Yan et al., 2006; Yang et al., 2006). Hyper-concentrated floods promote development of secondary suspended rivers (Jiang et al., 2003). Excessive use of Yellow River water has caused the total amount of water diverted from the Yellow River to exceed its carrying capacity, and production and social water use have long been occupying a large amount of sediment flushing water, which has also promoted development of secondary suspended rivers (Pang, 2005). In terms of channel boundary conditions, although production levees have alleviated inundation losses in the beach area to some extent, they have hindered water and sediment exchange in the beach and channel, accelerating development of secondary suspended rivers (Zhang, 2004; Pang, 2005; Yang et al., 2006; Zhang et al., 2018). To eliminate secondary suspended rivers, it is necessary to break down production levees (Zhang, 2004; Pang, 2005). Jiang et al. (1999) conducted extensive research on the adjustment laws of the vertical and horizontal sections, water and sediment transport, and exchange characteristics of the lower Yellow River, and highlighted that the lateral imbalance of sediment transport in the channel gradually formed secondary suspended rivers. Sun et al. (2008) established a planar two-dimensional water and sediment mathematical model for development of the secondary suspended river in the lower Yellow River and studied the impacts of the suspended difference in the secondary suspended river on flood routing, beach and channel flow structures, and flood discharge along the levee. The frequent occurrence of extreme weather worldwide (Pei et al., 2023) has also led to some geological disasters (Wang et al., 2022; Ma et al., 2023). Time series analysis is conducive to disaster identification and monitoring (Liu et al., 2022), and many experts have established corresponding prediction models (Qiu et al., 2022). However, there are still shortcomings in time series analysis of secondary suspended rivers.
Although the water and sediment regulations of Xiaolangdi have alleviated the secondary suspended river situation in the lower Yellow River to some extent, the threat of secondary suspended rivers to flood control remains significant, and secondary suspended rivers are receiving increasing attention. The 2021 Yellow River Basin Ecological Protection and High-Quality Development Plan Outline mentions that carrying out secondary suspended river management in the lower Yellow River to reduce the safety risks of the Yellow River levees, and which has put forward higher requirements for secondary suspended river management at the national level. Research on the causes and mechanisms of secondary suspended river formation has mostly been qualitative. However, research on the evolution characteristics of long-term secondary suspended rivers, their development and evolution after operation of Xiaolangdi Reservoir commenced, and the quantitative impact of various factors on secondary suspended rivers, remains relatively weak. Therefore, in the context of increasingly intensified human activities, there is an urgent need to comprehensively study the development and evolution of secondary suspended rivers from a long-term perspective, as well as the quantitative impact of various influencing factors on their formation. In this study, the most severe secondary suspended river section from Dongbatou–Gaocun in the wandering section of the lower Yellow River was selected to analyze the basic parameter evolution characteristics and periodicity of secondary suspended rivers under long-term time-series conditions, determine their severity, and quantitatively analyze and calculate the various factors that caused their development. The research results will have significant implications for managing wandering river channels and downstream flood control and provide theoretical and technical support for scientific management of secondary suspended rivers.
2 Materials and methods
2.1 Study areas
The wandering section of the lower Yellow River starts in Baihe in Mengjin, Henan, and ends in Gaocun in Dongming, Shandong. The river has a total length of 299 km, a wide and shallow channel, and significant erosion and sedimentation. The main stream oscillates frequently; the distance between the main levees on both sides is generally 5–10 km, with the widest levee distance exceeding 20 km. The Dongbatou–Gaocun section is 70 km long (Figure 2) and has a beach area of 402 km. The flood discharge width decreased from 10.5 km before construction of the production levee to 4.2 km after its construction. In the late 1990s, the bank-full discharge in this section of the river decreased to 2000 m³/s on one occasions, and the river was heavily silted up. Under the influence of various factors, the entire Dongbatou–Gaocun section forms a secondary suspended river, which is one of the most severe secondary suspended river situations (Jiang et al., 2006).
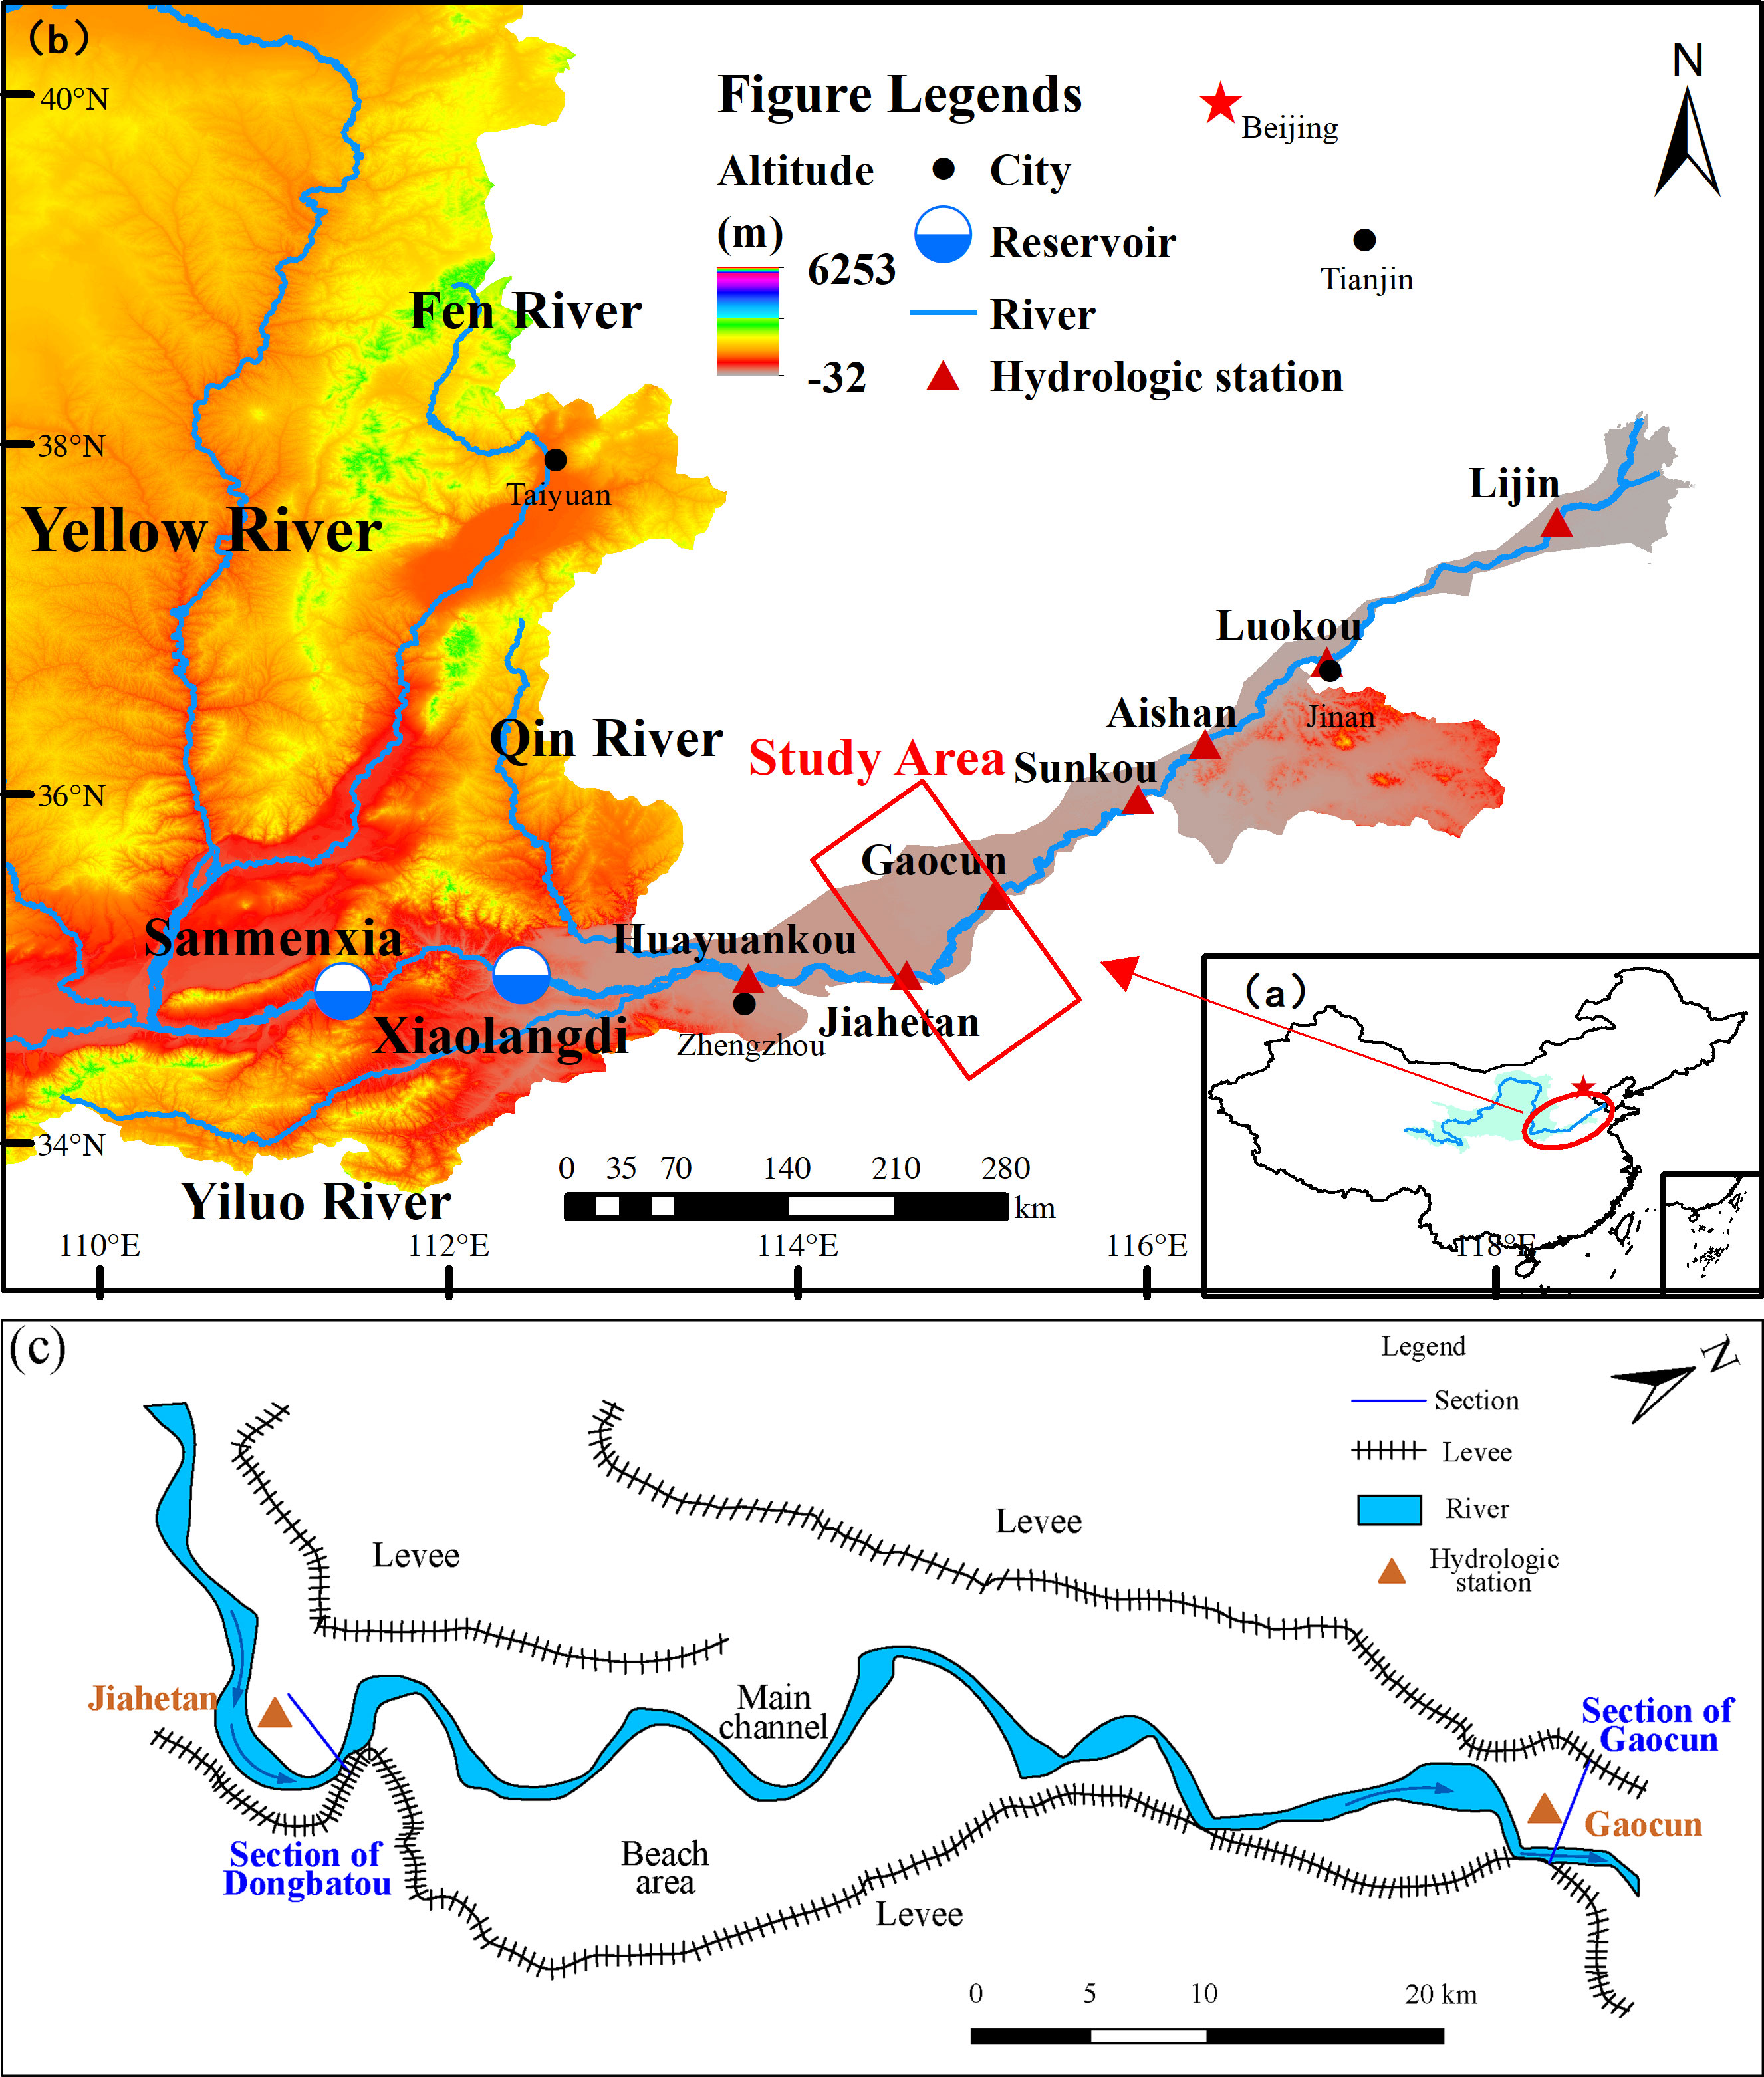
Figure 2 Study area location: (A) location of the lower Yellow River in China; (B) magnified lower Yellow River and location of the study area; (C) magnified study area.
2.2 Study methods
2.2.1 Data sources
Based on the large-section topography data of the Dongbatou–Gaocun section from 1960–2021, the elevations and starting distances of the beach lip and beach surface near the levees were determined, and the elevation difference and beach width between the beach lip and beach surface near the levees were calculated, followed by calculation of the beach transverse slope. The transverse slope of the beach is the ratio of the elevation difference between the beach lip and beach surface adjacent to the levee to the beach width. Taking the Gaocun section (1996) as an example, the calculation process of lateral slope is shown in Figure 3. Due to the fact that the lowest point elevation at the levee root cannot reflect the true transverse slope of the beach, the average elevation of the levee root within a certain range (300m) is used as the levee root elevation for this study. The main channel of the observation section set up in the research river section is mostly located on the right bank, which leads to the width of the right bank beach being too small and abnormal values in the transverse slope. To avoid this problem, we take the left bank as the research object. The system sorted and calculated the annual water volume and sediment volume of Huayuankou station in the lower Yellow River from 1960–2021, as well as the water volume, sediment volume, peak discharge, and other floodplain flood data. Large-section data were measured by professional departments of the Yellow River Conservancy Commission (YRCC). The water and sediment data of the series of years and floods were obtained from the sediment bulletin of the YRCC and hydrological data of the Yellow River basin. All data were official and of high authority.
2.2.2 Data processing methods
(1) Theil-Sen estimator
The Theil-Sen estimator is a stable non-parametric statistical trend calculation method. Using this method to estimate the linear slope has advantages of high calculation efficiency and insensitivity to measurement errors and discrete group data, and it is widely used in trend analysis of long time-series data (Kong et al., 2022). The formula is as follows:
where Median represents the median; xj and xi are the sample data corresponding to time j and time i (j > i), respectively; and k is the degree of the trend of the time series. When k > 0, the time series shows an upward trend, and when k< 0, the time series shows a downward trend.
(2) Wavelet analysis
Wavelet analysis is a signal analysis method based on the Fourier transform and developed in the early 1980s. The key to wavelet analysis is selection of the wavelet functions. A complex Morlet (Cmor) wavelet with good resolution in both the time and frequency domains was selected for this study.
Before using the wavelet analysis, the data of each sequence were subjected to anomaly processing, i.e., taking the mean difference between each element in the sequence and the sequence as the anomaly sequence. The amplitude of the wavelet coefficients calculated after leveling is smaller, which better reflects the fluctuation details of the wavelet coefficients (Wang et al., 2006). Because the measured sequence is a finite time series, boundary effects may occur at both ends. To eliminate the boundary effects generated at both ends of the sequence during wavelet transform, the two ends of the anomalous sequence were symmetrically extended (Sun and Luo, 2008). After the calculations were completed, the corresponding added data were deleted.
For wavelet functions that satisfy certain conditions, Ψ(t), the wavelet transform of the time series f(t) ∈ L2 (R) is:
where Wf (a, b) is the wavelet transform coefficient; f(t) is a signal or a flat integrable function; a is the scaling factor; b is the time factor, i.e., the translation of the reaction in time; is the complex conjugate function of Ψ. Wf(a, b) is a binary function that varies with parameters a and b, with b as the abscissa and a as the ordinate, drawing a three-dimensional surface map Wf, and its projection on the plane is a two-dimensional contour map. The wavelet transform three-dimensional surface map and contour map reflect the time‒frequency variation characteristics of the time series. When the scale of a was the same, the wavelet coefficient changed with time, reflecting the variation characteristics of the time series at that scale. By analyzing the wavelet coefficients, the periodic evolution characteristics of a long time series at multiple timescales can be identified (Sang et al., 2013).
The real parts of the Cmor wavelet coefficients reflected periodic changes in the transverse slope time series of the beach at different timescales. The modulus of the wavelet coefficients reflected the distribution of the energy density corresponding to different timescale periods in the time domain. The larger the modulus of the wavelet coefficients, the stronger the periodicity of their corresponding timescale during that time period, and the color mapping in the 3D surface and contour maps is warm. The square of the wavelet coefficient modulus is equivalent to the wavelet energy spectrum, which was used to analyze the oscillation energy of different periods and obtain the limitations of the periods in the time domain at different timescales.
To determine the main timescale of the time series, the square value of the wavelet coefficient modulus was integrated into the time domain to obtain the wavelet variance, as follows:
where Var(a,b) is the wavelet variance, and the meaning of Wf(a,b) is as described previously.
The process of changing the wavelet variance with the timescale a is called the wavelet variance map. Each peak in the wavelet variance map corresponded to a significant period. When the wavelet variance reaches its maximum value, the scale of the wavelet function most accurately matches the period of the time series, indicating that the periodic oscillation is the strongest at that scale and is referred to as the main period.
3 Results
3.1 Evolution characteristics of secondary suspended rivers
The main characteristics of secondary suspended rivers are the high beach lip elevation and low depression of the levee root. The average elevation of the levee root and average transverse slope of the beach were selected to characterize the development of the secondary suspended river.
3.1.1 Evolution process of average elevation of left-bank beach lip and levee root
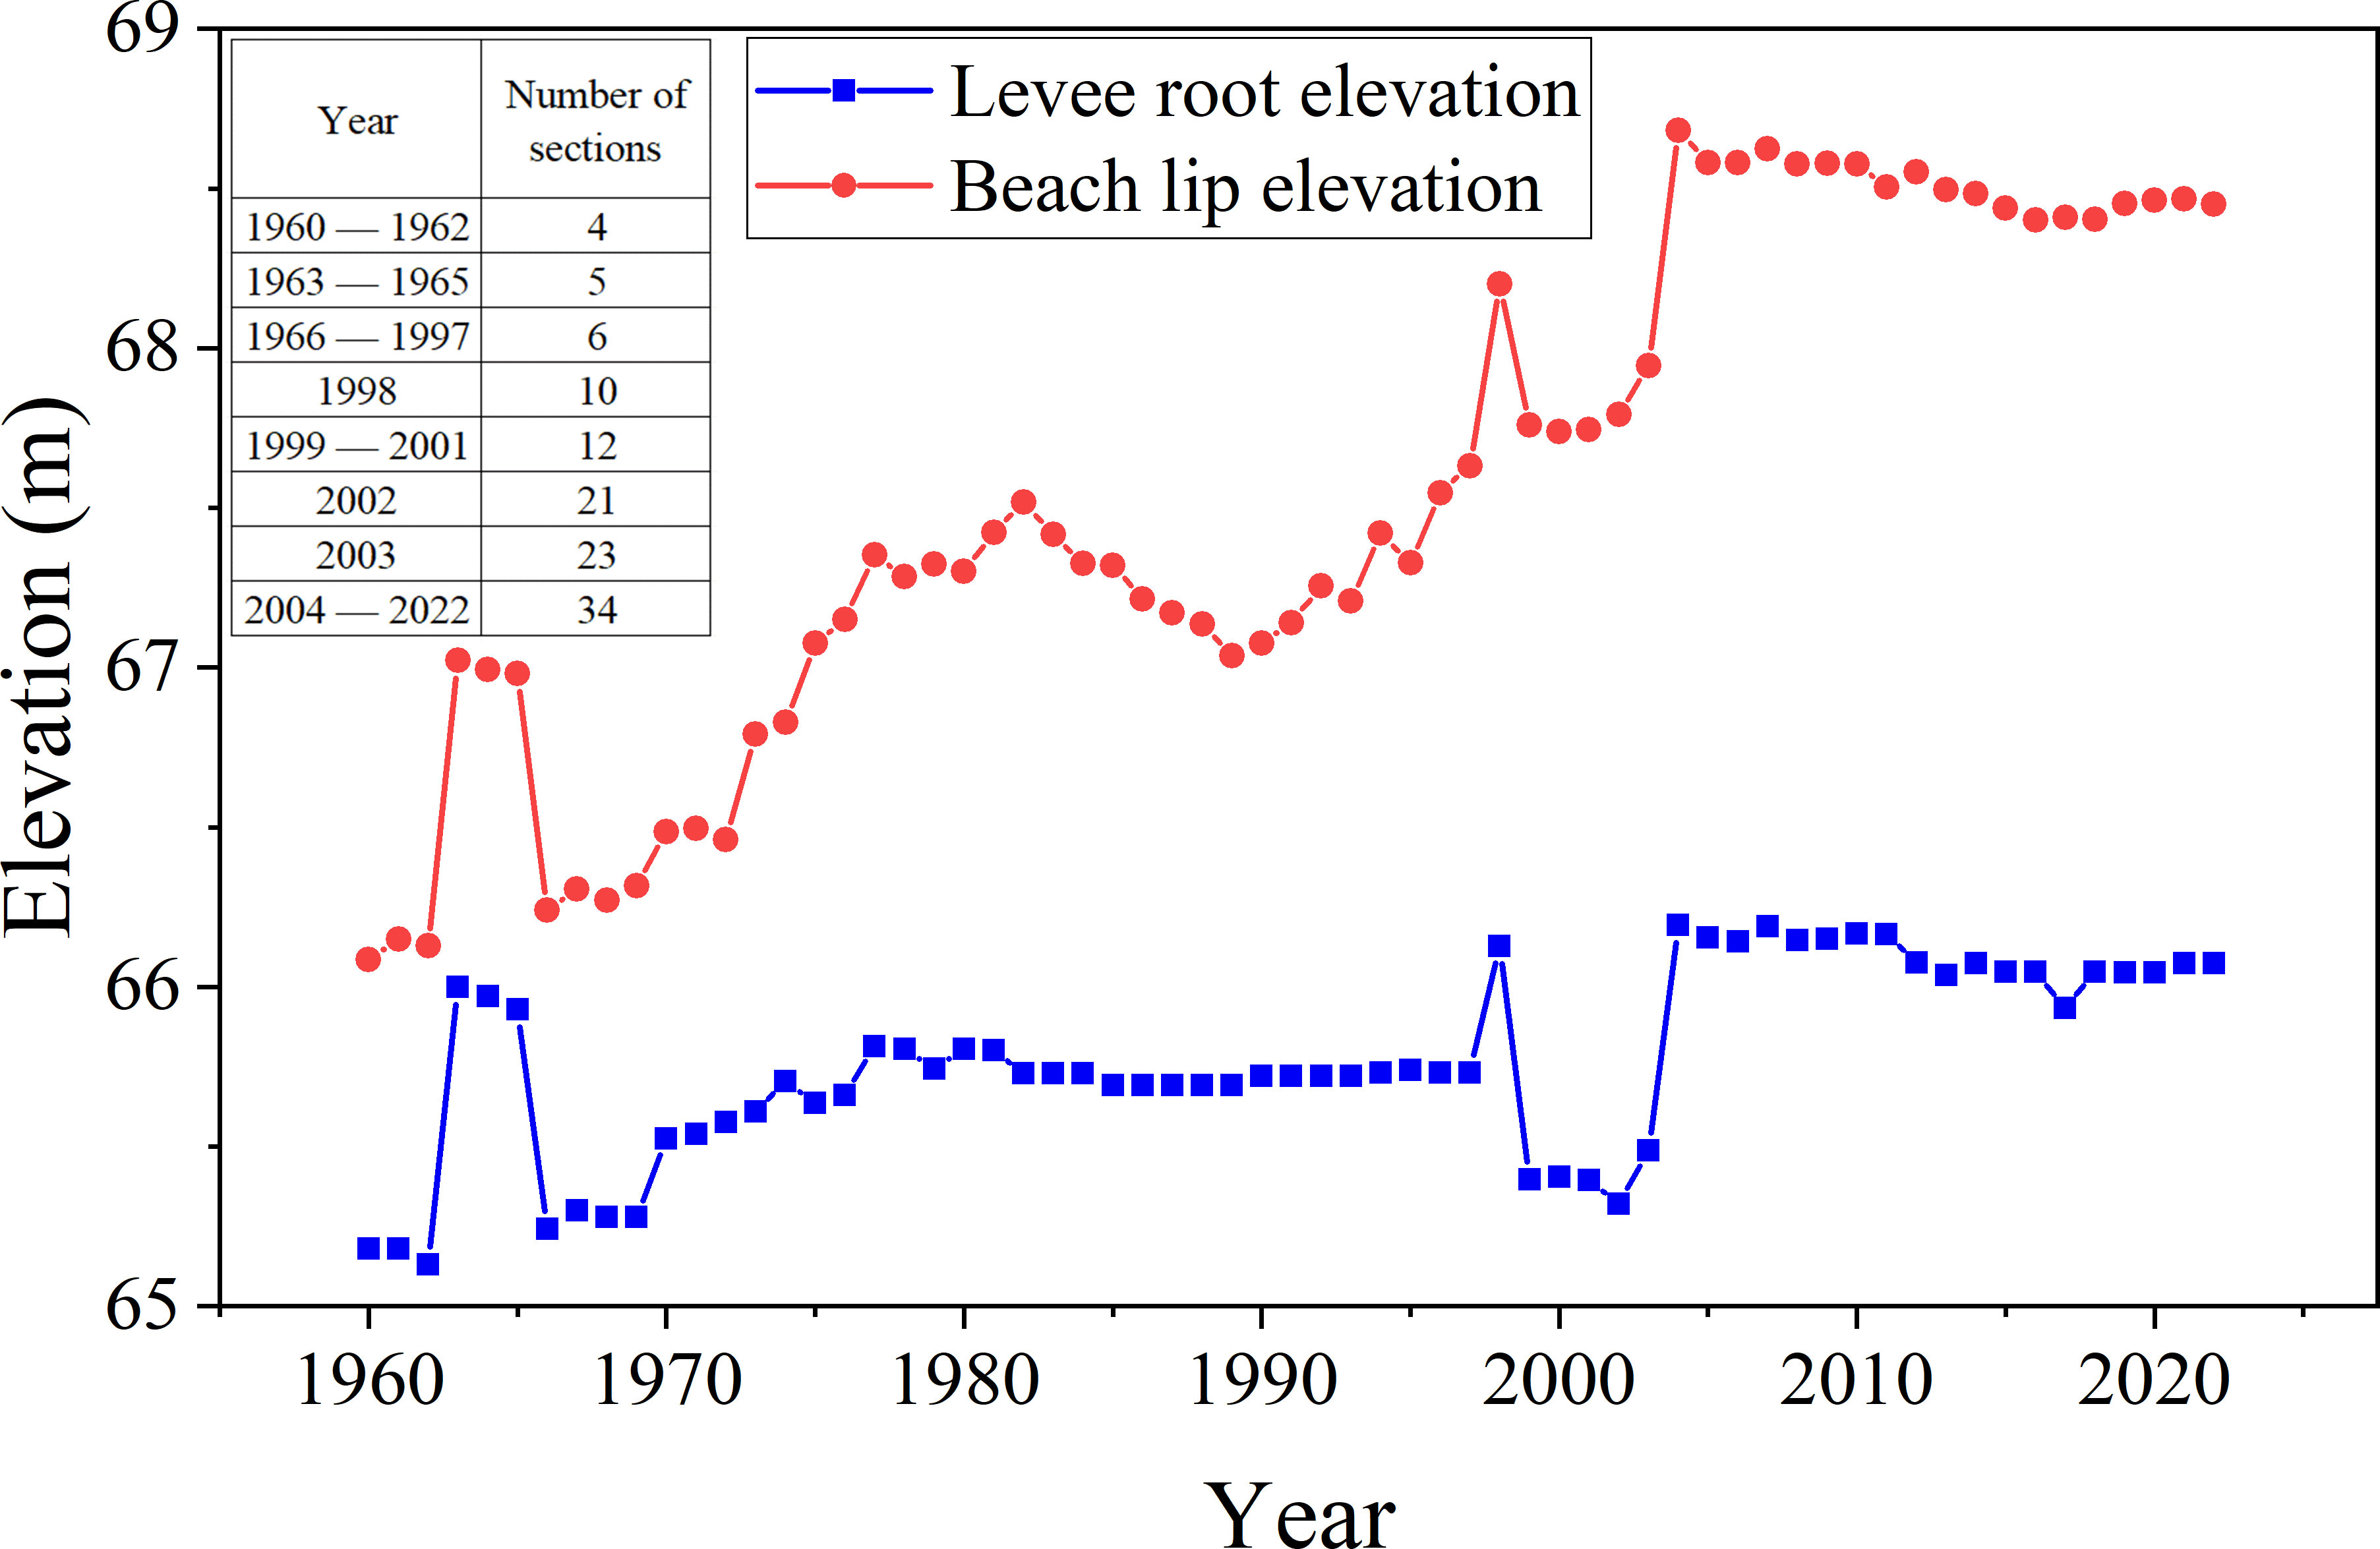
Severe sedimentation of the beach lip of the main channel was the direct cause of the formation of the secondary suspended river, and changes in its elevation reflected its evolution characteristics. Figure 4 shows the changes in the average elevations of the levee root and beach lip on the left bank in the Dongbatou–Gaocun section from 1960–2021. Owing to the inconsistent years of layout along the cross sections, the number of cross sections varied in different years. Figure 4 shows that an increase in the number of sections impacted the average levee root and beach lip elevations, which may have increased (e.g., from 1963–1965) or decreased (from 1999–2003). When the impact caused by the unstable period of the cross section was not considered, analyses of the data from other long-term series showed that the average elevations of the left-bank beach lip and levee root had both increased over time, and that the trend of their changes was relatively consistent. Although there was a slight increase in the average elevation of the levee root from 1970–1997, this change was extremely gentle. During this period, the average beach lip elevation changed significantly and increased annually; it decreased after 1983, and increased gradually after 1989. This indicated that the floodplain floods during this period only caused sedimentation at the beach lip with minimal impact on the levee roots. After 2004, the cross-sectional data remained stable, with both the average beach lip elevations and levee root being relatively high and the changes being relatively stable.
3.1.2 Evolution process of average transverse slope on the left-bank beach
The transverse slope of a beach is an important parameter that reflects the development level of secondary suspended rivers and an important indicator of the degree of flood risk in river channels. Therefore, variation in the transverse slope was an important manifestation of the evolution of the riverbed in the lower Yellow River.
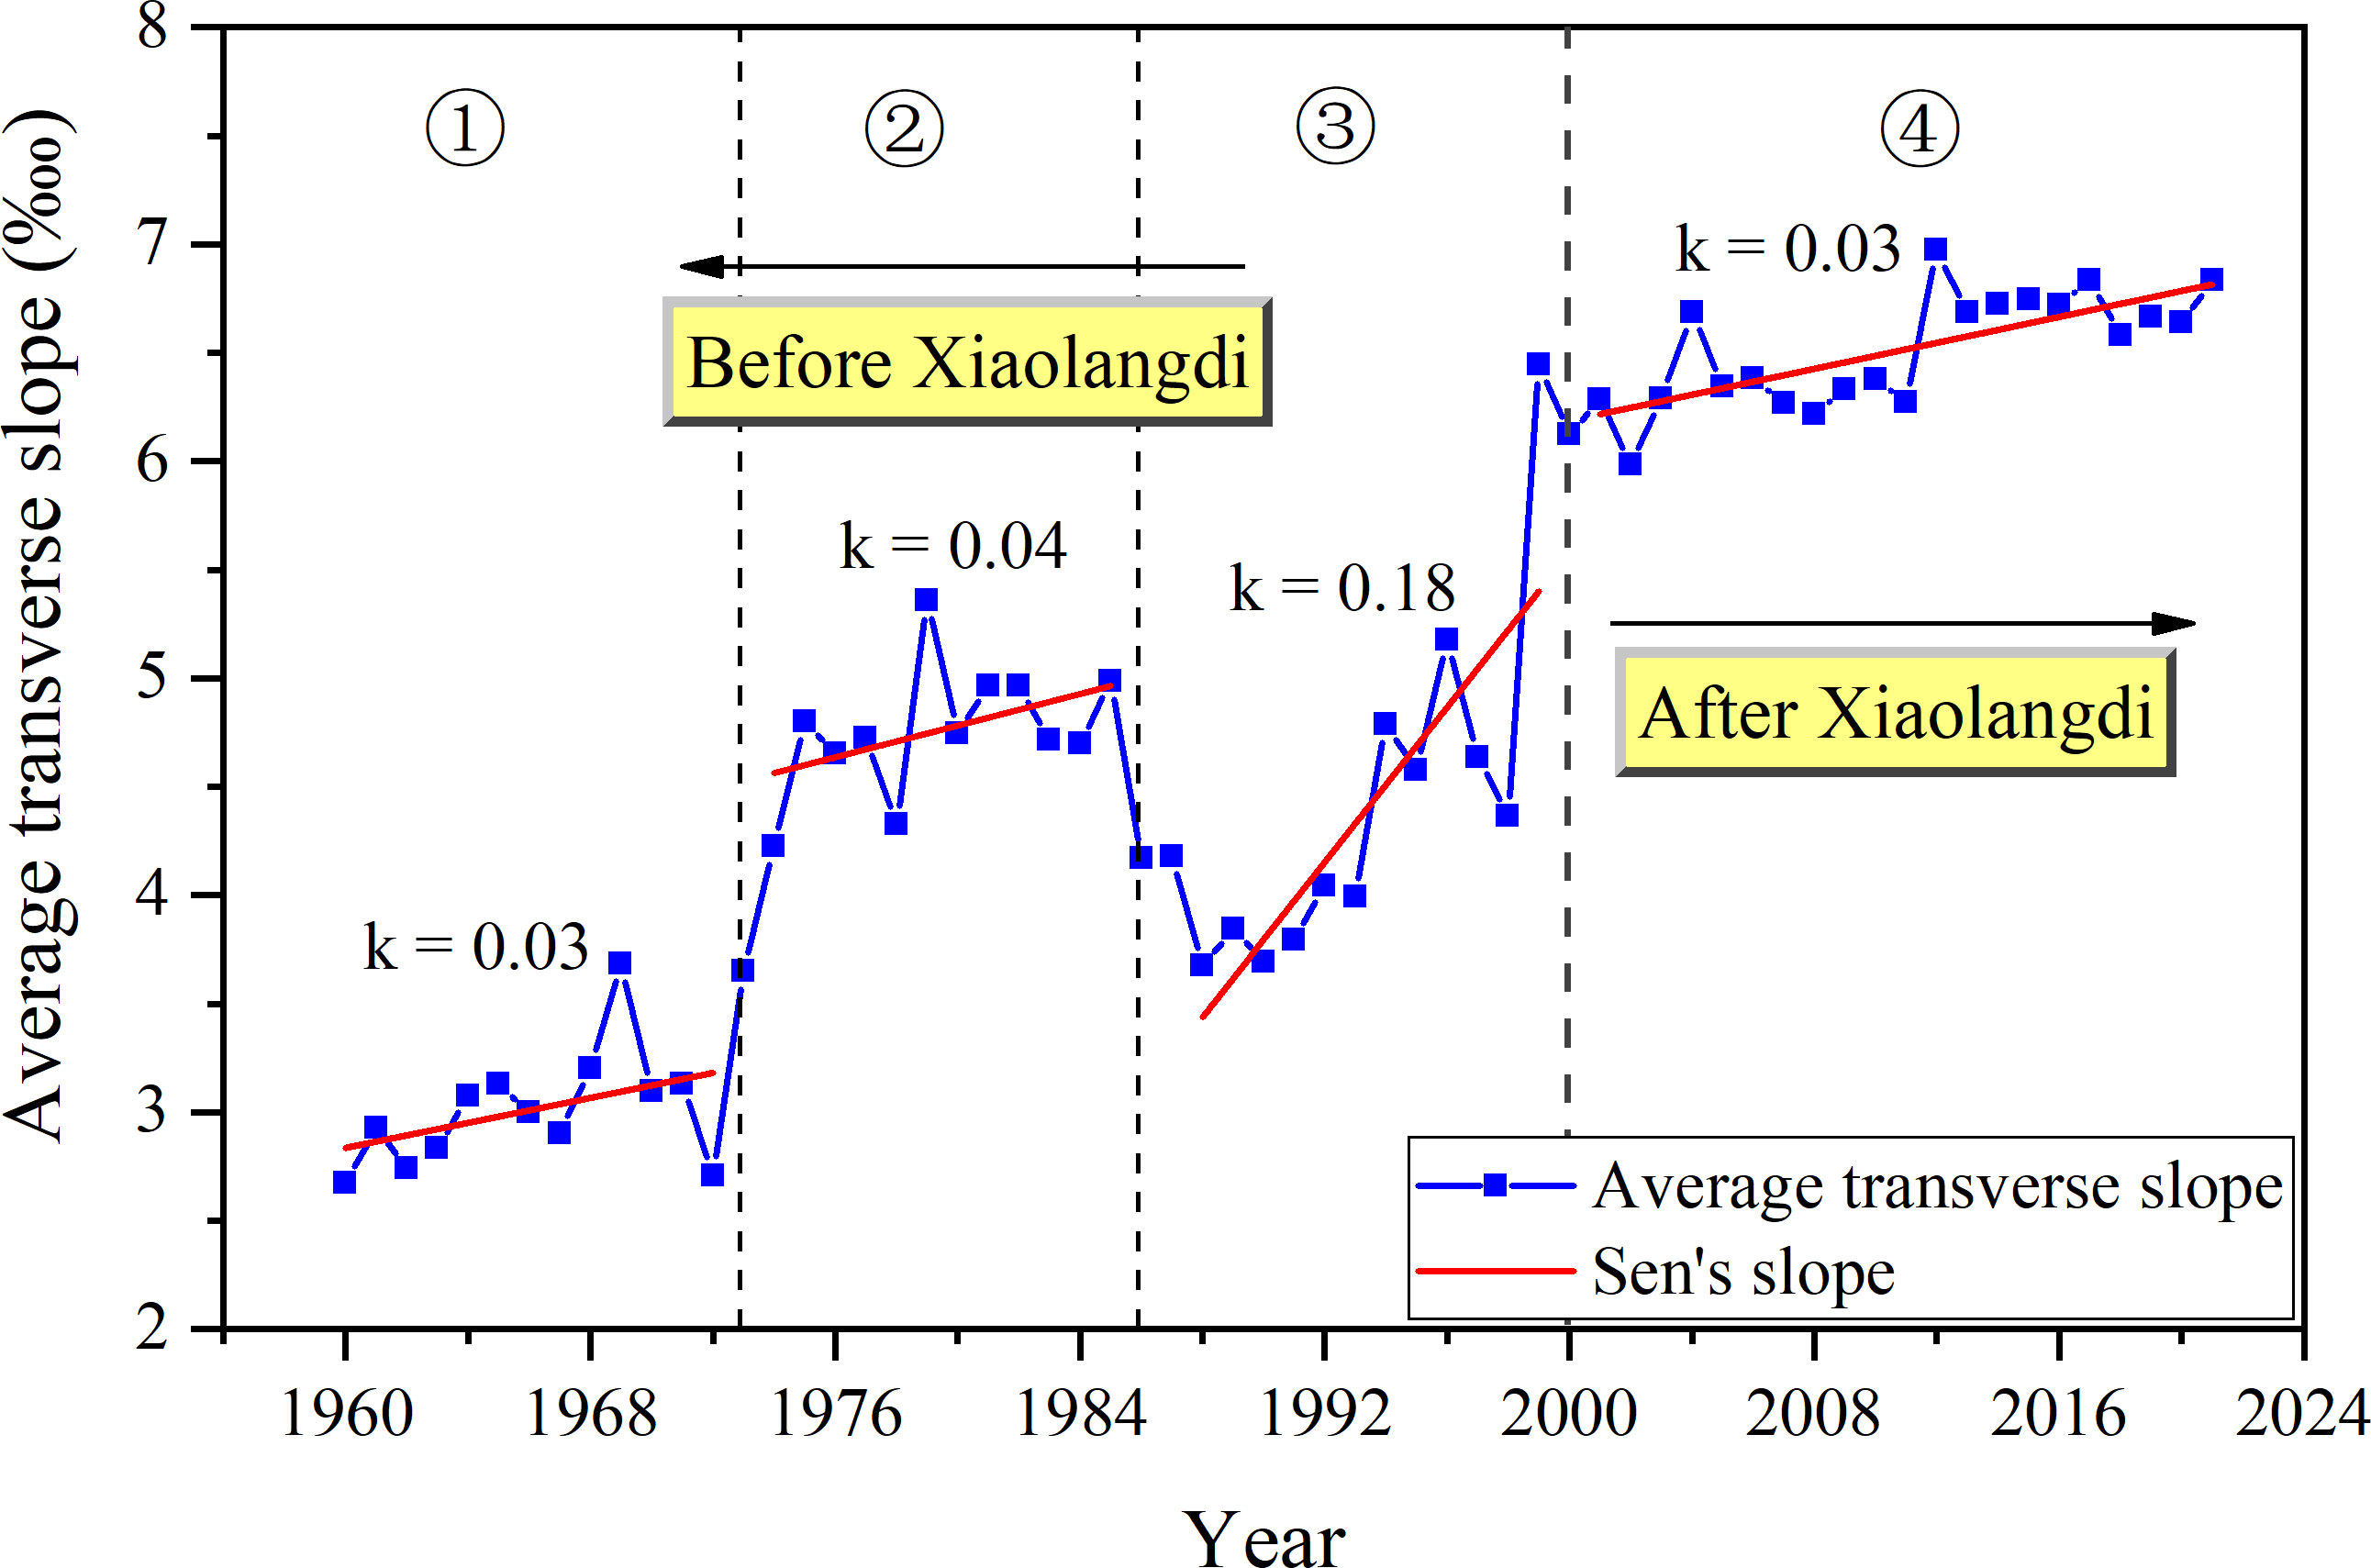
Figure 5 shows the evolution of the average transverse slope of the left-bank beach in the Dongbatou–Gaocun section from 1960–2021. Overall, prior to commencement of operation of Xiaolangdi Reservoir in 2000, the evolution trend of the average transverse slope of the beach underwent multiple fluctuations, and the overall trend gradually increased. In the analyses of its trend using the Theil–Sen estimator, the trend degree is expressed in k, which could be divided into four stages: ① 1960–1973, the transverse slope of the beach had a trend degree of k = 0.03, which belongs to the initial formation period of secondary suspended rivers; ② 1974–1986, k = 0.04, which belongs to the period of slow development of secondary suspended rivers; ③ 1987–1999, k = 0.18, which belongs to the rapid development period of secondary suspended rivers; and ④ 2000–2021, k = 0.03, which belongs to the stable period of secondary suspended rivers. The first three periods were before commencement of operation of Xiaolangdi Reservoir and the fourth period was after operation commenced.
Figure 6 and Table 1 present the transverse slope of the left-bank beach for each section from Dongbatou–Gaocun in 2021. As of 2021, the transverse slope of 88% of the cross section was within 10% and 12% of the cross section was > 10%. The secondary suspended rivers in the Shuangjing and Qingzhuang sections were the most severe, with a transverse slope of > 20% on the beach. The transverse slope from Xiezhaizha–Hedao was relatively small, i.e., basically within 5%. The current secondary suspended river situation in the lower Yellow River remains serious.
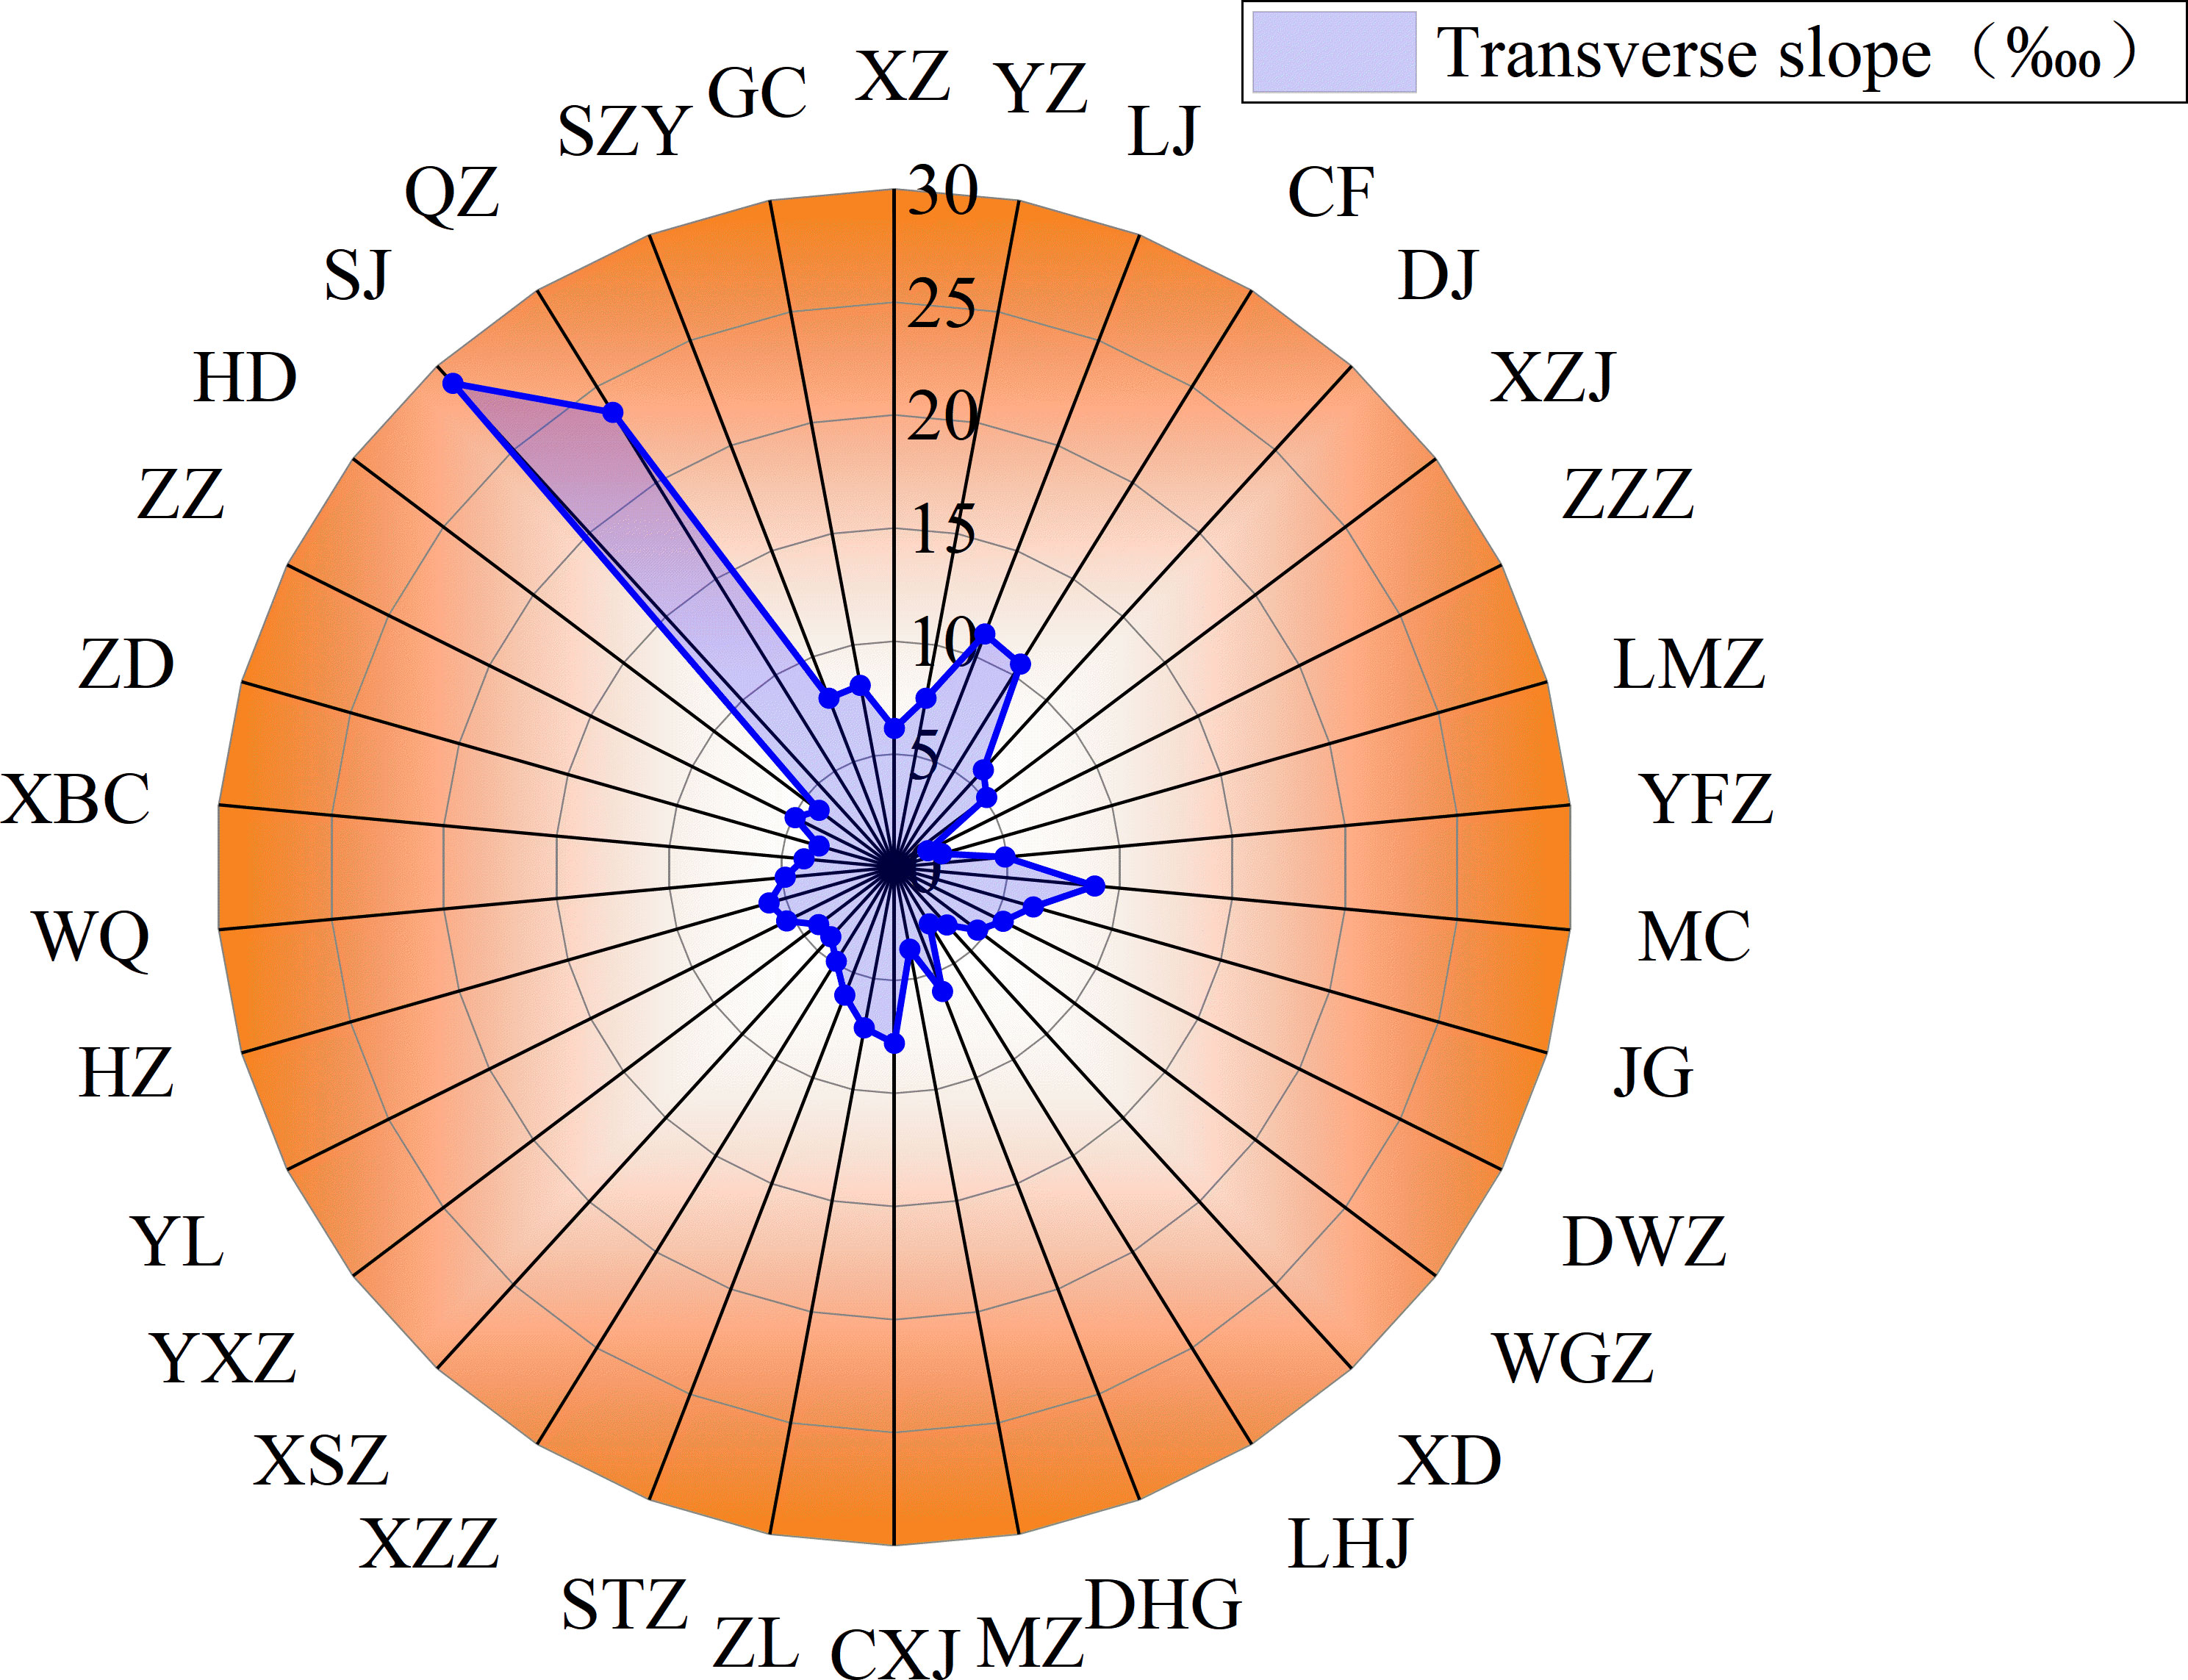
Figure 6 Trend of transverse slope change with channel section (numbers represent the transverse slope)(starting from XZ, clockwise direction is Xinzhuang, Yangzhuang, Leiji, Chanfang, Dianji, Xizhangji, Zuozhaizha, Limenzhuang, Youfangzhai, Machang, Jinggang, Dawangzhai, Wanggaozhai, Xindian, Liuheji, Dongheigang, Mazhai, Changxingji, Zhulin, Shitouzhuang, Xiezhaizha, Xiaosuzhuang, Yangxiaozhai, Yulin, Huangzhai, Wuqiu, Xibaocheng, Zhaodi, Zhangzhai, Hedao, Shuangjing, Qingzhuang, Shiziyuan and Gaocun respectively).
3.2 Periodicity of secondary suspended river evolution
The time-series changes in the transverse slope of the left bank beach from Dongbatou–Gaocun showed that the evolution law of the transverse slope had nonlinear characteristics and had been in a fluctuating state. The following presents a periodic analysis of the transverse slope using the Cmor wavelet analysis method.
Figure 7 shows the wavelet coefficients of the transverse slope of the left-bank beach from Dongbatou–Gaocun, China. Figures 7A, B show the wavelet real part three-dimensional surface maps and real-part contour maps, respectively, which reflect the distribution of the transverse slope in the timescale and the periodic changes in different time domains. Figure 7 shows that the wavelet coefficients fluctuate on timescales of 25–32, 15–25, 10–15, and 5–9 years, indicating multiple timescale characteristics in the transverse slope. There were three quasi-oscillations with alternating rises and falls on the 25–32-year timescale, and four and a half oscillations on the 15–25-year timescale. The wavelet coefficients exhibited the most drastic changes at these two timescales and most accurately represented the fluctuation pattern of the transverse slope.
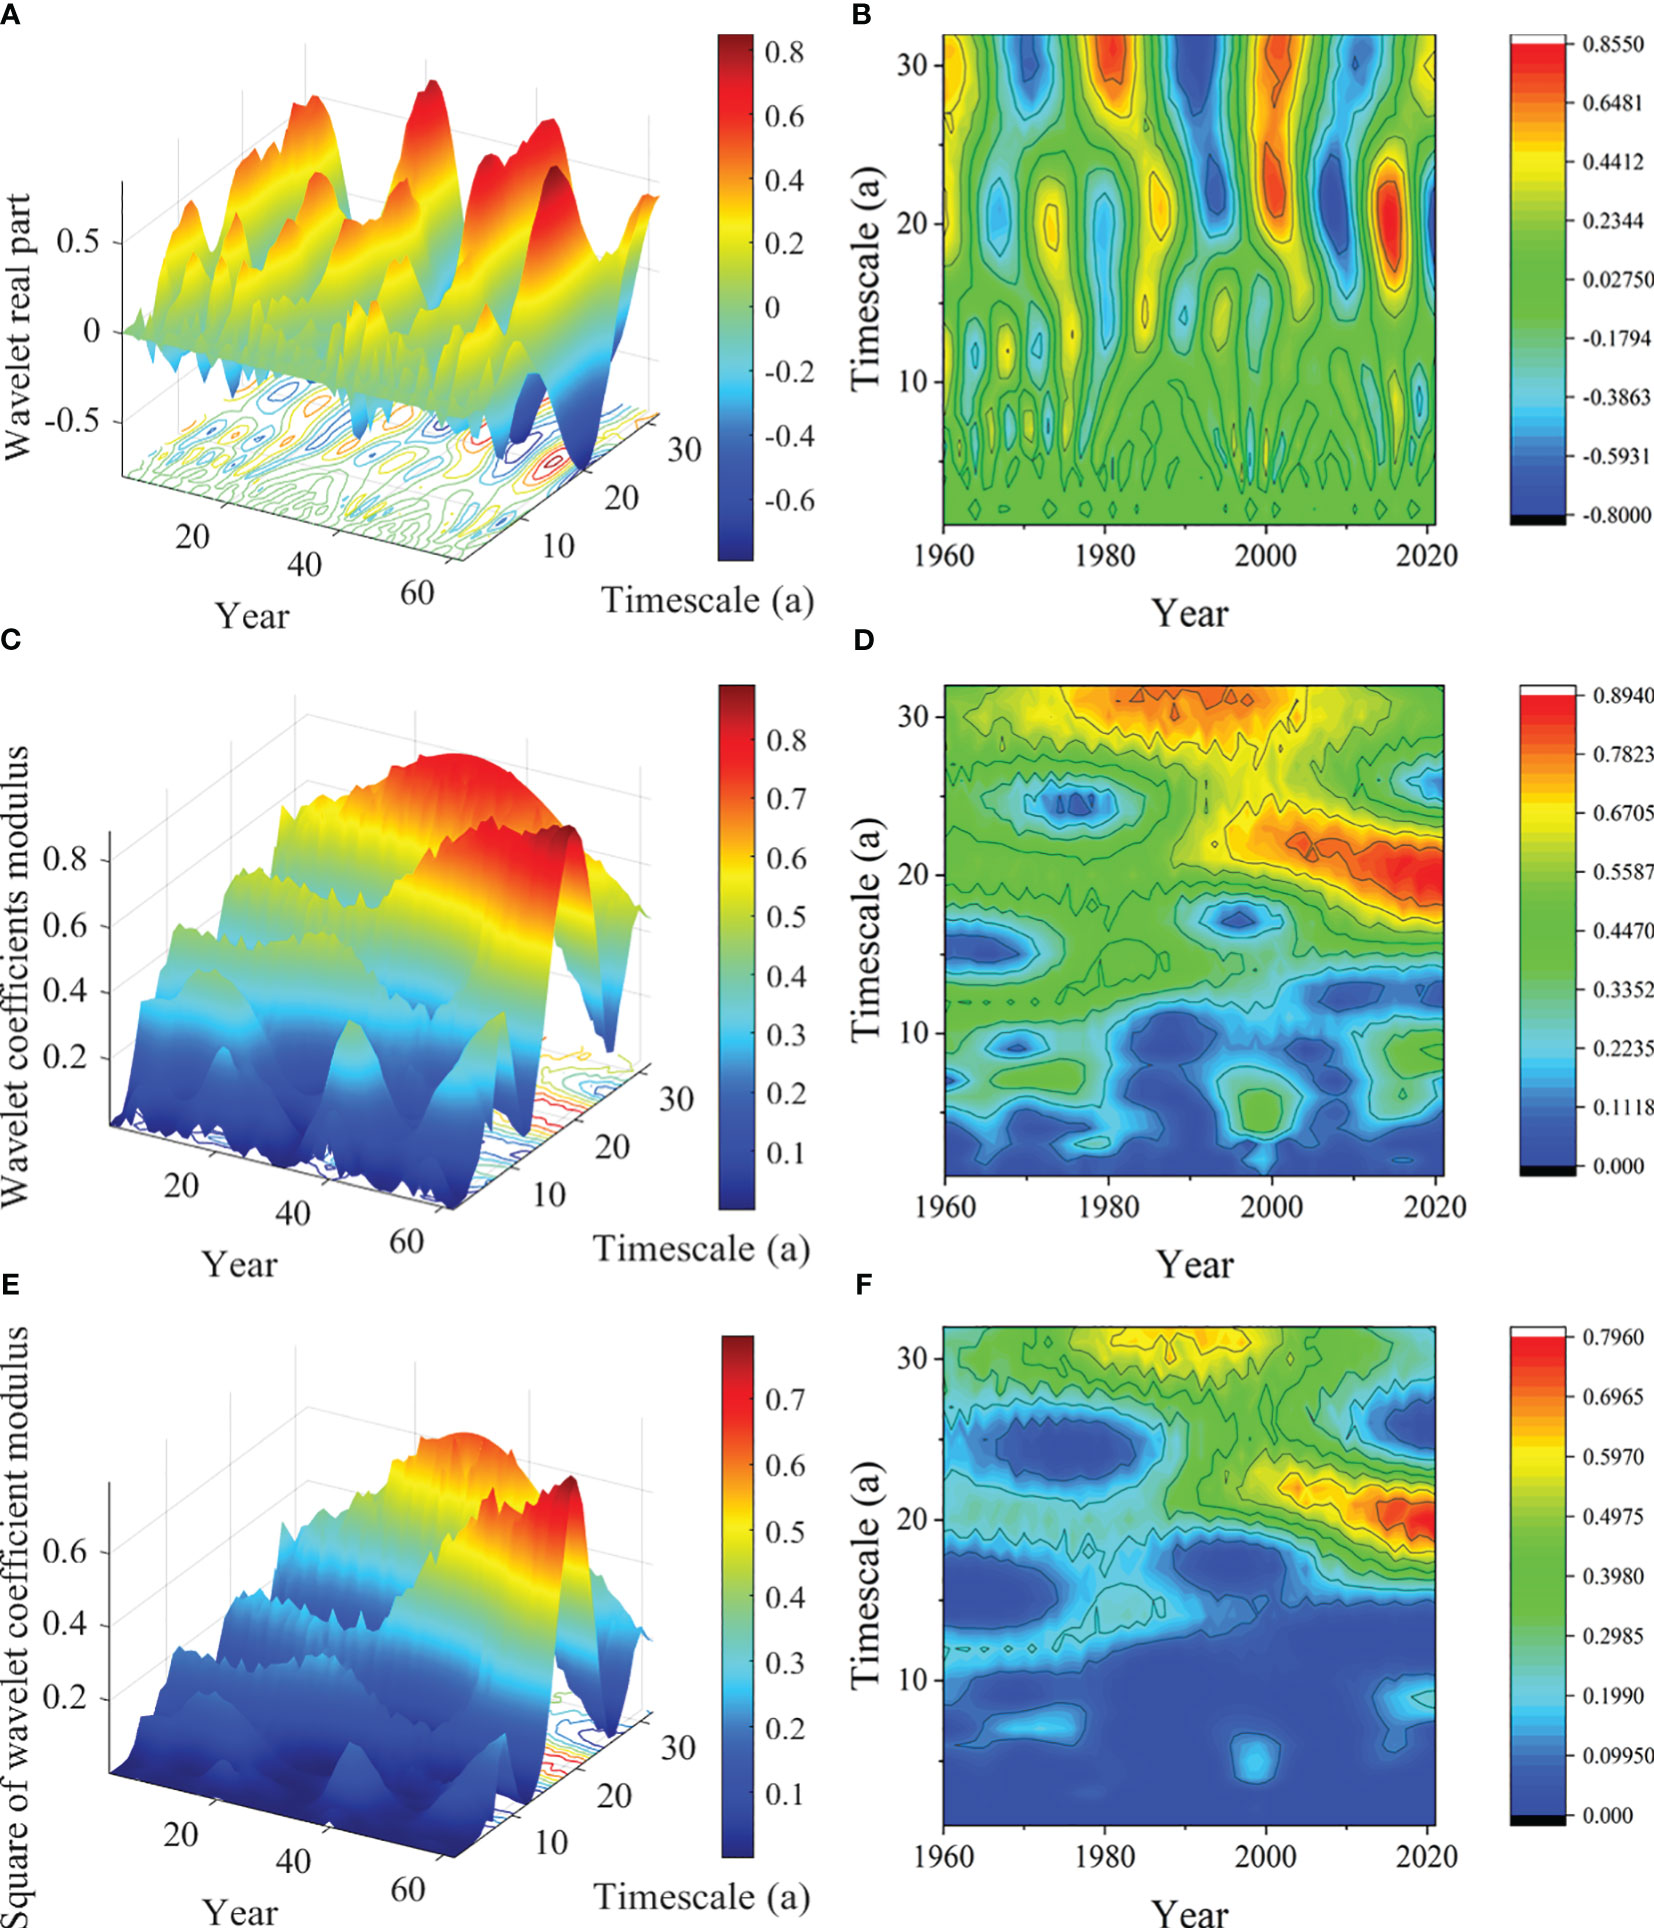
Figure 7 Wavelet coefficient map of the time series of the beach transverse slope: (A) wavelet real part 3D surface map, (B) wavelet real part contour map,(C) wavelet coefficient modulus 3D surface map, (D) wavelet coefficient modulus contour map, (E) 3D surface map of wavelet coefficient modulus square, (F) contour map of wavelet coefficient modulus square.
Figures 7C, D show the three-dimensional surface and contour maps of the wavelet coefficients of the transverse slope, respectively, reflecting the periodicity intensity of the corresponding timescales during this period. Warm colors indicated strong periodicities, and cold colors indicated weak periodicities. Figure 7 shows that during the evolution of the transverse slope, the modulus values on the 15–25 and 25–32-year timescales were the highest, indicating that the transverse slope period of the beach was the strongest within these two timescales; whereas, the modulus values of periodic changes on other timescales were small, indicating that the transverse slope period of the beach was not significant at other timescales.
Figures 7E, F show the three-dimensional surface and contour maps of the modulus of the wavelet coefficients of the transverse slope, which were used to analyze the oscillation energy of different periods. Unlike Figures 7C, D, Figures 7E, F clearly reflects the timescale of the strongest period. It can be seen that the energy on the 15–25-year timescale was the strongest, with a time domain distribution after 2000. The energy on the 25–32-year timescale was the second strongest, with a time-domain distribution from 1975–2000.
Figure 8 shows the variance and main period trend charts of the wavelet coefficient of the transverse slope of the beach, which reflect the main period and evolution trends of the transverse slope of the beach, respectively. Figure 8A shows two clear peaks in the wavelet variance map of the beach transverse slope: the first and second main periods. The first main period corresponded to a 31-year timescale, and the second main period corresponded to a 21-year timescale. Figure 8B shows that on the 31-year timescale of the first main period, the transverse slope experienced three quasi-oscillations with an evolution period of 20 years. On the 21-year timescale of the second main period, the transverse slope experienced four and a half oscillations, with an evolution period of 13–14 years.
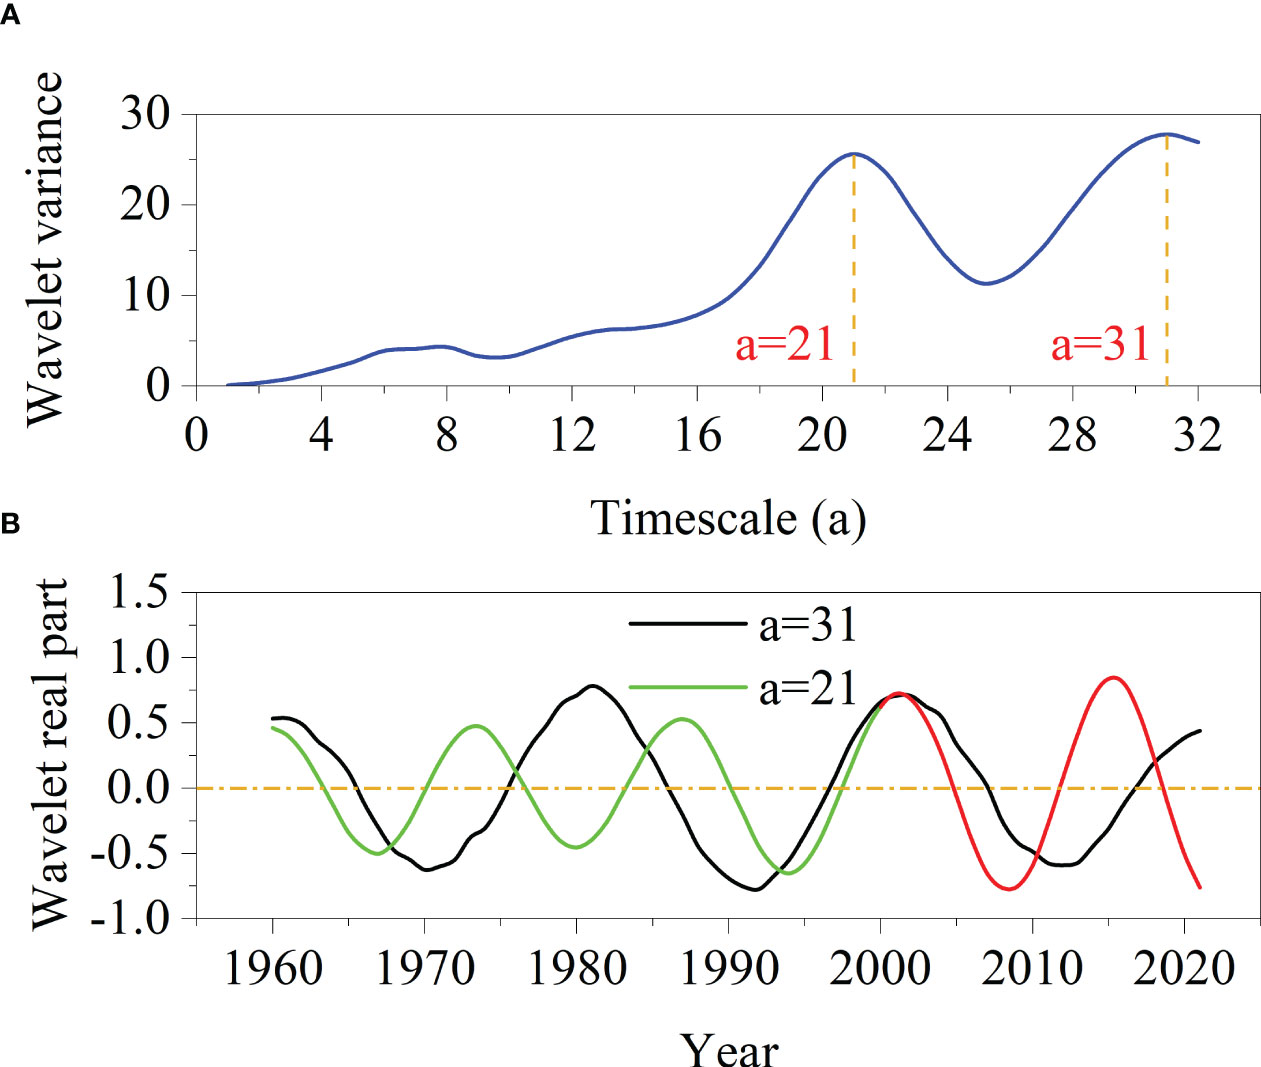
Figure 8 Wavelet map of the beach transverse slope: (A) wavelet variance map, (B) main period trend map of the beach transverse slope.
Figures 7 and 8 show that the first and second main periods corresponded to two different timescales. Using 2000 as the boundary, it was divided into two stages. The first main period was before 2000 and the second was after 2000. After 2000, the construction and operation of Xiaolangdi Reservoir changed the original periodic evolution of the beach transverse slope.
4 Discussion
According to previous studies, the formation and development of the secondary suspended river in the lower Yellow River result from the combined effects of incoming water, sediment, and river boundary conditions. The impact of human activities has also promoted development of secondary suspended rivers. This study focused on quantitative research on the various factors that affect development of secondary suspended rivers and explored the evolutionary characteristics of secondary suspended river development under the influence of various factors.
4.1 Annual water and sediment impact on secondary suspended rivers
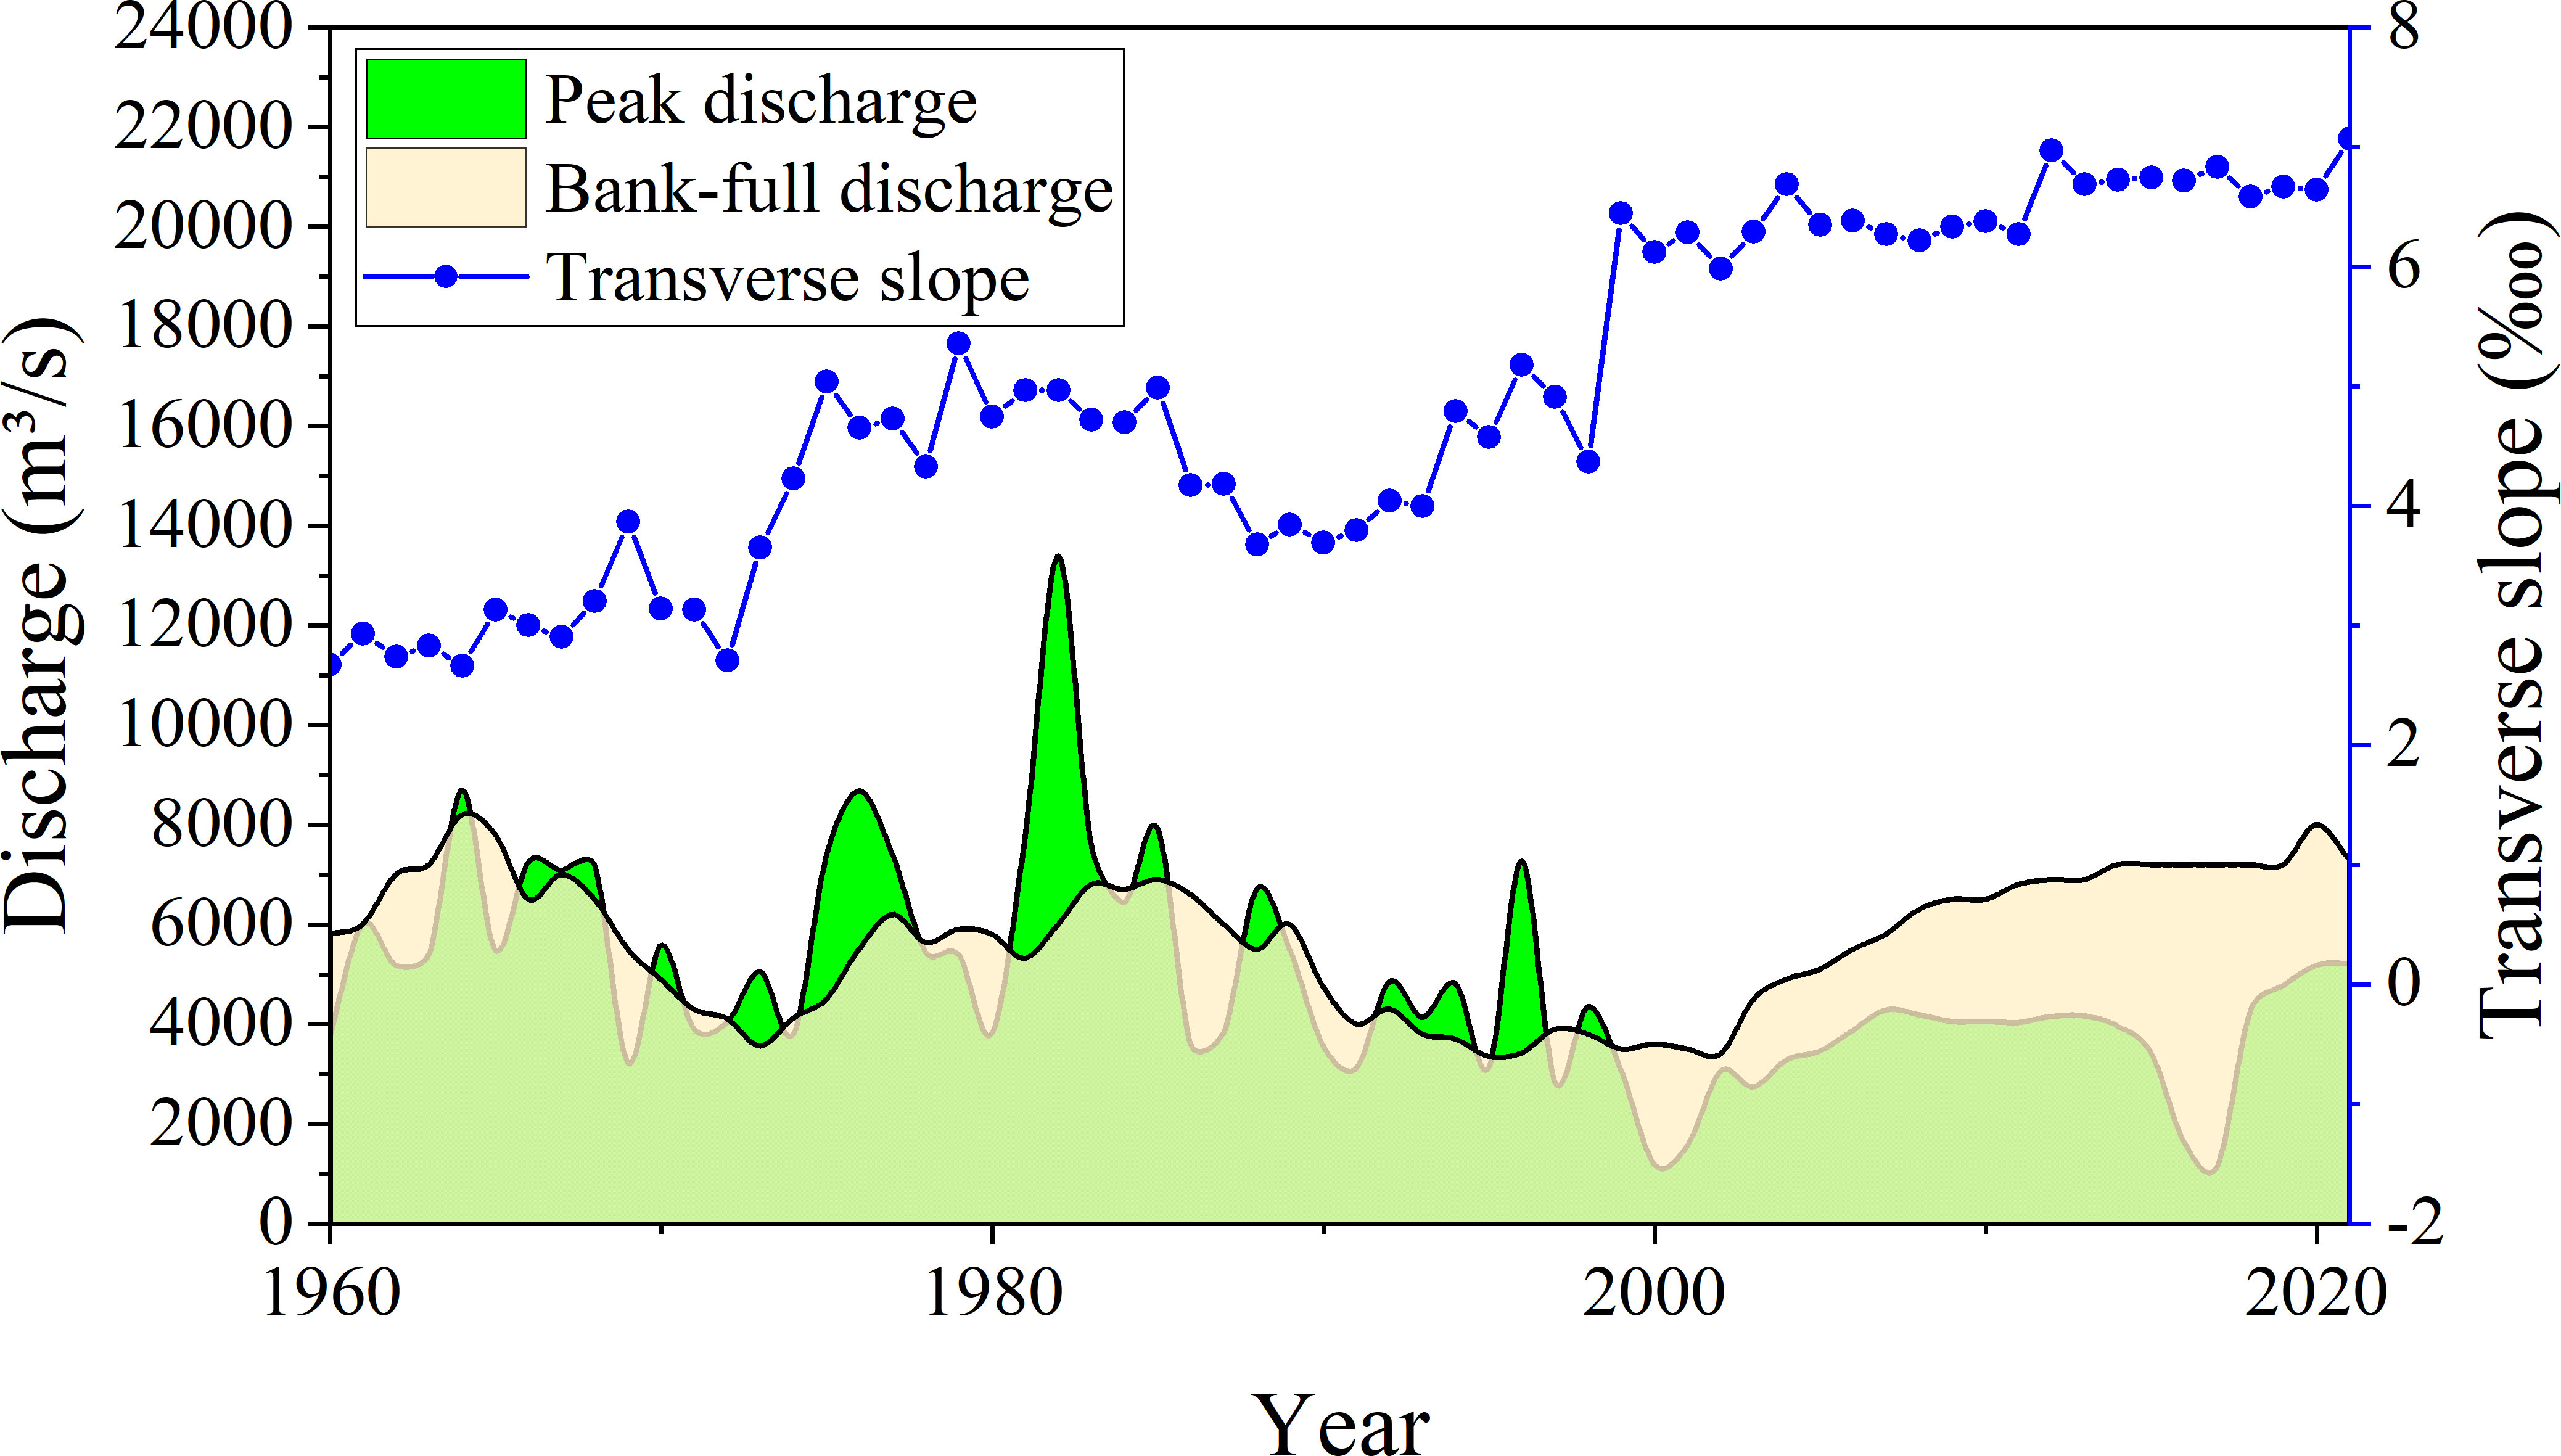
Figure 9 shows the impacts of annual runoff, annual sediment transport, incoming sediment coefficient, and bank-full discharge on the transverse slope at Huayuankou station in the lower Yellow River from 1960–2021. From a long-term perspective, annual runoff and sediment transport in the lower Yellow River decreased; whereas, the transverse slope showed an overall increasing trend (Figures 9A, B). Specifically, the overall trends of annual runoff and sediment transport at Huayuankou station gradually decreased from 1960–2000. Although overall annual runoff was relatively low after 2000, there was a steady increasing trend. The overall change in annual sediment transport was not significant, with an increase over the past 5 years (2017–2021). The incoming sediment coefficient at Huayuankou station (Figure 9C) fluctuated between 0–0.06 kg·s/m6 before 2000, with an average of 0.024 kg·s/m6. After 2000, the incoming sediment coefficients fluctuated between 0–0.01 kg·s/m6 overall, with an average of 0.005 kg·s/m6. Changes in annual runoff and sediment transport in the lower Yellow River only reflected the overall impact on the transverse slope. Before 2000, the high sediment coefficient and repeated fluctuations significantly impacted the morphology of river sections, resulting in an overall increase in the transverse slope. After 2000, no floodplain flood shaped the previously formed floodplain; the transverse slope was still relatively large, and the threat of secondary suspended rivers remained. However, the overall incoming sediment coefficient was relatively small, and the riverbed had a certain degree of erosion, resulting in a clear trend of stability and slowing down development of secondary suspended rivers.
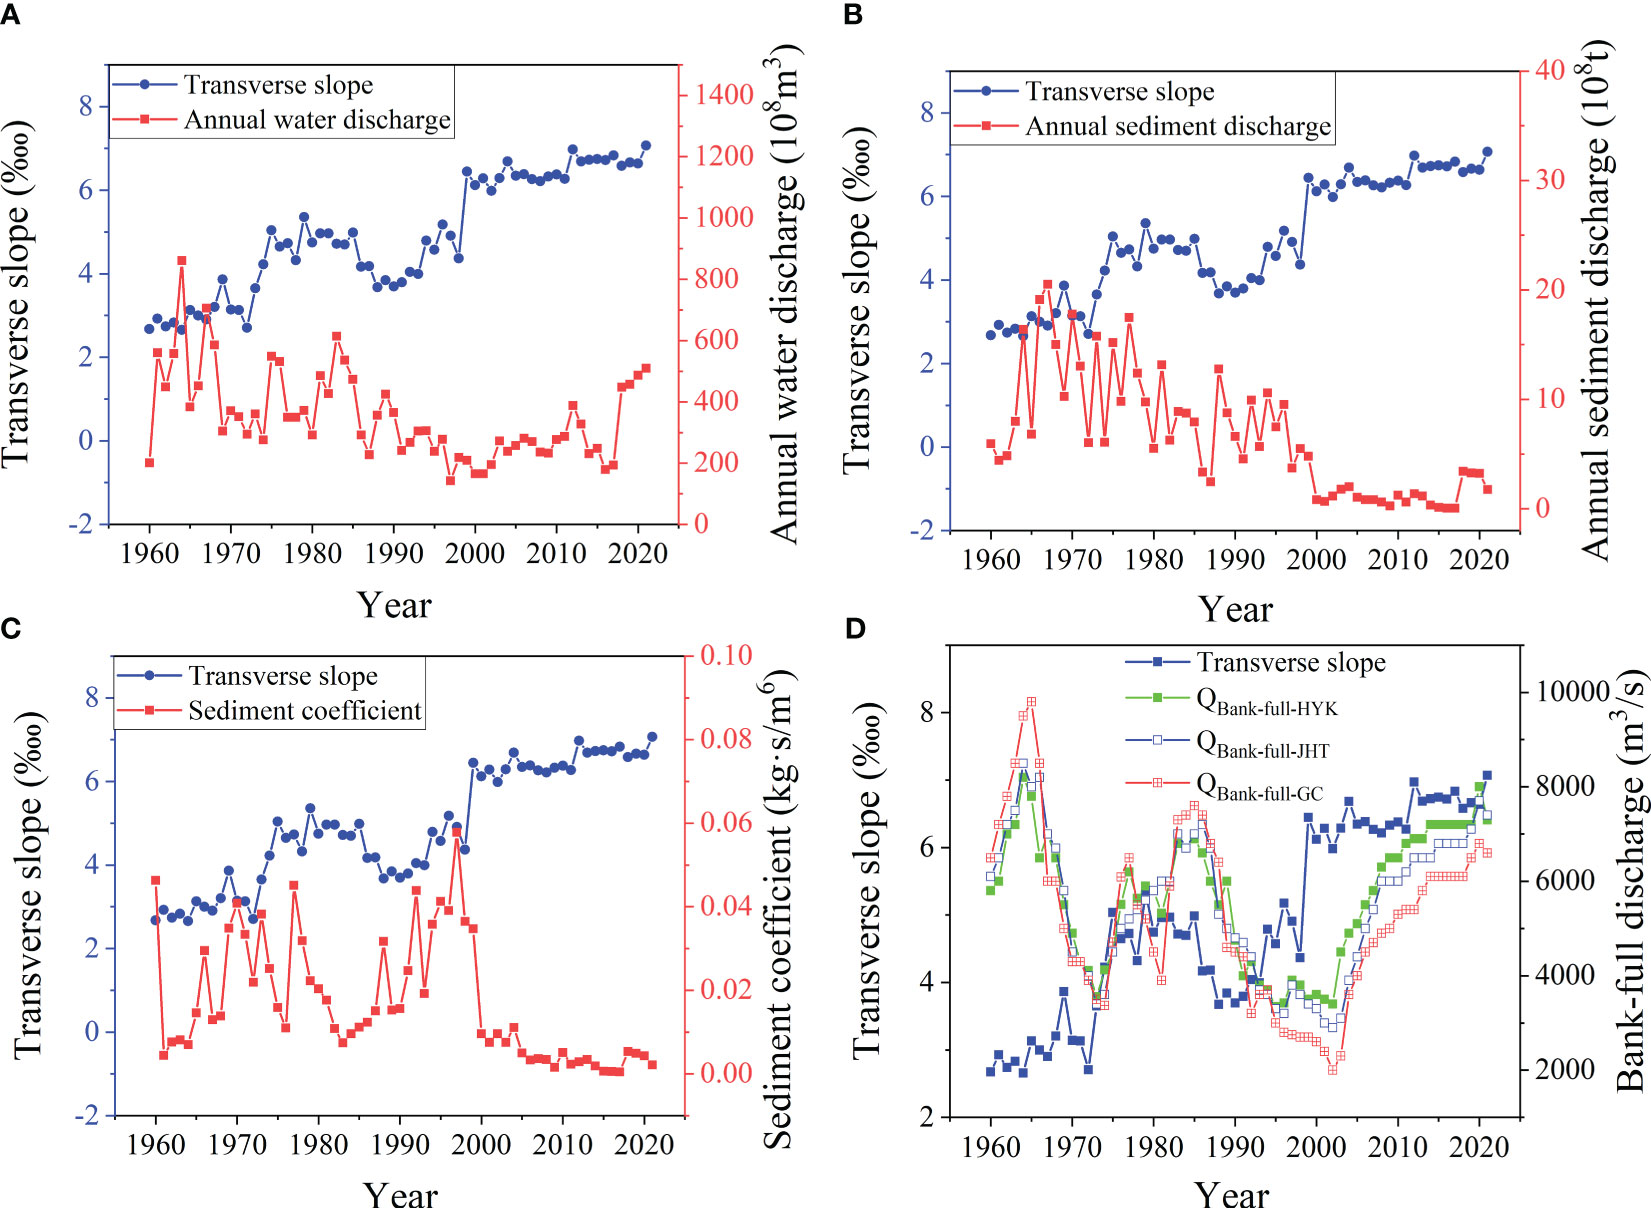
Figure 9 Incoming water and sediment from Huayuankou station in the lower Yellow River (1960–2021): (A) annual water volume; (B) annual sediment volume; (C) incoming sediment coefficient; (D) bank-full discharge.
When the incoming sediment coefficient was large, it caused sedimentation and shrinkage of the main channel, resulting in a decrease in the bank-full discharge and an increase in the probability of water flooding. On one hand, the lateral sedimentation of floodplain sediment was mainly distributed near the beach lip; on the other hand, river regulations and production levees limited floodplain floods to a certain range, exacerbating the sedimentation of the beach lip. Figure 9D shows the relationship between the transverse slope and full bank discharge. Overall, the transverse slope also increased with a decrease in bank-full discharge, particularly at the two turning points. One of these turning points was around 1972, during the early stage of the rapid development of the transverse slope, when the bank-full discharge decreased to its minimum value. The other was around 1999, when the transverse slope tended to a higher value and the bank-full discharge decreased to its historically minimum value.
Figure 5 shows that development of the secondary suspended river was divided into four stages. Table 2 shows the relationship between the average annual runoff, average annual sediment transport, average annual incoming sediment coefficient, and the development trend k value of the secondary suspended river in these four stages at Huayuankou station in the lower Yellow River. From 1960–1973, the average annual sediment coefficient was relatively high, at 0.0224 kg·s/m6. This is because from September, 1960 to March, 1962, Sanmenxia Reservoir was used for water storage and sediment retention, resulting in severe sedimentation in the reservoir. From March, 1962 to October, 1973, Sanmenxia Reservoir was used for flood detention and sediment discharge, resulting in a high incoming sediment coefficient and serious sedimentation in the downstream channel, causing the rapid development of secondary suspended rivers. From November, 1974 to 1985, Sanmenxia Reservoir implemented a storage and sediment discharge operation method of non-flood season water storage and sediment retention, and flood season flood and sediment discharges. Although the flood season was still silted, the rate of increase in the transverse slope slowed, and the secondary suspended river developed slowly. From 1986–1999, under the influence of the completion of and joint regulation with Longyangxia Reservoir, development and utilization of water resources of the Yellow River, comprehensive management of the middle and upper reaches, and low precipitation, the inflow of water and sediment in the lower reaches underwent tremendous changes. The water inflow in the flood season decreased and that in the non-flood season increased, the peak flow decreased, the dry water duration lengthened, and the sediment-carrying capacity of the water flow decreased, leading to a sharp decrease in the size of the main channel and a reduction in the bank-full discharge. The transverse slope was rapidly increasing, and development of secondary suspended rivers was accelerating. From 2000–2021, after completion and commencement of operation of Xiaolangdi Reservoir, the amount of water and sediment entering the lower Yellow River was effectively controlled. Through water and sediment regulations, the main channel was scoured and cut down and the bank-full discharge gradually increased. The water flow did not flood the beach, and the rapid upward trend of the transverse slope was restrained and became relatively gentle. However, the transverse slope remains large, and the secondary suspended river situation remains severe.

Table 2 Relationship between water and sediment and the development trend of secondary suspended rivers in the lower Yellow River.
Notably, after 2000, the water flow in the lower Yellow River did not flood the floodplain. In this case, the driving force for the change in the transverse slope mainly came from changes in the shape of the river section, such as the widening of the main channel, which led to changes in the beach lip elevation (decreasing) and beach width (narrowing). Changes in river section shape are generally caused by an abnormal river regime and bank collapse; however, this situation accounts for a very small proportion of the entire lower Yellow River. At the time of the present study, the overall river section morphology in the lower Yellow River was relatively stable; therefore, development of secondary suspended rivers caused by changes in the morphology of river sections was relatively rare. Therefore, we did not focus on this issue.
4.2 Impact of floodplain floods on secondary suspended rivers
The bed formation pattern of the floodplain floods differed from that of the non-floodplain floods. After flooding, the cross section suddenly increased, the average velocity of the cross section decreased, the sediment-carrying capacity of the water flow decreased, and a large amount of sediment was deposited, forming new beach lips at the beach edge and increasing the transverse slope of the beach. Figure 10 shows the relationship between flood peak discharge, bank-full discharge, and beach transverse slope of Huayuankou station floodplain in the lower Yellow River from 1960–2021. From 1973–1985, the floodplain frequency during this period was relatively high (up to 61%) and the sediment coefficient was relatively small (Table 3), the transverse slope was in a slow development stage. From 1986–1999, the frequency of floodplains was also high (up to 43%), moreover, the terrain was affected by the previous floodplain floods, the transverse slope decreases first during this period. Subsequently, due to the occurrence of two Hyper-concentrated floods in 1992 and 1994, the river siltation was severe, and the bank-full discharge continued to decrease, resulting in rapid development of the transverse slope. The shapes of the river channels were completely different because of the different sediment concentrations in the floodplain floods. For floodplain floods with a high sediment content, after the floodplain, the cross-section increased and the average flow velocity decreased, resulting in a decrease in the sediment-carrying capacity of the water flow. A large amount of sediment accumulated in the river channel and beach lip, resulting in a decrease in the bank-full discharge and an increase in the transverse slope of the beach, which promoted development of secondary suspended rivers.
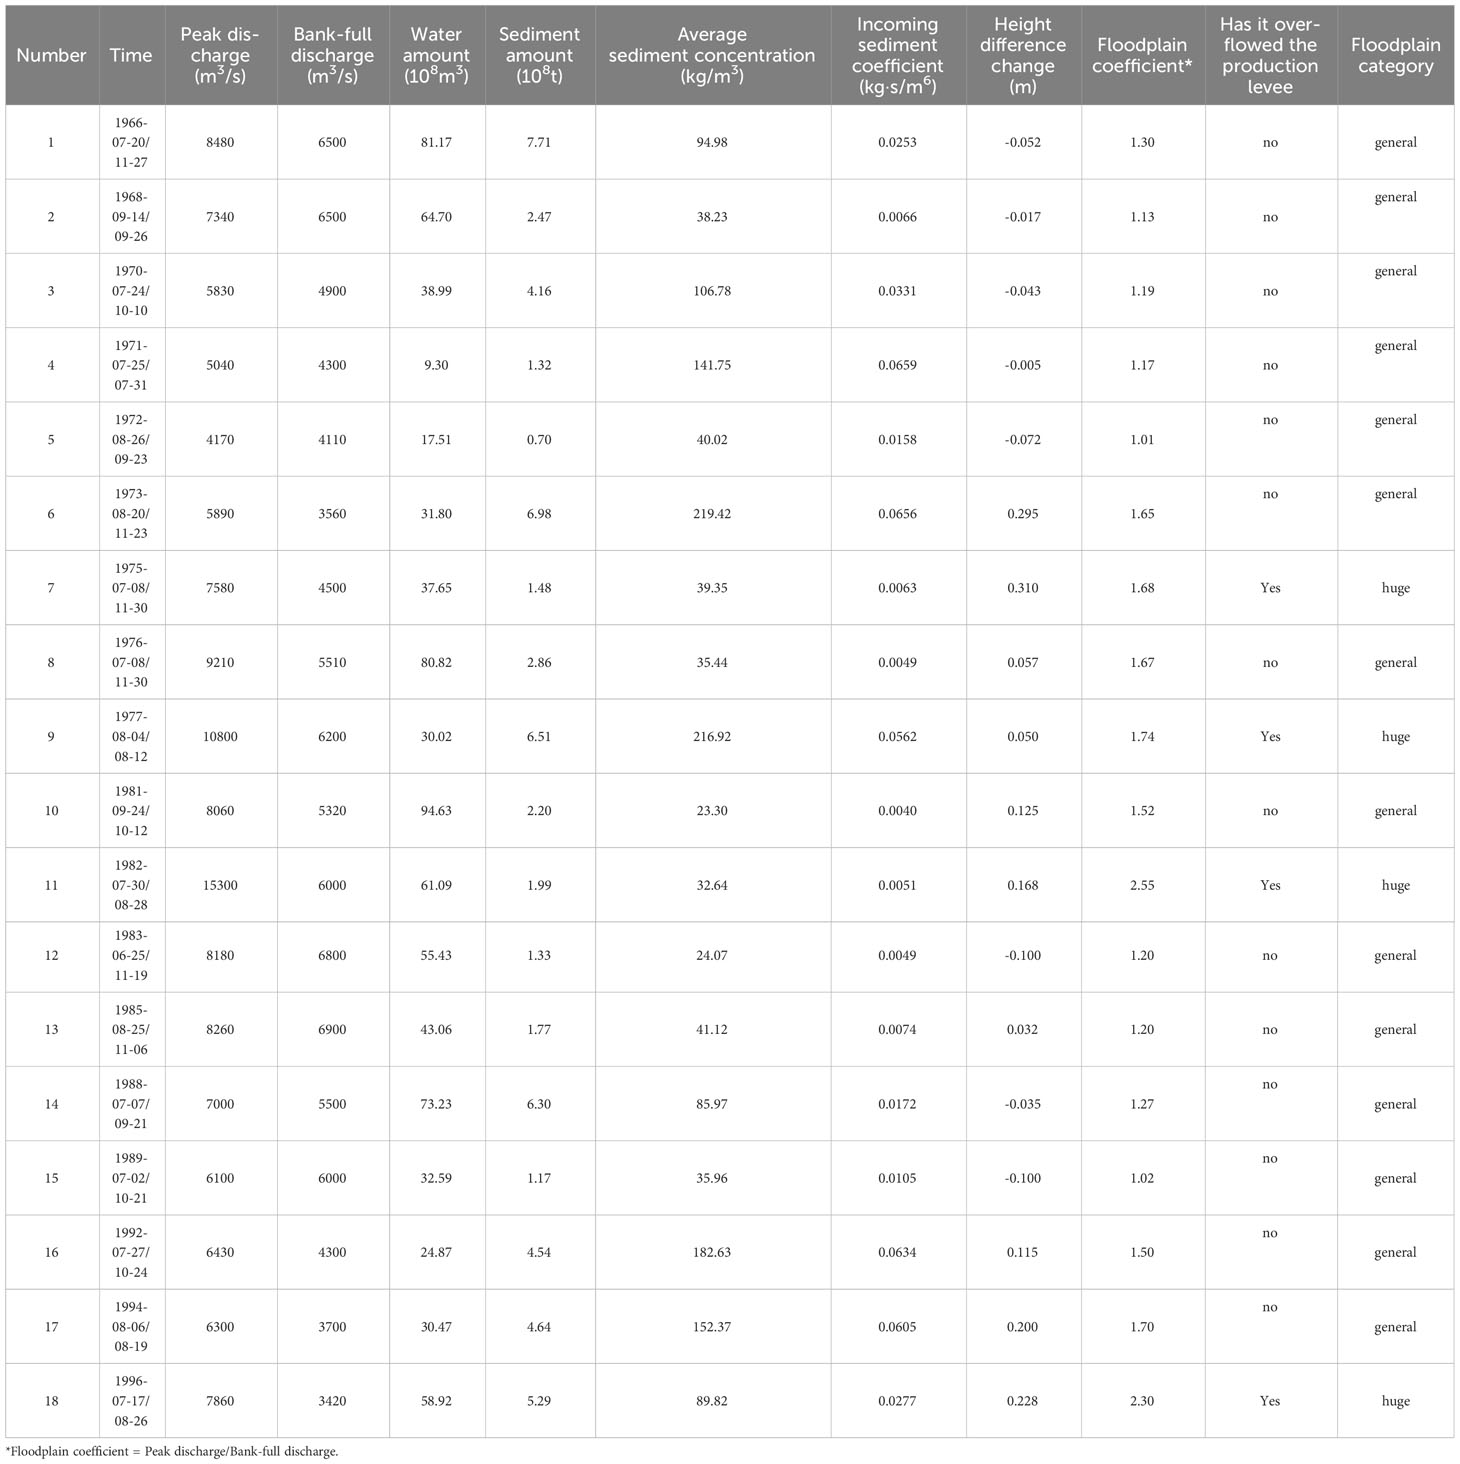
Table 3 presents the flood situation in the floodplain from 1960–2021 and shows the characteristic values of floodplain floods in different years, such as peak flow, water volume, sediment volume, and bank-full discharge. The average sediment concentration, sediment inflow coefficient, floodplain coefficient, and height difference changes of each floodplain flood were calculated. The floodplain flood category was determined based on whether the production levees overflowed and was combined with the floodplain coefficient. The floodplain coefficient was calculated as the ratio of the peak discharge to the bank-full discharge of the current year, which represented the degree of floodplain in this flood (Hu and Zhang, 2015; Shen et al., 2017). The height difference refers to the difference between the elevation of the beach lip and the levee root, and the change in height difference refers to the difference between the height of the previous year that of the current year. If the change in height difference was positive, it indicated that the current secondary suspended river had developed. A negative change in height difference indicated that the current secondary suspended river had eased. When the floodplain coefficient was >1.5 (Zhang et al., 2016) and the floodplain flood overflowed the production levee, it was determined that the flood was a large floodplain flood; otherwise, it was a general floodplain flood (Table 3).
Figure 11 shows the relationship between floodplain floods and changes in the elevation difference of the secondary suspended rivers. When incoming sediment coefficient (ζ) was >0.04, the changes in elevation difference were basically positive, and the suspension difference of the secondary suspended river increased. When ζ < 0.04, the changes in elevation difference were basically negative (Figure 11A) and the difference in height of the secondary suspended river decreased. However, there are situations in which the elevation difference increased within the sediment coefficient range. Floodplain floods with ζ < 0.04 were selected, and a relationship was established between the elevation difference and the floodplain coefficient to analyze the factors affecting the elevation difference (Figure 11B). As the degree of the floodplain increased, the elevation difference changed from negative to positive and gradually increased. When the change in the elevation difference was zero, the floodplain coefficient was approximately 1.29; i.e., when the flood coefficient of the floodplain was <1.29 and the sediment coefficient was <0.04, the suspension difference of the secondary suspended river was negative, and the secondary suspended river situation could be alleviated to some extent.
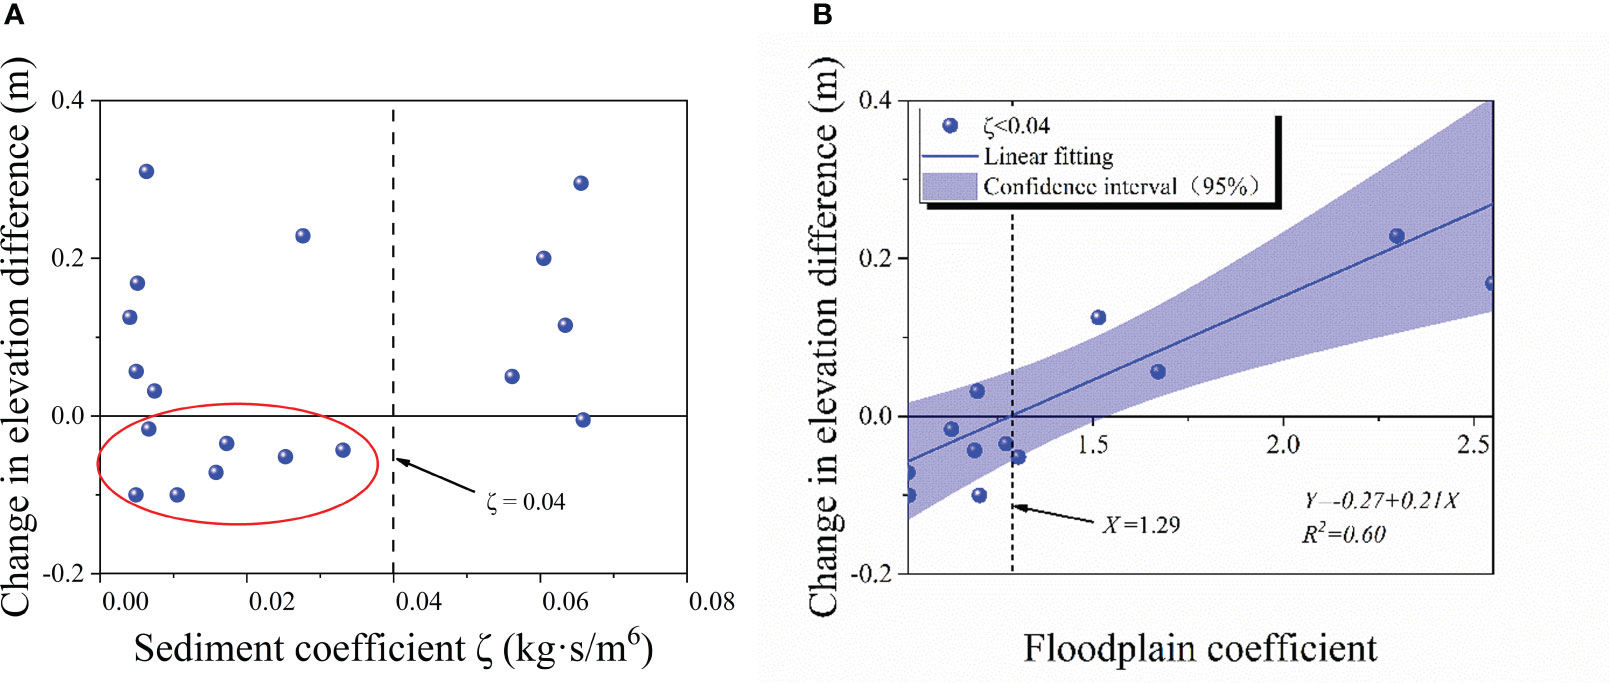
Figure 11 Relationship between characteristic values of floodplain floods and changes in elevation difference. Relationships between (A) sediment coefficient and changes in elevation difference and (B) floodplain coefficients and changes in elevation differences (ζ < 0.4).
Figure 12 shows the shaping effect of different floodplain floods on the river cross-section, and the impact on the development of secondary suspended rivers was analyzed. Figures 12A, B show the changes in erosion and sedimentation of the Youfangzhai section in 1989 and Mazhai section in 1970, respectively, before and after the flood season. The sediment coefficient and floodplain degree of the 1989 flood were relatively low, and changes in erosion and sedimentation mainly occurred within the production levee. After the flood, the main channel was scoured and the left-bank beach lip elevation decreased. The elevation of the left bank levee root remained unchanged, and the height difference between the beach lip and levee root decreased. Although the 1970 flood did not overflow the production levee, the sediment coefficient was higher than that in in 1989, and the bank-full discharge in the river channel was lower than that in 1989. The degree of flooding increased, causing the river to be in a silted state with the beach lip raised and the elevation difference increased. Figures 12A, B show the general floodplain floods, in which it can be seen that general floodplain floods may have promoted (1970 floodplain floods) or slowed (1989 floodplain floods) the development of secondary suspended rivers, which mainly related to the incoming sediment coefficient.
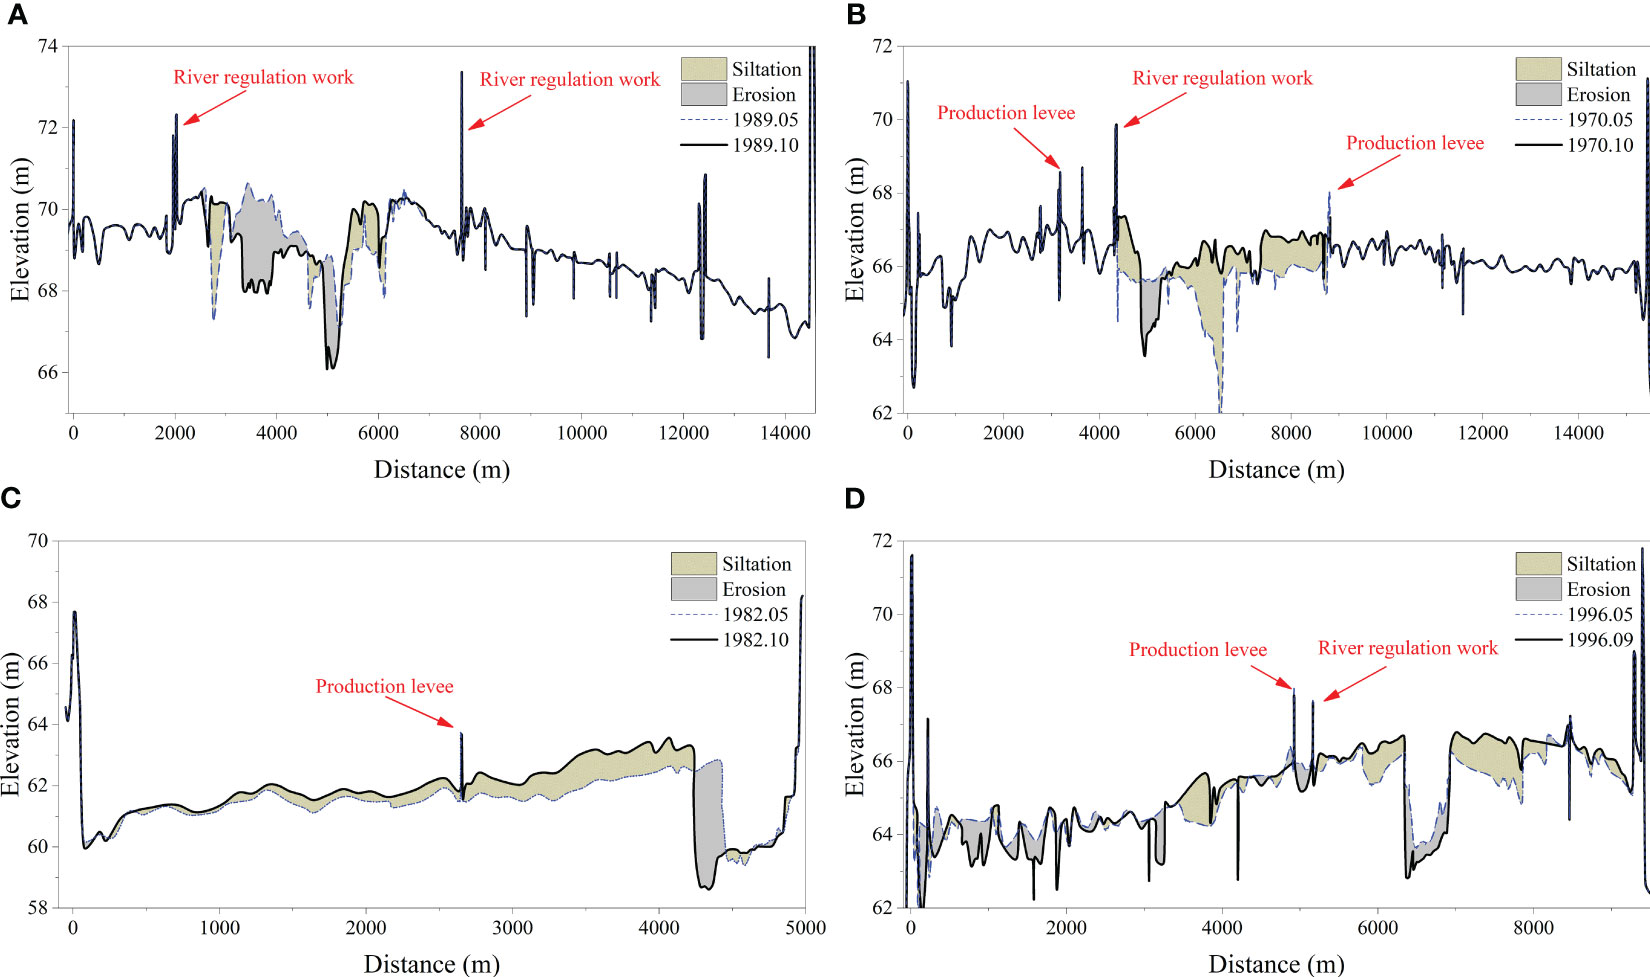
Figure 12 Cross-section changes in erosion and sedimentation in a typical flood year: (A) Youfangzhai station (1989); (B) Mazhai station (1970); (C) Gaocun station (1982); (D) Yangxiaozhai station (1996).
Figures 12C, D show the cross-sectional erosion and sedimentation changes in the Gaocun section in 1982 and Yangxiaozhai section in 1996 before and after the flood season. The floods in 1982 and 1996 were both large floodplain floods, and the main channel eroded to a certain extent. The floodplain overflowed the production levee and silted up along the beach; however, lateral siltation gradually decreased to the outside, and erosion occurred near the levee root, leading to a further increase in the height difference. The causes of the flooding in 1982 and 1996 differed. In 1982, the peak discharge of Huayuankou station reached 15300 m³/s, the bank-full discharge was 6000 m³/s, and the sediment coefficient was 0.0051, which was a typical case of high water and low sediment flow. In 1996, the peak discharge of Huayuankou station reached 7860 m³/s, and its main channel was affected by previous sedimentation and shrinkage, resulting in bank-full discharge of only 3420 m³/s. The sediment coefficient was as high as 0.0277, causing all floodplains in the lower Yellow River. This showed that floods in the floodplain were beneficial for erosion of the river channel, which had a positive effect on shaping the subsequent form of the river channel. This could improve the sediment transport capacity of the river channel, increase the bank-full discharge, and slow the development of the secondary suspended river to some extent.
4.3 Impact of human activities on secondary suspended rivers
Human activities have changed the boundary conditions of the riverbed, and their impact on the secondary suspended river was the same as that of the riverbed boundary conditions. Human activities mainly include construction of river regulation works and production levees. Since the 1960s, the construction and gradual improvement of river regulations in the lower Yellow River have played a dual role in controlling the river regime and protecting levees. River regulations have controlled the river regime in the curved section of the lower Yellow River. The transitional section is basically controlled, and the majority of the wandering section is controlled. The relatively stable main channel is an excellent container for sediment deposition. Once the main channel accumulates, a secondary suspended river develops in it. However, the river regulations are mainly used to control water flow, stabilize river regimes, and protect levees. Moreover, after water and sediment regulation in Xiaolangdi Reservoir, the downstream river channel underwent a certain degree of erosion, and the effect of river regulation on stabilizing the river regime became increasingly obvious without directly affecting development of secondary suspended rivers.
The production levees in the lower Yellow River were built based on the historical Minnian (People spontaneously build earth embankments to protect farmland and villages for blocking water). Historically, people living on beaches spontaneously built Minnian to defend themselves against certain levels of flooding. Due to war and floods, Minnian has dilapidated and can no longer function effectively. Since the people’s governance of the Yellow River in 1946, Minnian has been repaired and production levees have been added to the building. By the 1970s, production levees had already reached a certain scale; therefore, the overall effect of floodplain floods after the 1970s continued to be affected by production levees.
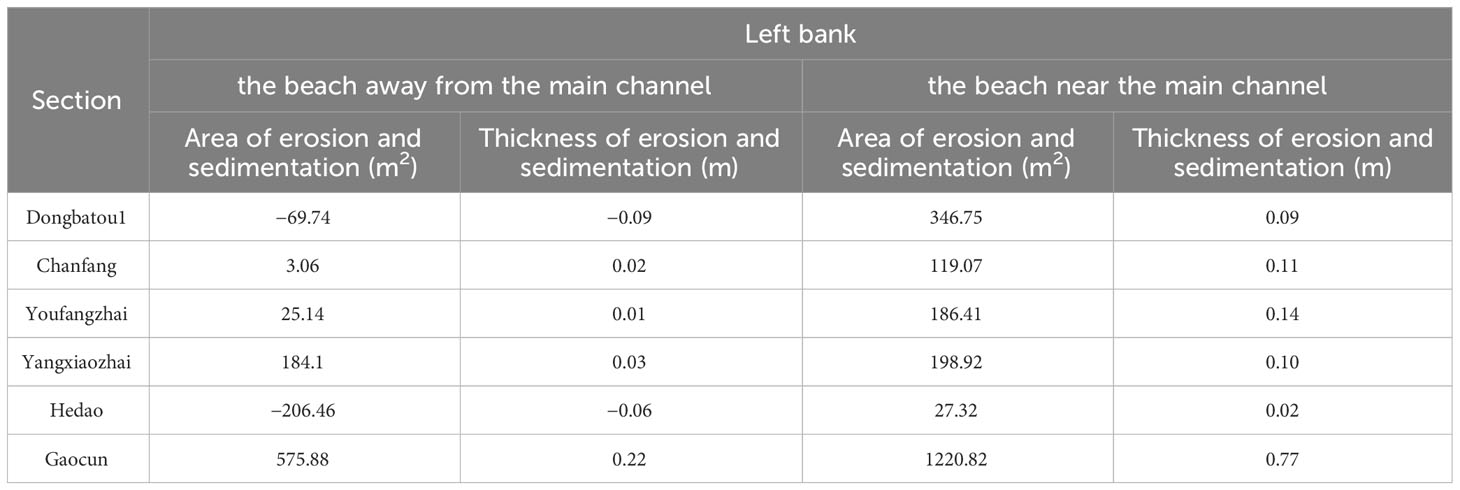
After construction of the production levee in the Dongbatou–Gaocun section, the flood width of the general floodplain has been reduced from >10.5 km to 4.2 km (Jiang et al., 2019). Generally, it is difficult for floodplain floods to cross production levees, resulting in changes in river erosion and siltation occurring only in the middle of the production levees on both banks. Although large floodplains can cross production levees, and beaches outside the production levees also exchange water and sediment, production levees limit the lateral distribution of sediment deposition. Figure 12 shows that there was a significant difference in the amount of erosion and sedimentation on both sides of the production levee, and that the sedimentation depth on the side near the main channel was significantly greater than that on the side far from the main channel. Table 4 shows the erosion and sedimentation conditions of the erosion and sedimentation situation near the main channel and far from the main channel at each section of the Dongbatou–Gaocun section under the action of flooding in 1982 (taking the left bank as an example). It is evident from Table 4 that owing to the production levees, the amount of sedimentation on the beach near the main channel was significantly greater than that on the beach far from the main channel.
These results showed that although production levees can block the inundation loss of local beach areas caused by floodplain floods, they seriously hinder normal water and sediment exchange in the beach channel, which causes most of the sediment in the flood not to overflow the production levees to settle at the beach lip. However, because of the inability of the flood to reach the root of the levee, there was no sediment deposition, which caused the beach lip to increase and the levee root to decrease, accelerating development of the secondary suspended river.
5 Conclusions
Considering the Dongbatou–Gaocun section as the research object, the evolution process of the secondary suspended river on the left-bank beach from 1960–2021 was analyzed. The trend and periodicity of the transverse slope change on the left-bank beach were studied, and the evolution law of the secondary suspended river in the wandering river channels was explored. Factors influencing the development of secondary suspended rivers were quantitatively analyzed. The main conclusions are as follows.
(1) The evolution process of the transverse slope from 1960–2021 can be divided into five stages: ① The period from 1960–1973 belongs to the initial formation period of secondary suspended rivers, with a transverse slope trend of k = 0.03; ② the period from 1974–1986 belongs to the slow development period of secondary suspended rivers, with a transverse slope trend of k = 0.04; ③ the period from 1987–1999 belongs to the rapid development of secondary suspended rivers, with a transverse slope trend of k = 0.18; ④ the period from 2000–2021 belongs to the stable period of secondary suspended rivers, with a transverse slope trend of k = 0.03.
The first three periods were before commencement of operation of Xiaolangdi Reservoir and the fourth period was after operation commenced. This showed that in the early stages of operation of Xiaolangdi Reservoir, a secondary suspended river developed to a very serious extent. Through water and sediment regulation in Xiaolangdi Reservoir, the sedimentation of the downstream river channel was reduced, which effectively alleviated the development trend of the secondary suspended river.
(2) The evolution period of the transverse slope on the beach differed significantly before and after commencement of operation of Xiaolangdi Reservoir. Prior to commencement of operation of Xiaolangdi Reservoir in 2000, incoming water and sediment from the lower Yellow River were mainly affected by Sanmenxia Reservoir. The transverse slope of the beach had a primary period of 31 years (period of 20 years). After commencement of operation of Xiaolangdi Reservoir, owing to its influence on water and sediment regulation, the overall downstream river channel continued to erode, the transverse slope of the beach changed, and there was a second main period of 21 years (period of 13–14 years).
(3) Incoming water and sediment affected development of secondary suspended rivers. When the incoming sediment coefficient of floodplain flood (ζ) was >0.04 or <0.04 and floodplain coefficient was >1.29, the change in height difference of the secondary suspended river increased, and the secondary suspended river intensified. When ζ < 0.04 and the floodplain coefficient was <1.29, the change in height difference of the secondary suspended river decreased, and the secondary suspended river was alleviated. The production levee blocked the water and sediment exchange between the general floodplain flood and the floodplain outside the production levee, which affected the lateral sedimentation distribution of sediment in a large floodplain flood and promoted development of secondary suspended rivers.
Data availability statement
The original contributions presented in the study are included in the article/supplementary material. Further inquiries can be directed to the corresponding author.
Author contributions
LX: Conceptualization, Funding acquisition, Methodology, Writing – original draft. JL: Conceptualization, Methodology, Project administration, Writing – original draft, Writing – review & editing. HX: Formal analysis, Methodology, Writing – original draft. XPZ: Methodology, Validation, Writing – original draft. RL: Validation, Visualization, Writing – original draft. XZ: Methodology, Writing – original draft. XG: Investigation, Resources, Writing – original draft.
Funding
The author(s) declare financial support was received for the research, authorship, and/or publication of this article. This research was financially supported by the National Natural Science Foundation of China (No. 42041006, U2243219), the Major Science and Technology Project of Henan Province (No. 231100320100), the Excellent Youth Foundation of He’nan Scientific Committee (No. 222300420013), the Significant Science and Technology Project of the Ministry of Water Resources (No. SKS-2022011), the Excellent Young Talents Project of the Yellow River Conservancy Commission (No. HQK-202309), the Water Conservancy Cadres Education and Talent Cultivation (No. 102126222015800019041).
Conflict of interest
The authors declare that the research was conducted in the absence of any commercial or financial relationships that could be construed as a potential conflict of interest.
Publisher’s note
All claims expressed in this article are solely those of the authors and do not necessarily represent those of their affiliated organizations, or those of the publisher, the editors and the reviewers. Any product that may be evaluated in this article, or claim that may be made by its manufacturer, is not guaranteed or endorsed by the publisher.
References
Duanmu L., Zhang S. (2003). Forming, Present Condition and Control measures of secondary rivers of the Yellow River in Henan province. China Water. 12), 58–59. doi: 10.3969/j.issn.1000-1123.2003.12.025
Gao J., Hu C., Chen X. (2004). A preliminary study on alteration of watercourse and improvement of the “secondary perched river” in the lower Yellow River. J. China Institute Water Resour. Hydropower Res. 01), 12–22. doi: 10.13244/j.cnki.jiwhr.2004.01.002
Hu Y., Zhang X. (2006). Brief discussion on the secondary perched river. J. Sediment Res. 5), 1–9. doi: 10.16239/j.cnki.0468-155x.2006.05.001
Hu C., Zhang Z. (2015). The research of mechanism of constructing riverbed and index of flow and sediment of floodwater in the Lower Yellow River. Scientia Sinica(Technologica). 45 (10), 1043–1051. doi: 10.1360/N092015-00012
Jiang E., Cao Y., Zhang Q. (2003). “Causes and control measures of the “Secondary suspended river,” in Lower yellow river (Zhengzhou: The Yellow River Water Conservancy Press), 334–349.
Jiang E., Cao Y., Zhang L., Zhao, Zhang Q. (2006). Study on the evolution law and mechanism of river regime in the wandering reach of the lower yellow river (Beijing: China Water & Power Press).
Jiang E., Li J., Chen J., Wang Y., Cao Y. (2019). Research on the function of flood detention and sedimentation in the wide beach area of the lower yellow river and the disaster reduction technology in the beach area (Beijing: China Water & Power Press).
Jiang E., Zhang H., Zhao L., Zhang L. (1999). Study of bed building law of hyper-concentrated flood and river facies relation. Yellow River. 21 (1), 14–16.
Kong D., Miao C., Duan Q., Li J., Zheng H., Gou J. (2022). Xiaolangdi Dam: A valve for streamflow extremes on the lower Yellow River. J. Hydrology. 606, 127426. doi: 10.1016/j.jhydrol.2022.127426
Liao Y. (2003). Causes and control measures of the “Secondary suspended river” in the lower yellow river (Zhengzhou: The Yellow River Water Conservancy Press).
Liu X. (2020). The water and sediment situation and countermeasure. Yellow River. 42 (09), 34–40. doi: 10.3969/j.issn.1000-1379.2020.09.007
Liu Z., Qiu H., Zhu Y., Liu Y., Yang D., Ma S., et al. (2022). Efficient identification and monitoring of landslides by time-series inSAR combining single- and multi-look phases. Remote Sensing. 14, 1026. doi: 10.3390/rs14041026
Ma S., Qiu H., Zhu Y., Yang D., Tang B., Wang D., et al. (2023). Topographic Changes, Surface Deformation and Movement Process before, during and after a Rotational Landslide. Remote Sensing. 15, 662. doi: 10.3390/rs15030662
Pang J. (2005). Pondering over issues of a general plan of the lower yellow river harnessing. Yellow River. 27 (1), 3–4. doi: 10.3969/j.issn.1000-1379.2005.01.002
Pei Y., Qiu H., Zhu Y., Wang J., Yang D., Tang B., et al. (2023). Elevation dependence of landslide activity induced by climate change in the eastern Pamirs. Landslides. 20, 1115–1133. doi: 10.1007/s10346-023-02030-w
Qiu H., Zhu Y., Zhou W., Sun H., He J., Liu Z. (2022). Influence of DEM resolution on landslide simulation performance based on the Scoops3D model, Geomatics. Natural Hazards Risk 13 (1), 1663–1681. doi: 10.1080/19475705.2022.2097451
Sang Y., Wang Z., Liu C. (2013). Applications of wavelet analysis to hydrology: Status and prospects. Prog. Geography. 32 (09), 1413–1422. doi: 10.11820/dlkxjz.2013.09.011
Shan L., Wang F. (2021). Some scientific issues in the cooperative management of the yellow river basin. Yellow River. 43 (10), 7–10. doi: 10.3969/j.issn.1000-1379.2021.10.002
Shen G., Zhang Y., Zhang M. (2017). Definition of channel and floodplain and spatio-temporal sedimentation characteristics for overbank hyper-concentrated flood in the lower Yellow River. Adv. Water Science. 28 (05), 641–651. doi: 10.14042/j.cnki.32.1309.2017.05.001
Sun D., Liu X., Xue H., Wang P., Liao X. (2008). Numerical simulation of fluvial process in the Lower Yellow River with “secondary perched river. J. Hydroelectric Engineering. 27 (06), 136–141.
Sun L., Luo J. (2008). Research of point-symmetric boundary extension in wavelet transform. J. Comput. Applications. 28 (2), 443–445, 468. doi: 10.3724/SP.J.1087.2008.00443
Wang L., Qiu H., Zhou W., Zhu Y., Liu Z., Ma S., et al. (2022). The post-failure spatiotemporal deformation of certain translational landslides may follow the pre-failure pattern. Remote Sensing. 14, 2333. doi: 10.3390/rs14102333
Wang H., Ye L., Liu M., Liu L. (2006). Problems and improvement methods in wavelet periodic analysis of hydrological sequences. Prog. Natural Science. 16 (8), 1002–1008. doi: 10.3321/j.issn:1002-008X.2006.08.013
Yan Y., Zhang H., Fu B. (2006). “Discussion on the causes and control measures of the “Secondary suspended river,” in Lower yellow river, vol. 02). (Yellow River: China Flood & Drought Management), 57–59.
Yang J., Xu J., Liao J. (2006). The process of secondary suspended channel in the lower yellow river under different conditions of runoff and sediment load. Acta Geographica Sinica. 01), 66–76. doi: 10.3321/j.issn:0375-5444.2006.01.007
YRCC (2013). Comprehensive planning of the yellow river basin: 2012-2030 (Zhengzhou: The Yellow River Water Conservancy Press).
Zhang R. (2004). Suggestions on a general plan for lower yellow river management. Yellow River. 05), 1-2, 46. doi: 10.3969/j.issn.1000-1379.2004.05.001
Zhang M., Huang H., Zhang X. (2016). A study of the characteristics of sedimentation in the Lower Yellow River during overbank floods. Adv. Water Science. 27 (02), 165–175. doi: 10.14042/j.cnki.32.1309.2016.02.001
Zhang J., Liu Y., Li C. (2018). Discussion on effect of ecological security barrier of the lower yellow river. Yellow River. 40 (02), 21–24. doi: 10.3969/j.issn.1000-1379.2018.02.005
Keywords: secondary suspended rivers, evolution trend, beach transverse slope, wavelet analysis, driver analysis, lower Yellow River, wandering section
Citation: Xu L, Li J, Xu H, Zhang X, Lai R, Zhang X and Gao X (2023) Evolution and drivers of secondary suspended rivers in typical wandering sections of the lower Yellow River from 1960–2021. Front. Ecol. Evol. 11:1330749. doi: 10.3389/fevo.2023.1330749
Received: 31 October 2023; Accepted: 21 November 2023;
Published: 13 December 2023.
Edited by:
Haijun Qiu, Northwest University, ChinaCopyright © 2023 Xu, Li, Xu, Zhang, Lai, Zhang and Gao. This is an open-access article distributed under the terms of the Creative Commons Attribution License (CC BY). The use, distribution or reproduction in other forums is permitted, provided the original author(s) and the copyright owner(s) are credited and that the original publication in this journal is cited, in accordance with accepted academic practice. No use, distribution or reproduction is permitted which does not comply with these terms.
*Correspondence: Junhua Li, bGpoeXltQDEyNi5jb20=
 Linjuan Xu
 Junhua Li1*
