 Deborah Zani
 Heike Lischke
 Veiko Lehsten
- 1Dynamic Macroecology/Land Change Science, Swiss Federal Institute for Forest, Snow and Landscape Research WSL, Birmensdorf, Switzerland
- 2Department of Physical Geography and Ecosystem Science, Lund University, Lund, Sweden
- 3Department of Natural Science, Design, and Sustainable Development, Mid Sweden University, Östersund, Sweden
Introduction: The ability of species to colonize newly suitable habitats under rapid climate change can be constrained by migration processes, resulting in a shift of the leading edge lagging behind the ameliorating climate, i.e. migration lag. The importance and extent of such migration lags during the forest expansion after the Last Glacial Maximum (LGM) are still debated. Similarly, the relative importance of the main drivers of post-glacial vegetation dynamics (temperature, dispersal limitation, and competition) is still discussed in the literature.
Methods: We used the dynamic global vegetation model LPJ-GM 2.0 to reconstruct the range shifts of 16 competing major European tree species after the LGM (18.5 ka BP) until recent times (0 ka BP). We simulated two dispersal modes by allowing free establishment whenever the climatic conditions suited the species (free dispersal), or by accounting for migration processes in the simulated vegetation dynamics (dispersal limitation). We then calculated thermal and range shift velocities, competition at establishment, thermal and dispersal lags for each species and dispersal mode. Finally, we compared our simulated range shift velocities with pollen-derived migration rates.
Results: The simulation assuming limited dispersal resulted in more accurate migration rates as compared to pollen-derived migration rates and spreading patterns. We found no marked migration lags in the post-glacial establishment of pioneer species (Pinus sylvestris and Betula pubescens). Under the free dispersal mode, the remaining temperate species expanded rapidly and almost synchronously across central Europe upon climate warming (Bølling-Allerød interstadial). Differently, the northward spread of temperate species simulated under dispersal limitation happened mainly during the Holocene and in successive waves, with late spreaders (e.g. Fraxinus excelsior) experiencing multi-millennial dispersal lags and higher competition.
Discussion: Our simulation under dispersal constraints suggests that the post-glacial tree expansion in Europe was mainly driven by species-specific thermal requirements and dispersal capacity, which in turn affected the order of taxa establishment and thus the degree of competition. Namely, taxa with less cold-tolerance and relatively low dispersal ability experienced the highest migration lags, whereas the establishment of pioneer species was mostly in equilibrium with the climate.
1 Introduction
Global change has altered biodiversity and caused the spatial redistribution of many species in the last decades, with significant impacts for ecosystem services and human health (Pecl et al., 2017). Specifically, climate warming resulted in a global thermal shift towards the poles and the summits of mountains to previously cooler latitudes and elevations, respectively (Lenoir et al., 2020). The majority of vascular plants in the Northern Hemisphere responded by moving their ranges northwards and upslope following the thermal shift (Lenoir et al., 2020). However, a number of studies have argued that the speed at which plants are able to track their optimal climate (range shift velocity) is overall lower than the rate of climate change (thermal velocity) (Corlett and Westcott, 2013; Jezkova and Wiens, 2016; Lenoir et al., 2020; Román-Palacios and Wiens, 2020). This leads to the possibility that a number of plant taxa may experience substantial migration lags in the future (or is already experiencing them now). Migration lag is defined as the delayed occupancy of a climatically suitable habitat due to the limited dispersal capacity of a species or to other processes impairing plant establishment (e.g. local competition) (Svenning and Sandel, 2013). Overall, a failure to track suitable climate niches in the absence of local adaptation is likely to result in the increasing risk of species extinction and the loss of biodiversity (Román-Palacios and Wiens, 2020). Furthermore, the vegetation-climate disequilibrium driven by migration lag is expected to introduce another source of uncertainty in model predictions under future scenarios, for example in the projections of the terrestrial carbon storage (Neilson et al., 2005).
The study of paleo-vegetation redistribution in response to past climatic fluctuations can be used to gain insights into the drivers of migration lags in range shift dynamics. While we are not expecting exactly the same rates of vegetation change in the future, the ecological mechanisms underlying range shift dynamics in the past will also regulate species’ response to future climate change (Fordham et al., 2020). Therefore, by analyzing the vegetation response to past climatic periods that experienced similar warming rates to forecasted temperature changes across the 21st century we can gain insights into the processes at work and improve our models and hence our ability to predict the effects of future climate change. Fossil-based and general circulation model reconstructions of the climate after the Last Glacial Maximum (LGM; 23–19 ka BP) indicate two periods of rapid warming (~14 ka BP and ~12 ka BP) with thermal rates comparable to RCP 8.5 projections for the future (Renssen and Isarin, 2001; Fordham et al., 2020). Modelling and pollen reconstructions have detected forest expansions across the Northern Hemisphere at similar times (Cao et al., 2019a; Cao et al., 2019b; Dallmeyer et al., 2022; Githumbi et al., 2022). This implies that climatic conditions, and especially temperature, had a major influence in the dynamics of the post-glacial vegetation, thus suggesting that at least some plant species could rapidly track the post-LGM climate change. However, the degree of vegetation-climate equilibrium in the post-glacial forests of the Northern Hemisphere is still debated, with studies finding both fast (Williams et al., 2002; Ordonez and Williams, 2013) and slow (Alsos et al., 2022) responses to post-LGM warming, or even an ongoing disequilibrium for some contemporary tree species distributions (Svenning and Skov, 2004; Normand et al., 2011). Possible drivers of vegetation-climate disequilibrium in the post-glacial forest include competition and dispersal limitation (Birks, 2019). Post-glacial competition refers to the competition for space and resources at occupied sites and for establishment at newly available sites after the retreat of the ice sheet and climate amelioration. In this sense, the temporal lag between the first arrival of a species and the subsequent population buildup and expansion may reflect the degree of local competition, given a stable climate niche (Lang et al., 2023). Along with competition, the dispersal ability of plants by propagules (henceforth seeds) may also constrain the population establishment in new areas if the potential spreading rate is lower than the climate change velocity (i.e. the speed of climate niche formation). Potential species-specific spreading rates are mainly determined by the maturation age for the production of seeds, intrinsic seed traits (e.g. germination rate and survival), and the mechanisms of dispersal (e.g. wind, water or via animals) that in turn define the dispersal distances (Lang et al., 2023).
High-resolution fossil-based reconstructions and dynamic vegetation simulations starting from the LGM can help to clarify whether the post-glacial vegetation was in disequilibrium with climatic conditions, as well as pointing out which plant taxa experienced a migration lag and at which point in time. One approach for such a reconstruction of vegetation is to use process-based models informed and/or validated by paleo-ecological data to disentangle the processes driving range shift dynamics. This can be done by simulating scenarios with different drivers and comparing their outcomes (Fordham et al., 2020).
In the current study, we aim to understand how the post-glacial range shifts of major European tree taxa were affected by three drivers of interglacial vegetation change: temperature, inter-specific plant competition and dispersal limitation. Using the LPJ-GM 2.0 model, we simulated the distribution shift of 16 tree species across ice-free Europe from the end of the LGM to the current time (18–0 ka BP) under two alternative dispersal modes: 1) a constant availability of seeds at all locations (free dispersal), or 2) availability determined by seed dynamics (dispersal limitation). In order to disentangle the effect and magnitude of each driver, we compared 1) thermal and species range shift velocities for both dispersal modes, 2) the year of species arrival between the two dispersal modes (dispersal lag), and 3) the year of species arrival against the minimum temperature year (i.e. the earliest year when the minimum thermal requirement for establishment was satisfied) (thermal lag). Additionally, we calculated the total leaf area index (LAI) of local established tree species at arrival (competition). Finally, we compared the simulated range shift velocities with the migration rates inferred from pollen records to evaluate the performance of the migration module of LPJ-GM 2.0.
2 Methods
2.1 Paleovegetation simulations
LPJ-GM 2.0 (Lehsten et al., 2019; Zani et al., 2022) allows species to migrate simultaneously while interacting with each other by coupling a dynamic migration module to the dynamic global vegetation model LPJ-GUESS 4.0 (where LPJ-GM is short for LPJ-GUESS-MIGRATION). The default version of LPJ-GUESS uses a gap model approach to simulate the population dynamics (establishment, growth and mortality) and physiological and biogeophysical processes of plants (e.g. photosynthesis, evapotranspiration) linked by the fluxes of water, carbon and nitrogen in response to input climate (e.g. temperature, precipitation, short-wave radiation) (Smith et al., 2001; Sitch et al., 2003; Smith et al., 2014). Plant functional types (PFTs) and species are defined by parameters based on growth form, life-history strategy, phenology, physiology, and bioclimatic limits. The population dynamics are simulated on an annual basis in cohorts of interacting species contained within areas experiencing the same climatic conditions (grid cells). Population dynamics and plant distribution are influenced by both species-specific bioclimatic limits for establishment and survival and competition for resources. Competition for light and nutrients is simulated asymmetrically based on canopy height and size of the root system, respectively, whereas competition for water depends on both water availability in the soil and the root fraction in each soil layer (Gerten et al., 2004; Smith et al., 2014). The establishment of species in the default version of LPJ-GUESS depends primarily on the suitability of the environmental conditions as defined by species-specific bioclimatic limits as well as light availability at the forest floor, and assumes that seeds are available at all grid cell patches (corresponding to the free dispersal mode in our simulation). On the other hand, LPJ-GM 2.0 implements a migration module so that plant establishment is directly dependent on seed availability at the patch level (in the dispersal limitation mode), where seed availability is simulated yearly through three processes: (1) seed production, (2) seed dispersal via a dispersal kernel, and (3) seed dynamics in the soil bank (Lehsten et al., 2019; Zani et al., 2022).
We defined our simulation domain in Europe south of the ice sheet covering northern Europe at the start of the Oldest Dryas period (10.75° O – 26° E; 36° N – 54° N) at a resolution of 0.01 degrees and spanning from the end of the Last Glacial Maximum (LGM; 18.5 ka BP) to the present time (0 ka BP). The temporal domain of simulation includes the following chronozones: the Late Holocene (4.25–0 ka BP; LH), the Middle Holocene (8.236–4.25 ka BP; MH), the Early Holocene (11.7–8.236 ka BP; EH), the Younger Dryas (12.9–11.7 ka BP; YD), the Late Glacial Interstadial or Bølling-Allerød interstadial (15.0–12.9 ka BP; BA), and the Oldest Dryas (18.5–15.0 ka BP; OD) (Walker et al., 2012) (see Table S4). The periglacial front was determined by a time-varying 0.5-degree land mask derived from Armstrong et al. (2019) and CRU data, which additionally allowed to simulate a dynamic landscape with inactive (submerged or under ice) or active (with possible vegetation establishment and dynamics) cells. Following the default settings of LPJ-GUESS (Smith et al., 2014), we allowed plants to establish and grow without nitrogen (N) limitation for 100 years (18.5–18.4 ka BP) before killing all plants in order to start plant succession from the bare soil with equilibrated N and carbon (C) pools (initialization period). After the initialization period, we allowed 400 years (18.4–18 ka BP; spin-up phase) of free dispersal during which plant could establish in all grid cells with suitable bioclimatic conditions, thus reflecting the potential distribution of glacial refugia at the end of the LGM. We included stochastic stand-destroying events for natural disturbances (e.g. fire) with a mean return interval of 400 years (Pugh et al., 2019). After the spin-up phase (18–0 ka BP), we simulated two alternative dispersal modes: 1) free dispersal (establishment following LPJ-GUESS) and 2) dispersal limitation (establishment following the migration module of LPJ-GM 2.0).
Our final set of simulated taxa and parameters corresponds to the representative European species selected by Hickler et al. (2012), with the addition of Alnus glutinosa, Acer campestris (Allen et al., 2010) and Larix decidua (Scherstjanoi et al., 2014), resulting in a total of 24 species and PFTs. Global model and species-specific parameters for all simulated taxa are listed in Tables S1, S2, 3, respectively. For further analyses, we used the 50-year averages of simulated leaf area index (LAI) of the tree species (Table 1, column 1). The simulations were run on the Swiss and Swedish supercomputers operated by CSCS and LUNARC.
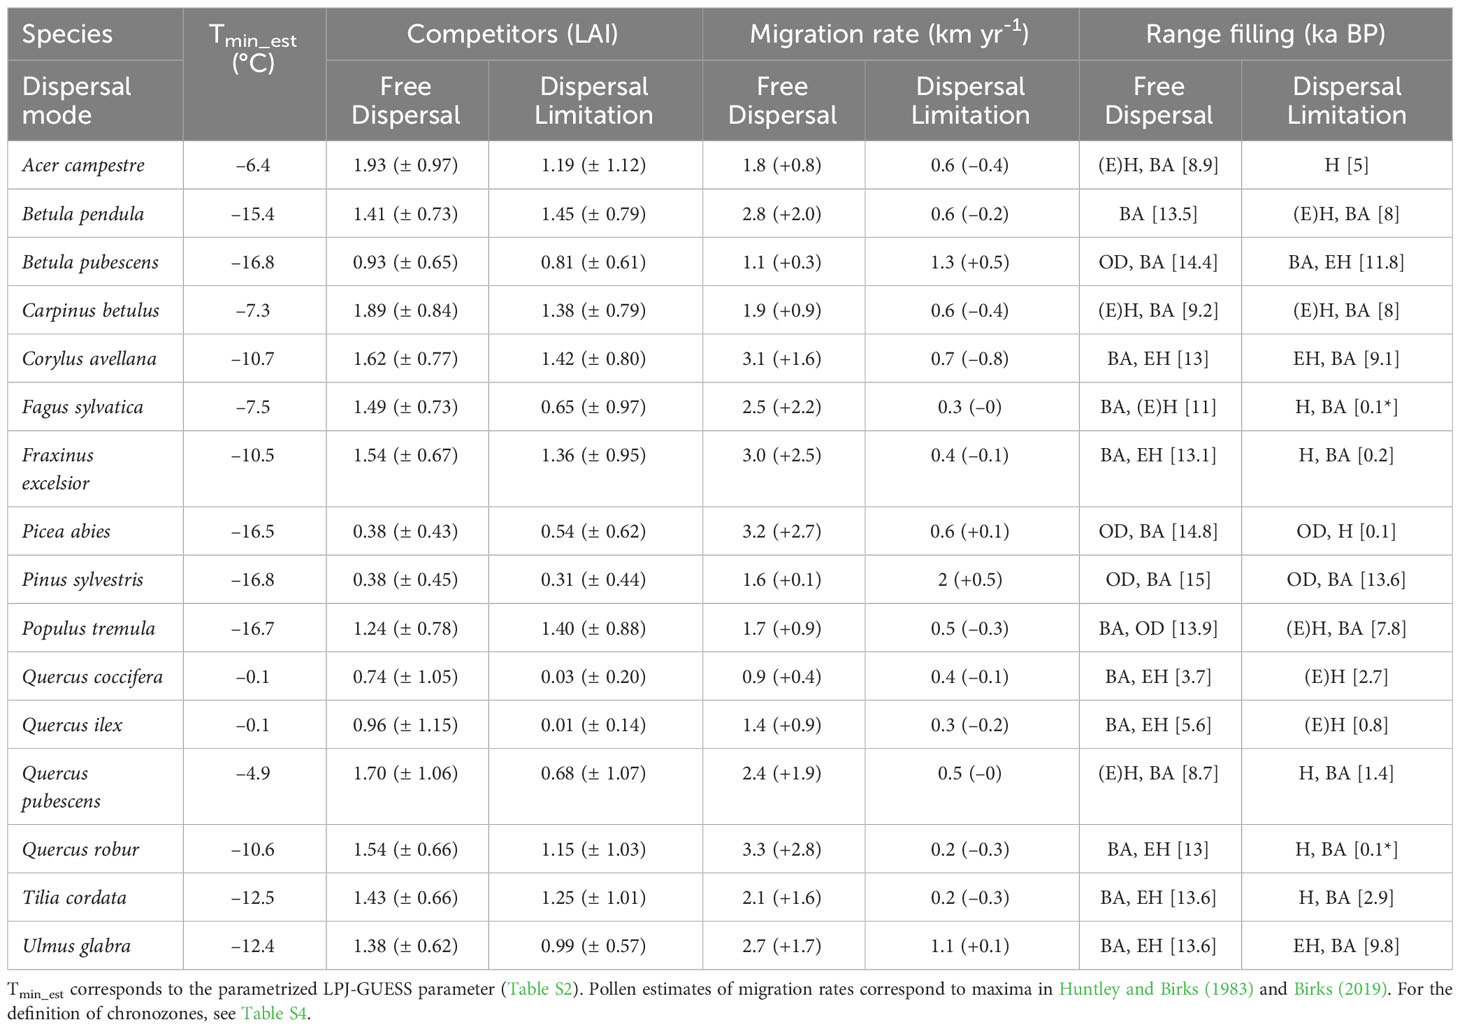
Table 1 List of simulated tree taxa with corresponding minimum temperature for establishment (Tmin_est, °C), average ( ± S.D.) total LAI of competitors, migration rate (with residuals from pollen estimates in parenthesis, km yr-1), and chronozone of major range filling (with northern-most arrival in square brackets, ka BP; * indicates spreading in progress) for both simulations.
2.2 Climate data
As climatic input for our model simulations, we used the paleoclimatic grid developed by Armstrong et al. (2019) at a spatial resolution of 0.5 x 0.5 degree longitude-latitude and sliced for the years (18.5–0 ka BP) and area of the simulation domain. The paleo-dataset was reconstructed using the HadCM3B-M2.1 coupled general circulation model and includes the millennial variability of environmental conditions during the last glacial (i.e. Heinrich Events), which has been shown to be important in determining the vegetation change during the Last Glacial (Huntley et al., 2013). Monthly surface air temperature, monthly precipitation, monthly incoming shortwave energy and annual global CO2 concentrations were used as forcing for our simulations. In order to increase the degree of thermal variability within each 0.5 degrees cell, we applied a 0.01 degrees elevation correction to the temperature, assuming a temperature difference of 0.65°C per 100 m elevation difference, which was calculated between the representative elevation for the CRU grid cell and the elevation of the GEBCO (General Bathymetric Chart of the Oceans) bathymetric dataset (difference in elevation, meters) on a 30 arc-second interval grid (GEBCO_2014 Grid, version 20150318, http://www.gebco.net).
2.3 Velocity of climate change
We calculated the velocity of climate change (VoCC) as the rate at which the average temperature is moving through space on a century basis. We applied the gradient-based approach using the gVocc function implemented in the R package ‘VoCC’ (García Molinos et al., 2019) as this function is commonly preferred to the distance-based approach for the calculation of temperature velocity (Loarie et al., 2009). The gradient-based VoCC is calculated in km yr-1 as the ratio between the temporal trend of the local temperature s (in °C yr-1), which is the slope of the linear regression of the cell-based (local) temperature across time, and the spatial temperature gradient g based on a 3×3 cell neighborhood (°C km-1).
For the current study, we used the 0.5 degrees mean monthly temperatures generated by Armstrong et al. (2019) for our simulation domain and averaged each cell on a yearly basis. Next, we calculated gVoCC across the simulation time (18.5–0 ka BP) with a time-step of 100 years and a threshold of 0.01 km to truncate the spatial gradient, resulting in 185 gVoCC layers. We then located the top four gVoCC layers with the maxima of temperature velocity averaged across space and thus derived the time-periods (on a century basis) of rapid warming after the LGM. Finally, we calculated the temperature velocities of each species’ j leading edge (gVoCCLeadj) by extracting the values of all cells contained within the latitudinal band of the leading edge [see Eq. (4) in Sect 2.4] from each gVoCC layer. Here as well we derived the four maxima of gVoCCLeadj (gVoCCLeadmax,j) following the approach described above.
2.4 Velocity of range shifts
The calculation of the range shift of species varies with respect to the location of the shift (centroid of the range, leading/trailing edges), which can then be associated to different governing processes (García Molinos et al., 2017). For example, the shift of the centroid distribution tracks the movement of the whole species range occupancy and is based upon both range limits expansion/contraction and the build-up of local populations driven by suitable climatic conditions and competition. On the other hand, shifts of the range edges are typically the response to changes of climatic conditions at the extremes of the species tolerance (García Molinos et al., 2017). Similarly, Giesecke and Brewer (2018) highlighted that spreading rates reconstructed from pollen data may be misleading in direction and/or magnitude if no distinction is made between local population expansion (i.e. the build-up of a species already present in the region) and the effective spread of the leading edge after isothermal shifts.
In order to disentangle these processes, we calculated range shift in two distinct ways: 1) centroid shift and 2) shift of the leading edge at the coldest/highest latitudinal extreme. In this sense, spreading rates [i.e. true rates of spread sensu Giesecke and Brewer (2018)] would correspond to northward shifts of the leading edge (northern-most occurrence) in response to the creation of new climatically suitable habitats. The leading edge shift is thus calculated in a latitudinal direction as it is commonly assumed that species will follow isothermal shifts towards the north in periods of warming (Boisvert-Marsh, 2020). On the other hand, shifts of the centroid of the occupied range can be interpreted as a sign of local population expansion, especially if the shift is longitudinal (Giesecke and Brewer, 2018).
We estimated the range shifts (km yr-1) of each species j and for each 100-year interval throughout the simulation time by dividing the harversine distance between longitudinal-latitudinal positions at the beginning (pt1) and end (pt2) of each consecutive time-window by the elapsed time (100 years) (Williams and Blois, 2018).
Centroid shifts were calculated as weighted mean centers of the longitude and latitude for each species j, by separately multiplying the coordinates of each simulated cell x (lonx and latx) by the weight of that cell (wgtj,x), summing over all cells (of total amount X), and dividing by the sum of all weights:
with weights wgtj,x being the LAI of species j at the simulated cell x, which were scaled to the climatic grid by aggregating values from 0.01 to 0.5 degrees longitude/latitude cells; and accordingly for latitude. Additionally, we estimated the direction of the centroid shifts by calculating the angle between the coordinate positions of consecutive time-windows using the R package ‘geosphere’. The comparison of centroid shifts between the two dispersal simulations may highlight possible delays in the filling of the potential niche following temperature rises.
Next, latitudes of the leading edges were calculated as the weighted maximum latitudinal presence (LAI>0.01) of each longitudinal band (0.5 degrees) and for each species j:
with weights wgtj,x being the LAI of species j at the simulated longitudinal band x. As we considered only latitudinal shifts, the longitude of the leading edge was fixed in the middle of our simulation domain. Furthermore, we assigned negative values to southward movements, i.e. when decreased between two consecutive time-windows, so to include the direction of species’ range shifts.
In order to evaluate whether the simulation involving dispersal limitation better represents the observed paleo-records of species distribution than the simulation assuming unlimited (free) dispersal, we compared our model-derived maxima of leading edge velocities (i.e. migration rates) with the pollen-based estimates of maximum rates of spread as derived by Huntley and Birks (1983):
where Δ% is the percentage difference. The maxima of species-specific velocities for the leading edge shifts in the free dispersal () and dispersal limitation simulation () were located following the same approach as for the calculation of thermal peaks (see Sect 2.3).
We additionally calculated the difference between the maximum velocities of warming (gVoCCLeadmax,j; see Sect. 2.3) and the range shift velocity at the corresponding time-point for both dispersal modes. Higher differences between the speed of climate amelioration and range expansion would indicate a higher potential for migration lags in species j.
2.5 Earliest post-glacial establishment, dispersal lag, thermal lag, and competition
The year of arrival (i.e. earliest post-glacial establishment) for each species j was defined as the first year after 18 ka BP when the LAI of the simulated species exceeded 0.01 within the grid cell (0.01 degrees resolution) and each 100 years. Next, we calculated the difference of the years of arrival between the simulations ( at each cell) to highlight areas of possible dispersal lag for a species’ expansion. Here we assume that any difference in establishment between the two simulations may be caused by the limited dispersal capacity of a species (dispersal lag).
Next, we calculated the average of the year of arrival across each 0.5 degrees latitudinal band of the simulation domain and found the year of arrival at the northern-most latitude for each species and dispersal mode. We fitted a simple polynomial function with a cubic term to the latitude of first arrival vs. time (rescaling the time to 100 years windows). The fitting was repeated separately for three major chronozones within the simulation time: Oldest Dryas (18–15 ka BP), Late Glacial Interstadial (15–12.9 ka BP) and Holocene (11.7–0 ka BP). In this sense, a positive slope in the regression fitting would indicate an ongoing species expansion. Along with the spatial patterns of earliest establishment, the years of arrival at the periglacial front (our northern-most region) can be compared to the expansion reconstructed from pollen data and genetic studies (Giesecke and Brewer, 2018) to verify how well our model simulations (and in particular our different dispersal modes) can (better) approximate the post-glacial spread of major European tree taxa.
We further calculated the earliest time at which the species-specific temperature for establishment was reached (minimum temperature year, tTmin_est,j), which correspond to the first year after 18 ka BP (in a time-window of 100 years) when the minimum temperature for establishment of species j (as defined in the LPJ-GUESS bioclimatic limits; Table S2) is reached at the cell level. Thermal lag was then defined as the difference between the minimum temperature year and the year of arrival as simulated by both dispersal modes (). Other limiting factors can affect the establishment of species in LPJ-GUESS (e.g. gdd5_est in Table S2), although they are highly correlated with minimum temperature for establishment. Thus, this approach assumes that tTmin_est,j roughly represents a species’ potential distribution as tree species establishment in post-glacial periods is mostly driven by thermal minima (Lang et al., 2023). In this sense, thermal lags would also reflect the delayed occupancy of a climatically suitable habitat due to competition and the limited dispersal capacity of species j (in the case of dispersal limitation), i.e. thermal migration lag. To decompose the drivers of migration lag (competition and dispersal capacity), we further calculated a proxy of competition at the point of establishment () by summing the LAI of all non-grass species for each cell across the simulation domain. Thus, we expect that the spatial distribution of competitors would resemble the pattern of thermal lag in the case of species mostly constrained by competition in their post-glacial establishment. On the other hand, we should observe a similarity between thermal and dispersal lags when the species’ spread is mainly constrained by a limited dispersal capacity.
3 Results
The climate change velocity calculated from our input temperature (gVoCC) peaked at two points, namely at the start of the Bølling-Allerød warming event (P-BA14.5 ka BP) and at the end of the cold spell of the Younger Dryas (P-YD11.5 ka BP) (Figure 1B). At P-BA and P-YD, gVoCC reached up to 5 km yr-1 and 4 km yr-1 in north-west Europe, respectively, with the slowest climate change happening across mountainous chains, i.e. the Alps, Carpathians and Pyrenees (Figure 1C).
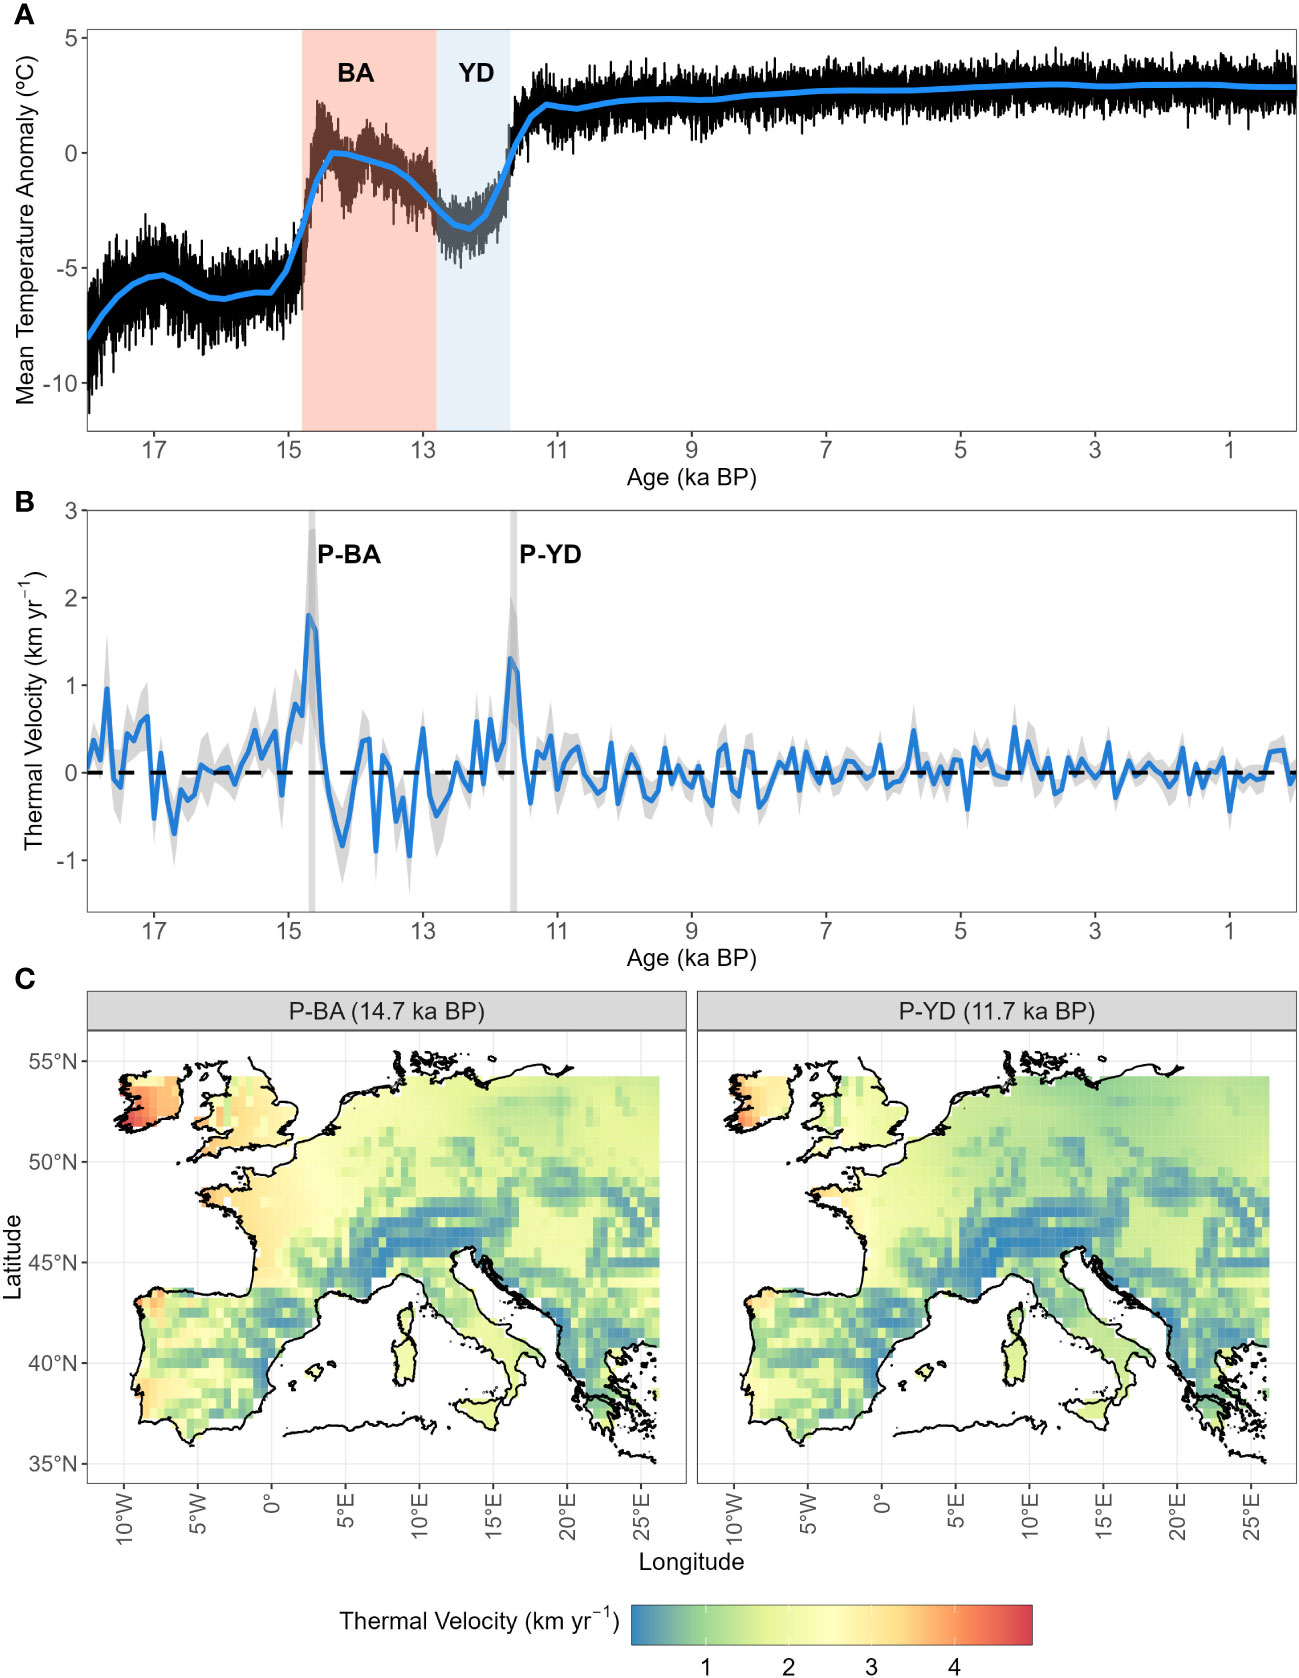
Figure 1 Post-glacial temperature anomaly and velocity in periglacial Europe. (A) Average of temperature anomalies reconstructed from the aggregated mean yearly temperature extracted from Armstrong et al. (2019). Shaded areas indicate the Bølling-Allerød warming event (BA, 14.8–12.8 ka BP; light red) and the cold spell of the Younger Dryas (YD, 12.8–11.7 ka BP; light blue). (B) Average ( ± S.D. as shaded areas) of gradient-based temperature velocities (gVoCC) as calculated in Sect. 2.3. Maxima of temperature velocities (peaks, P) are indicated by vertical grey bands (P-BA=14.7 ka BP; P-YD=11.7 ka BP). (C) Spatial representation of climate change velocity (gVoCC) at the two thermal peaks (P-BA and P-YD).
We observe a temporal variation in the range shift velocity of leading edges (and centroids), with velocities peaking around warming periods and range contracting with negative values (or shifting southward) during the cold YD (Figures S1, S2). Specifically, the maxima of range shift velocity under free dispersal are recorded during P-BA or P-YD, with the exception of Pinus sylvestris, which expands rapidly during the Oldest Dryas (OD; ~17 ka BP) (Figures 1, S1, S2). On the other hand, species simulated under dispersal limitation tend to reach high leading edge velocities (or northward direction in centroid shifts) with a delay after P-BA and P-YD (i.e. across the Holocene), except for boreal (e.g. Betula spp., Pinus sylvestris) and Mediterranean (the evergreen Quercus spp.) taxa, which respond rapidly (and northward) to warming (Figures 1, S1, S2). Most of the remaining species simulated under dispersal limitation respond to the two rapid warming events by local population build-up (mostly westward; Figure S2B).
When compared to the thermal velocities at their maxima (P-BA and P-YD), many species expanding in the free dispersal simulation manage to track rapid climate shifts, either during P-BA (e.g. Tilia cordata, Ulmus glabra) or P-YD (e.g. Acer campestre, Fagus sylvatica, Carpinus betulus, Corylus avellana) (Figure 2A), with boreal species’ (e.g. Pinus sylvestris) spread peaking before at OD (Figure S1). Contrary to this, migration speed within the simulation taking dispersal limitation into account is always exceeded by thermal velocities by ~2–4 km yr-1 (Figure 2A). Compared to pollen-derived values, the simulation with free dispersal mode generates strong overestimations of the maxima of range shift velocities, with Fagus sylvatica being ~7.5 times faster than expected by paleo-records, whereas Betula pubescens and Pinus sylvestris have smaller deviations ( +35% and +5%, respectively) (Figure 2B). For the dispersal limitation simulation, the maxima of migration speeds are overall close to (e.g. –3% for Quercus pubescens) or slightly lower than estimates from paleo-records, with the lowest being –52% for Corylus avellana and Quercus robur (Figure 2B). On average, the magnitude of underestimations (–17%) for the simulation with dispersal limitation is lower than the overestimations under free dispersal (+259%) (Figure 2B).
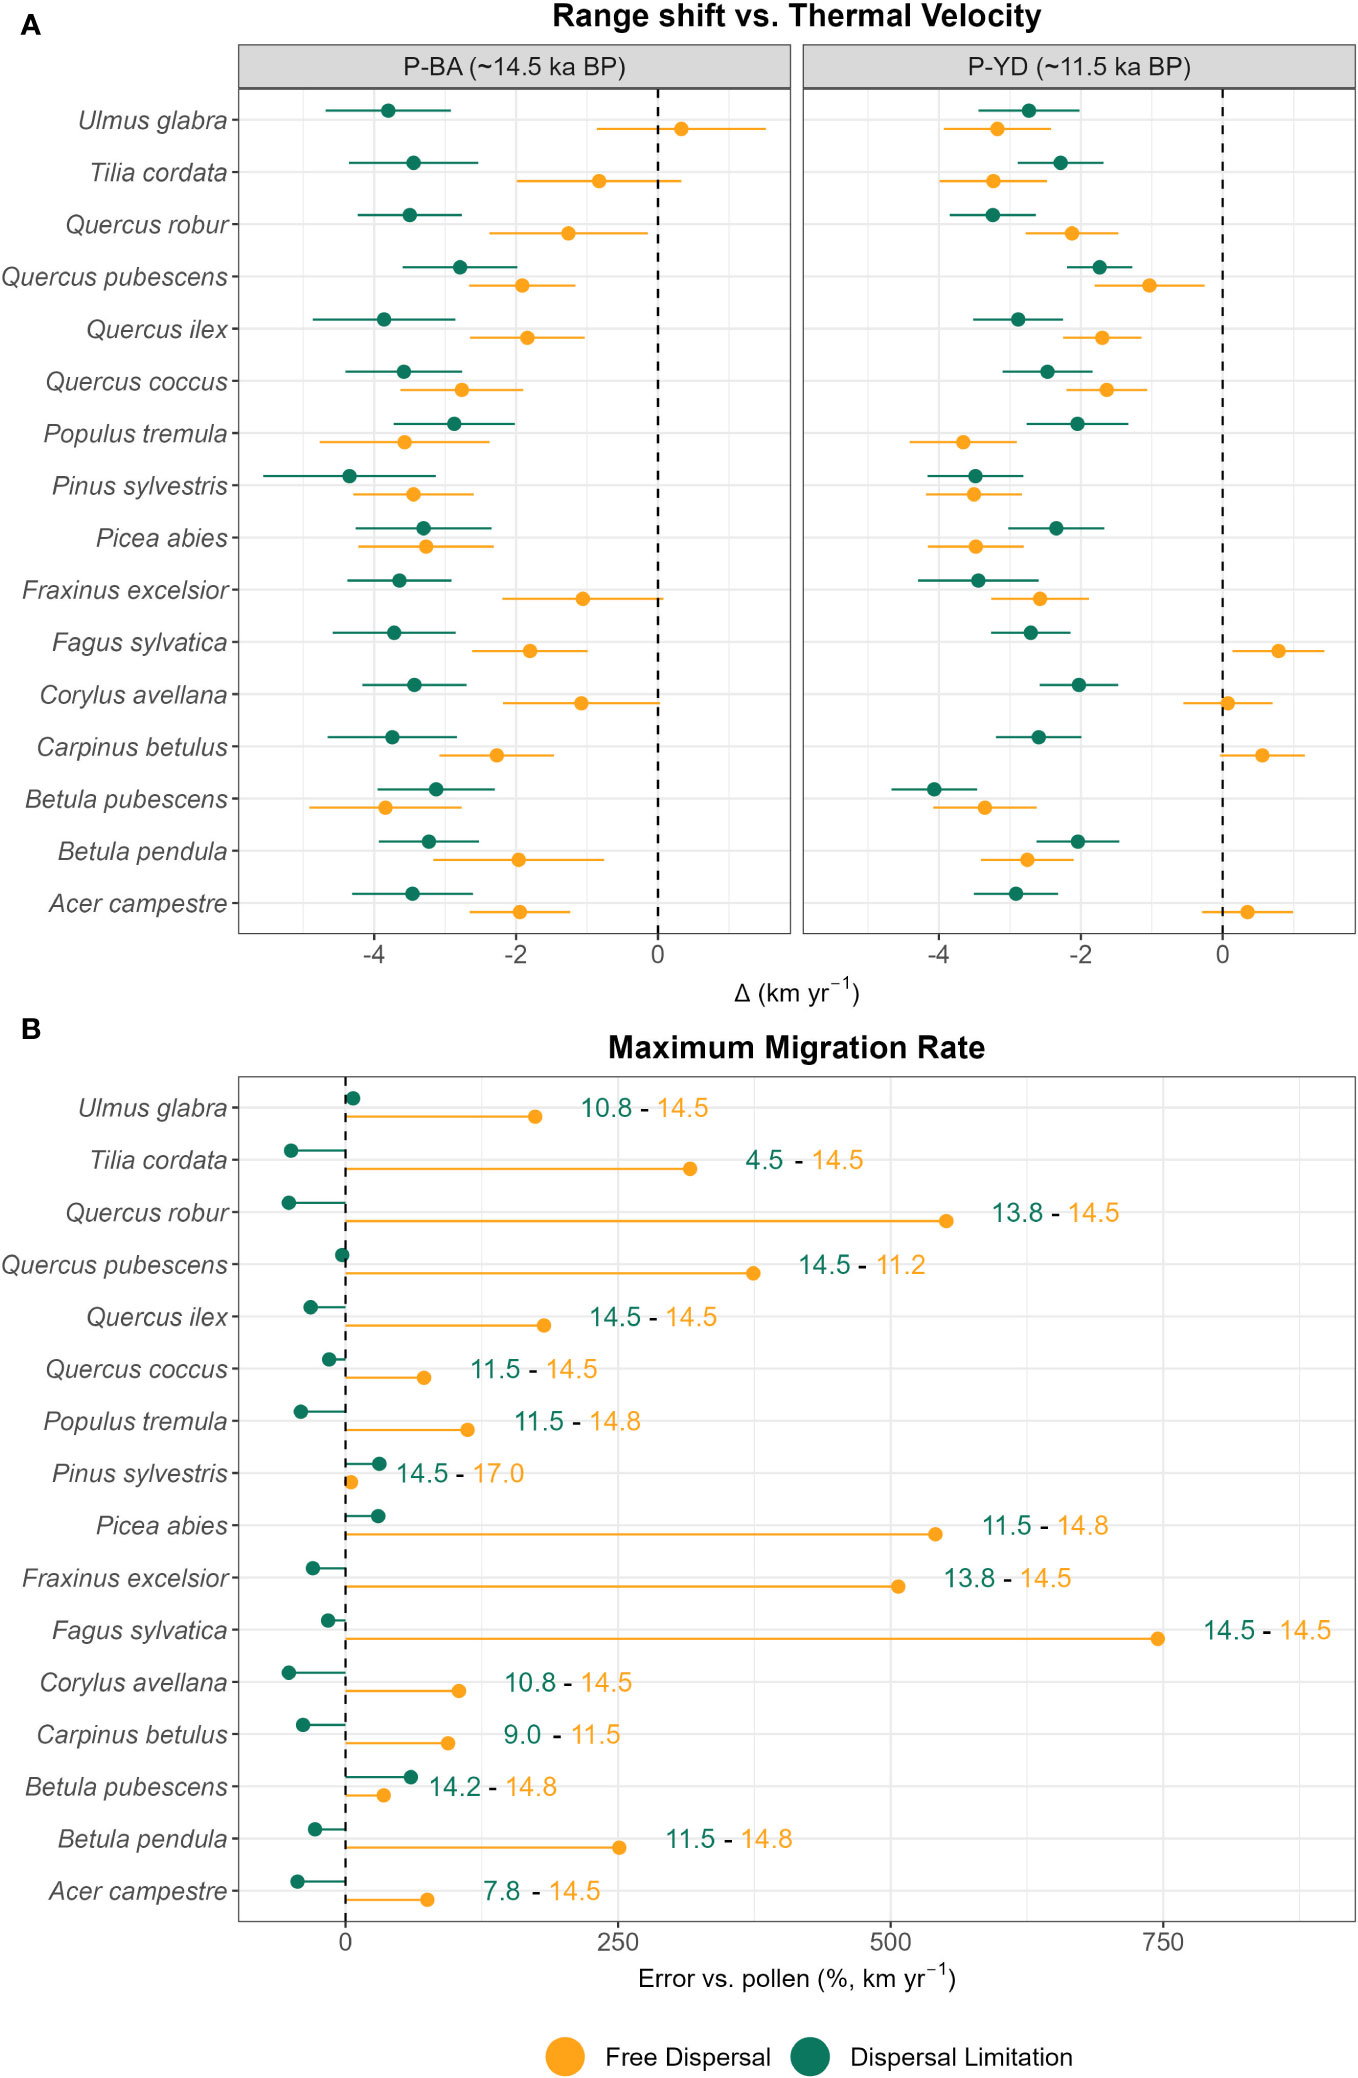
Figure 2 (A) Difference of thermal and range shift velocities at the leading edge (km yr-1) at points of maxima (P-BA and P-YD) and (B) error (percentage difference, Δ%) against pollen-derived estimates of maximum migration rate (leading edge) under free dispersal (yellow) and dispersal limitation (green). (B) Years of recorded maxima (ka BP) are reported on the right for each species and colored according to dispersal mode. (A) For the calculation of the maxima of thermal velocity (gVoCCLeadmax,j) and range shift velocity (maxRangeShiftLeadj) see Sect 2.3 and Sect 2.4, respectively. (B) For the calculation of percentage difference see Sect 2.4.
The spatial distribution of post-glacial arrival time shows a northward expansion for the simulations with dispersal limitation (Figure 3B). Pinus sylvestris, and to a lesser degree Betula pubescens, are the only species that manage to occupy most of their range by the end of the first warming period (BA) (Figures 3B, S3; Table 1). The remaining species simulated under dispersal limitation complete their range filling either by the end of the Early to Mid-Holocene (Ulmus glabra, Corylus avellana, Carpinus betulus, Betula pendula, Populus tremula) or predominantly over the Mid- to Late Holocene (Figures 3B, S3; Table 1). On the other hand, most of the species simulated under free dispersal manage to complete their range expansion across the BA or at the latest during the Early Holocene, with Pinus sylvestris, Picea abies and Betula pubescens expanding even during the OD (Figure 3A; Table 1). Interestingly, Fagus sylvatica and Quercus robur are still in the process of filling their potential range by the end of the simulation time (0 ka BP) when simulated under dispersal limitation (Figures 3B, S3; Table 1). In the case of Mediterranean taxa (i.e. the evergreen Quercus spp.), the potential climate niche is not fully occupied under dispersal limitation by the end of the simulation (cf. Figure 3 with Figure S4). Comparing the two dispersal modes, dispersal lag occurs across the Holocene for most of the species (cf. Figure 4 with Figure S1B). However, we do not observe any multi-millennial dispersal lag for Pinus sylvestris (Figure 4), which is the only species that manages to complete range filling before the start of the Holocene. On the other hand, species with a predominant Mid- to Late Holocene expansion have substantial dispersal lags (>5,000 years), while Early to Mid-Holocene spreaders (Betula pubescens, Carpinus betulus, Corylus avellana and Ulmus glabra) experience dispersal lags of a lesser magnitude (<5,000 years) in the area of central Europe located north of the Alps (Figure 4). The delays in northward arrival for the dispersal limitation mode are in the order of 2,000–6,000 years, with the highest being ~15,000 years in the case of Picea abies, which reaches its highest latitudes at the start of BA (~15 ka BP; Figure S3; Table 1) under free dispersal but keeps expanding until the Late Holocene (0.1 ka BP) in the case of dispersal limitation (Figures 3B, S3).
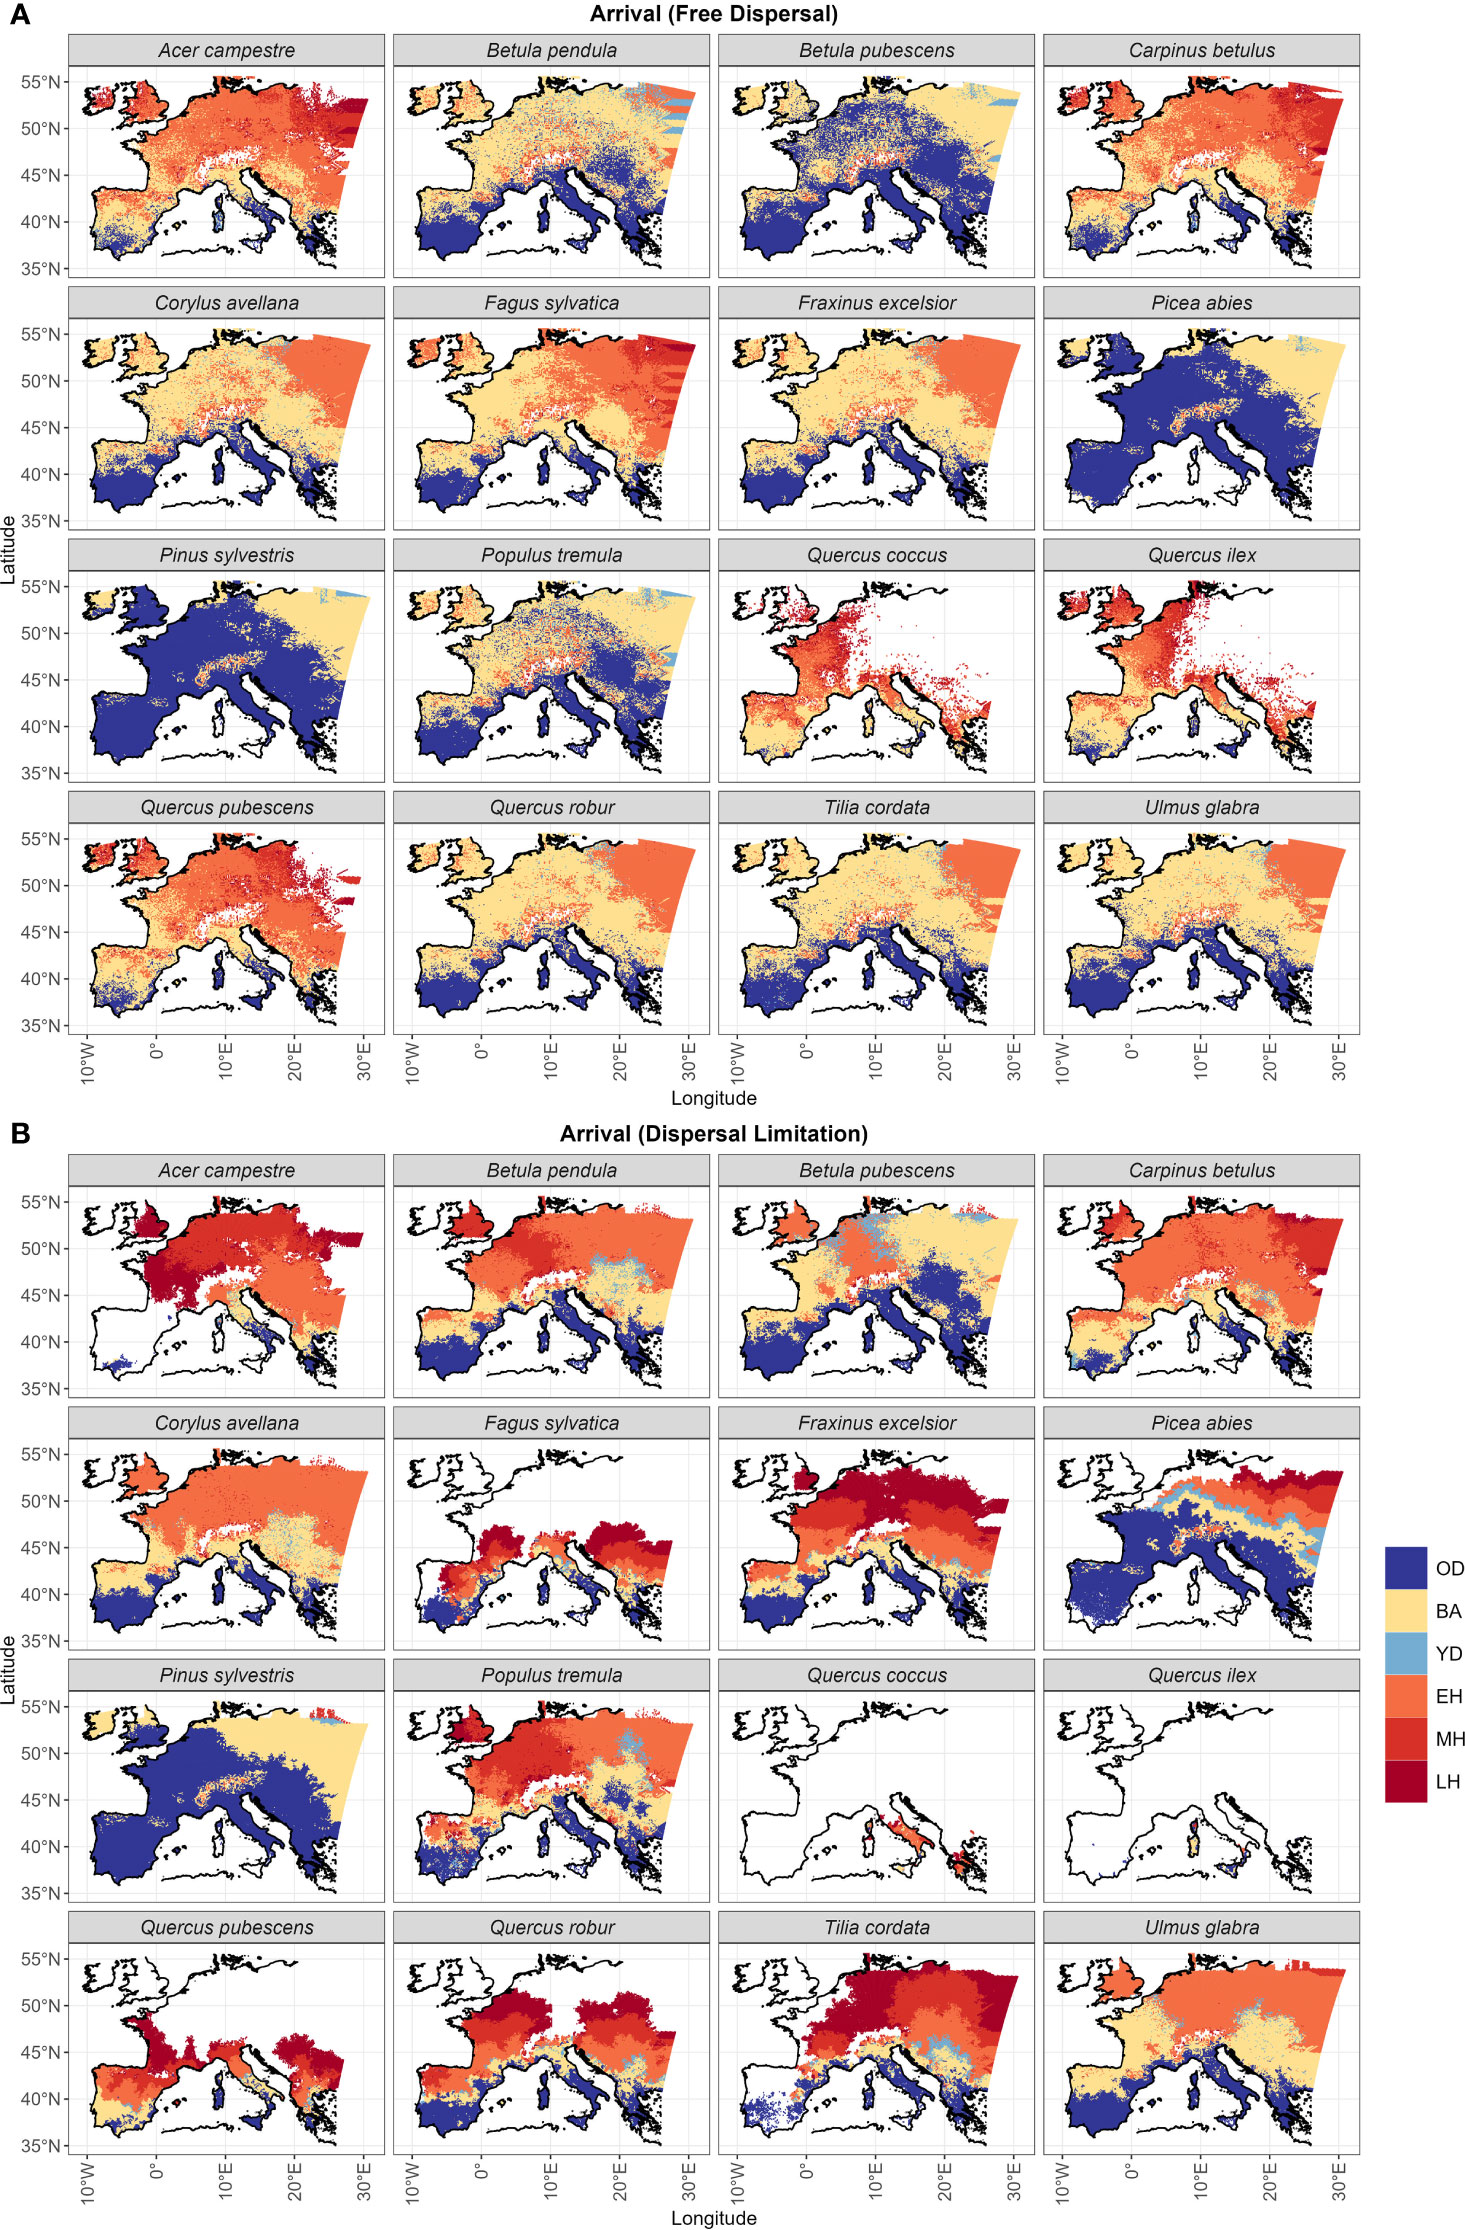
Figure 3 Post-glacial years of arrival under (A) the free dispersal and (B) the dispersal limitation mode are classified according to the following chronozones: the Oldest Dryas (18.5–15.0 ka BP; OD), the Bølling-Allerød interstadial (15.0–12.9 ka BP; BA), the Younger Dryas (12.9–11.7 ka BP; YD), the Early Holocene (11.7–8.236 ka BP; EH), the Middle Holocene (8.236–4.25 ka BP; MH), and Late Holocene (4.25 ka BP–0 ka BP; LH). White areas correspond to the unoccupied species range. For this visualization, we applied a nearest neighbor interpolation to the sampled grid cells in the simulation domain and a land mask following the current European coastline.
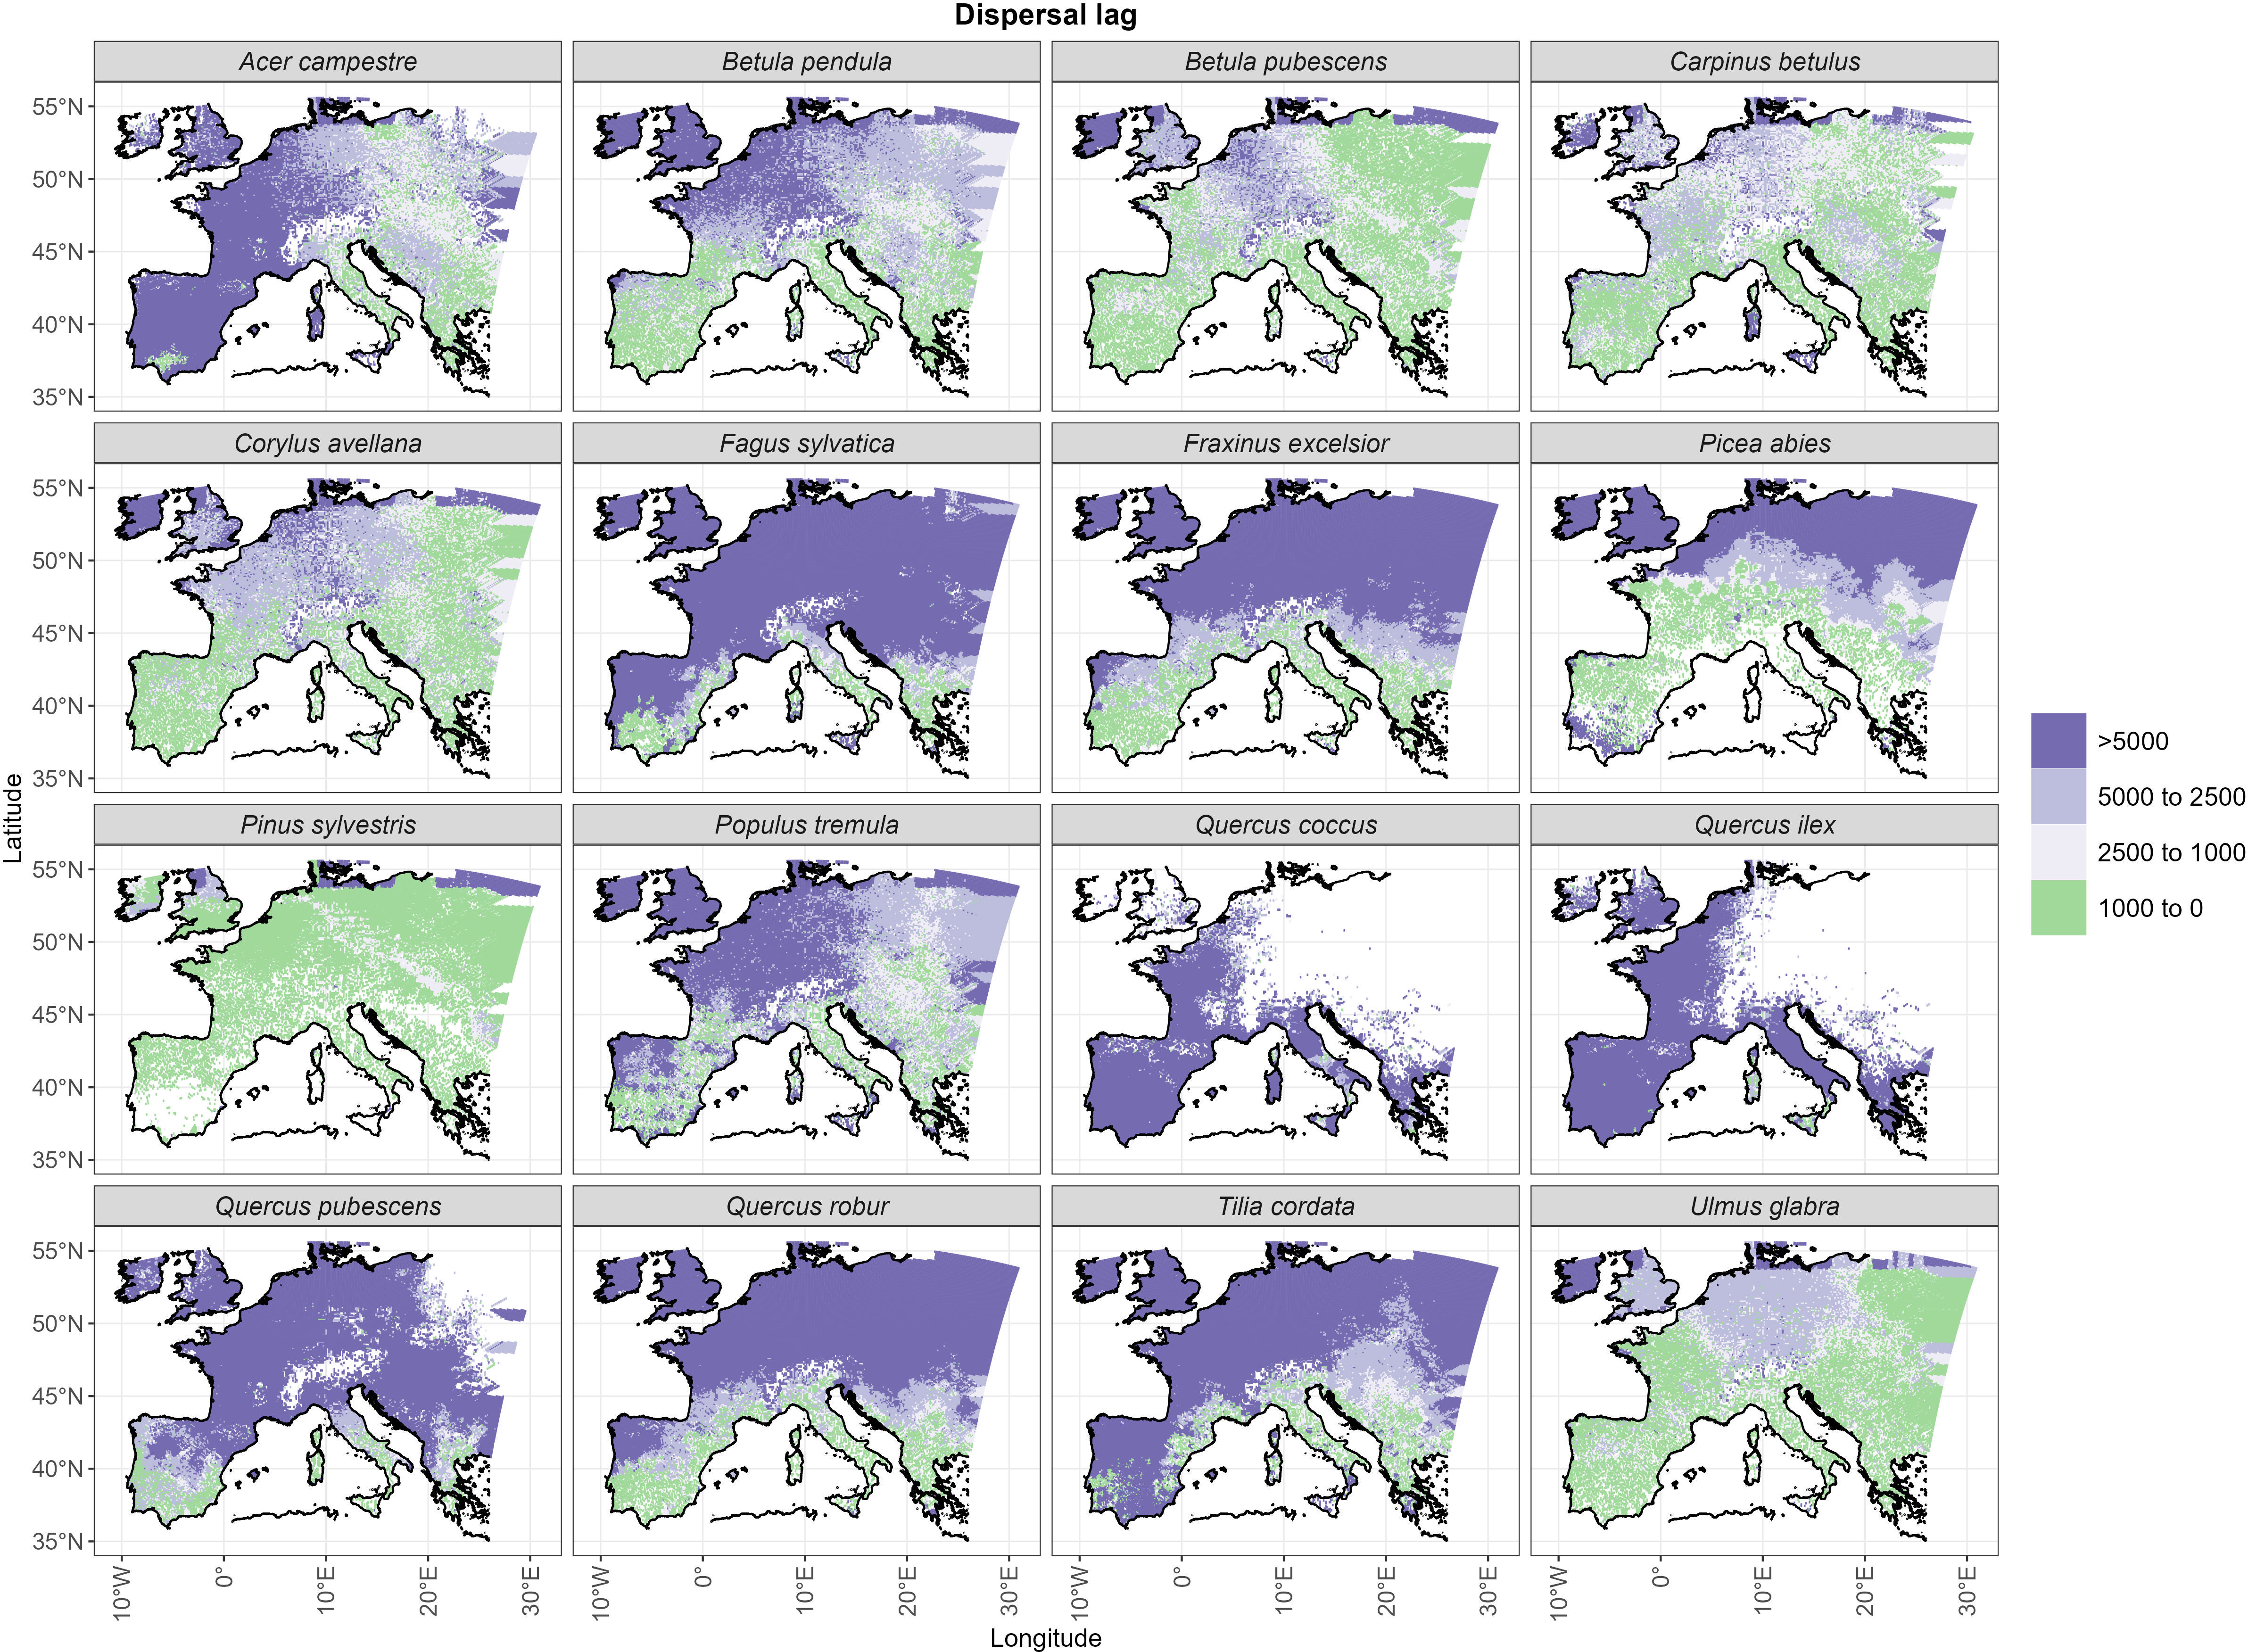
Figure 4 Dispersal lags as represented by the temporal delay (in years) between the year of arrival under free dispersal (Figure 5A) and dispersal limitation (Figure 5A).
Under the free dispersal mode, we found no multi-millennial thermal lag across the whole post-glacial range of Picea abies and Pinus sylvestris, whereas the remaining species experience multi-millennial (up to 5,000 years) thermal lags only in the central and western regions of Europe (Figure 5). On the other hand, we observe substantial thermal lags (>5,000 years) for all species simulated under dispersal limitation, with the exception of Pinus sylvestris, and to a lesser degree Betula pubescens, Carpinus betulus and Ulmus glabra (Figure 5). In the case of dispersal limitation, the spatial pattern of thermal lags differs among species, where lags are higher in areas of Holocene establishment, thus resembling the species-specific patterns of dispersal lags (cf. Figure 4).
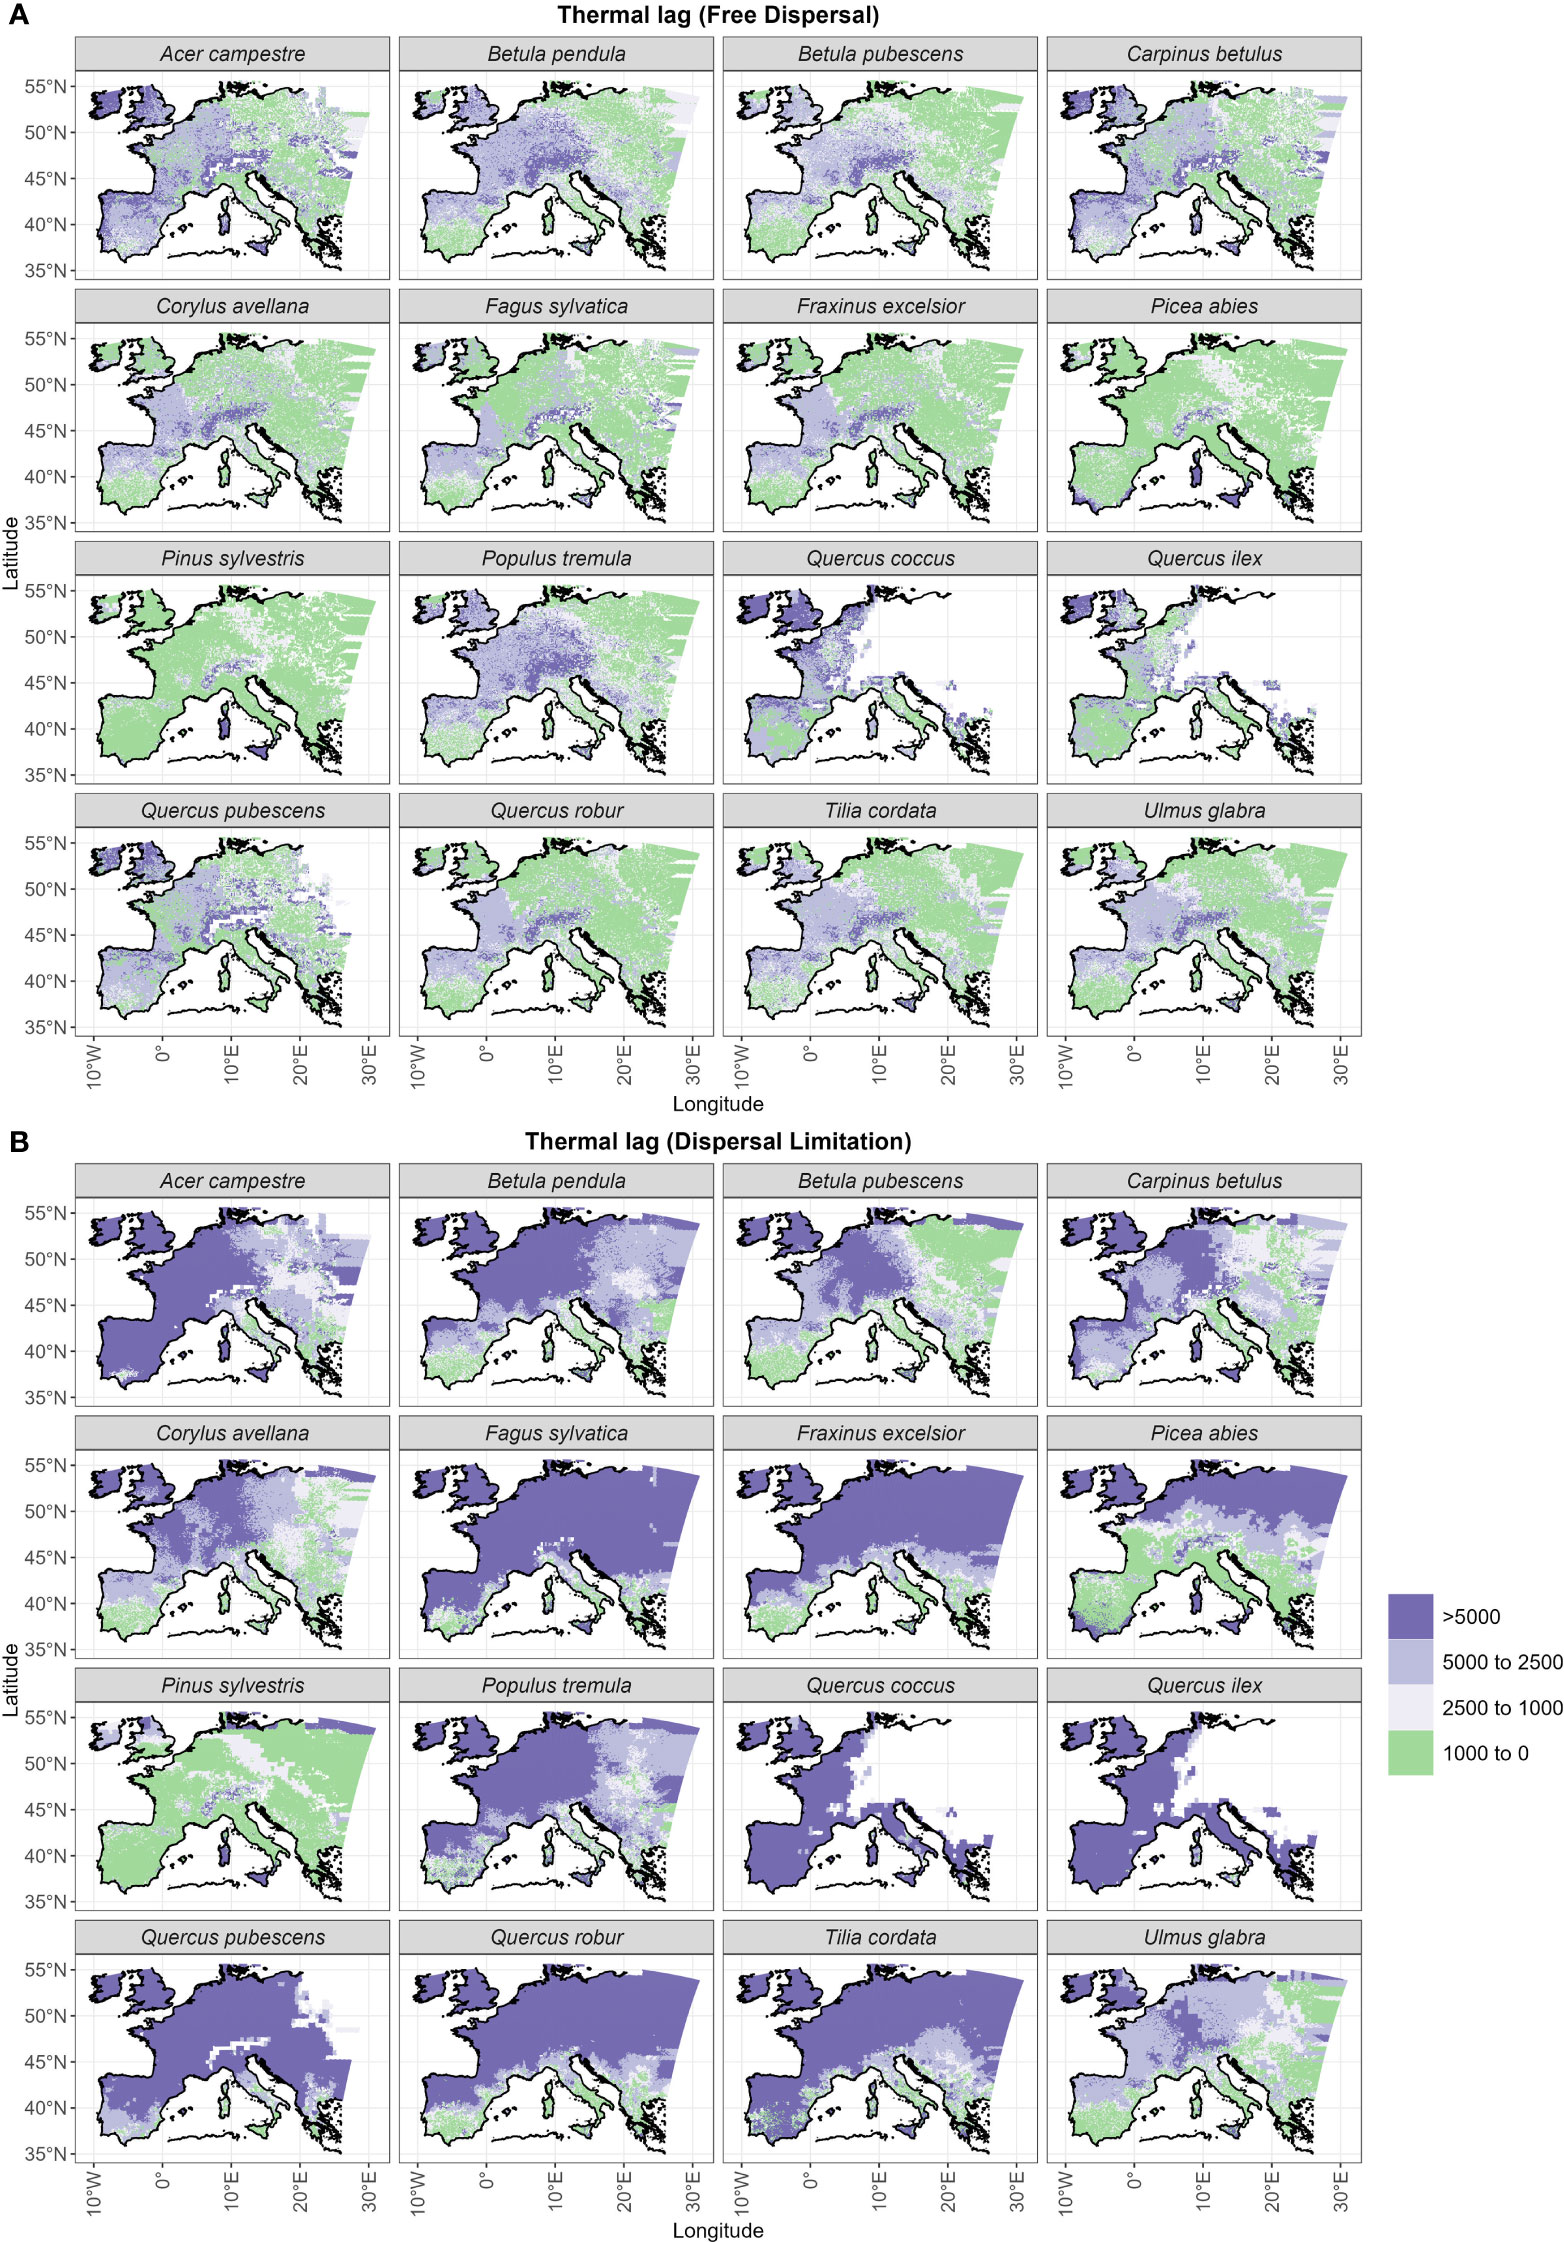
Figure 5 Thermal lags for (A) the free dispersal and (B) the dispersal limitation simulations. Thermal lag is the temporal delay between the earliest time at which the species-specific minimum temperature for establishment was reached (Figure S4) and the post-glacial year of arrival of the species (Figure 3).
Competition at establishment is overall higher under the free dispersal mode (Table 1), with the exception of Picea abies and Pinus sylvestris (Figure 6). The highest degree of competition (LAI>2) is observed across most of the range of Acer campestre, Carpinus betulus, Quercus pubescens and the evergreen Quercus spp.; all these species are late to expand under free dispersal (mostly during the Mid-Holocene) (Figure 3A). For the remaining species, we found higher competition in Western Europe (Figure 6). The longitudinal gradient of the degree of competition and of thermal lag is similar under free dispersal. In the case of dispersal limitation, the overall competition at establishment is lower (Table 1), and especially for Pinus sylvestris, Betula pubescens, Ulmus glabra, and Picea abies, with competition being more abundant in pre-Holocene (OD) areas of establishment (cf. Figure 6 with Figure 3). Instead, most of the remaining species experience higher competition at establishment across the Holocene, especially during the Mid- and Late Holocene (e.g. Acer campestre, Fagus sylvatica, Fraxinus excelsior, the deciduous Quercus spp.) (cf. Figure 6 with Figure 3).
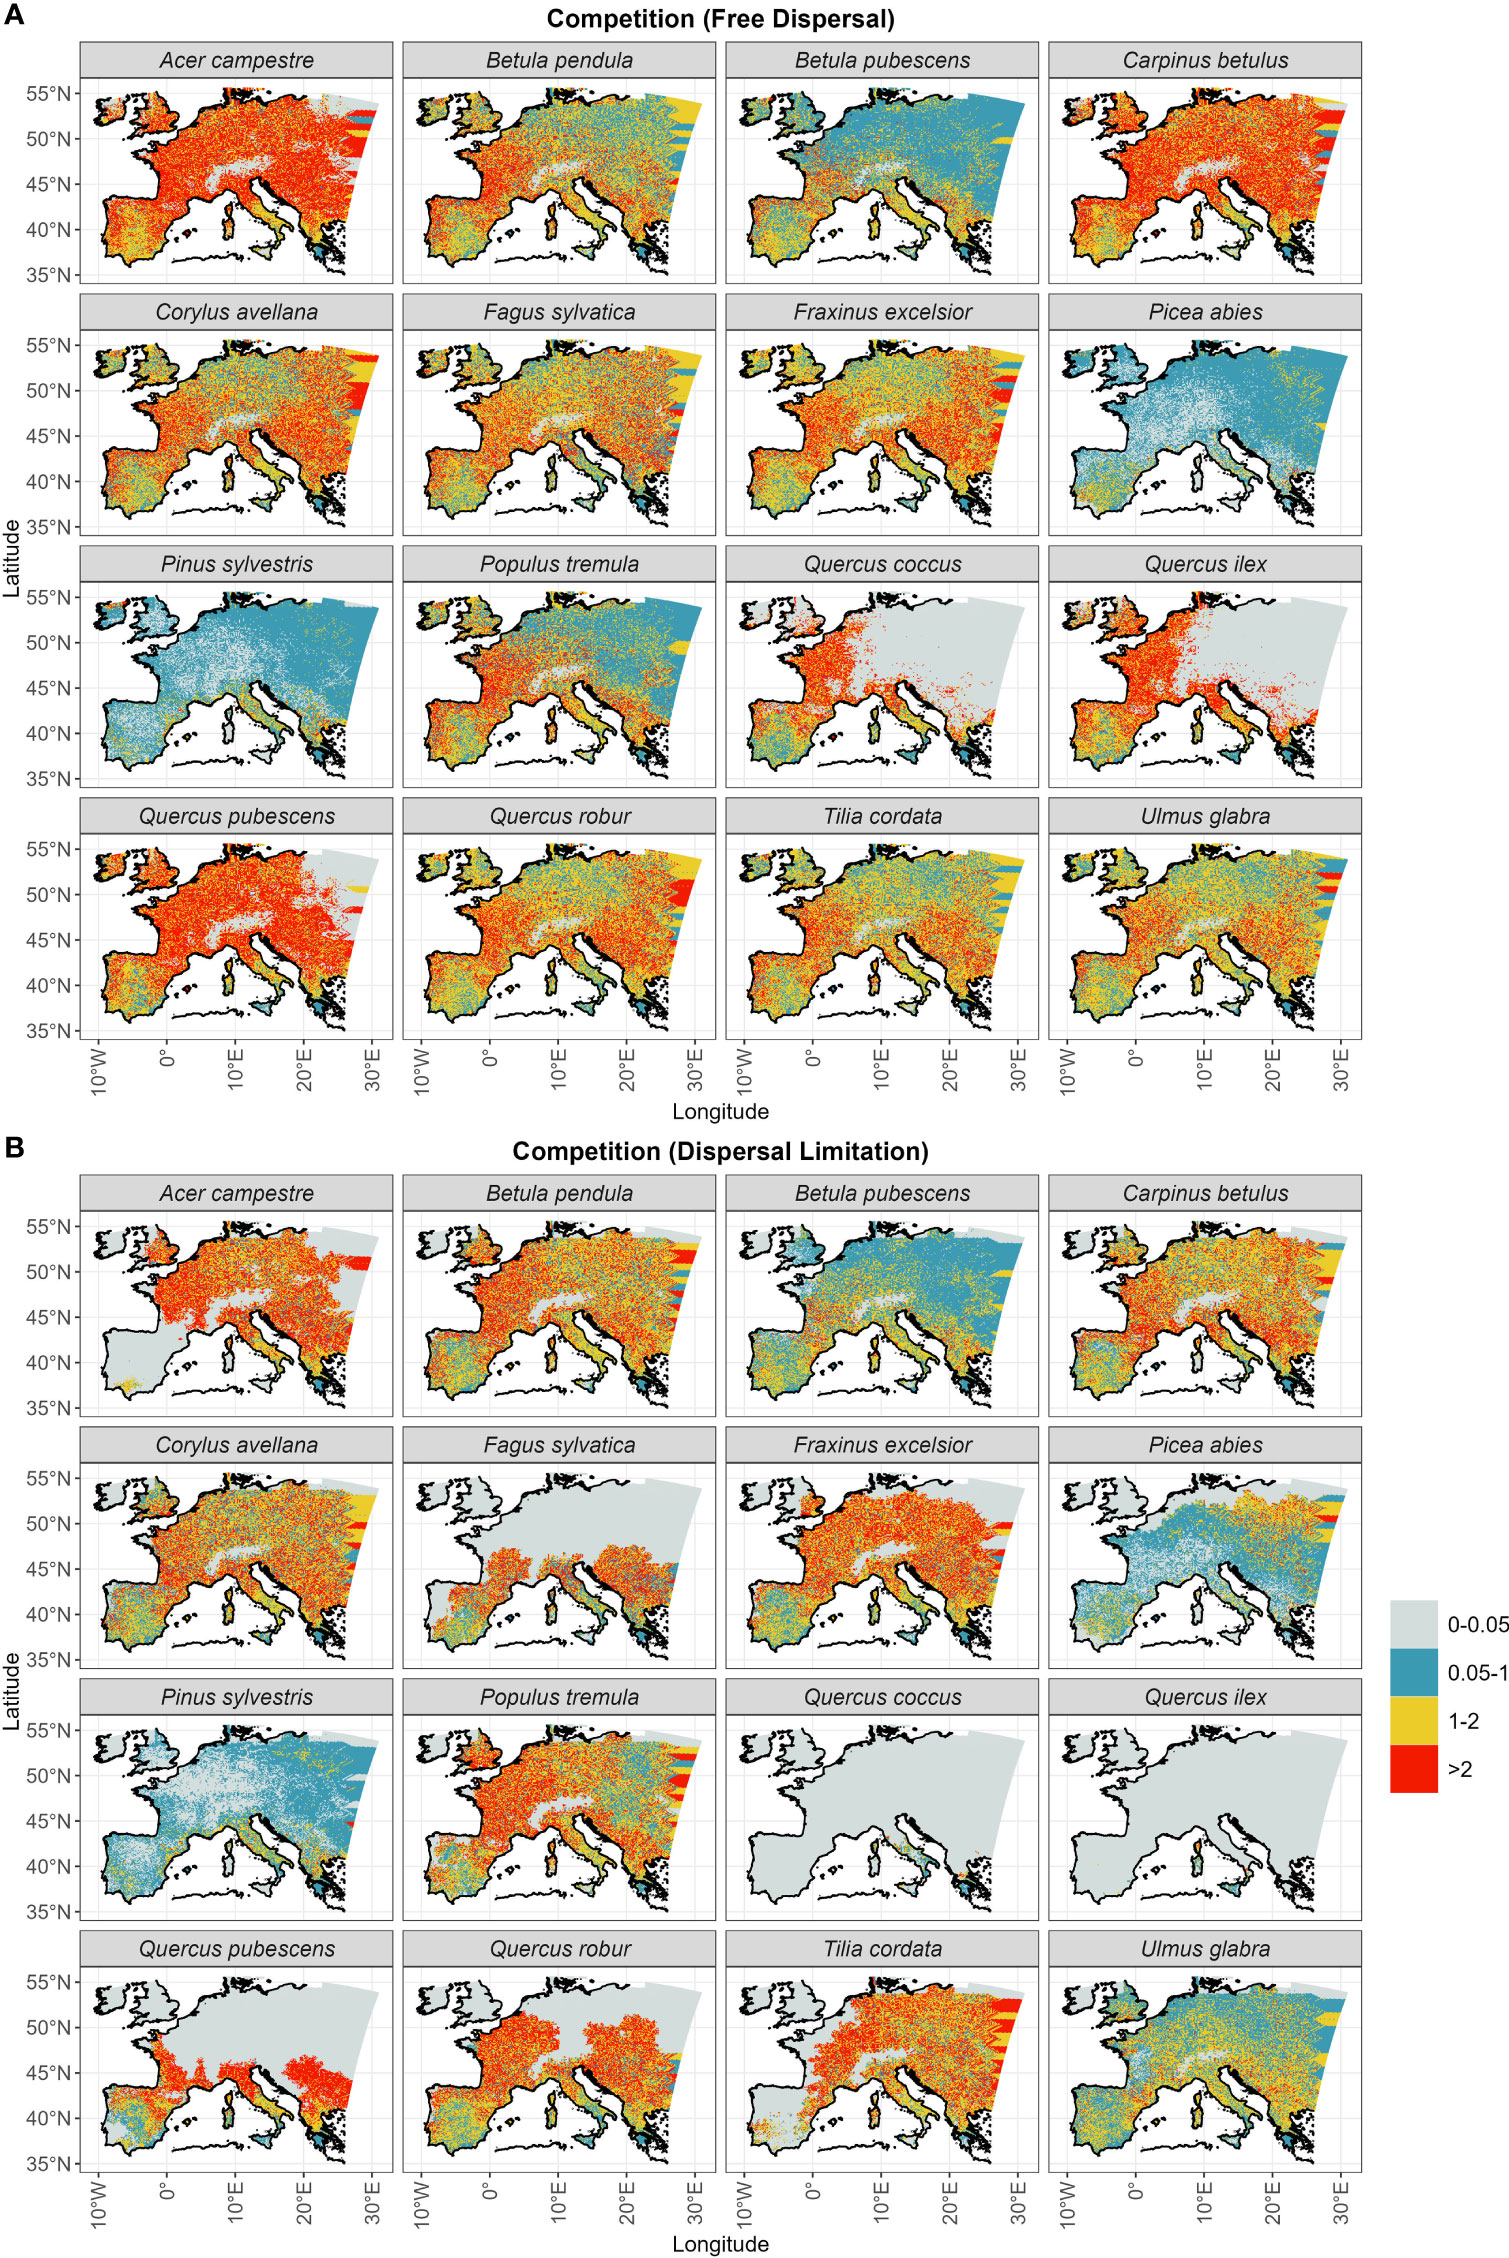
Figure 6 Total LAI of established trees at arrival (Figure 3) for (A) the free dispersal and (B) the dispersal limitation mode.
4 Discussion
Our study shows that the post-glacial northward spread of most tree taxa was not constant over time but peaked around two periods of rapid warming, P-BA and P-YD (Figures S1, S2), which are in agreement with recent paleo-climatic reconstructions [cf. our Figure 1A with Figure 2 in Osman et al. (2021)]. This indicates that species responded to climate amelioration by tracking a mostly northward isothermal shift, though with speeds of different magnitude depending on the simulated dispersal model and species-specific factors (thermal requirement, competition, dispersal ability).
Comparisons with pollen estimates of migration rates (Figure 2) and patterns of thermal lags (Figure 5) seem to suggest a marked delay in the post-glacial range expansion of most tree species (i.e. migration lag), which our dispersal limitation mode could reasonably capture (Figure 2B). Nevertheless, we observed some taxa with relatively low dispersal (Figure 4) and thermal (Figure 5) lags, indicating that these species did not lag much behind their favorable climate after the onset of the interglacial phase, i.e. Pinus sylvestris and, to a lesser degree, Betula pubescens. Interestingly, both species are classified as protocratic taxa according to pollen reconstructions of interglacial vegetation dynamics (Giesecke et al., 2017; Lang et al., 2023). The protocratic stage is defined as the initial phase after the ice sheet retreat when pioneer species colonized the newly emptied habitats and the tundra-steppe of northern Europe (Lang et al., 2023). As shown by pollen reconstructions (Giesecke et al., 2017) supported by genetic analysis (Cheddadi et al., 2006), Pinus sylvestris and Betula pubescens covered a large and continuous area in periglacial Europe even during the cold OD, with northern and formerly glaciated areas being occupied at later periods (EH or MH). Rates of spread were relatively high, in the order of 1–1.5 km yr-1 (Huntley and Birks, 1983; Giesecke and Brewer, 2018; Lang et al., 2023), which is compatible with our simulated values for both dispersal modes (Figure 2). This early and fast northward migration was likely determined by a large spreading front before the rapid BA warming (OD range) and by some characteristic traits of pioneer taxa: thermal tolerance to low temperatures (down to -16.8 °C to start establishment; Table 1), fast maturation and growth rate, and an efficient dispersal mechanism, which are reflected by our migration parameters (e.g. very high fecundity for Betula spp., high germination rate for Pinus sylvestris, and long-tailed kernels for both taxa) (Table S3).
Interestingly, we observed the highest difference in northern-most arrival between the dispersal modes (15,000 years of delay under dispersal limitation; Figure S3) for another cold-tolerant species that shares the same OD range of Pinus sylvestris and Betula pubescens, i.e. Picea abies. Here the free dispersal simulation predicted a complete range filling before the start of the Holocene, thus classifying Picea abies as a protocratic taxon. Instead, in the case of dispersal limitation, the expansion of Picea abies during the BA was limited compared to Pinus sylvestris, but continued steadily through the YD and until the LH (Figure 3B). This delayed expansion is confirmed by pollen reconstructions (Giesecke et al., 2017; Lang et al., 2023), including the uninterrupted spread through the cold spell of the YD (Latałowa and van der Knaap, 2006), which is attributed to a high cold tolerance. Compared to pollen reconstructions (Giesecke et al., 2017; Giesecke and Brewer, 2018), the dispersal limitation mode managed also to capture the prevalent east-west spread of Picea abies across the LH (Figures 3B, S2). Here simulated migration rates are close to estimates of spreading rates from fossil records, i.e. in the order of 0.25–0.5 km yr-1 (Huntley and Birks, 1983; Lang et al., 2023), which is far lower (1/3) than values for Pinus sylvestris (Table 1). As the patterns of thermal and dispersal lags of Picea abies are almost the same (cf. Figure 5B with Figure 4) and competition at establishment is quite low (Figure 6B), we can conclude that the species lagged behind its potential niche by multiple millennia due to a limited dispersal capacity and in spite of a relatively low thermal requirement.
The simulation with free dispersal predicted an almost synchronous expansion over the BA and EH for the remaining non-boreal taxa (Figure 3A). In this case, species’ spread was mainly driven by the minimum thermal requirement and constrained by competition (cf. Figure 5A with Figure 6A). That is, species with low thermal requirements managed to complete range filling by the BA/EH and avoided the higher MH/LH competition of less cold tolerant species (e.g. Acer campestre, Fraxinus excelsior, Quercus pubescens in Figure 6A). Overall, the simulated spread of non-protocratic taxa was closer to estimates based on pollen data with the dispersal limitation mode (Figure 2B), especially when we compare the order of simulated species expansion with the order of tree succession during interglacial stages derived from fossil records. Under the simulation with dispersal limitation, the first group of deciduous trees to spread throughout the open woodland of birch and pine included Ulmus glabra and Corylus avellana, and later Carpinus betulus (Figure 3B). This is in agreement with pollen reconstructions (Giesecke and Brewer, 2018). Isopollen maps (Giesecke et al., 2017; Giesecke and Brewer, 2018; Lang et al., 2023) highlight a rapid population expansion around 11 ka BP with high spreading rates (~1.5, 1 and 0.5 km yr–1 for Corylus avellana, Ulmus glabra and Carpinus betulus, respectively) (Huntley and Birks, 1983) and a westward direction (with the slower Carpinus betulus being a late-successional tree in north-eastern Europe) (cf. Figure 3B). Additionally, the centroid shifts of Corylus avellana under dispersal limitation (Figure S2B) agrees with the study by Giesecke and Brewer (2018), where the sudden pollen increase of this species around 10.5 ka BP is interpreted as a population expansion controlled by the climate (post-YD warming) more than an effective spread of the leading edge. For these first deciduous colonizers, the relatively low migration lags were driven mainly by their dispersal capacity (cf. Figure 4 with Figure 5B). The high spreading rates (~0.5–1 km yr-1) were likely possible due to species-specific dispersal characteristics, such as high seed production (Ulmus glabra and Carpinus betulus) and early maturation (Corylus avellana) (Table S3), and to a lack of strong competition (Figure 6B) from the pioneer species pine and birch (Figure S5).
The last expansion wave of deciduous trees simulated under dispersal limitation included Tilia cordata, Acer campestre, Fraxinus excelsior, the deciduous Quercus spp. and Fagus sylvatica (Table 1 and Figure 3B). According to pollen reconstruction (Giesecke et al., 2017; Giesecke and Brewer, 2018), the range filling of Tilia cordata in central Europe occurred mainly across the EH and MH with a relatively fast pacing (in the order of 0.1-0.8 km yr-1) (Giesecke et al., 2017). However, northern limits were reached only by the LH and at a lower rate, indicating that the spreading front was possibly constrained by temperature (cooling) or increased competition (Lang et al., 2023). This is mostly in agreement with our simulated spread under dispersal limitation, although the occupancy of the area north of the Alps is delayed compared to pollen reconstruction (LH instead of MH) (Figure 3B). Similarly, the dispersal limitation mode could reasonably reproduce the pollen-derived spreading patterns of Acer campestre (Lang et al., 2023) until the contemporary distribution (i.e., excluding most of the Iberian peninsula, contrary to the free dispersal simulation) (Figure 3B). In this case, Acer campestre spreads northward from its glacial refugia in the Balkans and southern Italy mostly during the EH and MH, and later north-west across the LH at a moderate speed (0.2-0.5 km yr-1; Figure S2). For both species, we observed a marked migration lag (Figure 5B), which was primarily driven by a relatively low dispersal capacity due to slow maturation (Acer campestre) or low fecundity (Tilia cordata) (cf. Figure 4 with Figure 5B), and by competition from faster spreading and already established taxa (Figures 6B, Figure S5).
For the remaining temperate deciduous species, neither of our dispersal modes reasonably replicated pollen data, with free dispersal yielding an excessively fast spread (Figure 2B), whereas the dispersal limitation simulation resulted in a delayed range filling (Figure 3B). For example, the northward expansion of Fraxinus excelsior under dispersal limitation occurred mainly during the LH after a population build-up in the EH/MH (Figure S2B), while pollen reconstructions highlight a rapid spread during the EH (0.1-0.5 km yr-1) and an almost complete range filling by the MH (Lang et al., 2023). In the case of Fagus sylvatica and Quercus robur, we observed an even larger underestimation of the contemporary distribution, to the point that the species are still in the process of expanding by the end of the simulation (Figure S3). Though both genetic (Petit et al., 2002) and pollen (Huntley and Birks, 1983; Giesecke et al., 2017) evidences indicate an EH spread throughout central Europe in the order of 0.5 km yr–1, our simulated Quercus robur experienced a far slower northern shift (0.2 km yr–1) starting from the MH and following a post-YD population build-up (Figure S2B). Similarly, paleobotanical and genetic studies of Fagus sylvatica (Magri et al., 2006; Magri, 2008) show a northward spread (mostly over the Alps) starting from the MH. Although the timing is compatible with our simulation under dispersal limitation (Figure 3B), pollen estimates from the northward expansion indicate rates of 0.4 km yr–1, which is far higher than our simulated 0.15 km yr–1 across the Holocene (Figure S1B). The analysis of the range expansion for the centroid (Figure S2B) suggests that the population build-up of the simulated Fagus sylvatica was rather slow across the Holocene and, thus, delayed the expansion of the leading edge. On the other hand, the pollen-derived migration rates and current distribution of the semi-Mediterranean Quercus pubescens in Europe (Lang et al., 2023) are closer to the establishment pattern simulated under dispersal limitation (Figure 3B), while free dispersal overestimates its contemporary range (Figure 3A). Similarly, the two Mediterranean evergreen Quercus spp. show a larger distribution range by the end of the simulation under free dispersal than currently observed (Lang et al., 2023). For example, fossil records suggest that Quercus ilex stopped or significantly slowed down its expansion in the Iberian peninsula across the MH/LH due to aridification (Lang et al., 2023), whereas free dispersal simulated a complete range filling for this region by the BA/EH (Figure 3A). Conversely, the dispersal limitation mode missed the Iberian expansion altogether (Figure 3B).
The delayed range expansion or incomplete range filling in the simulation with dispersal limitation suggest that these species first needed to grow in abundance at a site before effectively spreading beyond their range (cf. Figure S1B with Figure S2B), which might have considerably slowed-down the migration process. Beside intrinsic low growth (and dispersal ability; discussed above), slow population build-up (and spread) in our model framework may be caused by (1) sub-optimal climate, (2) strong competition, and/or (3) topographic barriers to dispersal.
• (1a) A cooler climatic input than historical records, or (1b) an incorrectly parametrized climatic niche might have caused a sub-optimal growth and hence a delayed spread. For instance, our climate input (Figure 1) does not include the mid-Holocene global warming (ca. +0.5°C) known as Holocene Thermal Maximum (Liu et al., 2014), which might have accelerated the spread of warmth-demanding species such as Fagus sylvatica. (1b) Additionally, an incorrect parametrization of the bioclimatic limits might have made the simulated species more warmth-demanding (or less drought tolerant) and restricted their potential establishment (e.g. Quercus ilex in Figure 3). Indeed, it is possible that after millennia of extreme cold (LGM) and fluctuating temperatures species might have adapted a wider climatic niche and specifically a higher tolerance to cold temperatures (Liu et al., 2020; Bennett et al., 2021). In our study, we used static parameters to define species’ climatic niches (Table S2), and derived values according to contemporary distributions, which, as we have seen in the case of some taxa, may not be in equilibrium with the climate. As the model used in this study does not include the concept of niche evolution, we suggest to parametrize bioclimatic limits based on paleo-environmental conditions at points of low climate-vegetation disequilibrium (i.e. not during P-BA and P-YD).
• (2) Competition under dispersal limitation might have affected in particular LH spreaders, which include all of the tree species with a delayed spread. Although we observed higher competitive pressure under free dispersal (Figure 6), the establishment and spread of species simulated under the dispersal limitation mode are more susceptible to competition due to delayed growth and hence seed production, and the potential loss of a spreading source by local die-out. (2a) It should also be noted that the parametrization procedure of the migration module assumed an ideal simulation domain with optimal climate and the early-successional Betula pendula as the sole competitor (Zani et al., 2022). Thus, the fitted migration rates are rather conservative estimates and expected to decrease under less ideal conditions as, for instance, the rapidly changing paleo-climate and multiple competitors used in this study. In this sense, a re-fit of the dispersal parameters with multiple and/or stronger competitors than Betula pendula (Figure S5) may yield higher spreading rates across the MH/LH. (2b) A missing driver of post-glacial vegetation dynamic might have also impacted the degree of competition for some LH spreaders. A likely candidate is the anthropogenic impact on European forests after the Neolithic Revolution (>7–6 ka BP) (Bocquet-Appel, 2011) either by landscape clearance or tree planting for cultivation (Kalis et al., 2003; Nascimento et al., 2022). Species positively affected by human activities include the deciduous Quercus spp. (used as staple food or for wood constructions) and Fagus sylvatica (favored by climate amelioration and landscape clearance of disturbance-sensitive competitors, such as Abies alba and Tilia in southern and central Europe and Picea in southern Scandinavia) (Tinner and Lotter, 2006; López-Merino et al., 2008; Valsecchi et al., 2008; Lang et al., 2023).
• (3) Finally, we observed a similar bias in the spatial pattern of post-glacial establishment for some species under dispersal limitation, i.e. a consistent delayed establishment in the area north of the Alps, or, in an extreme case, a failure to move beyond the mountains for Quercus robur or Fagus sylvatica (Figure 3B). This suggests that the Alps acted as a dispersal barrier in our dispersal limitation mode. Contrary to this, paleobotanical and genetic studies (Magri et al., 2006; Magri, 2008) show that a number of species (e.g. Fagus sylvatica) managed to survive the coldest and driest periods of the OD at mid-elevations in the Alps, where environmental conditions were not too severe (Lang et al., 2023). This failure to establish and/or cross over the Alps in our simulation with dispersal limitation may likely explain the low spreading rates and range filling for some species, and especially for Quercus robur and Fagus sylvatica. Although we provided corridors to allow for migration across the Alps in our simulation domain, it is possible that the spatial resolution was still too coarse or (1b) the bioclimatic limits were not adequately parametrized to capture the microclimate that would have enabled the species to cross the Alps or to establish and persist in glacial refugia.
5 Conclusions
Our study demonstrates that the post-glacial forest of Europe experienced multi-millennial lags in the response to rapid warming, and that this climate-vegetation disequilibrium can be captured by a model implementing spatially-explicit migration dynamics. However, not all post-glacial expanding species experienced substantial migration lags. Migration lags had higher magnitude for less cold-tolerant (or warmth-demanding) tree taxa with a relatively low dispersal ability (e.g. low seed production and/or slow growth). On the other hand, tree taxa with pioneer characteristics (e.g. cold tolerance and high dispersal rates and seed production in Pinus sylvestris) experienced almost no migration lag. The mismatch between the appearance of suitable habitats and range filling has already been observed not only in post-glacial periods (Herzschuh et al., 2016; Talluto et al., 2017; Rumpf et al., 2019) but also in recent decades for a number of species (Lenoir et al., 2020), and especially in northern edge limits and ecotone transitions (Vissault et al., 2020; Boisvert-Marsh et al., 2022). Thus, the inclusion of dispersal limitation and migration constraints in vegetation models would likely improve the prediction of tree range shifts in the future.
Data availability statement
The datasets presented in this study can be found in online repositories.The model LPJ-GM 2.0 (LPJ-GUESS 4.0 coupled to a dynamic migration module) was used for the simulations presented in the study. The model code can be found in the Zenodo repository: https://doi.org/10.5281/zenodo.8434850. The model LPJ-GM 2.0 is distributed under the Mozilla Public License 2.0. This applies to all versions of LPJ-GUESS. The instruction file and grid list used to run the simulations presented in the study can be found in the Supplement. The input temperature and simulation outputs analyzed in this study can be found in DataGuru repositories: yearly temperature and land mask (https://doi.org/10.18161/zani2023_postlgmeu_temperature_landmask). The temperature velocity calculated at half-degree resolution and each 100 years across the simulation domain (https://doi.org/10.18161/climatevelocity_18.5_0_kabp). LPJ-GM simulated LAI as 19 pairs of 1,000 years time slices (50 years averages at 0.01 degrees resolution) for the free dispersal mode (FreeDisp) and the dispersal limitation mode (LimDisp) (https://doi.org/10.18161/lpjgdisp). LPJ-GM simulated LAI averaged at 0.5 degrees and 100 years resolution for range shift calculations (https://doi.org/10.18161/rangeshift). The datasets generated in this study and the R scripts used to generate all figures and datasets can be found in the DataGuru repository: https://doi.org/10.18161/zani2023_postlgmeu_supplementb. Full climate and landscape data were provided by Armstrong et al. (2019) and can be found in the public repository: https://doi.org/10.5285/4ca242208e904efe830af45f1697f730.
Author contributions
DZ: Formal Analysis, Investigation, Methodology, Software, Visualization, Writing – original draft. HL: Conceptualization, Funding acquisition, Project administration, Resources, Supervision, Writing – review & editing. VL: Conceptualization, Funding acquisition, Project administration, Resources, Supervision, Writing – review & editing, Methodology.
Funding
The author(s) declare financial support was received for the research, authorship, and/or publication of this article. This research has been supported by the SNF (Schweizerischer Nationalfonds zur Förderung der Wissenschaftlichen Forschung), grant no. Project “EXTRAS” 205320M 182609 with computing resources at the Swiss National Supercomputing Centre (CSCS) under project ID s1117 as well as computing resources provided by Center for scientific and technical computing at Lund University (LUNARC).
Conflict of interest
The authors declare that the research was conducted in the absence of any commercial or financial relationships that could be construed as a potential conflict of interest.
Publisher’s note
All claims expressed in this article are solely those of the authors and do not necessarily represent those of their affiliated organizations, or those of the publisher, the editors and the reviewers. Any product that may be evaluated in this article, or claim that may be made by its manufacturer, is not guaranteed or endorsed by the publisher.
Supplementary material
The Supplementary Material for this article can be found online at: https://www.frontiersin.org/articles/10.3389/fevo.2023.1321104/full#supplementary-material
References
Allen J. R. M., Hickler T., Singarayer J. S., Sykes M. T., Valdes P. J., Huntley B. (2010). Last glacial vegetation of Northern Eurasia. Quaternary Sci. Rev. 29 (19–20), 2604–2618. doi: 10.1016/j.quascirev.2010.05.031
Alsos G. I., Rijal D. P., Ehrich D., Karger D. N., Yoccoz N. G., Heintzman P. D., et al. (2022). Postglacial species arrival and diversity buildup of northern ecosystems took millennia. Sci. Adv. 8. doi: 10.1126/sciadv.abo7434
Armstrong E., Hopcroft P. O., Valdes P. J. (2019). A simulated Northern Hemisphere terrestrial climate dataset for the past 60,000 years. Sci. Data 6 (1). doi: 10.1038/s41597-019-0277-1
Bennett J. M., Sunday J., Calosi P., Villalobos F., Molina-Venegas R., Araújo M. B., et al. (2021). The evolution of critical thermal limits of life on Earth. Nat. Commun. 12 (1), 1198. doi: 10.1038/s41467-021-21263-8
Birks H. J. B. (2019). Contributions of Quaternary botany to modern ecology and biogeography. Plant Ecol. Diversity 12 (3–4), 189–385. doi: 10.1080/17550874.2019.1646831
Bocquet-Appel J.-P. (2011). When the world’s population took off: the springboard of the Neolithic Demographic Transition. Science 333 (6042), 560–561 doi: 10.1126/science.1208880
Boisvert-Marsh L. (2020). Patterns and processes affecting northward migration of tree species in a changing climate [dissertation/PhD thesis]. [Montreal]: McGill University.
Boisvert-Marsh L., Pedlar J. H., de Blois S., Le Squin A., Lawrence K., McKenney D. W., et al. (2022). Migration-based simulations for Canadian trees show limited tracking of suitable climate under climate change. Diversity Distributions 28 (11), 2330–2348. doi: 10.1111/ddi.13630
Cao X., Tian F., Dallmeyer A., Herzschuh U. (2019a). Northern Hemisphere biome changes (>30°N) since 40 cal ka BP and their driving factors inferred from model-data comparisons. Quaternary Sci. Rev. 220, 291–309. doi: 10.1016/j.quascirev.2019.07.034
Cao X., Tian F., Li F., Gaillard M. J., Rudaya N., Xu Q., et al. (2019b). Pollen-based quantitative land-cover reconstruction for northern Asia covering the last 40 ka cal BP. Climate Past 15 (4), 1503–1536. doi: 10.5194/cp-15-1503-2019
Cheddadi R., Vendramin G. G., Litt T., François L., Kageyama M., Lorentz S., et al. (2006). Imprints of glacial refugia in the modern genetic diversity of Pinus sylvestris. Global Ecol. Biogeography 15 (3), 271–282. doi: 10.1111/j.1466-822X.2006.00226.x
Corlett R. T., Westcott D. A. (2013). Will plant movements keep up with climate change? Trends Ecol. Evol. 28 (8), 482–488. doi: 10.1016/j.tree.2013.04.003
Dallmeyer A., Kleinen T., Claussen M., Weitzel N., Cao X., Herzschuh U. (2022). The deglacial forest conundrum. Nat. Commun. 13 (1). doi: 10.1038/s41467-022-33646-6
Fordham D. A., Jackson S. T., Brown S. C., Huntley B., Brook B. W., Dahl-Jensen D., et al. (2020). Using paleo-archives to safeguard biodiversity under climate change. Science 369 (6507). doi: 10.1126/science.abc5654
García Molinos J., Burrows M. T., Poloczanska E. S. (2017). Ocean currents modify the coupling between climate change and biogeographical shifts. Sci. Rep. 7 (1). doi: 10.1038/s41598-017-01309-y
García Molinos J., Schoeman D. S., Brown C. J., Burrows M. T. (2019). VoCC: An r package for calculating the velocity of climate change and related climatic metrics. Methods Ecol. Evol. 10 (12), 2195–2202. doi: 10.1111/2041-210X.13295
Gerten D., Schaphoff S., Haberlandt U., Lucht W., Sitch S. (2004). Terrestrial vegetation and water balance—hydrological evaluation of a dynamic global vegetation model. J. Hydrology 286 (1–4), 249–270. doi: 10.1016/j.jhydrol.2003.09.029
Giesecke T., Brewer S. (2018). Notes on the postglacial spread of abundant European tree taxa. Vegetation History Archaeobotany 27 (2), 337–349. doi: 10.1007/s00334-017-0640-0
Giesecke T., Brewer S., Finsinger W., Leydet M., Bradshaw R. H. W. (2017). Patterns and dynamics of European vegetation change over the last 15,000 years. J. Biogeography 44 (7), 1441–1456. doi: 10.1111/jbi.12974
Githumbi E., Fyfe R., Gaillard M. J., Trondman A. K., Mazier F., Nielsen A. B., et al. (2022). European pollen-based REVEALS land-cover reconstructions for the Holocene: Methodology, mapping and potentials. Earth System Sci. Data 14 (4), 1581–1619. doi: 10.5194/essd-14-1581-2022
Herzschuh U., Birks H. J. B., Laepple T., Andreev A., Melles M., Brigham-Grette J. (2016). Glacial legacies on interglacial vegetation at the Pliocene-Pleistocene transition in NE Asia. Nat. Commun. 7 (1), 11967. doi: 10.1038/ncomms11967
Hickler T., Vohland K., Feehan J., Miller P. A., Smith B., Costa L., et al. (2012). Projecting the future distribution of European potential natural vegetation zones with a generalized, tree species-based dynamic vegetation model. Global Ecol. Biogeography 21 (1), 50–63. doi: 10.1111/j.1466-8238.2010.00613.x
Huntley B., Allen J. R. M., Collingham Y. C., Hickler T., Lister A. M., Singarayer J., et al. (2013). Millennial climatic fluctuations are key to the structure of last glacial ecosystems. PloS One 8 (4). doi: 10.1371/journal.pone.0061963
Huntley B., Birks H. J. B. (1983). An atlas of past and present pollen maps for Europe: 0-13000 BP (Cambridge-London-New York-New Rochelle-Melbourne-Sydney: Cambridge University Press).
Jezkova T., Wiens J. J. (2016). Rates of change in climatic niches in plant and animal populations are much slower than projected climate change. Proc. R. Soc. B: Biol. Sci. 283 (1843), 20162104. doi: 10.1098/rspb.2016.2104
Kalis A. J., Merkt J., Wunderlich J. (2003). Environmental changes during the Holocene climatic optimum in central Europe-human impact and natural causes. Quaternary Sci. Rev. 22 (1), 33–79. doi: 10.1016/S0277-3791(02)00181-6
Lang G., Ammann B., Behre K.-E., Tinner W. (2023). Quaternary vegetation dynamics of europe. Haupt, Bern, Switzerland.
Latałowa M., van der Knaap W. O. (2006). Late Quaternary expansion of Norway spruce Picea abies (L.) Karst. in Europe according to pollen data. Quaternary Sci. Rev. 25 (21–22), 2780–2805. doi: 10.1016/j.quascirev.2006.06.007
Lehsten V., Mischurow M., Lindström E., Lehsten D., Lischke H. (2019). LPJ-GM 1.0: Simulating migration efficiently in a dynamic vegetation model. Geoscientific Model. Dev. 12 (3), 893–908. doi: 10.5194/gmd-12-893-2019
Lenoir J., Bertrand R., Comte L., Bourgeaud L., Hattab T., Murienne J., et al. (2020). Species better track climate warming in the oceans than on land. Nat. Ecol. Evol. 4 (8), 1044–1059. doi: 10.1038/s41559-020-1198-2
Liu H., Ye Q., Wiens J. J. (2020). Climatic-niche evolution follows similar rules in plants and animals. Nat. Ecol. Evol. 4 (5), 753–763. doi: 10.1038/s41559-020-1158-x
Liu Z., Zhu J., Rosenthal Y., Zhang X., Otto-Bliesner B. L., Timmermann A., et al. (2014). The Holocene temperature conundrum. Proc. Natl. Acad. Sci. 111 (34), E3501–E3505. doi: 10.1073/pnas.1407229111
Loarie S. R., Duffy P. B., Hamilton H., Asner G. P., Field C. B., Ackerly D. D. (2009). The velocity of climate change. Nature 462 (7276), 1052–1055. doi: 10.1038/nature08649
López-Merino L., López-Sáez J. A., Zapata M. B. R., García M. J. G. (2008). Reconstructing the history of beech (Fagus sylvatica L.) in the north-western Iberian Range (Spain): from Late-Glacial refugia to the Holocene anthropic-induced forests. Rev. Palaeobotany Palynology 152 (1–2), 58–65. doi: 10.1016/j.revpalbo.2008.04.003
Magri D. (2008). Patterns of post-glacial spread and the extent of glacial refugia of European beech (Fagus sylvatica). J. Biogeography 35 (3), 450–463. doi: 10.1111/j.1365-2699.2007.01803.x
Magri D., Vendramin G. G., Comps B., Dupanloup I., Geburek T., Gömöry D., et al. (2006). A new scenario for the Quaternary history of European beech populations: palaeobotanical evidence and genetic consequences. New Phytol. 171 (1), 199–221. doi: 10.1111/j.1469-8137.2006.01740.x
Nascimento M. N., Heijink B. M., Bush M. B., Gosling W. D., McMichael C. N. H. (2022). Early to mid-Holocene human activity exerted gradual influences on Amazonian forest vegetation. Philos. Trans. R. Soc. B 377 (1849), 20200498. doi: 10.1098/rstb.2020.0498
Neilson R. P., Pitelka L. F., Solomon A. M., Nathan R. A. N., Midgley G. F., Fragoso J. M. V., et al. (2005). Forecasting regional to global plant migration in response to climate change. Bioscience 55 (9), 749–759. doi: 10.1641/0006-3568(2005)055[0749:FRTGPM]2.0.CO;2
Normand S., Ricklefs R. E., Skov F., Bladt J., Tackenberg O., Svenning J. C. (2011). Postglacial migration supplements climate in determining plant species ranges in Europe. Proc. R. Soc. B: Biol. Sci. 278 (1725), 3644–3653. doi: 10.1098/rspb.2010.2769
Ordonez A., Williams J. W. (2013). Climatic and biotic velocities for woody taxa distributions over the last 16 000 years in eastern North America. Ecol. Lett. 16 (6), 773–781. doi: 10.1111/ele.12110
Osman M. B., Tierney J. E., Zhu J., Tardif R., Hakim G. J., King J. (2021). Globally resolved surface temperatures since the Last Glacial Maximum. Nature 599 (7884), 239–244. doi: 10.1038/s41586-021-03984-4
Pecl G. T., Araújo M. B., Bell J. D., Blanchard J., Bonebrake T. C., Chen I. C., et al. (2017). Biodiversity redistribution under climate change: Impacts on ecosystems and human well-being. Science 355 (6332). doi: 10.1126/science.aai9214
Petit R. J., Brewer S., Bordács S., Burg K., Cheddadi R., Coart E., et al. (2002). Identification of refugia and post-glacial colonisation routes of European white oaks based on chloroplast DNA and fossil pollen evidence. For. Ecol. Manage. 156 (1–3), 49–74. doi: 10.1016/S0378-1127(01)00634-X
Pugh T. A. M., Lindeskog M., Smith B., Poulter B., Arneth A., Haverd V., et al. (2019). Role of forest regrowth in global carbon sink dynamics. Proc. Natl. Acad. Sci. 116 (10), 4382–4387. doi: 10.1073/pnas.1810512116
Renssen H., Isarin R. F. B. (2001). The two major warming phases of the last deglaciation at ; 14.7 and ; 11.5 ka cal BP in Europe: climate reconstructions and AGCM experiments. Global Planetary Change 30. doi: 10.1016/S0921-8181(01)00082-0
Román-Palacios C., Wiens J. J. (2020). Recent responses to climate change reveal the drivers of species extinction and survival. PNAS 117 (8), 4211–4217. doi: 10.5061/dryad.4tmpg4f5w
Rumpf S. B., Hülber K., Wessely J., Willner W., Moser D., Gattringer A., et al. (2019). Extinction debts and colonization credits of non-forest plants in the European Alps. Nat. Commun. 10 (1), 4293. doi: 10.1038/s41467-019-12343-x
Scherstjanoi M., Kaplan J. O., Poulter B., Lischke H. (2014). Challenges in developing a computationally efficient plant physiological height-class-structured forest model. Ecol. Complexity 19, 96–110. doi: 10.1016/j.ecocom.2014.05.009
Sitch S., Smith B., Prentice I. C., Arneth A., Bondeau A., Cramer W., et al. (2003). Evaluation of ecosystem dynamics, plant geography and terrestrial carbon cycling in the LPJ dynamic global vegetation model. Global Change Biol. 9 (2), 161–185. doi: 10.1046/j.1365-2486.2003.00569.x
Smith B., Prentice I. C., Sykes M. T. (2001). Representation of vegetation dynamics in the modelling of terrestrial ecosystems: comparing two contrasting approaches within European climate space. Global Ecol. Biogeography 10 (6) 621–637. doi: 10.1046/j.1466-822X.2001.t01-1-00256.x
Smith B., Wårlind D., Arneth A., Hickler T., Leadley P., Siltberg J., et al. (2014). Implications of incorporating N cycling and N limitations on primary production in an individual-based dynamic vegetation model. Biogeosciences 11 (7), 2027–2054. doi: 10.5194/bg-11-2027-2014
Svenning J.-C., Sandel B. (2013). Disequilibrium vegetation dynamics under future climate change. Am. J. Bot. 100 (7), 1266–1286. doi: 10.3732/ajb.1200469
Svenning J.-C., Skov F. (2004). Limited filling of the potential range in European tree species. Ecol. Lett. 7 (7), 565–573. doi: 10.1111/j.1461-0248.2004.00614.x
Talluto M. V., Boulangeat I., Vissault S., Thuiller W., Gravel D. (2017). Extinction debt and colonization credit delay range shifts of eastern North American trees. Nat. Ecol. Evol. 1 (7), 182. doi: 10.1038/s41559-017-0182
Tinner W., Lotter A. F. (2006). Holocene expansions of Fagus silvatica and Abies alba in Central Europe: Where are we after eight decades of debate? Quaternary Sci. Rev. 25 (5–6), 526–549. doi: 10.1016/j.quascirev.2005.03.017
Valsecchi V., Finsinger W., Tinner W., Ammann B. (2008). Testing the influence of climate, human impact and fire on the Holocene population expansion of Fagus sylvatica in the southern Prealps (Italy). Holocene 18 (4), 603–614. doi: 10.1177/0959683608089213
Vissault S., Talluto M. V., Boulangeat I., Gravel D. (2020). Slow demography and limited dispersal constrain the expansion of north-eastern temperate forests under climate change. J. Biogeography 47 (12), 2645–2656. doi: 10.1111/jbi.13978
Walker M. J. C., Berkelhammer M., Björck S., Cwynar L. C., Fisher D. A., Long A. J., et al. (2012). Formal subdivision of the Holocene Series/Epoch: a Discussion Paper by a Working Group of INTIMATE (Integration of ice-core, marine and terrestrial records) and the Subcommission on Quaternary Stratigraphy (International Commission on Stratigraphy). J. Quaternary Sci. 27 (7), 649–659. doi: 10.1002/jqs.2565
Williams J. E., Blois J. L. (2018). Range shifts in response to past and future climate change: can climate velocities and species’ dispersal capabilities explain variation in mammalian range shifts? J. Biogeography 45 (9), 2175–2189. doi: 10.1111/jbi.13395
Williams J. W., Post D. M., Cwynar L. C., Lotter A. F., Levesque A. J. (2002). Rapid and widespread vegetation responses to past climate change in the North Atlantic region. Geology 30 (11), 971–974. doi: 10.1130/0091-7613(2002)030<0971:RAWVRT>2.0.CO;2
Keywords: dispersal, dynamic vegetation modeling, migration lag, paleovegetation, range shift
Citation: Zani D, Lischke H and Lehsten V (2023) Climate and dispersal limitation drive tree species range shifts in post-glacial Europe: results from dynamic simulations. Front. Ecol. Evol. 11:1321104. doi: 10.3389/fevo.2023.1321104
Received: 13 October 2023; Accepted: 20 November 2023;
Published: 05 December 2023.
Edited by:
Jiang Jiang, Nanjing Forestry University, ChinaReviewed by:
Diego Nieto-Lugilde, University of Cordoba, SpainJohn Birks, University of Bergen, Norway
Copyright © 2023 Zani, Lischke and Lehsten. This is an open-access article distributed under the terms of the Creative Commons Attribution License (CC BY). The use, distribution or reproduction in other forums is permitted, provided the original author(s) and the copyright owner(s) are credited and that the original publication in this journal is cited, in accordance with accepted academic practice. No use, distribution or reproduction is permitted which does not comply with these terms.
*Correspondence: Deborah Zani, ZGVib3JhaC56YW5pMDFAZ21haWwuY29t