 Jinyu Li
 Bang Zhang2,3,4†
 Shijun You
- 1Tea Research Institute, Fujian Academy of Agricultural Sciences, Fuzhou, China
- 2State Key Laboratory of Ecological Pest Control for Fujian and Taiwan Crops, Institute of Applied Ecology, Fujian Agriculture and Forestry University, Fuzhou, China
- 3Joint International Research Laboratory of Ecological Pest Control, Ministry of Education, Fuzhou, China
- 4Key Laboratory of Integrated Pest Management for Fujian-Taiwan Crops, Ministry of Agriculture, Fuzhou, China
Habitat suitability analysis using species distribution models (SDMs) presents a valuable approach for determining appropriate land utilization strategies and crop planting decisions, which are vital to achieve optimal agricultural productivity and ensure environmental sustainability in the context of rapid global change. Aside abiotic conditions, pests emerge as the most important biological factor affecting crop growth. It can be an effective avenue to comprehensively assess land use suitability by building and integrating SDMs for both crops and their pests. Using the MaxEnt model and a bivariate map, we predicted and integrated the habitat suitability of tea (Camellia sinensis) and its primary insect herbivore (Empoasca onukii) in China. Our study explicitly revealed spatial heterogeneity in suitability between the two species, despite finding that they shared common environmental predictors (i.e., temperature, elevation, and soil pH). Results support South China and Southwest China as the most favorable areas for tea cultivation, while highlighting the adverse climatic challenges on tea growth in the middle and lower reaches of the Yangtze River and in the northern regions of the Yangtze River. Meanwhile, analyses emphasize the necessity of sustainable leafhopper management strategies in the middle and lower reaches of the Yangtze River and in regions along the southeast coast. These findings demonstrate the significance of comparative analysis on the habitat suitability of both crops and insect herbivores, providing valuable insights for agricultural production planning and sustainable pest management. Furthermore, the methods employed in this study hold potential for the application in diverse context, ranging from the control of invasive species to the conservation of endangered biodiversity.
1 Introduction
As one of the most important cash crops, tea (Camellia sinensis) holds a position immense significance in rural development, poverty reduction, and food security in exporting and developing countries. It is cultivated extensively across more than 60 countries and regions (Gunathilaka and Tularam, 2016), resulting in a production of 6.2 million tonnes in 2021 (FAO, 2022). China remains by far the largest producer of tea, yielding 47 percent of global production (FAO, 2022). Tea plants are sensitive to the environments in which they are grown. Several environmental factors, including climate, soil pH, and elevation, are known to deeply affect the growth and development of tea (Han et al., 2018; Nowogrodzki, 2019). And tea plants survive habitats that satisfy their certain eco-physiological requirements. It is reported that tea plants require an ecological condition with temperature ranging from 13-26°C, a minimum annual rainfall of 1500-2000 mm and an average optimal relative humidity more than 70-75%, as well as acidic soil (optimal pH: 4.5–5.5) and elevation below 2000 m (Zhao et al., 2022; Ran et al., 2023). And apart from these abiotic requirements, insect pests are considered as another important factor restricting the growing of tea plants. Particularly, the tea green leafhopper, Empoasca onukii, poses a significant threat as the primary insect pest in tea plantations, leading to substantial reductions in tea yield and quality as well as annual economic losses ranging from 15% to 50% (Li et al., 2022). Variation of these abiotic and biotic factors above and below tea’s thresholds are expected in varied locations, which can initiate different physiological stress levels in tea plants, influence tea’s quality and yield, and thus determine how well and where tea plants grow. Moreover, global climate change is increasing temperature, altering precipitation level, shifting the timing of seasons, and encouraging insect pests, which are complicating habitat selection and geographic distribution pattern of tea plants (Nowogrodzki, 2019). Clearly, a comprehensive evaluation of habitat suitability for tea growth by combining the information of those abiotic factors and leafhopper effects is imperative to attain optimal tea productivity.
In the context of anthropogenic global change, appropriate land utilization and crop planting decisions, through a comprehensive assessment of habitat suitability for crop cultivation, are of great importance in attaining optimal land productivity and ensuring environmental sustainability (Baja et al., 2002). The Food and Agricultural Organization (FAO) has recommended a land suitability assessment approach for crops, which considers climatic conditions, terrain characteristics, and soil properties. Meanwhile, the application of species distribution models (SDMs) offers a promising avenue to model the potential distribution of suitable habitats for crops. Land suitability assessment based on the FAO criteria has been conducted in various regions worldwide for different crops (e.g., Jayasinghe et al., 2019). However, SDMs have gained increasing prominence in fields of conservation biology (Morera-Pujol et al., 2023), invasive biology (Qin et al., 2021), and the exploration of potential species range shifts in response to climate change (de Gabriel Hernando et al., 2021). Nevertheless, their utilization in determining land suitability for sustainable agricultural crop farming remains limited.
SDMs encompass a range of statistical methods, such as logistic regression and multivariate regression splines. Among them, maximum entropy (MaxEnt) serves as one of the most widely employed methods due to its ability to produce reliable results with small sample sizes, its adaptability in handling various types of variables, its effective noise reduction capabilities, superior performance, and user-friendly nature (Elith et al., 2006; Phillips et al., 2006). This method involves the integration of species occurrence records with environmental conditions to infer the ecological niches of species and their habitat suitability, enabling the identification of key factors influencing species distribution and their habitat preferences (Phillips et al., 2006). Numerous MaxEnt studies have currently been reported, with a predominant focus on abiotic factors such as climate, terrain, and soil properties. However, it is crucial to recognize that biological factors also play a key role in shaping species distribution (Qin et al., 2021; Newman et al., 2022). And as described previously, pests emerge as the most important biological factor affecting cultivation of crop like tea, as their feeding activities can significantly affect crop growth and even result in plant mortality. Evidently, quantifying the precise effect of pests and directly incorporating it as a factor in crop distribution models poses challenges. Furthermore, the relationship between crops and pests is intricate, as crops serve as host plants and food sources for pest populations, which, in turn, can affect the distribution of pests. This complexity makes it difficult to define and distinguish the interactions between these two entities. As a result, it can be regarded as an alternative and effective strategy that can model the suitable habitats for both crops and their pests and subsequently compare their spatial patterns. This approach not only facilitates land resource planning and decision-making in crop cultivation but also provides guidance for regional-scale pest management strategies.
For the tea system, recent studies have investigated the climate suitability of E. onukii in China and its potential range shifts in response to climate change using the MaxEnt model (Jiang et al., 2022). Meanwhile, several SDMs studies on tea plants have been conducted in several countries, including Kenya (Leshamta, 2017), Uganda (Muthee et al., 2015), India (Adhikari et al., 2015), Sri Lanka (Jayasinghe and Kumar, 2019; Jayasinghe et al., 2019), and globally (Zhang et al., 2019b), with the consideration of the available data of abiotic factors. In China, the climate suitability of tea has been assessed in specific provinces according to the FAO criteria (e.g. Li et al., 2012). Experts have also proposed agricultural zoning schemes for tea cultivation, based on local environmental conditions, as well as the biological and ecological requirements for tea plant growth (Chen and Yang, 2011). However, a comprehensive study encompassing the entire tea-growing regions of China that combines SDMs techniques with pest information to map land suitability for tea cultivation remains lacking. Recent studies have highlighted the continuous expansion of tea production and significant shifts in tea planting distribution across China (Xiao et al., 2018; Wu et al., 2020). Consequently, there is an urgent and vital demand to employ the SDMs to accurately predict and compare the suitable distributions of tea plants and their main pests throughout the entire tea-growing regions of China. Such endeavors will provide essential scientific evidence to guide tea planting expanding and management efforts.
In this study, we employed the MaxEnt model approach and a bivariate map for the following main objectives: (1) to predict the suitable ecological habitats and potential distribution of both tea plants and tea green leafhopper in China, (2) to perform a comparative analysis of the differences in habitat suitability between these two species, (3) to quantify and compare the relationship between ecological distribution and environmental variables for both species, with the aim of identifying the key factors that limit their distribution. The findings of this study will contribute to an enhanced comprehension of tea planting arrangement and provide valuable insights for pest management recommendations.
2 Materials and methods
2.1 Study area and species occurrence records
The study area covers the entire China, located between 3°51′ to 53°34′ North latitude and 73°33′ to 135°05′ East longitude, with a land area of approximately 9.60 million km2. The area exhibits a complex and highly diverse climate, characterized by distinct temperature zones spanning from tropical and subtropical in the south to temperate in the north (Su, 2020). The climate gradually transitions from humid to semi-humid, semi-arid, and arid as one moves from the southeastern coast to the northwestern inland areas. An additional climatic feature of the study area is the continental monsoon, characterized by cold and dry winters and hot and humid summers. Furthermore, the elevation varies gradually from sea level to 8,845 m above sea level. The study area also hosts a wide range of soils including red-yellow podzolic and reddish-brown laterictic soils (Han et al., 2018), which are conducive to tea plant growth. Notably, among the 34 provinces/regions in China, 22 possess tea-growing records with georeferenced information (Chen and Yang, 2011).
The species occurrence records of tea were obtained from a previous study on the global climatic suitability of tea (Zhang et al., 2019b). In contrast, occurrence records for the tea green leafhopper were sourced from three distinct channels: (1) field sampling (Li et al., 2022), (2) published literature (Li et al., 2013; Fu et al., 2014a; Fu et al., 2014b; Zhou et al., 2014; Chen et al., 2015; Zhang et al., 2019a), and (3) the Global Biodiversity Information Facility (GBIF.org). Due to the use of various scientific names for the tea green leafhopper in prior studies, such as E. flavescens, E. pirisuga, Jacobiasca formosana, E. vitis, and E. onukii (Qin et al., 2015), all of these names were employed to compile the occurrence records for the tea green leafhopper. In total, 858 occurrence points were collected for tea, while 211 points were obtained for the tea green leafhopper. Subsequently, these records underwent further investigations and manual verification using Google Earth Pro (Version 7.3.1, Google Inc.). The coordinates of these points within the study area were then extracted and recorded.
To address issues of spatial autocorrelation and sampling biases, the R package ‘spThin’ (Aiello-Lammens et al., 2015) was adopted for spatial thinning and resampling. A total of 100 iterations were performed with a distance threshold of 50 km to thin the occurrence points. Consequently, the MaxEnt model for tea comprised 286 occurrence points, while the leafhopper model included 114 occurrence points.
2.2 Environment data and preprocessing
It has been evidenced that the growth and distribution of species can be associated with a variety of environmental factors, such as climate, soil, topography, and vegetation. In this study, we focused on climate, elevation, and soil pH as the main variables for the MaxEnt models developed for both tea plants and leafhopper. These factors were selected based on their recognized significance in influencing tea growth dynamics, and additionally, their potential association with leafhopper populations. The soil pH was also used in modelling of leafhopper as it is the most important soil feature influencing tea plants growth (Han et al., 2018), and thereby potentially also shows effect on E. onukii performance and distribution.
Regarding climate, all of the 19 bioclimatic variables were considered and the gridded layers at 30-arc seconds were extracted from the WorldClim website (http://www.worldclim.org, bioclim; Fick and Hijmans, 2017; Table 1). Moreover, for elevation (Table 1), we included the 30-arc second elevation data extracted from the WorldClim website. This elevation data was derived from the SRTM and used to generate WorldClim 2.1. Soil pH data (at a 30 cm depth) was acquired from the ISRIC website (https://data.isric.org; Hengl et al., 2017; Table 1), To facilitate our analyses, the soil pH data was transformed to a 30-s resolution using the R package raster (Hijmans and van Etten, 2016).
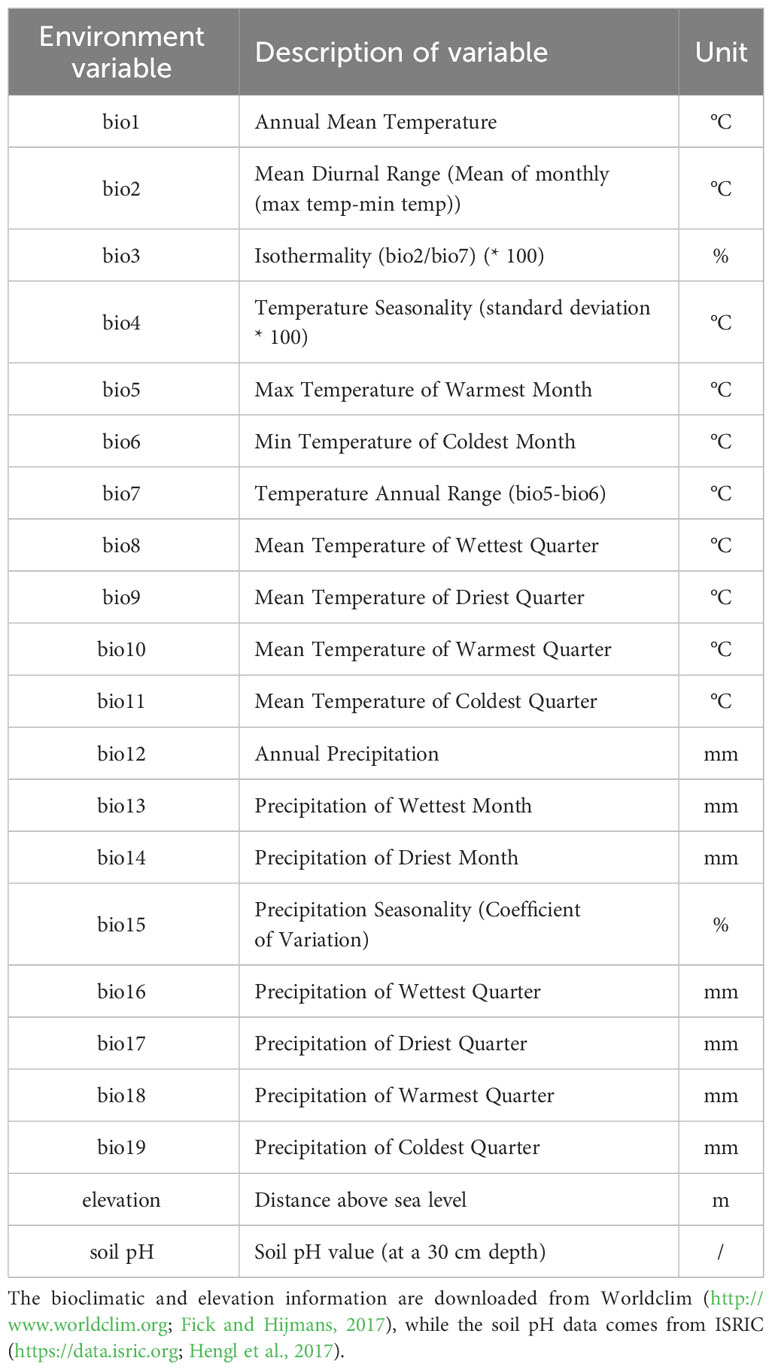
Table 1 The environmental variables used in this study.
The presence of multicollinearity among environmental variables can lead to overfitting of the model and hinder species-environment relationships analyses (Yoon and Lee, 2021).To address this issue, we employed correlation analyses using the raster.cor.matrix function in R package ENMTools (Warren et al., 2010).This approach aimed to identify a set of variables that exhibited low correlation (correlation coefficient |r| ≤ 0.8) while retaining ecologically and physiologically relevance to the species. Ultimately, we selected a set of nine variables for modelling purposes. These variables included mean diurnal range (bio2), isothermality (bio3), temperature seasonality (bio4), mean temperature of coldest quarter (bio11), precipitation of wettest month (bio13), and precipitation of driest month (bio14), precipitation seasonality (bio15), elevation, and soil pH.
2.3 MaxEnt modelling
The MaxEnt 3.3 (Phillips et al., 2006) was adopted to model the potential geographic distributions of tea and tea green leafhopper independently using 286 (tea) and 211 (leafhopper) occurrence points, along with nine environmental variables. To determine the optimal model tuning parameters, we utilized the R package ENMeval (Muscarella et al., 2014). Specifically, the regularization multiplier (RM) values were varied from 1 to 4 (incremented by 1), and six feature class (FC) combinations were evaluated (L, H, LQ, LQH, LQHP, LQHPT; L, linear; Q, quadratic; H, hinge; P, product; T, threshold). This process resulted in a total of 24 parameter combinations being tested. The RM value and FC combination with a test delta.AICc value of 0 were considered as the optimal model tuning parameters and were subsequently utilized in the model. During the modeling process, 75% of the occurrence points were randomly assigned as training data, while the remaining 25% served as testing data. To ensure the accuracy of the model, 10 replications were performed with 10,000 background points.
Model performance was evaluated by the true skill statistic (TSS)and the area under the receiver operating curve (AUC), which were calculated by averaging the TSS and AUC values obtained from the 10 replicated runs, respectively. The AUC value of each run was automatically generated by MaxEnt. AUC is a standard and threshold-independent metric frequently used to evaluate the model performance, with value ranging from 0 to 1. An AUC value below 0.5 points to a model predicting no better than random, and higher value, up to a maximum value of 1, suggest a much better model performance (Kebede et al., 2014; Adhikari et al., 2023). In comparison, TSS is a threshold-dependent method used to evaluate model performance of discerning suitable areas for species occurrence. Its value ranges from -1 to 1, with values of zero or less indicating a performance no better than chance and value of 1 pointing towards perfect agreement (Hong et al., 2021; Adhikari et al., 2023). Here, the TSS value of each run was estimated using the R script called ‘MaxEnt_TSS_calculations’ (Catharina, 2019) based on the outputs of modelling. And the maximum training sensitivity plus specificity threshold which accounts both presence and absence was selected to estimate the TSS value since the sensitivity-specificity sum maximization approach has been evidenced as a good one to determine thresholds (Liu et al., 2005; Vale et al., 2014). Furthermore, the relative contribution of each environmental variable to the model can also be estimated and reported with the use of Jackknife testing.
2.4 Reclassification and area statistics
The MaxEnt model generated a digital map of China based on a logistic output format which showed the values of habitat suitability index (HSI), ranging from 0 to 1. To facilitate further analysis, the map was imported into ArcGIS 10.6 for rasterization, visualization, reclassification, and area calculation. The habitat suitability was reclassified into four categories: (1) unsuitable habitat: 0.00–0.20; (2) low suitable habitat: 0.20–0.40; (3) moderately suitable habitat: 0.40–0.60; and (4) highly suitable habitat: 0.60–1.00. Subsequently, the areas were calculated for each type of habitat in different provinces.
2.5 Integrating habitat suitability models of tea and leafhopper
A bivariate map depicting the predicted suitability models of tea and leafhopper was created using R packages “raster”, “rgdal” (Bivand et al., 2019), “classInt” (Bivand, 2018), and “XML” (Lang and the CRAN Team, 2019). The habitat suitability models for tea and leafhopper were projected onto the bivariate map, allowing for the visualization of heterogeneous spatial patterns. To create the bivariate map, both the habitat suitability model projections for tea and leafhopper were scaled from zero to one. This scaling was essential to ensure the comparability of units and enable the calculation of 10% quantiles for the bivariate map. The final bivariate color matrix consisted of breaks based on the 10% quantiles derived from the habitat suitability model of tea on one axis and that of leafhopper on the other axis.
3 Results
3.1 Model optimization and accuracy evaluation
ENMeval tests revealed that the model of tea achieved a delta.AICc value of 0 when the RM was set to 3 and the FC combination was LQHPT. Similarly, for the model of leafhopper, the delta. AICc value reached 0 with RM = 1 and the FC combination being LQ. Hence, these optimized RM and FC parameters were employed for the respective MaxEnt models. The mean AUC values, averaged over 10 replications, were 0.879 (SD = 0.009) for tea (Figure 1A and 0.904 (SD = 0.026) for leafhopper (Figure 1B), pointing towards an overall favorable ratio between sensitivity (low false negatives) and specificity (low false positives). The mean TSS values of all 10 runs were 0.733 (SD = 0.004) and 0.753 (SD = 0.007) for tea and leafhopper, respectively, showing that the models were both sensitive and specific in identifying presence and absence points based on the threshold.
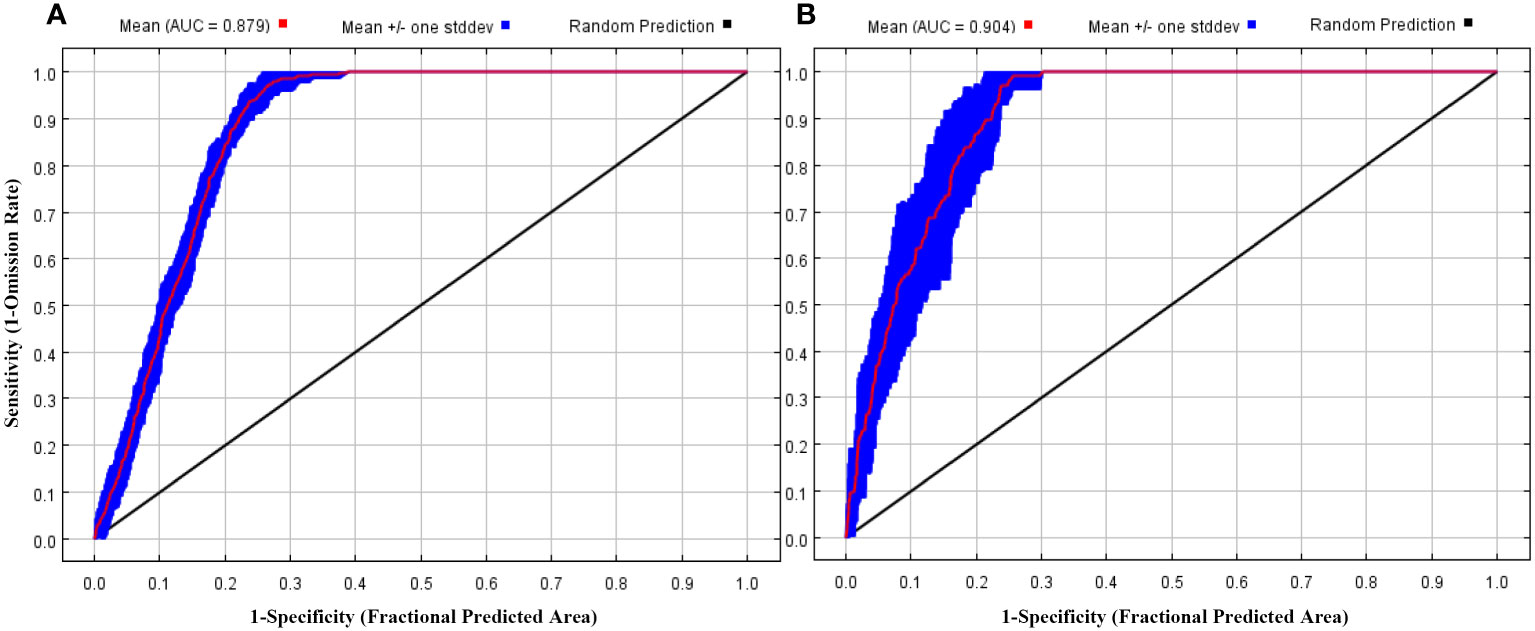
Figure 1 The receiver operating characteristic (ROC) curve and AUC values of the MaxEnt models on Camellia sinensis (A) and Empoasca onukii (B).
3.2 Contribution of environmental variables
The jackknife method was adopted to assess the contribution of each environmental variable, with the consideration of values above 10.00% as key factors affecting the distribution of tea and leafhopper. Analyses (Table 2; Supplementary Figure S1) indicated that tea and leafhopper shared three common key environmental factors, including bio11, bio2, and soil pH. Moreover, elevation was also important (with a contributing percentage of 18.05%; Table 2) in the distribution of leafhopper, while it was not a key factor (with a contributing percentage of 4.01%; Table 2) related with tea distribution. These key variables accounted for 85.66% and 90.69% of the predictive power in determining the distribution of tea and leafhopper, respectively. Notably, bio11 and bio2 emerged as the top two leading variables for both tea and leafhopper. Response curves (Figure 2) further reflected the quantitative relationship between the predicted probability of habitat suitability and environmental variables. We observed similar curves for tea and leafhopper, indicating high probabilities of suitability predicted when bio11 exceeded 5°C, bio2 ranged from 2°C–10°C, soil pH exhibited a range from 4 to 7, and elevation remained below 1000 m.
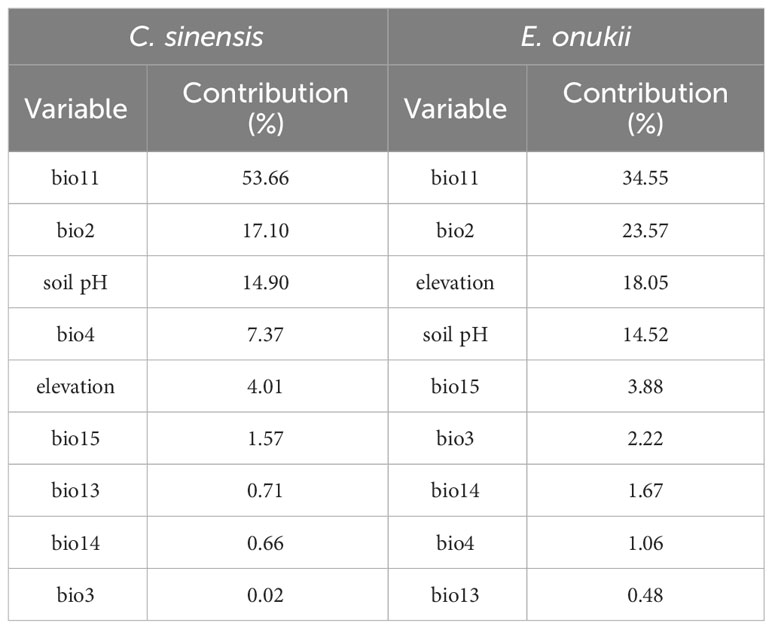
Table 2 The percent contribution of each environmental variable to the distribution of Camellia sinensis and Empoasca onukii reported by the MaxEnt models.
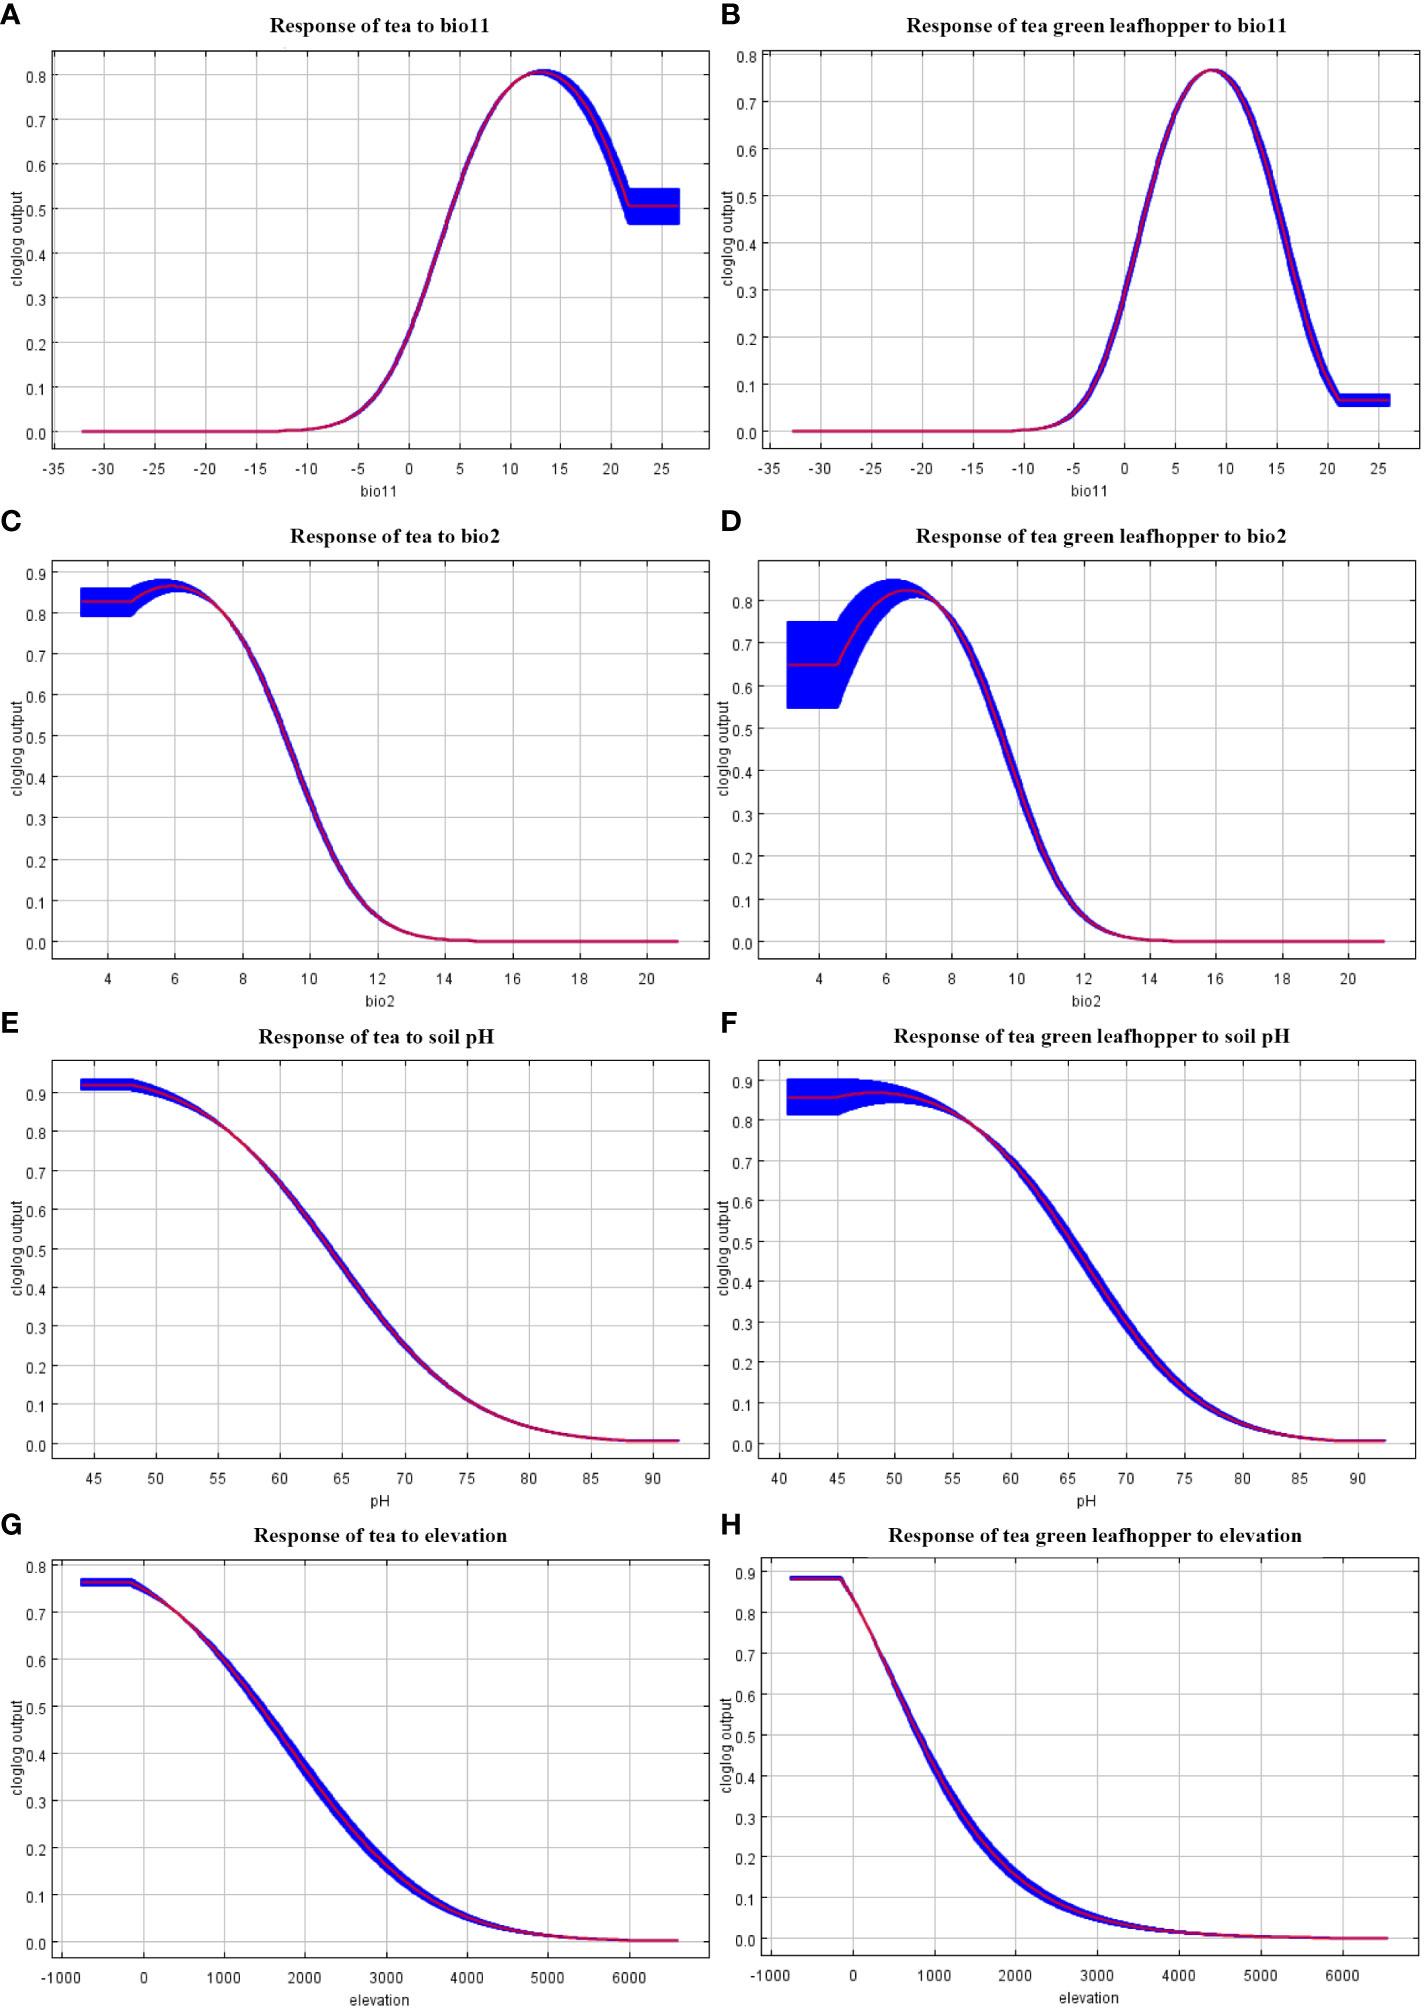
Figure 2 The marginal response curves of tea and four key environmental variables including in habitat distribution models of tea (A, C, E, G) and tea green leafhopper (B, D, F, H). The habitat suitability of tea and leafhopper in varying degrees with (A, B) mean temperature of coldest quarter (bio11), (C, D) mean diurnal range (bio2), (E, F) soil pH, (G, H) elevation.
3.3 Habitat suitability distribution
For tea, the modelling (Figures 3A, C, 4A) demonstrated a suitable habitat area (HIS>0.4, moderately and highly suitable habitat) of 205.96×10⁴ km2, accounting for 21.45% of China’s total area. Specifically, the predicted highly suitable habitat covered an area of 135.80×10⁴ km2, accounting for 65.94% of the suitable habitat area, as well as being mainly located in southwestern regions (e.g., Yunnan, Chongqing, Guizhou, and eastern Sichuan) and certain regions south of the Yangtze River (e.g., Guangxi, Fujian, Guangdong, Hainan, southern Zhejiang, southern Jiangxi, and southern Hunan). The moderately and low suitable habitats encompassed areas of 70.16×10⁴ km2 and 32.53×10⁴ km2, respectively.
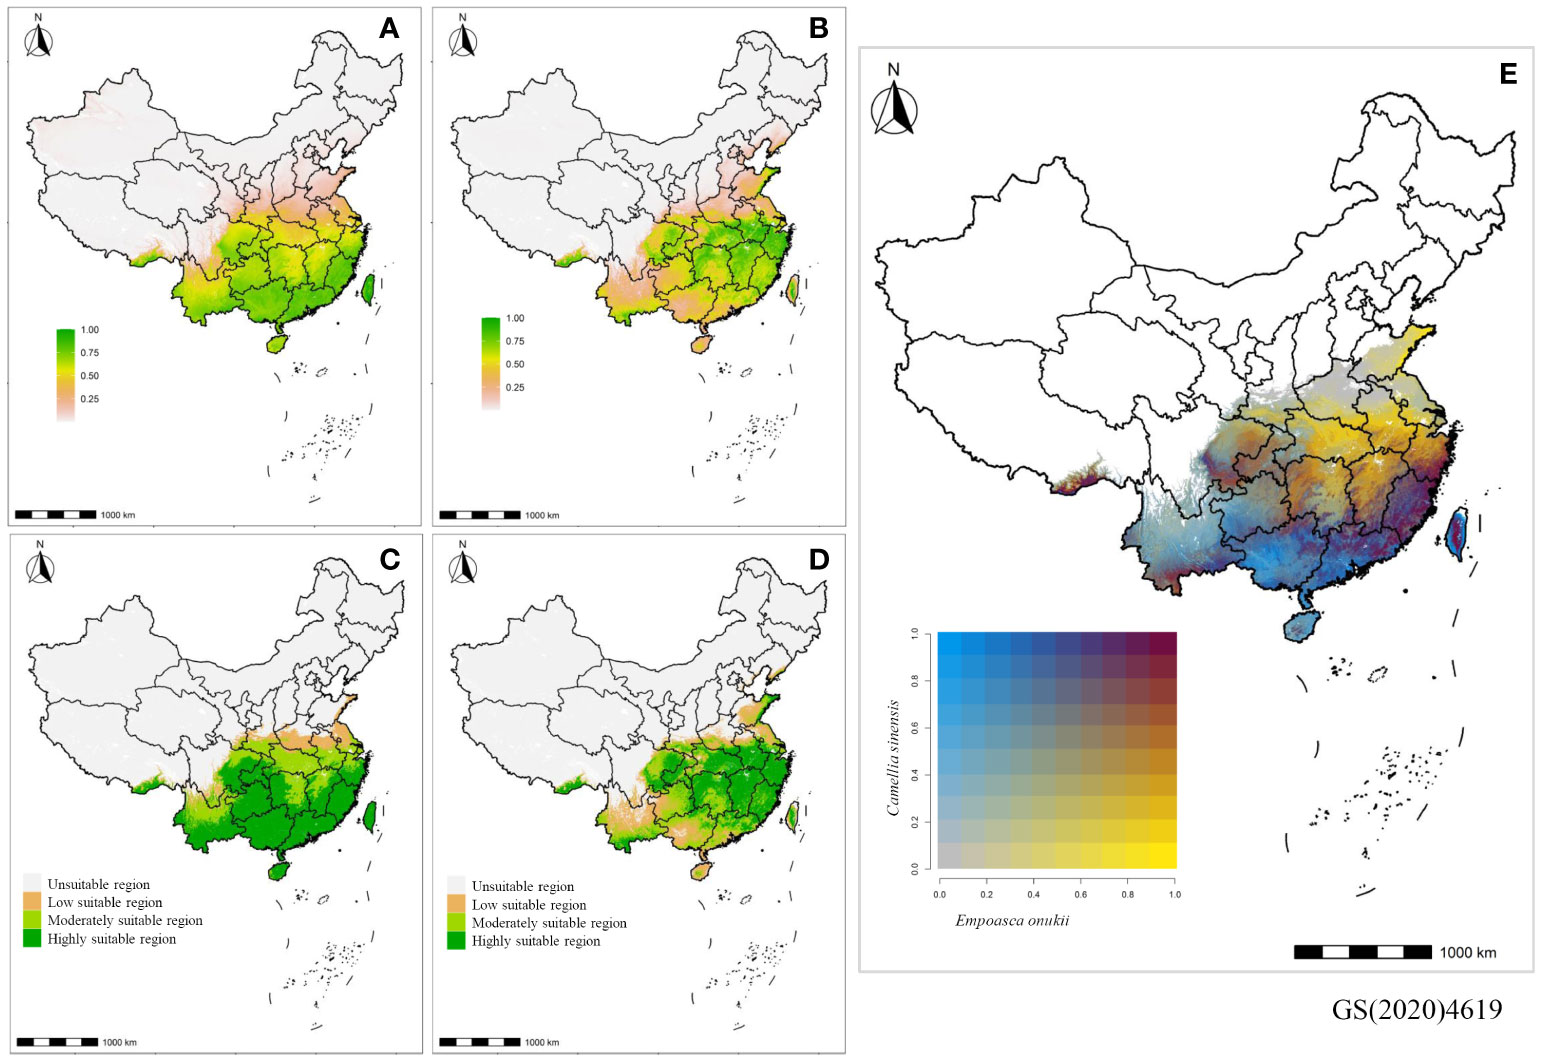
Figure 3 Projected distribution maps of Camellia sinensis (A, C) and Empoasca onukii (B, D) showing probability that conditions are suitable predicted by MaxEnt models. (A, B) The probability of suitable conditions are shaded from high (yellow-green) to low (white-carnation). (C, D) The unsuitable (white), low suitable (carnation), moderately suitable (chartreuse), and highly suitable (green) regions that are classified based on the predicted probability. (E) The bivariate map showing habitat suitability of E. onukii versus C. sinensis. To make the habitat suitability of C. sinensis and E. onukii comparable and more clearly present the common suitably-distributed regions of them, comparisons were not made in the broad regions of North China (white) where both of C. sinensis and E. onukii were expected to be absent, with probability of presence values less than ten percent in the suitability model projection.
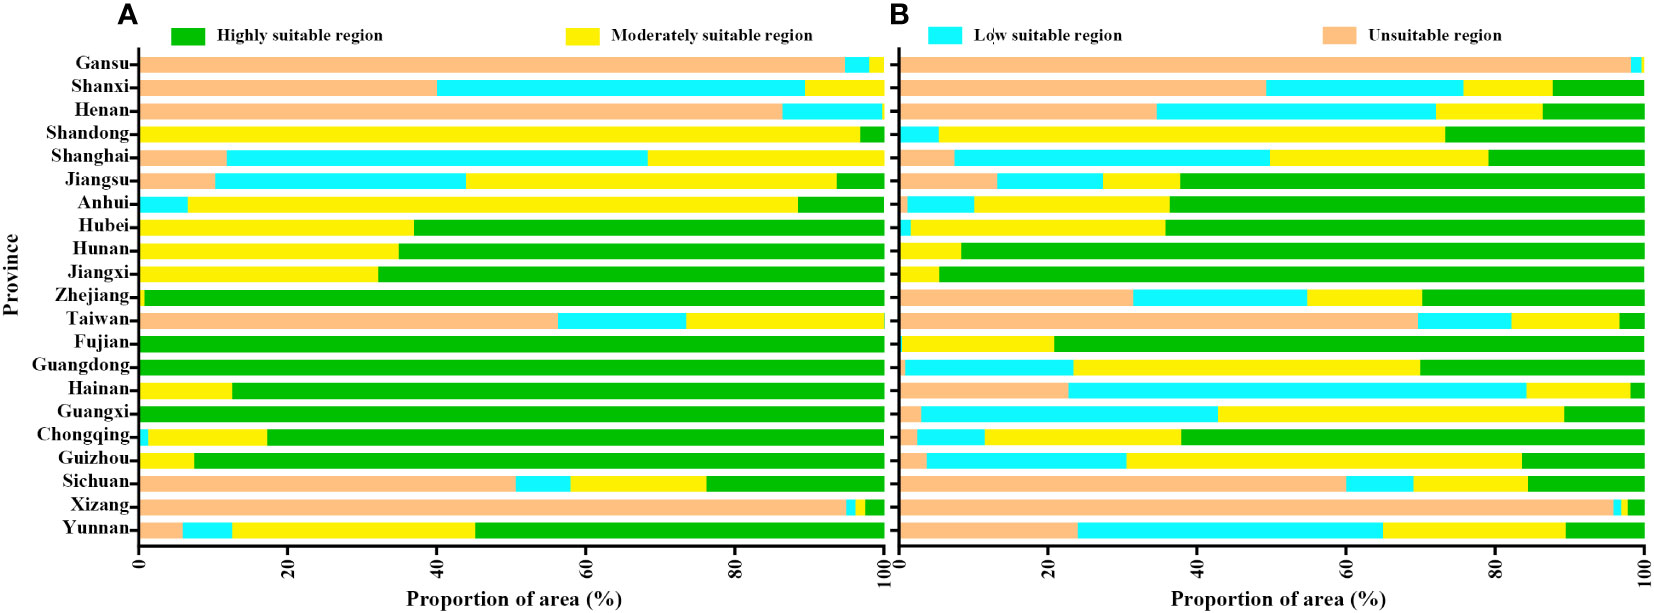
Figure 4 The proportion of unsuitable, low suitable, moderately suitable and highly suitable regions of Camellia sinensis (A) and Empoasca onukii (B) in different provinces of China.
Regarding leafhopper, the modelling (Figures 3B, D, 4B) resulted in a suitable habitat area of 167.83×10⁴ km2, accounting for 17.48% of China’s total area. Among the suitable habitat, the highly suitable habitat covered an estimated area of 96.77×10⁴ km2 (57.66%), while the moderately suitable and low suitable habitats covered areas of 71.06×10⁴ km2, and 60.64×10⁴ km2, respectively. The highly suitable habitat was primarily distributed in regions along the middle and lower reaches of the Yangtze River, including Chongqing, Hunan, Hubei, Anhui, Jiangxi, Jiangsu, Zhejiang, and Fujian provinces.
3.4 Niche overlap between tea and tea green leafhopper
The final suitability models (Figures 3A–D) indicated that tea and leafhopper shared common suitable habitats, which were situated in regions south of the Yangtze River and provinces in southwestern China. However, the bivariate map (Figure 3E) highlighted heterogeneous spatial patterns between tea and leafhopper in terms of various categories of (i.e., highly, moderately, and low) suitable habitats. High suitability of both tea and leafhopper was predicted primarily in certain regions of southwestern China (i.e., the southern and eastern part of Sichuan and Chongqing), as well as along the southeastern coast (i.e., Fujian, a small section of the southern part of Zhejiang, a small section of the northern part of Guangdong, and a small section of the central part of Taiwan). In the other regions along the southeastern coast (i.e., Guangdong, Guangxi, Hainan, and Taiwan) and in southwestern China (i.e., Yunnan, Guizhou, and central Sichuan), they still had high predicted suitability for tea but low suitability for leafhopper. Regions of low suitability for tea but high for leafhopper were located at the middle and lower reaches of the Yangtze River, including Jiangxi, Hunan, Hubei, central and northern Zhejiang, as well as central and southern Jiangsu, whereas the regions north of the Yangtze River were characterized by low suitability for both tea and leafhopper.
4 Discussion
Based on the species occurrence points and the data of climate, elevation and soil pH, we used the MaxEnt approach and a bivariate map to model and integrate the potential habitats of both tea and its primary insect pest tea green leafhopper in China. The estimation of average AUC and TSS values suggested effective performance of our modelling and good agreement between the observations and predictions. The predicted suitable habitat for the studied species were highly matched with the current records of them, mainly concentrating in regions south of the Yangtze River and some provinces in southwestern China. And the bivariate mapping explicitly revealed heterogeneous spatial patterns between the two species in terms of various categories of suitable habitats. Analyses showed that the key environmental factors determining the habitats of the two species were similar, including temperature, soil pH, and elevation. These findings help identify different categories of landscape that may require different strategies for tea cultivation planning and leafhopper management, and facilitate our regionally specific recommendations for those strategies.
4.1 Environment driver of habitat use
The comprehension of the species-environment relationship is crucial for studying the ecological demands and spatial distribution of species (Collart et al., 2023). Through the utilization of the MaxEnt modelling, our results demonstrated a similarity in the key environmental factors influencing both tea and leafhopper. These factors encompassed bio11, bio2, and soil pH. These suggest that although tea is a perennial plants and tea green leafhopper belongs to an insect pest, they exhibit congruent responses to environmental conditions.
In terms of the key environment factors driving tea habitat preferences, Zhang et al. (2019b) demonstrated that globally, bio11 and precipitation of the warmest quarter (bio18) were the most influential factors limiting tea distribution, while maximum temperature of the warmest month (bio5) and bio14 exhibited a lesser impact. In Sri Lanka, the MaxEnt modelling (Jayasinghe and Kumar, 2019) suggested the greatest influence of bio15 and interpreted this to the variation in precipitation patterns within the country (Jayasinghe and Kumar, 2019). Furthermore, the Analytical Hierarchical Process (AHP) and Decision-Making Trail and Evaluation Laboratory (DEMATEL) analyses provided the evidence of climate variables (including precipitation and temperature) as the driving force for tea distribution (Jayasinghe et al., 2019). Studies conducted in Kenya (Eitzinger et al., 2011a) and Uganda (Eitzinger et al., 2011b) indicated that an increase in bio18 corresponded to an increase in suitability of tea distribution, while a decrease in suitability was mainly relevant with a decrease in bio4. Thus, the key environment factors affecting tea habitat utilization differed significantly across varying spatial scales and study regions, closely aligning with the variation of environmental conditions in the study area. In this study, we observed that the distribution of tea in China largely depended on bio11 (the mean temperature of coldest quarters; with a contributing percentage of 53.66%), and evidenced decreasing probability of suitability when bio11 was lower than 5°C. It is well known that suitable temperature conditions are essential for the survival and growth of tea plants. Previous studies have indicated that tea originates from subtropical regions, and its growth and distribution may mainly rely on extreme minimum temperatures, as tea plants are unable to withstand temperatures lower than -10°C (Han et al., 2018). In addition to the dominant role of bio11, our study also highlighted the important influence of bio2 (with a contributing percentage of 17.10%), indicating the importance of temperature variation in shaping the distribution of tea plants. Generally, large temperature fluctuations within a day are unfavorable for tea plant growth, thereby affecting their yield and quality (Chen and Yang, 2011). This is evidenced by our findings on response curves that the probability of suitability was high when the mean diurnal range of temperature (bio2) was between 2°C and 10°C. Furthermore, the growth of tea plants is also closely related to soil condition, with studies demonstrating a preference for acidic soil (Han et al., 2018). Although Zhang et al. (2019b) did not find a significant contribution of soil pH to the global distribution of tea, arguing that the influence of soil might be much smaller than that of climate on a large spatial scale, but detectable on a small local scale. Our study confirmed this viewpoint by revealing the significant effect of soil pH on the distribution of tea in China (with a contributing percentage of 14.90%). Moreover, our analyses uncovered a high probability of suitability when soil pH remained between 4 and 7, coinciding with its preference for acidic soil. Interestingly, we did not identify the key role of precipitation-related factors in this study, which differed from the results of previous studies in other regions. This discrepancy is likely due to the relatively small variation in precipitation across tea-growing regions in China, insufficient to exert a notable influence on tea habitat utilization.
As for insect species, temperature and precipitation of driest and coldest quarter are identified as important environmental variables that can limit the geographical distribution of locustamigratoria tibetensis (Wang et al., 2017) and Solenopsis invicta (Liu et al., 2019) in China. In the case of the soybean aphid Aphis glycines, Ma et al. (2022) determined that bio18, annual mean temperature (bio1), mean temperature of wettest quarter (bio8), bio14, bio2, and bio4 were crucial factors influencing its global distribution. Ectothermic organisms like insects are particularly susceptible to temperature, as their biology is intricately linked to the temperature of their habitat (Colinet et al., 2015). Therefore, temperature can play a vital role in growth, development, and dispersal of insects, thus affecting their population dynamics and geographical distribution. The results of this study suggested that bio11 and bio2 are the important factors affecting the distribution of tea green leafhopper in China, while previous MaxEnt study on tea green leafhopper (Jiang et al., 2022) reported the significance of min temperature of coldest month (bio6), bio2, bio14, and precipitation of wettest quarter (bio16). Previous ecological, biochemical, and molecular evidence have shown that environmental temperature has great influence on E. onukii populations. Their survival, development, and reproduction are optimal at temperature between 19°C and 27°C (Li et al., 2023). And winter mean temperature acts as a critical factor affecting the overwintering survival of tea green leafhopper adults. With the coming of late autumn in China, the temperate decreases. The growth and development of tea green leafhopper gradually slow down, and limited adults are left to survive the winter. These overwintering adults do not begin to feed and lay eggs until the temperature goes up to 10°C in the next spring (Jiang et al., 2022). It is found that extremely low temperatures can lead to significant mortality among overwintering adults, which can subsequently impact the population establishment and occurrence in the following year (Jiang et al., 2022). Therefore, the habitat utilization of tea green leafhopper can be strongly influenced by the risk of low winter temperatures for overwintering adults. Indeed, our study was accordant with these reports in predicting low probability of suitability in regions where bio11 remained below 5°C. Noticeably, our study did not identify the leading role of precipitation, which differed from the report by Jiang et al. (2022). This may be attributed to the inclusion of elevation and soil pH as additional factors in our study, which could exert a greater influence than precipitation. Our results indeed suggested the importance of soil pH and elevation as crucial factors shaping the distribution of tea green leafhopper. Previous studies have recorded the response of Hemiptera insects to elevation. For example, the richness and abundance of Hemiptera insect species decrease with increasing elevation (Le Cesne et al., 2015). Similarly, significant differences in hemipteran species have been observed among pepper plantations at different elevations (Yin et al., 2013). Regarding soil pH, its importance may be related to the preference of tea plants for acidic soil. Consequently, precipitation-related factors exhibited weaker effects in our study, as they were not the primary drivers of tea plant distribution in China and thus had limited influence on tea green leafhopper through their host plants. Furthermore, considering the field activity characteristics of leafhoppers, the direct impact of precipitation on leafhopper populations can be limited. Female adults of tea green leafhopper lay their eggs in tender tea shoots and leaves, and both the adults and nymphs often seek shelter behind the tender leaves, where they feed on the sap (Li et al., 2022). In this context, tender tea shoots and leaves can help leafhopper populations avoid or alleviate the unfavorable influence of precipitation, resulting in a lesser role for precipitation compared to temperature in driving leafhopper habitat use.
4.2 Habitat suitability distribution
The modelling indicated that a significant portion of China exhibited suitable conditions for the distribution of tea plants and tea green leafhopper. Approximately 25% of China’s total area was identified as suitable habitat for both tea and tea green leafhopper, with the majority of these habitats categorized as highly suitable. Moreover, the predicted distribution of suitable habitats was concentrated in regions located in the south of the Yangtze River and certain provinces in southwestern China. These findings aligned with the widespread cultivation of tea plants in southern China (Chen and Yang, 2011), and the previous collection of tea green leafhopper populations in these regions (Li et al., 2022). In addition, the predicted pattern of leafhopper coincides with the results of a previous MaxEnt study conducted by Jiang et al. (2022), while the results of tea aligned with the agricultural zoning scheme proposed by experts (Chen and Yang, 2011) and were consistent with the potential distribution of tea in China modelled by Zhang et al. (2019b).
Although our models suggested that tea and tea green leafhopper shared common suitable habitats, it is worth noting that their distribution differed significantly in terms of various categories of suitable habitats. The bivariate map clearly demonstrated a spatially heterogeneous pattern. In a large portion of the study area (blue, Figure 2E), tea exhibited high predicted suitability, while tea green leafhoppers showed low suitability. On the contrary, there was also a considerable fraction of the areas where tea green leafhoppers were highly suitable but tea plants were not (yellow, Figure 2E). Only a small number of areas indicated high (red, Figure 2E) or low (gray, Figure 2E) predicted suitability for both tea and tea green leafhopper. These findings contradicted our initial expectation that the projected niche of the two species may overlap largely, given the shared environmental factors driving their habitat use. Furthermore, it was also inconsistent with the understanding derived from population ecology, which suggested that suitability of pest and their primary host plants should mutually facilitate each other. This discrepancy may be due to the limitations of habitat suitability models, which solely considered abiotic factors (e.g., ignore ecological interactions) potentially resulting in an over-prediction of suitability (Bishop et al., 2021). However, the observed pattern may also reflect the biological reality that the suitability of pests and their host plants does not always enhance each other, even though there are the same ecological constraints responsible for shaping their habitat use.
Evidently, there exist complex co-evolutionary relationships and interactions between pests and their host plants, which affect their distribution patterns and contribute to their patterns to be complicated and heterogeneous. It is widely recognized that insects and plants exhibit completely different biological characteristics, leading to varying degrees of influence from the same ecological constraints. For example, the habitat use of tea plants may be more susceptible to environmental stress risks, while the dispersal capability of leafhopper may help alleviate it. Indeed, our models suggested a higher contributing percentage of their common predominant factor, bio11, to tea (53.66%) compared to leafhopper (34.55%). Nonetheless, it was also possible that other constraints played a role in shaping their habitat use. For example, compared with tea plants, the leafhopper’s ability to disperse as an animal between different sites may be a crucial factor affecting its habitat use.
4.3 Applications to tea cultivation planning and leafhopper management
Regardless of the mechanisms underlying the heterogeneity in suitability between tea and leafhopper, the application of bivariate map enabled the identification of four categories of landscape that may possibly require different strategies for tea cultivation planning and leafhopper management. These categories included the regions of (a) high suitability for both tea and leafhopper, (b) high suitability for tea and low suitability for leafhopper, (c) low suitability for tea and high suitability for leafhopper, and (d) low suitability for both tea and leafhopper.
High suitability for both tea and leafhopper were observed primarily in patches of southwestern China (i.e., the southern and eastern part of Sichuan, Chongqing) and along the southeastern coast (i.e., Fujian, a small section of the southern part of Zhejiang, a small section of the northern part of Guangdong, and a small section of the central part of Taiwan).According to our models, these regions demonstrate favorable climatic and soil conditions conducive to the growth of tea plants, while also facilitating the proliferation of leafhopper populations. Given the considerable potential for leafhopper-induced damage within these areas, tea cultivation endeavors may face notable challenges. Consequently, it is recommended to prioritize the implementation of environmentally friendly pest control systems to effectively manage leafhopper populations in the field.
Extensive areas encompassing large parts of Southwest and South China, such as Yunnan, Guizhou and central Sichuan, Guangdong, Guangxi, Hainan, and Taiwan, exhibited a notable pattern on the bivariate map, indicating a high likelihood of suitability for tea plants but a relatively lower suitability for leafhoppers. Our models suggested that these regions possess favorable conditions conducive to the growth and development of tea plants, while potentially limiting the establishment of year-round leafhopper populations that necessitate targeted management interventions. Therefore, they may be favorable regions for tea cultivation and production.
The regions exhibiting low suitability for tea but high suitability for leafhopper were primarily concentrated in the middle and lower reaches of the Yangtze River, including Jiangxi, Hunan, Hubei, central and northern Zhejiang, and central and southern Jiangsu. Our models suggested that these regions could support substantial populations of leafhopper, while the climate conditions may affect habitat use of tea plants in these regions. Tea cultivation in these regions may encounter the dual challenges of climate-induced stress and pest feeding. The ecological environment (e.g., low temperature in winter) may not be optimal for the growth of tea plants. The implementation of appropriate cultivation strategies according to local conditions (e.g., keeping tea plants warm against cold in winter by applying feasible methods) may be a crucial part of high-quality and high-yield production of tea in these regions. Meanwhile, the impact of low winter temperatures on overwintering populations of leafhopper may not be sufficiently inhibitory to prevent the rapid establishment of the populations in the following spring, leading to extensive occurrence and significant damage. As a result, the targeted, effective, and environmentally friendly management strategies are required.
Regions of low suitability for both tea and leafhopper were primarily identified at north of the Yangtze River, including Henan, southern Shaanxi, northern Anhui, north-central Jiangsu, and south-central and eastern Shandong. In these more northerly regions, the winter temperatures were lower, thus posing greater challenges for tea cultivation. Meanwhile, the impact on the overwintering leafhopper populations became profound, potentially impeding the rapid establishment of the population in the following spring and its year-round maintenance of leafhopper population. To facilitate the survival of tea plants in winter and promote the germination in spring, the implementation of strategies, such as mulching and pruning, may be necessary and effective. However, before such measures are undertaken, it is also crucial to plan effective pest control efforts in these regions to minimize the overwintering populations of the leafhopper and block dispersal from outside regions in spring (e.g., inter-regional transportation of tea plants should be conducted with strict inspection).
The provinces located at the middle and lower reaches of the Yangtze River, as well as Fujian, have traditionally been significant regions of tea cultivation. In recent years, economic development in these areas has led to rising labor and land costs. As a result, a westward shift in tea planting has been observed (Xiao et al., 2018). Farmers in the western mountainous regions, driven by the need for economic development and poverty alleviation, are increasingly interested in tea planting and production. The expansion of tea cultivation to a wider range of areas, leveraging the advantages of climate, mountainous terrain, and labor resources, while ensuring biodiversity conservation, can be an effective approach. Clearly, the provinces at the middle and lower reaches of the Yangtze River and Fujian remain the key for tea cultivation and production in China, making the management of leafhopper damage particularly crucial in these regions. In addition, the regions north of the Yangtze River have experienced development and expansion in recent years (Wu et al., 2020). For the expansion of its planting area and the development of new tea plantations, it is essential to carefully consider the constraints posed by unfavorable climatic conditions and the threat of leafhopper damage. These discovered information highlights the importance of conducting comparative analyses on the habitat suitability of both host plants and insect herbivores, as they can provide regionally specific recommendations for agricultural crop planting plan and pest management.
5 Conclusion
In this study, we employed MaxEnt models to assess the habitat suitability of both tea and its primary insect herbivore (tea green leafhopper) and used a bivariate map to conduct a comparative analysis of the projected distribution between them. The analysis suggested that both tea and leafhopper shared common key environment factors (i.e., temperature, elevation, and soil pH) determining their habitat preferences and displayed a common distribution range concentrating in regions south of the Yangtze River and some provinces in southwestern China. However, they exhibited heterogeneous spatial patterns in terms of different categories of suitable habitats. These information help the identification of regions with high risk of leafhopper damage and assist the development of its spatially explicit management strategies. Meanwhile, these findings contribute to the implementation of rational cultivation technologies aimed at protecting tea plants from adverse environmental stress. Our work suggest that the application of SDMs and bivariate map can optimize crop planting practices and guide spatially explicit pest management strategies. Beyond utility for agricultural crop farming, the approach employed holds immense potential in facilitating regionally specific management of biological resources in a variety of contexts, such as the control of invasive species and the conservation of endangered biodiversity.
Data availability statement
The original contributions presented in the study are included in the article/Supplementary Material, further inquiries can be directed to the corresponding author/s.
Ethics statement
The manuscript presents research on animals that do not require ethical approval for their study.
Author contributions
JL: Conceptualization, Formal analysis, Funding acquisition, Methodology, Project administration, Resources, Supervision, Writing – original draft. BZ: Data curation, Investigation, Methodology, Software, Validation, Visualization, Writing – review & editing. YM: Methodology, Resources, Validation, Writing – review & editing. JJ: Data curation, Resources, Validation, Writing – review & editing. KL: Resources, Software, Visualization, Writing – review & editing. SY: Conceptualization, Investigation, Writing – review & editing.
Funding
The author(s) declare financial support was received for the research, authorship, and/or publication of this article. Funding for this research was provided by Fujian Provincial Department of Science and Technology (2022J05080, 2022R1029007), and Fujian Academy of Agricultural Sciences (ZYTS202208).
Conflict of interest
The authors declare that the research was conducted in the absence of any commercial or financial relationships that could be construed as a potential conflict of interest.
The author(s) declared that they were an editorial board member of Frontiers, at the time of submission. This had no impact on the peer review process and the final decision.
Publisher’s note
All claims expressed in this article are solely those of the authors and do not necessarily represent those of their affiliated organizations, or those of the publisher, the editors and the reviewers. Any product that may be evaluated in this article, or claim that may be made by its manufacturer, is not guaranteed or endorsed by the publisher.
Supplementary material
The Supplementary Material for this article can be found online at: https://www.frontiersin.org/articles/10.3389/fevo.2023.1305369/full#supplementary-material
References
Adhikari P., Lee Y. H., Poudel A., Hong S. H., Park Y. S. (2023). Global spatial distribution of Chromolaena odorata habitat under climate change: random forest modeling of one of the 100 worst invasive alien species. Sci. Rep. 13, 9745. doi: 10.1038/s41598-023-36358-z
Adhikari U., Nejadhashemi A. P., Woznicki S. A. (2015). Climate change and eastern Africa: a review of impact on major crops. Food Energy Secur. 4 (2), 110–132. doi: 10.1002/fes3.61
Aiello-Lammens M. E., Boria R. A., Radosavljevic A., Vilela B., Anderson R. P. (2015). spThin: an R package for spatial thinning of species occurrence records for use in ecological niche models. Ecography 38 (5), 541–545. doi: 10.1111/ecog.01132
Baja S., Chapman D. M., Dragovich D. (2002). A conceptual model for defining and assessing land management units using a fuzzy modeling approach in GIS environment. Environ. Manage. 29 (5), 647–661. doi: 10.1007/s00267-001-0053-8
Bishop A. P., Amatulli G., Hyseni C., Pless E., Bateta R., Okeyo W. A., et al. (2021). A machine learning approach to integrating genetic and ecological data in tsetse flies (Glossina pallidipes) for spatially explicit vector control planning. Evol. Appl. 14 (7), 1762–1777. doi: 10.1111/eva.13237
Bivand R. (2018) classInt: choose univariate class intervals. Available at: https://cran.r-project.org/package=classInt.
Bivand R., Keitt T., Rowlingson B. (2019) rgdal: bindings for the “Geospatial” Data abstraction library. Available at: https://cran.r-project.org/package=rgdal.
Catharina K. (2019) MaxEnt_TSS_calculations. Available at: https://github.com/KarlssonCatharina/MaxEnt_TSS_calculations/blob/master/MaxEnt_TSS_calculations.R (Accessed 2023-11-27).
Chen S., Wang X., Peng P., Hu X., Duan X., Lin Q. (2015). Genetic differentiation of Empoasca vitis (Göthe) (Hemiptera: Cicadellidae) among eleven populations based on 16S rRNA sequence. Southwest China J. Agr. Sci. 28 (2), 584–590. doi: 10.16213/j.cnki.scjas.2015.02.025
Chen Z. M., Yang Y. M. (2011). The book of Chinese tea (Shanghai: Shanghai Scientific & Technical Publishers).
Colinet H., Sinclair B. J., Vernon P., Renault D. (2015). Insects in fluctuating thermal environments. Annu. Rev. Entomol. 60 (1), 123–140. doi: 10.1146/annurev-ento-010814-021017
Collart F., Broennimann O., Guisan A., Vanderpoorten A. (2023). Ecological and biological indicators of the accuracy of species distribution models: lessons from European bryophytes. Ecography 2023, e06721. doi: 10.1111/ecog.06721
de Gabriel Hernando M., Fernández-Gil J., Roa I., Juan J., Ortega F., de la Calzada F., et al. (2021). Warming threatens habitat suitability and breeding occupancy of rear-edge alpine bird specialists. Ecography 44 (8), 1191–1204. doi: 10.1111/ecog.05593
Eitzinger A., Läderach P., Quiroga A., Pantoja A., Gordon J. (2011a). Future climate scenarios for Kenya´s tea growing areas (International Center for Tropical Agriculture (CIAT).
Eitzinger A., Läderach P., Quiroga A., Pantoja A., Gordon J. (2011b). Future climate scenarios for Uganda’s tea growing areas (International Center for Tropical Agriculture (CIAT).
Elith J., Graham H. C., Anderson P. R., Dudík M., Ferrier S., Guisan A., et al. (2006). Novel methods improve prediction of species’ distributions from occurrence data. Ecography 29 (2), 129–151. doi: 10.1111/j.2006.0906-7590.04596.x
Fick S. E., Hijmans R. J. (2017). WorldClim 2: new 1-km spatial resolution climate surfaces for global land areas. Int. J. @ Climatol. 37 (12), 4302–4315. doi: 10.1002/joc.5086
Food and Agriculture Organization of the United Nations (FAO) (2022) International tea market: market situation, prospects and emerging issues. Available at: https://www.fao.org/markets-and-trade/commodities/tea/en/ (Accessed 2023-11-29).
Fu J. Y., Han B. Y., Xiao Q. (2014b). Mitochondrial COI and 16sRNA evidence for a single species hypothesis of E. vitis, J. formosana and E. onukii in East Asia. PloS One 9 (12), e115259. doi: 10.1371/journal.pone.0115259
Fu J., Li L., Yuan Z., Tang M., Xiao Q. (2014a). Molecular phylogenetic analysis of tea green leafhopper (Empoasca vitis) based on mtDNA COI sequences. J. Tea Sci. 34 (6), 601–608. doi: 10.13305/j.cnki.jts.2014.06.022
Gunathilaka D., Tularam A. (2016). The tea industry and a review of its price modelling in major tea producing countries. J. Manage. Strategy 7 (1), 21–36. doi: 10.5430/jms.v7n1p21
Han W., Li X., Ahammed G. J. (2018). Stress physiology of tea in the face of climate change (Singapore: Springer Nature Singapore Pte Ltd).
Hengl T., Leenaars J. G. B., Shepherd K. D., Walsh M. G., Heuvelink G. B. M., Mamo T., et al. (2017). Soil nutrient maps of Sub-Saharan Africa: assessment of soil nutrient content at 250 m spatial resolution using machine learning. Nutr. Cycl. Agroecosys. 109 (1), 77–102. doi: 10.1007/s10705-017-9870-x
Hijmans R. J., van Etten J. (2016) raster: Geographic data analysis and modeling. Available at: https://cran.r-project.org/package=raster.
Hong S. H., Lee Y. H., Lee G., Lee D. H., Adhikari P. (2021). Predicting impacts of climate change on northward range expansion of invasive weeds in South Korea. Plants 10 (8), 1604. doi: 10.3390/plants10081604
Jayasinghe S. L., Kumar L. (2019). Modeling the climate suitability of tea [Camellia sinensis(L.) O. Kuntze] in Sri Lanka in response to current and future climate change scenarios. Agr. For. Meteorol. 272 (2), 102–117. doi: 10.1016/j.agrformet.2019.03.025
Jayasinghe L. S., Kumar L., Sandamali J. (2019). Assessment of potential land suitability for tea (Camellia sinensis (L.) O. Kuntze) in Sri Lanka using a GIS-based multi-criteria approach. Agriculture 9 (7), 148. doi: 10.3390/agriculture9070148
Jiang M., Zhong W., Hu H., Zheng Z., Chen Y., You M., et al. (2022). Prediction of potential suitable regions of the tea green leafhopper in China in the context ofclimate change. Chin. J. Ecol. 41 (10), 2008–2016. doi: 10.13292/j.1000-4890.202209.014
Kebede F., Moehlman P. D., Bekele A., Evangelista P. H. (2014). Predicting seasonal habitat suitability for the critically endangered African wild ass in the Danakil, Ethiopia. Afr. J. Ecol. 52, 533–542. doi: 10.1111/aje.12159
Lang D. T., the CRAN Team (2019) XML: Tools for parsing and generating XML within R and S-Plus. Available at: https://cran.r-project.org/package=XML.
Le Cesne M., Wilson S. W., Soulier-Perkins A. (2015). Elevational gradient of Hemiptera (Heteroptera, Auchenorrhyncha) on a tropical mountain in Papua New Guinea. PeerJ 3 (23), e978. doi: 10.7717/peerj.978
Leshamta G. T. (2017). Assessing the suitability of tea growing zones of Kenya under changing climate and modelling less regret agrometeorological options. Master's Thesis. Nairobi: University Of Nairobi.
Li L., Fu J., Xiao Q. (2013). Sequence analysis of the mtDNA gene and genetic differentiation in geographic populations of Empoasca vitis. Chin. J. Appl. Entomol. 50 (3), 675–685. doi: 10.7679/j.issn.2095-1353.2013.095
Li J., Shi L., Chen W., Mao Y., Vasseur L., Gurr G., et al. (2023). Environmental heterogeneity drives population genetic divergence of a key agricultural pest, Empoasca onukii. Entomol. Gen. 43 (2), 305–313. doi: 10.1127/entomologia/2023/1695
Li J., Shi L., Vasseur L., Zhao Q., Chen J., You M., et al. (2022). Genetic analyses reveal regional structure and demographic expansion of the predominant tea pest Empoasca onukii (Hemiptera: Cicadellidae) in China. Pest Manage. Sci. 78 (7), 2838–2850. doi: 10.1002/ps.6908
Li B., Zhang F., Zhang L. W., Huang J. F., Jin Z. F., Gupta D. K. (2012). Comprehensive suitability evaluation of tea crops using GIS and a modified land ecological suitability evaluation model. Pedosphere 22 (1), 122–130. doi: 10.1016/S1002-0160(11)60198-7
Liu C., Berry P. M., Dawson T. P., Pearson R. G. (2005). Selecting thresholds of occurrence in the prediction of species distributions. Ecography 28, 385–393. doi: 10.1111/j.0906-7590.2005.03957.x
Liu X., Zhao C., Li F., Zhu J., Gao K., Hu Y. (2019). Prediction of potential geographical distribution of Solenopsis invicta Buren in China based on Max-Ent. Plant Quaran. 33 (6), 70–76. doi: 10.19662/j.cnki.issn1005-2755.2019.06.016
Ma S., Yu H., Zhao K., Xie T. (2022). Potential geographical distribution of the soybean aphid, Aphis glycines (Hemiptera: Aphododae), in the world based on MaxEnt model. Acta Entomol. Sin. 65 (5), 630–637. doi: 10.16380/j.kcxb.2022.05.011
Morera-Pujol V., Mostert P. S., Murphy K. J., Burkitt T., Coad B., McMahon B. J., et al. (2023). (2023.) Bayesian species distribution models integrate presence-only and presence–absence data to predict deer distribution and relative abundance. Ecography 2), e06451. doi: 10.1111/ecog.06451
Muscarella R., Galante P. J., Soley-Guardia M., Boria R. A., Kass J. M., Uriarte M., et al. (2014). ENMeval: An R package for conducting spatially independent evaluations and estimating optimal model complexity for Maxent ecological niche models. Methods Ecol. Evol. 5 (11), 1198–1205. doi: 10.1111/2041-210X.12261
Muthee M., Waswa F., Obando J. (2015). Emerging land use changes-climatic variability nexus in Meru county, Kenya. J. Environ. Earth Sci. 5 (20), 118–129.
Newman J. C., Riddell E. A., Williams L. A., Sears M. W., Barrett K. (2022). Integrating physiology into correlative models can alter projections of habitat suitability under climate change for a threatened amphibian. Ecography 2022 (8), e06082. doi: 10.1111/ecog.06082
Nowogrodzki A. (2019). How climate change might affect tea. Nature 566, S10–S11. doi: 10.1038/d41586-019-00399-0
Phillips S. J., Anderson R. P., Schapire R. E. (2006). Maximum entropy modeling of species geographic distributions. Ecol. Model. 190 (3-4), 231–259. doi: 10.1016/j.ecolmodel.2005.03.026
Qin Y., Zhang Y., Clarke A. R., Zhao Z., Li Z. (2021). Including host availability and climate change impacts on the global risk area of Carpomya pardalina (Diptera: Tephritidae). Front. Ecol. Evol. 9, 724441. doi: 10.3389/fevo.2021.724441
Qin D., Zhang L., Xiao Q., Dietrich C., Matsumura M. (2015). Clarification of the identity of the tea green leafhopper based on morphological comparison between Chinese and Japanese specimens. PloS One 10 (9), e0139202. doi: 10.1371/journal.pone.0139202
Ran W., Li Q., Hu X., Zhang D., Yu Z., Chen Y., et al. (2023). Comprehensive analysis of environmental factors on the quality of tea (Camellia sinensis var. sinensis) fresh leaves. Sci. Hortic. 319, 112177. doi: 10.1016/j.scienta.2023.112177
Su Y. (2020) What are the main characteristics of the climate in China? Available at: https://www.cma.gov.cn/2011xzt/2012zhuant/20120302/2012030205/201203020501/201103/t20110314_3096052.html.
Vale C. G., Tarroso P., Brito J. C. (2014). Predicting species distribution at range margins: testing the effects of study area extent, resolution and threshold selection in the Sahara–Sahel transition zone. Diversity Distrib. 20, 20–33. doi: 10.1111/ddi.12115
Wang R., Li Q., Feng C., Shi C. (2017). Predicting potential ecological distribution of Locusta migratoria tibetensis in China using MaxEnt ecological niche modeling. Acta Ecol. Sin. 37 (24), 8556–8566. doi: 10.5846/stxb201611152326
Warren D. L., Glor R. E., Turelli M. (2010). ENMTools: a toolbox for comparative studies of environmental niche models. Ecography 33 (3), 607–611. doi: 10.1111/j.1600-0587.2009.06142.x
Wu Q., Sun C., Yang J. (2020). Economic analysis of the change of tea production layout in China. J. Phys. Conf. Ser. 1629 (1), 012048. doi: 10.1088/1742-6596/1629/1/012048
Xiao Z., Huang X., Zang Z., Yang H. (2018). Spatio-temporal variation and the driving forces of tea production in China over the last 30 years. J. Geogr. Sci. 28 (3), 275–290. doi: 10.1007/s11442-018-1472-2
Yin S., Dong Z., Wen Y., Chen G., Song J., Shi A., et al. (2013). Study on the influence of altitude on the characters of hemiptera communities in Zanthoxylum bungeanum plantations. J. Environ. Entomol. 35 (2), 148–156. doi: 10.3969/j.issn.1674-0858.2013.02.03
Yoon S., Lee W. H. (2021). Methodological analysis of bioclimatic variable selection in species distribution modeling with application to agricultural pests (Metcalfa pruinosa and Spodoptera litura). Comput. Electron. Agric. 190 (1), 106430. doi: 10.1016/j.compag.2021.106430
Zhang X., Li Y., Wang Y., Cai H., Zeng H., Wang Z. (2019b). Influence of future climate change in suitable habitats of tea in different contries. Bidivers. Sci. 27 (6), 595–606. doi: 10.17520/biods.2019085
Zhang L., Wang F., Qiao L., Dietrich C. H., Matsumura M., Qin D. (2019a). Population structure and genetic differentiation of tea green leafhopper, Empoasca (Matsumurasca) onukii, in China based on microsatellite markers. Sci. Rep. 9 (1), 1–10. doi: 10.1038/s41598-018-37881-0
Zhao Y., Xu Y., Zhang L., Zhao M., Wang C. (2022). Adapting tea production to climate change under rapid economic development in China from 1987 to 2017. Agronomy 12, 3192. doi: 10.3390/agronomy12123192
Keywords: land resource planning, species distribution model, land suitability assessment, tea cultivation, tea green leafhopper
Citation: Li J, Zhang B, Mao Y, Jiang J, Li K and You S (2024) Comparative analysis of habitat suitability for a crop and its primary insect herbivore: providing insights for crop planting and pest management strategies. Front. Ecol. Evol. 11:1305369. doi: 10.3389/fevo.2023.1305369
Received: 01 October 2023; Accepted: 11 December 2023;
Published: 04 January 2024.
Edited by:
Gengping Zhu, Tianjin Normal University, ChinaReviewed by:
Jiufeng Wei, Shanxi Agricultural University, ChinaPradeep Adhikari, Hankyong National University, Republic of Korea
Copyright © 2024 Li, Zhang, Mao, Jiang, Li and You. This is an open-access article distributed under the terms of the Creative Commons Attribution License (CC BY). The use, distribution or reproduction in other forums is permitted, provided the original author(s) and the copyright owner(s) are credited and that the original publication in this journal is cited, in accordance with accepted academic practice. No use, distribution or reproduction is permitted which does not comply with these terms.
*Correspondence: Jinyu Li, anlsaV9mYWFzQDE2My5jb20=
†These authors have contributed equally to this work