 Teng Gao
 Yuchen Li2
 Ri Jin
- 1Department of Geography, College of Geography and Ocean Sciences, Yanbian University, Hunchun, China
- 2Department of Geography, College of Integration Science, Yanbian University, Yanji, China
- 3Tibet Entry-Exit Frontier Inspection Station, Lhasa, China
Jilin Province in China borders other countries in Northeast Asia and is a complex ecosystem of transboundary rivers, varying terrains, and climates, which provides vital freshwater resources to the neighboring countries. Water conservation is one of the ecosystem service functions and is of great significance to maintaining sustainable development of water resources and ecological security. In this study, we analyzed the water conservation function and its variations in Jilin Province from 2000 to 2020 using the InVEST model. Furthermore, we examined the dominant factors governing spatial distribution of the changes in water conservation function over the past two decades using geographical detectors. In addition, a multi-scale geographic weighted regression model was adopted to investigate spatial differences and characteristics of individual drivers across different spatial scales. The study revealed a number of findings. First, between 2000 and 2020, average water conservation in Jilin Province increased by 46.12% overall from 87.14 mm/m2 to 127.28 mm/m2. Second, compared with land use change, climate change had a greater influence on water conservation. However, in some areas, the opposite was true, and the combined impact of both factors was more substantial on water conservation than when each acted independently. Third, except for temperature, the correlation between each driving factor and the change in water conservation function exhibited spatial variations, and the characteristics of each factor also varied across different spatial scales. In the study site, variations in water conservation were positively correlated with forest and grass coverage and negatively correlated with cultivated land and urban-rural and industrial-mining land. This study provides new insights for exploring the driving factors of changes in water conservation function and imparts a more appropriate basis for government agencies to make decisions about ecological and environmental protection and optimization of ecosystem management.
1 Introduction
Ecosystem services refer to the direct or indirect ways by which natural ecosystems contribute to human well-being. This topic has attracted the interest of many scholars and managers since it serves as the foundation for human survival and development (Reid et al., 2006; Sandifer et al., 2015; Yang et al., 2019). An ecosystem’s capacity for water conservation is demonstrated by its ability to deflect precipitation, control runoff, and preserve water quality, providing a vital reference for other regions (Wenmin et al., 2020; Li et al., 2021). It is not only a necessary attribute for the functional evaluation of ecosystem services, but is also a critical factor in the long-term development of water resources (Xu et al., 2020). Within the extensive studies on ecosystem services, water conservation function has received significant attention from several researchers (Gao et al., 2017; Wang et al., 2021). Therefore, conducting a quantitative assessment of the water conservation function of an ecosystem while evaluating the influencing factors can provide scientific guidance to inform regional ecological policy and local government planning. Such analysis is vital for the long-term development of water resources and the social economy (Du et al., 2022; Fang et al., 2022).
Previous studies on water conservation have primarily focused on quantitative assessment, identification of key factors that influence its spatial patterns, spatiotemporal evolution characteristics, and the investigation of responses to a single factor. Wang et al. (2022a) quantitatively assessed the water conservation function of the Tibetan Plateau and analyzed the impact of two dominant factors—precipitation and normalized difference vegetation index (NDVI)—on the overall water source conservation capacity. Yang et al. (2019) quantitatively assessed water production in the Xiangjiang River Basin and, through sensitivity analysis, showed that precipitation is the most important factor affecting water production. Azimi et al. (2020) quantitatively analyzed the impact of runoff on Iranian pastures and determined the impact of different pasture conditions on water conservation functions. Wang et al. (2019) quantitatively assessed water production and water conservation in the Shiyang River Basin and analyzed the impact of land use transformation on aquatic ecosystem services. Research on the causes of water conservation has progressed using various methods, including principal components, cluster analysis, or scenario simulation methods, which can only be used for analyzing a single factor response, and the geographic detector method that can be used for performing single and interactive factor analysis (Wang and Xu, 2017). The above series of methods provide an in-depth analysis of overall quantitative attribution. Qi et al. (2020) used principal component analysis and cluster analysis to evaluate the trade-off and synergistic relationship between water conservation functions and other ecosystem service functions in Northeast China. Zhao et al. (2022) predicted the spatiotemporal changes in water production, soil conservation, and carbon storage under different land use scenarios in the Heihe River Basin. Zhang et al. (2023) used geographical detectors to conduct single and interactive factor analysis on the driving factors of changes in water conservation functions in the Tumen River Basin. However, several studies have only examined the drivers of variations in water conservation function from the perspective of watersheds or regions, without considering the spatial heterogeneity of influencing factors. Thus, these studies cannot provide a comprehensive understanding of the current situation (Zhang et al., 2020). Geographically weighted regression (GWR) is a localized regression analysis method that has been used in the investigation of elements determining ecosystem services. Sannigrahi et al. (2020) quantitatively assessed the ecosystem service functions of the Sundarbans region of India, and by comparing multiple spatial regression models, concluded that the GWR model is more suitable for studying local influencing factors. Wang et al. (2022b) quantitatively assessed the ecosystem service functions of the Beijing–Tianjin urban agglomeration and used the GWR model to analyze the local impact of natural and social factors on ecosystem service functions. The GWR model addresses the issue of spatial heterogeneity, but does not include the concept of spatial scale. Fotheringham et al. (2017) proposed a multi-scale geographically weighted regression model (MGWR) based on GWR, which is capable of effectively addressing the spatial differences as well as spatial scales of different contributing factors. Liu et al. (2023) used this MGWR model to analyze the local impact of urbanization factors and landscape pattern factors on the habitat quality of the Wanjiang River urban belt. In addition, Wu et al. (2023) analyzed the local impact of natural and economic factors on soil cadmium pollution in Huangpi District, Wuhan City using the MGWR model and explained the relationship between factor change scale and spatial heterogeneity. These studies demonstrate that the MGWR model is an effective means to understand the influence and scale of environmental factors. Currently, only a few studies have combined global quantitative attribution and local factor assessment to comprehensively consider the factors impacting changes in water conservation function. Therefore, in this study, we aimed to combine the geographic detector approach (Hu et al., 2021) with the MGWR model to investigate the driving factors of water conservation function changes from a geospatial perspective. This approach would provide a detailed analysis of the overall response, spatial differences, and spatial scales of the driving factors influencing regional water conservation functions.
There are many mountains and cross-border rivers in Jilin Province in China, and the western plain is the national grain production base. Regional water conservation is of great strategic significance for ensuring the ecological security of Northeast Asia and national food security (Yu and Han, 2016; Zhang et al., 2022). The Integrated Valuation of Ecosystem Services and Tradeoffs (InVEST) model can be applied on a large temporal and spatial scale and offers the advantages of minimal parameter and characteristic data requirements, allowing its wide applicability (Nelson et al., 2009). This modeling tool has been commonly employed in the assessment of river basins and regional water conservation functions (Ning et al., 2020; Li et al., 2021; Liu et al., 2021; Wei et al., 2022). ArcGIS software can be utilized to visualize and further interpret the calculation results, making it suitable for use in this study. The innovative contribution of this study is that it combines global quantitative attribution with local factor exploration to analyze the driving factors of changes in water conservation functions from a geographical spatial perspective. In addition, the scale of factor change is explained, which is more reasonable than previous local factor exploration. Overall, this study provides an example of exploring relevant environmental factors, generates a more sufficient theoretical basis for local and sub-local governments, and further yields a scientific reference for formulating ecological environment protection policies and optimizing ecosystem management.
2 Data and methodology
2.1 Research area
Jilin Province is located in northern East Asia, in the hinterland of Northeast China (121°38′–131°19′ E, 40°50′–46°19′ N), bordering North Korea and Russia, with an area of approximately 187,400 km2 (Figure 1). There are three cross-border rivers in the easternmost part of the province, namely the Suifen River, the Tumen River, and the Yalu River. The terrain decreases from southeast to northwest. The province is bounded by the Dahei Mountains in the central part and divided into two major landform units: the eastern mountains and the western plains. The southeast region is a southwest–northeast mountainous area including Laoling, the main line of Changbai Mountains, and Laoyeling. The central part of the eastern mountainous area encompasses the southwest–northeastward Jilinhadaling, Zhangguangcailing, and east–west Mudanling. The west region comprises Songnen Plain and Liaohe Plain (Xiang et al., 2023). Jilin Province experiences a temperate continental monsoon climate, with low temperatures and dry weather in spring, a warm and rainy summer, a cool and dry autumn, and winter characterized by long, cold, and dry weather. From southeast to northwest, the climate of the province shifts from humid to semi-humid to semi-arid. The annual average temperature varies between 2–6°C, and the annual average precipitation is 400–900 mm. The zonal vegetation is mainly temperate broad-leaved mixed forest and temperate coniferous broad-leaved mixed forest (Wang et al., 2011; Fan et al., 2016).
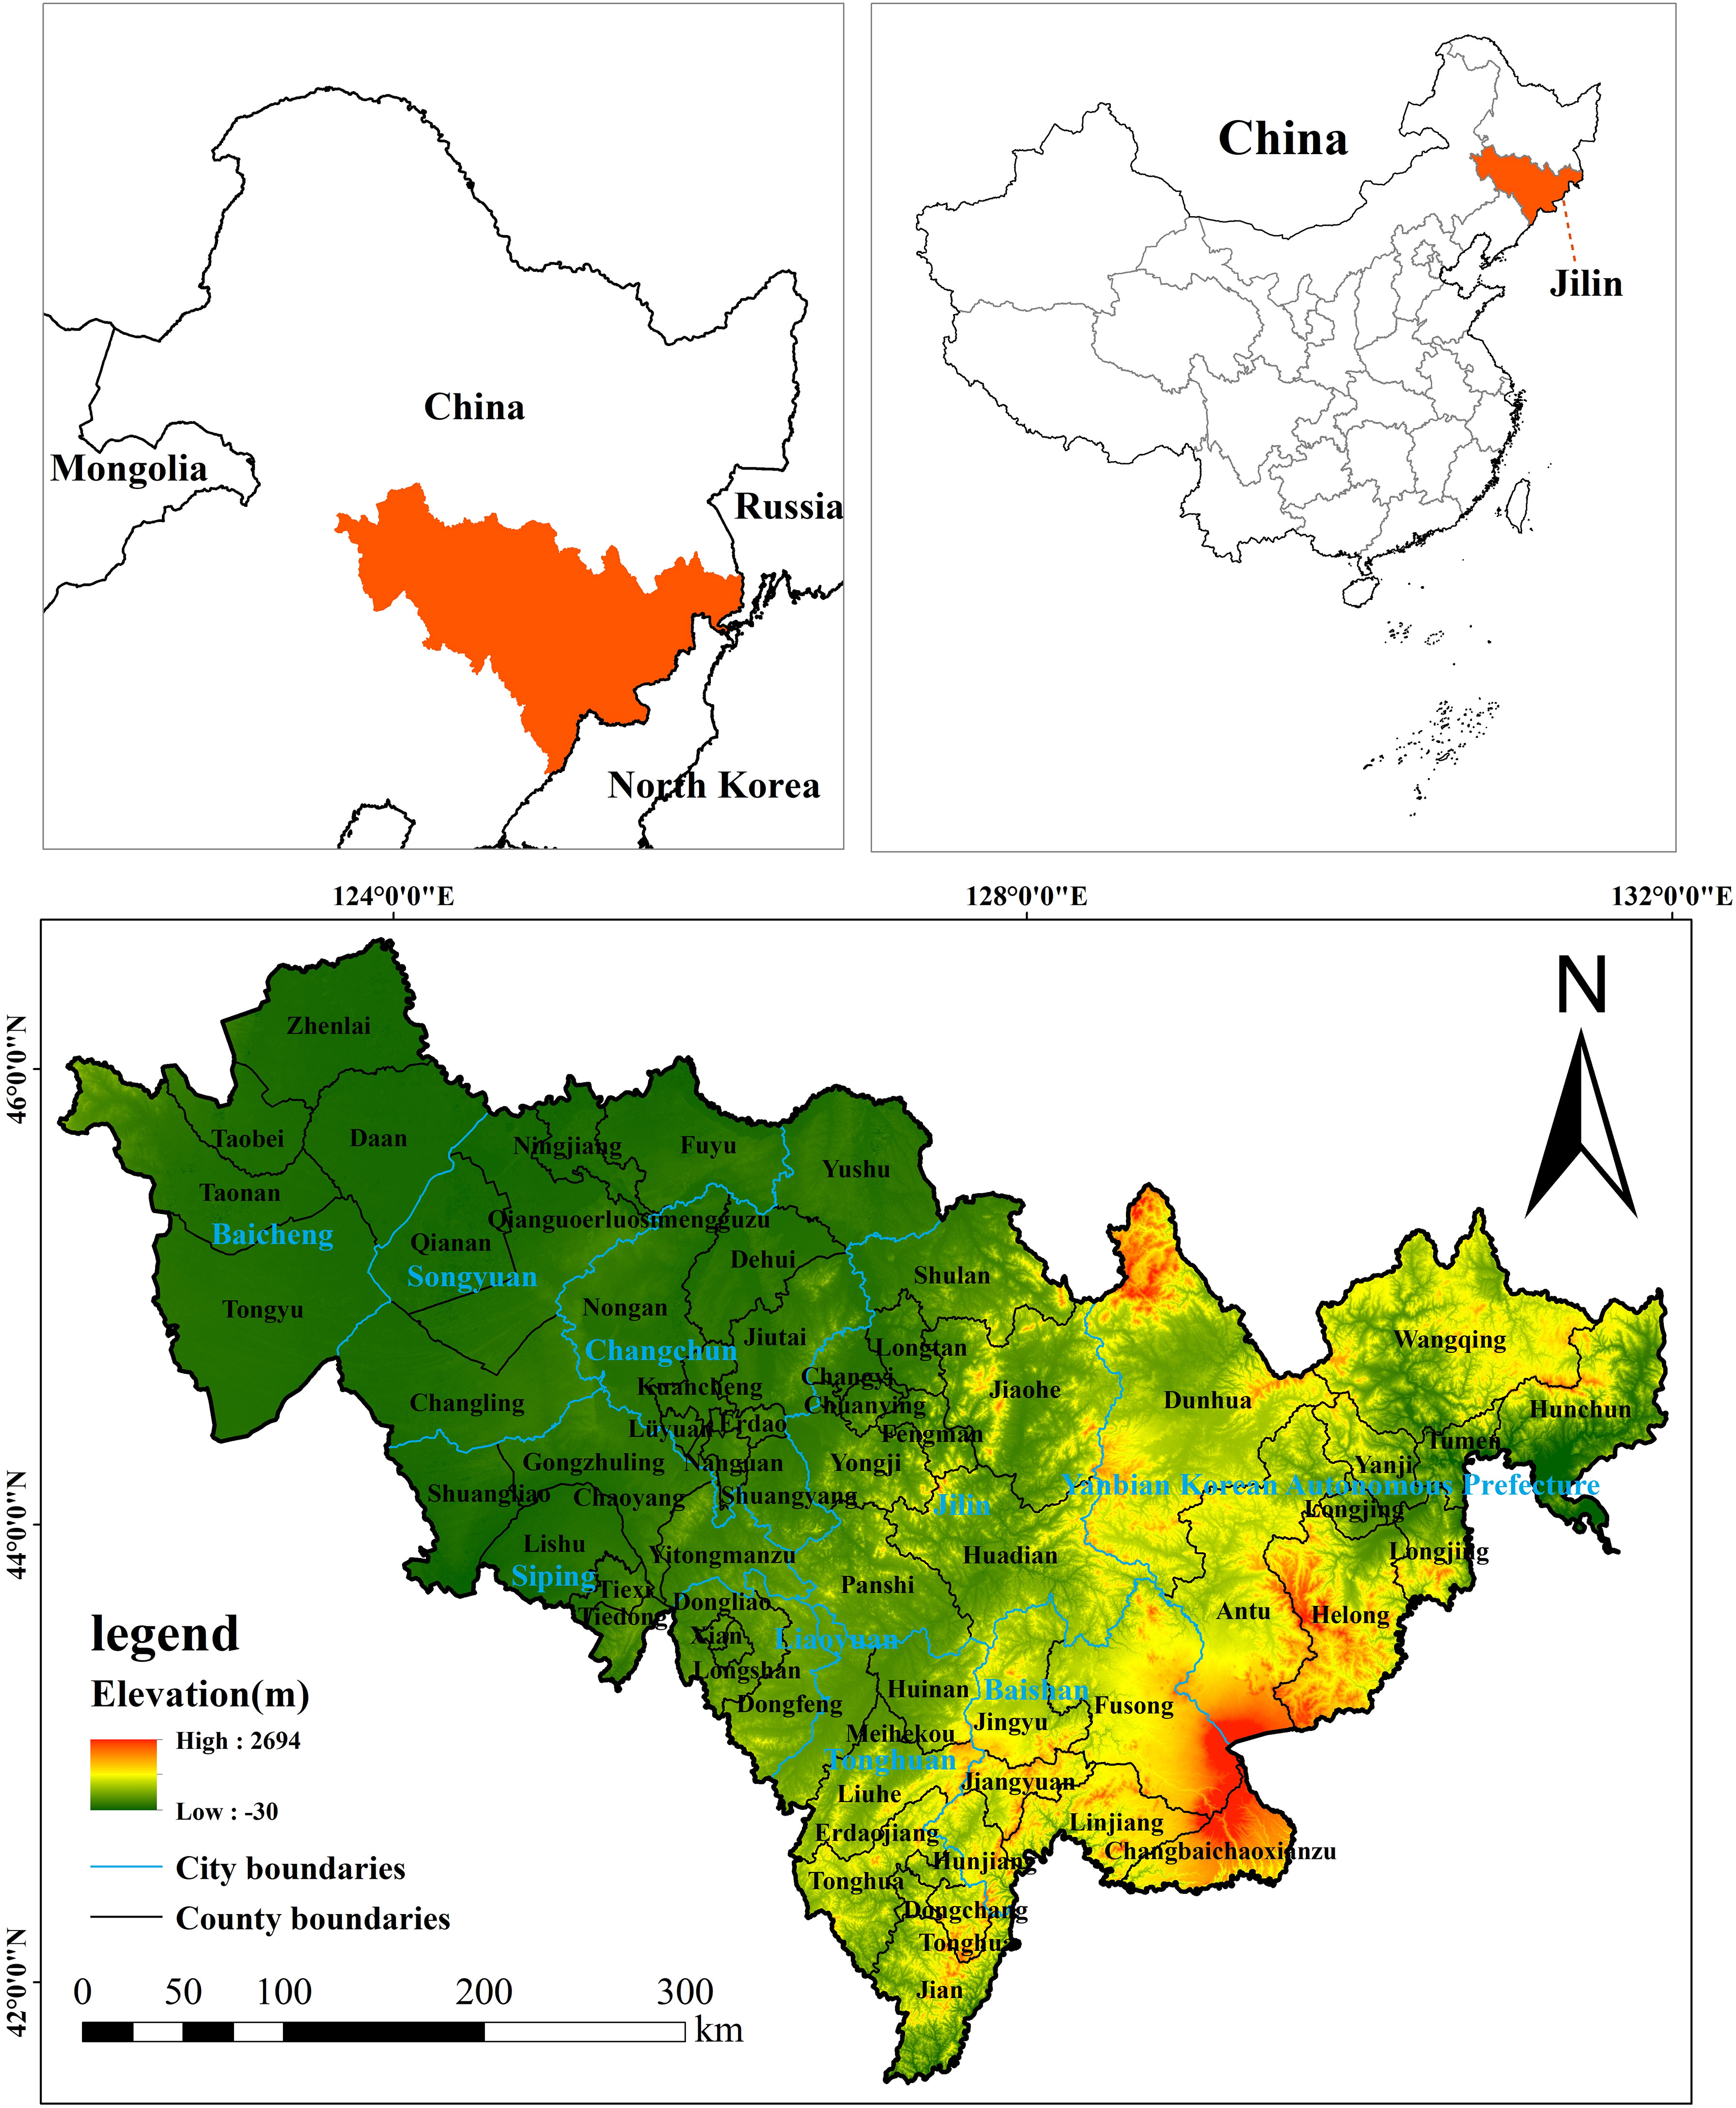
Figure 1 Location, division, and altitude of Jilin Province.
2.2 Data source and description
Table 1 explains in detail the data required for model calculation.
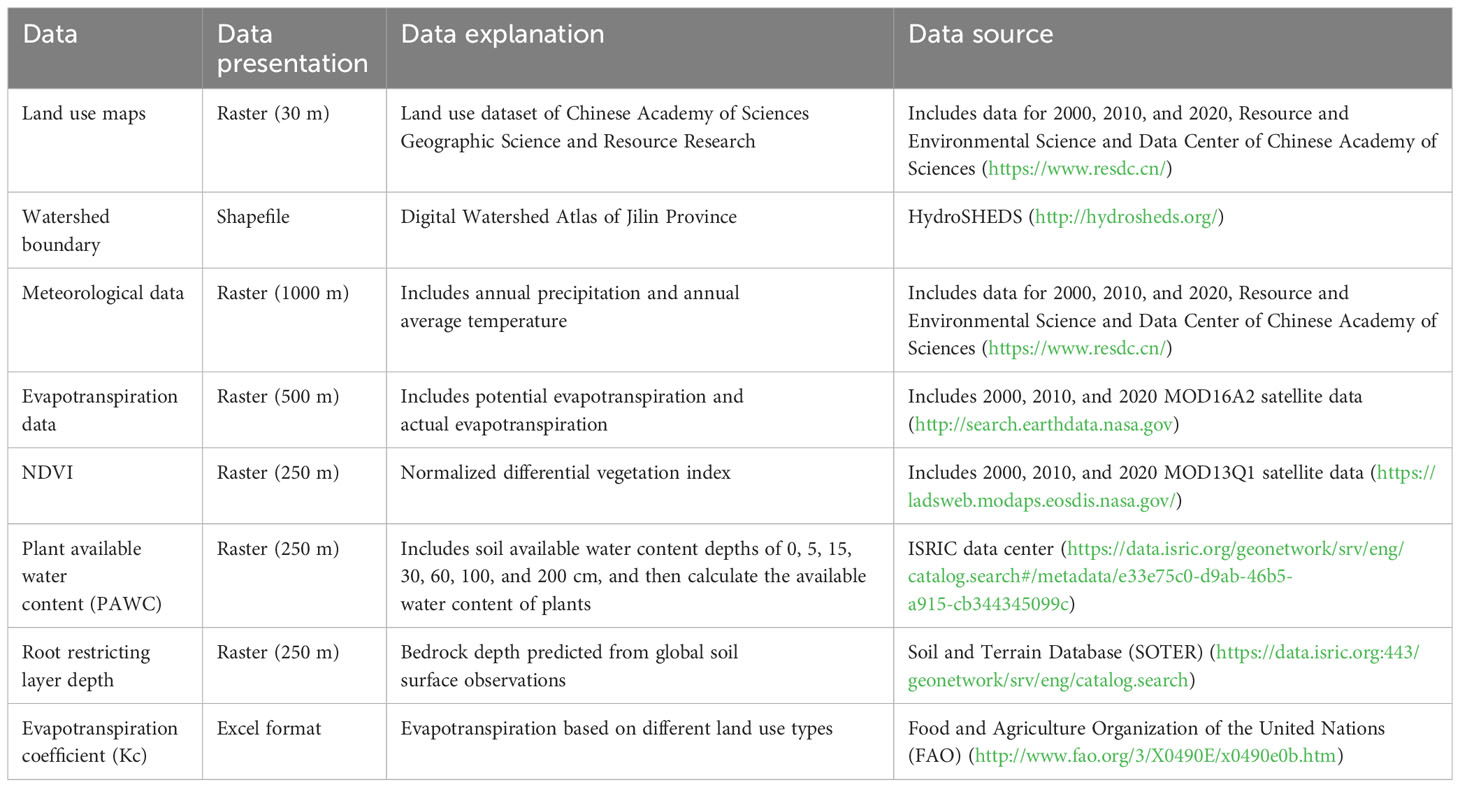
Table 1 Data used to calculate water yield, water conservation, and influencing factors: watershed boundary, land use, meteorology, NDVI, elevation, plant available water content, root depth, evapotranspiration coefficient, etc.
2.3 Methods
2.3.1 Simulation of water production
In this study, the water production module in InVEST 3.13.0 was used to assess the spatial distribution and changes in water production in Jilin Province. This module is a water balance-based estimation method, where the actual water yield is computed by subtracting evapotranspiration from the precipitation of each grid unit to obtain the water yield for the grid unit (Huang et al., 2023). The model is described by Equations (1)–(6):
Where Yxj stands for the water yield generated by the grid unit’s jth land use type; AETxj represents the annual actual evapotranspiration of the grid cell x of the jth land use type; PETxj denotes the potential evapotranspiration for grid unit x of the jth land use type; Px signifies the annual precipitation within raster cell x; ωx indicates a non-physical parameter of natural climate-soil properties; ET0xj represents the reference evapotranspiration of the grid cell x of the jth land use type; Kj indicates the vegetation evapotranspiration coefficient of the jth land use type; AWCx represents the volume of plant available water content for the grid cell x; Z indicates Zhang’s coefficient, which is a seasonal constant; Rest_layer_depth represents the depth of the root-limiting layer; root_depth represents the depth of the root; and PAWC corresponds to the available water content of the plant.
The input variables to the model include potential evapotranspiration, precipitation, land use, plant available water content, root-limiting layer depth, watershed boundary, vegetation evapotranspiration coefficient, root depth, and Z coefficient. All data were set as unified projection coordinates. The root-limiting layer depth data were obtained from the Soil and Terrain Database (SOTER). Similarly, the available water content of plants was estimated from the soil water bulk density across seven different depths until the withering point provided by the International Soil Reference and Information Centre (ISRIC) data center (Hengl et al., 2017). Vegetation evapotranspiration coefficient and root depth were obtained from the InVEST user manual and other references (Bai et al., 2019; Liu et al., 2019). The value of the Z coefficient corresponded to 9.731, which was obtained through repeated verification of the simulated data on water production and surface water resources in Jilin Province.
2.3.2 Estimation of water conservation
The InVEST modeling tool was utilized to calculate water yield. The extended model of water conservation was employed (Bai et al., 2019) to compute the overall water conservation volume (WR) by subtracting the surface runoff from the water yield. The calculations were performed using Equations (7) and (8):
Where WRxj represents the water holding capacity of the grid unit x of the jth land use type; Yxj represents the water yield of the jth land use type of the grid unit x; Runoffxj represents the annual surface runoff of the jth land use type grid unit x; Px indicates the annual precipitation of the grid cell x; and Cxj represents the surface runoff coefficient of the jth land use type of the grid unit x. The surface runoff coefficients of various land use types were gathered from the Ministry of Ecology and Environment of the People’s Republic of China’s “Guidelines for the Delineation of Ecological Protection Red Lines” (May 2017 edition) and other references (Bai et al., 2019).
Changes in water conservation as a result of driving factors at the sub-basin level were investigated, with a total of 1648 sub-basins. The dependent variable was the difference between water conservation in 2020 and water conservation in 2000. The “Spatial Analyst Tools”, “Zonal”, and “Zonal Statistics as Table” tools of ArcGIS 10.8 were utilized to further process the calculated grid data of water conservation in the entire province for determining the average value of the variation in water conservation in each sub-basin.
2.3.3 Selection and treatment of driving factors
Representative, easily accessible, and quantifiable driving factors associated with changes in water conservation functions were selected based on three aspects: climate, vegetation, and anthropogenic activities. Precipitation and actual evapotranspiration directly influence water production, while temperature and aridity index (AI) have an indirect effect on water conservation by influencing precipitation and evapotranspiration. AI represents the ratio of potential evaporation to precipitation (Yang et al., 2021a). Vegetation contributes to water conservation by reducing the rate of surface runoff. NDVI, forest land coverage, and grassland coverage were used as parameters for highlighting the status of vegetation. Cultivated land coverage and urban-rural and industrial-mining land coverage were used to represent the impact of anthropogenic activities (Table 2). The variation in each driving factor’s value from 2000 to 2020 served as an independent variable for the analysis of the driving factors of water conservation.
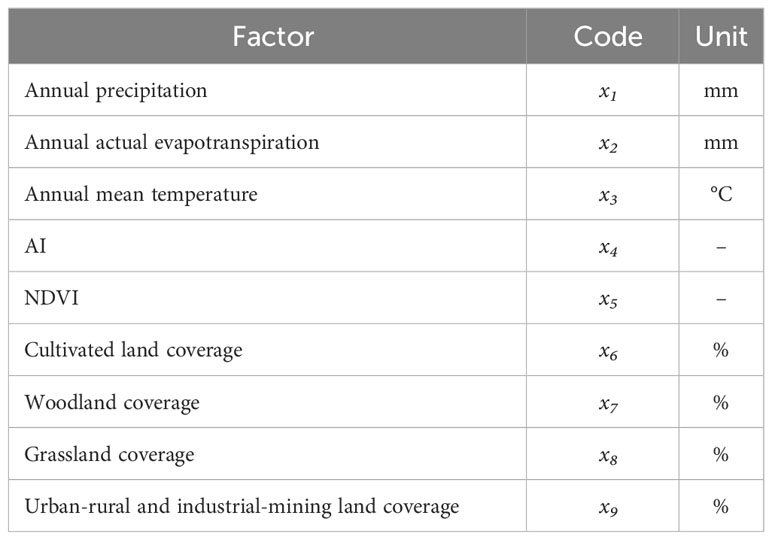
Table 2 Factors influencing the changes in water conservation function from 2000 to 2020.
The “Spatial Analyst” and “Zonal” tools of ArcGIS 10.8 were employed to determine the average value of each independent variable for each sub-basin. Since geographic detectors can only calculate discrete variables, the K-means clustering method in SPSS 25 was employed to transform the nine continuous independent variables into discrete independent variables. This method is based on the Euclidean distance, where the continuous data is divided into K different categories, resulting in a higher degree of similarity for the same type of data and a lower degree of similarity for different types of data. This method is suitable for the discretization of continuous data (Li et al., 2022; Wu et al., 2022).
2.3.4 Geodetectors
In this study, sub-watersheds were considered as spatially differentiated units, and geographic detectors were utilized to examine the major drivers of changes in water conservation. For this purpose, factor detection and interaction detection of the geographic detector model were predominantly employed. Factor detection was used to assess how well each dependent variable describes the independent variable, whereas interactive detection was used to analyze the influence of the combined effect of two dependent variables on the explanatory power of the dependent variable (i.e., increase, decrease, or no effect) (Chen et al., 2019; Hu et al., 2021). The strength of the explanatory power is represented by the q value (Hu et al., 2021; Yang et al., 2022). The dependent variable and discretized independent variable were loaded into the geographic detector software (http://geodetector.cn/), which was compiled using Excel. The expression for the q statistic is given by Equation (9):
Where q represents the explanatory strength of the discretized independent variable to the dependent variable (representing the variation in water conservation). The q value range is [0, 1], and the value of q represents the strength of explanatory power. h = 1, 2, 3 …; L indicates the stratification of the independent variable x; and denote the number of samples and variance of layer h, respectively; and N and represent the overall size of the sample (total number of sub-basins) and variance, respectively.
2.3.5 Multi-scale geographically weighted regression
The local regression model minimizes errors arising from differences in spatial variables and, in doing so, assesses the extent to which various driving factors influence changes in water conservation across diverse locations (Hu et al., 2021). MGWR 2.2.1 software, released by the University of Arizona, was used for regression analysis to examine the spatial differences and spatial scale of the influence of each driving factor on the change in water conservation. GWR is a single-scale local spatial regression model. The parameters needed during the modeling process include the bandwidth and the kernel function. The bandwidth determines the fitting range of the model, whereas the kernel function determines the weight distribution of each spatial position to the surrounding data (Sannigrahi et al., 2020; Wang et al., 2022a). MGWR is a multi-scale local spatial regression model developed to improve GWR. MGWR changes the assumption that a single scale is necessary for the modeling process. The regression coefficient of the driving factor represents the spatial response relationship between the changes in water conservation and the driving factor. The adjusted R2 value describes the fitting effect of the model. Considering the sub-basin as a unit, the regression model expressions for GWR and MGWR are given by Equations (10) and (11), respectively (Shen et al., 2020):
In Equation (10): yi is the dependent variable of the ith sub-basin; is the ith independent variable of the jth sub-basin; is the intercept; represents the regression coefficient of the jth driving factor in the ith sub-basin; m indicates the number of drivers; n is the number of sub-basins; and represents the random error term. In Equation (11): is the regression coefficient after correction of the bandwidth for the jth driving factor in the ith sub-watershed, and bwj in βbwj signifies the bandwidth utilized for calibrating the jth driving factor.
Setting of model parameters: The dependent variable corresponded to the variation in water conservation, and the independent variable corresponded to the variations in nine driving factors. In the software, the “Fixed and Gaussian” feature was selected for kernel space, the “Gloden Section” feature was selected for bandwidth search, “Gaussian” was selected for model type, and “AICc” was used as the optimization criterion. Subsequently, the calculations associated with the GWR and MGWR models were performed.
3 Results
3.1 Changes in land use
The major types of land use in Jilin Province include cultivated land and forest land, followed by grassland, urban-rural and industrial-mining land, water area, and wetland (Figure 2). Iin Jilin Province during the past two decades, the area of cultivated land has increased by 1075.41 km2, the area of forest land has decreased by 553.52 km2, the area of grassland has decreased by 1231.36 km2, the area of water has decreased by 632.13 km2, the area of urban-rural and industrial-mining land has increased by 1474.62 km2, the area of wetland has increased by 324.82 km2, and the area of other land has decreased by 474.05 km2 (Table 3).
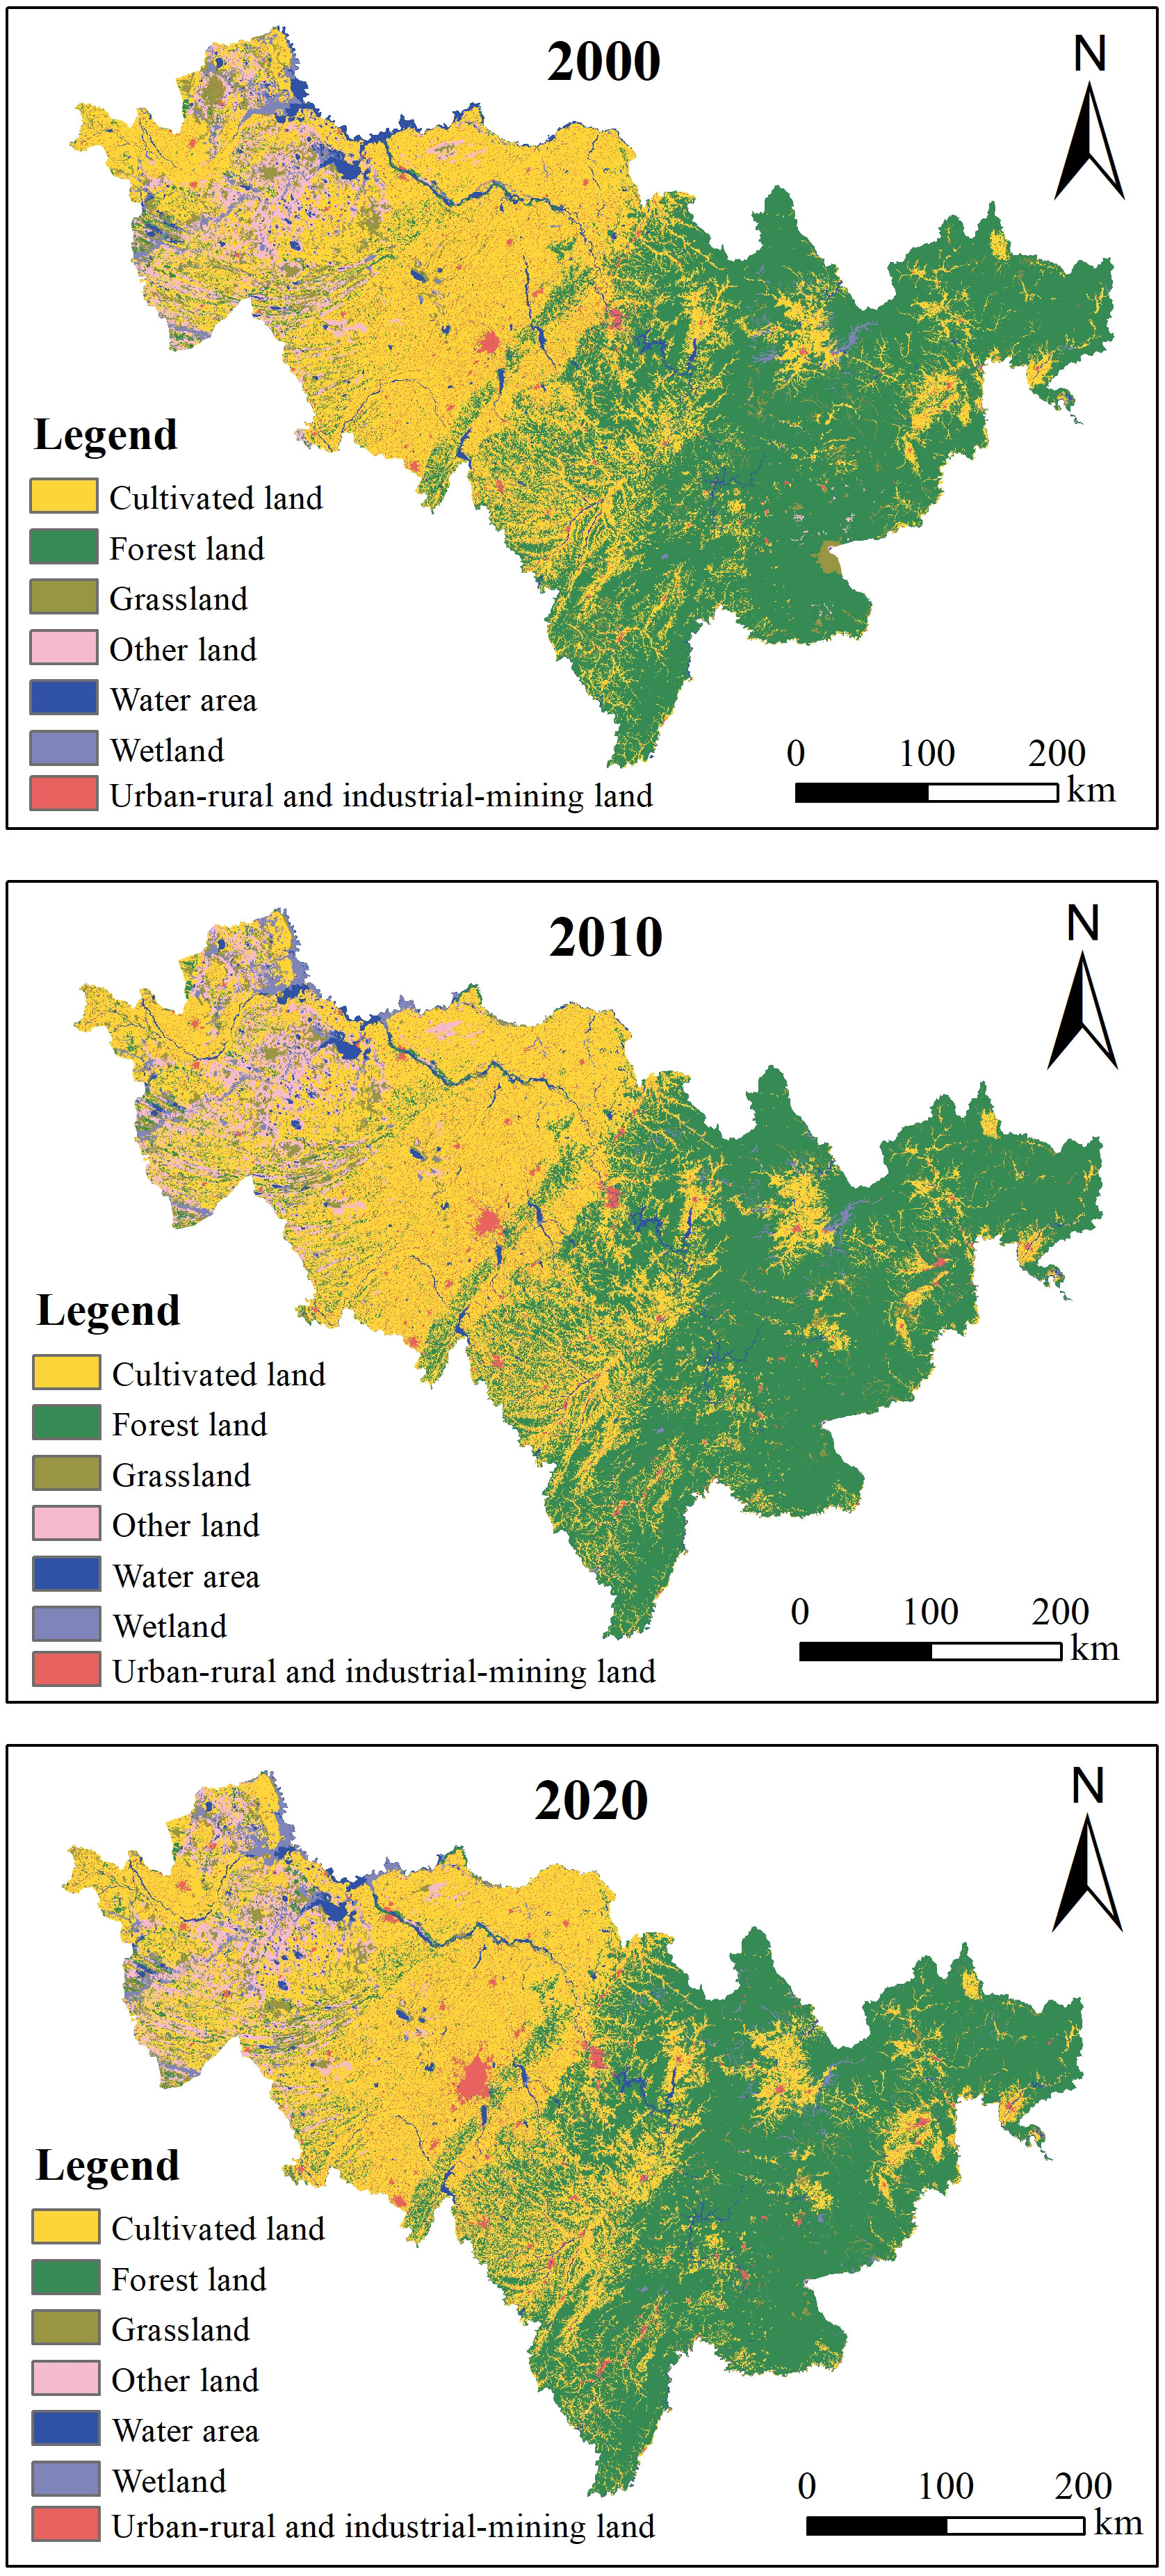
Figure 2 Land use types in Jilin Province from 2000 to 2020.
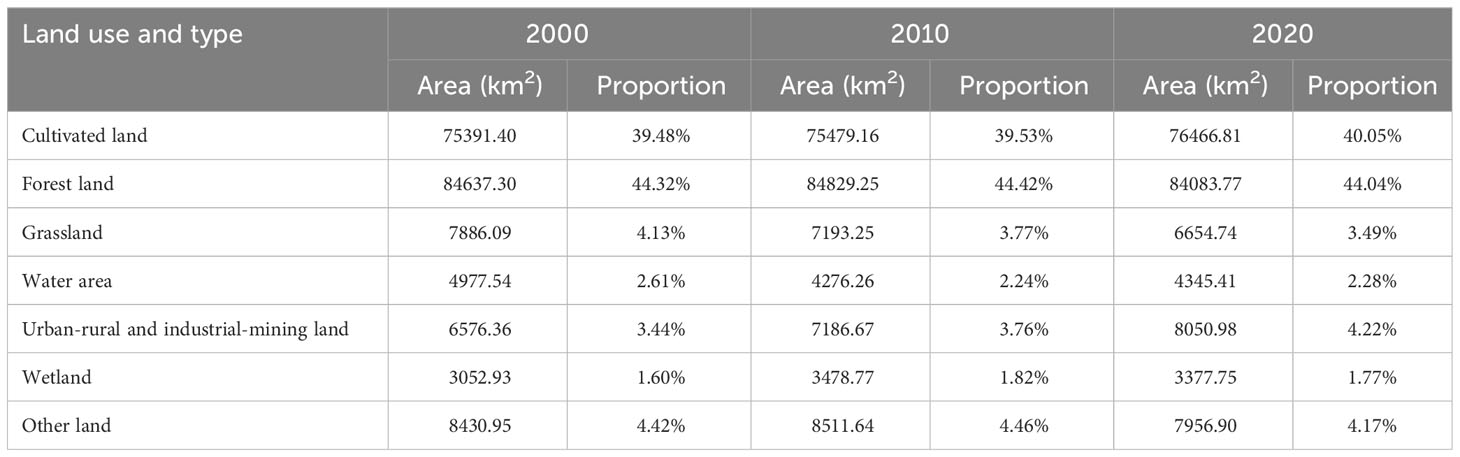
Table 3 Area and proportion of different land use types in Jilin Province in 2000, 2010, and 2020.
The increase in cultivated land is mainly attributed to the conversion of forest land, grassland, and urban-rural and industrial-mining land. The decrease in forest land is mainly attributed to the conversion of cultivated land and grassland. The decrease in grassland is mainly attributed to the conversion of cultivated land, forest land, and other land. The reason for the decrease in water area is predominantly attributed to the conversion of cultivated land and wetland. The increase in urban-rural and industrial-mining land is mainly attributed to the conversion of cultivated land and forest land. The increase in wetland is predominantly attributed to the conversion of water area, forest land, cultivated land, and grassland. Additionally, the decrease in other land is mainly due to the conversion of cultivated land and grassland (Figure 3).
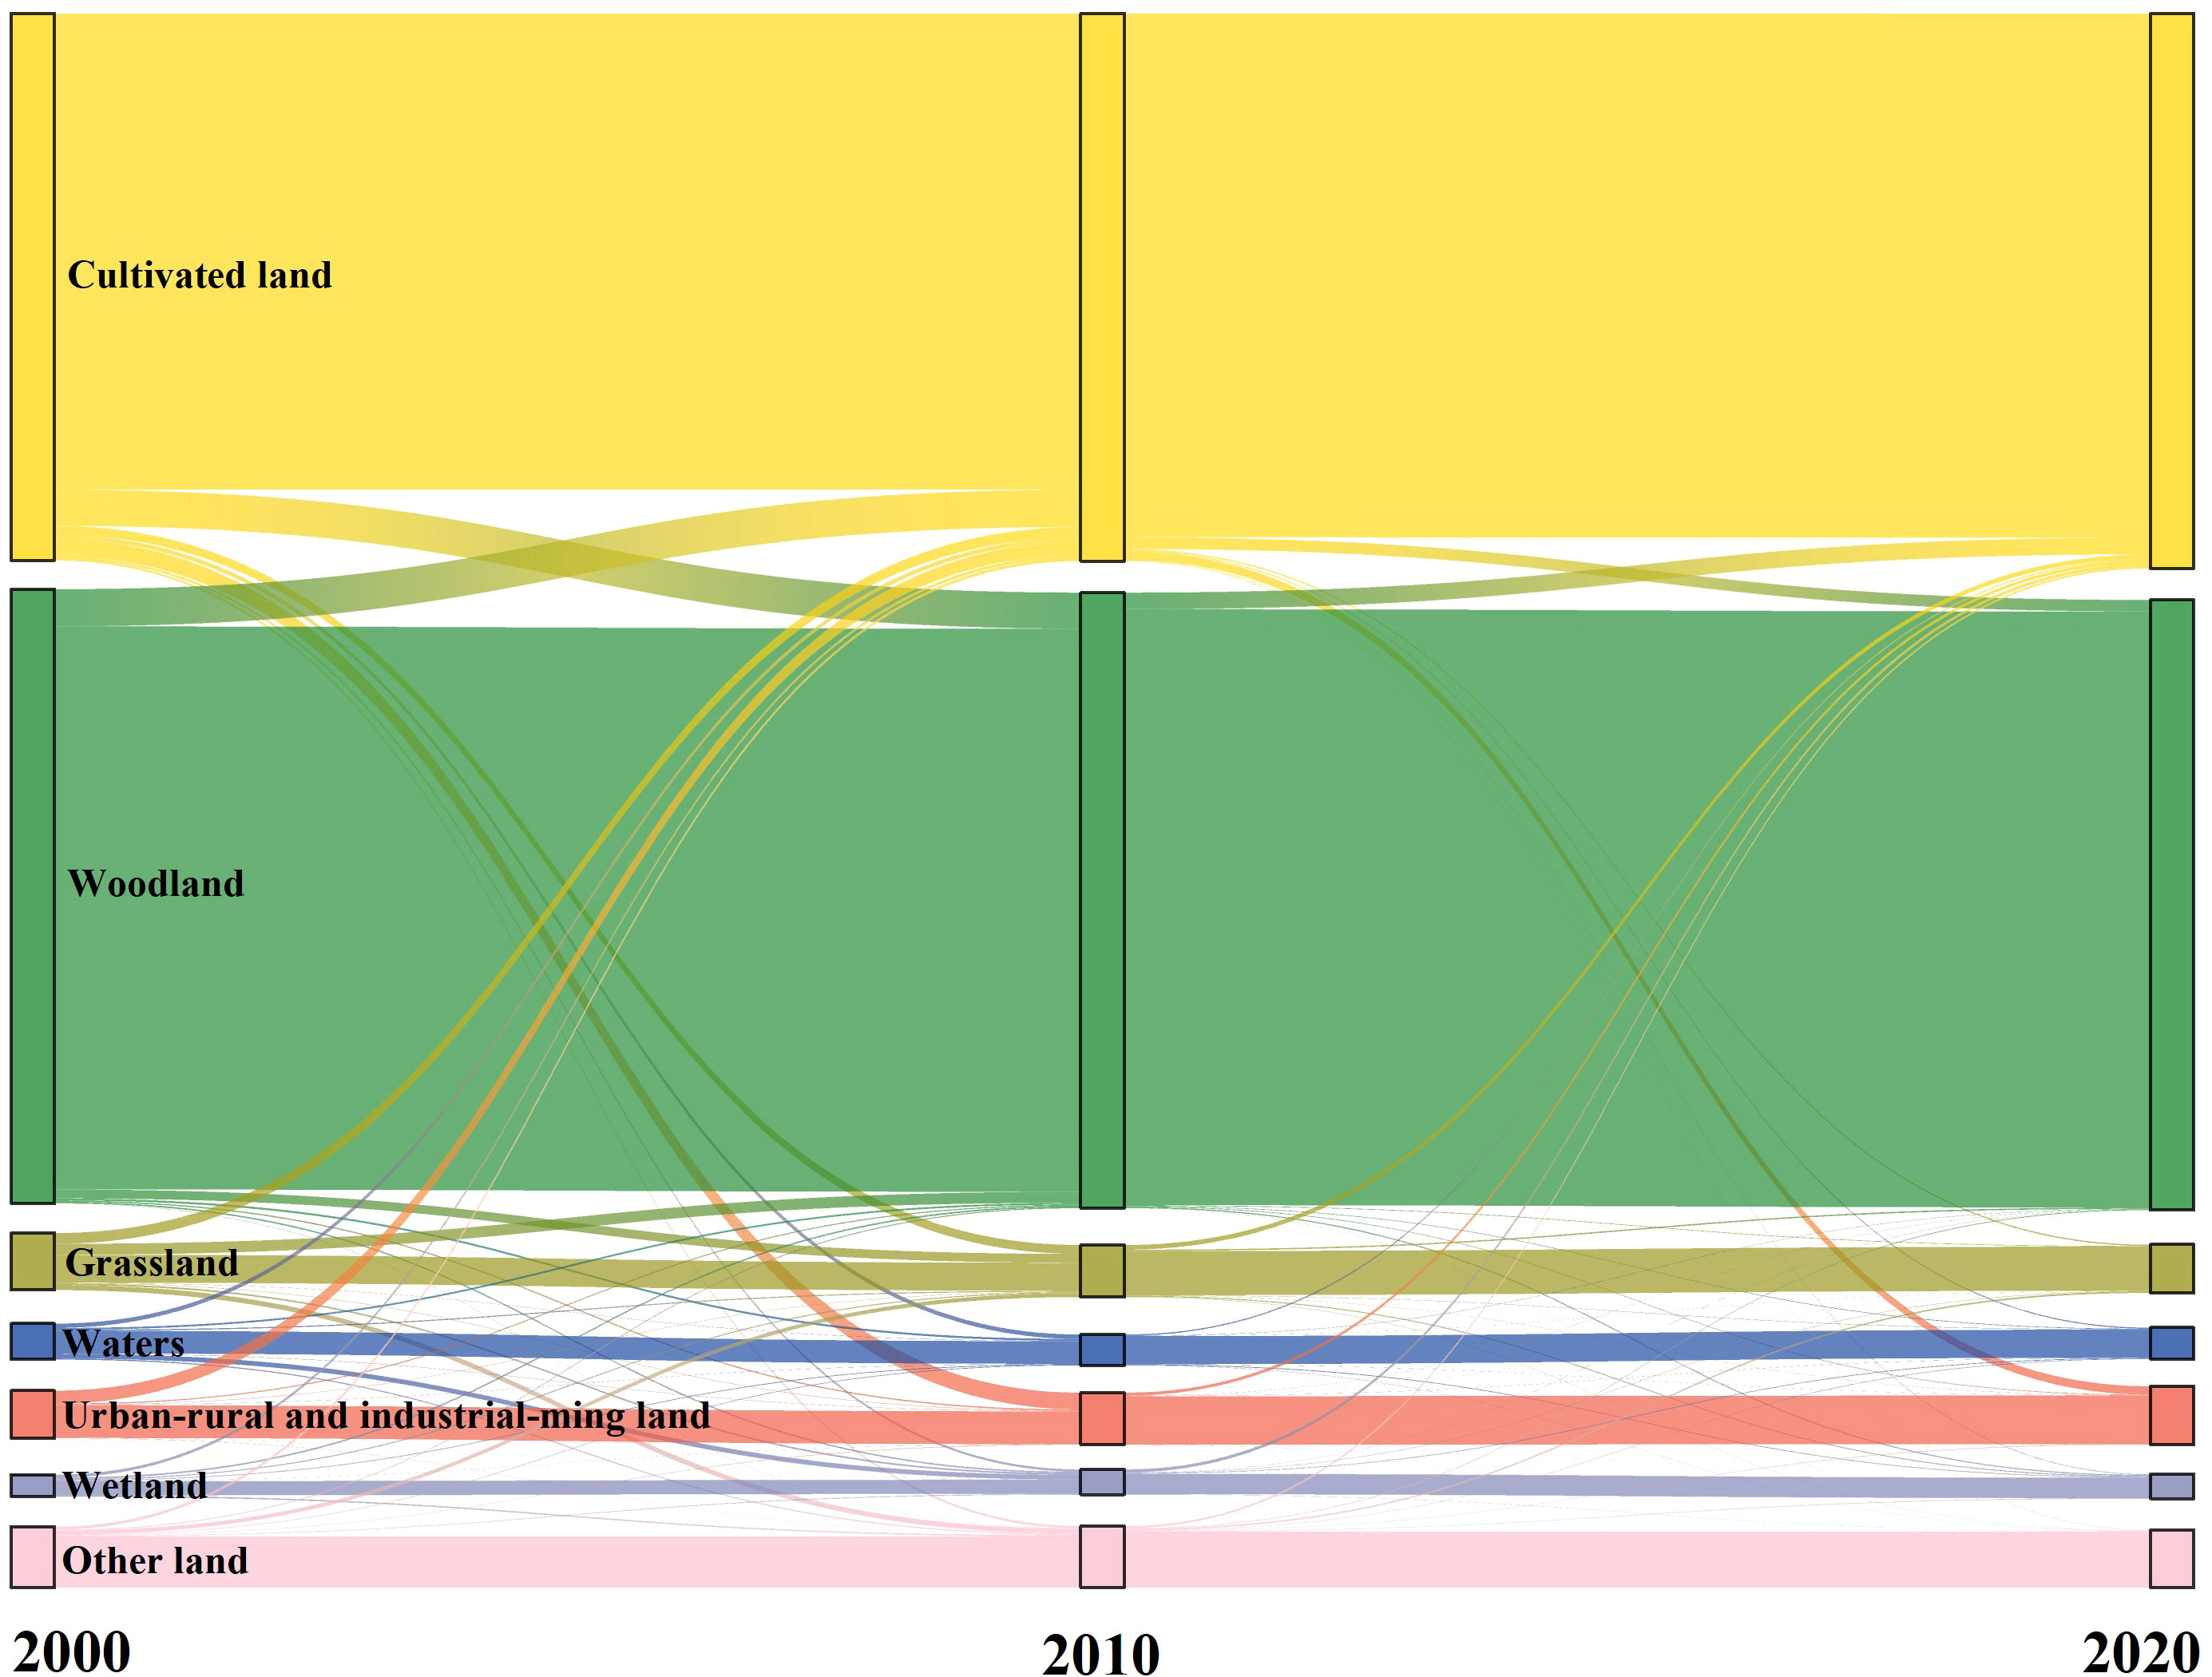
Figure 3 Conversion of different land use types in Jilin Province from 2000 to 2020.
3.2 Changes in water conservation functions over time and space
The total amount of water conservation in Jilin Province exhibited a trend of increase followed by a decrease. The amount was 18.42 × 10⁹ m3 in 2000, 40.73 × 10⁹ m3 in 2010, and 26.91 × 10⁹ m3 in 2020. The increase from 2000 to 2010 was 121.15%, and the decrease from 2010 to 2020 was 33.92%. The water conservation per unit area of the province also exhibited a trend of increase followed by a decrease, with values of 87.14 mm/m2 in 2000, 192.74 mm/m2 in 2010, and 127.28 mm/m2 in 2020 (Table 4).
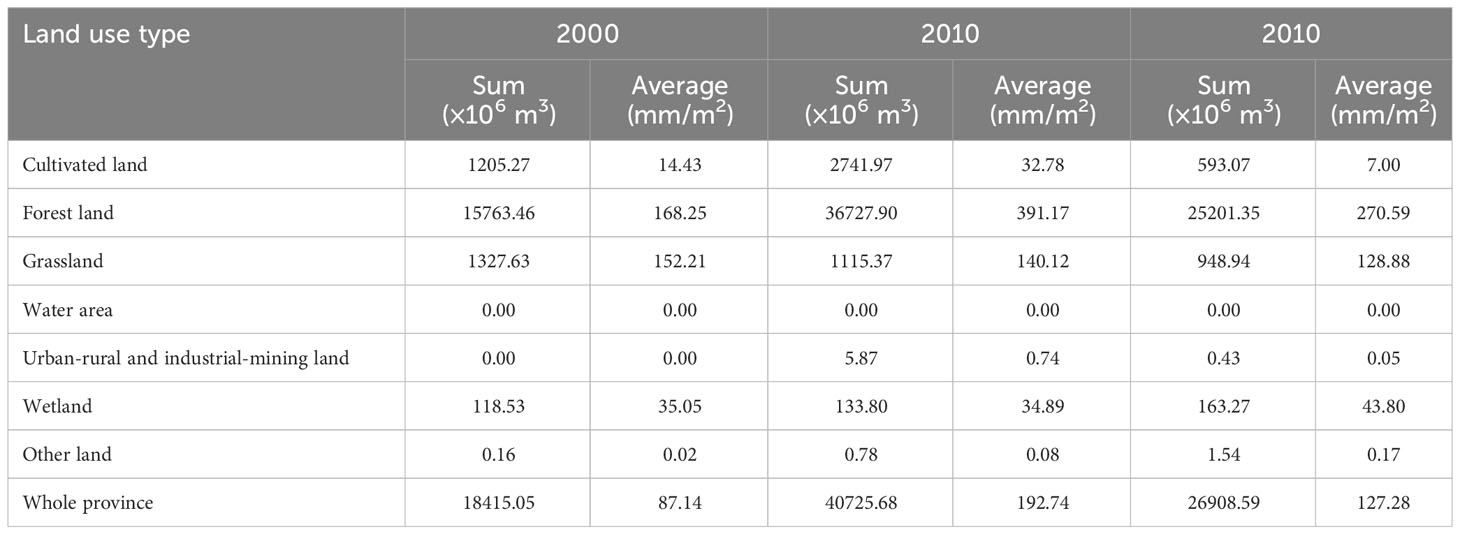
Table 4 Water conservation of different land use types in Jilin Province in 2000, 2010, and 2020.
The water conservation per unit area for the forest land, cultivated land, and urban-rural and industrial-mining land exhibited the trend of an increase followed by a decrease. However, in the case of wetland, a trend of decrease followed by a continuous increase was observed. Furthermore, grassland exhibited a decreasing trend, while other land exhibited an increasing trend. From 2000 to 2020, the water conservation per unit area for forest land, urban-rural and industrial-mining land, other land, and wetland increased by 102.34 mm/m2, 0.05 mm/m2, 0.15 mm/m2, and 8.75 mm/m2, respectively, whereas that for grassland and cultivated land decreased by 23.33 mm/m2 and 7.43 mm/m2, respectively. Based on the total water conservation volume, forest land exhibited the highest capacity, followed by cultivated land, grassland, wetland, urban-rural and industrial-mining land, and other types of land. The water conservation capacity was the lowest for the water area (Table 4).
The spatial distribution of water conservation in Jilin Province was uneven. It was predominantly concentrated in the mountainous areas east of the Dahei Mountains, and less concentrated in the western plains. Water conservation was highly concentrated in the Laoling Mountains, along the main line of the Changbai Mountains, Zhangguangcailing Mountains, Mudanling Mountains, and Laoyeling Mountains. Conversely, low values of water conservation were obtained in the western plains (Figure 4A-C). In the last two decades, there has been a significant change in water conservation in the entire province, demonstrating a trend of overall increase, with significant regional differences (Figure 4D). Specifically, a significant increase in water conservation was observed in the Zhangguangcailing Mountains, Laoling Mountains, Mudanling Mountains, and Jilinhadaling Mountains. However, there was a decrease in the amount of water conservation in a large area near the Laoyeling Mountains. The water conservation in the western plains remained relatively stable.
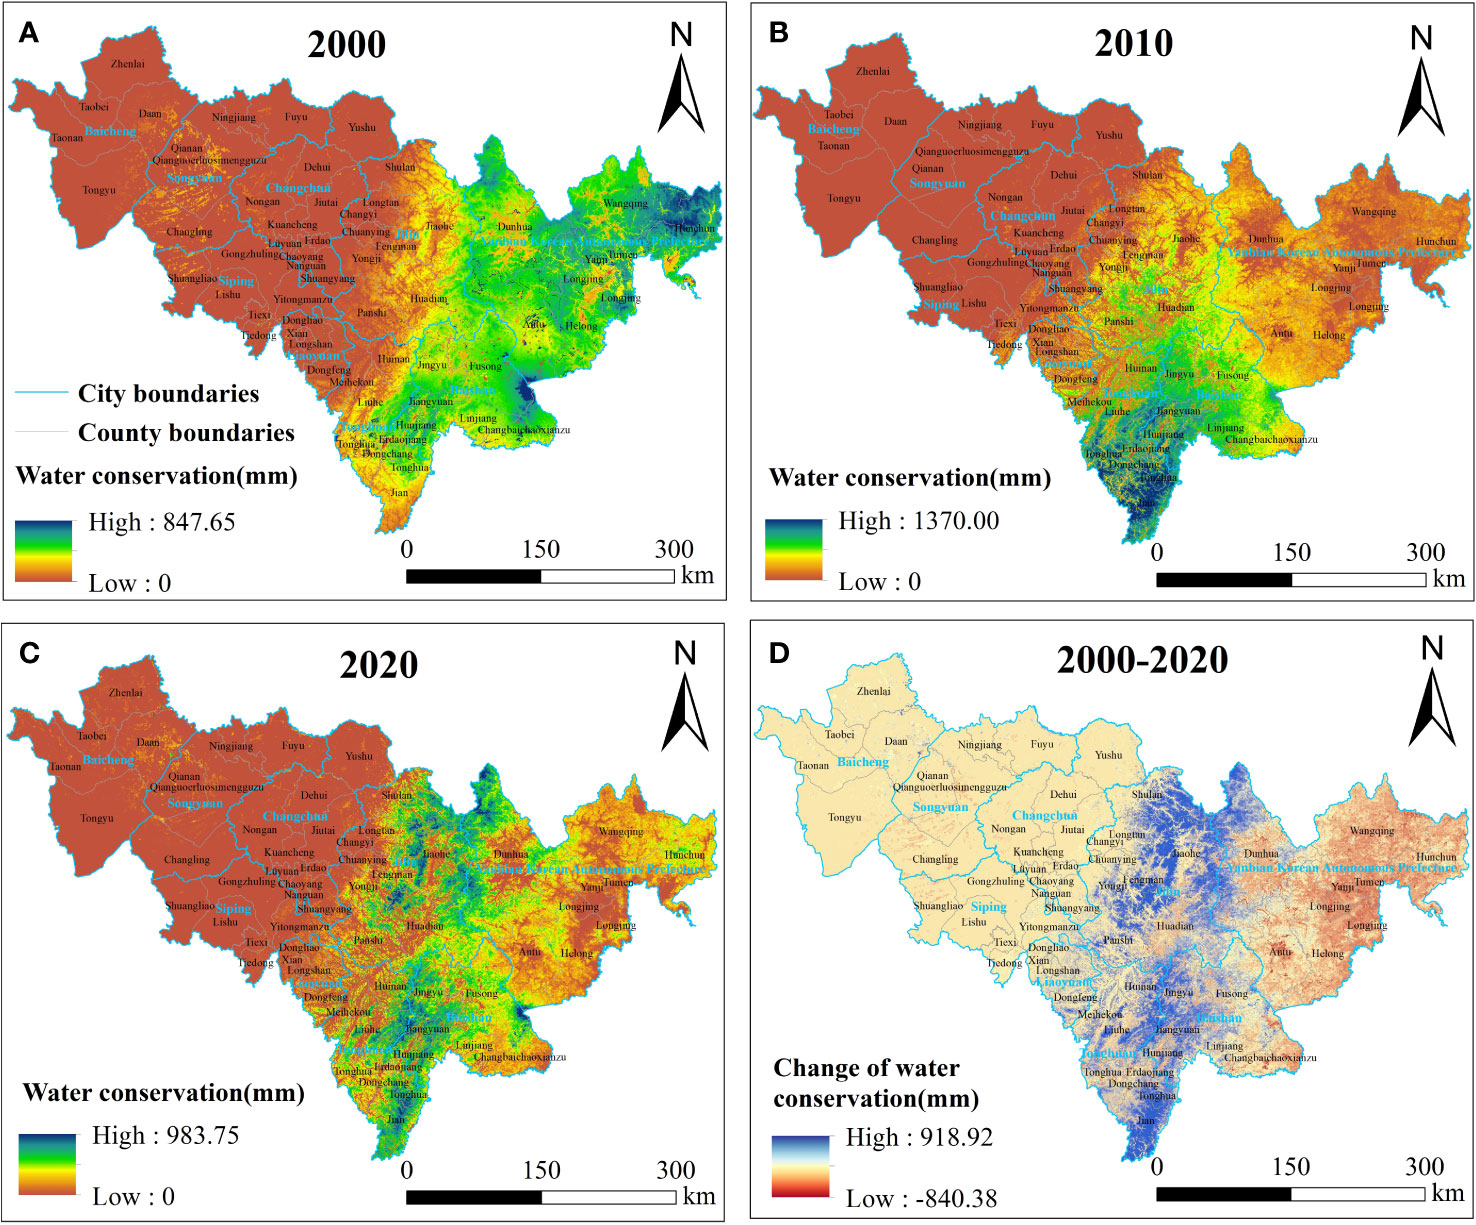
Figure 4 Spatial distribution and changes in water conservation in Jilin Province in (A) 2000, (B) 2010, (C) 2020, and (D) 2000-2020.
In terms of administrative regions, the spatial variation in water conservation in Jilin Province from 2000 to 2010 primarily exhibited an increasing trend. The average water conservation in all regions, including Baishan City and Tonghua City, Chuanying District, Fengman District, Jiaohe County, Longtan District, Panshi County, Yongji County of Jilin City, Dongfeng County, Dongliao County, and Longshan District of Liaoyuan City increased significantly (increase ≥100 mm/m2). In contrast, the average water conservation in Tumen County, Wangqing County, and Longjing County of Yanbian Korean Autonomous Prefecture decreased significantly (decrease ≤−100 mm/m2). From 2010 to 2020, the spatial variation in water conservation in Jilin Province primarily exhibited a decreasing trend. The average water conservation in all regions, including Baishan City, Dongchang District, Erdaojiang District, Ji’an County, Liuhe County, Meihekou County, Tonghua County, Huinan County of Tonghua City, Dongfeng County of Liaoyuan City, Huadian County, and Panshi County of Jilin City decreased significantly. However, the average water conservation in Shulan County of Jilin City increased significantly. In summary, water conservation in Jilin Province over the last two decades initially increased and then decreased, with an overall increasing trend (Table 4).
3.3 Analysis of driving factors of changes in water conservation
The results of geographic detectors demonstrated that eight out of nine factors had a significant influence on the variation in water conservation function in Jilin Province (p< 0.05). The urban-rural and industrial-mining land coverage had no significant effect on the change in water conservation function (p = 0.06). The contribution of various driving factors of changes in water conservation was different. Precipitation, temperature, and evaporation had the highest q values of 0.3606, 0.1824 and 0.1059, respectively (Figure 5), indicating that these factors were the primary contributors to spatial variation in water conservation. The influence of land use type on alterations in water conservation functions can be summarized as: grassland > cultivated land > forest land > urban-rural and industrial-mining land, with q values of 0.0186, 0.0144, 0.0108, and 0.0057, respectively.
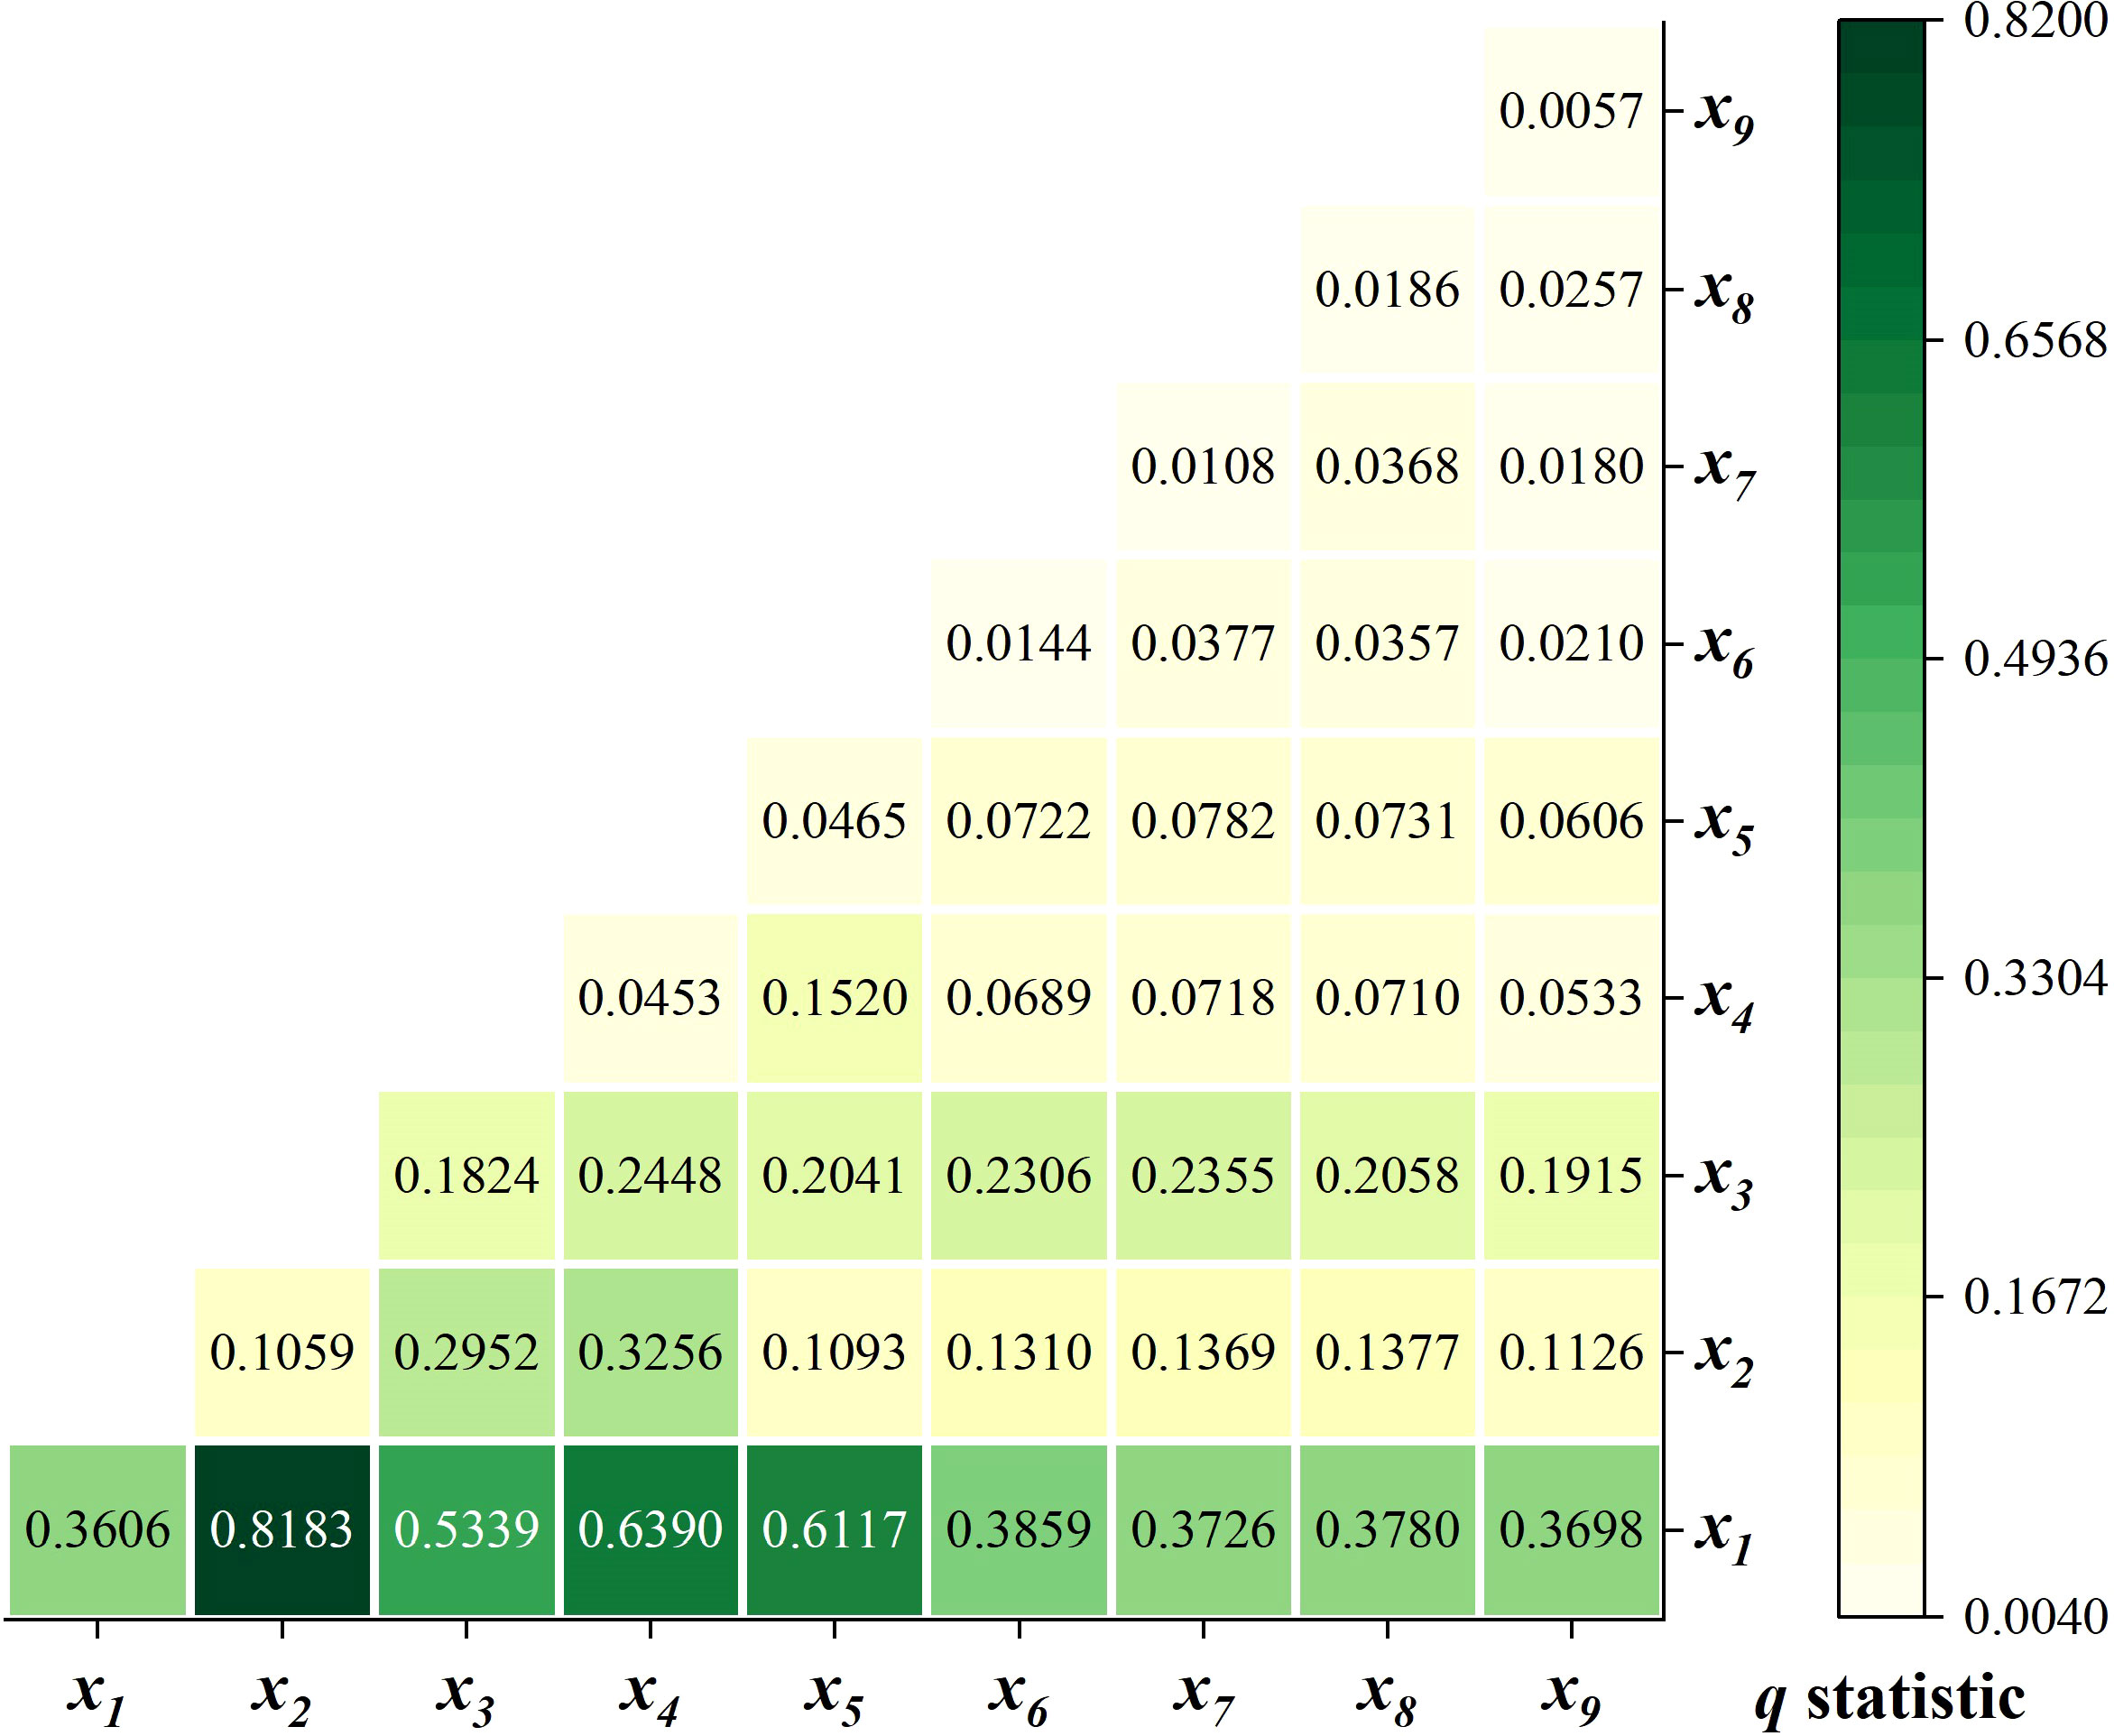
Figure 5 Single and interactive effects of driving factors on the changes in water conservation. Driving factors refer to the quantity of change from 2000 to 2020; see Table 2 for the meaning of x1–x9.
The interaction among various factors had a more significant influence on the changes in water conservation compared with any single factor, and it was primarily a non-linear enhancement (Figure 5). In the last two decades, the interaction between precipitation and evapotranspiration had the most significant influence on water conservation, followed by the interaction between precipitation and AI, precipitation and NDVI, and precipitation and temperature, with q values of 0.8183, 0.6390, 0.6177, and 0.5339, respectively.
3.4 Spatial differentiation of changes in water conservation in response to driving factors
As shown in Figure 4D, in the last two decades, spatial differences in the changes in water conservation were evident in Jilin Province. The global Moran’s index corresponded to 0.799, and the p-value was<0.001, indicating a significant spatial positive correlation with changes in water conservation. The highest values of water conservation were concentrated in the regions of Laoling Mountains, Jilinhadaling Mountains, and Zhangguangcailing Mountains, while the lowest values were concentrated in Laoyeling Mountains. No significant change was observed in the western plains. We utilized the MGWR model to examine the spatial distribution of the impact of various driving factors on water conservation. A higher value of R2 indicates that the model has stronger prediction ability and higher applicability, and a lower AICc indicates a more concise and reliable regression analysis of the model (Shen et al., 2020). The model results revealed that the parameters of MGWR showed better accuracy than those of OLS and GWR, implying a more accurate representation of the real situation by MGWR (Table 5).
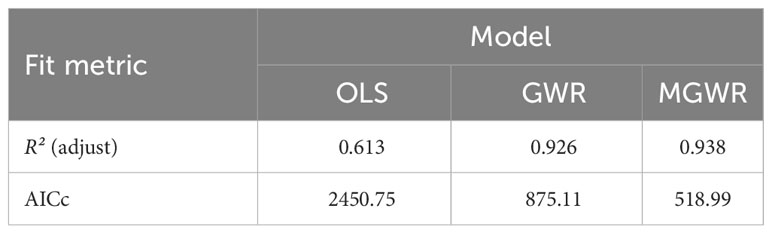
Table 5 Model fit metrics for ordinary least squares regression (OLS), geographically weighted regression (GWR), and multi-scale geographically weighted regression (MGWR).
Assessment of the MGWR model demonstrated that the nine driving factors selected in this study were able to account for 93.8% of the changes in water conservation. Moreover, under the same bandwidth of different driving factors, the higher regression coefficient indicated a more significant impact of the driving factors on the changes in water conservation. In the last two decades, the variation in water conservation in Jilin Province was positively correlated with precipitation (Figure 6B) and negatively correlated with actual evapotranspiration (Figure 6C). Furthermore, the correlation coefficient was higher along the line from Zhangguangcailing Mountains to Laoling Mountains. The correlation between water conservation and AI varied among different regions (Figure 6E). Among them, the northeast of Laoling Mountains, Jilinhadaling Mountains, and Zhangguangcailing Mountains demonstrated a positive correlation, whereas the main line of Changbai Mountains and Laoyeling Mountains demonstrated a negative correlation. Water conservation was positively correlated with forest coverage and grassland coverage (Figure 6H, I), and the correlation coefficients were higher in the Laoyeling Mountains, Jilinhadaling Mountains, and the main line of Changbai Mountains and Laoling Mountains. Cultivated land coverage and urban-rural and industrial-mining land coverage were negatively correlated with the changes in water conservation (Figure 6G, J), and the correlation coefficient was higher in the Zhangguangcailing Mountains.
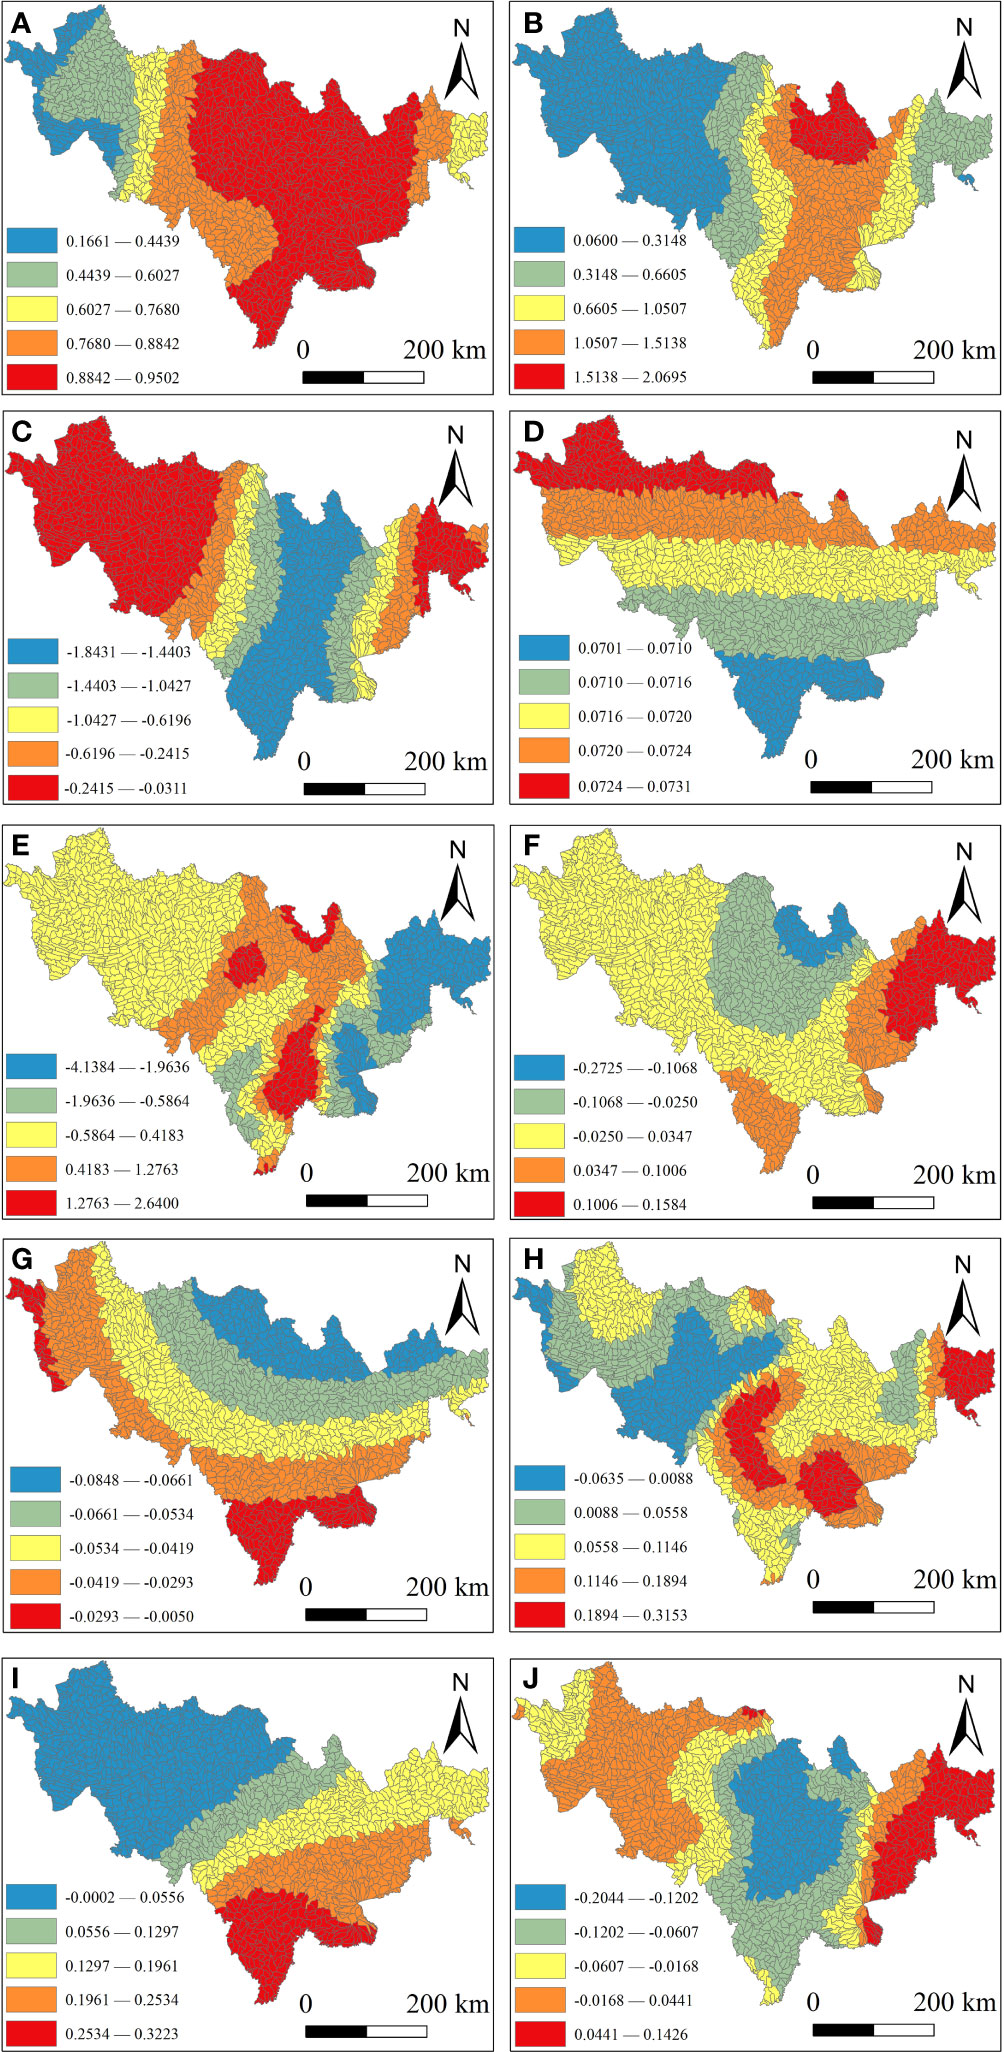
Figure 6 MGWR and local determination coefficients between changes in water conservation and driving factors. Driving factors refer to the changes from 2000 to 2020. Figures 6B, J are the regression coefficient of the driving factor. (A) R2; (B) Precipitation; (C) Actual evapotranspiration; (D) Average temperature; (E) AI; (F) NDVI; (G) Cultivated land coverage; (H) Forest land coverage; (I) Grassland coverage; (J) Urban-rural and industrial-mining land.
3.5 Spatial scale of changes in water conservation in response to driving factors
Table 6 shows that MGWR can describe different variables at different spatial scales, whereas GWR can only indicate the average value of each variable at a given spatial scale. The constant term represents the influence of different regions on the changes in water conservation when the driving factors are determined. The bandwidth of the constant term was 41, accounting for 2.48% of the total number of sub-watersheds. This corresponds to approximately 4662 km2 of area, which is close to the county-level administrative region. Among the various driving factors, the scale of AI was almost close to that of the county scale. The spatial scales of precipitation, evaporation, NDVI, forest land coverage, and urban-rural and industrial-mining land coverage were between the county and city scales, and the cultivated land coverage and grassland coverage were close to that of the city scale. The temperature corresponds to a global scale, with almost no spatial heterogeneity.
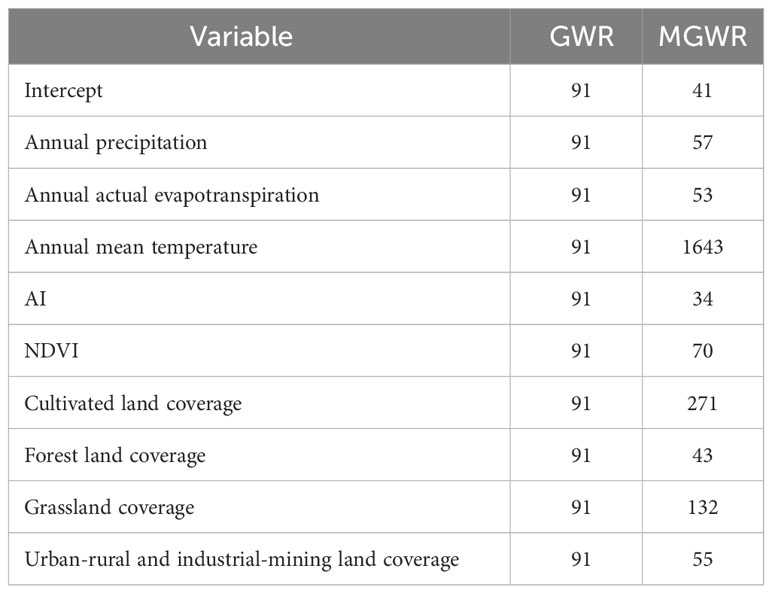
Table 6 Bandwidth of GWR and MGWR.
4 Discussion
4.1 Impact of climate change on water conservation
The assessment in this study was based on the water balance method, that is, the estimated capacity of water conservation, which was obtained by subtracting actual evapotranspiration from precipitation. In previous studies by researchers in China (Gong et al., 2017), water conservation in regions of the Qinghai–Tibet Plateau (Wang et al., 2022b), Shangluo City (Chen et al., 2016), the Han River Basin (Hu et al., 2022), the Jinsha River Basin (Liu et al., 2021), and the Qinling Mountains (Ning et al., 2020) exhibited significant correlation with precipitation, evapotranspiration, and other climatic factors. In this study, the precipitation in Jilin Province exhibited a substantial increase from 2000 to 2010, followed by a decrease from 2010 to 2020, mirroring the fluctuations in water conservation. Our geographic detector analysis revealed that precipitation exerted the most significant impact on water conservation, with a q value of 0.3606 (Figure 5), indicating that precipitation was the most significant driving factor. For example, the large-scale decline in water conservation in Hunchun County and surrounding areas was directly related to the decrease in precipitation. The impact of temperature on water conservation was second only to that of precipitation, with a q value of 0.1824, but the positive and negative relationship and spatial heterogeneity of the impact of temperature on water source conservation were not obvious. Actual evapotranspiration also had a significant influence on water conservation, with a q value of 0.1059. The interaction between precipitation and evapotranspiration directly affected water conservation at a regional scale, with a q value of 0.8183. Among them, Changling County, Qian’an County, and Qianguoerluosimengguzu Autonomous County of Songyuan City exhibited the most significant reduction in water conservation due to an increase in evaporation. The correlation between precipitation and drought was second only to the correlation between precipitation and evapotranspiration, with a q value of 0.6390. Specifically, the reduction in water conservation of Yanji City, Tumen County, and Longjing County of Yanbian Korean Autonomous Prefecture was directly associated with drought aggravation. Therefore, based on previous studies and the results of the geographic detector analysis in this study, it can be concluded that climate change was the predominant factor in the spatial differentiation of water conservation in Jilin Province from 2000 to 2020.
4.2 Impact of land use change on water conservation
The impact of land use type on water conservation changes is relatively complex, but its influence is less significant than that of climate factors (Zeng and Li, 2019; Qiao et al., 2023; Zuo et al., 2023). Changes in land use can lead to variations in soil characteristics and underlying surfaces, thereby affecting surface water infiltration and evaporation. Land use change has a significant influence on hydrological processes such as surface runoff, thereby leading to variations in water conservation functions (Lian et al., 2019; Yang et al., 2021b). The morphology, structure, and root depth of vegetation, as well as the capacity for water conservation, vary among different land use types (Wu et al., 2020; Liu et al., 2022). In this study, the evapotranspiration coefficient of forest land was relatively higher, followed by cultivated land, grassland, and urban-rural and industrial-mining land. Therefore, the water yield of urban-rural and industrial-mining land was greater than that of grassland, cultivated land, and forest land. Forest land was characterized by a low runoff coefficient, followed by grassland, cultivated land, and urban-rural and industrial-mining land. It can be concluded that forest land had higher water conservation capacity, followed by grassland, cultivated land, and urban-rural and industrial-mining land (Table 4) (Ning et al., 2020; Liu et al., 2021; Hu et al., 2022). In the last two decades, the area of urban-rural and industrial-mining land in Jilin Province has experienced the most significant changes, with a change rate of 0.78%, followed by grassland, cultivated land, and forest land (Table 3), with change rates of −0.64%, 0.57%, and −0.28%, respectively. The q value of the geographic detector verified that the change in grassland coverage had the most influence on water conservation, with a q value of 0.0186. Moreover, the change in cultivated land coverage had a larger influence on water conservation compared with the change in forest land, whereas the change in urban-rural and industrial-mining land coverage had the least impact. Although the changes in the area of urban-rural and industrial-mining land are large, they are mainly concentrated in the western plains with smaller water resources, so the overall impact of these changes is limited. In summary, the area and type of land use can significantly impact regional water conservation function, and the impact is greater than that of climate factors in certain areas. For instance, a large area of cultivated land in Kuancheng District, Lvyuan District, Chaoyang District, and Nanguan District of Changchun City was transformed into urban-rural and industrial-mining land. Similarly, a large area of forest land in Huadian County of Jilin City as well as Dunhua County and Antu County of Yanbian Korean Autonomous Prefecture was transformed into cultivated land. Consequently, water conservation in certain areas of Jilin Province has experienced a decline in the past two decades.
4.3 Impact of change in comprehensive factors on water conservation
The variation in regional water conservation function is a complex ecological process that is influenced by multiple factors such as climate, vegetation, and human activities (Gao et al., 2020). For a considerable period, the state has been implementing a project of safeguarding natural forest resources in the Changbai Mountains and key state-owned forest areas. The forest area within the scope of the project has increased significantly. In addition, the water conservation function has improved significantly, demonstrating the huge ecological benefits of the project (Yu et al., 2015; Xiang et al., 2021). However, in a subsequent project, the area of forest land in Jilin Province showed a significant decrease (Li et al., 2018), resulting in reduced water conservation in a few areas. For example, the decrease in water conservation in the southeast region of Zhangguangcailing Mountains is closely associated with the decrease in forest area. Simultaneously, some studies have reported that the degradation of grassland is associated with global warming, aggravated drought, anthropogenic activities, and other factors (Yu et al., 2019; Man et al., 2020). For instance, even though precipitation in the western region of the Laoling Mountains has increased in recent years, local water conservation has decreased. This can be attributed to enhanced evaporation owing to the degradation of local grassland and the increase in forest land. Therefore, the expansion of grassland in the western region of the Laoling Mountains could be more beneficial for improving the water conservation function compared with increasing the area of forest land. This is further supported by the correlation coefficient between the Laoling area and grassland coverage, which is significantly greater than that between the Laoling area and forest land coverage. The results of this study revealed that the variation in water conservation in Zhangguangcailing Mountains had a significant negative correlation with the coverage of cultivated land and urban-rural and industrial-mining land, whereas the variation in water conservation in Jilinhadaling Mountains and Changbai Mountains had a significant positive correlation with forest and grassland coverage. Therefore, improvements in the land use structure, as well as rational restoration of vegetation, can be conducive to improving water conservation functions (Hu et al., 2022; Qiao et al., 2023; Zuo et al., 2023; Zeng and Li, 2019).
4.4 Policy recommendations
Assessment of characteristics at various spatial scales is crucial for research on ecosystem services (Isbell et al., 2017; Yu et al., 2022). Based on the current situation, it can be concluded that there is significant spatial variation in cultivated land in Jilin Province, resulting in relatively low spatial heterogeneity. As the ratio of evaporation to precipitation, aridity reflects the comprehensive changes of both, so its spatial heterogeneity is greater than that of evaporation and precipitation. Based on the results of the MGWR model, the impact of aridity on the changes in water conservation was observed among different counties in this study. There are differences in evaporation, precipitation, urban-rural and industrial-mining land, and forest land coverage between counties and cities, and the influence of grassland and cultivated land coverage varies across cities. Therefore, government agencies should formulate natural protection measures based on the major driving factors that influence water conservation changes at different spatial scales. For example, in the case of Yanji, Tumen, and Longjing counties in Yanbian Korean Prefecture, attention must be paid to the decline in water resources owing to drought and other issues. In the districts of Kuancheng, Lvyuan, Chaoyang, and Nanguan located in Changchun City, the intensity of urban-rural construction and industrial-mining activities should be adequately controlled, and the coverage of forest and grass should be increased. In the Laoling Mountains of Tonghua City, the vegetation restoration model should be optimized, and afforestation should be replaced by grass planting. In the case of Huadian County of Jilin City as well as Dunhua County and Antu County of Yanbian Korean Autonomous Prefecture, it is necessary to restrict the extent of anthropogenic activities such as forest-grain intercropping and transformation of cultivated land to forest area (People's Government of Huadian City, Jilin Province, 2023). Ecological restoration projects need to focus on enhancing the coverage of forests and grasslands. Furthermore, the development of a localized management model is expected to have a significant impact on the stability and sustainability of the water conservation services in Jilin Province.
4.5 Limitations and future prospects
This study provides a novel combination method to investigate the factors influencing the changes in water conservation in terms of geospatial scale. However, errors in model evaluation are difficult to avoid (Wen et al., 2019). For example, land use was classified into seven types and each type was assumed to be homogeneous. This could affect the accuracy of the land use variable in the model. In addition, in the InVEST model used for water conservation evaluation, the input parameters in each region are different, which may lead to certain errors in the model evaluation results. Furthermore, this study considered the sub-basin as the research unit to examine the relationship between the variation in water conservation and various driving factors, which could have an influence on the evaluation of the local regression model. Therefore, further studies are necessary to conduct an in-depth investigation of the changes in water conservation during the transformation of land use, collect additional data of different parameters, and utilize administrative villages as research units to perform local regression analysis; such research should provide decision-makers with a more appropriate reference.
5 Conclusions
The assessment of the driving factors affecting changes in water source conservation functions and their spatial distribution is crucial to ensuring the sustainable development of water resources and ecological security in Jilin Province and surrounding countries. This study investigated alterations in the water conservation of Jilin Province between 2000 and 2020, analyzing the impact of climate change and land use change on these variations at a geographic scale. The Laoling Mountains, Changbai Mountain main line, Zhangguangcailing Mountains, Mudanling Mountains, and Laoyeling Mountains were found to be major areas for water conservation in Jilin Province. Over the last two decades, water conservation in Jilin Province initially experienced an increase but subsequently declined. Climate change emerged as the primary driving factor influencing the variations in water conservation function. However, the impact of land use change on water conservation was more significant than that of climate change in a few areas. The impact of land use changes on water conservation was significant for grassland, followed by cultivated land, forest land, and urban-rural and industrial-mining land. In addition, this study evaluated the influence of various factors on changes in water conservation services at different spatial scales and recommended appropriate measures in the administrative area. In Tumen County, Yanji urban area, and Longjing County, attention should be paid to preventing drought, rationally allocating water resources, and preventing excessive evaporation. In Tonghua City, Kuancheng District, Lvyuan District, Chaoyang District, Nanguan District, Huadian County, Dunhua County, and Antu County, there is a need to reasonably control the extent of anthropogenic activities such as land cultivation and urban-rural and industrial-mining activities. Moreover, optimizing the vegetation restoration model, promoting ecological restoration projects, and increasing the extent of natural vegetation is crucial in these regions. This research provides new insights for exploring the influencing factors of water conservation service functions, and imparts a reasonable basis for decision-making on ecological environment protection and optimized ecosystem management in the region.
Data availability statement
The original contributions presented in the study are included in the article/supplementary files. Further inquiries can be directed to the corresponding author.
Author contributions
TG: Conceptualization, Methodology, Software, Writing – original draft. YL: Writing – review & editing. CZ: Data curation, Formal analysis, Funding acquisition, Writing – review & editing. JC: Writing – review & editing. RJ: Supervision, Validation, Writing – review & editing. WZ: Writing – review & editing.
Funding
The author(s) declare financial support was received for the research, authorship, and/or publication of this article. This work was supported by the National Natural Science Foundation of China (41830643) and the Jilin Provincial Fundamental Research Fund for Central Guidance of Local Science and Technology Development (202002024JC).
Conflict of interest
The authors declare that the research was conducted in the absence of any commercial or financial relationships that could be construed as a potential conflict of interest.
Publisher’s note
All claims expressed in this article are solely those of the authors and do not necessarily represent those of their affiliated organizations, or those of the publisher, the editors and the reviewers. Any product that may be evaluated in this article, or claim that may be made by its manufacturer, is not guaranteed or endorsed by the publisher.
References
Azimi M., Barzali M., Abdolhosseini M., Lotfi A. (2020). Examining the impact of rangeland condition on water conservation by using an integrated modelling approach. Land Degrad Dev. 32, 3711–3719. doi: 10.1002/ldr.3830
Bai Y., Ochuodho T. O., Yang J. (2019). Impact of land use and climate change on water-related ecosystem services in Kentucky, USA. Ecol. Indic. 102, 51–64. doi: 10.1016/j.ecolind.2019.01.079
Chen T., Feng Z., Zhao H., Wu K. (2019). Identification of ecosystem service bundles and driving factors in Beijing and its surrounding areas. Sci. Total Environ. 711, 134687. doi: 10.1016/j.scitotenv.2019.134687
Chen S., Liu K., Bao Y., Chen H. (2016). Spatial pattern and influencing factors of water conservation service function in shangluo city. Sci. Geogr. Sin. 36, 1546–1554. doi: 10.13249/j.cnki.sgs.2016.10.012
Du H., Yu S., Zhang P., Zhang L. (2022). Assessing payment for ecosystem services based on water retention value flow in Beijing-Tianjin-Hebei region. Acta Ecol. Sin. 42, 9871–9885. doi: 10.5846/stxb202108062153
Fan C., Han S., Guo Z., Zheng J., Cheng Y. (2016). Present status and rate of carbon sequestration of forest vegetation in Jilin Province, NortheastChina. Chin. J. Plant Ecol. 40, 341–353. doi: 10.17521/cjpe.2015.0192
Fang Z., Ding T., Chen J., Xue S., Zhou Q., Wang Y., et al. (2022). Impacts of land use/land cover changes on ecosystem services in ecologically fragile regions. Sci. Total Environ. 831, 154967. doi: 10.1016/j.scitotenv.2022.154967
Fotheringham A. S., Yang W., Kang W. (2017). Multiscale geographically weighted regression (MGWR). Ann. Am. Assoc. Geogr. 107, 1247–1265. doi: 10.1080/24694452.2017.1352480
Gao J., Li F., Gao H., Zhou C., Zhang X. (2017). The impact of land-use change on water-related ecosystem services: a study of the Guishui River Basin, Beijing, China. J. Clean. Prod. 163, S148–S155. doi: 10.1016/j.jclepro.2016.01.049
Gao J., Zuo L., Liu W. (2020). Environmental determinants impacting the spatial heterogeneity of karst ecosystem services in southwest China. Land Degrad Dev. 32, 1718–1731. doi: 10.1002/ldr.3815
Gong S., Xiao Y., Zheng H., Xiao Y., Ouyang Z. (2017). Spatial patterns of ecosystem water conservation in China and its impact factors analysis. Acta Ecol. Sin. 37, 2455–2462. doi: 10.5846/stxb201512012406
Hengl T., Mendes de Jesus J., Heuvelink G. B. M., Ruiperez Gonzalez M., Kilibarda M., Blagotić A., et al. (2017). SoilGrids250m: Global gridded soil information based on machine learning. PloS One 12, e0169748. doi: 10.1371/journal.pone.0169748
Hu B., Kang F., Han H., Cheng X., Li Z. (2021). Exploring drivers of ecosystem services variation from a geospatial perspective: Insights from China’s Shanxi Province. Ecol. Indic. 131, 108188. doi: 10.1016/j.ecolind.2021.108188
Hu Y., Yu X., Liao W., Liu X. (2022). Spatial-temporal patterns of water yield and its influencing factors in the han river basin. Resour. Environ. Yangtze Basin. 31, 73–82. doi: 10.11870/cjlyzyyhj202201007
Huang X., Liu J., Peng S., Huang B. (2023). The impact of multi-scenario land use change on the water conservation in central Yunnan urban agglomeration, China. Ecol. Indic. 147, 109922. doi: 10.1016/j.ecolind.2023.109922
Isbell F., Gonzalez A., Loreau M., Cowles J., Diaz S., Hector A., et al. (2017). Linking the influence and dependence of people on biodiversity across scales. Nature. 546, 65–72. doi: 10.1038/nature22899
Li W., Cai Z., Jin L. (2022). Spatiotemporal characteristics and influencing factors of the coupling coordinated development of production-living-ecology system in China. Ecol. Indic. 145, 109738. doi: 10.1016/j.ecolind.2022.109738
Li H., Li X., Yu H., Wang Z., Ren C., Mao D. (2018). Assessments of loss and fragmentation of forests in the Changchun – Jilin demonstration zone, Jilin Province in the past 40 years. J. Arid Land Res. Environ. 32, 128–135. doi: 10.13448/j.cnki.jalre.2018.059
Li M., Liang D., Xia J., Song J., Cheng D., Wu J., et al. (2021). Evaluation of water conservation function of Danjiang River Basin in Qinling Mountains, China based on InVEST model. J. Environ. Manage. 286, 112212. doi: 10.1016/j.jenvman.2021.112212
Lian X., Qi Y., Wang H., Zhang J., Yang R. (2019). Assessing changes of water yield in qinghai lake watershed of China. Water. 12, 11. doi: 10.3390/w12010011
Liu J., Fu B., Zhang C., Hu Z., Wang Y. (2019). Assessment of ecosystem water retention and its value in the upper reaches of minjiang river based on inVEST model. Resour. Environ. Yangtze Basin. 28, 577–585. doi: 10.11870/cjlyzyyhj201903008
Liu Y., Huang S., Xu D., Pu Y., An D., Wang H. (2022). Examining water conservaion capacity of different vegetation types along an elevation gradient in Wuyishan National Park based on Sentinel-2 images. Chin. J. Ecol. 41, 2406–2413. doi: 10.13292/j.1000-4890.202212.018
Liu J., Lang X., Su J., Liu W., Liu H., Tian Y. (2021). Evaluation of water conservation function in the dry-hot valley area of Jinsha River Basin based on InVEST model. Acta Ecol. Sin. 41, 8099–8111. doi: 10.5846/stxb202101050035
Liu Y., Yang Z., Xu G., Chi J. (2023). Impacts of urbanization on habitat quality using MGWR models in Wanjiang City Belt. Sci. Geol. Sin. 43, 280–290. doi: 10.13249/j.cnki.sgs.2023.02.010
Man W., Liu M., Wang Z., Hao Y., Ren C. (2020). Remote sensing investigation of grassland change in Northeast China during 1990~2015. China Environ. Sci. 40, 2246–2253. doi: 10.19674/j.cnki.issn1000-6923.2020.0257
Nelson E., Mendoza G., Regetz J., Polasky S., Tallis H., Cameron Dr., et al. (2009). Modeling multiple ecosystem services, biodiversity conservation, commodity production, and tradeoffs at landscape scales. Front. Ecol. Environ. 7, 4–11. doi: 10.1890/080023
Ning Y., Zhang F., Feng Q., Wei Y., Ding J., Zhang Y. (2020). Temporal and spatial variation of water conservation function in Qinling Mountain and its influencing factors. Chin. J. Ecol. 39, 3080–3091. doi: 10.13292/j.1000-4890.202009.031
People's Government of Huadian City, Jilin Province (2023) The work plan for comprehensively protectingand checking the results of forestry restoration and stopping forest-grain intercropping. Available at: http://xxgk.huadian.gov.cn/qtdw/ljz/xxgkml/202306/t20230625_1137022.html/ (Accessed 12 July 2023).
Qi N., Zhao J., Yang T., Gou R., Chen J., Zhao P., et al. (2020). Quantifying ecosystem service trade-offs and synergies in Northeast China based on ecosystem service bundles. Acta Ecol. Sin. 40, 2827–2837. doi: 10.5846/stxb201903310620
Qiao Y., Zhang H., Liu Q., Liu K., Hu M., Pei W. (2023). Exploring drivers of water conservation function variation in Heilongjiang Province from a geospatial perspective. Acta Ecol. Sin. 43, 2711–2721. doi: 10.5846/stxb202202090327
Reid W., Mooney H., Capistrano D., Carpenter S., Chopra K., Cropper A., et al. (2006). Nature: the many benefits of ecosystem services. Nature. 443, 749–749. doi: 10.1038/443749a
Sandifer P., Sutton-Grier A., Ward B. (2015). Exploring connections among nature, biodiversity, ecosystem services, and human health and well-being: Opportunities to enhance health and biodiversity conservation. Ecosyst. Serv. 12, 1–15. doi: 10.1016/j.ecoser.2014.12.007
Sannigrahi S., Zhang Q., Pilla F., Joshi P. K., Basu B., Keesstra S., et al. (2020). Responses of ecosystem services to natural and anthropogenic forcings: A spatial regression based assessment in the world’s largest mangrove ecosystem. Sci. Total Environ. 715, 137004. doi: 10.1016/j.scitotenv.2020.137004
Shen T., Yu H., Zhou L., Gu H., He H. (2020). On hedonic price of second-hand houses in beijing based on multi-scale geographically weighted regression: Scale law of spatial heterogeneity. Econ Geogr. 40, 75–83. doi: 10.15957/j.cnki.jjdl.2020.03.009
Wang K., Feng Y., Qiu C., Wang X., Ma J., Zhang Y. (2022a). Spatial and temporal evolution and drivers of ecosystem services in Beijing, Tianjin and the Beijing-Tainjin Ring urban agglomeration. Acta Ecol. Sin. 42, 7871–7883. doi: 10.5846/stxb202111203270
Wang X., Qi G., Yu D., Zhou L., Dai L. (2011). Carbon storage, density and distribution in forest ecosystems in Jilin Province of Northeast China. Chin. J. Appl. Ecol. 22, 2013–2020. doi: 10.13287/j.1001-9332.2011.0277
Wang J., Wu T., Li Q., Wang S. (2022a). Quantifying the effect of environmental drivers on water conservation variation in the eastern Loess Plateau, China. Ecol. Indic. 125, 107493. doi: 10.1016/j.ecolind.2021.107493
Wang J., Xu C. (2017). Geodetectors: principles and prospects. Sci. Geogr. Sin. 72, 116–134. doi: 10.11821/dlxb201701010
Wang Y., Ye A., Peng D., Miao C., Di Z., Gong W. (2022b). Spatiotemporal variations in water conservation function of the Tibetan Plateau under climate change based on InVEST model. J. Hydrol-Reg Stud. 41, 101064. doi: 10.1016/j.ejrh.2022.101064
Wang Y., Zhao J., Fu J., Wei W. (2019). Effects of the Grain for Green Program on the water ecosystem services in an arid area of China—Using the Shiyang River Basin as an example. Ecol. Indic. 104, 659–668. doi: 10.1016/j.ecolind.2019.05.045
Wei P., Wu M., Jia Y., Gao Y., Xu H., Liu Z., et al. (2022). Spatiotemporal variation of water yield in the upstream regions of the Shule River Basin using the InVEST Model. Acta Ecologica Sinica. 42, 6418–6429. doi: 10.5846/stxb202105011149
Wen X., Deng X., Zhang F. (2019). Scale effects of vegetation restoration on soil and water conservation in a semi-arid region in China: Resources conservation and sustainable management. Resour Conserv. Recy. 151, 104474. doi: 10.1016/j.resconrec.2019.104474
Wenmin H., Guo L., Gao Z., Jia G., Wang Z., Yi L. (2020). Assessment of the impact of the Poplar Ecological Retreat Project on water conservation in the Dongting Lake wetland region using the InVEST model. Sci. Total Environ. 733, 139423. doi: 10.1016/j.scitotenv.2020.139423
Wu Z., Liu Y., Feng X., Chen Y., Yan Q. (2023). Analysis of local influencing factors of cadmium pollution in soil by using multi-scaleGeographically weighted regression. J. Geo-Inf. Sci. 25, 573–587. doi: 10.12082/dqxxkx.2023.220681
Wu L., Sun C., Fan F. (2022). Multi-criteria framework for identifying the trade-offs and synergies relationship of ecosystem services based on ecosystem services bundles. Ecol. Indic. 144, 109453. doi: 10.1016/j.ecolind.2022.109453
Wu S., Zhou W., Yan K., Zhang X. (2020). Response of the water conservation function to vegetation dynamics in the qinghai-tibetan plateau based on MODIS products. IEEE J-STARS. 13, 1675–1686. doi: 10.1109/jstars.2020.2984830
Xiang H., Wang Z., Mao D. (2021). Ecological effect of natural forest protection project in northeast China. J. Univ. Chin. Acad. Sci. 38, 314–322. doi: 10.7523/j.issn.2095-6134.2021.03.004
Xiang H. X., Zhang J., Mao D. H., Mao D. H., Wang M., Yu F. D., et al. (2023). Optimizing ecological security patterns considering zonal vegetation distribution for regional sustainability. Ecol. Eng. 194, 107055. doi: 10.1016/j.ecoleng.2023.107055
Xu F., Zhao L., Jia Y., Niu C., Liu X., Liu H. (2020). Evaluation of water conservation function of Beijiang River basin in Nanling Mountains, China, based on WEP-L model, Ecol. Indic. 134, 108383. doi: 10.1016/j.ecolind.2021.108383
Yang Z., Liu Y., Su H., Liu X. (2022). Exploring complex place-based coevolution of ecosystem and human activities: A case study of Qilian Mountain area in China. Int. J. Appl. Earth Obs. 115, 103091. doi: 10.1016/j.jag.2022.103091
Yang D., Liu W., Tang L., Chen L., Li X., Xu X. (2019). Estimation of water provision service for monsoon catchments of South China: Applicability of the InVEST model. Landscape Urban Plan. 182, 133–143. doi: 10.1016/j.landurbplan.2018.10.01
Yang S., Liu J., Zhang T., Cao M., Cheng X., Liu Y. (2021a). Characteristics of spatio-temporal variations of surface aridity index and its response to meteorological factors in the upper reaches of the Yane River. J. Water Resour. Water Eng. 32, 101–108. doi: 10.11705/j.issn.1672-643X.2021.04.14
Yang J., Xie B., Zhang D., Tao W. (2021b). Climate and land use change impacts on water yield ecosystem service in the Yellow River Basin, China. Environ. Earth Sci. 80, 72. doi: 10.1007/s12665-020-09277-9
Yu D., Han S. (2016). Ecosystem service status and changes of degraded natural reserves – A study from the Changbai Mountain Natural Reserve, China. Ecosyst. Serv. 20, 56–65. doi: 10.1016/j.ecoser.2016.06.009
Yu H., Wang L., Wang Z., Ren C., Zhang B. (2019). Using landsat OLI and random forest to assess grassland degradation with aboveground net primary production and electrical conductivity data. ISPRS Int. J. Geoinf. 8, 511. doi: 10.3390/ijgi8110511
Yu P., Zhang S., Yung E., Chan E., Luan B., Chen Y. (2022). On the urban compactness to ecosystem services in a rapidly urbanising metropolitan area: Highlighting scale effects and spatial non–stationary. Environ. impact Asses. 98, 106975. doi: 10.1016/j.eiar.2022.106975
Yu D., Zhou W., Bao Y., Qi L., Zhou L., Dai L. (2015). Forest management of Korean pine and broadleaf mixed forest in Northeast China since the implementation of Natural Forest Protection Project. Acta Ecol. Sin. 35, 10–17. doi: 10.5846/stxb201405201029
Zeng L., Li J. (2019). A Bayesian belief network approach for mapping water conservation ecosystem service optimization region. J. Geogr. 29, 1021–1038. doi: 10.1007/s11442-019-1642-x
Zhang P., Guan P., Hao C., Yang J., Xie Z., Wu D. (2022). Changes in assembly processes of soil microbial communities in forest-to-cropland conversion in Changbai Mountains, northeastern China. Sci. Total Environ. 818, 151738. doi: 10.1016/j.scitotenv.2021.151738
Zhang Z., Liu Y., Wang Y., Liu Y., Zhang Y., Zhang Y. (2020). What factors affect the synergy and tradeoff between ecosystem services, and how, from a geospatial perspective? J. Clean. Prod. 257, 120454. doi: 10.1016/j.jclepro.2020.120454
Zhang P., Liu X., Zhu W., Li C., Jin R., Yan H., et al. (2023). Spatio-temporal changes in water conservation ecosystem service during 1990-2019 in the tumen river basin, northeast China. Chin. Geogr. Sci. 33, 102–115. doi: 10.1007/s11769-023-1328-2
Zhao J., Shao Z., Xia C., Fang K., Chen R., Zhou J. (2022). Ecosystem services assessment based on land use simulation: A case study in the Heihe River Basin, China. Ecol. Indic. 143, 109402. doi: 10.1016/j.ecolind.2022.109402
Keywords: water conservation function, InVEST model, driving factors, geographic detector, multi-scale geographic weighted regression
Citation: Gao T, Li Y, Zhao C, Chen J, Jin R and Zhu W (2023) Factors driving changes in water conservation function from a geospatial perspective: case study of Jilin Province. Front. Ecol. Evol. 11:1303957. doi: 10.3389/fevo.2023.1303957
Received: 28 September 2023; Accepted: 13 November 2023;
Published: 29 November 2023.
Edited by:
Fang Chen, Chinese Academy of Sciences (CAS), ChinaReviewed by:
Zhe Feng, China University of Geosciences, ChinaJianmin Qiao, Shandong Normal University, China
Copyright © 2023 Gao, Li, Zhao, Chen, Jin and Zhu. This is an open-access article distributed under the terms of the Creative Commons Attribution License (CC BY). The use, distribution or reproduction in other forums is permitted, provided the original author(s) and the copyright owner(s) are credited and that the original publication in this journal is cited, in accordance with accepted academic practice. No use, distribution or reproduction is permitted which does not comply with these terms.
*Correspondence: Chunzi Zhao, Y3p6aGFvQHlidS5lZHUuY24=