 Colin J. Anthony
 Colin Lock
 Brett M. Taylor
 Bastian Bentlage
94% of researchers rate our articles as excellent or good
Learn more about the work of our research integrity team to safeguard the quality of each article we publish.
Find out more
BRIEF RESEARCH REPORT article
Front. Ecol. Evol., 05 December 2023
Sec. Population, Community, and Ecosystem Dynamics
Volume 11 - 2023 | https://doi.org/10.3389/fevo.2023.1288596
This article is part of the Research TopicExploring the Unseen World: Advancements in Understanding Environmental MicroorganismsView all 5 articles
Coral-associated dinoflagellates (Symbiodiniaceae) are photosynthetic endosymbionts that influence coral acclimation, as indicated by photo-endosymbiotic phenotypic variance across different environmental conditions. Symbiont shuffling (shifts in endosymbiont community composition), changes in endosymbiont cell density, and cellular plasticity have all been proposed as acclimation mechanisms. However, few studies have been able to partition which of the three strategies were responsible for observed phenotypic variance. Using a combination of metabarcoding and flow cytometry, we simultaneously characterized Acropora pulchra-associated Symbiodiniaceae assemblages at the community, population, and individual level under natural environmental conditions to deduce whether seasonal phenotypic change and site-related phenotypic variation of Symbiodiniaceae assemblages is a product of symbiont shuffling or cellular plasticity. Symbiodiniaceae assemblages displayed season-specific phenotypic variance, while Symbiodiniaceae community composition was geographically structured and cell density showed limited data structure. Based on these patterns, we reveal that cellular plasticity of Symbiodiniaceae was the source of a phenotypic variation, thus indicating that cellular plasticity is a mechanism for acclimation to mild environmental change.
Symbiodiniaceae are dinoflagellates known for their endosymbiotic relationship with many marine invertebrates including Cnidaria, Mollusca, Porifera, Platyhelminthes, Foraminifera, and Ciliata (LaJeunesse et al., 2018). The ecological success of reef-building corals has been attributed to this endosymbiotic relationship with Symbiodiniaceae (Gault et al., 2021). Corals are highly dependent on Symbiodiniaceae for nutrient acquisition and effective calcification (Falkowski et al., 1984; Muscatine et al., 1984; Ezzat et al., 2017; Matthews et al., 2017), but environmental stress can cause a breakdown of this photo-endosymbiotic relationship, leading to the expulsion of Symbiodiniaceae from the host (coral bleaching) and often death (Brown, 1997). Climate change has increased the frequency and severity of coral bleaching globally (Hughes et al., 2017) and the survival of corals has been linked to differences in the ecological tolerances of Symbiodiniaceae (Thornhill et al., 2014; Parkinson et al., 2015; Howe-Kerr et al., 2020).
Acropora pulchra (Brook, 1891) is a fast-growing staghorn coral, providing substantial reef structure and habitat for a diverse assemblage of fish and invertebrates. In Guam, A. pulchra is the most abundant staghorn coral, dominating shallow reef flats. However, A. pulchra is highly susceptible to elevated sea surface temperatures, exposure to extreme low tides, and disease (Raymundo et al., 2017). In Guam, two consecutive years of anomalously high sea surface temperatures combined with extreme tides caused a decline of ~33% of A. pulchra’s distribution (Raymundo et al., 2017; Raymundo et al., 2019). Stress events and extreme environments naturally select for resilient genotypes (Fine et al., 2013; Roche et al., 2018; Leiva et al., 2023), yet A. pulchra populations around Guam are highly clonal (Rios, 2020). In highly clonal populations, coral genotype has been found to be a minor determinant of selection, suggesting that Symbiodiniaceae are key determinants of coral survival in such populations (Swain et al., 2020). As such, we expect Guam’s remaining A. pulchra populations to be dominated by resilient Symbiodiniaceae assemblages. The characterization of Guam’s dominant reef flat staghorn corals, which have survived several recent coral bleaching and stress events may provide succinct and novel insight on the response of Symbiodiniaceae to environmental change and their role in coral survival.
In the short term (within a generation), Symbiodiniaceae communities seem largely controlled by the host, while in the long term (across generations), environmental change may shift symbiont community composition (Baker et al., 2018; Camp et al., 2019; Howe-Kerr et al., 2020). If environments change, successful acclimation of corals may be caused by shifts in endosymbiont community composition, known as symbiont shuffling (Buddemeier and Fautin, 1993; Baker, 2003; Jones et al., 2008). For example, Durusdinium is more common than other Symbiodiniaceae genera in stressful environments (Fabricius et al., 2004; LaJeunesse et al., 2010) or after acute stress events (Baker et al., 2004; Berkelmans and van Oppen, 2006). However, endosymbiotic Symbiodiniaceae community composition can also be remarkably stable (Rouzé et al., 2019), indicating a high level of host-symbiont specificity, thus requiring a high acclimation potential through phenotypic plasticity to survive environmental change (Goulet, 2006). Species of Symbiodiniaceae have been experimentally shown to have varying rates of plasticity in response to environmental change (Mansour et al., 2018), which could lead to a change in Symbiodiniaceae assemblage composition or abundance. Therefore, the acclimation strategy of a coral-associated Symbiodiniaceae assemblage may be facilitated by either symbiont shuffling, cell density regulation, or cellular plasticity and is dependent on its constituent members and its environment (Jones and Yellowlees, 1997; Baker, 2003; Baker et al., 2004; Goulet, 2006).
Phenotypic variance within and across Symbiodiniaceae assemblages may be caused by the presence of diverse symbiont clades that display different phenotypes. However, in low complexity Symbiodiniaceae assemblages, dominated by a single symbiont clade, variations in observed phenotypes may be interpreted as the result of cellular plasticity (Anthony et al., 2023). Symbiodiniaceae individuals have several mechanisms for acclimation through cellular plasticity. Generally, Symbiodiniaceae acclimation revolves around modifying the efficiency and productivity of their photosystem, as it is the most direct way to regulate ATP and NADPH formation, and in turn, the quantity of harmful and beneficial metabolic byproducts (Oakley et al., 2014). Photosystem acclimation is typically tied to the modification of photosystem photochemistry (Warner et al., 1996; Ulstrup et al., 2008; Nitschke et al., 2018). The physical reorganization and regulation of photopigments or adjustments to cell morphology can also mitigate stress and promote successful acclimation to different conditions and may be a better representation of long term (months versus days) system regulation (Johnsen et al., 1994; Sawall et al., 2014; Xiang et al., 2015; Oliveira et al., 2022).
Photoacclimation in situ is well studied during seasonal change (Warner et al., 2002; Ulstrup et al., 2008; Sawall et al., 2014) and along light attenuation gradients including depth (Iglesias-Prieto et al., 2004; Frade et al., 2008; Lesser et al., 2010; Cooper et al., 2011) and turbidity (Hennige et al., 2008; Suggett et al., 2012). This research typically attributes observed photoacclimation patterns to (1) changes in community composition, (2) endosymbiotic cell densities, and (3) cellular plasticity. However, research often relies on pulse-amplitude-modulated (PAM) fluorometry (Warner et al., 1996), multi-spectral fluorometry (Hoadley et al., 2023), or high performance liquid chromatography (HPLC) (Mantoura and Llewellyn, 1983) to characterize the state of endosymbiont photosystems. These methods can be standardized to ‘phenotype’ coral holobionts (Voolstra et al., 2020), but cannot provide insight into phenotypic variance of individual symbiont cells. Alternatively, flow cytometry is an underutilized methodology that can rapidly quantify symbiont cells (Krediet et al., 2015) and generate phenotypic profiles on a per cell basis, thus providing the resolution required to identify the source of phenotypic variation (Apprill et al., 2007; Anthony et al., 2023).
Symbiont shuffling, cell density regulation, and cellular plasticity have all been proposed as mechanisms for Symbiodiniaceae to adjust to environmental change (Jones and Yellowlees, 1997; Baker, 2003; Baker et al., 2004; Goulet, 2006). Despite the plethora of knowledge on Symbiodiniaceae response to their environment, most research has not closed the gap in resolving the relationship between phenotypic variance, shifts of Symbiodiniaceae community composition, and cellular plasticity of the existing community. Here we help narrow this knowledge gap by simultaneously characterizing the A. pulchra-associated Symbiodiniaceae assemblage at the community (biodiversity), population (cell density), and individual level (phenotype) under natural environmental conditions. By comparing ITS2 type profiles to flow cytometric phenotypic profiles, we were able to test whether Symbiodiniaceae phenotypic variation was caused by cellular plasticity or symbiont genotype.
To identify the dynamics of Symbiodiniaceae assemblages under natural seasonal fluctuation on an island-wide scale, four plots of A. pulchra from five reef flats (20 plots total) were GPS-tagged around the island of Guam: Urunao (N 13.63672° E 144.84527°), West Agaña (N 13.47993° E 144.74278°), Luminao (N 13.46584° E 144.64496°), Cocos Lagoon (N 13.24596° E 144.68475°) and Togcha (N 13.36865° E 144.774967°) (Figures 1A–F). From this point forward sites will be referred to as North (Urunao), Northwest (West Agaña), West (Luminao), South (Cocos Lagoon), and East (Togcha). Colonies within each plot were photographed using an Olympus Tough TG-6.
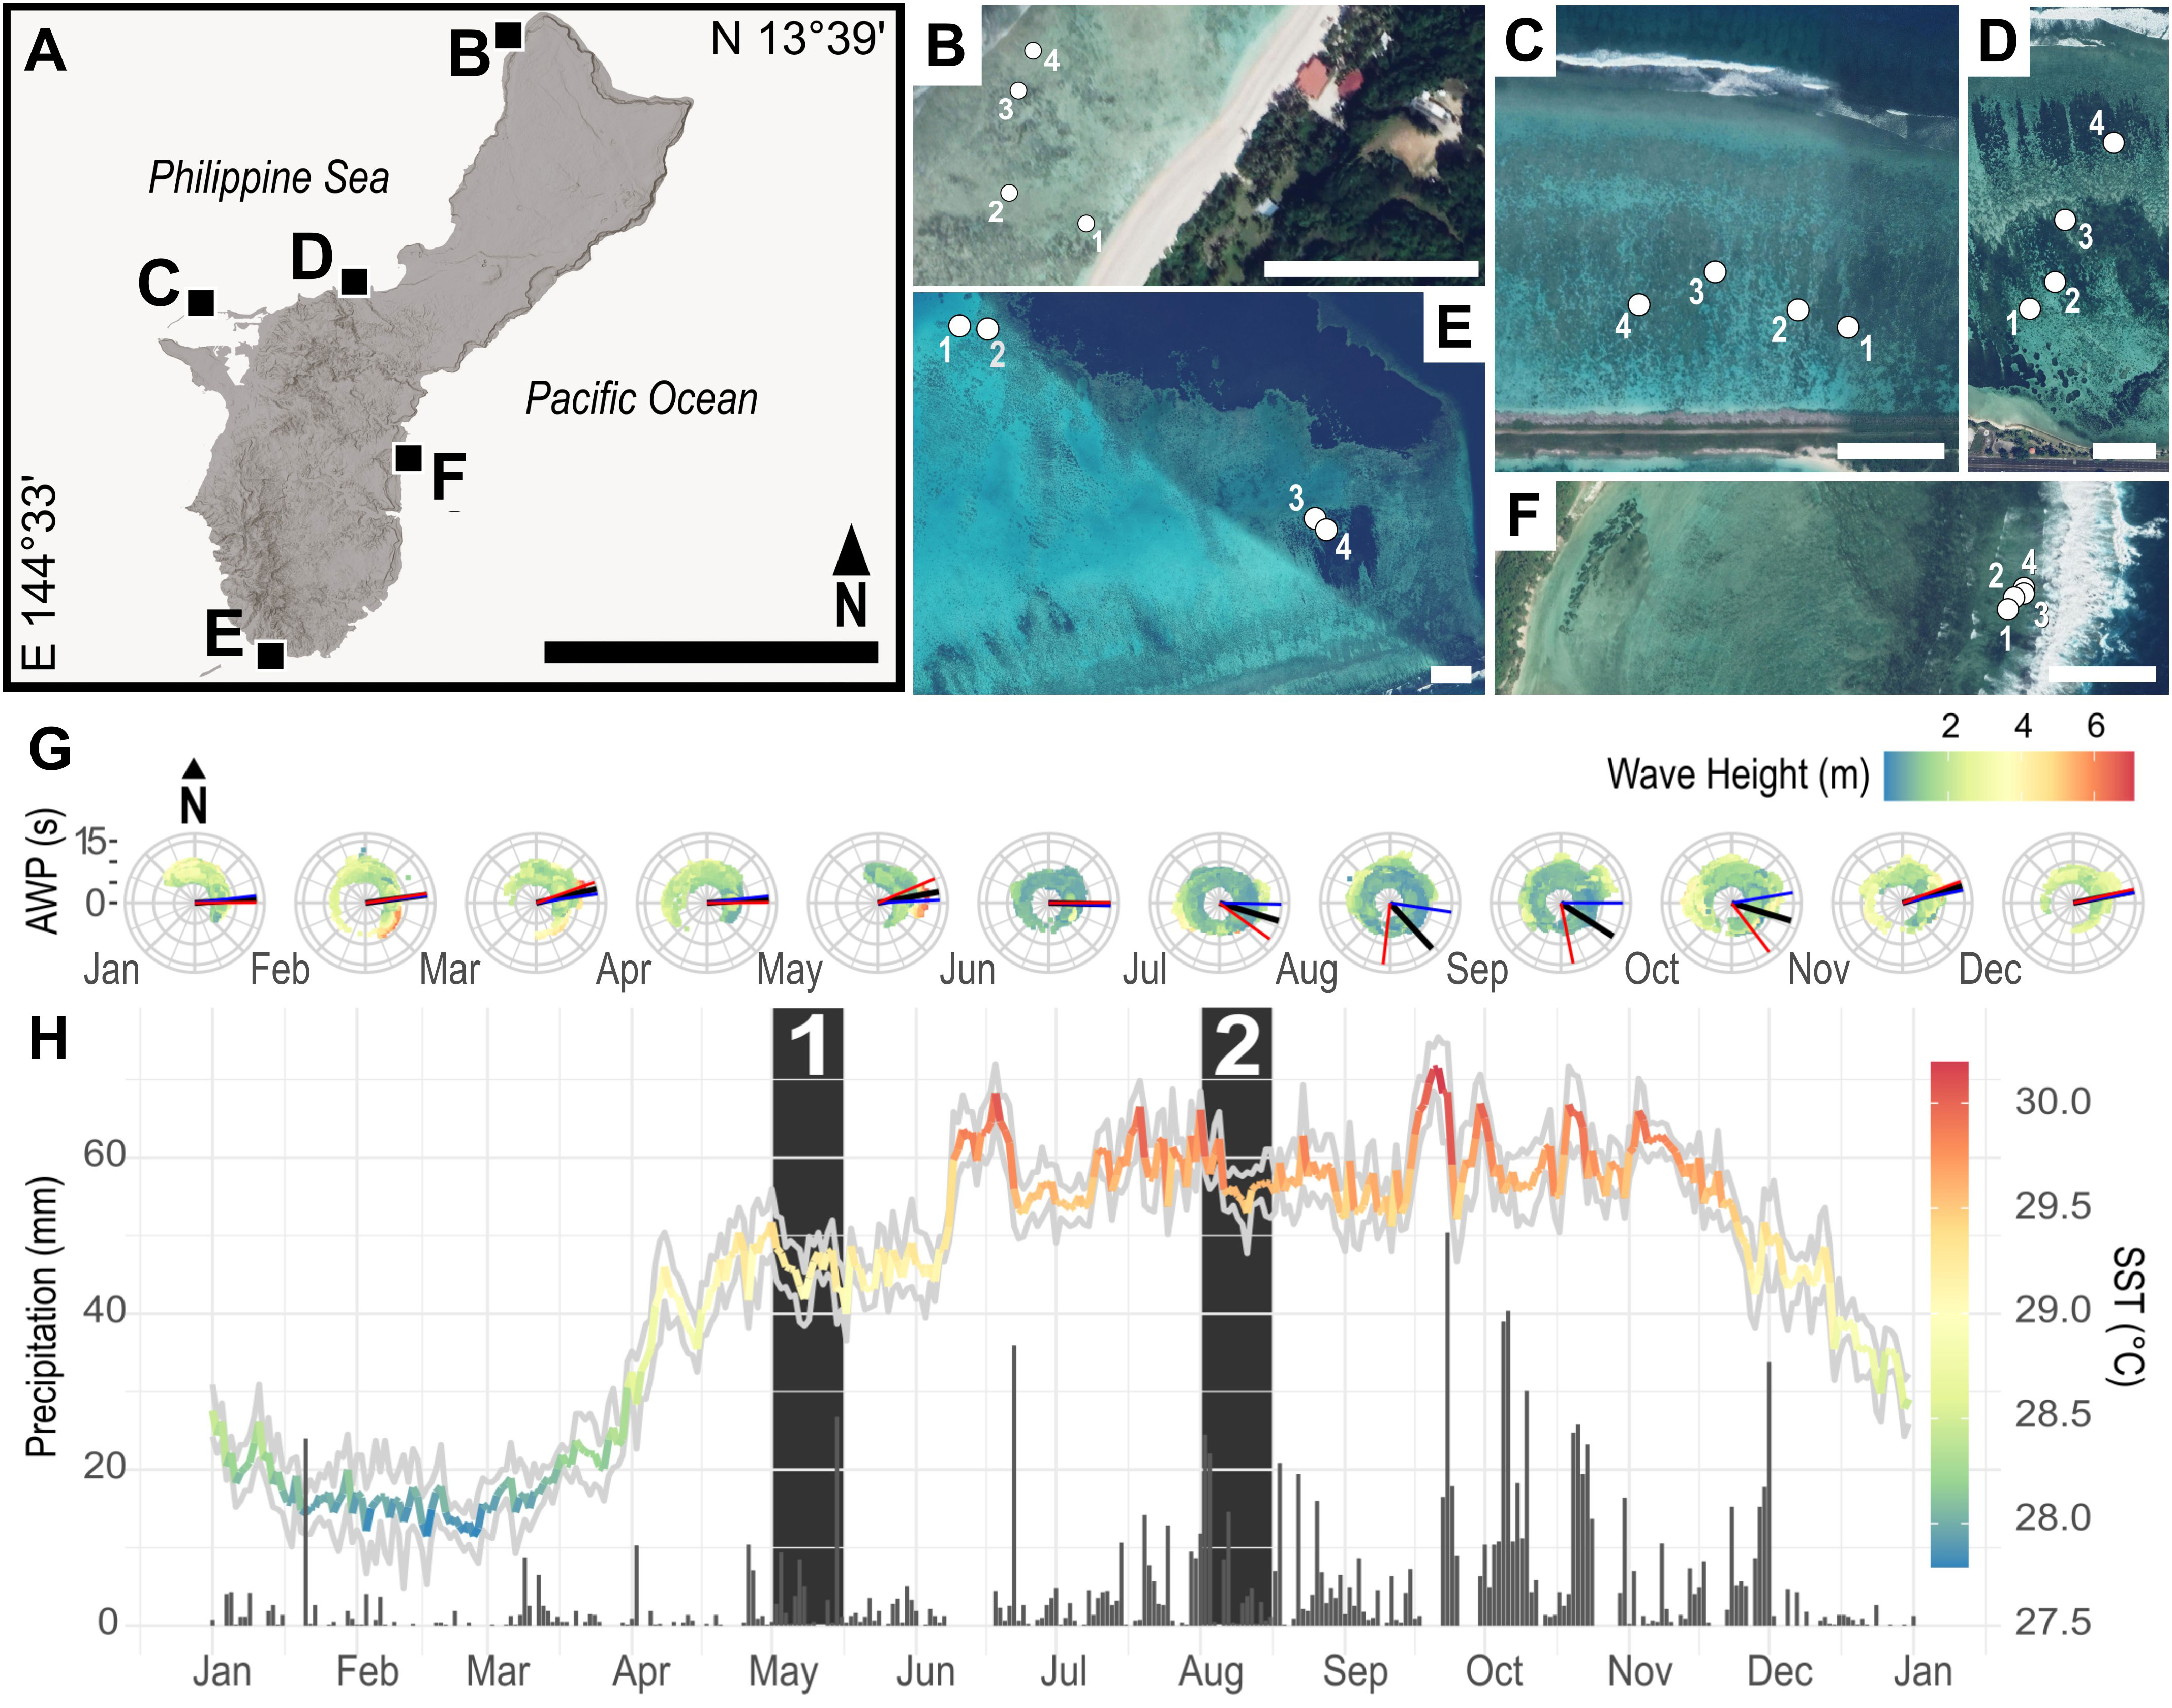
Figure 1 (A) Sampling sites in Guam (scale: 20 km) with each square indicating the location of a reef flat sampled for this study: (B) Urunao (North), (C) West Agaña (Northwest), (D) Luminao (West), (E) Cocos Lagoon (South), and (F) Togcha (East). (B–F) Within each site, four plots (1-4) of A. pulchra were georeferenced for repeated sampling. Images provided by Google Earth Pro v7.3.4.8248 (scale: 100 m). (G) Spectral polar plots of aggregated historical wave data from Ritidian (red lines) and Ipan (blue lines) wave buoys. Monthly mean wave direction (black lines) indicated prevailing swells from the East, the windward side of Guam. (Provided by PacIOOS; www.pacioos.org). (H) Average sea surface temperature (SST) (spectral line) and precipitation (grey bars) for 2021 showed distinct seasonal patterns. (Provided by NOAA Coral Reef Watch; www.coralreefwatch.noaa.gov) The first set of samples was collected in the first two weeks of May (1) during the transitional warming period, while the second set of samples was collected in the first two weeks of August (2) during the hot, rainy season.
To characterize island-wide seasonal environmental changes, average sea surface temperature (SST) and precipitation data were obtained for Guam in 2021 from the NOAA Coral Reef Watch (Liu et al., 2018; www.coralreefwatch.noaa.gov, accessed 10 February 2022) and the Global Historical Climatology Network (Menne et al., 2012; www.ncdc.noaa.gov/cdo-web/datasets/GHCND/stations/GHCND : GQW00041415/detail; accessed 10 February 2022), respectively. Bleaching risk was assessed using NOAA’s 5km regional virtual field station for Guam (Liu et al., 2018; https://coralreefwatch.noaa.gov/product/vs/gauges/guam.php, accessed 10 February 2022). Historical wave height, period, and cardinal direction was provided by the Pacific Islands Ocean Observing System (PacIOOS; www.pacioos.org, accessed 10 February 2022) for 2012-2022 from wave buoys at Ritidian Point (N Guam) and Ipan (SE Guam).
From each site (Figures 1A–F), three tissue samples per plot were collected by cutting two-centimeter-long pieces from at least three centimeters below the axial growth tip. This was repeated for all 20 GPS-tagged plots at two time points within 2021: (1) 30 April – 18 May and (2) 28 July – 15 August. Each sampling effort yielded 12 tissue samples per site and 60 tissue samples per time point. If more than one colony existed near the GPS-tagged plot (North and East), photographs were referenced on-site to ensure that the same colonies were repeatedly sampled within each plot. All samples were immediately flash-frozen in liquid nitrogen on site, then stored at -80°C until processing. These samples were subsequently used to quantify Symbiodiniaceae community composition, cell density, and phenotypic variation, deriving all variables from the same source fragment.
Coral tissue (120 samples) was airbrushed from the skeleton with filtered seawater (FSW) and homogenized using a vortexer followed by syringe needle-shearing, and then processed using the protocol described in Anthony et al. (2023).
Absolute cell counts were obtained by multiplying flow cytometry-generated cell concentrations with each sample’s dilution factor and tissue homogenate volume to determine total cell count for each coral tissue fragment. Cell density per cm2 (Equation 1) was obtained by the normalization of flow cytometry-derived cell counts to the source fragment’s skeletal surface area. To determine skeletal surface area, a three-dimensional model was created for each coral fragment built from point clouds with 0.010 mm point spacing generated by a jewelry scanner (D3D-s, Vyshneve, Ukraine). Prior to scanning, coral fragments were coated with SKD-S2 Aerosol (Magnaflux, Glenview, IL) to reduce skeletal light refraction. Point clouds of each fragment were imported into MeshLab v2020.04 (Cignoni et al., n.d.) to generate a surface mesh by Poisson surface reconstruction. Portions of the fragment that were not covered in tissue prior to airbrushing were removed from the reconstructed surface prior to surface area estimation.
As described by Anthony et al. (2023), three flow cytometric signatures (red fluorescence, forward scatter, and side scatter) were used to generate a phenotypic profile for Symbiodiniaceae cells from each of the 120 tissue samples. Red fluorescence represents relative photopigment abundance (Lesser, 1996; Lee et al., 2012; Cooper et al., 2014). Side scatter is a representation of cell shape or roughness, and forward scatter is a representation of cell size or cell volume (Mullaney et al., 1969; Steen, 1980; Shapiro, 2003; Tzur et al., 2011). The full protocol with details on sample preparation, data curation, and analysis is publicly available on protocols.io (dx.doi.org/10.17504/protocols.io.dm6gpjr2jgzp/v3).
Genomic DNA was extracted from tissue aliquoted prior to airbrushing (see ‘Symbiodiniaceae cell density’ above) using a Qiagen DNeasy PowerSoil Pro Kit (Qiagen, Hilden, Germany) on a Qiacube connect liquid handling system. The ITS2 region was amplified via PCR with SYM_VAR_5.8S2 and SYM_VAR_REV primers (Hume et al., 2018) using 3 μL of DNA (10 ng/μl), 3 μl of 10 μM primer, 2.4 μl of 2.5 mM dNTP, 18.6 μl water, 3 μl buffer (10x), and 0.15 μl Taq (TaKaRa Taq DNA Polymerase 1U, Takara Bio USA, Ann Arbor, MI). The PCR profile included 26 cycles of 95°C for 40 s, 59°C for 120 s, 72°C for 60 s, and a final extension at 72°C for 420 s. ITS2 amplicons were multiplexed and sequenced on a NovaSeq 6000 (Illumina, San Diego, CA, USA) to generate 250 bp paired-end reads. Of the 120 samples extracted, 92 samples were successfully sequenced. After NovaSeq sequencing (Illumina, San Diego CA), metabarcoding data was preprocessed with the SymPortal pipeline (Hume et al., 2019). Raw reads are available through NCBI’s GenBank (BioProject PRJNA1043707), while preprocessed ITS2 data can be obtained from www.symportal.org (accession: 20220419_GuamWild_bentlage). Relative ITS2 sequence abundances and type profiles were normalized and visualized as per Eckert et al. (2020). Curated datasets have been deposited within this manuscript’s associated GitHub repository (https://github.com/AnthonyCuog/SpatiotemporalPhenotypicProfiling).
Flow cytometric data (cell density, red fluorescence, forward scatter, and side scatter) violated the assumption of parametric tests of a normal data distribution, as determined by Shapiro-Wilk tests (p < 0.001); therefore all statistical tests were non-parametric and did not assume normality.
To identify possible correlations between cell density, red fluorescence, side scatter, and forward scatter, non-parametric Spearman correlations were calculated for two groupings of paired dependent variables: (1) cell density, red fluorescence, side scatter, and forward scatter averaged to the fragment-level replicate and (2) red fluorescence, side scatter, and forward scatter without any value summarization (single symbiont cells), given that flow cytometry automatically produces paired data for each cell detected (Anthony et al., 2023). Calculations were completed using rstatix v0.7.1 (Kassambara, 2022).
Repeated measures, univariate analyses of variance (RM-ANOVA) were performed to quantify the factorial contribution of time, site, and plot to the data structure of cell density, red fluorescence, forward scatter, and side scatter using the MANOVA.RM package v0.5.3 (Friedrich et al., 2022). A repeated measures, multivariate analysis of variance (RM-MANOVA) was also completed for grouping of red fluorescence, forward scatter, and side scatter to determine their contribution to the variation of cell phenotypes. For these tests, plot was treated as a fixed effect for the repeated sampling of colonies within each plot and was only analyzed as a nested factor within each site to control the variation of site-specific plot location (Figure 1). Main and interaction effects were resampled with 1000 non-parametric bootstrap replicates and corrected p-values were calculated for type statistics. This test neither assumes multivariate normality nor covariance matrix specificity, making it robust to repeated measure designs with factorial nesting not requiring any data transformation to adhere to model assumptions (Friedrich et al., 2019). Prior to any statistical tests, 1000 observations for each group were randomly sampled for each cytometry replicate (often from a sample size of > 100,000 per cell measurements) to reduce the computational requirements of statistical tests and decrease the likelihood of effect size and strength overinterpretation.
In addition to the repeated measures tests, data from the 40 sampling events (five sites, two timepoints, and 20 colonies) were evaluated with non-parametric pairwise Dunn’s tests, as integrated in the FSA package v0.9.3 (Ogle et al., 2022). Statistical outputs were then converted to statistical groups using _rcompanion v2.4.21 (Mangiafico, 2023). Each sample distribution was assigned to a statistical group (a-s) based on the results of pairwise Dunn’s tests, which better visualized data structure and similarity, thus improving the interpretation of previously calculated repeated measures tests. A distribution would be in the same group as another distribution if they were not statistically different (e.g., p > 0.001), while distributions would appear in different groups if they were statistically different (e.g., p< 0.001). Cell density data distributions were grouped with a standard threshold of p = 0.05, while phenotypic measurements were grouped with a threshold of p = 0.001 to avoid the overinterpretation of effect sizes made stronger by a high sample size (n = 1000) (c.f. Anthony et al., 2023).
Symbiodiniaceae community structure was compared across sites (North, Northwest, West, South, East) and seasons (May, August). Multivariate homogeneity of dispersion (PERMDISP), pairwise permutation tests (PERM), and a permutational multivariate analysis of variance (PERMANOVA) were conducted on normalized ITS2 type profiles as needed using Vegan v2.5-7 (Oksanen et al., 2019) and pairwise Adonis v0.4 (Martinez Arbizu, 2017) packages. PERMDISP and permutation tests used Bray-Curtis dissimilarity. Permutation tests were run with 9999 replicates.
To test whether underlying phenotypic variation was caused by cellular plasticity or ITS2 type-specific phenotypes, the North Site’s ITS2 type profiles, identified by metabarcoding, were mapped to their fragment’s associated phenotypic profile generated by flow cytometry. Phenotypic measurements for the North (the only site with heterogeneous Symbiodiniaceae biodiversity) were compared using a combination of Kruskal-Wallis and Dunn’s tests; with the same process described in the previous paragraph. Not all repeatedly sampled colonies were successfully barcoded, hence the use of non-repeated measures tests, rather than the RM-MANOVAs used for phenotypic data. All data curation and statistical analyses were completed with R v4.1.2 in Rstudio v1.3.1073. Figures were generated and modified with a combination of ggplot2 v3.3.5 (Wickham, 2016) and InkScape v1.1 (https://inkscape.org).
Guam’s windward (East) and leeward (West) sides are characterized by a large disparity in average wave energy. Wave energy on Guam was highest from December to March with waves, on average, coming from the East year-round (Figure 1G). In 2021, Guam did not enter a formal coral bleaching warning (Liu et al., 2018; Skirving et al., 2020) nor was bleaching observed or reported locally. Water temperatures increased steadily from March to June, remaining stable during the following four months, although temperature change was relatively mild. Precipitation followed a similar trend (Figure 1H). May represented a seasonal transition with warming waters and decreasing wave energy; August was characterized by high water temperatures and low wave energy (Figures 1G, H).
Symbiodiniaceae cell density was relatively consistent and averaged 1.345 x 10⁶ cells/cm2 (SD: 5.455 x 10⁶). Cell density only varied with time (RM-ANOVA: t = 20.81, p = 0.042). Notably, this was primarily driven by increased densities in South colonies during August (Figure 2A). All other factors demonstrated relatively low predictability for data structure (RM-ANOVA: Site: t = 0.917, p = 0.44; Time : Site: t = 2.99, p = 0.159; Site : Plot: t = 0.758, 0.516; Time : Site:Plot: t = 0.711; 0.528) (Table S1). Dunn’s tests did not reveal any obvious factorial structuring (Figure S1A). Cell density was not correlated to any phenotypic metric (Spearmans: RED: ρ = 0.096, p = 0.299; FSC: ρ = 0.021, p = 0.822; SSC: ρ = 0.03, p = 0.742).
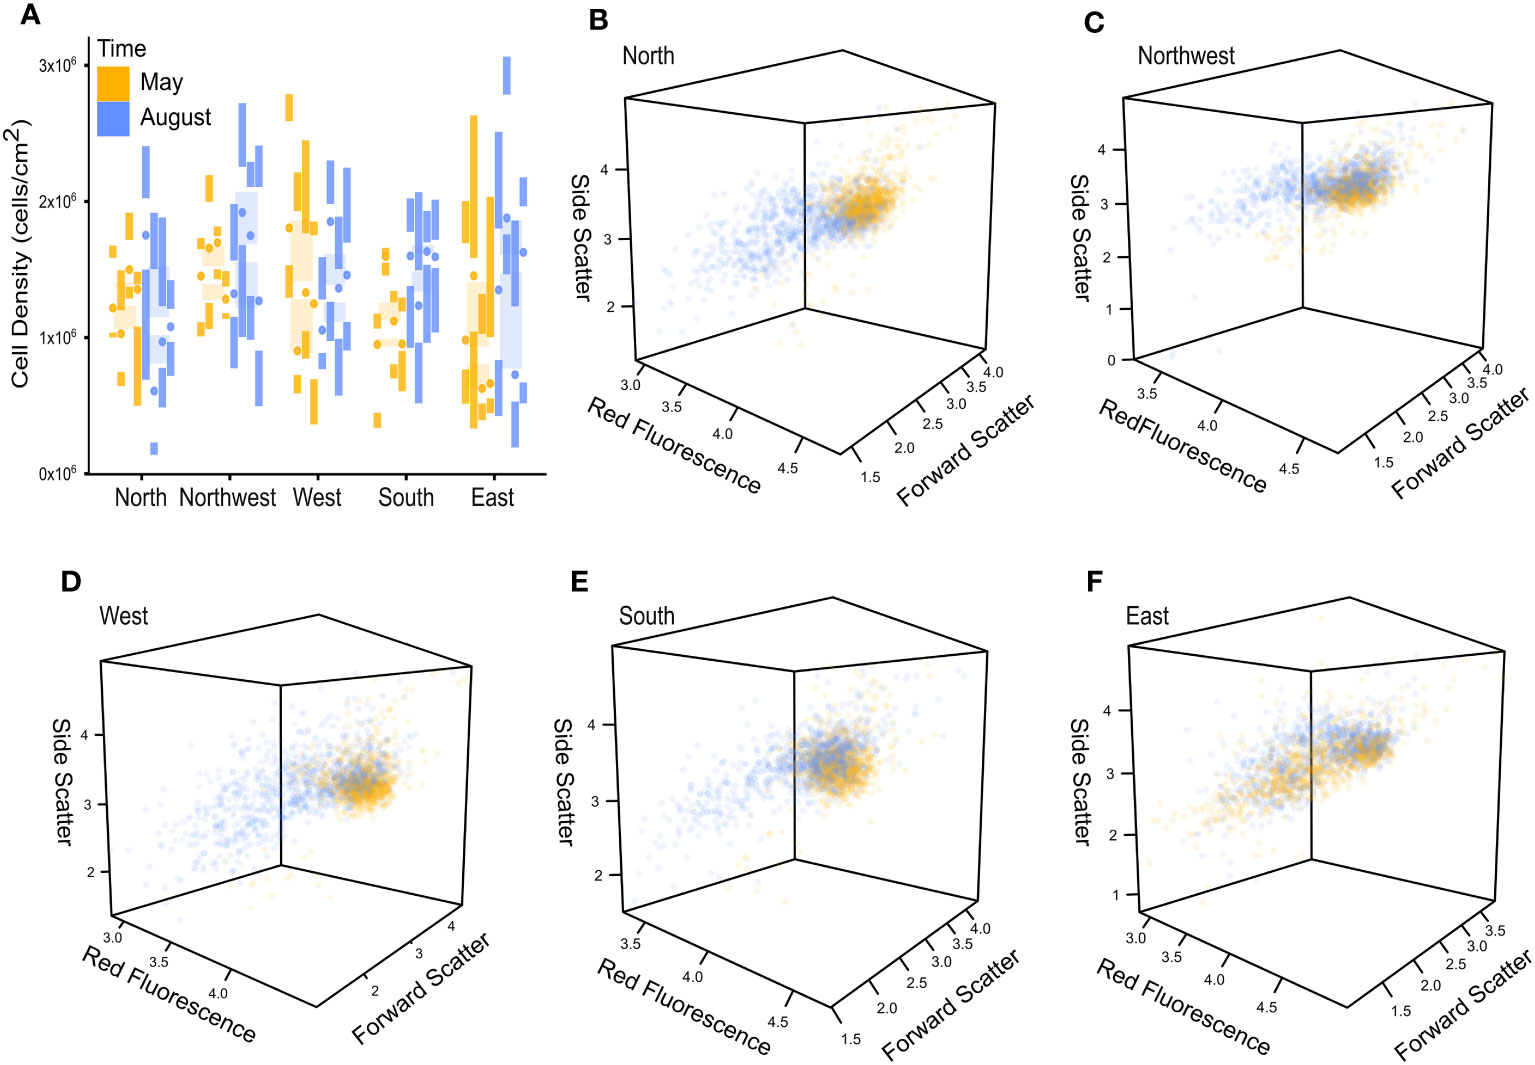
Figure 2 Cell density and phenotypic variance plots colored for repeated temporal sampling (May & August). (A) Cell density illustrated no pattern, as visualized by Tufte’s box plots summarized to the plot level within each site and colored across temporal sampling points. (B–F) Phenotypic variance illustrates a temporal pattern, as visualized by three-dimensional dot plots for North (B), Northwest (C), West (D), South (E), and East (F) Symbiodiniaceae assemblages.
Symbiodiniaceae phenotypic metrics were heavily influenced by time (RM-MANOVA: t = 2165.490, p< 0.001), site (RM-MANOVA: t = 4859.680, p< 0.001), and site within time (RM-MANOVA: t = 18.661, p< 0.001) (Table S2). Time was especially influential for cell phenotype across four sites (North, Northwest, West, and South) with low phenotypic variance in May and a wide phenotypic variance in August (Figures 2B–E), while the East site displayed a wide phenotypic variance at both sampling time points (Figure 2F). All phenotypic variables were correlated to each other (Spearman: RED-FSC: ρ = 0.38, p< 0.001; RED-SSC: ρ = 0.37, p< 0.001; FSC-SSC: ρ = 0.54, p< 0.001).
Red fluorescence (photopigment abundance) was most influenced by site (RM-ANOVA: t = 291.668, p< 0.001); although it was also influenced by time (RM-ANOVA: t = 1056.040; p = 0.002) (Table S2). Generally, red fluorescence declined from May to August, aside from a few plot-specific scenarios, while sites showed a more complex, case-specific partitioning of statistical groups (Figure S1B). Side scatter (cell roughness) displayed similar trends of case-specific partitioning but was especially influenced by site within time (RM-ANOVA: t = 86.503, p< 0.001) and did not show any obvious large-scale pattern (Figure S1C). Forward scatter (cell size), by contrast, showed strong structuring with Site within Time (RM-ANOVA: t = 322.342, p< 0.001), and displayed comparatively little within site data variation (Table S2; Figure S1).
Symbiodiniaceae communities of A. pulchra were largely dominated by Cladocopium C40 (Figure 3A). ITS2 type biodiversity and beta-diversity dispersion was determined by site (PERMANOVA: F = 88.793, p = 0.001; PERMDISP: F = 11.725, p< 0.001) and not by time (PERMANOVA: F = 0.437, p = 0.761; PERMDISP: F = 0.014, p = 0.906) (Figure 3; Table S3). ITS2 type profiles showed Symbiodiniaceae community overlap along Guam’s western coast, while southern and eastern ITS2 type profiles were distinct (Figure 3).
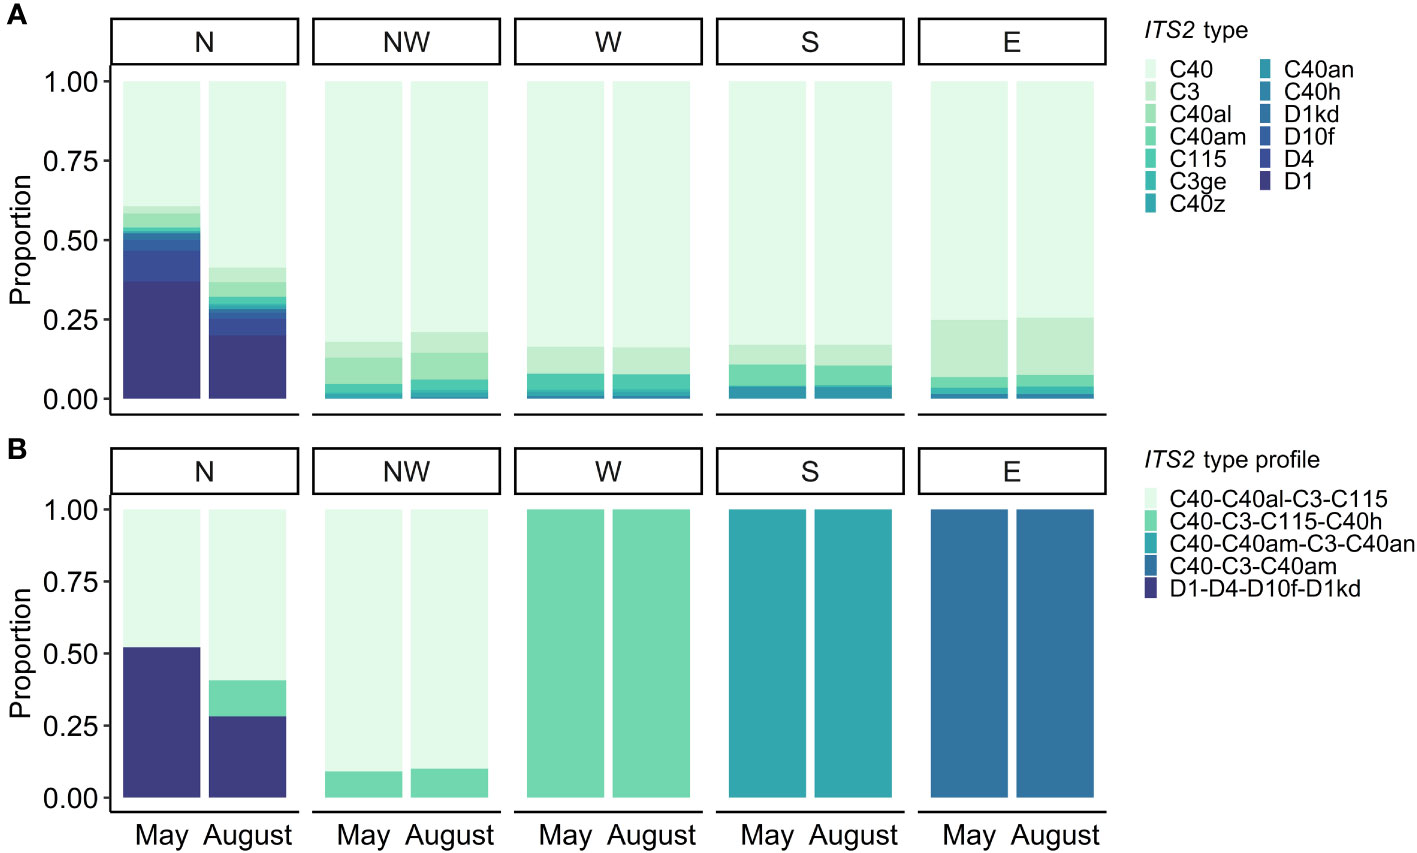
Figure 3 ITS2 type diversity (A) and ITS2 type profiles (B) from spatiotemporal sampling across five sites (North, Northwest, West, South, and East) and two timepoints (May and August).
Pairwise permutation tests revealed North as an outlier, the only site with a Durusdinium ITS2 type profile. A pairwise permutation test of the North site across time points indicated that communities were not statistically differentiated between sampling time points (PERM: F = 0.543, p = 0.494); however, plot-specific data suggested a Cladocopium to Durusdinium partitioning from nearshore to farshore colonies, with Durusdinium being more common nearshore (Figure 4).
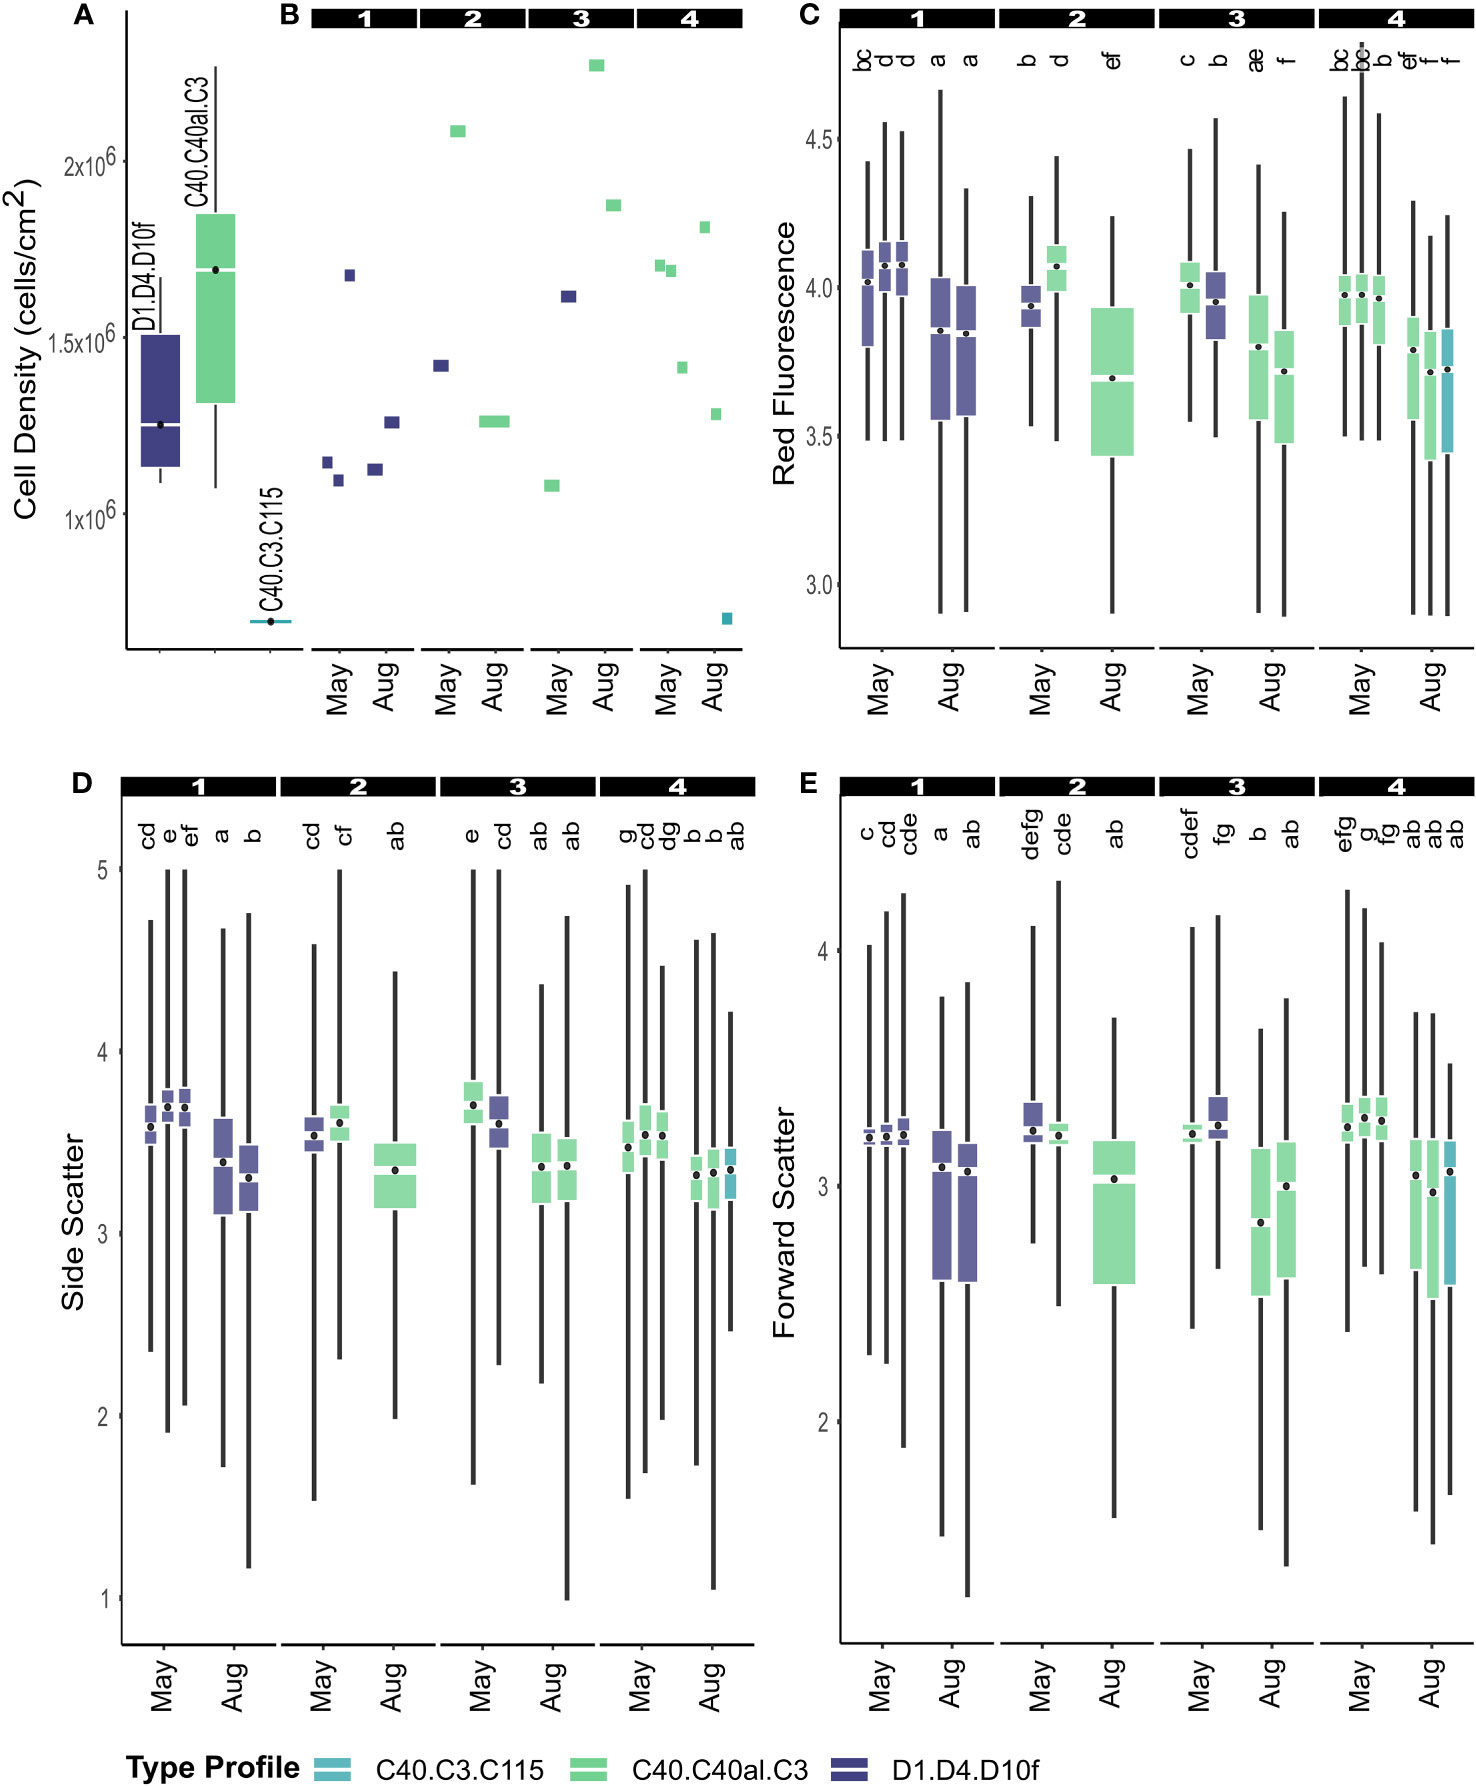
Figure 4 Cell density (A, B) and phenotypic measurements (C–E) were mapped to samples from the North site with known ITS2 type profiles. Sampled plots spanned across the reef flat from nearshore to farshore (1-4) (Figure 1B). Box plots (C–E) correspond to different colonies sampled within their respective plots (Figure 1). Letters above each boxplot (C–E) indicate statistical groupings (p<0.001).
As discussed in previous sections, only the North site showed co-dominance of Cladocopium and Durusdinium ITS2 type profiles (Figure 3). Therefore, each colony with a successfully identified ITS2 type profile was compared to evaluate whether ITS2-type profiles were associated with phenotypic variance (Figure 4). Independent from plot, type profiles did not differ in cell density (Kruskal-Wallis: X2 = 5.760, df = 2, p = 0.056) (Figure 4A). Plot-specific measurements illustrated a general increase in cell density from nearshore to farshore corals (Figure 4B), although accompanied by high variance. Although neighboring colonies with different ITS2 types (Durusdinium vs. Cladocopium) displayed different phenotypic profiles (e.g. colonies in Plots 2 and 3) (Figures 4C–E), neighboring colonies of the same ITS2 types (Cladocopium vs. Cladocopium or Durusdinium vs. Durusdinium) also demonstrated phenotypic differences (e.g. colonies in Plots 1, 3, and 4) (Figures 4C–E), indicating an alternative influence on phenotypic variance.
We set out to identify whether seasonal phenotypic change and site-related phenotypic variation of Symbiodiniaceae assemblages is a product of symbiont shuffling or cellular plasticity. Therefore, we used flow cytometric phenotypic profiling to characterize the phenotypes of thousands of cells within each Acropora pulchra colony alongside ITS2 metabarcoding to identify Symbiodiniaceae clade and community composition. Combining phenotypic profiling with ITS2 metabarcoding provided the resolution to partition cellular plasticity and symbiont shuffling. Although environmental change between timepoints was relatively mild, flow cytometry revealed clear spatiotemporally structured phenotypic variation (Figures 2B–F). In conjunction with the geographic structuring of ITS2 biodiversity (Figure 3) and stable cell densities (Figure 2A), our data suggests that cellular plasticity of Symbiodiniaceae was responsible for changes in phenotypic variation.
In Acropora, Symbiodiniaceae are acquired from the environment (Baird et al., 2009), and Acropora species are often thought to harbor more flexible and diverse symbiont assemblages than other coral genera (Rouzé et al., 2017; Qin et al., 2019). However, we found that A. pulchra-associated Symbiodiniaceae ITS2 types were geographically structured and temporally stable (Figure 3). Although the high fidelity A. pulchra-associated Symbiodiniaceae may be surprising, this result is consistent with previous studies from Guam. For example, Rios (2020) found Guam’s A. pulchra-associated Symbiodiniaceae assemblages dominated by Cladocopium, with only A. pulchra from Saipan and northern Guam containing Durusdinium-dominated colonies. Additionally, the long-term monitoring of Symbiodiniaceae communities found high stability and colony-level specificity of A. pulchra-associated Symbiodiniaceae in French Polynesia (Rouzé et al., 2019).
The dominance of thermotolerant Symbiodiniaceae, Cladocopium C40 and Durusdinium D1, in A. pulchra on Guam’s reef flats indicate the selection of resilient corals following mass coral bleaching and mortality. Both Cladocopium C40 and Durusdinium D1 represent important lineages associated with reduced coral bleaching rates and increased coral survival following stress (Jones et al., 2008; Mieog et al., 2009; Rouzé et al., 2017; Qin et al., 2019). Guam experienced four major coral bleaching events over the last decade leading to an estimated 60% reduction of coral cover between 2013 and 2017 (Raymundo et al., 2019). At many sites around Guam, A. pulchra populations experienced 50-100% mortality, yet, among acroporids, A. pulchra remains the dominant reef-building coral on Guam’s reef flats (Raymundo et al., 2017; Raymundo et al., 2019). The nearshore to farshore partitioning of Durusdinium D1 to Cladocopium C40 dominated A. pulchra colonies may be the result of microhabitat adaptation to long term chronic stressors or environmental conditions (e.g. differences in water flow observed across Guam’s reef flats; Fifer et al., 2021), a hypothesis that ought to be tested with additional targeted sampling.
Under extreme environmental stress, successful acclimation may be caused by symbiont shuffling, the turnover of symbiont community composition (Buddemeier and Fautin, 1993; Baker, 2003; Jones et al., 2008; Zhu et al., 2022). Durusdinium D1 may have been selected for its higher tolerance to warmer nearshore waters (Stat et al., 2008; Keshavmurthy et al., 2014; Silverstein et al., 2017). Additionally, selection for Symbiodiniaceae genotypes may have led to microhabitat adaptation that cannot be detected using ITS2 metabarcoding. For example, signatures of selection were identified from transcriptomes of Symbiodiniaceae living in acidic waters of CO2 seeps (Leiva et al., 2023). The combination of A. pulchra host clonality (Rios, 2020), geographical structuring of Symbiodiniaceae in Guam and the surrounding region (Davies et al., 2020; Rios, 2020; Current Study), and the temporal stability of Symbiodiniaceae community composition (Rouzé et al., 2019; Current Study) point to the importance of phenotypic plasticity as an acclimation mechanism for A. pulchra and its Symbiodiniaceae assemblage. A. pulchra’s fidelity for putatively thermotolerant Cladocopium C40 and Durusdinium D1 may have allowed A. pulchra to persist through repeated severe coral bleaching, but the full acclimation potential of this coral remains to be explored.
Species of Symbiodiniaceae have been experimentally shown to display varying degrees of plasticity to respond to environmental change (Mansour et al., 2018); therefore, we expected that phenotypic variation of a coral-associated Symbiodiniaceae assemblage would differ between different Symbiodiniaceae assemblages. Between time points, flow cytometry revealed that most Acropora pulchra colonies had a low phenotypic variance of Symbiodiniaceae in May and high phenotypic variance in August (Figure 2). In conjunction, with temporally stable ITS2 community compositions, we have strong evidence for temporal cellular plasticity. However, phenotypic variance was also influenced by site (Table S3).
The overall taxonomic homogeneity of community compositions made determining the influence of Symbiodiniaceae identities on spatial phenotypic differences difficult. Only the North site provided any insight on the influence of Symbiodiniaceae community composition given the codominance of two ITS2 type profiles: (1) Durisdinium D1-dominated and (2) Cladocopium C40-dominated (Figure 3). After mapping ITS2-type profiles of each colony to their respective phenotypic profiles, colonies from nearshore (Durusdinium D1-dominated) to farshore (Cladocopium C40-dominated) displayed some mild differences in phenotypic characteristics, such as the higher abundance of photopigments (high red fluorescence) in nearshore colonies (Figure 4C). However, the phenotypic variance between neighboring Durusdinium and Cladocopium-dominated colonies (e.g. colonies in Plots 2 and 3) was no different than neighboring colonies of the same ITS2 types (e.g. colonies in Plots 1, 3, and 4) (Figure 4). Although flow cytometry-derived phenotypic metrics display high variation, high sampling size (>1000 cells) makes comparative results robust (Anthony et al., 2023). Therefore, the data indicate that phenotypic variation between colonies is most likely caused by the cellular plasticity of Symbiodiniaceae, and not by differences in community composition.
Symbiodiniaceae communities of Guam’s A. pulchra populations did not display changes in cell densities or community composition shuffling (Figures 2A, 3). Instead, A. pulchra’s Symbiodiniaceae communities were geographically structured by sampling location (Figure 3), similar to the geographic structuring of acroporid Symbiodiniaceae communities reported previously. Flow cytometric phenotypic profiling revealed that time and site-specific phenotypic differences were likely caused by plasticity of Symbiodiniaceae cells (Figures 2, 4). The implementation and expansion of flow cytometric phenotypic profiling within the framework presented here, for example by characterizing Symbiodiniaceae phenotypic variation with higher temporal resolution and samples from extreme events, has the potential to provide important insights into the mechanisms, dynamics, and limits of Symbiodiniaceae acclimation in situ.
The datasets presented in this study can be found in online repositories. The names of the repository/repositories and accession number(s) can be found below: www.symportal.org, 20220419_GuamWild_bentlage. NCBI Genbank Bioproject, PRJNA104307; github.com, AnthonyCuog/SpatiotemporalProfiling.
Collection permits were issued by Guam’s Division of Aquatic & Wildlife Resources. The study was conducted in accordance with the local legislation and institutional requirements.
CJA: Conceptualization, Data curation, Formal Analysis, Investigation, Methodology, Software, Validation, Visualization, Writing – review & editing, Writing – original draft. CL: Data curation, Formal Analysis, Investigation, Methodology, Validation, Writing – review & editing. BMT: Formal Analysis, Supervision, Writing – review & editing. BB: Funding acquisition, Investigation, Methodology, Project administration, Resources, Supervision, Validation, Writing – review & editing.
The author(s) declare financial support was received for the research, authorship, and/or publication of this article. This work was directly supported by Guam NSF EPSCoR through the National Science Foundation (award OIA-1946352). Wave data was provided by the Pacific Islands Ocean Observing System (PacIOOS) (www.pacioos.org), which is a part of the U.S. Integrated Ocean Observing System (IOOS), funded in part by National Oceanic and Atmospheric Administration (NOAA) (awards #NA16NOS0120024 and #NA21NOS0120091).
We wish to thank Dr. Cheryl Ames, Dr. Héloïse Rouzé, and Dr. Shinichiro Maruyama for providing their expertise and mentorship. We would also like to thank Marine Laboratory boat captain, Jonathan “Nanny” Perez, for assisting with field collections in Cocos Lagoon, and the Ritidian Eco Beach Resort for providing land access to the pristine reef flats of Urunao.
The authors declare that the research was conducted in the absence of any commercial or financial relationships that could be construed as a potential conflict of interest.
All claims expressed in this article are solely those of the authors and do not necessarily represent those of their affiliated organizations, or those of the publisher, the editors and the reviewers. Any product that may be evaluated in this article, or claim that may be made by its manufacturer, is not guaranteed or endorsed by the publisher.
The Supplementary Material for this article can be found online at: https://www.frontiersin.org/articles/10.3389/fevo.2023.1288596/full#supplementary-material
Anthony C. J., Lock C. C., Bentlage B. (2023). Rapid, high-throughput phenotypic profiling of endosymbiotic dinoflagellates (Symbiodiniaceae) using benchtop flow cytometry. PloS One 18, e0290649. doi: 10.1371/journal.pone.0290649
Apprill A. M., Bidigare R. R., Gates R. D. (2007). Visibly healthy corals exhibit variable pigment concentrations and symbiont phenotypes. Coral Reefs 26, 387–397. doi: 10.1007/s00338-007-0209-y
Baird A. H., Guest J. R., Willis B. L. (2009). Systematic and biogeographical patterns in the reproductive biology of scleractinian corals. Annu. Rev. Ecol. Evol. Syst. 40, 551–571. doi: 10.1146/annurev.ecolsys.110308.120220
Baker A. C. (2003). Flexibility and specificity in coral-algal symbiosis: diversity, ecology, and biogeography of Symbiodinium. Annu. Rev. Ecol. Evol. Syst. 34, 661–689. doi: 10.1146/annurev.ecolsys.34.011802.132417
Baker A. C., Starger C. J., McClanahan T. R., Glynn P. W. (2004). Coral reefs: corals’ adaptive response to climate change. Nature 430, 741. doi: 10.1038/430741a
Baker D. M., Freeman C. J., Wong J. C. Y., Fogel M. L., Knowlton N. (2018). Climate change promotes parasitism in a coral symbiosis. ISME J. 12, 921–930. doi: 10.1038/s41396-018-0046-8
Berkelmans R., van Oppen M. J. H. (2006). The role of zooxanthellae in the thermal tolerance of corals: a “nugget of hope” for coral reefs in an era of climate change. Proc. Biol. Sci. 273, 2305–2312. doi: 10.1098/rspb.2006.3567
Brook G. (1891). Descriptions of new species of Madrepora in the collections of the British Museum. Ann. Mag. Nat. Hist. 8, 458–471. doi: 10.1080/00222939109459223
Brown B. E. (1997). Coral bleaching: causes and consequences. Coral Reefs 16, S129–S138. doi: 10.1007/s003380050249
Buddemeier R. W., Fautin D. G. (1993). Coral Bleaching as an Adaptive Mechanism: A testable hypothesis. Bioscience 43, 320–326. doi: 10.2307/1312064
Camp E. F., Edmondson J., Doheny A., Rumney J., Grima A. J., Huete A., et al. (2019). Mangrove lagoons of the Great Barrier Reef support coral populations persisting under extreme environmental conditions. Mar. Ecol. Prog. Ser. 625, 1–14. doi: 10.3354/meps13073
Cignoni P., Callieri M., Corsini M. (n. d.). Meshlab: an open-source mesh processing tool. Eurographics Italian.. doi: 10.2312/localchapterevents.italchap.italianchapconf2008.129-136/129-136
Cooper E. D., Bentlage B., Gibbons T. R., Bachvaroff T. R., Delwiche C. F. (2014). Metatranscriptome profiling of a harmful algal bloom. Harmful Algae 37, 75–83. doi: 10.1016/j.hal.2014.04.016
Cooper T. F., Ulstrup K. E., Dandan S. S., Heyward A. J., Kühl M., Muirhead A., et al. (2011). Niche specialization of reef-building corals in the mesophotic zone: metabolic trade-offs between divergent Symbiodinium types. Proc. Biol. Sci. 278, 1840–1850. doi: 10.1098/rspb.2010.2321
Davies S. W., Moreland K. N., Wham D. C., Kanke M. R., Matz M. V. (2020). Cladocopium community divergence in two Acropora coral hosts across multiple spatial scales. Molec. Ecol. 00, 1–14. doi: 10.1111/mec.15668
Eckert R. J., Reaume A. M., Sturm A. B., Studivan M. S., Voss J. D. (2020). Depth influences symbiodiniaceae associations among Montastraea cavernosa corals on the Belize barrier reef. Front. Microbiol. 11, 518. doi: 10.3389/fmicb.2020.00518
Ezzat L., Fine M., Maguer J.-F., Grover R., Ferrier-Pagès C. (2017). Carbon and nitrogen acquisition in shallow and deep holobionts of the scleractinian coral S. pistillata. Front. Mar. Sci. 4. doi: 10.3389/fmars.2017.00102
Fabricius K. E., Mieog J. C., Colin P. L., Idip D., van Oppen M. J. H. (2004). Identity and diversity of coral endosymbionts (zooxanthellae) from three Palauan reefs with contrasting bleaching, temperature and shading histories. Mol. Ecol. 13, 2445–2458. doi: 10.1111/j.1365-294X.2004.02230.x
Falkowski P. G., Dubinsky Z., Muscatine L., Porter J. W. (1984). Light and the bioenergetics of a symbiotic coral. Bioscience 34, 705–709. doi: 10.2307/1309663
Fifer J., Bentlage B., Lemer S., Fujimura A. G., Sweet M., Raymundo L. J. (2021). Going with the flow: How corals in high-flow environments can beat the heat. Molec. Ecol. 30, 2009–2024. doi: 10.1111/mec.15869
Fine M., Gildor H., Genin A. (2013). A coral reef refuge in the Red Sea. Glob. Change Biol. 19, 3640–3647. doi: 10.1111/gcb.12356
Frade P. R., De Jongh F., Vermeulen F., van Bleijswijk J., Bak R. P. M. (2008). Variation in symbiont distribution between closely related coral species over large depth ranges. Mol. Ecol. 17, 691–703. doi: 10.1111/j.1365-294X.2007.03612.x
Friedrich S., Konietschke F., Pauly M. (2019). Resampling-based analysis of multivariate data and repeated measures designs with the R package MANOVA.RM. R J. 11, 380.
Friedrich S., Konietshke F., Pauly M. (2022). MANOVA.RM: Resampling-Based Analysis of Multivariate Data and Repeated Measures Designs. doi: 10.32614/RJ-2019-051
Gault J. A., Bentlage B., Huang D., Kerr A. M. (2021). Lineage-specific variation in the evolutionary stability of coral photosymbiosis. Sci. Adv. 7, eabh4243. doi: 10.1126/sciadv.abh4243
Goulet T. L. (2006). Most corals may not change their symbionts. Mar. Ecol. Prog. Ser. 321, 1–7. doi: 10.3354/meps321001
Hennige S. J., Smith D. J., Perkins R., Consalvey M., Paterson D. M., Suggett D. J. (2008). Photoacclimation, growth and distribution of massive coral species in clear and turbid waters. Mar. Ecol. Prog. Ser. 369, 77–88. doi: 10.3354/meps07612
Hoadley K. D., Lockridge G., McQuagge A., Pahl K. B., Lowry S., Wong S., et al. (2023). A phenomic modeling approach for using chlorophyll-a fluorescence-based measurements on coral photosymbionts. Front. Mar. Sci. 10. doi: 10.3389/fmars.2023.1092202
Howe-Kerr L. I., Bachelot B., Wright R. M., Kenkel C. D., Bay L. K., Correa A. M. S. (2020). Symbiont community diversity is more variable in corals that respond poorly to stress. Glob. Change Biol. 26, 2220–2234. doi: 10.1111/gcb.14999
Hughes T. P., Barnes M. L., Bellwood D. R., Cinner J. E., Cumming G. S., Jackson J. B. C., et al. (2017). Coral reefs in the anthropocene. Nature 546, 82–90. doi: 10.1038/nature22901
Hume B. C. C., Smith E. G., Ziegler M., Warrington H. J. M., Burt J. A., LaJeunesse T. C., et al. (2019). SymPortal: A novel analytical framework and platform for coral algal symbiont next-generation sequencing ITS2 profiling. Mol. Ecol. Resour. 19, 1063–1080. doi: 10.1111/1755-0998.13004
Hume B. C. C., Ziegler M., Poulain J., Pochon X., Romac S., Boissin E., et al. (2018). An improved primer set and amplification protocol with increased specificity and sensitivity targeting the Symbiodinium ITS2 region. PeerJ 6, e4816. doi: 10.7717/peerj.4816
Iglesias-Prieto R., Beltrán V. H., LaJeunesse T. C., Reyes-Bonilla H., Thomé P. E. (2004). Different algal symbionts explain the vertical distribution of dominant reef corals in the eastern Pacific. Proc. Biol. Sci. 271, 1757–1763. doi: 10.1098/rspb.2004.2757
Johnsen G., Samset O., Granskog L., Sakshaug E. (1994). In vivo absorption characteristics in 10 classes of bloom-forming phytoplankton: taxonomic characteristics and responses to photoadaptation by means of discriminant and HPLC analysis. Mar. Ecol. Prog. Ser. 105, 149–157. doi: 10.3354/meps105149
Jones A. M., Berkelmans R., van Oppen M. J. H., Mieog J. C., Sinclair W. (2008). A community change in the algal endosymbionts of a scleractinian coral following a natural bleaching event: field evidence of acclimatization. Proc. Biol. Sci. 275, 1359–1365. doi: 10.1098/rspb.2008.0069
Jones R. J., Yellowlees D. (1997). Regulation and control of intracellular algae (= zooxanthellae) in hard corals. Philos. Trans. R. Soc Lond. B Biol. Sci. 352, 457–468. doi: 10.1098/rstb.1997.0033
Kassambara A. (2022). Rstatix: Pipe-friendly framework for basic statistical tests. R package version 0.7.1.
Keshavmurthy S., Meng P.-J., Wang J.-T., Kuo C.-Y., Yang S.-Y., Hsu C.-M., et al. (2014). Can resistant coral-Symbiodinium associations enable coral communities to survive climate change? A study of a site exposed to long-term hot water input. PeerJ 2, e327. doi: 10.7717/peerj.327
Krediet C. J., DeNofrio J. C., Caruso C., Burriesci M. S., Cella K., Pringle J. R. (2015). Rapid, precise, and accurate counts of Symbiodinium cells using the guava flow cytometer, and a comparison to other methods. PloS One 10, e0135725. doi: 10.1371/journal.pone.0135725
LaJeunesse T. C., Parkinson J. E., Gabrielson P. W., Jeong H. J., Reimer J. D., Voolstra C. R., et al. (2018). Systematic revision of symbiodiniaceae highlights the antiquity and diversity of coral endosymbionts. Curr. Biol. 28, 2570–2580.e6. doi: 10.1016/j.cub.2018.07.008
LaJeunesse T. C., Pettay D. T., Sampayo E. M., Phongsuwan N., Brown B., Obura D. O., et al. (2010). Long-standing environmental conditions, geographic isolation and host-symbiont specificity influence the relative ecological dominance and genetic diversification of coral endosymbionts in the genus Symbiodinium. J. Biogeogr. 37, 785–800. doi: 10.1111/j.1365-2699.2010.02273.x
Lee C. S., Yeo Y. S. W., Sin T. M. (2012). Bleaching response of Symbiodinium (zooxanthellae): determination by flow cytometry. Cytometry A 81, 888–895. doi: 10.1002/cyto.a.22111
Leiva C., Pérez-Portela R., Lemer C. (2023). Genomic signatures suggesting adaptation to ocean acidification in a coral holobiont from volcanic CO2 seeps. Commun. Biol. 6, 769. doi: 10.1038/s42003-023-05103-7
Lesser M. P. (1996). Elevated temperatures and ultraviolet radiation cause oxidative stress and inhibit photosynthesis in symbiotic dinoflagellates. Limnol. Oceanogr. 41, 271–283. doi: 10.4319/lo.1996.41.2.0271
Lesser M. P., Slattery M., Stat M., Ojimi M., Gates R. D., Grottoli A. (2010). Photoacclimatization by the coral Montastraea cavernosa in the mesophotic zone: light, food, and genetics. Ecology 91, 990–1003. doi: 10.1890/09-0313.1
Liu G., Eakin C. M., Chen M., Kumar A., de la Cour J. L., Heron S. F., et al. (2018). Predicting heat stress to inform reef management: NOAA coral reef watch’s 4-month coral bleaching outlook. Front. Mar. Sci. 5. doi: 10.3389/fmars.2018.00057
Mangiafico S. (2023) rcompanion: Functions to Support Extension Education Program Evaluation. Available at: https://CRAN.R-project.org/package=rcompanion.
Mansour J. S., Pollock F. J., Díaz-Almeyda E., Iglesias-Prieto R., Medina M. (2018). Intra- and interspecific variation and phenotypic plasticity in thylakoid membrane properties across two Symbiodinium clades. Coral Reefs 37, 841–850. doi: 10.1007/s00338-018-1710-1
Mantoura R. F. C., Llewellyn C. A. (1983). The rapid determination of algal chlorophyll and carotenoid pigments and their breakdown products in natural waters by reverse-phase high-performance liquid chromatography. Anal. Chim. Acta 151, 297–314. doi: 10.1016/S0003-2670(00)80092-6
Matthews J. L., Crowder C. M., Oakley C. A., Lutz A., Roessner U., Meyer E., et al. (2017). Optimal nutrient exchange and immune responses operate in partner specificity in the cnidarian-dinoflagellate symbiosis. Proc. Natl. Acad. Sci. U. S. A. 114, 13194–13199. doi: 10.1073/pnas.1710733114
Menne M. J., Durre I., Vose R. S., Gleason B. E., Houston T. G. (2012). An overview of the global historical climatology network-daily database. J. Atmos. Ocean. Technol. 29, 897–910. doi: 10.1175/JTECH-D-11-00103.1
Mieog J. C., Olsen J. L., Berkelmans R., Bleuler-Martinez S. A., Willis B. L., van Oppen M. J. H. (2009). The roles and interactions of symbiont, host and environment in defining coral fitness. PloS One 4, e6364. doi: 10.1371/annotation/e06b31ef-6b29-44ae-aec1-1740daa93f4b
Mullaney P. F., Van Dilla M. A., Coulter J. R., Dean P. N. (1969). Cell sizing: a light scattering photometer for rapid volume determination. Rev. Sci. Instrum. 40, 1029–1032. doi: 10.1063/1.1684143
Muscatine L., Falkowski P. G., Porter J. W., Dubinsky Z. (1984). Fate of photosynthetic fixed carbon in light- and shade-adapted colonies of the symbiotic coral. Stylophora pistillata. Proc. R. Soc Lond. 222, 181–202. doi: 10.1098/rspb.1984.0058
Nitschke M. R., Gardner S. G., Goyen S., Fujise L., Camp E. F., Ralph P. J., et al. (2018). Utility of photochemical traits as diagnostics of thermal tolerance amongst great barrier reef corals. Front. Mar. Sci. 5. doi: 10.3389/fmars.2018.00045
Oakley C. A., Schmidt G. W., Hopkinson B. M. (2014). Thermal responses of Symbiodinium photosynthetic carbon assimilation. Coral Reefs 33, 501–512. doi: 10.1007/s00338-014-1130-9
Ogle D. H., Doll J. C., Wheeler P., Dinno A. (2022). FSA: Fisheries Stock Analysis. R package version 0.9.3.
Oksanen J., Blanchet F. G., Friendly M., Kindt R., Legendre P., Minchin P. R., et al. (2019). Vegan: Community Ecology Package.
Oliveira C. Y. B., Abreu J. L., Santos E. P., Matos Â.P., Tribuzi G., Oliveira C. D. L., et al. (2022). Light induces peridinin and docosahexaenoic acid accumulation in the dinoflagellate Durusdinium glynnii. Appl. Microbiol. Biotechnol. 106, 6263–6276. doi: 10.1007/s00253-022-12131-6
Parkinson J. E., Coffroth M. A., LaJeunesse T. C. (2015). New species of Clade B Symbiodinium (Dinophyceae) from the greater Caribbean belong to different functional guilds: S. aenigmaticum sp. nov., S. antillogorgium sp. nov., S. endomadracis sp. nov., and S. pseudominutum sp. nov. J. Phycol. 51, 850–858. doi: 10.1111/jpy.12340
Qin Z., Yu K., Chen B., Wang Y., Liang J., Luo W., et al. (2019). Diversity of Symbiodiniaceae in 15 coral species from the Southern South China Sea: Potential relationship with coral thermal adaptability. Front. Microbiol. 10, 2343. doi: 10.3389/fmicb.2019.02343
Raymundo L. J., Burdick D., Hoot W. C., Miller R. M., Brown V., Reynolds T., et al. (2019). Successive bleaching events cause mass coral mortality in Guam, Micronesia. Coral Reefs 38, 677–700. doi: 10.1007/s00338-019-01836-2
Raymundo L. J., Burdick D., Lapacek V. A., Miller R., Brown V. (2017). Anomalous temperatures and extreme tides: Guam staghorn Acropora succumb to a double threat. Mar. Ecol. Prog. Ser. 564, 47–55. doi: 10.3354/meps12005
Rios D. (2020). The population genetic structure of Acropora pulchra in Guam. Master's Thesis (Mangilao, Guam: University of Guam).
Roche R. C., Williams G. J., Turner J. R. (2018). Towards developing mechanistic understanding of coral reef resilience to thermal stress across multiple scales. Curr. Clim. Change Rep. 4, 51–64. doi: 10.1007/s40641-018-0087-0
Rouzé H., Lecellier G., Pochon X., Torda G., Berteaux-Lecellier V. (2019). Unique quantitative Symbiodiniaceae signature of coral colonies revealed through spatio-temporal survey in Moorea. Sci. Rep. 9, 7921. doi: 10.1038/s41598-019-44017-5
Rouzé H., Lecellier G. J., Saulnier D., Planes S., Gueguen Y., Wirshing H. H., et al. (2017). An updated assessment of Symbiodinium spp. that associate with common scleractinian corals from Moorea (French Polynesia) reveals high diversity among background symbionts and a novel finding of clade B. PeerJ 5, e2856. doi: 10.7717/peerj.2856
Sawall Y., Al-Sofyani A., Banguera-Hinestroza E., Voolstra C. R. (2014). Spatio-temporal analyses of Symbiodinium physiology of the coral Pocillopora verrucosa along large-scale nutrient and temperature gradients in the Red Sea. PloS One 9, e103179. doi: 10.1371/journal.pone.0103179
Shapiro H. M. (2003). Practical Flow Cytometry 4th edition (United States of America: John Wiley & Sons).
Silverstein R. N., Cunning R., Baker A. C. (2017). Tenacious D: Symbiodinium in clade D remain in reef corals at both high and low temperature extremes despite impairment. J. Exp. Biol. 220, 1192–1196. doi: 10.1242/jeb.148239
Skirving W., Marsh B., de la Cour J., Liu G., Harris A., Maturi E., et al. (2020). CoralTemp and the coral reef watch coral bleaching heat stress product suite version 3.1. Remote Sens. 12, 3856. doi: 10.3390/rs12233856
Stat M., Morris E., Gates R. D. (2008). Functional diversity in coral-dinoflagellate symbiosis. Proc. Natl. Acad. Sci. U. S. A. 105, 9256–9261. doi: 10.1073/pnas.0801328105
Steen H. B. (1980). Further developments of a microscope-based flow cytometer: light scatter detection and excitation intensity compensation. Cytometry 1, 26–31. doi: 10.1002/cyto.990010107
Suggett D. J., Kikuchi R. K. P., Oliveira M. D. M., Spanó S., Carvalho R., Smith D. J. (2012). Photobiology of corals from Brazil’s near-shore marginal reefs of Abrolhos. Mar. Biol. 159, 1461–1473. doi: 10.1007/s00227-012-1925-6
Swain T. D., Lax S., Backman V., Marcelino L. A. (2020). Uncovering the role of Symbiodiniaceae assemblage composition and abundance in coral bleaching response by minimizing sampling and evolutionary biases. BMC Microbiol. 20, 124. doi: 10.1186/s12866-020-01765-z
Thornhill D. J., Lewis A. M., Wham D. C., LaJeunesse T. C. (2014). Host-specialist lineages dominate the adaptive radiation of reef coral endosymbionts. Evolution 68, 352–367. doi: 10.1111/evo.12270
Tzur A., Moore J. K., Jorgensen P., Shapiro H. M. (2011). Optimizing optical flow cytometry for cell volume-based sorting and analysis. PloS One 6, e16053. doi: 10.1371/journal.pone.0016053
Ulstrup K. E., Hill R., van Oppen M. J. H., Larkum A. W. D., Ralph P. J. (2008). Seasonal variation in the photo-physiology of homogeneous and heterogeneous Symbiodinium consortia in two scleractinian corals. Mar. Ecol. Prog. Ser. 361, 139–150. doi: 10.3354/meps07360
Voolstra C. R., Buitrago-López C., Perna G., Cárdenas A., Hume B. C. C., Rädecker N., et al. (2020). Standardized short-term acute heat stress assays resolve historical differences in coral thermotolerance across microhabitat reef sites. Glob. Change Biol. 26, 4328–4343. doi: 10.1111/gcb.15148
Warner M., Chilcoat G., McFarland F., Fitt W. (2002). Seasonal fluctuations in the photosynthetic capacity of photosystem II in symbiotic dinoflagellates in the Caribbean reef-building coral Montastraea. Mar. Biol. 141, 31–38. doi: 10.1007/s00227-002-0807-8
Warner M. E., Fitt W. K., Schmidt G. W. (1996). The effects of elevated temperature on the photosynthetic efficiency of zooxanthellae in-hospite from four different species of reef coral: a novel approach. Plant Cell Environ. 19, 291–299. doi: 10.1111/j.1365-3040.1996.tb00251.x
Wickham H. (2016). ggplot2: Elegant Graphics for Data Analysis (Springer). doi: 10.1007/978-3-319-24277-4_10
Xiang T., Nelson W., Rodriguez J., Tolleter D., Grossman A. R. (2015). Symbiodinium transcriptome and global responses of cells to immediate changes in light intensity when grown under autotrophic or mixotrophic conditions. Plant J. 82, 67–80. doi: 10.1111/tpj.12789
Keywords: phenotype, plasticity, acclimation, coral reefs, Symbiodiniaceae, Acropora
Citation: Anthony CJ, Lock C, Taylor BM and Bentlage B (2023) Cellular plasticity facilitates phenotypic change in a dominant coral’s Symbiodiniaceae assemblage. Front. Ecol. Evol. 11:1288596. doi: 10.3389/fevo.2023.1288596
Received: 04 September 2023; Accepted: 21 November 2023;
Published: 05 December 2023.
Edited by:
Miao Lv, Southwest Jiaotong University, ChinaReviewed by:
Risheng Xu, Northwestern Polytechnical University, ChinaCopyright © 2023 Anthony, Lock, Taylor and Bentlage. This is an open-access article distributed under the terms of the Creative Commons Attribution License (CC BY). The use, distribution or reproduction in other forums is permitted, provided the original author(s) and the copyright owner(s) are credited and that the original publication in this journal is cited, in accordance with accepted academic practice. No use, distribution or reproduction is permitted which does not comply with these terms.
*Correspondence: Colin J. Anthony, Y29saW5fYW50aG9ueW53QG91dGxvb2suY29t
Disclaimer: All claims expressed in this article are solely those of the authors and do not necessarily represent those of their affiliated organizations, or those of the publisher, the editors and the reviewers. Any product that may be evaluated in this article or claim that may be made by its manufacturer is not guaranteed or endorsed by the publisher.
Research integrity at Frontiers
Learn more about the work of our research integrity team to safeguard the quality of each article we publish.