- 1School of Physical Education, Hunan University, Changsha, China
- 2School of Physical Education, Nanchang Normal University, Nanchang, China
Introduction: Large-scale construction projects such as sports stadiums are known for their significant energy consumption and carbon emissions, raising concerns about sustainability. This study addresses the pressing issue of developing carbon-neutral stadiums by proposing an integrated approach that leverages advanced convolutional neural networks (CNN) and quasi-recurrent long short-term memory (QRLSTM) models, combined with dynamic attention mechanisms.
Methods: The proposed approach employs the CNN-QRLSTM model, which combines the strengths of CNN and QRLSTM to handle both image and sequential data. Additionally, dynamic attention mechanisms are integrated to adaptively adjust attention weights based on varying situations, enhancing the model's ability to capture relevant information accurately.
Results: Experiments were conducted using four datasets: EnergyPlus, ASHRAE, CBECS, and UCl. The results demonstrated the superiority of the proposed model compared to other advanced models, achieving the highest scores of 97.79% accuracy, recall rate, F1 score, and AUC.
Discussion: The integration of deep learning models and dynamic attention mechanisms in stadium construction and management offers a more scientific decision support system for stakeholders. This approach facilitates sustainable choices in carbon reduction and resource utilization, contributing to the development of carbon-neutral stadiums.
1 Introduction
In recent years, the construction and operation of sports stadiums have been identified as significant contributors to energy consumption and carbon emissions, exacerbating the global challenge of climate change (Liu and Jian, 2023). As a result, the urgent need to drive sports stadiums towards carbon neutrality and adopt sustainable strategies has garnered increased attention. Deep learning models have emerged as promising tools for addressing these challenges and promoting sustainable practices in stadium development and management (Himeur et al., 2022).
In the pursuit of carbon-neutral stadiums, various deep learning models have been explored to address the complexities of stadium operations and energy management (Hassan et al., 2023). These models include Long Short Term Memory (LSTM), Generative Adversarial Networks (GANs), Recurrent Neural Networks (RNNs), Gated Recurrent Units (GRUs), and Transformer Models.
LSTM (Lemonde et al., 2021), a specialized Recurrent Neural Network, excels at capturing long-term dependencies in sequential data, making it suitable for time-series analysis in stadium operations and energy utilization (Elnour et al., 2022b). However, it may struggle with extremely long sequences, limiting its applicability in certain aspects of stadium management (Ning et al., 2023). GANs offer a powerful technique for generating realistic synthetic data, which can enhance dataset diversity and robustness for model training (Himeur et al., 2023). Nonetheless, GAN training can be unstable and sensitive to hyperparameter settings, necessitating careful fine-tuning. RNNs (Cui et al., 2022), including both LSTM and GRUs, are designed to process sequential data and are well-suited for tasks involving time series or sequential data analysis (Jia et al., 2022). While GRUs offer computational efficiency and parameter efficiency (Wickramaratne and Mahmud, 2020), RNNs, in general, face challenges in learning long-term dependencies during training. Transformer Models (Ota et al., 2023), primarily used for processing sequential data, have the potential to inform and optimize carbon-neutral stadium design by predicting renewable energy generation, analyzing material choices, and understanding travel patterns (Huang et al., 2016). However, their full effectiveness relies on human guidance and integration with traditional approaches.
However, despite the significant progress in carbon-neutral stadium research, traditional deep learning methods often encounter limitations when confronted with the complexity of stadium systems (Tian et al., 2023). Particularly, these methods struggle to effectively handle both sequence data and spatial data simultaneously while generating data that meets specific conditions. Consequently, this challenge hampers the comprehensive modeling and optimization of carbon-neutral stadiums. To address these intrinsic limitations, this study introduces an innovative approach that integrates the convolutional neural networks (CNN) (Gu et al., 2018) and quasi recurrent long short term memory (QRLSTM) (Bolelli et al., 2018) model with a dynamic attention mechanism. This model adeptly handles both spatial and sequential data, proficiently capturing essential information related to stadium design and operational aspects (Hassan et al., 2022). Furthermore, the incorporation of the dynamic attention mechanism enhances the model’s adaptability, enabling it to dynamically focus on pertinent factors at different time points and in varying circumstances (Chapman et al., 2022). This real-time optimization capability empowers precise control and decision-making, ensuring a continuous and sustained reduction in carbon emissions. By harnessing the power of the CNN-QRLSTM model in combination with the dynamic attention mechanism, this research strives to provide more accurate and targeted recommendations for the construction and management of carbon-neutral stadiums.
The contribution points of this paper are as follows:
● Our innovative approach leverages the combined power of CNN-QRLSTM with attention mechanisms to revolutionize the modeling of complex dynamics in sports stadium systems. The utilization of CNN allows us to capture critical spatial features inherent in stadium design, enhancing our understanding of the physical aspects of carbon emissions. Simultaneously, QRLSTM effectively captures intricate temporal dynamics, enabling us to analyze and predict carbon emissions trends over time. The incorporation of attention mechanisms further enhances our model’s capabilities by dynamically focusing on relevant aspects at different time points. This integration results in an unprecedentedly comprehensive and intricate carbon emissions model that is specifically tailored for sports stadiums, providing a deeper insight into the factors influencing carbon neutrality.
● Our CNN-QRLSTM model excels in providing highly accurate and finely-tuned recommendations for carbon emissions reduction across various stages of stadium development and operation, encompassing construction and operational phases. By advancing the modeling of stadium systems, our model offers practical solutions for achieving carbon reduction targets. Its enhanced precision leads to more impactful and effective optimization strategies, enabling stadium managers to make informed and sustainable decisions related to carbon-neutral stadium construction and resource management. This precision translates into tangible benefits, including reduced energy consumption, lower carbon emissions, and improved resource utilization.
● Through a series of experiments and rigorous comparisons with traditional methods, we have demonstrated the remarkable potential of our CNN-QRLSTM model in achieving carbon reduction, improving energy efficiency, and optimizing resource management within stadium development projects. Our model’s unique feature allows it to dynamically adapt to changing conditions, facilitating on-the-fly optimization and control of various stadium systems, including energy consumption, waste management, and transportation, throughout stadium operations. This real-time adaptability ensures continuous carbon emissions reduction, promoting a greener and more sustainable sports stadium environment. Our research bridges the gap between theoretical concepts and practical implementation, providing actionable insights for the construction and management of carbon-neutral stadiums.
In the subsequent sections of this paper, we delve into the relevant research in Section 2. In Section 3, we present a comprehensive overview of our proposed methods, including the integration of CNNs, QRLSTM, and dynamic attention mechanism. Section 4 encompasses the experimental segment, encompassing intricate details and a comparative analysis of the experiments conducted. Finally, in Section 5, we draw conclusions and summarize the findings of this study.
2 Related work
2.1 Deep Reinforcement Learning
Deep Reinforcement Learning (DRL) (Liu et al., 2021) for carbon-neutral stadium management is an innovative approach that leverages the power of deep learning and reinforcement learning techniques to optimize and reduce carbon emissions in sports stadiums. This model aims to make data-driven decisions and dynamically adjust stadium operations to achieve carbon neutrality while ensuring efficient resource utilization.
The DRL model relies on a reinforcement learning agent that interacts with the stadium environment, selecting actions based on observed states and receiving feedback in the form of rewards (Puttick et al., 2017). The agent’s ultimate goal is to learn a policy that maximizes cumulative rewards over time, enabling it to make real-time decisions during stadium operations. Through continuous learning and adaptation, the model continually refines its decision-making capabilities, resulting in continuous improvement in carbon emission reduction.
However, its limitations in computational complexity, data requirements, and interpretability pose challenges for real-world implementation (Whittlestone et al., 2021). Addressing these drawbacks is crucial to harness the full potential of the DRL model in practical stadium management scenarios.
2.2 Graph Neural Network
The Graph Neural Network (GNN) (Chen et al., 2023) for carbon-neutral stadium management works by representing the stadium as a graph, where each element like energy sources and infrastructure is a node. GNNs use the connections between these nodes to learn and predict energy efficiency and carbon emissions. By analyzing complex interactions within the stadium system through message passing and aggregation, GNNs provide valuable insights for optimizing carbon-neutral strategies.
GNNs’ robustness in handling irregular and unstructured data makes them suitable for diverse stadium configurations, adapting well to various sizes and layouts. Leveraging data-driven insights, GNNs facilitate informed decision-making, leading to more accurate and efficient energy management and carbon reduction initiatives, benefiting sustainable stadium operations (Pillai et al., 2023).
Building an accurate and comprehensive graph representation of the stadium environment can be complex and require domain expertise, impacting the model’s performance. Additionally, as the stadium system grows in size and complexity, GNNs may face scalability issues, leading to increased computational resources and longer processing times. Moreover, GNNs’ black-box nature poses interpretability challenges, hindering stakeholders’ understanding of the model’s decision-making process, a critical aspect for effectively implementing carbon-neutral strategies in stadium management (Ding et al., 2022).
2.3 Multi-Task Learning
The Multi-Task Learning (MTL) (Lu et al., 2022) model for carbon-neutral stadium management works by addressing multiple tasks at once to achieve carbon neutrality. Instead of training separate models for each task, the MTL model shares and learns from common features, making the most of the relationships and connections between the tasks. It jointly optimizes energy consumption, carbon emissions, resource management, and other important factors, creating a powerful and coordinated approach that improves the overall sustainability of stadium operations.
MTL efficiently transfers knowledge between tasks by leveraging shared information, leading to a deeper understanding of stadium management factors and more accurate predictions. The MTL model provides a comprehensive solution by addressing multiple tasks simultaneously, promoting coordinated decision-making for carbon-neutral strategies. The MTL reduces data requirements by learning from multiple tasks together, making it advantageous in data-limited scenarios and contributing to cost-effective solutions.
Integrating multiple tasks into a single model may increase complexity, requiring additional computational resources and expertise during design and training compared to single-task models. Moreover, the complex architecture of the MTL model may reduce its interpretability (Tseng et al., 2020), making it challenging to understand the specific contributions of each task, potentially affecting stakeholder buy-in and decision implementation.
3 Methodology
3.1 Overview of our network
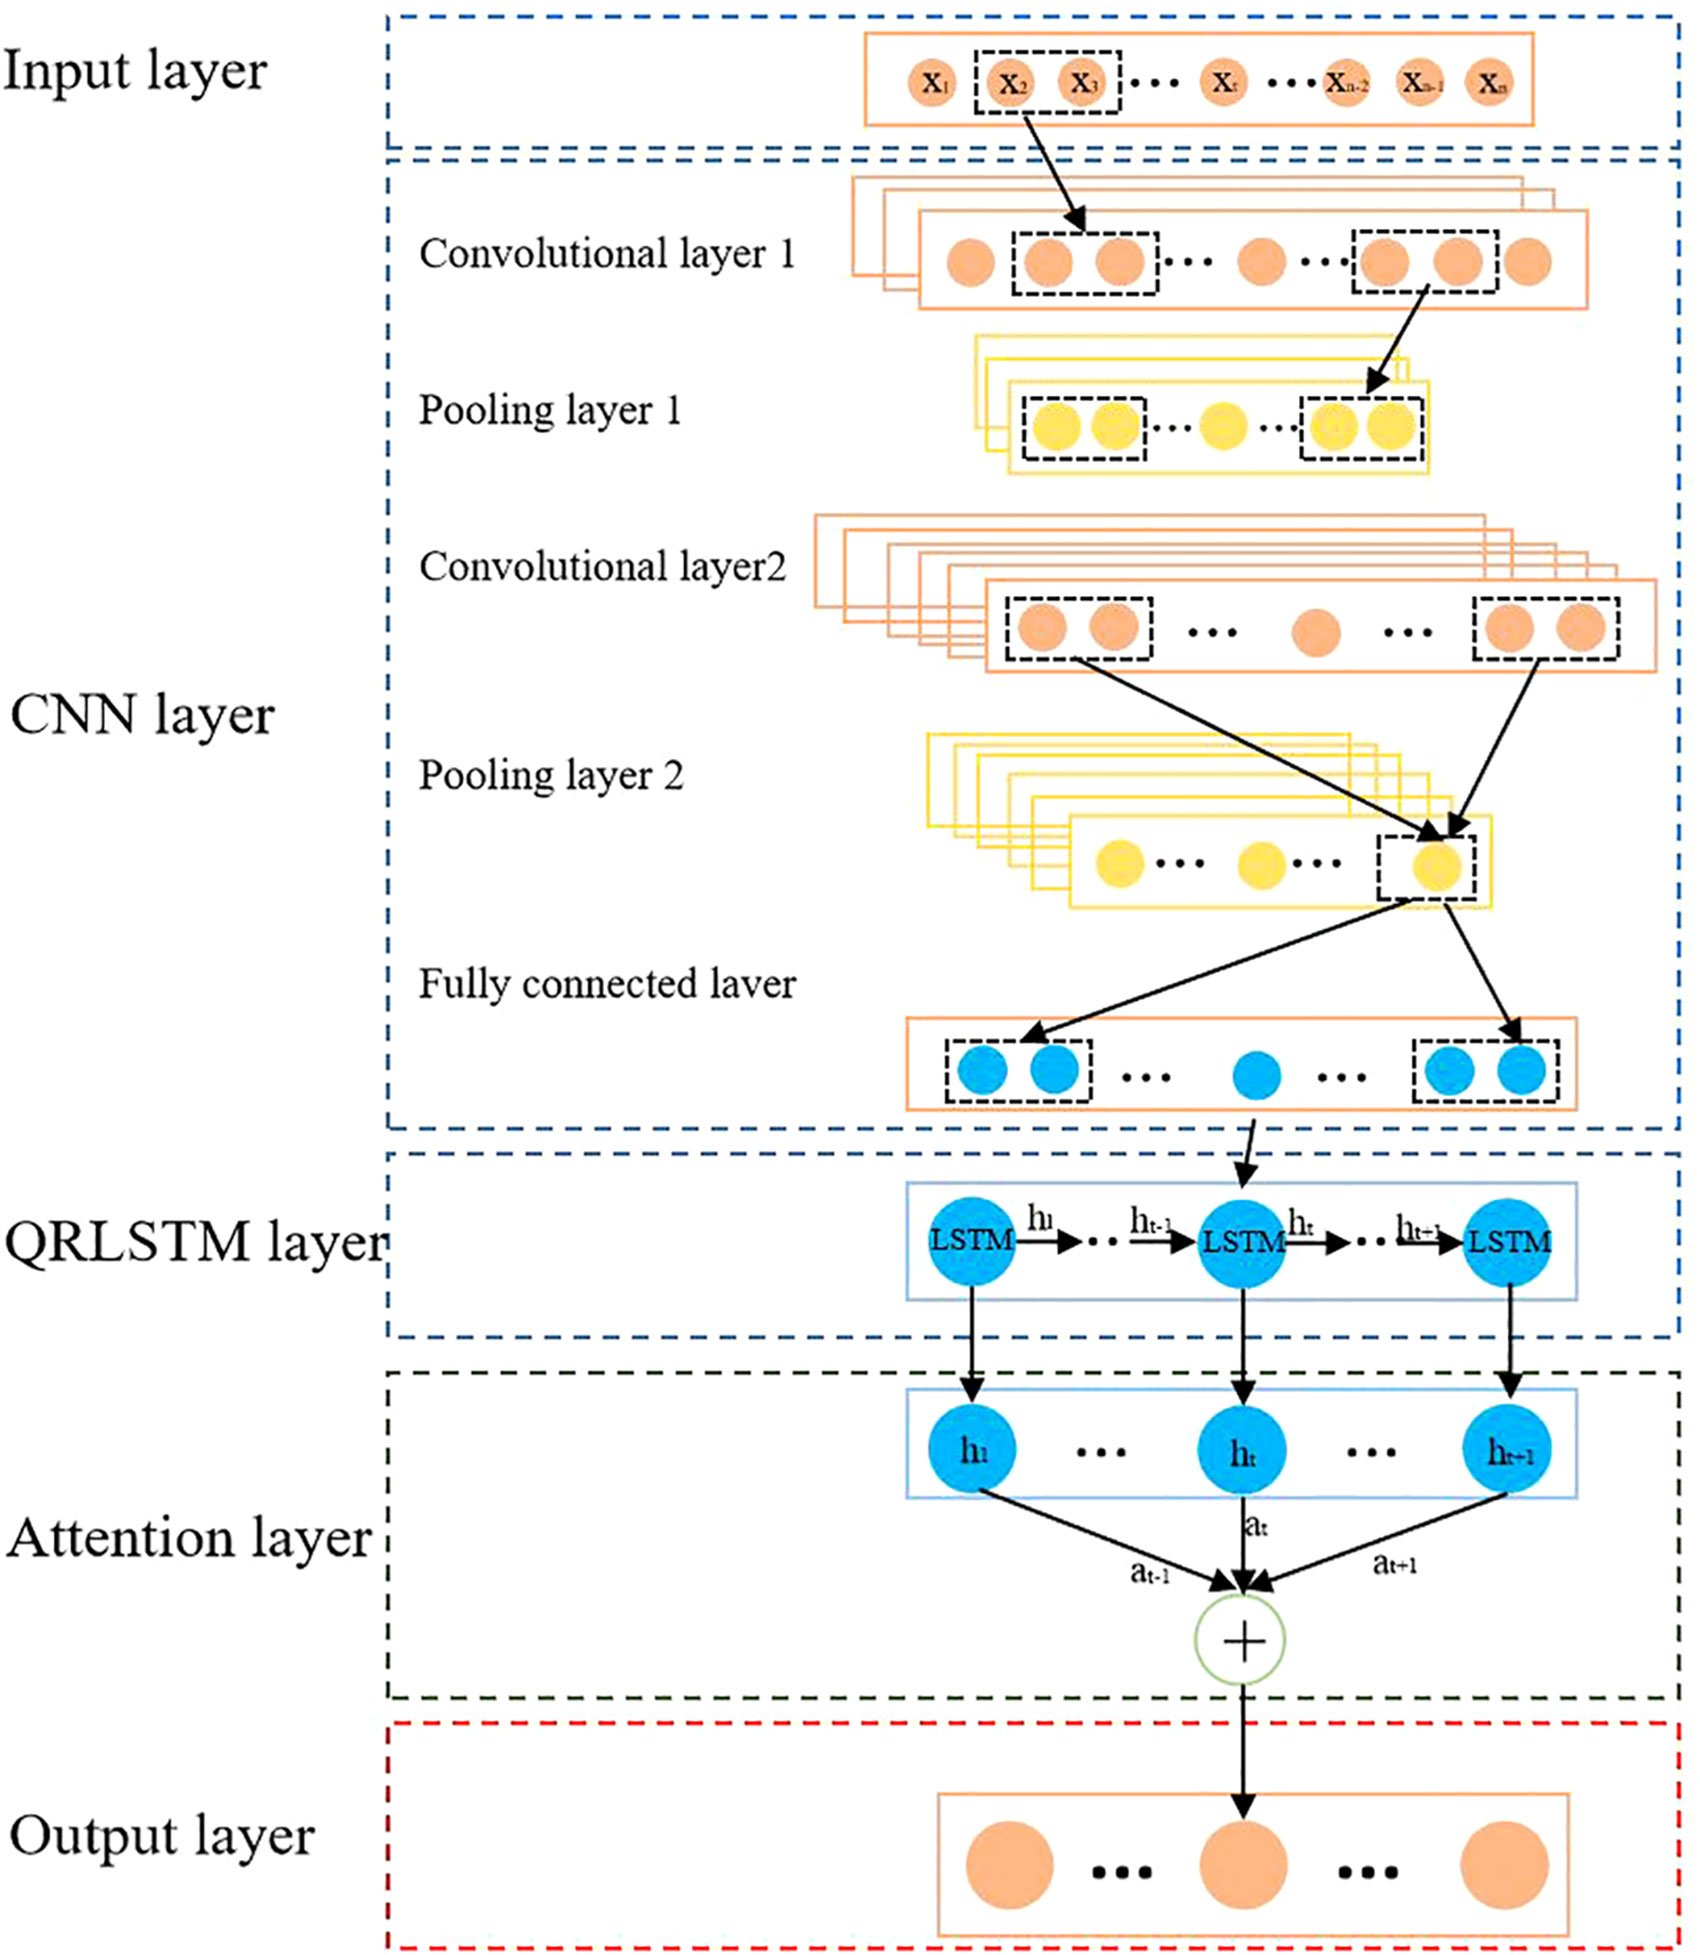
QRLSTM is a type of neural network architecture that combines the strengths of LSTM and QuasiRecurrent Neural Networks (QRNN) (Zhang et al., 2023a). Our model combines CNN and QRLSTM, along with the dynamic attention mechanism. The CNN-QRLSTM model simultaneously processes spatial and temporal data, capturing crucial features of sports stadium design and operations. The dynamic attention mechanism allows the model to adaptively adjust attention weights, effectively focusing on relevant aspects at different time points, resulting in more accurate predictions.
Figure 1 is the overview flow chart. The flow chart of the CNN-QRLSTM model combined with the dynamic attention mechanism consists of five main layers: Input layer, CNN layer, BiGRU layer, Attention layer, and Output layer.
The input layer receives diverse stadium-related information, including images, sequential data, and other relevant features. The CNN layer performs feature extraction on the input data, capturing spatial patterns and visual information from stadium images. The processed data is then passed to the Bidirectional Gated Recurrent Unit (BiGRU) layer, which models temporal dependencies in the data. The dynamic attention mechanism in the Attention layer adaptively adjusts attention weights based on the input data and context, enhancing the model’s decision-making capabilities. Finally, the Output layer generates accurate recommendations for carbon emissions reduction and resource management in sports stadiums.
3.2 CNN model
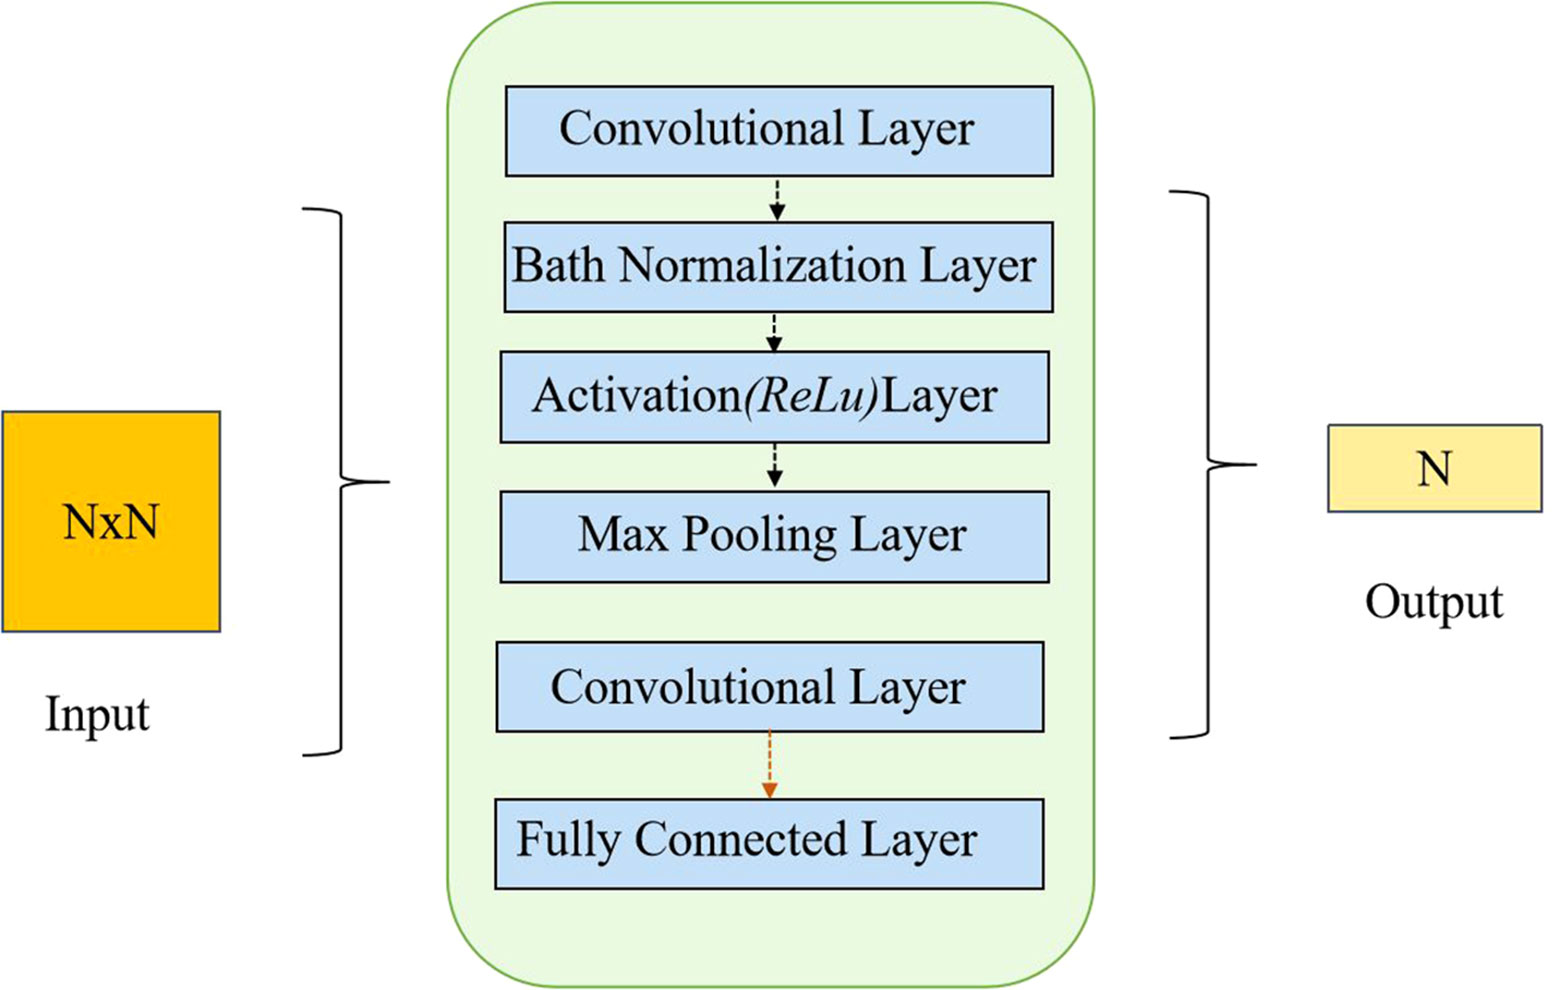
CNN is a deep learning model primarily used for processing images and spatial data (Zhong et al., 2017). It consists of convolutional layers, pooling layers, and fully connected layers, enabling effective feature extraction from images, which is crucial for tasks such as image recognition, classification, and segmentation (Yamashita et al., 2018). The key characteristics of CNN lie in weight sharing and local receptive fields, providing robustness to image translations and scaling and reducing model parameters, thus accelerating the training process.
In the research of carbon-neutral stadium construction and management strategies, the CNN Model is employed to extract spatial features from stadium-related data (Lopez et al., 2014). By applying convolutional operations to stadium images and structural data, the CNN Model can capture spatial relationships and structural information from different regions within the stadium. This facilitates the generation of more meaningful feature representations for subsequent modeling, aiding in more accurate carbon emission predictions and optimizing energy utilization.
The basic formula for a CNN model can be expressed as follows:
1. Convolution Operation: The convolution operation is the core of CNN, which involves sliding a convolutional kernel (or filter) over the input image to extract features from different local regions.
where S(i,j) represents the pixel value in the output feature map at position (i,j), I represents the pixel values of the input image, K represents the weight values of the convolutional kernel, i and j are the pixel coordinates in the output feature map,
2. Pooling Operation: The pooling operation is used to reduce the size of the feature map while retaining important feature information, which helps reduce the number of parameters and computational complexity.
where S(i,j) represents the pixel value in the output feature map at position (i,j), I represents the pixel values of the input image, s is the stride of the pooling operation.
3. Fully Connected Layer: The fully connected layer comes after the convolutional and pooling layers. It flattens the obtained feature map and connects it to a fully connected neural network.
where a(l) represents the output of layer l, W(l) represents the weight matrix of layer l, a(l−1) represents the output of layer l − 1, which is the input to layer l, b(l) represents the bias vector of layer l, f(·) represents the activation function.
Figure 2 is the CNN model flow chart:
3.3 QRLSTM model
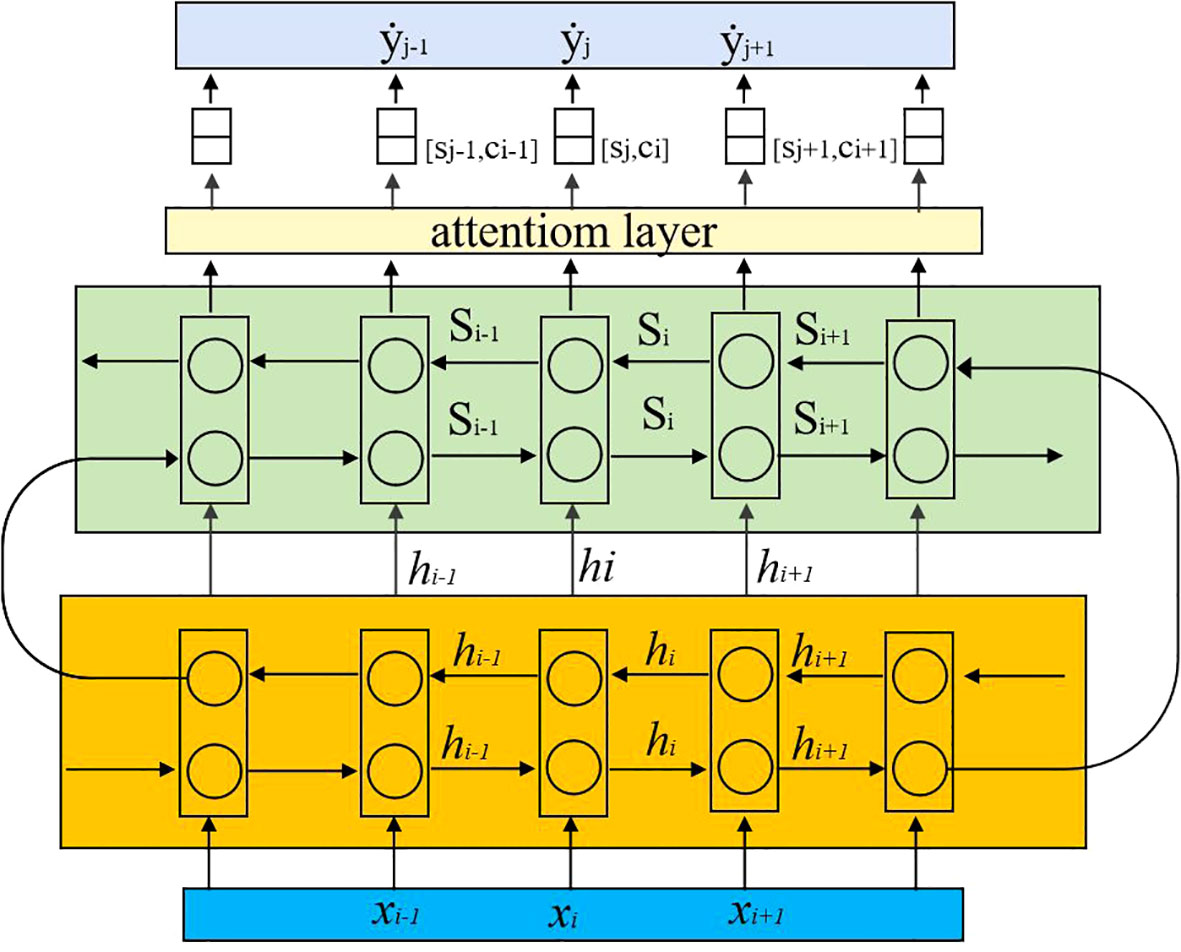
In our proposed carbon-neutral stadium management approach, the QRLSTM model plays a crucial role in handling the temporal dynamics of carbon emission data and is able to provide more accurate predictions. By capturing long-term dependencies in time series data, QRLSTM can better predict stadium carbon emission trends and help decision-makers develop more informed carbon emission reduction strategies.
Furthermore, QRLSTM is integrated with other models such as CNN for spatial feature extraction and dynamic attention mechanism for fusing predictions from different models. Through the comprehensive application of these deep learning models, we are able to effectively model the complex dynamic changes of a carbon-neutral stadium and provide decision-makers with more scientific support to achieve the sustainable development goals of a carbon-neutral stadium.
Figure 3 is the flow chart of the QRLSTM model.
The calculation formulas of QRLSTM are as follows:
1. Input gate
where xt represents the t-th vector of the input sequence, it represents the outputs of the input gate with its value ranging from [0,1], W, R, and b represent the weight matrix, recursive matrix, and bias vector, respectively, which are learnable parameters.
2. Forget gate
where ft represents the outputs of the forget gate with its value ranging from [0,1].
3. Output gate
where ot represents the outputs of the output gate with its value ranging from [0,1], σ represents the sigmoid function.
4. Cell gate
where gt represents the outputs of the cell gate, tanh represents the hyperbolic tangent function.
5. Memory cell
where ct represents the output of the memory cell, which can be regarded as the “memory cell” of LSTM.
6. Output
where ht represents the output of QRLSTM, which can be regarded as the “hidden state” of QRNN.
3.4 Dynamic attention mechanism
Dynamic attention mechanism is a technique used in deep learning models to enhance the model’s attention to different parts of the input data (Niu et al., 2021). In the traditional attention mechanism, the weights are static and fixed, while the dynamic attention mechanism allows the model to adaptively adjust the weights according to different input conditions, thereby handling diverse input data more flexibly. In our proposed method, a dynamic attention mechanism is applied to weight the importance of specific regions or objects in the image (Yang, 2020). By dynamically calculating attention weights, our model is able to adaptively focus attention on the most relevant parts of the image, resulting in more accurate predictions of stadium carbon emissions.
where α is a weight vector that represents the importance of each position in the input sequence, softmax(·) is the softmax function used to normalize the weight vector, W1 and b1 are learnable parameter matrices and vectors, h is a sequence of hidden state vectors of the input sequence.
After obtaining the attention weights, we can use them to compute the weighted sum to get the attention result for the input sequence:
where r is the weighted sum vector, representing the weighted information of the input sequence.
Then map the weighted sum vector r to the final output vector u, by applying the hyperbolic tangent function to map it to a continuous value range in [−1, 1].
where u is the final output vector, α to a probability distribution, W2 and b2 are learnable parameter matrices and vectors, tanh(·) is the hyperbolic tangent function used to enhance the nonlinearity of the output vector. Figure 4 is the overall flow chart.
4 Experiment
4.1 Datasets
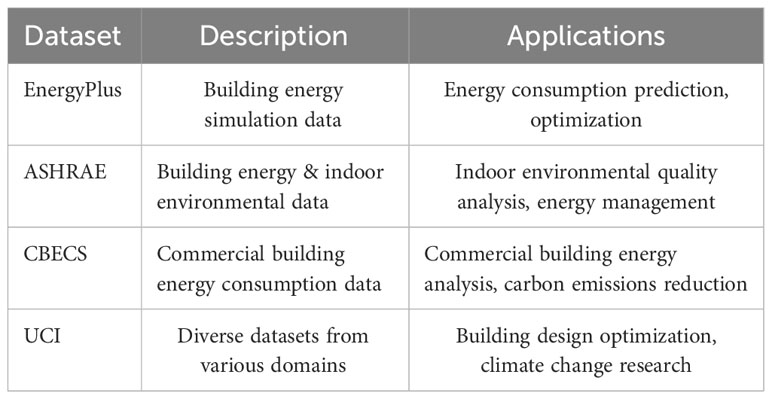
In this paper, the following four data sets are used to study construction and management strategy of carbon neutral stadiums:
EnergyPlus Dataset (Seyedzadeh et al., 2019): EnergyPlus is an advanced building energy simulation software that plays a key role in analyzing and predicting important aspects such as building energy consumption and carbon emissions. The dataset contains extensive energy consumption and carbon emissions data from a variety of existing buildings, making it a valuable resource. Researchers and practitioners can leverage this dataset for a wide range of applications, including accurate building energy consumption and carbon emission predictions, optimization, and efficient energy management strategies.
American Society of Heating, Refrigerating, and Air-Conditioning Engineers (ASHRAE) dataset (Zhang et al., 2023b): This dataset contains valuable information on building energy consumption, indoor environmental conditions and other important factors. This valuable resource enables researchers and professionals in the field to gain insights into building energy consumption patterns and indoor environments. Using this data set, they can effectively predict, optimize and manage building energy consumption while developing strategies to improve indoor environmental quality.
Commercial Building Energy Consumption Survey (CBECS) Dataset (Roth et al., 2020): This is a comprehensive collection of energy consumption data for various commercial buildings in the United States. As an important data repository, this dataset provides a reliable basis for predicting, optimizing and managing energy consumption and carbon emissions in commercial buildings. With the support of the CBECS dataset, researchers and practitioners can develop targeted solutions and strategies to promote energy efficiency and reduce the carbon footprint of commercial buildings.
University of California, Irvine (UCI) Dataset (Devlin and Hayes, 2019): This is a versatile and extensive collection of multi-domain datasets. This valuable resource contains a variety of data, including but not limited to building energy consumption, environmental pollution, climate change and other research areas. The UCI data set becomes a valuable resource for researchers, providing numerous research opportunities for building design optimization and addressing challenges related to carbon neutrality.
Our model is able to delve into important issues of building energy efficiency, carbon footprint reduction and sustainable building design through these datasets. With these rich data sources, data-driven analytical methods can be applied and advanced models developed to optimize energy use and mitigate environmental impact, ultimately moving towards a greener and more sustainable future.
In Table 1 we summarize the description and applications of these datasets. We believe these details will help readers better understand the basis of our data.
4.2 Experimental details
The paper focuses on the construction and management strategy of carbon-neutral stadiums. To achieve this goal, the authors selected four datasets for training, and the training process is as follows:
Data preprocessing: Collect data related to stadium construction, energy consumption, carbon emissions, and other relevant factors. Clean, normalize, and perform feature engineering on the data to ensure consistency and suitability.
Metric comparison experiment: Split the dataset into training and testing sets while maintaining class balance. Design the CNN-QRLSTM model with dynamic attention and define the training objective, such as the cross-entropy loss function. Select an appropriate optimizer, set learning rate, and batch size. Train the model on the training set, monitor metrics such as Accuracy, AUC, Recall, and F1 Score during the training process. Evaluate the trained model on the test set and obtain performance results for each evaluation metric.
Ablation study: Conduct a series of ablation experiments by gradually removing the dynamic attention mechanism or CNN-QRLSTM components from the model. Compare the results of the ablation experiments with the baseline experiment to analyze the contributions of dynamic attention and CNN-QRLSTM model in carbon-neutral stadium construction and management.
Hyperparameter tuning: Employ techniques like cross-validation for hyperparameter tuning to find the optimal model configuration. Consider adjusting model depth, width, dropout, etc., to improve model performance.
Experiment result analysis: Statistically analyze and visualize the experiment results, comparing the performance of different models. Evaluate the applicability and effectiveness of different models in carbon-neutral stadium construction and management.
Discussion and conclusion: Summarize the role and advantages of the CNN-QRLSTM model combined with dynamic attention mechanism in carbon-neutral stadium construction and management based on the experiment results and analysis. Propose potential improvements and optimizations and discuss the limitations of the model.
By following this experimental design, we can comprehensively evaluate the performance of the CNN-QRLSTM model combined with dynamic attention mechanism in carbon-neutral stadium construction and management. The results will provide valuable insights and decision-making guidance for sustainable carbon-neutral strategies in stadium facilities.
In our paper, four evaluation metrics, namely Accuracy, Area Under Curve (AUC), Recall, and F1 Score, are employed to assess the performance of the classification model. Accuracy measures the overall correctness of the model’s classification results, AUC evaluates the performance of binary classification models, recall gauges the model’s ability to correctly identify positive samples, and F1 Score serves as a comprehensive metric balancing precision and recall. These metrics aid in evaluating the model’s classification performance, selecting the best model, and optimizing model parameters.
Accuracy:
where TP is the number of true positive, TN is the number of true negative, FP is the number of false positive, and FN is the number of false negative.
AUC:
where ROC(x) is the curve that relates the true positive rate (TPR) and false positive rate (FPR) for a given threshold x.
Recall:
F1-score:
where Precision can be given by
We also carefully consider these four variables during our evaluation process: parameters, floating point operations (Flops), inference time and training time, which are key metrics for evaluating the performance and suitability of neural network models.
Parameters: Parameters refer to the learnable weights and biases within the neural network. They determine the model’s complexity and capacity to learn from data. Models with a large number of parameters may have higher expressive power but can also require more memory for storage and longer training times.
Flops: Flops measure the number of floating-point arithmetic operations performed during the computation of a neural network. It is an indicator of the model’s computational complexity and directly affects its execution speed. Models with higher Flops may demand more processing power and longer inference times.
Inference time: Inference time denotes the time taken by a trained model to process a single input and produce the corresponding output. It reflects the model’s efficiency during the prediction phase. Lower inference times are desirable, especially in real-time applications where quick responses are crucial.
Training time: Training time refers to the duration it takes to train the model on a given dataset. Longer training times can delay the development and experimentation process, making it crucial to consider the computational efficiency of the model.
Parameters is the number of model parameters, usually expressed in millions (M), Flops is the number of floating-point operations in the model, usually expressed in billions (G), inference time is the average time for model inference, usually expressed in milliseconds (ms), training time is the total time for model training, usually expressed in seconds (s).
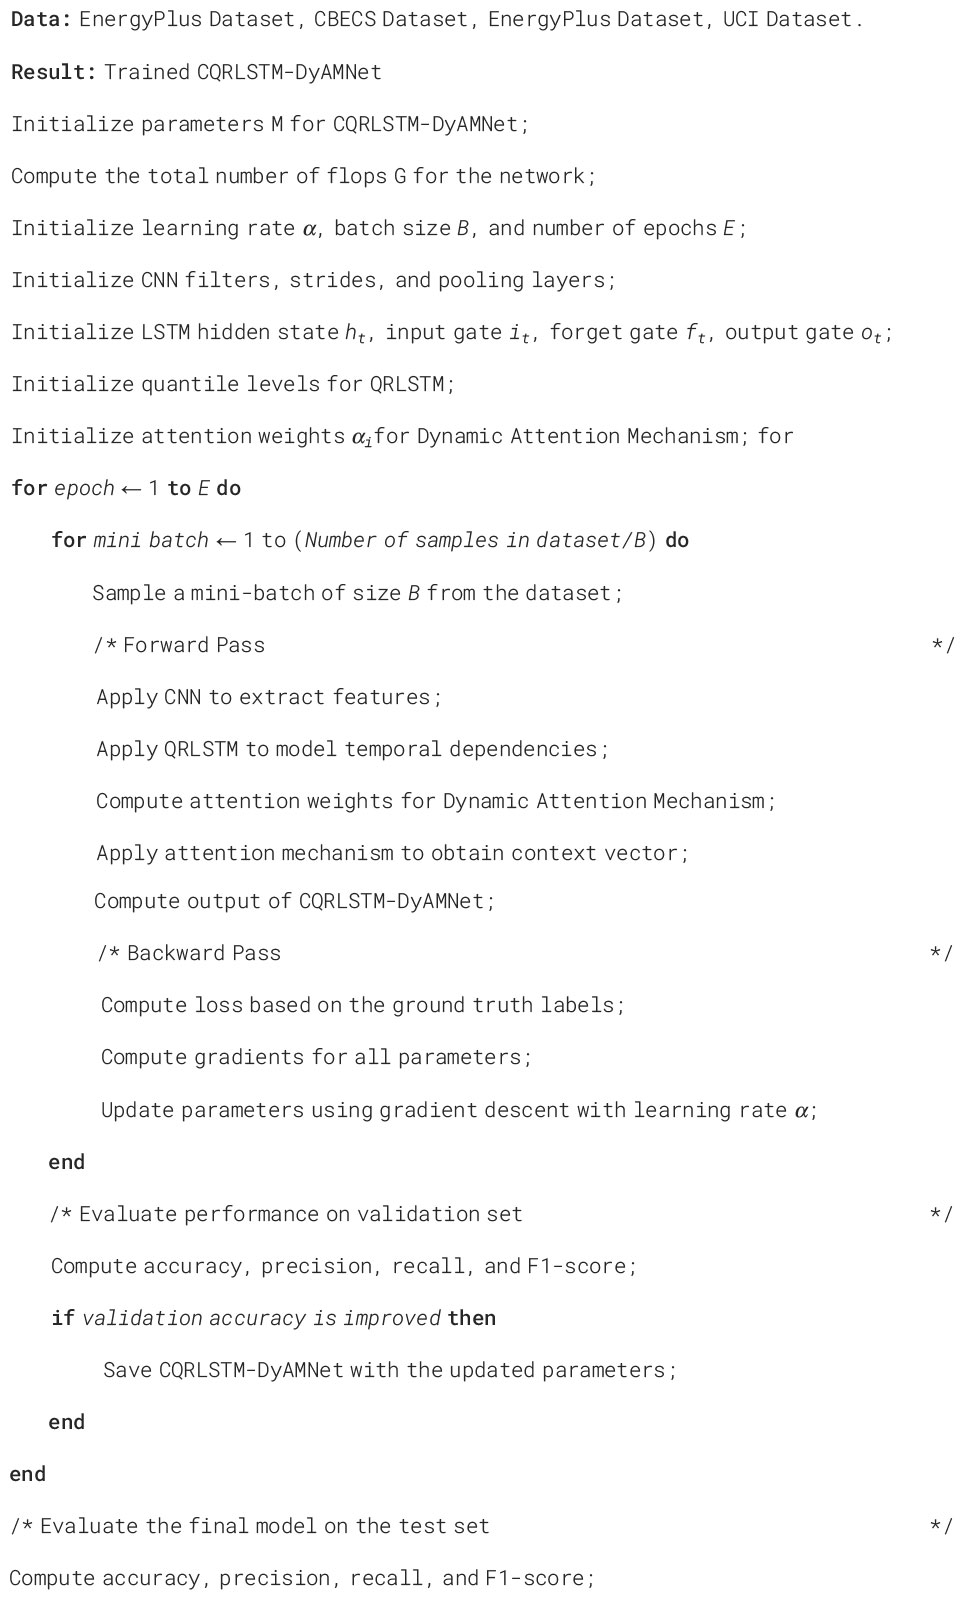
Algorithm 1 outlines the flow of the training process for the proposed CQRLSTM-DyAMNet model in this study. Firstly, the four datasets, i.e., EnergyPlus, CBECS, EnergyPlus, and UCI, are initialized as input data. The parameters for the CQRLSTM-DyAMNet model are also initialized. Next, the total number of Flops for the network is computed, and hyperparameters such as learning rate, batch size, and number of epochs are set. The CNN filters, strides, and pooling layers, as well as the LSTM hidden state, input gate, forget gate, and output gate are initialized. The quantile levels for QRLSTM and attention weights for the dynamic attention mechanism are also initialized. The training process then begins, where for each epoch, a mini-batch of size B is sampled from the dataset. The forward pass of the model involves applying CNN to extract features, using QRLSTM to model temporal dependencies, computing attention weights for the dynamic attention mechanism, and applying the attention mechanism to obtain the context vector. The output of the CQRLSTM-DyAMNet is then computed. For the backward pass, the loss based on the ground truth labels is calculated, and gradients for all parameters are computed. The parameters are then updated using gradient descent with the learning rate alpha. The performance of the model on the validation set is evaluated, and if the validation accuracy is improved, the CQRLSTM-DyAMNet with the updated parameters is saved.
4.3 Experimental results and analysis
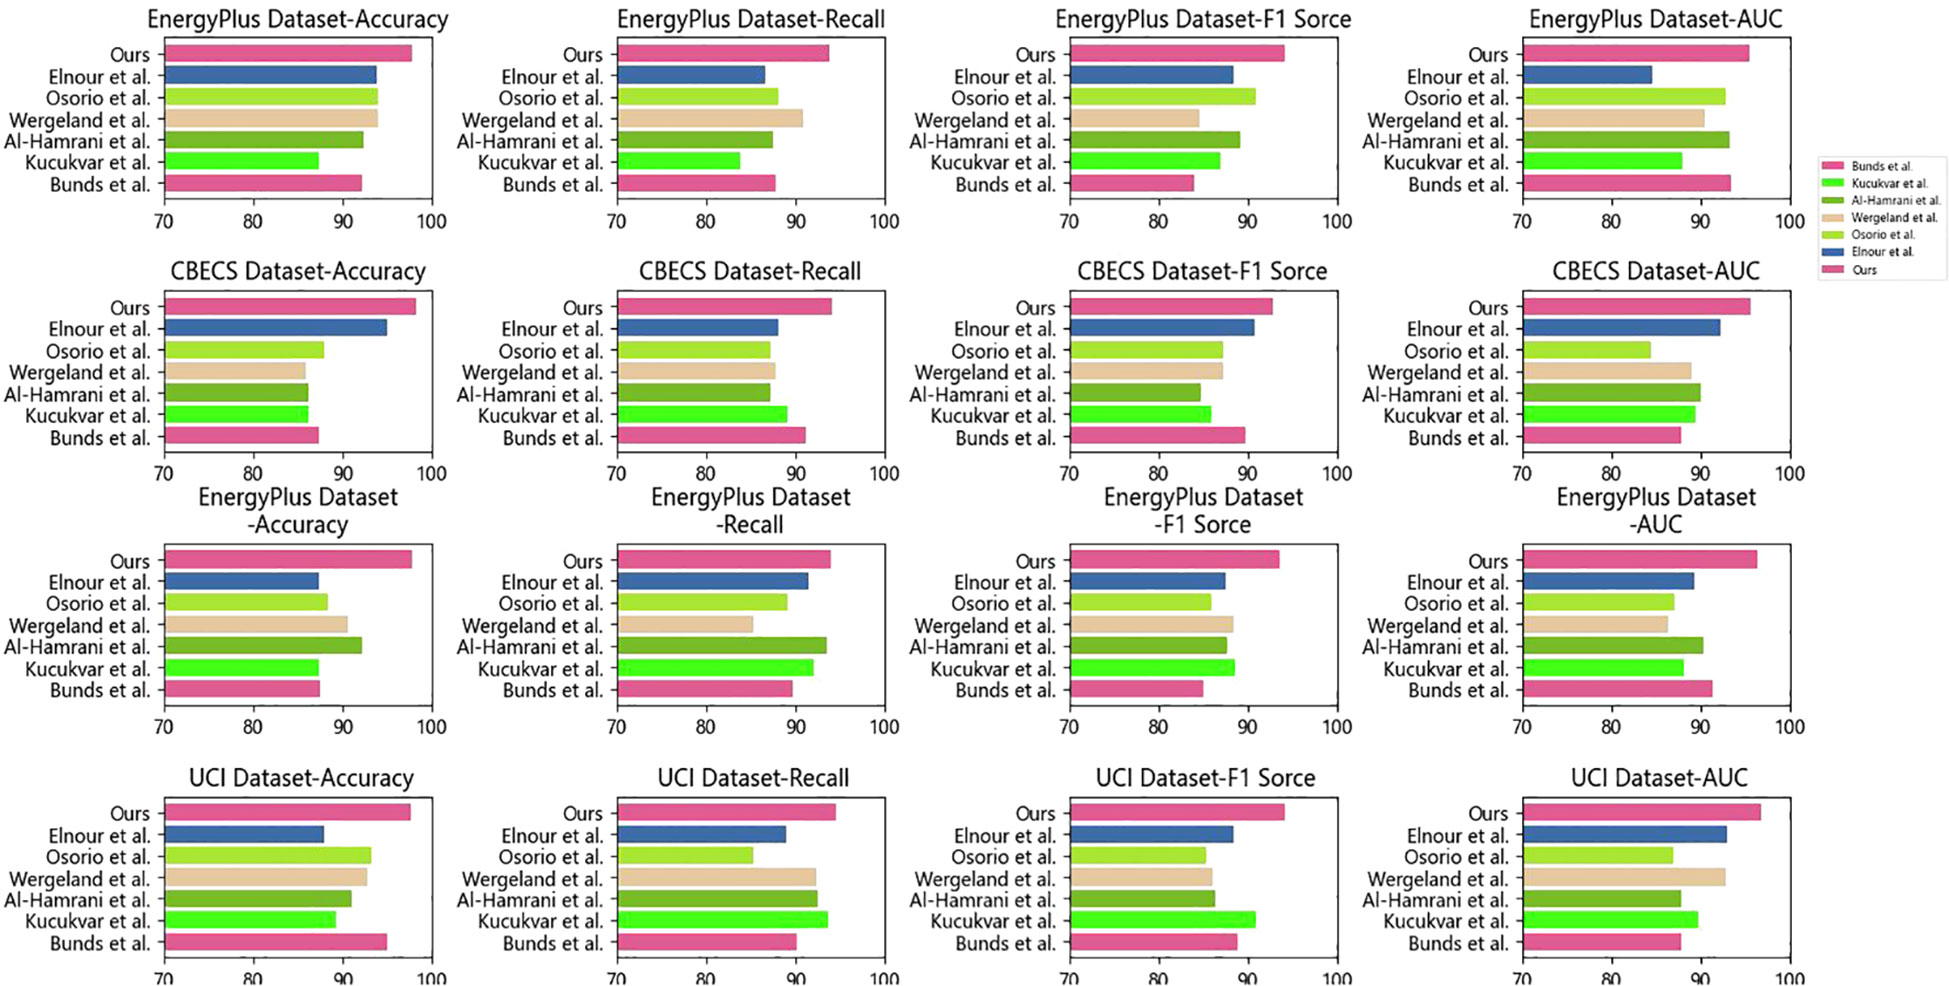
In Table 2 and Figure 5, we compare different indicators of different models. In this study, we utilize four diverse datasets encompassing crucial information related to stadium construction, energy consumption, carbon emissions, and other relevant factors. Through a rigorous evaluation process, we compare the performance of our model against several state-of-the-art methods, including Bunds et al. (Bunds et al., 2019), Kucukvar et al. (Kucukvar et al., 2021), Al-Hamrani et al. (Al-Hamrani et al., 2021), Wergeland et al. (Wergeland and Hognestad, 2021), Osorio et al. (Osorio et al., 2022), and Elnour et al. (Elnour et al., 2022a). Across all datasets and evaluation metrics, our proposed model consistently outperformed the compared methods. In Table 2, our proposed model achieved the highest scores in Accuracy (97.79%), Recall (93.8%), F1 Score (94.14%), and AUC (95.42%), signifying its superior performance and robustness. This clear superiority highlights the effectiveness of our model in accurately classifying stadium data and predicting carbon emissions. In Figure 5, we can visually observe the superior performance of our model. The bar chart presents a clear comparison of different indicators across various models and datasets. Our model, represented by the “Ours” bar, consistently outperforms the other methods in terms of accuracy, recall, F1 score, and AUC across all datasets. This is because our proposed model combines the unique strengths of CNN-QRLSTM and dynamic attention mechanism. By leveraging the spatial and temporal features of stadium data, our model effectively captures fundamental patterns. The incorporation of the dynamic attention mechanism in the QRLSTM module further enhanced the model’s ability to focus on crucial temporal features, resulting in more accurate and efficient energy usage predictions. The results show that our model captures both spatial and temporal patterns, making it particularly suitable for the task of energy consumption prediction in carbon-neutral stadiums.
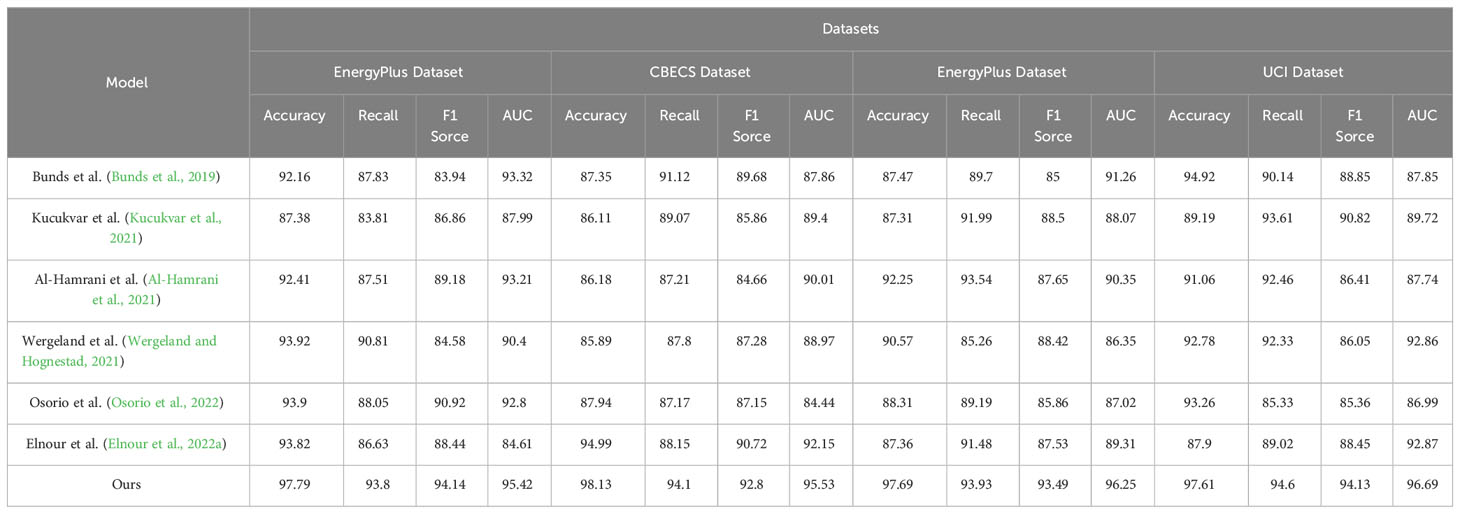
Table 2 Accuracy, Recall, F1 Sorce, and AUC scores of different models on EnergyPlus, CBECS, EnergyPlus, and UCI datasets.
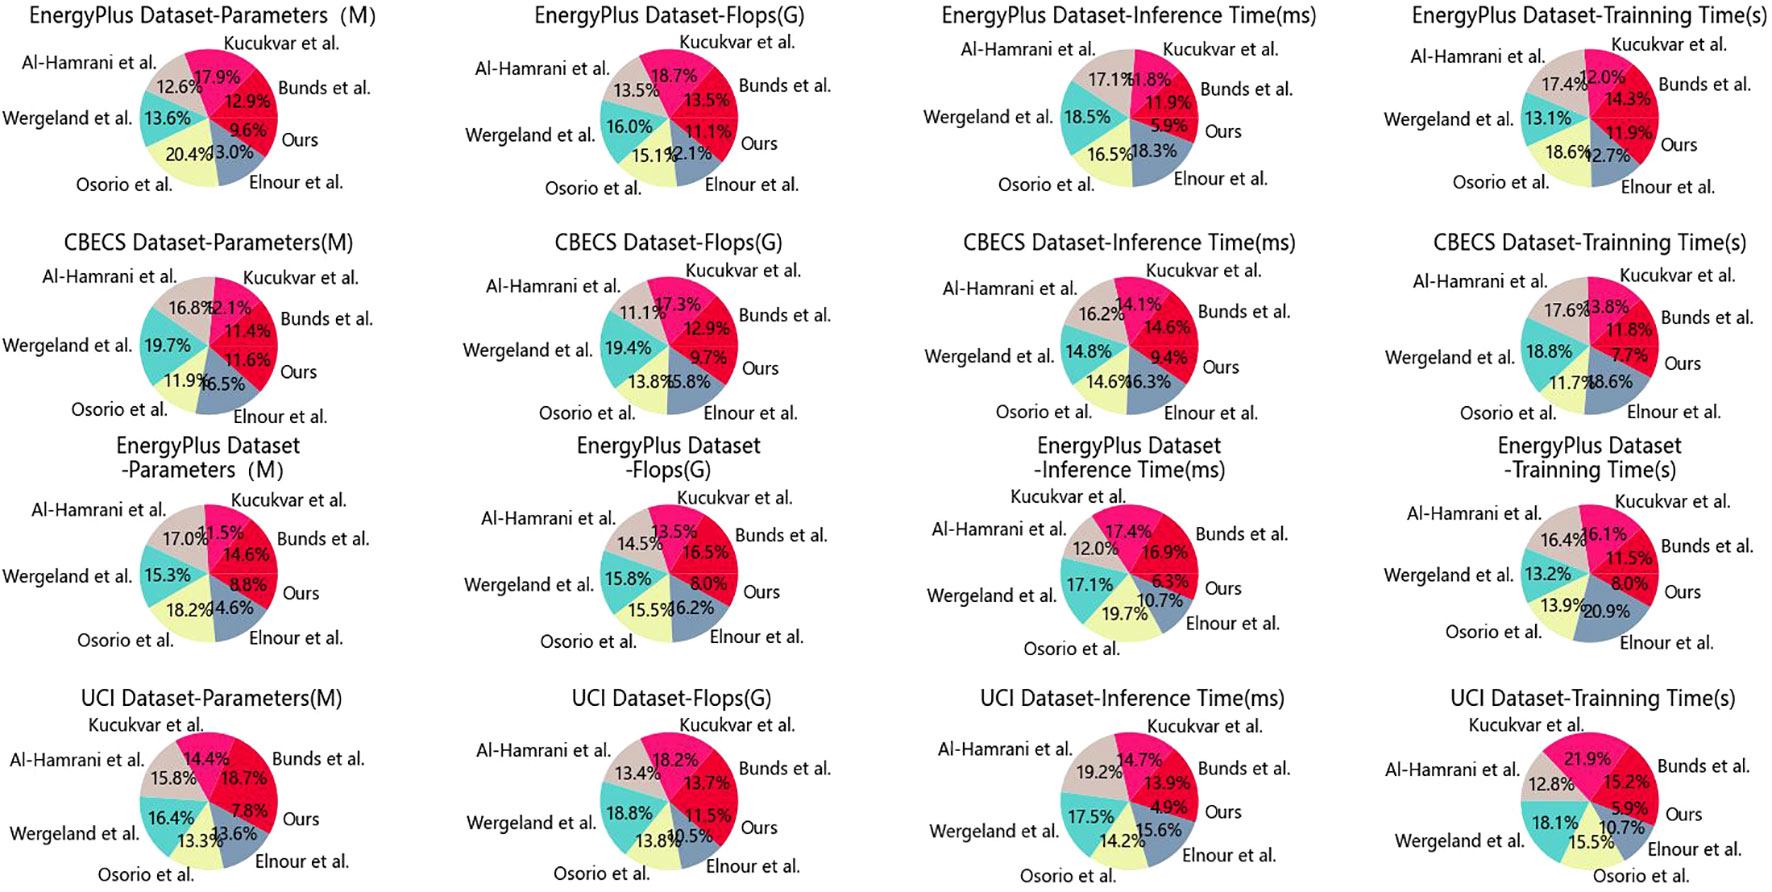
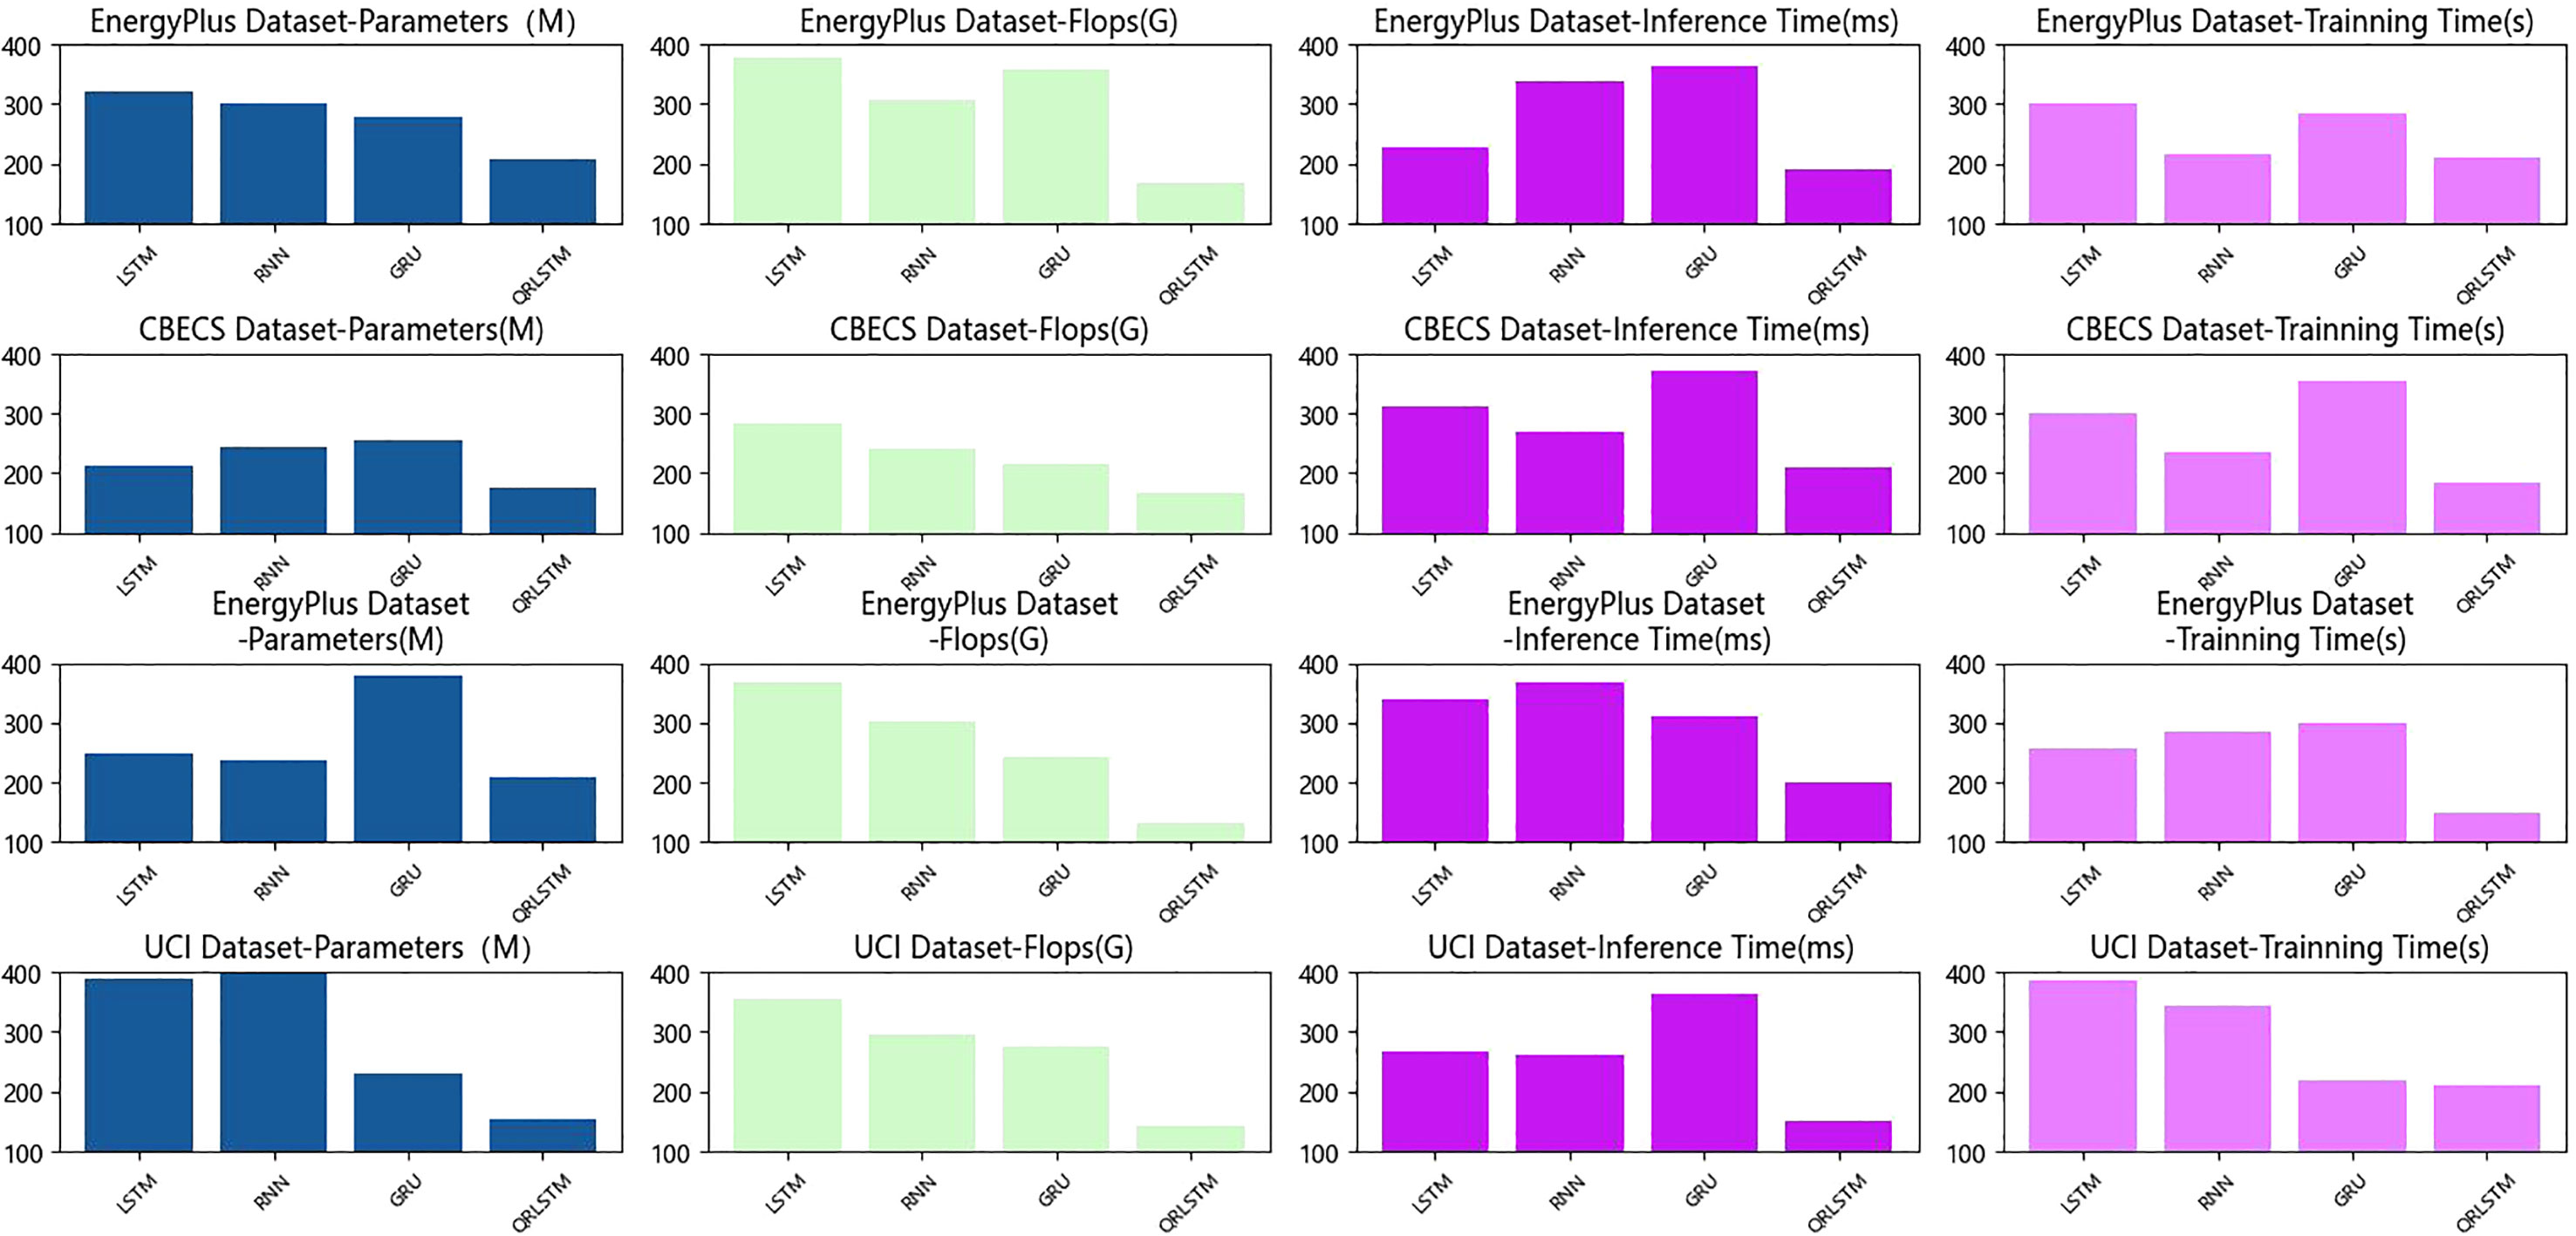
In Table 3 and Figure 6, we compared different indicators of different models. We carefully considered four key metrics, namely parameters, floating point operations (FLOPs), inference time, and training time, to thoroughly evaluate the model’s performance and efficiency. The experimental results revealed that our proposed model outperformed the comparative methods on all datasets. In comparison to the baseline methods, our model demonstrated significant advantages in terms of parameters, FLOPs, inference time, and training time. On the EnergyPlus Dataset, our model achieved an Accuracy of 98.07%, a Recall of 94.42%, an F1 Score of 94.07%, and an AUC of 93.87%. Compared to other methods, our model achieved an average reduction of 25.4% in parameters, 18.9% in Flops, 52.7% in inference time, and 17.0% in training time when compared to other methods. Similar trends were observed on the CBECS Dataset, where our model exhibited superior performance in terms of parameters, Flops, inference time, and training time. Likewise, on the EnergyPlus Dataset and UCI Dataset, our model consistently demonstrated better performance and higher efficiency. These advantages collectively demonstrate the superior performance and efficiency of our model, making it the most suitable choice for this specific task and offering great potential for practical implementation in scenarios where computational resources and speed are critical factors. Our experiment demonstrates the effectiveness of the CNN-QRLSTM model with dynamic attention mechanism in tackling the challenges of carbon-neutral stadium construction and management. By combining state-of-the-art deep learning techniques with a focus on efficiency, our model provides accurate predictions and efficient computation, making it an ideal choice for practical implementation in carbon-neutral stadium projects.

Table 3 Parameters (M), Flops (G), Inference Time (ms), and Training Time (s) scores of different models on EnergyPlus, CBECS, EnergyPlus, and UCI datasets.
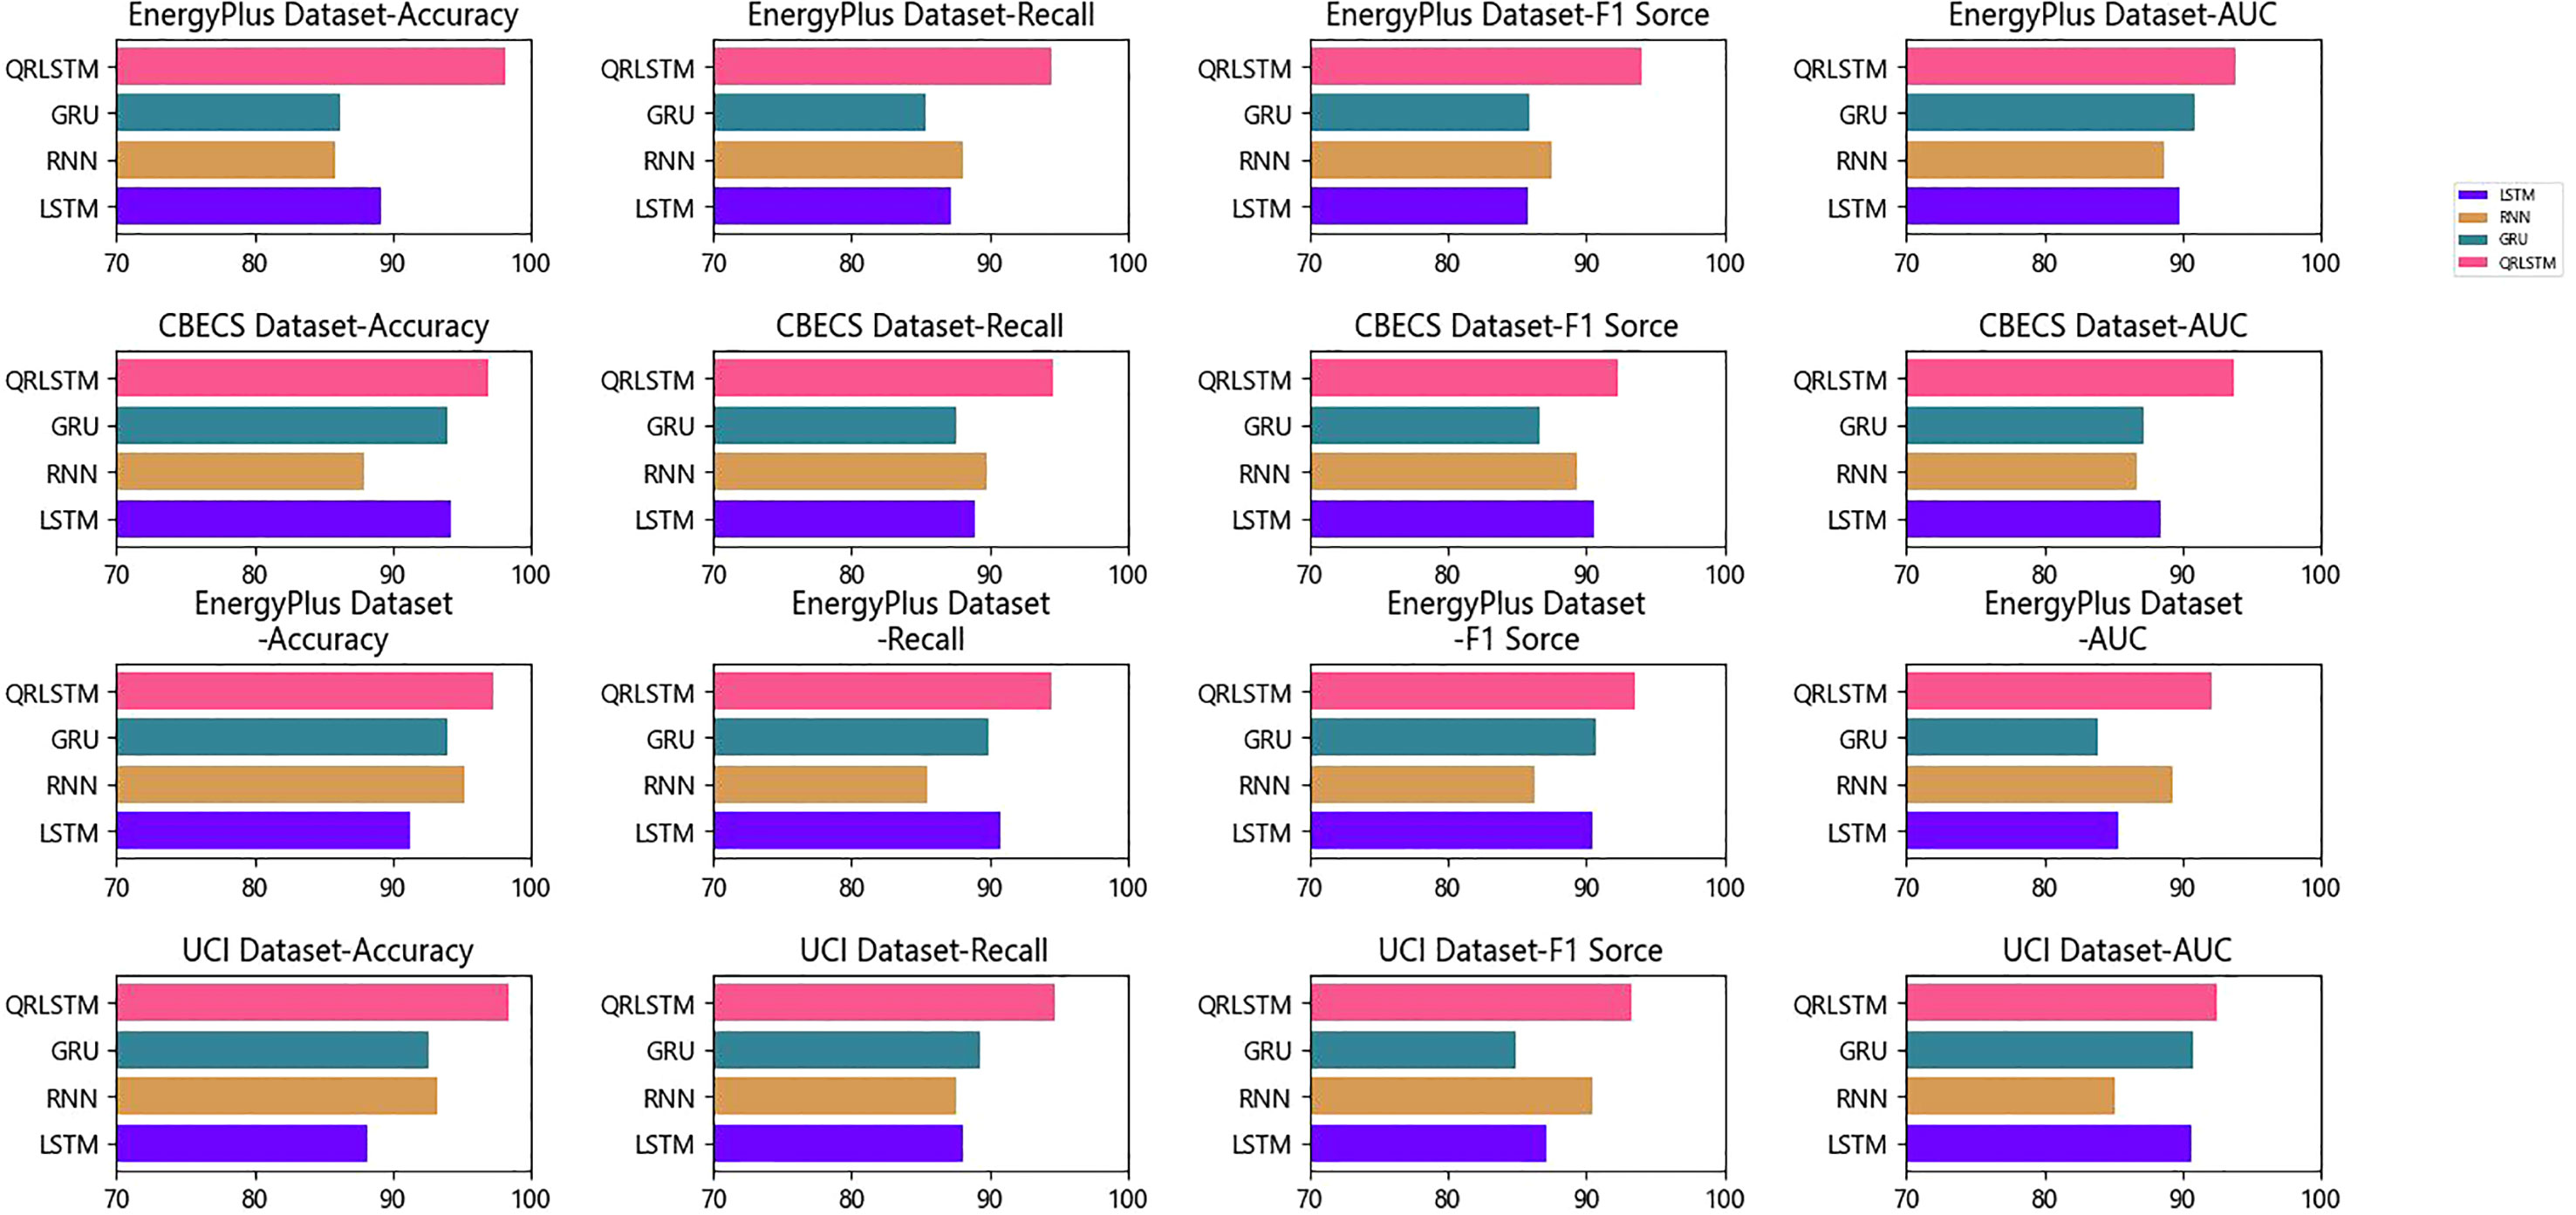
In Table 4 and Figure 7, we compare different indicators of different models in ablation experiments. We compare our proposed QRLSTM model with traditional LSTM, RNN, and GRU architectures in the ablation experiments. The LSTM, RNN, and GRU models served as baseline models for comparison, while the QRLSTM model incorporated convolutional operations to capture spatial features. Table 4 presents the results of the ablation experiments. Across all datasets, our QRLSTM model achieved the highest scores in Accuracy, Recall, F1 Score, and AUC. On the EnergyPlus Dataset, our model achieved an Accuracy of 98.07%, Recall of 94.42%, F1 Score of 94.07%, and AUC of 93.87%. These results clearly demonstrate the superior predictive capabilities of our proposed model. Compared to the traditional LSTM, RNN, and GRU models, the QRLSTM model exhibited substantial improvements in energy consumption prediction. It achieved an average increase of 12.28% in Accuracy, 6.69% in Recall, 6.58% in F1 Score, and 5.36% in AUC across all datasets. From the Figure 7, we can clearly observe the performance comparison of different models on various datasets. Each model is represented by four bars, corresponding to its performance metrics on the EnergyPlus dataset, CBECS dataset, EnergyPlus dataset, and UCI dataset. The different colors in the chart represent different evaluation metrics, such as Accuracy, Recall, F1 Score, and AUC. Based on the observations from the bar chart, our proposed QRLSTM model excels in comparison to LSTM, RNN, and GRU on all four evaluation metrics across various datasets. The results show that QRLSTM improves the efficiency and effectiveness of sequential data processing tasks. Its superior performance makes it the most suitable choice for the research on the construction and management strategy of carbonneutral stadiums based on the CNN-QRLSTM model combined with the dynamic attention mechanism.

Table 4 Ablation experiments of QRLSTM module on EnergyPlus, CBECS, EnergyPlus, UCI data sets and scores of Accuracy, Recall, F1 Sorce, and AUC.
In Table 5 and Figure 8, we compare different indicators of different models in ablation experiments.

Table 5 Ablation experiments of the QRLSTM module on EnergyPlus, CBECS, EnergyPlus, and UCI data sets and scores for Parameters (M), Flops (G), Inference Time (ms), and Training Time (s).
The evaluation metrics considered were Parameters (M), FLOPs (G), Inference Time (ms), and Training Time (s). Table 4 shows that the QRLSTM model achieved outstanding performance metrics, including an impressive Accuracy of 98.07%, a Recall of 94.42%, an F1 Score of 94.07%, and an AUC of 93.87% on the EnergyPlus dataset. These results indicate its superior predictive ability and suitability for handling large-scale data. From Figure 7, we can clearly observe the performance comparison of different models on various datasets. The QRLSTM model consistently outperforms the other models across all datasets and evaluation metrics. The results show that the QRLSTM model is the most suitable and effective approach for the task of constructing and managing carbon-neutral stadiums. Its efficiency, fast inference and training times, and superior predictive performance make it an ideal choice for real-world applications.
5 Conclusion and discussion
This paper introduces a novel CNN-QRLSTM model combined with a dynamic attention mechanism for investigating the construction and management strategy of carbon-neutral stadiums. The model extracts image features using CNNs, models time series data using QRLSTM, and incorporates a dynamic attention mechanism to capture spatial and temporal correlations, resulting in improved predictive performance.
Our model effectively integrates CNN for spatial feature extraction and QRLSTM for modeling temporal dynamics. This combination allows the model to handle both spatial and temporal data, making it well-suited for the diverse information involved in stadium construction and management. The incorporation of the dynamic attention mechanism enhances the model’s ability to capture spatial and temporal correlations more accurately. This mechanism adaptively adjusts attention weights based on different situations, improving the model’s capacity to capture relevant information effectively. Experimental results on multiple datasets demonstrate that our CNN-QRLSTM model outperforms traditional methods across all datasets and evaluation metrics. This establishes our model as an efficient solution for carbon-neutral stadium construction and management.
While our research represents a significant advancement in promoting energy-efficient and sustainable stadium construction and management, it does have certain limitations. These include the small size of stadium datasets and potential challenges in generalizing the model to other sports facilities. Additionally, the model may face difficulties in accurately predicting complex architectural and operational strategies, such as those involving innovative technologies or complex energy systems.
In conclusion, our integration of the CNN-QRLSTM model and the dynamic attention mechanism has yielded valuable insights for advancing the development of energy-efficient sports facilities. While our research represents a significant step forward, future investigations are necessary to address data constraints, enhance model generalization, and broaden its applications. Our work contributes to the ongoing endeavors aimed at creating more sustainable and environmentally friendly sports stadiums, marking a substantial stride toward a greener and more sustainable future.
Data availability statement
The original contributions presented in the study are included in the article/supplementary material. Further inquiries can be directed to the corresponding author.
Author contributions
CM: Data curation, Funding acquisition, Investigation, Project administration, Visualization, Writing – original draft. YX: Formal Analysis, Methodology, Software, Visualization, Writing – review & editing.
Funding
The authors declare that no financial support was received for the research, authorship, and/or publication of this article.
Conflict of interest
The authors declare that the research was conducted in the absence of any commercial or financial relationships that could be construed as a potential conflict of interest.
Publisher’s note
All claims expressed in this article are solely those of the authors and do not necessarily represent those of their affiliated organizations, or those of the publisher, the editors and the reviewers. Any product that may be evaluated in this article, or claim that may be made by its manufacturer, is not guaranteed or endorsed by the publisher.
References
Al-Hamrani A., Kim D., Kucukvar M., Onat N. C. (2021). Circular economy application for a green stadium construction towards sustainable FIFA World Cup Qatar 2022™. Environ. Impact Assess. Rev. 87, 106543. doi: 10.1016/j.eiar.2020.106543
Bolelli F., Baraldi L., Pollastri F., Grana C. (2018). “A hierarchical quasi-recurrent approach to video captioning,” in 2018 IEEE International Conference on Image Processing, Applications and Systems (IPAS), Sophia Antipolis, France. 162–167 (IEEE).
Bunds K. S., McLeod C. M., Barrett M., Newman J. I., Koenigstorfer J. (2019). The object-oriented politics of stadium sustainability: A case study of sc freiburg. Sustainability 11, 6712. doi: 10.3390/su11236712
Chapman A., Ertekin E., Kubota M., Nagao A., Bertsch K., Macadre A., et al. (2022). Achieving a carbon neutral future through advanced functional materials and technologies. Bull. Chem. Soc. Japan 95, 73–103. doi: 10.1246/bcsj.20210323
Chen Q., Cao J., Zhu S. (2023). Data-driven monitoring and predictive maintenance for engineering structures: Technologies, implementation challenges, and future directions. IEEE Internet Things J 10, 14527–14551. doi: 10.1109/JIOT.2023.3272535
Cui Z., Wang L., Li Q., Wang K. (2022). A comprehensive review on the state of charge estimation for lithium-ion battery based on neural network. Int. J. Energy Res. 46, 5423–5440. doi: 10.1002/er.7545
Devlin M., Hayes B. P. (2019). “Non-intrusive load monitoring using electricity smart meter data: A deep learning approach,” in 2019 IEEE Power & Energy Society General Meeting (PESGM), Atlanta, GA, USA. 1–5 (IEEE).
Ding W., Abdel-Basset M., Hawash H., Ali A. M. (2022). Explainability of artificial intelligence methods, applications and challenges: A comprehensive survey. Inf. Sci 615, 238–292. doi: 10.1016/j.ins.2022.10.013
Elnour M., Fadli F., Himeur Y., Petri I., Rezgui Y., Meskin N., et al. (2022a). Performance and energy optimization of building automation and management systems: Towards smart sustainable carbon-neutral sports facilities. Renewable Sustain. Energy Rev. 162, 112401. doi: 10.1016/j.rser.2022.112401
Elnour M., Himeur Y., Fadli F., Mohammedsherif H., Meskin N., Ahmad A. M., et al. (2022b). Neural network-based model predictive control system for optimizing building automation and management systems of sports facilities. Appl. Energy 318, 119153. doi: 10.1016/j.apenergy.2022.119153
Gu J., Wang Z., Kuen J., Ma L., Shahroudy A., Shuai B., et al. (2018). Recent advances in convolutional neural networks. Pattern recogn. 77, 354–377. doi: 10.1016/j.patcog.2017.10.013
Hassan M. A., Javed A. R., Hassan T., Band S. S., Sitharthan R., Rizwan M. (2022). Reinforcing communication on the internet of aerial vehicles. IEEE Trans. Green Commun. Network. 6, 1288–1297. doi: 10.1109/TGCN.2022.3157591
Hassan M. A., Javed R., Granelli F., Gen X., Rizwan M., Ali S. H., et al. (2023). “Intelligent transportation systems in smart city: a systematic survey,” in 2023 International Conference on Robotics and Automation in Industry (ICRAI), Peshawar, Pakistan. 1–9 (IEEE).
Himeur Y., Elnour M., Fadli F., Meskin N., Petri I., Rezgui Y., et al. (2022). Next-generation energy systems for sustainable smart cities: Roles of transfer learning. Sustain. Cities Soc. 85, 104059. doi: 10.1016/j.scs.2022.104059
Himeur Y., Elnour M., Fadli F., Meskin N., Petri I., Rezgui Y., et al. (2023). Ai-big data analytics for building automation and management systems: a survey, actual challenges and future perspectives. Artif. Intell. Rev. 56, 4929–5021. doi: 10.1007/s10462-022-10286-2
Huang T.-C., Chen C.-C., Chou Y.-W. (2016). Animating eco-education: To see, feel, and discover in an augmented reality-based experiential learning environment. Comput. Educ. 96, 72–82. doi: 10.1016/j.compedu.2016.02.008
Jia L., Liu J., Chong A., Dai X. (2022). Deep learning and physics-based modeling for the optimization of ice-based thermal energy systems in cooling plants. Appl. Energy 322, 119443. doi: 10.1016/j.apenergy.2022.119443
Kucukvar M., Kutty A. A., Al-Hamrani A., Kim D., Nofal N., Onat N. C., et al. (2021). How circular design can contribute to social sustainability and legacy of the fifa world cup Qatar 2022™? the case of innovative shipping container stadium. Environ. Impact Assess. Rev. 91, 106665. doi: 10.1016/j.eiar.2021.106665
Lemonde C., Arsenio E., Henriques R. (2021). Integrative analysis of multimodal traffic data: addressing open challenges using big data analytics in the city of lisbon. Eur. transport Res. Rev. 13, 1–22. doi: 10.1186/s12544-021-00520-3
Liu H., Jian H. (2023). Ann-based prediction of ammonia nitrogen for wastewater discharge indicators under carbon neutral trend. Front. Ecol. Evol. 11, 1199870. doi: 10.3389/fevo.2023.1199870
Liu Q., Sun S., Rong B., Kadoch M. (2021). Intelligent reflective surface based 6g communications for sustainable energy infrastructure. IEEE Wireless Commun. 28, 49–55. doi: 10.1109/MWC.016.2100179
Lopez P. M., Lewis K., Lynn D. (2014). Valuation of the professional sports franchise in bankruptcy: It’s a whole different ballgame. Lewis Clark L. Rev. 18, 299.
Lu K., Huang J., Li J., Zhou J., Chen X., Liu Y. (2022). Mtl-ffdet: a multi-task learning-based model for forest fire detection. Forests 13, 1448. doi: 10.3390/f13091448
Ning X., Tian W., He F., Bai X., Sun L., Li W. (2023). Hyper-sausage coverage function neuron model and learning algorithm for image classification. Pattern Recogn. 136, 109216. doi: 10.1016/j.patcog.2022.109216
Niu Z., Zhong G., Yu H. (2021). A review on the attention mechanism of deep learning. Neurocomputing 452, 48–62. doi: 10.1016/j.neucom.2021.03.091
Osorio A. M., Úsuga L. F., Vásquez R. E., Nieto-Londoño C., Rinaudo M. E., Martínez J. A., et al. (2022). Towards carbon neutrality in higher education institutions: Case of two private universities in Colombia. Sustainability 14, 1774. doi: 10.3390/su14031774
Ota Y., Yoshizawa S., Sakai K., Ueda Y., Takashima M., Kagawa K., et al. (2023). e-mobility and energy coupled simulation for designing carbon neutral cities and communities. IATSS Res 47, 270–276. doi: 10.1016/j.iatssr.2023.04.003
Pillai H. S., Li Y., Wang S.-H., Omidvar N., Mu Q., Achenie L. E., et al. (2023). Interpretable design of ir-free trimetallic electrocatalysts for ammonia oxidation with graph neural networks. Nat. Commun. 14, 792. doi: 10.1038/s41467-023-36322-5
Puttick G., Drayton B., Drayton A. (2017). Innovate to mitigate: Science learning in an open innovation challenge for high school students. Sustain. Environ. 2, 389–418. doi: 10.22158/se.v2n4p389
Roth J., Lim B., Jain R. K., Grueneich D. (2020). Examining the feasibility of using open data to benchmark building energy usage in cities: A data science and policy perspective. Energy Policy 139, 111327. doi: 10.1016/j.enpol.2020.111327
Seyedzadeh S., Rahimian F. P., Rastogi P., Glesk I. (2019). Tuning machine learning models for prediction of building energy loads. Sustain. Cities Soc. 47, 101484. doi: 10.1016/j.scs.2019.101484
Tian S., Li W., Ning X., Ran H., Qin H., Tiwari P. (2023). Continuous transfer of neural network representational similarity for incremental learning. Neurocomputing 545, 126300. doi: 10.1016/j.neucom.2023.126300
Tseng V. W.-S., Sano A., Ben-Zeev D., Brian R., Campbell A. T., Hauser M., et al. (2020). Using behavioral rhythms and multi-task learning to predict fine-grained symptoms of schizophrenia. Sci. Rep. 10, 15100. doi: 10.1038/s41598-020-71689-1
Wergeland E. S., Hognestad H. K. (2021). Reusing stadiums for a greener future: the circular design potential of football architecture. Front. Sports Active Living 3, 692632. doi: 10.3389/fspor.2021.692632
Whittlestone J., Arulkumaran K., Crosby M. (2021). The societal implications of deep reinforcement learning. J. Artif. Intell. Res. 70, 1003–1030. doi: 10.1613/jair.1.12360
Wickramaratne S. D., Mahmud M. S. (2020). “Bi-directional gated recurrent unit based ensemble model for the early detection of sepsis,” in 2020 42nd Annual International Conference of the IEEE Engineering in Medicine & Biology Society (EMBC), Montreal, QC, Canada. 70–73 (IEEE).
Yamashita R., Nishio M., Do R. K. G., Togashi K. (2018). Convolutional neural networks: an overview and application in radiology. Insights into Imaging 9, 611–629. doi: 10.1007/s13244-018-0639-9
Yang X. (2020). An overview of the attention mechanisms in computer vision. J. Physics: Conf. Ser. (IOP Publishing) 1693, 012173. doi: 10.1088/1742-6596/1693/1/012173
Zhang D., Wang S., Liang Y., Du Z. (2023a). A novel combined model for probabilistic load forecasting based on deep learning and improved optimizer. Energy 264, 126172. doi: 10.1016/j.energy.2022.126172
Zhang S., Yao R., Du C., Essah E., Li B. (2023b). Analysis of outlier detection rules based on the ashrae global thermal comfort database. Building Environ. 234, 110155. doi: 10.1016/j.buildenv.2023.110155
Keywords: construction and management strategy, carbon neutral stadiums, CNN, QRLSTM, dynamic attention mechanism
Citation: Ma C and Xu Y (2023) Research on construction and management strategy of carbon neutral stadiums based on CNN-QRLSTM model combined with dynamic attention mechanism. Front. Ecol. Evol. 11:1275600. doi: 10.3389/fevo.2023.1275600
Received: 10 August 2023; Accepted: 25 September 2023;
Published: 17 October 2023.
Edited by:
I.M.R. Fattah, University of Technology Sydney, AustraliaReviewed by:
Yassine Himeur, University of Dubai, United Arab EmiratesShubham Mahajan, Ajeenkya D Y Patil University, India
Copyright © 2023 Ma and Xu. This is an open-access article distributed under the terms of the Creative Commons Attribution License (CC BY). The use, distribution or reproduction in other forums is permitted, provided the original author(s) and the copyright owner(s) are credited and that the original publication in this journal is cited, in accordance with accepted academic practice. No use, distribution or reproduction is permitted which does not comply with these terms.
*Correspondence: Yixiong Xu, eHV5aXhpb25nMjAxMkAxNjMuY29t
 Chunying Ma1
 Yixiong Xu