 Chantelle Hooper1,2*
 Georgia M. Ward1
 Rachel Foster1,3,4
 Ilze Skujina5,6
 Joseph E. Ironside5
 Cédric Berney7
 David Bass1,2
- 1Centre for Environment, Fisheries and Aquaculture Science (Cefas), Weymouth Laboratory, Weymouth, United Kingdom
- 2Centre for Sustainable Aquaculture Futures, University of Exeter, Exeter, United Kingdom
- 3Department of Life Sciences, the Natural History Museum, London, United Kingdom
- 4School of Life Sciences and the Environment, Royal Holloway University of London, Egham, United Kingdom
- 5Department of Life Sciences, Aberystwyth University, Aberystwyth, United Kingdom
- 6University College Dublin, School of Biology and Environmental Science, O’Brien Centre, Science Centre West, Belfield, Ireland
- 7Centre National de la Recherche Scientifique (CNRS), Sorbonne Université, Station Biologique de Roscoff, Roscoff, France
Introduction: There is no universally appropriate basis for delimiting species in protists, including parasites. Many molecular markers used for species delimitation are part of the ribosomal RNA (rRNA) array, with different regions of the array being used for different parasitic protist taxa. However, little is known about sequence variability across the rRNA in most organisms, and there is no standard threshold at which divergence in the sequence of a particular gene can be used as a basis for species delimitation.
Methods: Here we demonstrate a method to generate the full rRNA array of parasitic protists by amplification of the array in two long, overlapping fragments followed by Illumina and Nanopore sequencing to produce high quality assemblies, to determine variations in sequence variability across the array. We apply this approach to two pairs of closely related ascetosporean parasites of crustaceans and molluscs [respectively Paramarteilia canceri/P. orchestiae and Marteilia cochillia/M. cocosarum (Rhizaria; Endomyxa; Ascetosporea)] and Bonamia ostreae and demonstrate how full-length rRNA sequences can be used to determine regions of the rRNA array that are most discriminatory, and robustly differentiate between species in combination with other lines of evidence.
Results: Phylogenetic analyses of the transcribed regions of the rRNA array demonstrate maximal support for, and separation of, all four parasite species. Sliding window global alignment analysis determined the regions of the rRNA array that had the most consistent nucleotide differences between the closely related parasites in a 1 kb region of the array. For Paramarteilia, this region was a combined internal transcribed spacer 1-5.8S-internal transcribed spacer 2 alignment, and for Marteilia, it was the external transcribed spacer. Phylogenetic analysis of these regions were able to recover the respective species, demonstrating that these regions could be used for improved diagnostic PCR assays.
Discussion: Our method could be adapted to quickly generate sequence data and determine regions more suitable for diagnostic assays for a wide diversity of parasite groups. It also allows the generation of sequence data for regions of the rRNA not commonly studied (e.g. regions of the intergenic spacer), thus enabling research into their suitability as marker regions.
1 Introduction
There is little consensus about appropriate criteria by which species are delimited across microeukaryotes, particularly parasitic protists. Traditionally, protist species have been described based on differences in morphology (observed by either light or electron microscopy), host specificity, and/or geographical location (Finlay, 2004). However, the rise of genetic research and the accessibility of sequencing has challenged the morphological species concept, with a larger number of differences identified in molecular sequence data than traditional phenotype-based techniques. A number of gene regions, including the variable regions of the ribosomal RNA (rRNA) array (small subunit (18S), large subunit (28S), internal transcribed spacer 1 (ITS1), internal transcribed spacer 2 (ITS2) and intergenic spacer (IGS)) and mitochondrial genes (most frequently Cytochrome oxidase 1 (CO1) and Cytochrome b (cytb)) have been used to discriminate between closely related species (Boenigk et al., 2012). Pawlowski et al. (2012) state that finding a single, universal DNA barcode for protists is virtually impossible due to their long and complex evolutionary histories, and very variable relative rates of genetic and phenotypic evolution. Additionally, some protist species completely lack commonly used discriminatory regions (i.e. mitochondrial genes) (Boenigk et al., 2012).
DNA approaches to species delimitation of different parasite groups have often been developed in isolation, resulting in the adoption of different genes (nuclear and mitochondrial) and gene regions as markers to discriminate between species within each group. For example, the Trichodina genus of ciliates, which includes species parasitic to aquatic hosts, are delimited based on variable regions of the 18S rRNA gene (Wang et al., 2022), whereas the Tetrahymena genus, also including species parasitic to aquatic hosts, are delimited based on the mitochondrial CO1 gene (Lynn and Strüder-Kypke, 2006). Other marker regions are commonly used for parasite groups: for example Haemosporida, an order of parasitic alveolates including malaria parasites, have been delimited based on differences in the cytb gene (Escalante et al., 1998), and species of parasitic dinoflagellates are delimited based on ITS1 of the ribosomal rRNA array (Small, 2012). The use of multilocus markers has aided the delimitation of many parasite species, including those from Apicomplexa (Bensch et al., 2004) and Microsporidia (Bacela-Spychalska et al., 2018), with some studies combining both nuclear and mitochondrial genes in phylogenetic analyses (Bensch et al., 2004). While providing better resolution, these regions are still relatively short (<500 bp) and may not capture additional variability in other regions of the gene.
As the variability of different regions of the rRNA array differs between groups of microeukaryotes, the present study aimed to amplify and sequence the full ribosomal rRNA (18S-ITS1-5.8S-ITS2-28S-IGS) from two sets of closely related species, using ascetosporean parasites as an example (Bass et al., 2019), to determine a method for reliably identifying regions of the rRNA array that could be used for phylogenetic analysis for species delimitation.
Some pathogens that cause significant losses in aquatic animal production of international concern are listed by the World Organisation for Animal Health (WOAH; previously OIE), including three ascetosporean parasites: B. ostreae, B. exitiosa and Marteilia refringens. As listed pathogens, their detection in a susceptible or novel host (WOAH, 2022) or reason to suspect the presence of a listed pathogen in an animal (e.g. detection in the environment that the susceptible host exists) (Regulation (EU) 2016/429) requires reporting to the competent authority. Following investigation, restrictions may be placed on the movement and trade of animals from the infected sites. Designation of geographic regions as positive for an WOAH-listed pathogen has significant trade implications, and so it is crucial that detection of the parasite, particularly by molecular biology techniques, is robust enough to be able to identify the species of concern and therefore sufficiently specific to discriminate between closely related species.
Marteilia cochillia was characterised in the cockle Cerastoderma edule from Alfacs Bay (Mediterranean coast of Spain) in 2013 (Carrasco et al., 2013) but has been associated with mass mortalities of C. edule since 2008 (Carrasco et al., 2011). M. cochillia has since been determined as the cause of collapse of the C. edule fishery in Ría de Arousa (NW Spain), where mortalities reached 100% in 2012 (Villalba et al., 2014). Histological analysis of infected cockles showed heavy presence of the parasite in the digestive gland, with all tubules within a histology section frequently infected (Villalba et al., 2014). In 2017, a novel Marteilia parasite was detected in Wales (UK) using M. cochillia-specific primers targeting the ITS1 region of rRNA (Skujina et al., 2022). Mortalities had been observed in the locations where this Marteilia had been detected, but were not to the extent seen in Spain, and could not be directly linked to infection with Marteilia. Histologically, infection with the Marteilia species in Wales was systemic, however there was no observation of the parasite within the digestive gland tubules typical of M. cochillia infection. Skujina et al. (2022) determined, based on sequencing larger regions of rRNA (18S, ITS1 and ITS2 and partial 28S rRNA), that ITS2 and partial 28S (~1250 bp) was able to phylogenetically discriminate between the two Marteilia species, whereas a previously published primer set designed to be specific to M. cochillia amplifying partial ITS1 (~300 bp) could not. Based on differences in ITS2 and 28S, geographical location, and differences in tissue tropism, the Marteilia detected in Wales was therefore described as a new species, Marteilia cocosarum Skujina et al. (2022).
The genus Paramarteilia (also Paramyxida) comprises two described species: Paramarteilia canceri and P. orchestiae (Feist et al., 2009; Ward et al., 2016). Until recently, the known host range of P. canceri was limited to the edible crab, Cancer pagurus, and was infrequently detected. However, (Collins et al., 2022) reported that the decline in landings of the adult velvet swimming crab (Necora puber) in Galway Bay, Ireland, was associated with high levels of infection by P. canceri, suggesting that this parasite may be of significance to fisheries. P. orchestiae has been shown to infect multiple amphipod species including Orchestia aestuarensis (Pickup and Ironside, 2018), O. gammarellus (Ginsburger-Vogel and Desportes, 1979; Ginsburger-Vogel, 1991) and Echinogammarus marinus (Short et al., 2012; Ward et al., 2016). Collins et al. (2022) showed that P. canceri and P. orchestiae cannot be reliably separated phylogenetically using 18S sequence data alone, and that the ITS1 region was more suitable to discriminate between these closely related parasites. Like M. cochillia and M. cocosarum, considering differences in host specificity and sequence data, P. canceri and P. orchestiae were considered to be distinct species. Having a reliable marker to be able to discriminate between these closely related parasites could be critical should P. canceri continue to pose a risk to crustacean fisheries.
These examples demonstrate the need for techniques targeting the most discriminative regions of the rRNA array to be able to robustly and unambiguously distinguish between closely related parasites. In this study we generated and sequenced long amplicons using Illumina and Oxford Nanopore Technologies (ONT) platforms, covering the entire rRNA array for M. cochillia, M. cocosarum, P. canceri, and P. orchestiae, to a) determine whether phylogenetic analysis of the complete array was able to fully separate these closely related parasites as discrete and holophyletic genetic lineages, and b) identify the most appropriate region(s) of the array to distinguish between them using shorter diagnostic amplicons. The broadly-targeted primers were able to amplify long rRNA array regions from other Ascetosporea/Endomyxa, which were used to generate the full array of Bonamia ostreae (Haplosporida), a notifiable parasite of oysters (Pichot et al., 1979), to serve as an outgroup in phylogenetic analyses.
2 Materials and methods
2.1 Sample collection
Cockles (C. edule) infected with Marteilia were collected from the Dyfi Estuary and Gann Flats (Wales, UK) in 2018 (Skujina et al., 2022), and from Ría de Arousa (Galica, Spain) in 2018 (Skujina et al., 2022). Orchestia spp. amphipods infected with P. orchestiae were collected from the Gann Estuary, Pembrokeshire in 2019 (Collins et al., 2022) and velvet swimming crabs (N. puber) infected with P. canceri were collected from Galway Bay in 2015 and 2016 (Collins et al., 2022). Flat oysters infected with B. ostreae were sourced from Mersea, Essex in 2018.
2.2 DNA extraction
A tissue cross-section from individual cockles from Wales infected with M. cocosarum (Skujina et al., 2022), digestive gland from cockles infected with M. cochillia (Skujina et al., 2022), gill tissue from velvet crabs infected with P. canceri (Collins et al., 2022) and whole amphipods infected with P. orchestiae (Collins et al., 2022) were fixed whole in 100% molecular grade ethanol. Tissue was homogenised in Lifton’s Buffer (Nishiguchi et al., 2002) or CTAB and extracted using a phenol:chloroform method (Winnepenninckx et al., 1993). DNA extractions were quantified using the Quantifluor® ONE dsDNA system (Promega, Wisconsin, USA) and quality checked on a TapeStation 4150 (Agilent Technologies, California, USA) using Genomic DNA ScreenTapes (Agilent Technologies).
2.3 Primer design
Multiple sequence alignment was carried out on a representative set of Cercozoa sequences using MAFFT (Katoh and Standley, 2013) using the E-INS-i algorithm. Conserved regions were identified by eye and primers were designed with degenerate bases to accommodate variation in sequence between lineages/species. The alignment is provided in the Supplementary Materials (alignment 1). Primer sequences used in the study are denoted in Table 1, and their location and direction of amplification in Figure 1.
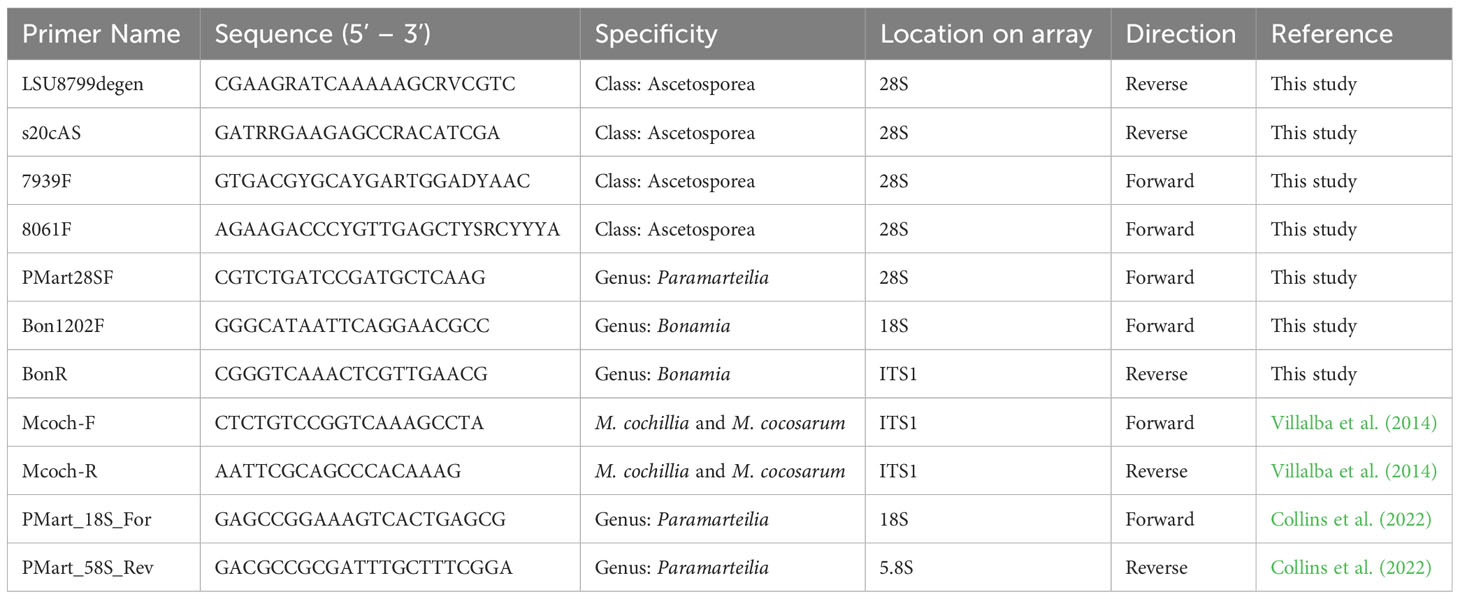
Table 1 Table outlining primer sequences, their position of the primer on the rRNA and the direction in which they amplify.
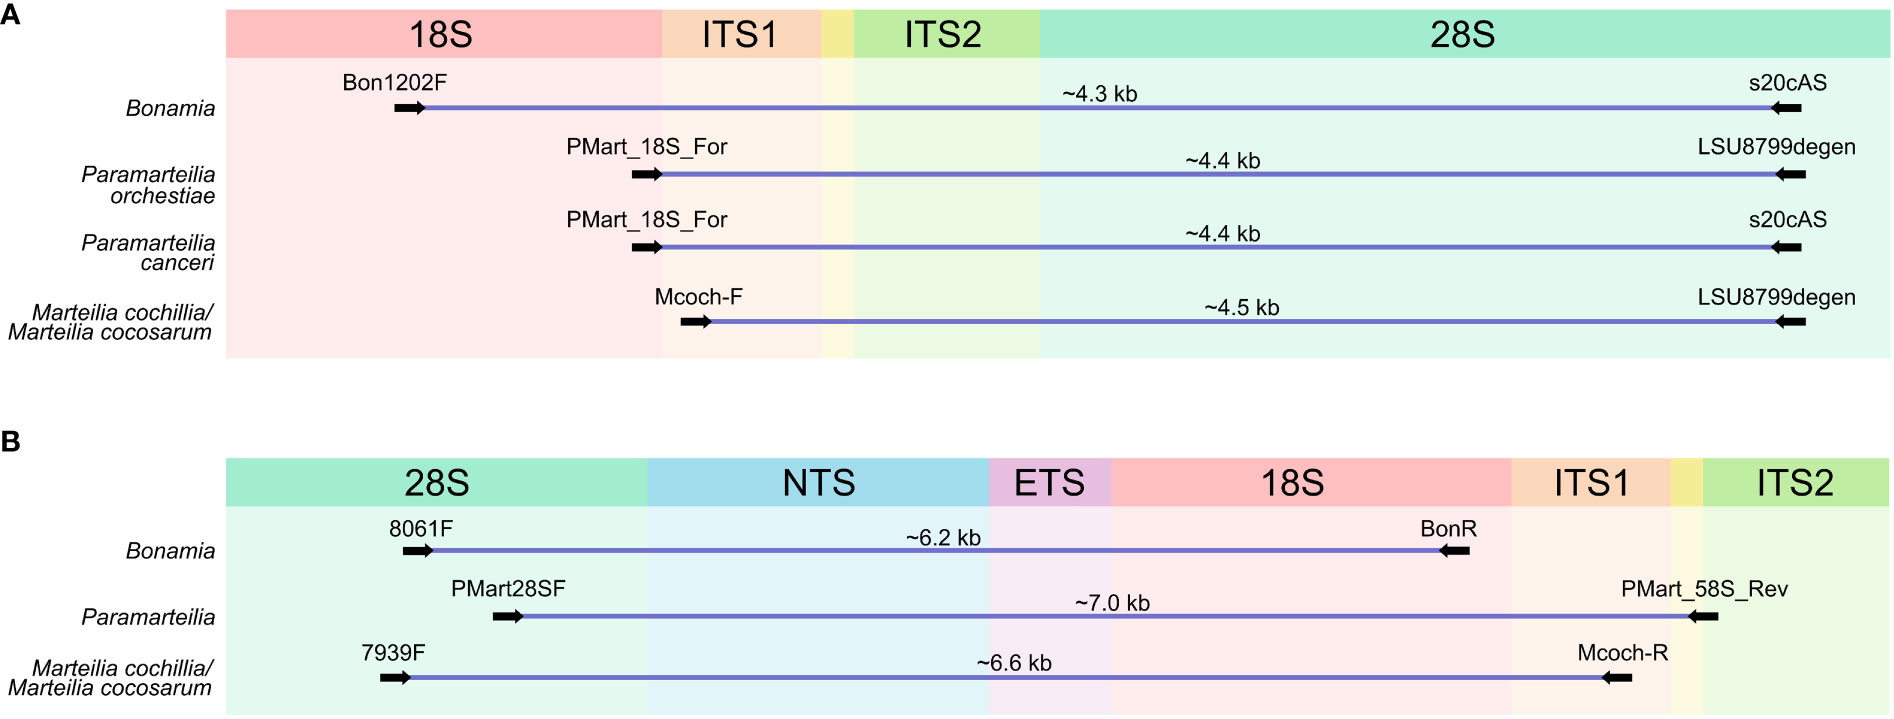
Figure 1 Schematic representation of the ribosomal RNA (rRNA) array with approximate location of the primers used to amplify long regions of the array. (A) Primers used to amplify the first amplicon. (B) Primers used to amplify the second amplicon. Approximate amplicon sizes are given above each. 18S, Small subunit rRNA gene, ITS1, Internal Transcribed Spacer 1; ITS2, Internal Transcribed Spacer 2; 28S, Large subunit rRNA gene; NTS, Non-transcribed Spacer; ETS, External Transcribed Spacer.
2.4 PCR
All PCRs were carried out in 25 µl volumes comprising 1× PrimeSTAR GXL Buffer (Takara Bio, Shiga, Japan), 0.2 µM dNTP mixture (Takara Bio), 0.4 µM of each primer and 1.25 U PrimeSTAR GXL DNA polymerase (Takara Bio). Cycling conditions for all PCRs were carried out by initial denaturation at 95°C for 5 minutes, followed by 35 cycles of 95°C for 45 seconds, a variable annealing temperature (described below) for 45 seconds and 68°C for 150 seconds; and a final extension of 10 minutes at 68°C.
Marteilia amplicons covering partial ITS1, 5.8S, ITS2 and partial 28S were amplified using Mcoch-F (Villalba et al., 2014) and LSU8799degen with an annealing temperature of 64°C. Amplicons covering partial 28S, IGS, 18S and partial ITS1 were amplified using 7939F and McochR (Villalba et al., 2014) with an annealing temperature of 63°C.
P. orchestiae amplicons covering partial 18S, ITS1, 5.8S, ITS2 and partial 28S were amplified using PMart_18S_For (Collins et al., 2022) and LSU8799degen with an annealing temperature of 65°C, and P. canceri amplicons covering the same region were amplified using PMart_18S_For (Collins et al., 2022) and s20cAS with an annealing temperature of 60°C. Amplicons for both Paramarteilia species covering partial 28S, IGS, 18S, ITS1 and partial 5.8S were amplified using PMart28SF and PMart_58S_Rev (Collins et al., 2022) with an annealing temperature of 57°C.
B. ostreae amplicons covering partial ITS1, 5.8S, ITS2 and partial 28S were amplified using Bon1202F and LSU8799degen with an annealing temperature of 60°C. Amplicons covering partial 28S, IGS and partial 18S were amplified using 8061F and BonR with an annealing temperature of 66°C.
2.5 Sequencing
Amplicons were cleaned using ProNex size-selective purification system (Promega) following the manufacturer’s protocol using a 1× bead volume. Amplicons were prepared for sequencing on an Illumina Miseq (Illumina, California, U.S.A.) using a Nextera XT DNA Library Preparation Kit (Illumina), following the manufacturer’s protocol, but using half volume reactions. Pooled and barcoded libraries (10 pM loading concentration) were paired-end sequenced on v2 Nano flow cells (500-cycle) (Illumina) on an Illumina MiSeq (2 x 250 bp).
Amplicons were prepared for Nanopore sequencing using the PCR Barcoding Kit (Oxford Nanopore Technologies, Oxford, UK) and sequenced on Flongle Flow Cells (12 samples per flow cell, 16 hours sequencing time) (Oxford Nanopore Technologies) using a MinIon Mk1C device (Oxford Nanopore Technologies). Basecalling was completed in real-time on the Mk1C device using Guppy v5.0.11 (Oxford Nanopore Technologies).
The raw data generated from Illumina and Nanopore sequencing were deposited to GenBank under BioProject ID PRJNA1013585.
2.6 Bioinformatic analysis of sequence data
For amplicons sequenced using Illumina MiSeq, raw paired-end sequence reads were trimmed to remove adaptor and low-quality sequences using Trimmomatic v0.39 (using a sliding window of 4, minimum quality of 15, leading and trailing values of 3, and a minimum length of 50 bases; Bolger et al. (2014)). The quality of trimmed and filtered reads was assessed using FastQC v0.11.8 (default parameters; https://www.bioinformatics.babraham.ac.uk/projects/fastqc/) prior to assembly using SPAdes v3.13.1 [in –meta mode, using kmer sizes of 21, 33, 55, 77, 88 and 127; Prjibelski et al. (2020)].
Nanopore-generated raw reads were trimmed, corrected, and a consensus generated using Canu v2.1 [default parameters with a genome size of 0.0050m for 18-28S amplicons and 0.0065m for 28-18S amplicons; Koren et al. (2017)]. Trimmed and filtered Illumina paired reads were concatenated using a python script (https://github.com/isovic/racon/blob/master/scripts/racon_preprocess.py) and mapped to the consensus nanopore contig using minimap2 v2.17-r941 [using -x sr; Li (2018)]. Using the mapped reads, the nanopore-generated contig was polished once using racon v1.4.13 [with default parameters; Vaser et al. (2017)].
Paired reads from each sample were mapped to their respective consensus sequence using BWA-MEM v0.7.17 (Li and Durbin, 2009) and SAMtools v1.9 (Li et al., 2009) with default parameters. The output from BWA-MEM was visualised with Integrative Genomics Viewer (IGV) v2.5.2 (Robinson et al., 2011). Coverage and assembly quality and accuracy was assessed using QualiMap v2.2.2 (García-Alcalde et al., 2012).
For analysis of the structure of the IGS, Bonamia transcriptome reads [accession number PRJNA731671; Chevignon et al. (2022)] were mapped as above to the full Bonamia rRNA generated in this study. Coverage at each nucleotide position was determined using SAMtools v1.9 (Li et al., 2009) and graphed using R Studio v1.4.1717. Direct tandem repeat regions of the IGS were determined using RepEx (Gurusaran et al., 2013), using a minimum repeat unit size of 11 nucleotides.
2.7 Multiple sequence alignment and analysis
The two overlapping consensus sequences from each sample were aligned using MAFFT v7.0 [L-INS-i algorithm; Katoh and Standley (2013)] and the resulting alignments were viewed in AliView v1.26 (Larsson, 2014). Full rRNA arrays were generated by manual concatenation of the two aligned overlapping contigs and were orientated so that the start of the 18S was at the 3’ end of the alignment. The resulting alignment is provided in the Supplementary Materials (alignment 2). All further multiple sequence alignments (MSAs) were carried out using MAFFT v7.0 E-INS-i algorithm (Katoh and Standley, 2013).
To determine conserved and variable regions of the rRNA array global alignment scores were calculated for 1 kb sliding windows covering the entirety of Marteilia and Paramarteilia transcribed rRNA MSAs (Supplementary Alignment 3). A 1 kb window was chosen to enable the identification of potential sites that could be used as diagnostic markers using traditional PCR and Sanger sequencing. Sliding windows were generated using sliding_windows (using a window size of 1000, a slide size of 1, and removing the deletion of gaps (-) produced by alignment; https://github.com/kdillmcfarland/sliding_windows). Global alignment scores were calculated using MstatX (using -g and a threshold of 1; https://github.com/gcollet/MstatX).
2.8 Phylogenetic analysis
A Bayesian consensus tree was constructed from full rRNA array alignments using MrBayes v3.2.7 (Ronquist et al., 2012) on the CIPRES Science Gateway (Miller et al., 2010). The tree was constructed using two separate MC3 runs, carried out for two million generations using one cold and three hot chains. The first 500,000 generations were discarded as burn-in, and trees were sampled every 1000 generations. Bayesian consensus trees for the defined gene and spacer regions [18S, ITS1, 5.8S, ITS2, 28S and external transcribed spacer (ETS)], and the most variable regions of the rRNA array identified by sliding window global alignment, were generated from alignments in the same manner as above. Alignments for all regions of the rRNA are provided in Supplementary Alignments 4–9, and for the most variable regions of the rRNA array (Supplementary Alignments 10, 11).
3 Results
3.1 Sequencing and assembly
The full parasite-derived rRNA arrays are deposited on GenBank with the accession numbers denoted in Table 2. All arrays are orientated to begin at the start of the 18S.
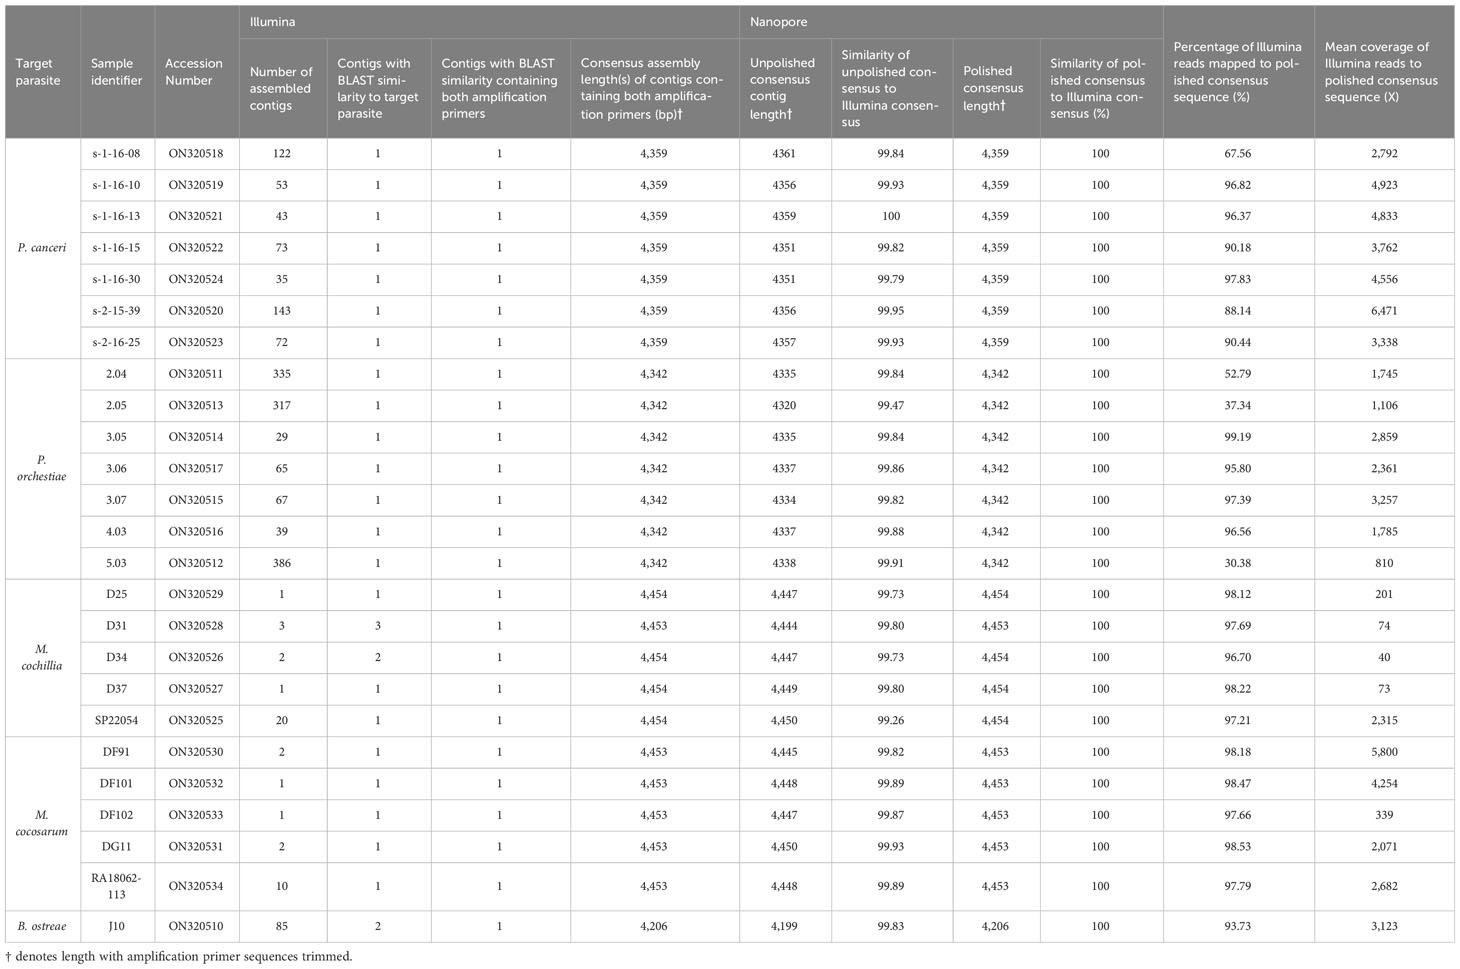
Table 2 Assembly statistics for ITS1-5.8-ITS2-28S Marteilia amplicons and 18S-ITS1-5.8-ITS2-28S Paramarteilia amplicons.
3.1.1 Illumina
In all cases, SPAdes assembly of ITS1-18S-IGS-28S Marteilia amplicons and 18S-ITS1-5.8-ITS2-28S Paramarteilia amplicons produced consensus sequences of the expected size: 4,453-4,454 bp for M. cochillia, 4,453 bp for M. cocosarum, 4,340 bp for P. canceri, and 4,342 bp P. orchestiae (Table 2).
For Marteilia amplicons covering 28S-IGS-18S-ITS1, SPAdes typically assembled a shorter consensus sequence containing the 5’ amplification primer (1,464 bp to 1,726 bp for M. cochillia, and 1,714 to 2,814 bp for M. cocosarum), and a longer consensus sequence containing the 3’ amplification primer (3,627 bp to 4,717 bp for M. cochillia, and 3,568 bp to 4,690 bp for M. cocosarum). For two M. cocosarum samples, SPAdes assembled the reads as a single 6,264 bp consensus sequence (Table 2).
For Paramarteilia amplicons covering 18S-ITS1-5.8-ITS2-28S, SPAdes also typically assembled a shorter consensus sequence containing the 5’ amplification primer (1,069 bp to 2,293 bp for P. canceri, and 2,294 bp to 2,692 bp for P. orchestiae). For one P. canceri sample (s-2-15-39), SPAdes assembled two short consensus sequences containing the 5’ and 3’ amplification primers, and a longer 5,210 bp consensus sequence with high BLAST similarity to the target parasite rRNA. For one P. canceri and one P. orchestiae sample, SPAdes assembled the reads as single 5,924 bp and 5,179 bp consensus sequences, respectively.
3.1.2 Nanopore
For both Marteilia and Paramarteilia, nanopore consensus contigs covering ITS1-5.8-ITS2-28S and 18S-ITS1-5.8-ITS2-28S, respectively, were very similar in identity to consensus contigs assembled using SPAdes (99.26-100% identity) but had errors in homopolymer regions. Polishing the Nanopore consensus contigs with Illumina reads resulted in a consensus sequence that had 100% identity to that of the consensus sequence generated with only Illumina reads (Table 2).
Polishing Marteilia Nanopore consensus reads covering 28S-IGS-18S-ITS1 with Illumina reads revealed a repeat region c. 220 bp into the IGS, between the two contigs that were assembled from Illumina reads. Analysing the tandem repeat content using RepEx revealed a ~1,024 bp region at the 5’ end of the Marteilia IGS with high repeat content, represented in Figure 2 by hatched lines. The largest tandem repeat unit in M. cocosarum was a 114 bp unit at the 5’ end of the IGS present at ungapped positions 7,345-7,458, 7,460-7,573, 7,575-7,688 of the DF91 rRNA array. In M. cochillia, the largest repeat unit was 53 bp, present at positions 7,302-7,355 and 7,393-7,446 of the SP22054 ungapped rRNA array. To determine whether the length of the repeat region varied within an infection, all Nanopore reads from individual samples were aligned and trimmed manually to only contain the IGS region of the array. Tandem repeats caused a variation in the length of the IGS from approximately 2,218 to 3,726 bp for M. cochillia and 2,020 to 3,816 bp for M. cocosarum. Variation in length for each sample is detailed in Table 3.
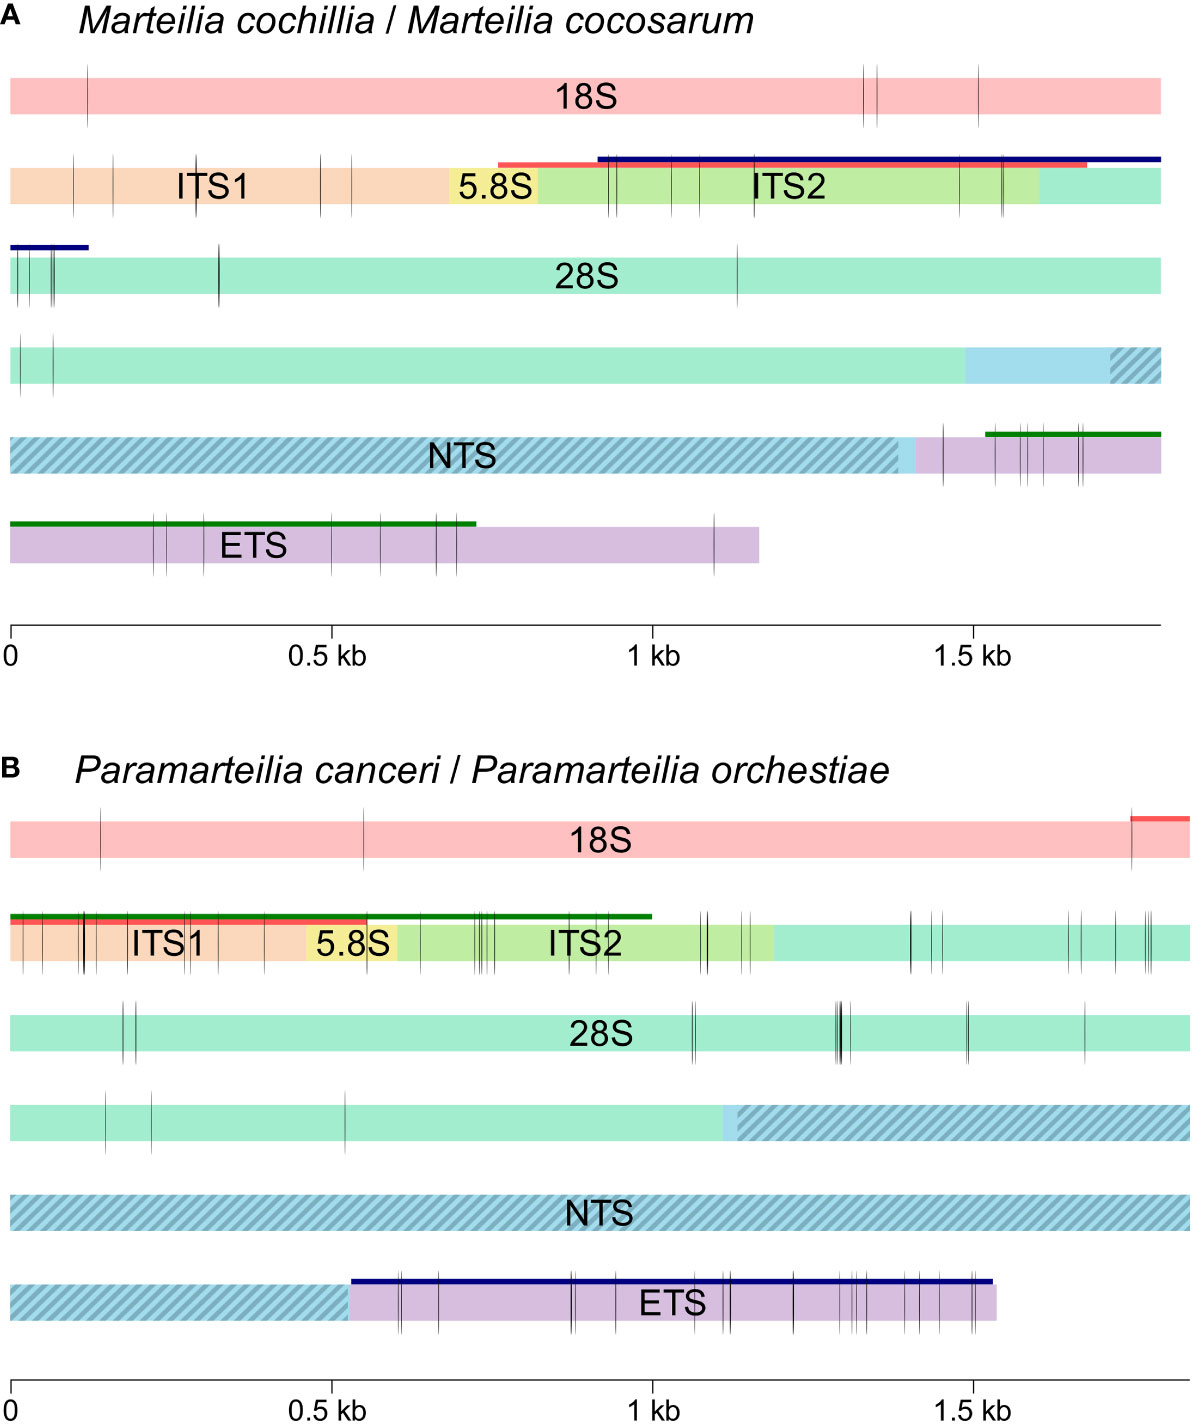
Figure 2 Schematic illustration (to scale) of the full rRNA arrays for (A) Marteilia cochillia and M. cocosarum, and (B) Paramarteilia canceri and P. orchestiae. Vertical black lines indicate consistent differences between all samples for each species. The current region amplified by primers to detect and discriminate between species is indicated by a red line. The most variable 1 kb region between species is indicated by a dark green line, and the second most variable 1 kb region is indicated by a dark blue line. Tandem repeat regions in the NTS are indicated by blue diagonal stripes.
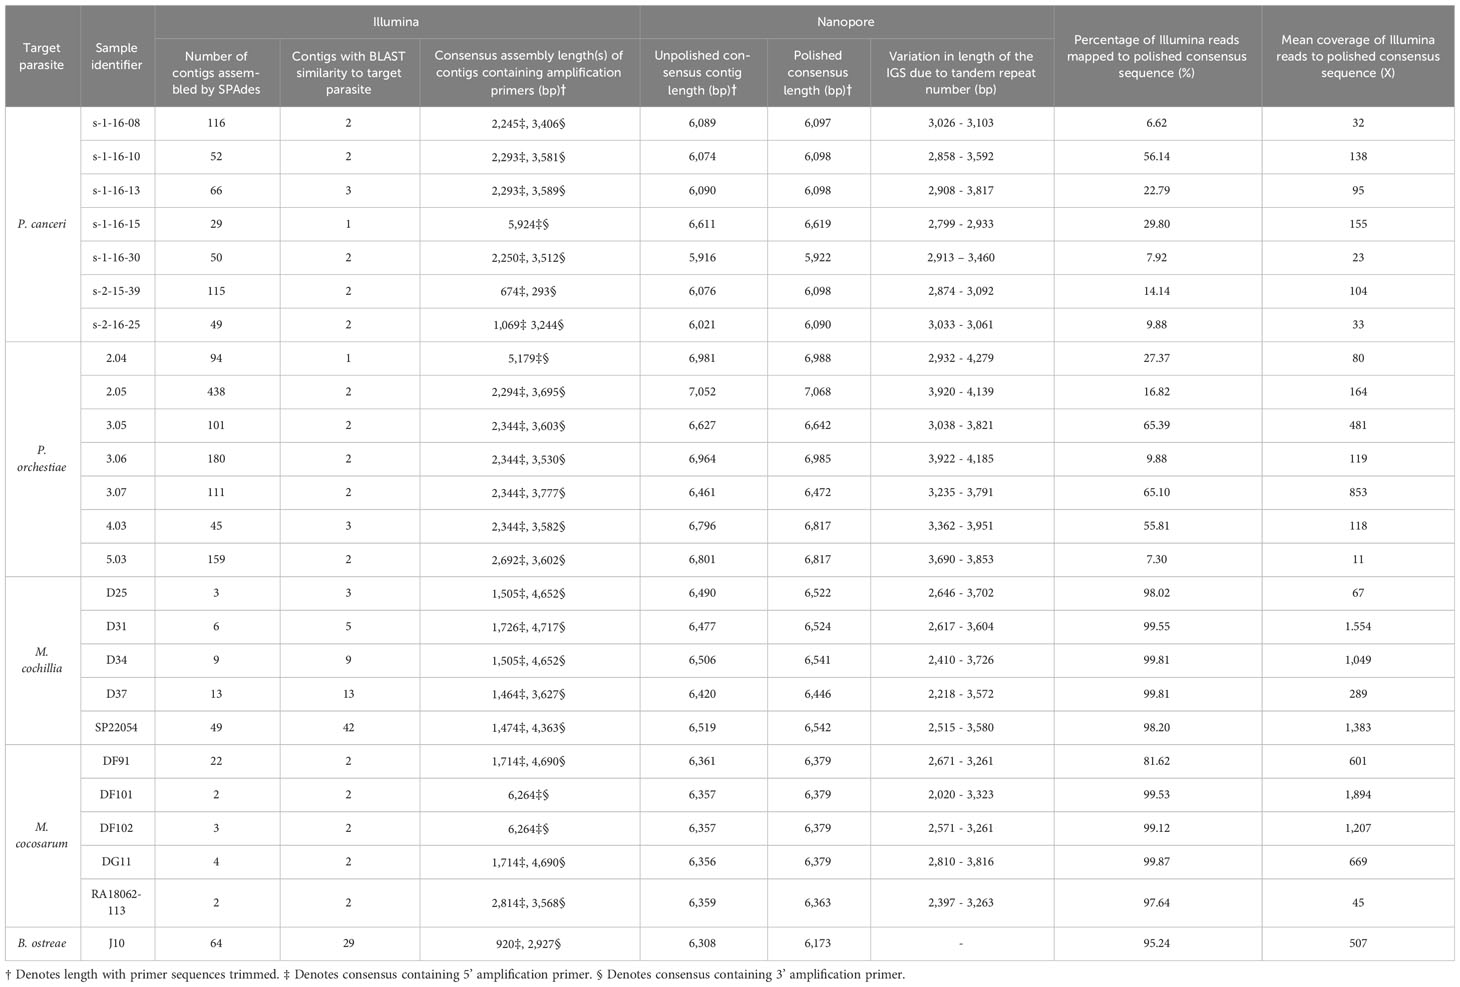
Table 3 Assembly statistics for 28S-IGS-18S-ITS1 Marteilia amplicons and 28S-IGS-18S-ITS1-5.8S Paramarteilia amplicons.
Polishing Paramarteilia nanopore consensus reads covering 28S-IGS-18S-ITS1-5.8S with Illumina reads also revealed a repeat region starting approximately 60 bp into the IGS. Analysing the repeat content of the IGS revealed the largest repeat unit to be a 122 bp unit (e.g. positions 8,150-8,271, 8,324-8,445, 8,497-8,618, 8,671-8,792, 8,845-8,966 and 9,019-9,140 of the s-1-16-30 rRNA array). Tandem repeats caused a variation in the length of the IGS from approximately 2,799 to 3,817 bp for P. canceri and 2,932 to 4,279 bp for P. orchestiae.
3.2 Assessment of amplification specificity
To assess the specificity of the amplification primers, trimmed and filtered Illumina reads were mapped to the polished consensus sequences. For all Marteilia amplicons, the number of mapped reads was high (>80%), with an average of 97.86% and 97.32% for ITS1-5.8-ITS2-28S amplicons and 28S-IGS-18S-ITS1 amplicons, respectively (Tables 2, 3). For Paramarteilia amplicons, mapping was high for the majority amplicons covering 18S-ITS1-5.8-ITS2-28S, with an average of 81.20% (Table 2), however, two samples had mapping <40% (Table 2), with many contigs assembled by SPAdes having similarity to bacterial species by BLAST. For Paramarteilia amplicons covering 18S-ITS1-5.8-ITS2-28S, mapping was lower, with an average of 28.21%. The majority of BLAST hits from contigs assembled by SPAdes had high similarity to crustacean species.
3.3 Analysis of intergenic spacer structure
To determine the location of the non-transcribed spacer (NTS) and external transcribed spacer (ETS) regions of the B. ostreae rRNA array, transcriptome reads from purified B. ostreae parasites [Accession number PRJNA731671; Chevignon et al. (2022)] were aligned against the full B. ostreae rRNA array generated in this study and the coverage across the array was determined (Figure 3). A 2,856 bp region, starting at the end of the 28S had no coverage with transcriptome reads, suggesting that this is the NTS region of the IGS. Transcription appears to resume 866 bp prior to the start of the 18S, suggesting that this region is the ETS.
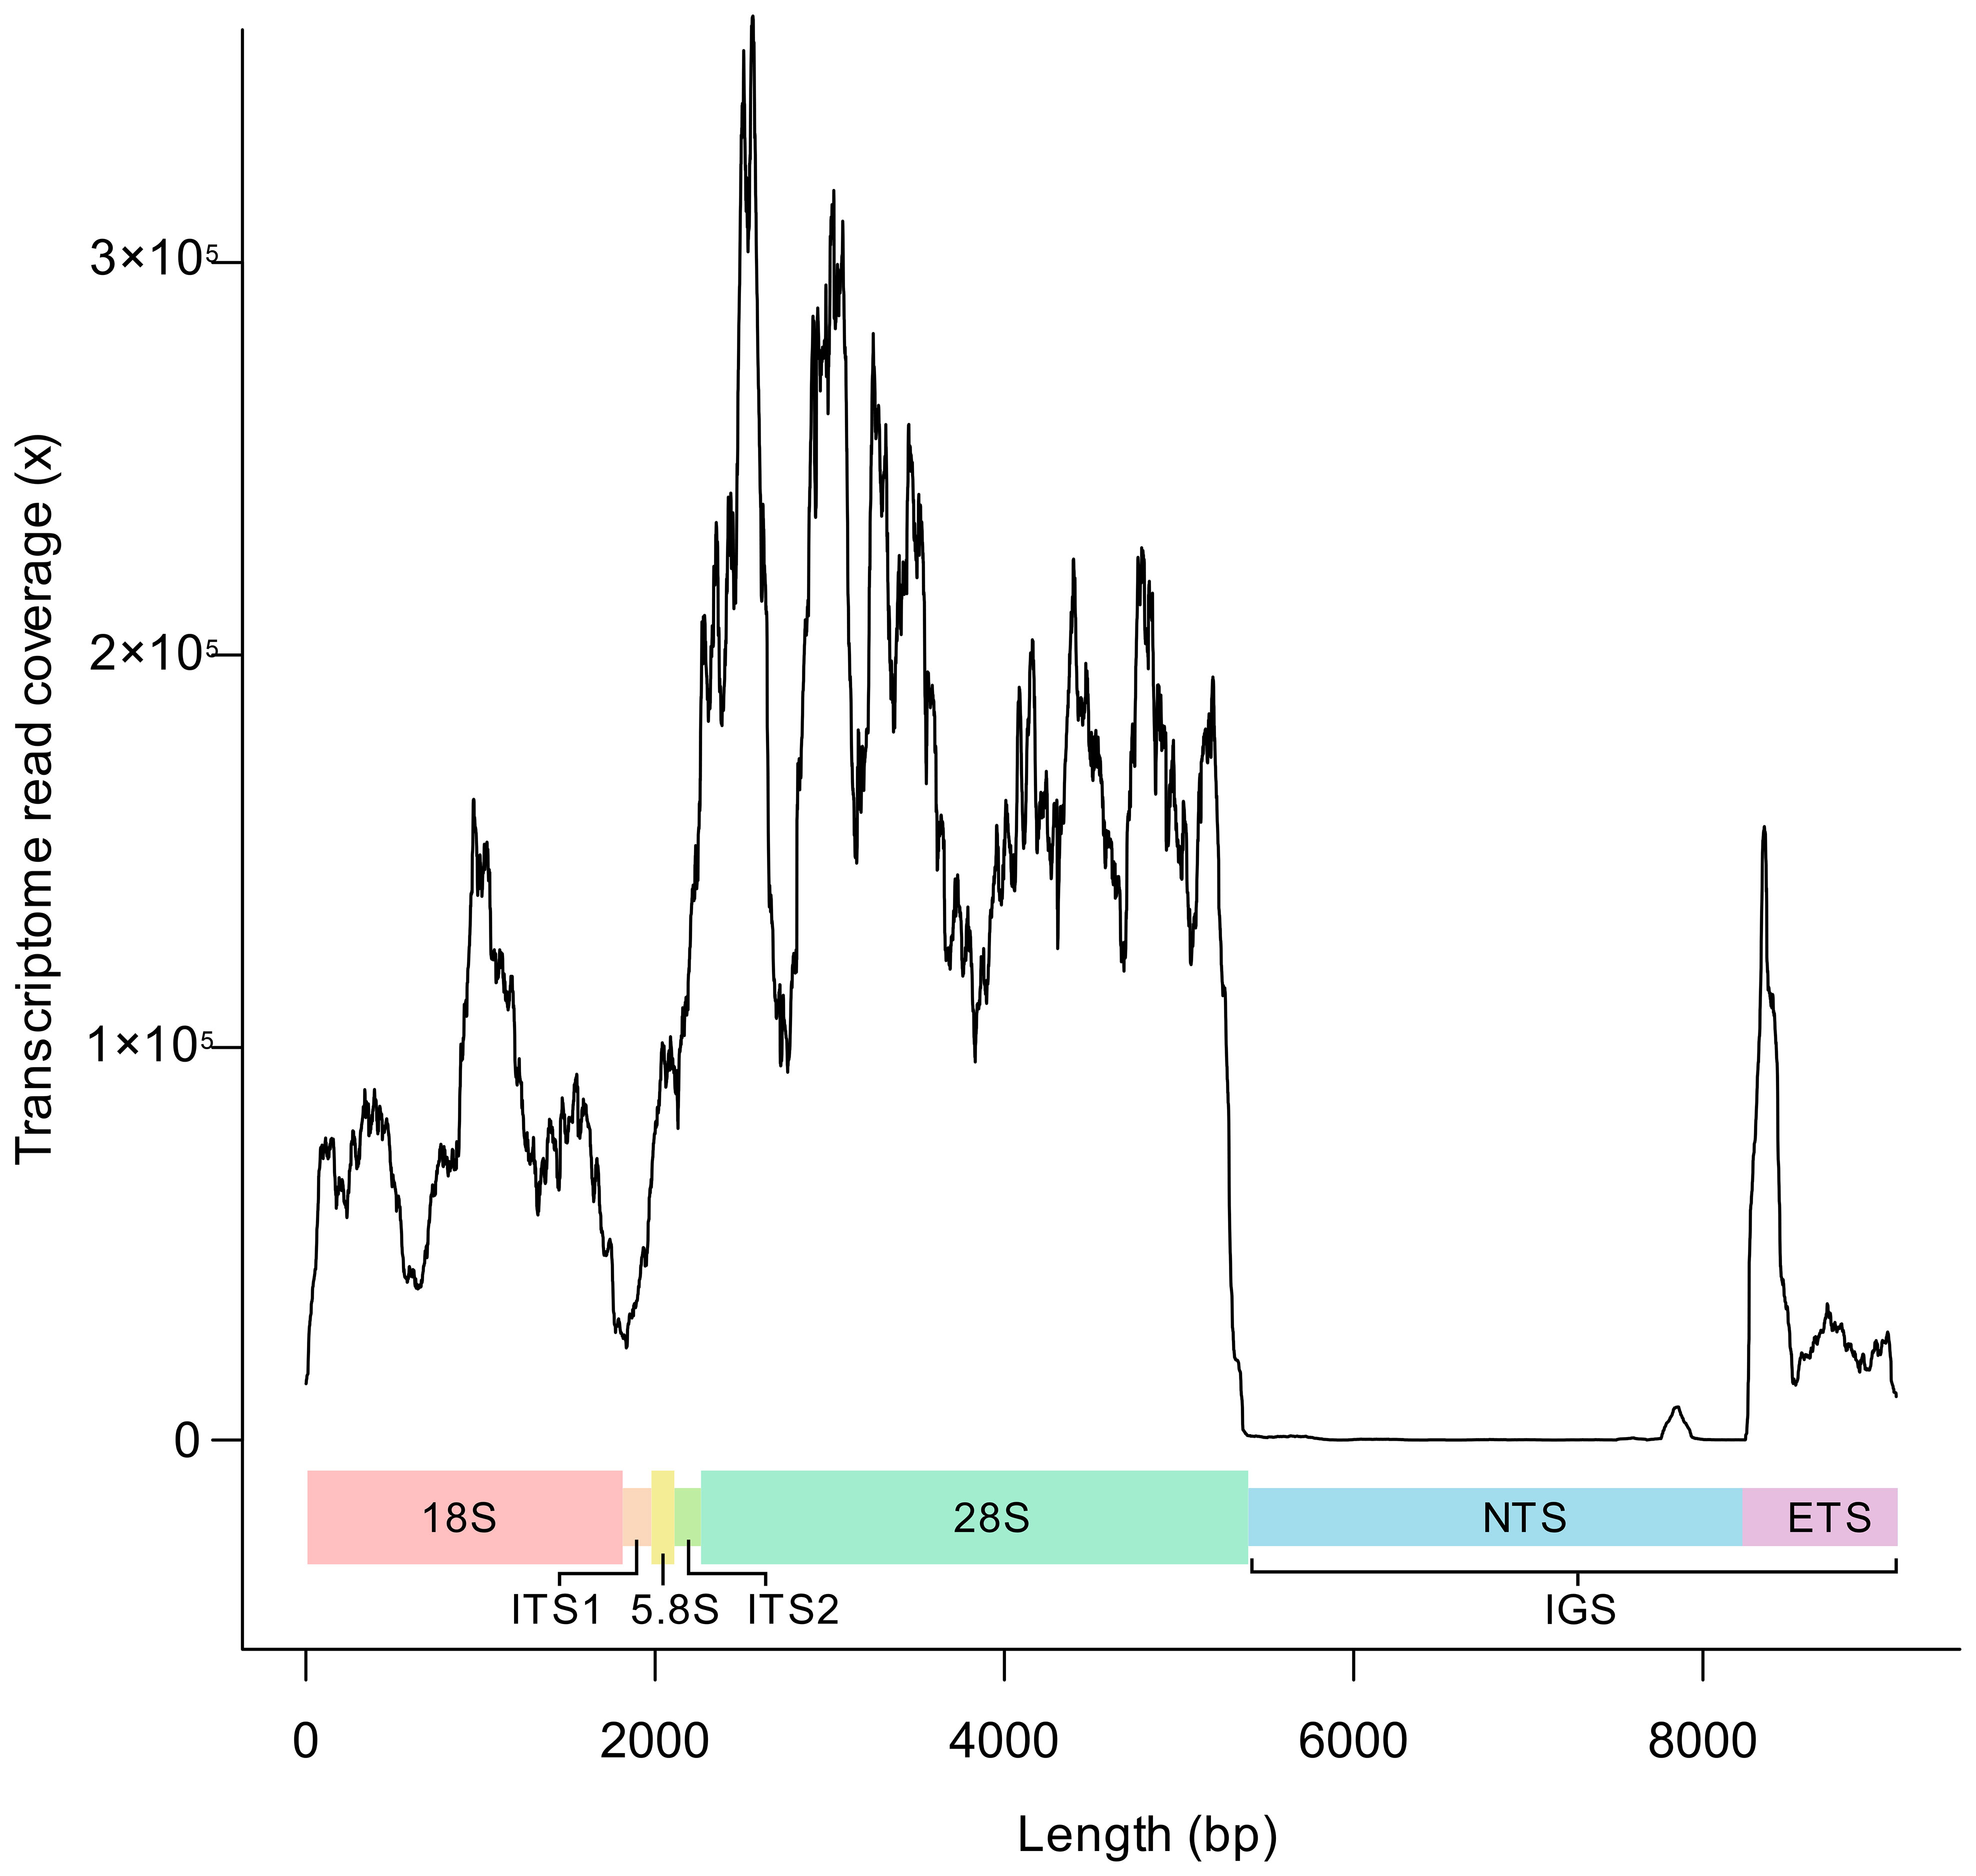
Figure 3 Read coverage of Bonamia ostreae transcriptome reads [Accession number PRJNA731671; Chevignon et al. (2022)] across the full rRNA array. 18S, Small subunit rRNA gene; ITS1, Internal Transcribed Spacer 1; 5.8S, 5.8S subunit rRNA gene; ITS2, Internal Transcribed Spacer 2; 28S, Large subunit rRNA gene; NTS, Non-transcribed spacer; ETS, External Transcribed Spacer; IGS, Intergenic Spacer.
Alignment of the ETS of B. ostreae to Marteilia and Paramarteilia alignments suggested that the ETS of M. cochillia, M. cocosarum, P. canceri and P. orchestiae begins 1,191, 1,191, 1,008 and 1,009 bp prior to the start of the 18S, respectively. The proposed NTS region of the IGS contained tandem repeats, whereas the proposed ETS region did not.
3.4 Multiple sequence alignment
Full rRNA arrays for seven independent samples of each P. canceri and P. orchestiae (10,602 bp), and five independent samples of each M. cochillia and M. cocosarum (10,132 bp) were aligned to determine the number of consistently different nucleotide positions between the two species from each genus (Table 4). Both species of Paramarteilia and Marteilia showed high sequence similarity in the 18S, 5.8S and 28S. However, both Paramarteilia and Marteilia species had multiple nucleotide differences that distinguished between species at the 5’ end of the 28S (illustrated in Figure 2). Spacer regions (ITS1, ITS2 and ETS) had greater sequence variation between species. Percentage similarity between P. canceri and P. orchestiae ITS1, ITS2 and ETS was 97.40%, 97.61% and 97.81%, respectively; and percentage similarity between M. cochillia and M. cocosarum ITS1, ITS2 and ETS was 99.12%, 98.85% and 99.03%, respectively (Table 4).
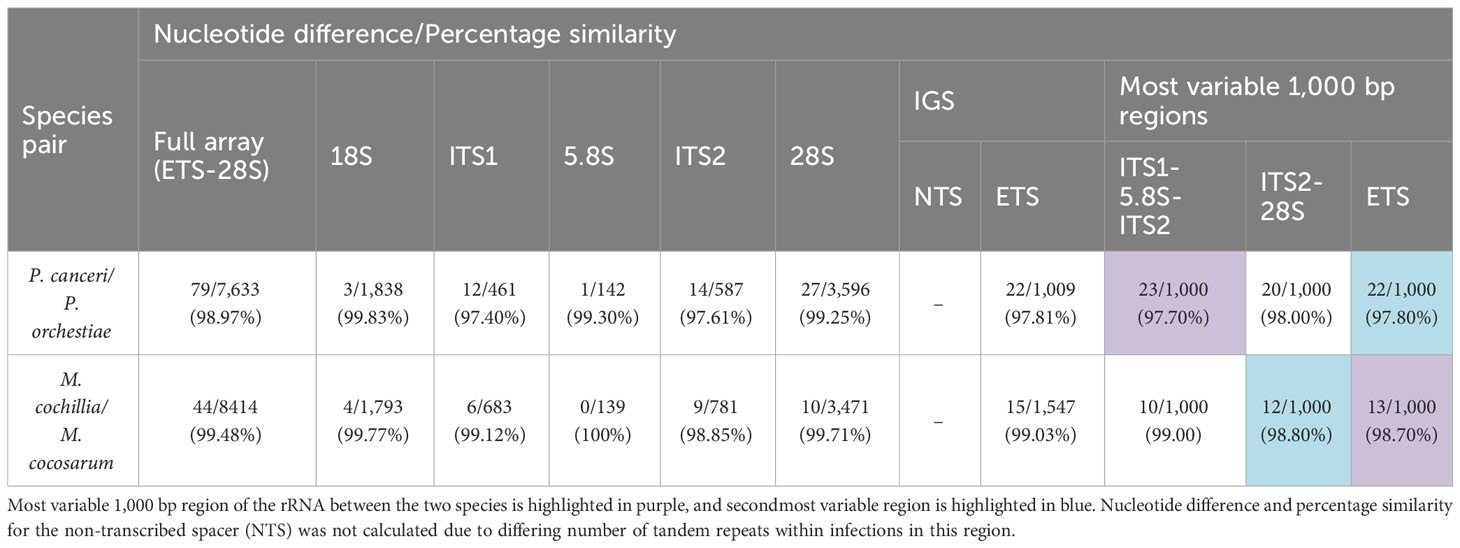
Table 4 Table outlining the nucleotide difference and percentage similarity per region of the rRNA array between Paramarteilia canceri and P. orchestiae, and Marteilia cochillia and M. cocosarum.
To identify potential sites that could be used as diagnostic markers using traditional PCR and Sanger sequencing, a 1 kb sliding window global alignment analysis was carried out. This confirmed that the NTS region of the IGS was the most variable region for both Paramarteilia and Marteilia, but due to varying numbers of tandem repeats within this region it was excluded from comparative analyses as it would not be a suitable region for diagnostic markers. Within the ETS-18S-ITS1-5.8S-ITS2-28S region of the rRNA arrays, global alignment scores showed that a 1 kb region covering the 5’ end of the ETS were the most variable region of the rRNA array between the two Marteilia species (13 consistent nucleotide differences; 98.7% similarity), followed by ITS2 and 5’ end of 28S (12 consistent nucleotide differences; 98.8% similarity). For the two Paramarteilia species ITS1-5.8S-ITS2 was the most variable region of the rRNA array (23 consistent nucleotide differences; 97.7% similarity), followed by the ETS (22 nucleotide differences; 97.8% similarity). The regions with the most consistent nucleotide differences in a 1 kb region are represented by dark green and dark blue horizonal lines in Figure 2.
3.5 Phylogenetic analysis
A Bayesian consensus tree based on the transcribed region (ETS-18S-ITS1-5.8S-ITS2-28S) of rRNA arrays of P. canceri, P. orchestiae, M. cochillia, M. cocosarum and B. ostreae sequenced in this study formed separate, mutually exclusive, maximally supported (posterior probably = 1), monophyletic clades for all species (Figure 4). P. canceri formed a sister clade to P. orchestiae, and M. cochillia formed a sister clade to M. cocosarum.
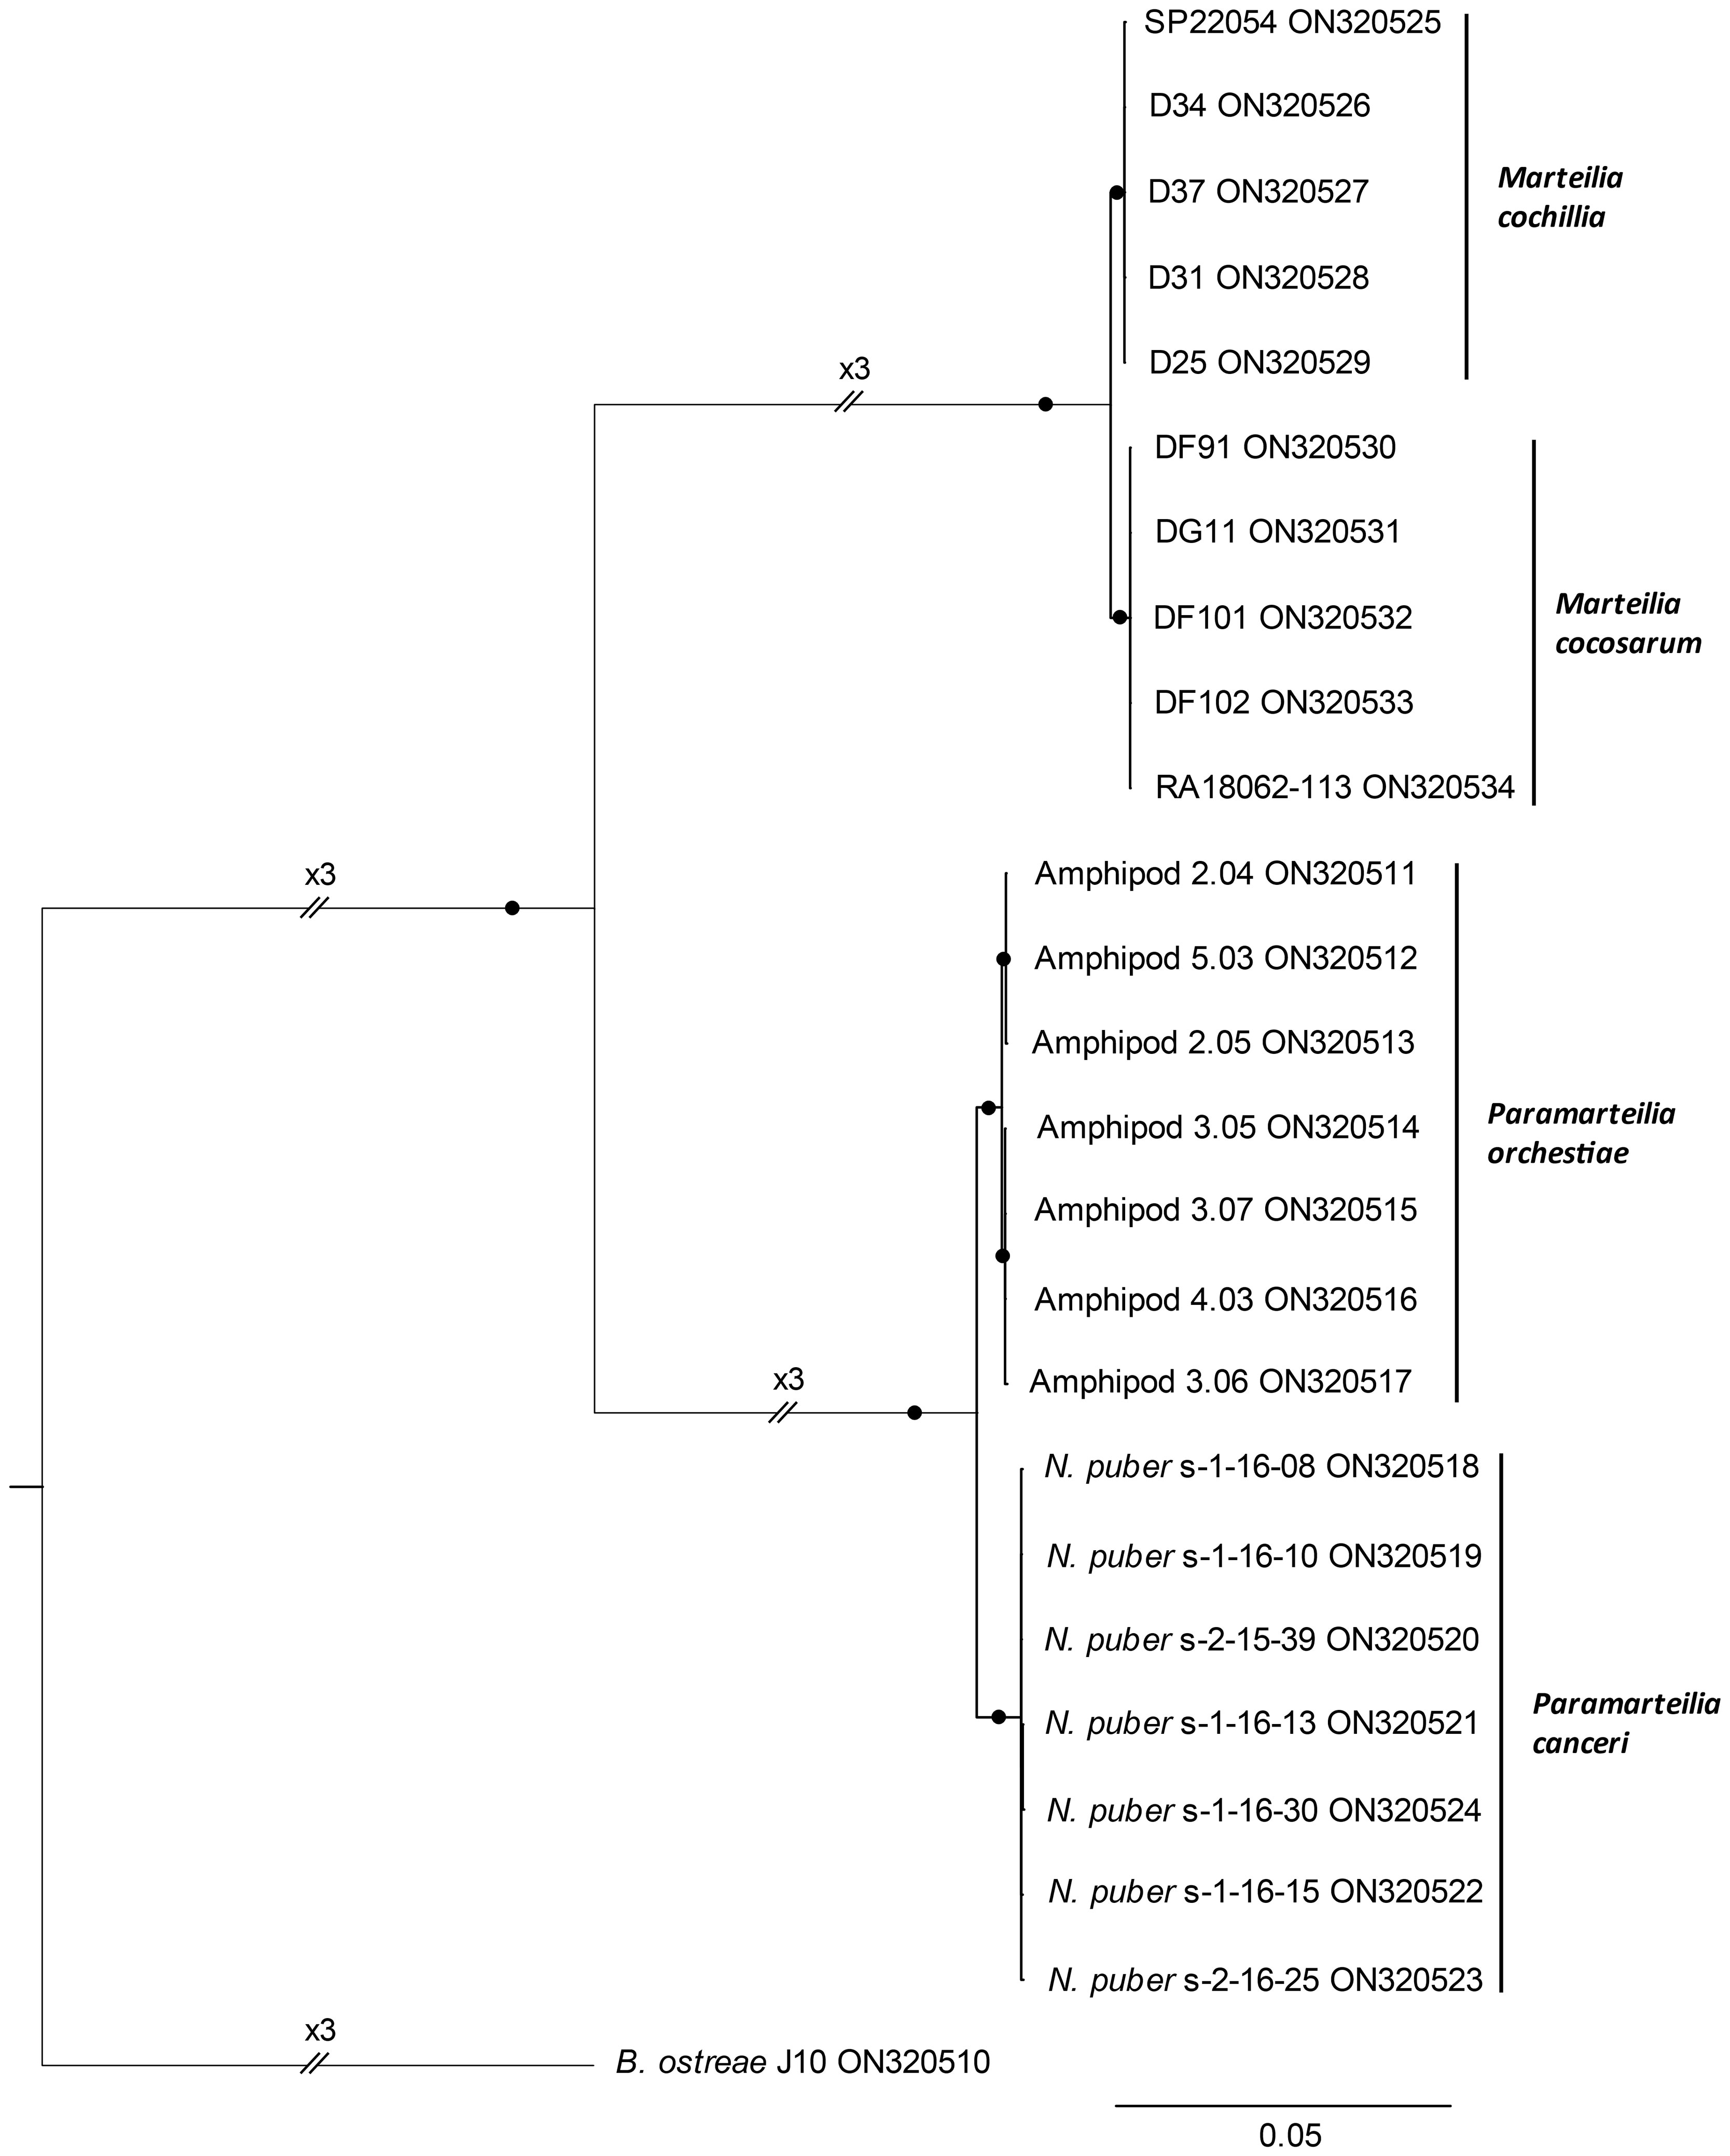
Figure 4 Bayesian consensus tree based on transcribed regions (ETS-18S-ITS1-5.8S-ITS2-28S) of rRNA arrays (8,868 nucleotide positions) of Paramarteilia orchestiae, P. canceri, Marteilia cochillia and M. cocosarum. Posterior probabilities ≥0.99 are represented by black circles on branches. The tree is rooted to the transcribed regions of the Bonamia ostreae rRNA array.
Bayesian consensus trees based on the individual gene and spacer regions of the rRNA array (Figure 5) only produced mutually exclusive, monophyletic clades for both Paramarteilia and Marteilia species when the ETS region was analysed (Figure 5F). Bayesian analysis of full 18S produced mutually exclusive, monophyletic clades for P. canceri and P. orchestiae (Figure 5A), despite this region of the rRNA having high similarity between the two species (3 consistent nucleotide differences over 1,838 bp; Table 4). Bayesian analysis of this region for the two Marteilia species produced a topology where M. cochillia was paraphyletic with respect to M. cocosarum. The two Paramarteilia species also formed mutually exclusive, monophyletic clades with maximal support for the 28S region of the rRNA array, but for Marteilia, M. cocosarum was paraphyletic with respect to M. cochillia (Figure 5E). For the remaining regions (ITS1, 5.8S and ITS2; Figures 5B-D), the two genera (Marteilia and Paramarteilia) formed monophyletic clades with maximal support, but within these clades the species were paraphyletic. The number of nucleotide positions and the number of consistently different positions for each region is outlined in Table 4.
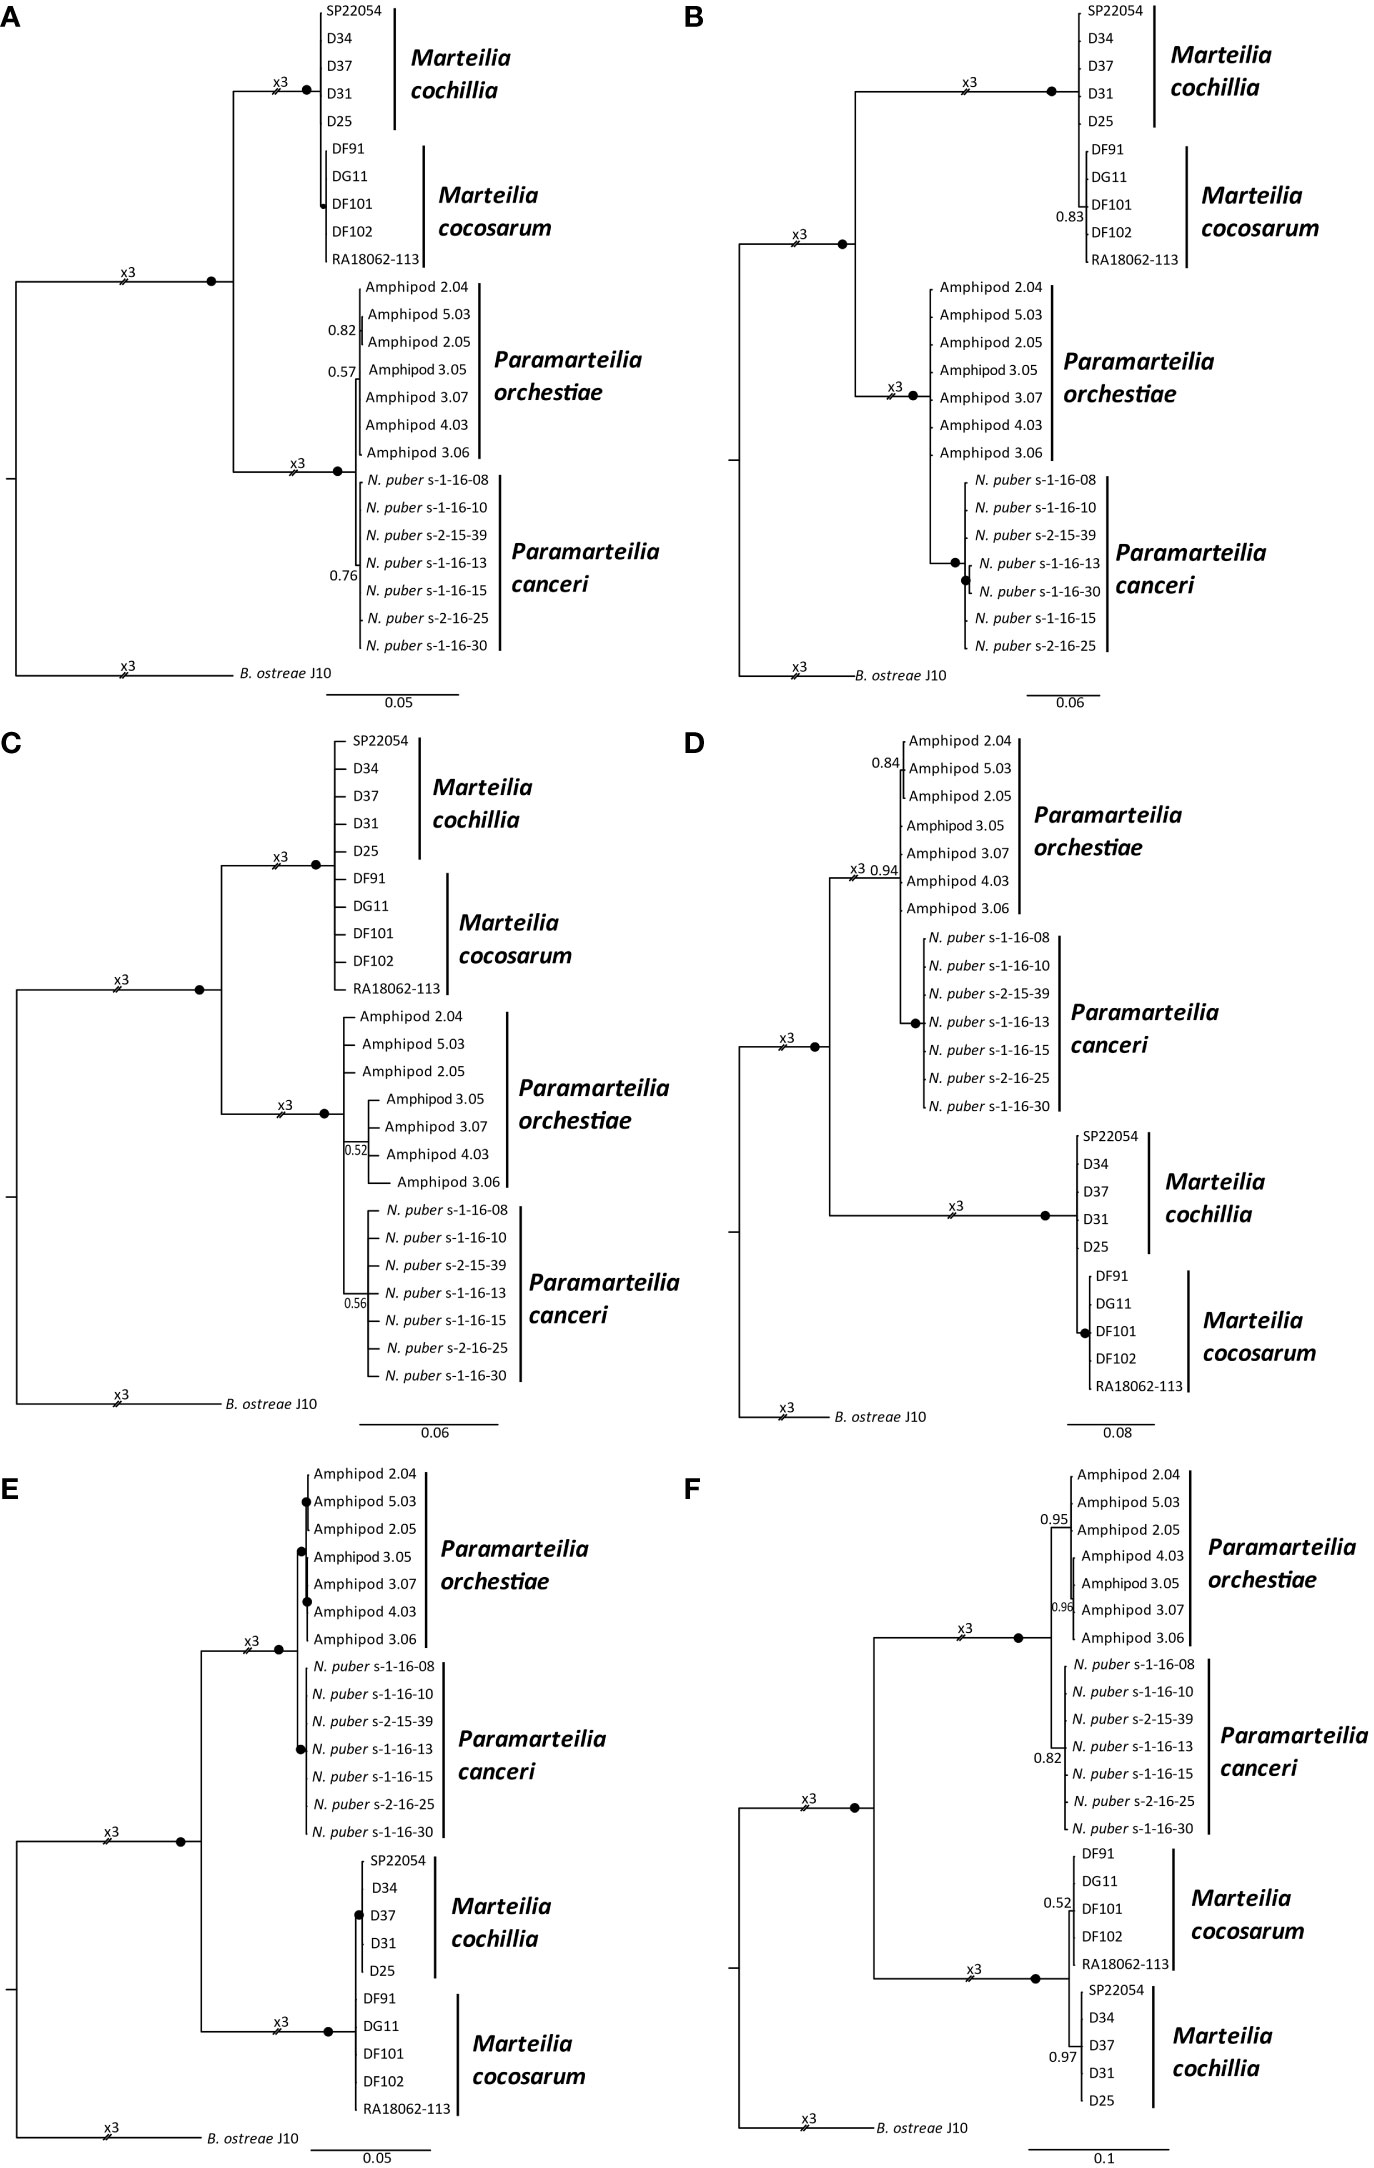
Figure 5 Bayesian consensus trees based on the discrete genes and spacer regions of the rRNA array of Paramarteilia orchestiae, P. canceri, Marteilia cochillia and M. cocosarum. Branch labels denote posterior probabilities to two significant figures, with posterior probabilities ≥0.97 represented by black circles. All trees were rooted to the relevant rRNA array regions of Bonamia ostreae. (A) 18S (1,893 nucleotide positions) (B) Internal transcribed spacer 1 (698 nucleotide positions) (C) 5.8S (142 nucleotide positions) (D) Internal transcribed spacer 2 (832 nucleotide positions) (E) 28S (3,729 nucleotide positions) (F) External transcribed spacer (1,587 nucleotide positions).
Bayesian consensus trees were constructed from alignments of the most variable regions within the transcribed region of the rRNA array, identified by 1 kb sliding window global alignment. A tree constructed based on the ETS (Figure 5F), the region of the rRNA array with the most consistent nucleotide differences between the two Marteilia species, and the second most differences between the two Paramarteilia species, produced mutually exclusive, monophyletic clades for all species. A tree constructed from ITS1-5.8S-ITS2 (Figure 6A), the region of the rRNA array with the most constituent nucleotide differences between the two Paramarteilia species produced mutually exclusive, monophyletic clades for both Paramarteilia species, but M. cochillia was paraphyletic with respect to M. cocosarum. Constructing a tree based on ITS2 and partial 28S (Figure 6B), the second most variable region of the rRNA array between the two Marteilia species, produced mutually exclusive, monophyletic clades for both Marteilia and both Paramarteilia species.
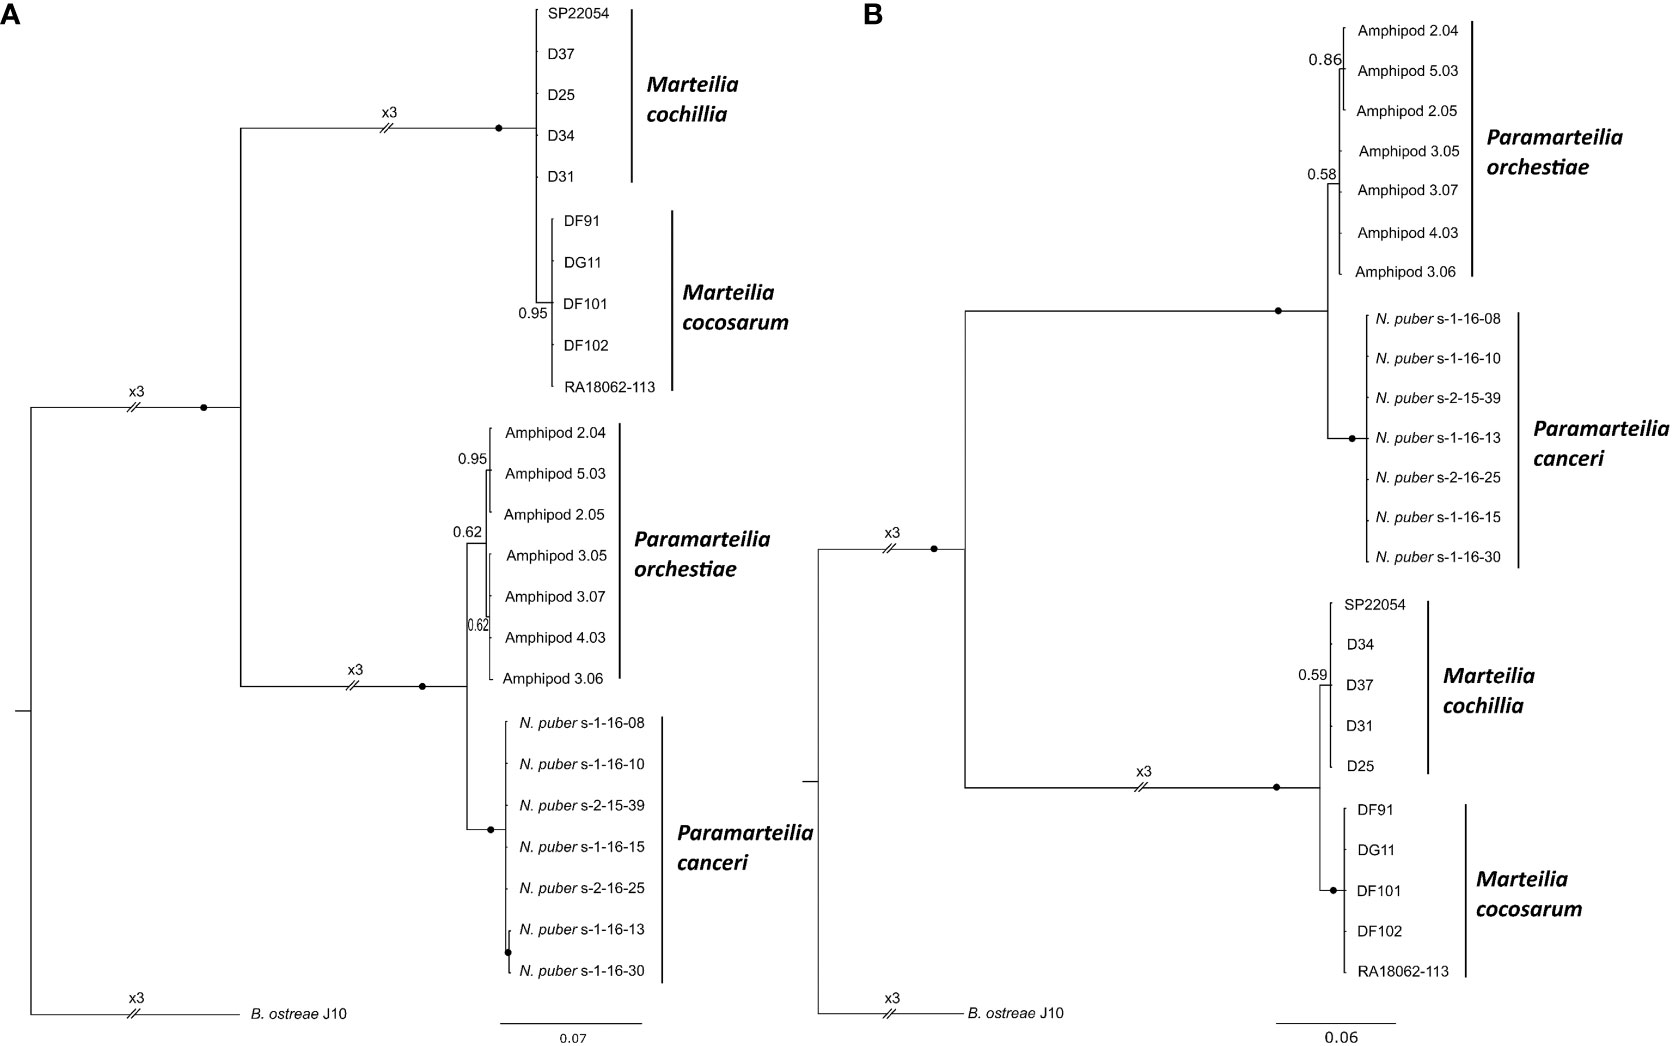
Figure 6 Bayesian consensus trees based on the most variable 1 kb regions of the rRNA array between Paramarteilia orchestiae and P. canceri, and the second most variable 1 kb region between Marteilia cochillia and M. cocosarum. Branch labels denote posterior probabilities to two significant figures, with posterior probabilities ≥0.97 represented by black circles. All trees are rooted to Bonamia ostreae. (A) ITS1-5.8S-ITS2 (relative to 1,839-2,838 bp of sample Amphipod 2.04 [accession number ON320511)] (B) ITS2 and partial 28S (relative to 2,656-3,655 bp of sample SP22054 [accession number ON320525)].
4 Discussion
In this study we produce full rRNA arrays from seven independent samples each of P. canceri and P. orchestiae, five of each M. cochillia and M. cocosarum, and one B. ostreae. We describe how full arrays can be generated by combined Illumina and Nanopore sequencing of two overlapping amplicons (c. 4.5 kb and 6.5 kb) produced by long-range PCR. A Bayesian phylogeny generated from an alignment of the transcribed regions of the rRNA array produced mutually exclusive monophyletic clades for each species of Paramarteilia and Marteilia, with maximal support for all branches. Analysis of multiple sequence alignments of the full arrays was able to identify regions of rRNA that could be used to better discriminate between the two species in each genus. These regions could be amplified in addition to – or instead of – the previously recognised discriminatory regions, which target regions with fewer discriminating nucleotide positions, to robustly differentiate between the closely related, but genetically and phenotypically distinct, species.
Current primers used to generate an amplicon to discriminate between Paramarteilia species are located in the 18S and the 5.8S, amplifying a 649 bp region covering partial 18S, ITS1 and partial 5.8S – a region with 12 consistent nucleotide differences between P. canceri and P. orchestiae. A phylogenetic tree generated from this region produced mutually exclusive monophyletic clades, with high support for the P. canceri clade but lower support for the P. orchestiae clade (Collins et al., 2022). In this study, we show that a 1 kb region covering ITS1-5.8S-ITS2 is the most variable region of the transcribed region of the rRNA array (23 consistent nucleotide differences), with phylogenetic analysis of this region able to recover the two species. Here, we also generate data for the ETS region of the rRNA, for which no data for Paramarteilia previously existed. The ETS region was the second most variable 1 kb region between the two Paramarteilia species, with 22 consistent nucleotide differences, and could also be used as a suitable region for diagnostic PCR amplification, either on its own, or in combination with ITS1-5.8S-ITS2.
Similarly, primers located in 5.8S and 28S amplify 1,256 bp of ITS2 and partial 28S are currently used to distinguish between M. cochillia and M. cocosarum (Skujina et al., 2022), who showed that ITS2 contained the most consistent nucleotide differences between the two species within the 18S-ITS2 region of the rRNA array. A phylogenetic tree generated from this region produced mutually exclusive monophyletic clades with full support for each species. However, Skujina et al. (2022) acknowledge that as a diagnostic marker, this region is flawed due to a indel within ITS2 of M. cocosarum, resulting in the need to clone amplicons to determine species. Here, we are able to assess the full rRNA array to determine which regions are the most suitable for the placement of primers to be able to robustly discriminate between the two species. We demonstrate that the 5’ end of ETS is the region of the rRNA with the most consistent nucleotide differences between M. cochillia and M. cocosarum (13 consistent nucleotide differences), with phylogenetic analysis of this region able to recover the two species. From the limited dataset analysed in this study, the ETS does not contain any indels within species, so may be a more suitable location of the rRNA array to amplify for diagnostics of these two species.
In other parasite groups, regions of the rRNA outside of 18S and ITS1 have been shown to be useful diagnostic markers to discriminate between closely related species. Regions of the ITS1-5.8-ITS2, combined with the variable region at the 5’ end of the 28S, have been shown to be useful as a marker for species discrimination in astome ciliates (Obert and Vďačný, 2020). Combined phylogenetic analysis of ITS1-5.8S-ITS2 regions of rRNA and the variable region of the 28S, ITS1-5.8S-ITS2 and a region of the IGS, and ITS1-5.8S-ITS2 and the actin gene have been used for discrimination between Perkinsus species (Villalba et al., 2004; Moss et al., 2008; Kang et al., 2016). Concatenated gene analysis (ITS regions and large subunit gene, as well as traditional methods of sequencing small subunit) has also been utilised to discriminate between closely related Microsporidia species (Bojko et al., 2022). As evident in these examples, a single marker may not be suitable for delimitating species, particularly in taxa where there appears to be a lot of variability in rates of rRNA evolution. We suggest that an approach to sequence the full rRNA could potentially quickly identify regions of rRNA that are suitable discriminating markers for groups of organisms.
Analysis of the full rRNA arrays in this study found that the ITS2 was one of the most variable regions in array. The ITS2 region of rRNA has been found to be a more reliable proxy for discriminating between cryptic, closely related Amoebophrya, a genus of parasitic syndinian (dinoflagellate) protists, than phenotypic characteristics (Cai et al., 2020). More generally, the ITS2 region has been recognised as a widely suitable region for (biological) species discrimination, in particular focusing on certain compensatory base changes in stems of the RNA secondary structure (Coleman, 2007; Cai et al., 2020; Obert and Vďačný, 2020). The method described in this study would allow rapid generation of full rRNA arrays, including the ITS2. This sequence data would allow the application of analysis of secondary structure, both in ITS2 and other regions of the rRNA array known to have functional secondary structure (i.e. ITS1 and ETS), to determine how these relate to discrimination of closely related species.
This study produces the first sequence data for the non-transcribed spacer (NTS) of the IGS in ascetosporean parasites. Previous metagenomic studies of hosts infected with ascetosporean parasites have been able to assemble regions of the rRNA outside of the NTS (e.g. Kerr et al. (2018)), but due to its repeating characteristics, would not have been able to assemble the NTS with short-read sequencing alone. In this study, we describe the variability in the number of tandem repeats within an infection in a single host, and therefore suggest that the NTS region of the IGS is not a suitable target for diagnostic primers. On the contrary, the external transcribed spacer (ETS) appears to be a suitable marker for discriminating between P. canceri and P. orchestiae and M. cochillia and M. cocosarum. The ETS region was identified by mapping transcriptomic reads produced in Chevignon et al. (2022) to the full B. ostreae rRNA array produced in this study. Subsequent alignment of the B. ostreae ETS region to Paramarteilia and Marteilia rRNA arrays identified the ETS in these genera. Partial ETS (358 bp) has been used to differentiate between M. refringens and M. pararefringens with some success (López-Flores et al., 2004; Kerr et al., 2018). As more sequence data becomes available, assessment of the ETS to be used as a molecular marker of evolution for a wider range of parasitic protists can be investigated.
As most primers to detect specific ascetosporean parasites are located in the 18S and ITS1, the majority of sequence data publicly available for these species is limited to these regions. It is unknown whether the regions shown to be most variable between closely related species in this study are as informative for other ascetosporean taxa, or protistan parasites more generally, as there are very few published sequences. Due to the limited data available for ascetosporean parasites outside of the regions routinely sequenced, designing specific primers outside of these regions is difficult. The reverse primers designed in this study to amplify the two overlapping long amplicons were based on the small number of sequences representing a broad phylogenetic range of ascetosporean sequences. High levels of primer degeneracy are often required when attempting to amplify an unknown lineage, or range of lineages, particularly in the parasitic protists in this study, where the 28S sequence is largely unknown. However, the more broadly-targeted primers we designed in the study (LSU8799degen, s20cAS, 7939F and 8061F) could be used to amplify at least some paramyxid, haplosporid, paradinid, and mikrocytid lineages (data not shown): highly divergent taxa whose interrelationships are currently unresolved due to the large genetic distances between them.
Identification of the variable regions of rRNA that can distinguish between closely-related species within groups of microeukaryotes (such as the ETS in this study) may enable group-specific metabarcoding studies to be performed at higher resolutions. Currently, metabarcoding approaches typically target the V4 and V9 variable regions of the 18S (Choi and Park, 2020). Within the V4 region, there are no differences within the two sets of closely related species in this study, and within the V9 region there is one nucleotide difference between P. orchestiae and P. canceri, and no differences between M. cochillia and M. cocosarum. Use of more variable regions of groups of microeukaryotes for metabarcoding has been successfully used for oomycetes, with recovery of larger numbers of operational taxonomic units (OTUs) than metabarcoding with other, less variable, regions (Riit et al., 2016). Application of metabarcoding approaches using more informative regions of the rRNA array could potentially allow the diversity of groups of microeukaryotes to be discovered within different hosts and environments, which cannot currently be observed with commonly used metabarcoding markers.
We show that long-range PCR followed by Illumina and Nanopore sequencing is an efficient method for generating full rRNA sequences. We also show that, for the parasites sequenced in this study, Nanopore sequencing is not needed to produce accurate 18-28S data. However, both Illumina and Nanopore sequencing are needed to produce accurate 28-18S data due to tandem repeats in the NTS region of the IGS. If NTS is not required, and if sequence data exist to design primers, Illumina sequencing alone may be able to be used to sequence ETS-28S. With sufficient long-range sequence reference datasets, informative regions of the rRNA for groups of parasites can be identified, primers can be designed to target these regions, and amplicons can be sequenced using cheaper, Sanger sequencing technology. As NGS is expensive in comparison to traditional Sanger sequencing techniques, and obtaining amplicons by long-range PCR relies on well-fixed and well-extracted DNA high molecular weight DNA, for many existing samples, especially those longer-term archived, long-range PCR will not be possible due to the quality of DNA. Thus, long-read PCR on a few reference samples could inform regions to amplify and sequence by Sanger-based techniques from a larger number of samples.
5 Conclusion
Sequencing of long amplicons covering the full rRNA array, as exemplified in this study, can quickly gather a large amount of informative molecular data for high resolution taxonomic discrimination. This technique could potentially be easily applied to other eukaryotic parasites, particularly those for which there are ample 18S and 28S sequence data from which specific primers could be easily designed. Sequence data covering all informative regions of the rRNA array will add valuable information to databases, enabling increased phylogenetic and taxonomic resolution to potentially reveal cryptic species, resolve taxonomic ambiguities, and enable informed decisions on the placement of diagnostic primers to amplify discriminating regions.
Data availability statement
Full ribosomal RNA arrays are deposited to NCBI under accession numbers ON320510-ON320534. Raw sequence reads from Illumina and Nanopore are deposited under PRJNA1013585.
Ethics statement
Ethical approval was not required for the study involving animals in accordance with the local legislation and institutional requirements because the study was carried out on tissue from bivalves and crustaceans so no ethical approval was required. Collection of all samples in this study has been previously published in other manuscripts (referenced in methods section).
Author contributions
CH: Conceptualization, Formal Analysis, Investigation, Methodology, Writing – original draft, Writing – review & editing. GW: Writing – review & editing. RF: Writing – review & editing. IS: Resources, Writing – review & editing. JI: Resources, Writing – review & editing. CB: Methodology, Writing – review & editing. DB: Conceptualization, Supervision, Writing – review & editing.
Funding
The author(s) declare financial support was received for the research, authorship, and/or publication of this article. This work was funded by Defra project FB002.
Acknowledgments
The authors would like to thank Antonio Villalba, Asun Cao, Susi Carballal, David Iglesias for kindly providing Marteilia cochillia infected material, Deborah Cheslett for providing Paramarteilia canceri infected material for this study, and Jennifer Nascimento Schulze for aiding with Bonamia material acquisition.
Conflict of interest
The authors declare that the research was conducted in the absence of any commercial or financial relationships that could be construed as a potential conflict of interest.
Publisher’s note
All claims expressed in this article are solely those of the authors and do not necessarily represent those of their affiliated organizations, or those of the publisher, the editors and the reviewers. Any product that may be evaluated in this article, or claim that may be made by its manufacturer, is not guaranteed or endorsed by the publisher.
Supplementary material
The Supplementary Material for this article can be found online at: https://www.frontiersin.org/articles/10.3389/fevo.2023.1266151/full#supplementary-material
References
Bacela-Spychalska K., Wroblewski P., Mamos T., Grabowski M., Rigaud T., Wattier R., et al. (2018). Europe-wide reassessment of Dictyocoela (Microsporidia) infecting native and invasive amphipods (Crustacea): molecular versus ultrastructural traits. Sci. Rep. 8, 8945. doi: 10.1038/s41598-018-26879-3
Bass D., Ward G. M., Burki F. (2019). Ascetosporea. Curr. Biol. 29, R7–R8. doi: 10.1016/j.cub.2018.11.025
Bensch S., Pérez-Tris J., Waldenström J., Hellgren O. (2004). Linkage between nuclear and mitochondrial DNA sequences in avian malaria parasites: multiple cases of cryptic speciation? Evolution 58, 1617–1621. doi: 10.1554/04-026
Boenigk J., Ereshefsky M., Hoef-Emden K., Mallet J., Bass D. (2012). Concepts in protistology: species definitions and boundaries. Eur. J. Protistol. 48, 96–102 doi: 10.1016/j.ejop.2011.11.004
Bojko J., Reinke A. W., Stentiford G. D., Williams B., Rogers M. S. J., Bass D. (2022). Microsporidia: a new taxonomic, evolutionary, and ecological synthesis. Trends Parasitol. 38, 642–659. doi: 10.1016/j.pt.2022.05.007
Bolger A. M., Lohse M., Usadel B. (2014). Trimmomatic: a flexible trimmer for Illumina sequence data. Bioinf. (Oxford England) 30, 2114–2120. doi: 10.1093/bioinformatics/btu170
Cai R., Kayal E., Alves-De-Souza C., Bigeard E., Corre E., Jeanthon C., et al. (2020). Cryptic species in the parasitic Amoebophrya species complex revealed by a polyphasic approach. Sci. Rep. 10, 2531–2531. doi: 10.1038/s41598-020-59524-z
Carrasco N., Hine P. M., Durfort M., Andree K. B., Malchus N., Lacuesta B., et al. (2013). Marteilia cochillia sp. nov., a new Marteilia species affecting the edible cockle Cerastoderma edule in European waters. Aquaculture 412-413, 223–230. doi: 10.1016/j.aquaculture.2013.07.027
Carrasco N., Roque A., Andree K. B., Rodgers C., Lacuesta B., Furones M. D. (2011). A Marteilia parasite and digestive epithelial virosis lesions observed during a common edible cockle Cerastoderma edule mortality event in the Spanish Mediterranean coast. Aquaculture 321, 197–202. doi: 10.1016/j.aquaculture.2011.09.018
Chevignon G., Dotto-Maurel A., Serpin D., Chollet B., Arzul I. (2022). De novo transcriptome assembly and analysis of the flat oyster pathogenic protozoa bonamia ostreae. Front. Cell. Infect Microbiol. 12. doi: 10.3389/fcimb.2022.921136
Choi J., Park J. S. (2020). Comparative analyses of the V4 and V9 regions of 18S rDNA for the extant eukaryotic community using the Illumina platform. Sci. Rep. 10, 6519. doi: 10.1038/s41598-020-63561-z
Coleman A. W. (2007). Pan-eukaryote ITS2 homologies revealed by RNA secondary structure. Nucleic Acids Res. 35, 3322–3329. doi: 10.1093/nar/gkm233
Collins E., Ward G. M., Bateman K. S., Cheslett D. L., Hooper C., Feist S. W., et al. (2022). High prevalence of Paramarteilia canceri infecting velvet swimming crabs Necora puber in Ireland. Dis. Aquat. Organisms 148, 167–181. doi: 10.3354/dao03652
Escalante A. A., Freeland D. E., Collins W. E., Lal A. A. (1998). The evolution of primate malaria parasites based on the gene encoding cytochrome <em<b</em< from the linear mitochondrial genome. Proc. Natl. Acad. Sci. 95, 8124. doi: 10.1073/pnas.95.14.8124
Eu (2016). “Regulation (EU) 2016/429 of the European Parliament of the Council on transmissible animal diseases and amending and replealing certain acts in the area of animal health (‘Animal Health Law’),” in European Union Law.
Feist S. W., Hine P. M., Bateman K. S., Stentiford G. D., Longshaw M. (2009). Paramarteilia canceri sp. n. (Cercozoa) in the European edible crab (Cancer pagurus) with a proposal for the revision of the order Paramyxida Chatton 1911. Folia Parasitol 56, 73–85. doi: 10.14411/fp.2009.012
Finlay B. J. (2004). Protist taxonomy: an ecological perspective. Philos. Transactions: Biol. Sci. 359, 599–610. doi: 10.1098/rstb.2003.1450
García-Alcalde F., Okonechnikov K., Carbonell J., Cruz L. M., Götz S., Tarazona S., et al. (2012). Qualimap: evaluating next-generation sequencing alignment data. Bioinformatics 28, 2678–2679. doi: 10.1093/bioinformatics/bts503
Ginsburger-Vogel T. (1991). Intersexuality in orchestia mediterranea costa 1853, and orchestia aestuarensis wildish 1987 (Amphipoda): a consequence of hybridization or parasitic infestation? J. Crustacean Biol. 11, 530–539. doi: 10.2307/1548522
Ginsburger-Vogel T., Desportes I. (1979). Etude Ultrastructurale de la Sporulation de Paramarteilia orchestiae gen. n., sp. n., Parasite de l’Amphipode Orchestia gammarellus (Pallas). J. Eukaryotic Microbiol. 26, 390–403. doi: 10.1111/j.1550-7408.1979.tb04642.x
Gurusaran M., Ravella D., Sekar K. (2013). RepEx: Repeat extractor for biological sequences. Genomics 102, 403–408. doi: 10.1016/j.ygeno.2013.07.005
Kang H. S., Yang H. S., Reece K. S., Hong H. K., Park K. I., Choi K. S. (2016). First report of Perkinsus honshuensis in the variegated carpet shell clam Ruditapes variegatus in Korea. Dis. Aquat. Organisms 122, 35–41. doi: 10.3354/dao03063
Katoh K., Standley D. M. (2013). MAFFT multiple sequence alignment software version 7: improvements in performance and usability. Mol. Biol. Evol. 30, 772–780. doi: 10.1093/molbev/mst010
Kerr R., Ward G. M., Stentiford G. D., Alfjorden A., Mortensen S., Bignell J. P., et al. (2018). Marteilia refringens and Marteilia pararefringens sp. nov. are distinct parasites of bivalves and have different European distributions. Parasitology 145, 1483–1492. doi: 10.1017/S003118201800063X
Koren S., Walenz B. P., Berlin K., Miller J. R., Bergman N. H., Phillippy A. M. (2017). Canu: scalable and accurate long-read assembly via adaptive k-mer weighting and repeat separation. Genome Res. 27, 722–736. doi: 10.1101/gr.215087.116
Larsson A. (2014). AliView: a fast and lightweight alignment viewer and editor for large datasets. Bioinformatics 30, 3276–3278. doi: 10.1093/bioinformatics/btu531
Li H. (2018). Minimap2: pairwise alignment for nucleotide sequences. Bioinformatics 34, 3094–3100. doi: 10.1093/bioinformatics/bty191
Li H., Durbin R. (2009). Fast and accurate short read alignment with Burrows-Wheeler transform. Bioinf. (Oxford England) 25, 1754–1760. doi: 10.1093/bioinformatics/btp324
Li H., Handsaker B., Wysoker A., Fennell T., Ruan J., Homer N., et al. (2009). The sequence alignment/map format and SAMtools. Bioinf. (Oxford England) 25, 2078–2079. doi: 10.1093/bioinformatics/btp352
López-Flores I., de la Herrán R., Garrido-Ramos M. A., Navas J. I., Ruiz-Rejón C., Ruiz-Rejón M. (2004). The molecular diagnosis of Marteilia refringens and differentiation between Marteilia strains infecting oysters and mussels based on the rDNA IGS sequence. Parasitology 129, 411–419. doi: 10.1017/S0031182004005827
Lynn D. H., Strüder-Kypke M. C. (2006). Species of tetrahymena identical by small subunit rRNA gene sequences are discriminated by mitochondrial cytochrome c oxidase I gene sequences. J. Eukaryot Microbiol. 53, 385–387. doi: 10.1111/j.1550-7408.2006.00116.x
Miller M. A., Pfeiffer W., Schwartz T. (2010). Creating the CIPRES Science Gateway for inference of large phylogenetic trees, in 2010 Gateway Computing Environments Workshop (GCE) (New Orleans, LA, United States: IEEE), 1–8.
Moss J. A., Xiao J. I. E., Dungan C. F., Reece K. S. (2008). Description of Perkinsus beihaiensis n. sp., a new Perkinsus sp. Parasite in Oysters of Southern China. J. Eukaryotic Microbiol. 55, 117–130. doi: 10.1111/j.1550-7408.2008.00314.x
Nishiguchi M. K., Doukakis P., Egan M., Kizirian D., Phillips A., Prendini L., et al. (2002). “DNA isolation procedures BT - techniques in molecular systematics and evolution,”. Eds. Desalle R., Wheeler G.G.W.. Fundamentals of Biochemistry (Basel: Birkhäuser Basel), 249–287.
Obert T., Vďačný P. (2020). Delimitation of five astome ciliate species isolated from the digestive tube of three ecologically different groups of lumbricid earthworms, using the internal transcribed spacer region and the hypervariable D1/D2 region of the 28S rRNA gene. BMC Evolutionary Biol. 20, 1–18. doi: 10.1186/s12862-020-1601-2
Pawlowski J., Audic S., Adl S., Bass D., Belbahri L., Berney C., et al. (2012). CBOL protist working group: barcoding eukaryotic richness beyond the animal, plant, and fungal kingdoms. PloS Biol. 10, e1001419. doi: 10.1371/journal.pbio.1001419
Pichot Y., Tige G., Grizel H., Rabouin M.-A. (1979). Recherches sur Bonamia ostreae gen. n., sp. n., parasite nouveau de l’huitre plate Ostrea edulis L Revue des Travaux de l'Institut des Pêches Maritimes 43, 131–140.
Pickup J., Ironside J. E. (2018). Multiple origins of parasitic feminization: thelygeny and intersexuality in beach-hoppers are caused by paramyxid parasites, not microsporidia. Parasitology 145, 408–415. doi: 10.1017/S0031182017001597
Prjibelski A., Antipov D., Meleshko D., Lapidus A., Korobeynikov A. (2020). Using SPAdes de novo assembler. Curr. Protoc. Bioinf. 70, e102–e102. doi: 10.1002/cpbi.102
Regulation (EU) 2016/429 of the European Parliament and of the Council of 9 March 2016 on transmissible animal diseases and amending and repealing certain acts in the area of animal health (‘Animal Health Law’). (OJ L 84, 31.3.2016, pp. 1–208).
Riit T., Tedersoo L., Drenkhan R., Runno-Paurson E., Kokko H., Anslan S. (2016). Oomycete-specific ITS primers for identification and metabarcoding. MycoKeys 14, 17–30. doi: 10.3897/mycokeys.14.9244
Robinson J. T., Thorvaldsdóttir H., Winckler W., Guttman M., Lander E. S., Getz G., et al. (2011). Integrative genomics viewer. Nat. Biotechnol. 29, 24–26. doi: 10.1038/nbt.1754
Ronquist F., Teslenko M., van der Mark P., Ayres D. L., Darling A., Höhna S., et al. (2012). MrBayes 3.2: efficient Bayesian phylogenetic inference and model choice across a large model space. Systematic Biol. 61, 539–542. doi: 10.1093/sysbio/sys029
Short S., Guler Y., Yang G., Kille P., Ford A. T. (2012). Paramyxean-microsporidian co-infection in amphipods: is the consensus that Microsporidia can feminise their hosts presumptive? Int. J. Parasitol. 42, 683–691. doi: 10.1016/j.ijpara.2012.04.014
Skujina I., Hooper C., Bass D., Feist S. W., Bateman K. S., Villalba A., et al. (2022). Discovery of the parasite Marteilia cocosarum sp. nov. in common cockle (Cerastoderma edule) fisheries in Wales, UK and its comparison with Marteilia cochillia. J. Invertebrate Pathol. 192, 107786. doi: 10.1016/j.jip.2022.107786
Small H. J. (2012). Advances in our understanding of the global diversity and distribution of Hematodinium spp. – Significant pathogens of commercially exploited crustaceans. J. Invertebrate Pathol. 110, 234–246. doi: 10.1016/j.jip.2012.03.012
Vaser R., Sović I., Nagarajan N., Šikić M. (2017). Fast and accurate de novo genome assembly from long uncorrected reads. Genome Res. 27, 737–746. doi: 10.1101/gr.214270.116
Villalba A., Iglesias D., Ramilo A., Darriba S., Parada J. M., No E., et al. (2014). Cockle Cerastoderma edule fishery collapse in the Ría de Arousa (Galicia, NW Spain) associated with the protistan parasite Marteilia cochillia. Dis. Aquat. Organisms 109, 55–80. doi: 10.3354/dao02723
Villalba A., Reece K. S., Camino Ordás M., Casas S. M., Figueras A. (2004). Perkinsosis in molluscs: A review. Aquat. Living Resour. 17, 411–432. doi: 10.1051/alr:2004050
Wang Z., Liu M., Ma H., Lu B., Shen Z., Mu C., et al. (2022). Redescription and molecular characterization of two Trichodina species (Ciliophora, Peritrichia, Mobilida) from freshwater fish in China. Parasitol. Int. 86, 102470. doi: 10.1016/j.parint.2021.102470
Ward G. M., Bennett M., Bateman K., Stentiford G. D., Kerr R., Feist S. W., et al. (2016). A new phylogeny and environmental DNA insight into paramyxids: an increasingly important but enigmatic clade of protistan parasites of marine invertebrates. Int. J. Parasitol. 46, 605–619. doi: 10.1016/j.ijpara.2016.04.010
Winnepenninckx B., Backeljau T., De Wachter R. (1993). Extraction of high molecular weight DNA from molluscs. Trends Genetics: TIG 9, 407–407. doi: 10.1016/0168-9525(93)90102-N
Keywords: protists, systematics, diagnostics, ascetosporea, marteilia, paramarteilia, bonamia, ribosomal RNA (rRNA)
Citation: Hooper C, Ward GM, Foster R, Skujina I, Ironside JE, Berney C and Bass D (2023) Long amplicons as a tool to identify variable regions of ribosomal RNA for improved taxonomic resolution and diagnostic assay design in microeukaryotes: using ascetosporea as a case study. Front. Ecol. Evol. 11:1266151. doi: 10.3389/fevo.2023.1266151
Received: 24 July 2023; Accepted: 10 October 2023;
Published: 27 October 2023.
Edited by:
Michael Tessler, Medgar Evers College, United StatesReviewed by:
Sally Warring, Earlham Institute (EI), United KingdomMichael Ginger, University of Huddersfield, United Kingdom
Copyright © 2023 Hooper, Ward, Foster, Skujina, Ironside, Berney and Bass. This is an open-access article distributed under the terms of the Creative Commons Attribution License (CC BY). The use, distribution or reproduction in other forums is permitted, provided the original author(s) and the copyright owner(s) are credited and that the original publication in this journal is cited, in accordance with accepted academic practice. No use, distribution or reproduction is permitted which does not comply with these terms.
*Correspondence: Chantelle Hooper, Y2hhbnRlbGxlLmhvb3BlckBjZWZhcy5nb3YudWs=