 Jinhang Li
 Mengdie Zhao1,2*
- 1School of Water Conservancy, North China University of Water Resources and Electric Power, Zhengzhou, China
- 2Yellow River Survey Planning and Design Institute Co., Ltd., Zhengzhou, China
The ecological health level of water resources plays a crucial role in achieving sustainable development in society. This study focuses on the core area of the Central Plains urban agglomeration. A comprehensive evaluation system, based on the Water Resources - Socio-Economic - Ecological Environment model framework, was constructed, incorporating 22 evaluation indicators in the indicator layer. Using an improved entropy weighting method combined with the ITOPSIS model, the water ecological health level in the study area from 2013 to 2022 was evaluated, and corresponding measures were proposed based on the evaluation results. Furthermore, the Barrier Degree model was applied to identify the eight major hindering factors influencing the water resource ecological environment in the research area. The results show that: The overall water resource ecological health level in the core area of the Central Plains urban agglomeration from 2013 to 2022 showed a generally improving trend. The eight major hindering factors indicate that cities should focus on green urban development while promoting the construction of smart water management systems and sponge cities.
1 Introduction
Water resources are a critical pillar supporting socio-economic development and the health of ecosystems. However, in the context of rapid urbanization and economic growth, the rational utilization and ecological preservation of water resources face increasingly severe challenges. To achieve ecological optimization and sustainable utilization of water resources, it is necessary to conduct in-depth research on the interrelationships between water resources, socio-economic factors, and the ecological environment, as well as analyze the obstacles that hinder water resource optimization (Zhao et al., 2023).
This paper aims to analyze water resource ecological optimization and the obstacles involved by employing a framework based on water resources-socio-economic factors-ecological environment models, with a focus on the core area of the Central Plains Urban Agglomeration (Mu et al., 2023). As an important region for China’s economic development, the water resource status and ecological environmental issues in the core area of the Central Plains Urban Agglomeration have attracted significant attention (Zhao M. et al., 2022). By comprehensively considering indicators and data related to the natural environment, socio-economic development, water resource utilization, and ecosystem conservation, we will explore the current status of water resource ecological optimization in the core area and conduct a detailed analysis of the obstacles hindering its progress (Zhang et al., 2023). A comprehensive evaluation system, based on the Water Resources - Socio-Economic - Ecological Environment model framework, was constructed, incorporating 22 evaluation indicators in the indicator layer. Using an improved entropy weighting method combined with the ITOPSIS model.
In this study, we will begin by describing and evaluating the current state of water resources in the core area of the Central Plains Urban Agglomeration (Peng et al., 2023). Subsequently, we will construct a framework of water resources-socio-economic factors-ecological environment, examining the interrelationships between water resources, socio-economic development, and the ecological environment (Tefera et al., 2023). We will explore the potential and challenges of water resource ecological optimization in a quantitative and qualitative manner.
Regarding the analysis of obstacles, we will identify and assess factors that hinder water resource ecological optimization, such as insufficient water supply, water pollution, inappropriate water resource utilization patterns, and a lack of effective management and conservation measures (Chen et al., 2023). For these obstacles, we will propose corresponding countermeasures, including improving water resource management mechanisms, strengthening environmental monitoring and governance capabilities, and promoting the application of sustainable development concepts in decision-making (Yang et al., 2021).
The results of this research will provide scientific decision support and guidance for water resource management and ecological environmental protection in the core area of the Central Plains Urban Agglomeration. Moreover, the findings will have important implications for water resource management and ecological environmental protection in other regions and countries, contributing to the global development of sustainable water resource utilization and ecological environmental preservation.
2 Literature review
2.1 Progress on water resources ecological security evaluation
Water resource ecological security evaluation is an important research field for assessing the ecological health and sustainability of water resources. In recent years, significant progress has been made in related research.
Firstly, researchers have established comprehensive indicator systems to assess the ecological condition and security of water resources. These indicator systems consider various aspects such as water quantity, water quality, biodiversity, ecosystem services, and ecological integrity, providing important foundations for a holistic evaluation of the ecological health of water resources (Melstrom and Malone, 2023).
Secondly, the application of remote sensing and geographic information systems (GIS) has provided strong support for water resource ecological security evaluation (Zhang et al., 2017). Remote sensing technology enables real-time monitoring and analysis of environmental factors such as water distribution, land use, and vegetation cover (Xu et al., 2023). When combined with GIS, spatial analysis can accurately assess the ecological condition of water resources and identify potential risks.
Furthermore, advancements in ecological modeling have played a crucial role in water resource ecological security evaluation (Zhou et al., 2023). Hydrological models, water quality models, and ecological risk assessment models simulate and predict changes in water quantity, water quality, and ecological dynamics. These models provide scientific foundations for formulating protection and management strategies (Sun et al., 2022).
The evaluation of ecosystem services is an essential component of water resource ecological security assessment. Researchers assess and quantify the value of ecosystem services provided by water resources, such as water supply, flood regulation, and habitat provision (Li M. et al., 2023). This approach facilitates the integration of ecological and economic factors, providing references for sustainable development strategies.
The application of integrated approaches in water resource ecological security evaluation has gained recognition. These approaches consider ecological, social, and economic factors and incorporate stakeholder participation (Mohammadyari et al., 2023). They contribute to balancing different objectives in decision-making processes, promoting the coordination of water resource ecological security and sustainable development.
In summary, notable progress has been made in the theoretical foundations, methodologies, and practical applications of water resource ecological security evaluation. These research achievements provide important support for protecting and managing water resources, maintaining ecological balance, and facilitating the sustainable utilization of water resources.
2.2 Research progress of ecological security optimization of water resources
Research on the optimization of water resource ecological security aims to improve the ecological security and sustainable utilization efficiency of water resources through measures and strategies. Significant progress has been made in this field in recent years.
Firstly, ecological restoration and protection measures are important directions in the optimization of water resource ecological security (Zhang et al., 2020). Researchers have conducted projects such as wetland restoration, aquatic ecosystem reconstruction, and the construction of riparian green belts to improve the ecological environment of water resources, restore ecosystem functions, and enhance biodiversity (Huang et al., 2023). These measures contribute to improving the ecological security of water resources and maintaining the health of water ecosystems.
Secondly, water resource management strategies are another focus of research. Researchers are committed to formulating rational water resource management strategies to ensure the sustainable utilization and ecological security of water resources. These strategies include establishing reasonable water resource allocation mechanisms, promoting water resource conservation and efficiency, and improving water resource management systems. They aim to enhance water resource utilization efficiency, reduce water waste, and protect the integrity of water ecosystems (Bertrand et al., 2023).
Furthermore, advancements in science and technology have provided support for the optimization of water resource ecological security. The application of tools such as remote sensing, GIS, and mathematical models has made the monitoring, assessment, and prediction of water resource ecosystems more accurate and reliable. These advancements provide important scientific foundations for formulating scientifically sound management strategies and decisions.
In conclusion, significant progress has been made in research on the optimization of water resource ecological security, particularly in the areas of ecological restoration and protection measures, water resource management strategies, and the application of scientific and technological advancements. These research achievements are of great significance in promoting the sustainable utilization of water resources, improving the ecological security of water resources, and protecting and managing water resources for the healthy and sustainable development of water ecosystems.
2.3 Research progress on obstacle factors analysis of water resources ecological security
Research on the analysis of obstacle factors in water resource ecological security aims to identify and analyze the key factors hindering water resource ecological security. Here is a summary of the research progress in this field:
Firstly, through extensive empirical research and case studies, researchers have identified a range of obstacle factors that affect water resource ecological security. These factors include climate change, water pollution, ecological degradation, and excessive water resource exploitation, each of which can have significant impacts on water resource ecological security (Zeng et al., 2023).
Secondly, the evaluation and quantification methods for obstacle factors have been continuously improved and developed. Researchers have proposed various quantitative and qualitative assessment methods, including indicator weighting methods, fuzzy comprehensive evaluation methods, and analytic hierarchy process (Li W. et al., 2023). These methods enable objective evaluation and comparison of obstacle factors, assisting decision-makers in identifying key obstacle factors that require attention.
Furthermore, researchers have also focused on the interactions and combined impacts among obstacle factors. They have studied the correlations and mechanisms between obstacle factors and revealed the complex relationships among them through systematic analysis methods. This provides a scientific basis for developing targeted solutions and policies.
Lastly, the analysis of obstacle factors has played an important role in policy-making and decision support. By gaining a deep understanding of the degree of influence and interrelationships among obstacle factors, researchers can provide scientific advice and decision support to governments and decision-makers to ensure the ecological security of water resources.
In conclusion, research on the analysis of obstacle factors in water resource ecological security has made significant progress in identifying obstacle factors, improving evaluation methods, studying interactions, and providing decision support. These research achievements provide important scientific support for the protection and management of water resource ecological security, enabling the development of effective solutions and policies to achieve sustainable utilization and ecological security of water resources.
2.4 Literature summary
Research progress in water resource ecological security evaluation focuses on developing evaluation indicator systems, applying remote sensing and GIS technologies, and constructing ecological models and integrated methods to assess and quantify the ecological condition and security of water resources. These research achievements provide scientific foundations for the management and protection of water resources.
Research progress in the optimization of water resource ecological security mainly includes ecological restoration and protection measures, water resource management strategies, and the application of scientific and technological advancements. Through these studies, it is possible to improve the ecological security and sustainable utilization efficiency of water resources, promoting their sustainable development.
Research progress in the analysis of obstacle factors in water resource ecological security focuses on identifying and analyzing obstacle factors, developing evaluation methods, and studying the interactions among these factors. This helps uncover the major obstacle factors affecting water resource ecological security and provides scientific advice and decision support for policymakers.
In summary, these research advances collectively contribute to the development of the field of water resource ecological security. By evaluating, optimizing, and analyzing the ecological security status and influencing factors of water resources, we can better manage and protect water resources, achieving sustainable utilization and ecological balance.
3 Materials and methodologies
3.1 Study area
The core area of the Central Plains Urban Agglomeration, located in the geographical center of mainland China, encompasses parts of Henan Province, including cities such as Zhengzhou, Luoyang, and Kaifeng. This region is renowned for its abundant water resources, thriving socio-economic development, and diverse ecological environment. In terms of water resources, the core area of the Central Plains Urban Agglomeration is situated in the Yellow River Basin, enjoying rich water resources. As one of China’s major rivers, the Yellow River provides vital irrigation and water supply for the local area. Agriculture in the core area relies on the water from the Yellow River, and the farmland here can fully utilize these water resources through irrigation systems, supporting agricultural development. Additionally, the region is home to several lakes and reservoirs, such as the Luo River in Luoyang and West Lake in Zhengzhou, providing additional water resources for the local residents. In the socio-economic aspect, the core area of the Central Plains Urban Agglomeration is one of China’s economic centers, characterized by strong economic prowess and a relatively high population density. Zhengzhou serves as the political, economic, and transportation center of the region, as well as an important hub city in central China. Luoyang is renowned for its long history and cultural heritage, while Kaifeng holds the distinction of being a renowned historical and cultural city in China. These cities attract significant investments and talents, driving the rapid development of the regional economy. The industrial structure of the core area of the Central Plains Urban Agglomeration is diverse, including manufacturing, construction, finance, logistics, and more. In recent years, information technology, high-tech industries, and emerging sectors have also experienced rapid growth in the region. Despite rapid economic development, the core area of the Central Plains Urban Agglomeration recognizes the importance of environmental protection. Various measures have been implemented to strengthen environmental protection in the region. These include the implementation of energy-saving and emission-reduction policies, intensified environmental monitoring and governance, and the promotion of sustainable development. The region actively protects the ecological system of the Yellow River, promoting improvements in water quality and wetland preservation. Additionally, the core area of the Central Plains Urban Agglomeration is committed to promoting sustainable industries such as ecological agriculture and ecotourism, aiming to protect and restore the ecological environment. Overall, the core area of the Central Plains Urban Agglomeration showcases its rich water resources, thriving socio-economic development, and a strong focus on ecological conservation. The region’s efforts to balance economic growth with environmental protection contribute to its sustainable development and the preservation of its unique natural heritage. The elevation chart of the study area is shown in the Figure 1.
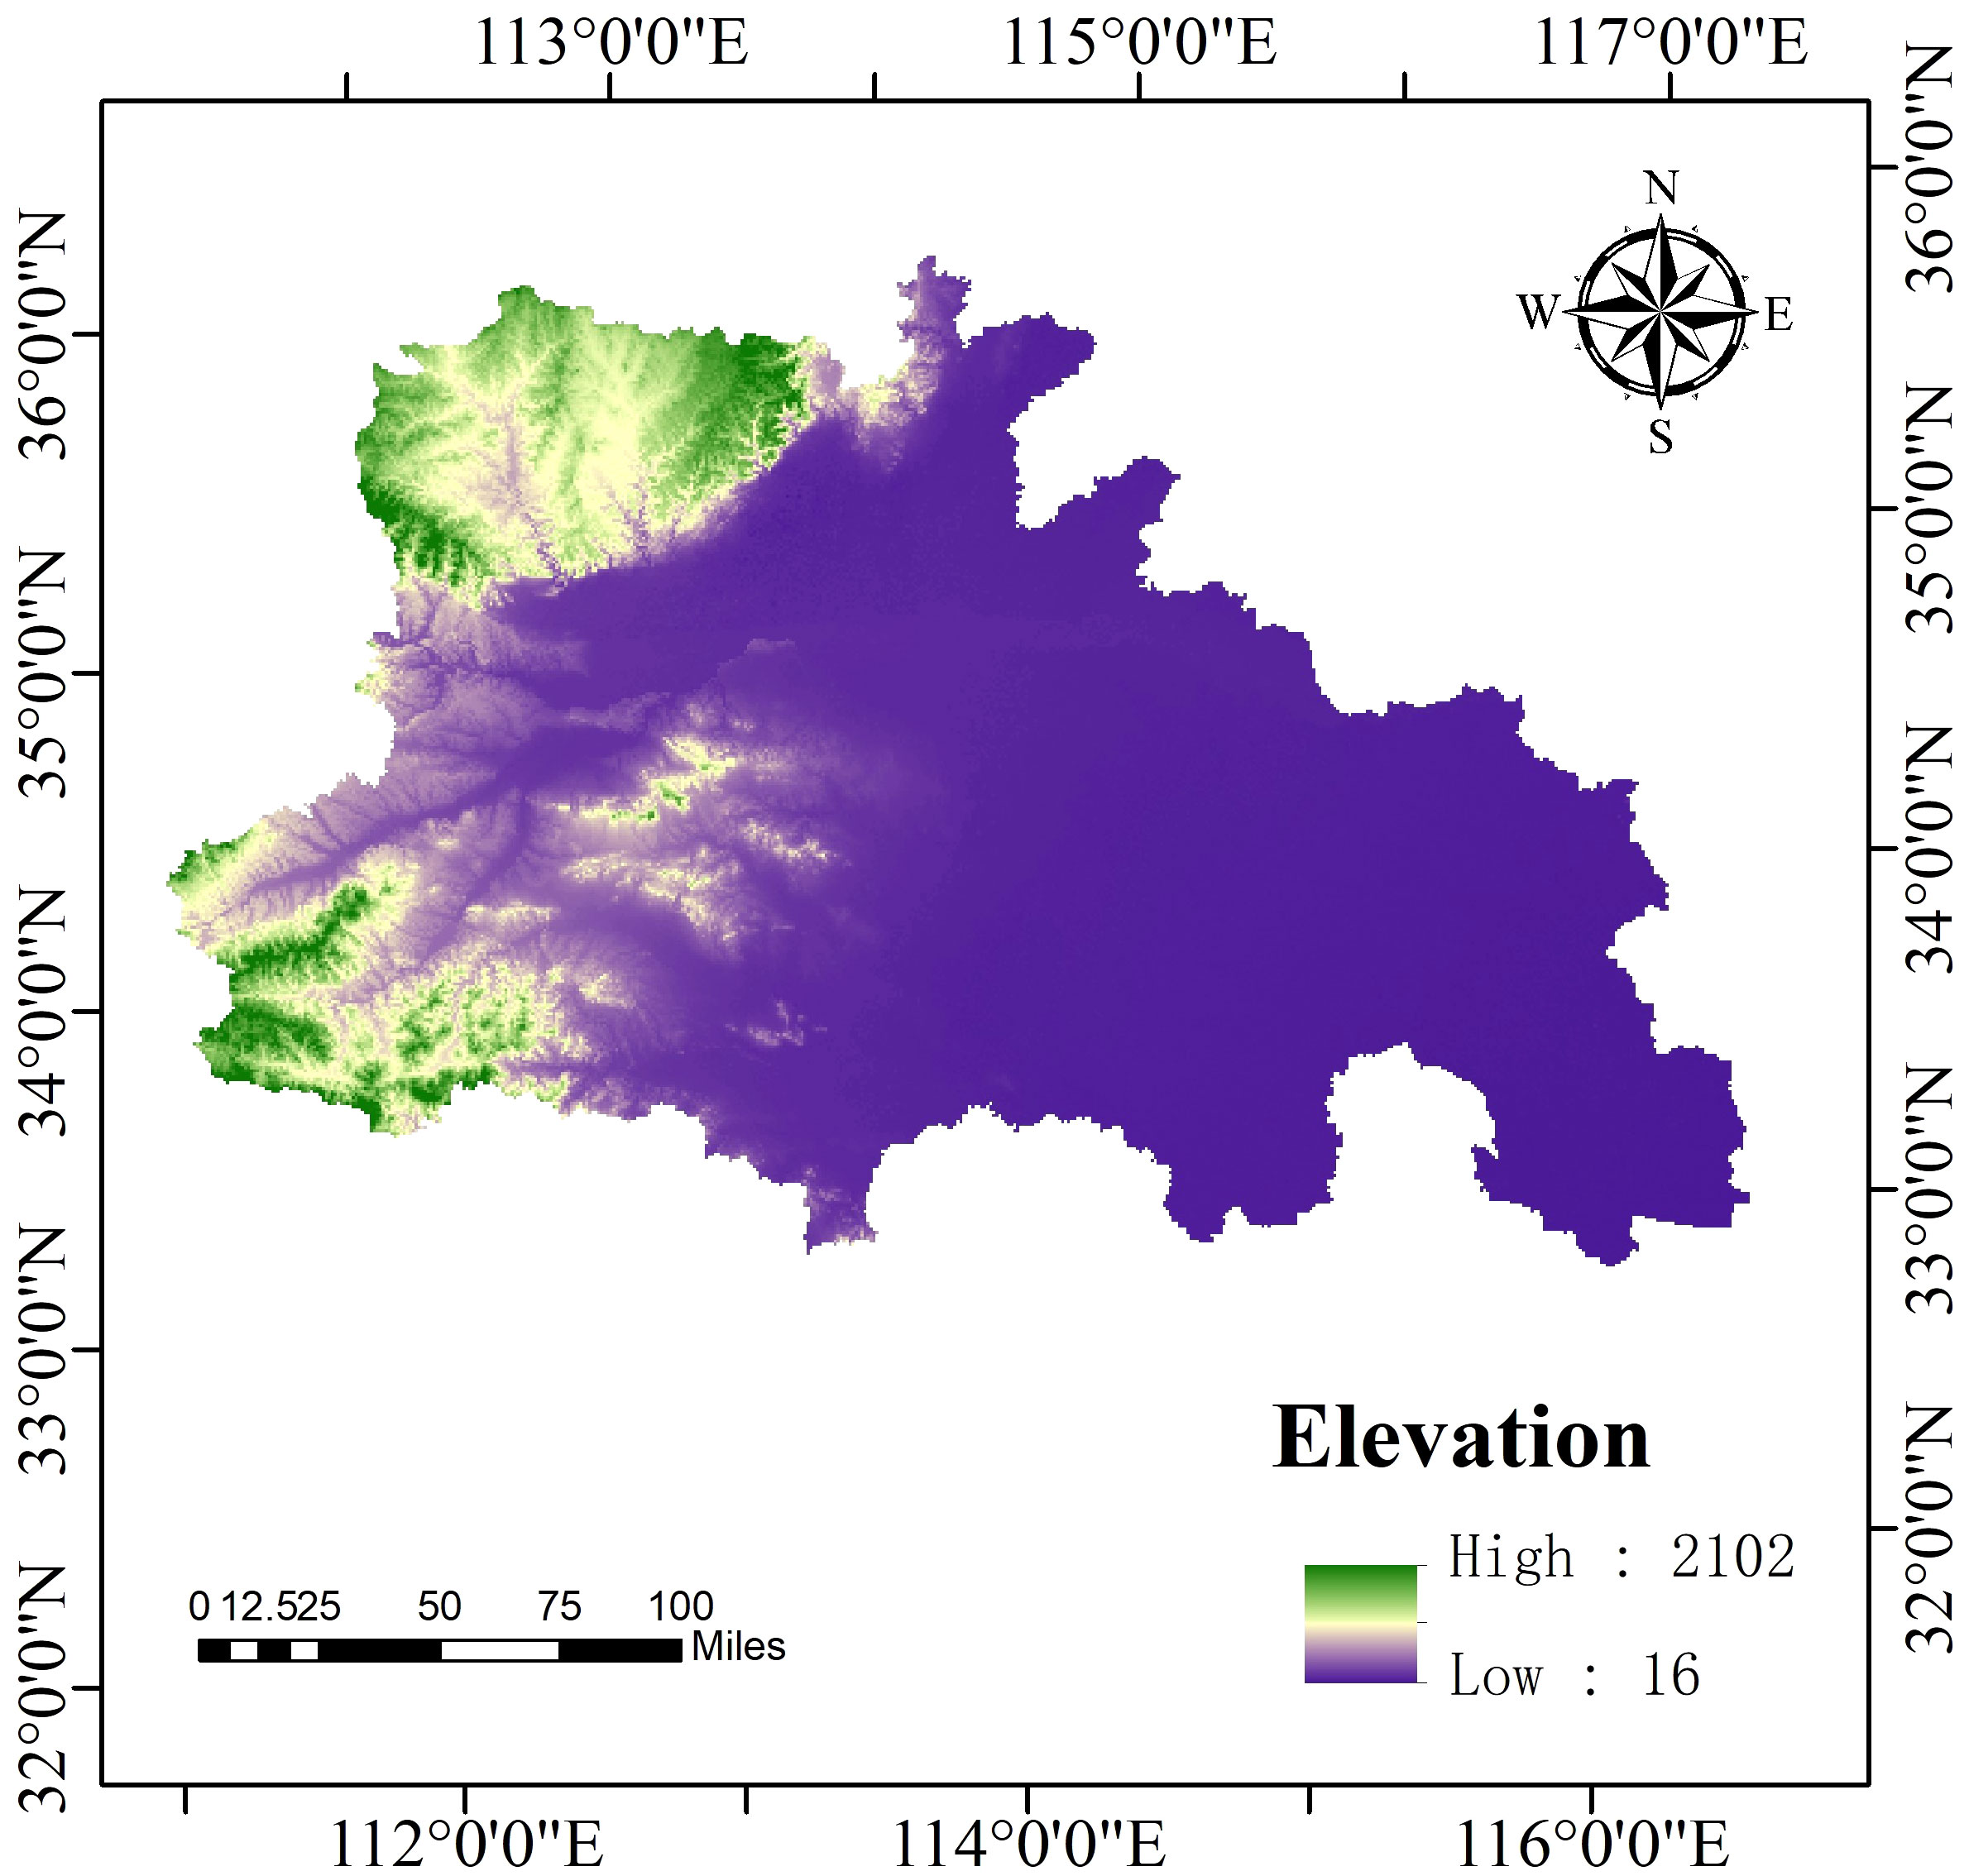
Figure 1 Elevation Map of the Central Plains Urban Agglomeration Core Area.
3.2 The connotation of healthy water resource ecosystem
A healthy water resource ecosystem refers to the maintenance of a stable and healthy water environment, promoting sustainable development and the well-being of human and ecological systems. It encompasses several key aspects: Firstly, it entails water quality protection. Measures such as strengthening wastewater treatment, reducing pollutant emissions, and prohibiting illegal discharges are essential to ensure good water quality in water sources, providing clean and safe drinking water resources (Lu et al., 2022). This contributes to the preservation of human health and the stability of ecosystems. Secondly, water balance is a crucial element of a healthy water resource ecosystem. Through proper water resource management and allocation, the goal is to achieve a balance between water supply and demand. This means avoiding over-extraction and wastage, promoting sustainable utilization of water resources, and meeting the water needs of agriculture, industry, urban areas, and ecosystems. Thirdly, the protection of water ecosystems is emphasized in a healthy water resource ecosystem. This includes preserving the integrity of wetlands, conserving biodiversity in rivers and lakes, and safeguarding the natural ecological functions of water ecosystems. The establishment of ecological conservation areas, wetland restoration, and protection of aquatic life and habitats are crucial for the sustainable development of water ecosystems. Additionally, a healthy water resource ecosystem advocates for the rational utilization of water resources, avoiding waste and misuse. Promoting water-saving technologies, improving agricultural irrigation efficiency, and strengthening water resource management contribute to efficient water resource utilization and increased water use efficiency (van Dijk et al., 2013). Lastly, achieving a healthy water resource ecosystem requires broad social participation and interdisciplinary cooperation. Governments, businesses, the public, and non-governmental organizations need to collaborate in formulating and implementing policies and measures for water resource conservation and management, fostering improvements in water resource ecosystems and promoting sustainable development. In summary, a healthy water resource ecosystem is essential for maintaining a stable and healthy water environment, achieving sustainable development, and contributing to the well-being of human and ecological systems. Through water quality protection, water balance, water ecosystem conservation, rational water resource utilization, and increased social participation and cooperation, we can realize the health and sustainability of water resources, benefiting both humanity and the natural environment.
3.3 Water Resources-Socio-Economic-Environmental model framework
The Water Resources-Socio-Economic-Environmental model framework is an analytical approach used to study water resource management and sustainable development. It considers water resources, socio-economic systems, and ecological environments as interconnected and interacting elements, and utilizes modelling to analyse their relationships. The framework typically includes the following elements:
1. Water Resources System: This element considers the supply and demand of water, including surface water and groundwater resources. It encompasses sustainable water use, water cycle processes, water quality management, and related factors.
2. Socio-Economic System: This element examines the human societal and economic activities related to water resources’ demand and utilization. It includes factors such as population growth, urbanization, agriculture, industry, energy production, as well as policies, management, and economic activities associated with water resources.
3. Ecological Environment System: This element considers the impacts of water resources on ecosystems and the dependency of ecosystems on water resources. It encompasses the protection and restoration of water-based ecosystems such as rivers, lakes, wetlands, as well as biodiversity conservation, water ecosystem services, and other aspects related to water resource management.
By establishing the Water Resources-Socio-Economic-Environmental model, researchers can simulate and evaluate the impacts of different water resource management strategies on socio-economic and environmental aspects. These models can be used to forecast indicators such as water supply-demand balance, water use efficiency, water pollution control, ecosystem health, and provide scientific evidence to support decision-makers in sustainable water resource management and development.
In summary, the Water Resources-Socio-Economic-Environmental model framework provides a comprehensive perspective to understand and manage the interrelationships between water resources, socio-economic development, and environmental protection, with the aim of achieving sustainable development goals. The evaluation system of this study is shown in the Figure 2.
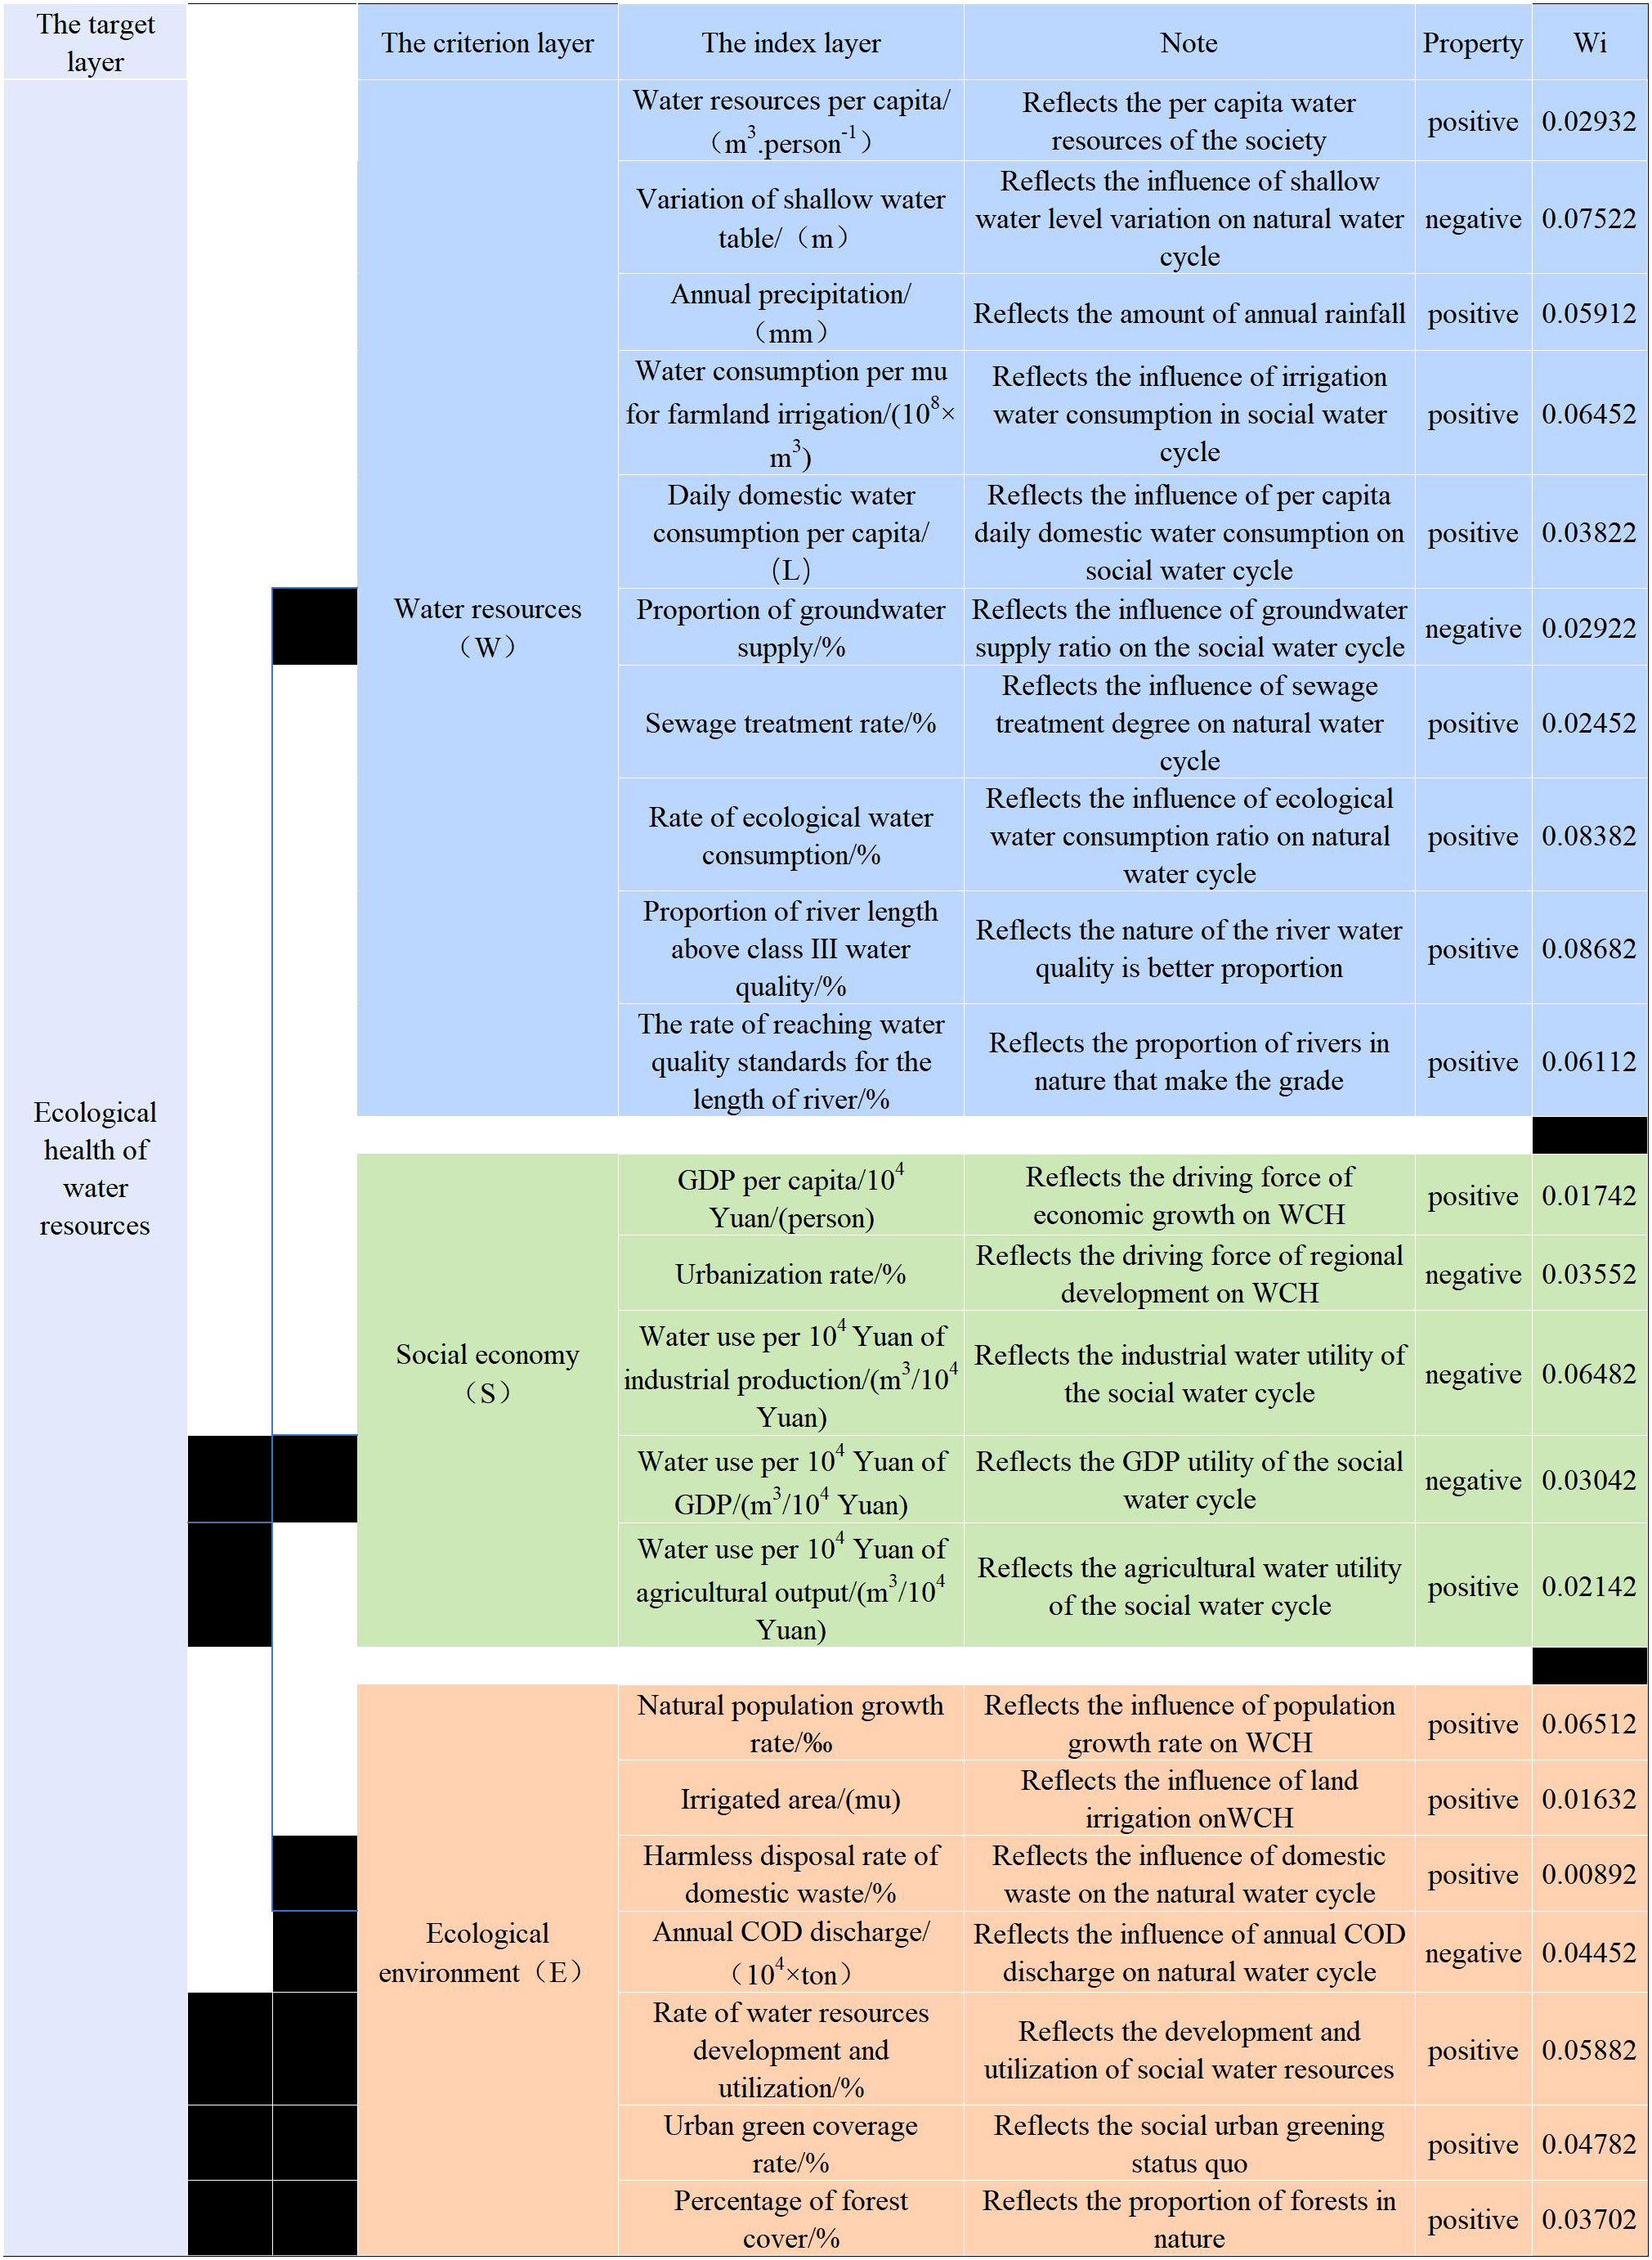
Figure 2 Water Ecological Health Evaluation Index System Diagram.
3.4 Weight calculation method
The Improved Entropy Weighting Method is an enhanced multi-criteria decision analysis approach used to calculate weights and determine the relative importance of multiple criteria or factors (Xi et al., 2022). In comparison to the traditional entropy weighting method, the improved version considers the correlation among the criteria when calculating the weights. The combination of subjective and objective weight values was achieved through the principle of Minimum Information Entropy. The application of this combined method effectively reduced the subjectivity of weight values in this research.
The entropy weighting method originates from the concept of entropy in information theory. In multi-criteria decision analysis, this method is primarily utilized to determine the weights of various criteria or factors. Its core function is to allocate a weight to each criterion or factor in the decision matrix, indicating its significance in the overall decision-making process. This way, for complex issues that involve numerous criteria or factors, the entropy weighting method offers a means to quantify their importance.
The basic mechanism of this method includes the following steps:
1. **Standardization of Decision Matrix**: First and foremost, the raw data of the decision matrix needs to be standardized to eliminate disparities in data units or magnitudes.
2. **Calculation of Entropy Value**: For each criterion, its entropy value is calculated based on its standardized data. This value represents the degree of dispersion of data for that criterion.
3. **Determination of Weights**: The entropy value is used to determine the weight for each criterion. Typically, the smaller the entropy value, the greater the variability of the data for that criterion, and consequently, the greater its weight.
4. **Features of the Improved Entropy Weighting Method**: Unlike the traditional entropy weighting method, the improved version also takes into account the correlation between criteria. This means that if two criteria are highly correlated, their weights might be adjusted to avoid exerting excessive influence on the decision.
In summary, the improved entropy weighting method offers a more comprehensive approach to determine the weights of criteria in multi-criteria decision analysis, especially when there’s a correlation between the criteria.
The Improved Entropy Weighting Method considers the correlation among criteria when calculating weights, providing a more accurate reflection of the relative importance of criteria. By using the improved entropy weighting method, biases that may occur in the traditional entropy weighting method when correlations exist can be avoided, thus enhancing the accuracy and reliability of decision analysis. The specific calculation process is as follows:
Data standardization processing:
Forward indicator:
Negative indicator:
In the formula: represents the information entropy of the index, represents the specific year, represents the index, and m represents the total number of years.
As can be seen from the above formula, >0, if the data of occurs, this paper replaces the 0 value with 0.00001.
Calculate index weight:
Index subjective and objective combination weight calculation:
In the formula: is the weight value of index combination; n is the number of indicators. is the weight result obtained by three-scale AHP; is the weight result obtained by the improved entropy weight method.
3.5 The improved TOPSIS method for evaluating the ecological condition of regional water resources
In this paper, the weighted Mahalanobis distance replaced the Euclidean distance of the original TOPSIS model, and the grey correlation analysis was introduced to improve the TOPSIS model (Yang et al., 2023). The flow chart of the formula is shown in Figure 3. Based on the original TOPSIS model, the improved TOPSIS model comprehensively considered the correlation between various indicators and intuitively showed the nonlinear relationship between sequences. The calculation process is as follows: criterion layer: and
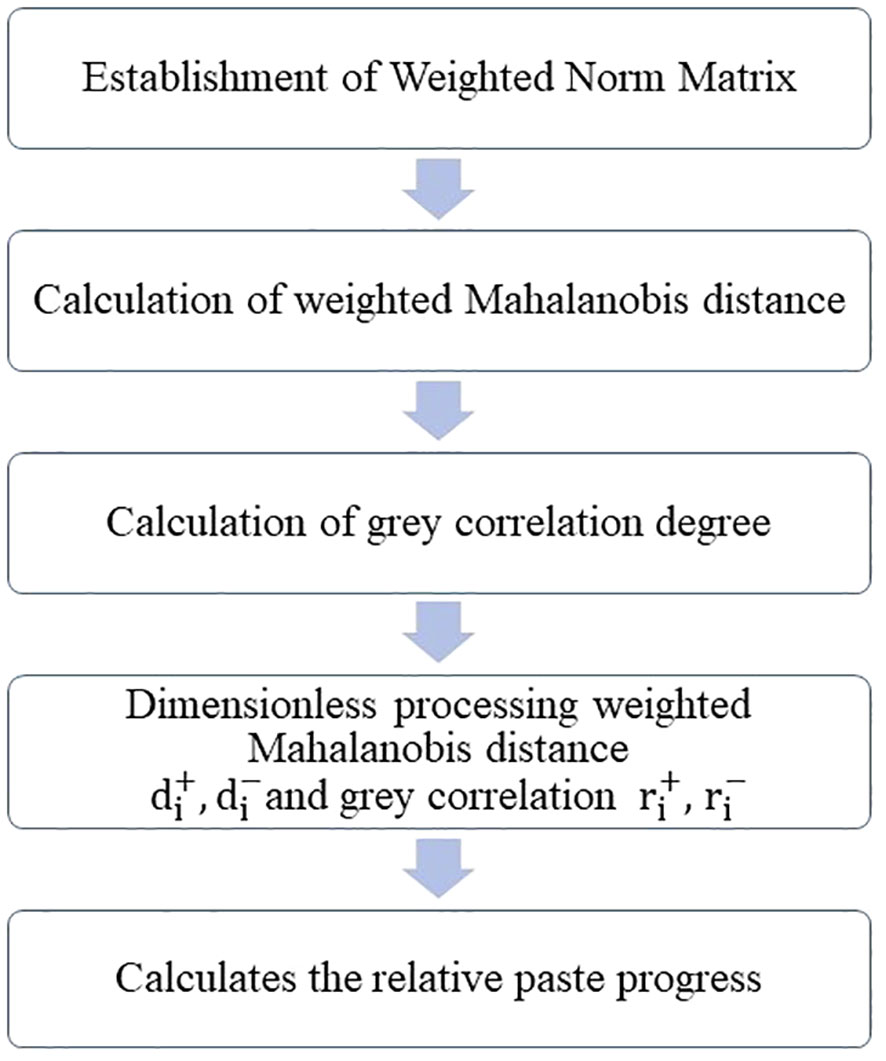
Figure 3 The flow chart of evaluation.
The standardized index matrix was established: the matrix comprised the standardized index data .
where is the standardized value of the sample and index : m and n are the criterion number of the criterion layer and the index number of the index layer, respectively.
Establishment of Weighted Norm Matrix
where is the number of evaluation schemes; is the number of indicators in each evaluation scheme; is the value multiplied by the corresponding weight value after the standardized transformation.
Calculation of weighted Mahalanobis distance. The formula is:
where ; is the covariance matrix.
Calculation of grey correlation degree:
where = 0.5, is the grey correlation degree between the evaluation scheme and positive ideal solution, is the grey correlation degree between the evaluation scheme and negative ideal solution.
Dimensionless processing weighted Mahalanobis distance , , and grey correlation , :
Calculates the relative paste progress:
where 、 ; 、 、 、 、 、 all reflect the distance between each evaluation object and the ideal solution; is the relative progress, and the larger the value is, the higher the water cycle health level is, and vice versa.
3.5.1 The standard for classifying the ecological health of water resources
The assessment of water resource ecological health involves evaluating the ecological condition of water bodies by considering various indicators such as water quality, structure, and functioning of aquatic ecosystems. In the field of water resource management and conservation, a commonly used approach is the classification of water bodies into five levels based on their ecological health (Zhao Z. et al., 2022).
In the “Excellent” category, water bodies exhibit a pristine ecological state with clear water, intact aquatic ecosystems, abundant biodiversity, no apparent signs of pollution, and full preservation of water functional zones.
The “Good” category represents water bodies with a favorable ecological state, relatively good water quality, mostly intact aquatic ecosystems, considerable biodiversity, slight pollution indications that have minimal impact on the ecosystem, and substantial preservation of water functional zones.
In the “Fair” category, water bodies have a moderate ecological state with water quality being moderately affected by pollution, some degree of ecosystem degradation, reduced biodiversity, and partial preservation of water functional zones.
The “Poor” category indicates water bodies with a relatively deteriorated ecological state, significant water pollution, severe damage to aquatic ecosystems, substantial loss of biodiversity, and the inability to maintain water functional zones in a normal condition.
The “Very Poor” category represents water bodies with an extremely degraded ecological state, highly polluted water, near-collapse of aquatic ecosystems, severe loss of biodiversity, and the complete breakdown of water functional zones.
It’s important to note that this classification system is just one commonly used approach, and the actual assessment of water resource ecological health may involve further subdivisions or adjustments based on specific circumstances. The purpose of such classification is to enhance understanding and management of water resource ecological health, allowing for the implementation of appropriate protection and restoration measures to ensure the sustainable development of aquatic ecosystems. The classification of health levels is shown in Figure 4.
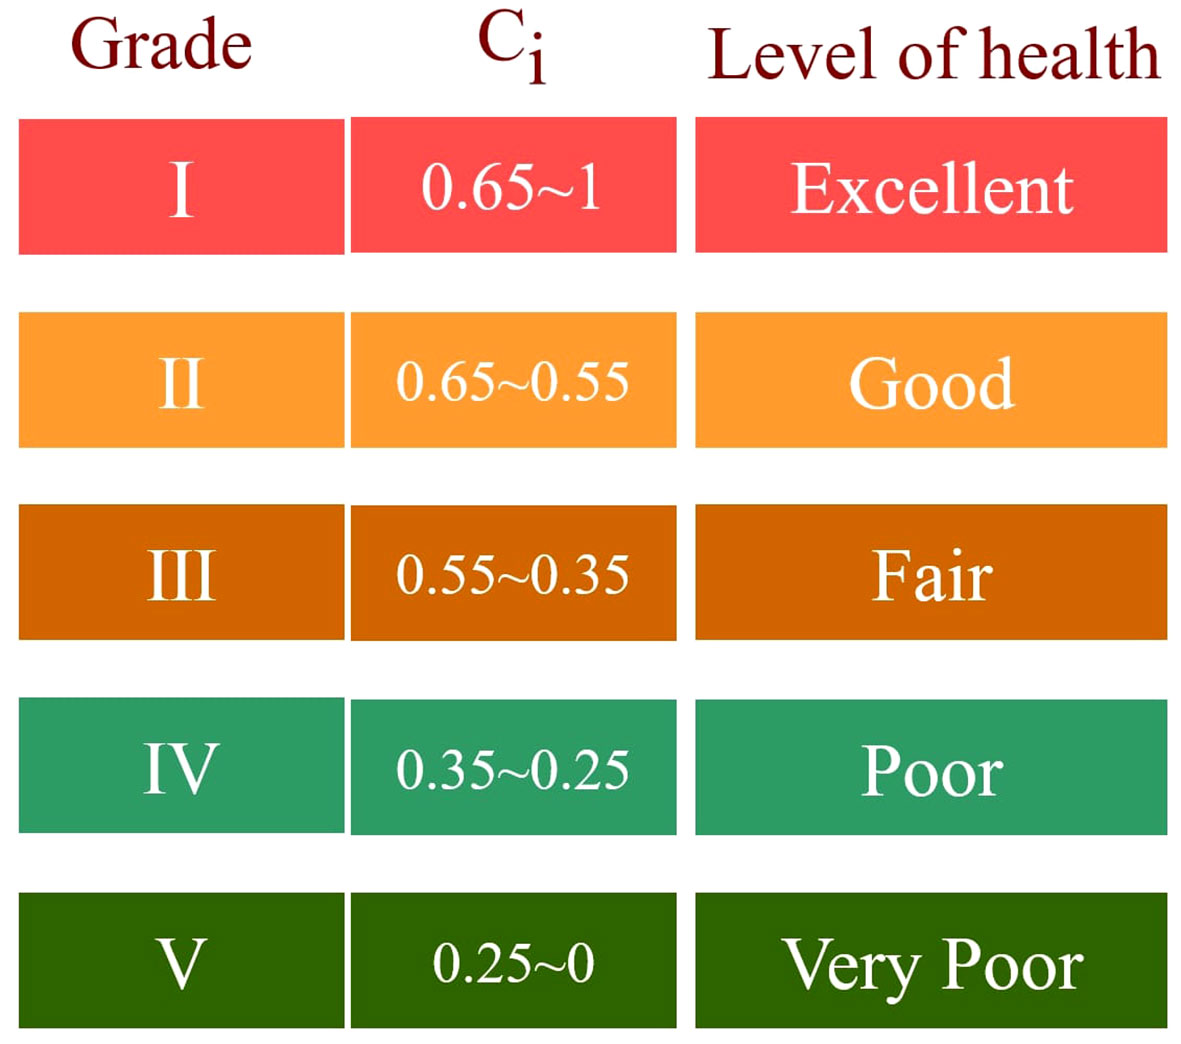
Figure 4 Water Ecological Health Grade Classification Chart.
3.6 Analysis of ecological health disruptive factors in the core area of the Central Plains urban agglomeration water resources
The obstacle degree model is an analytical model used to assess and quantify the degree of obstacles in systems or processes. In the analysis of disruptive factors affecting water resource ecological health in the core area of the Central Plains Urban Agglomeration, the obstacle degree model can be employed to evaluate the impact of various factors on water resource ecological health. The basic steps of the obstacle degree model are as follows:
(1) Calculate the contribution of the evaluation indicator:
In the formula: represents the weight value of the corresponding criterion layer.
(2) Calculate the deviation :
(3) Calculate the obstacle degree for each evaluation indicator :
4 Results and discussion
4.1 Water resource ecological health evaluation results
4.1.1 The temporal and spatial changes of WREH
To clearly demonstrate the ecological health status of water resources in the research area, this study presents the temporal trend graph using a bubble chart and the spatial trend graph using GIS. Specific results can be seen in Figures 5 and 6.
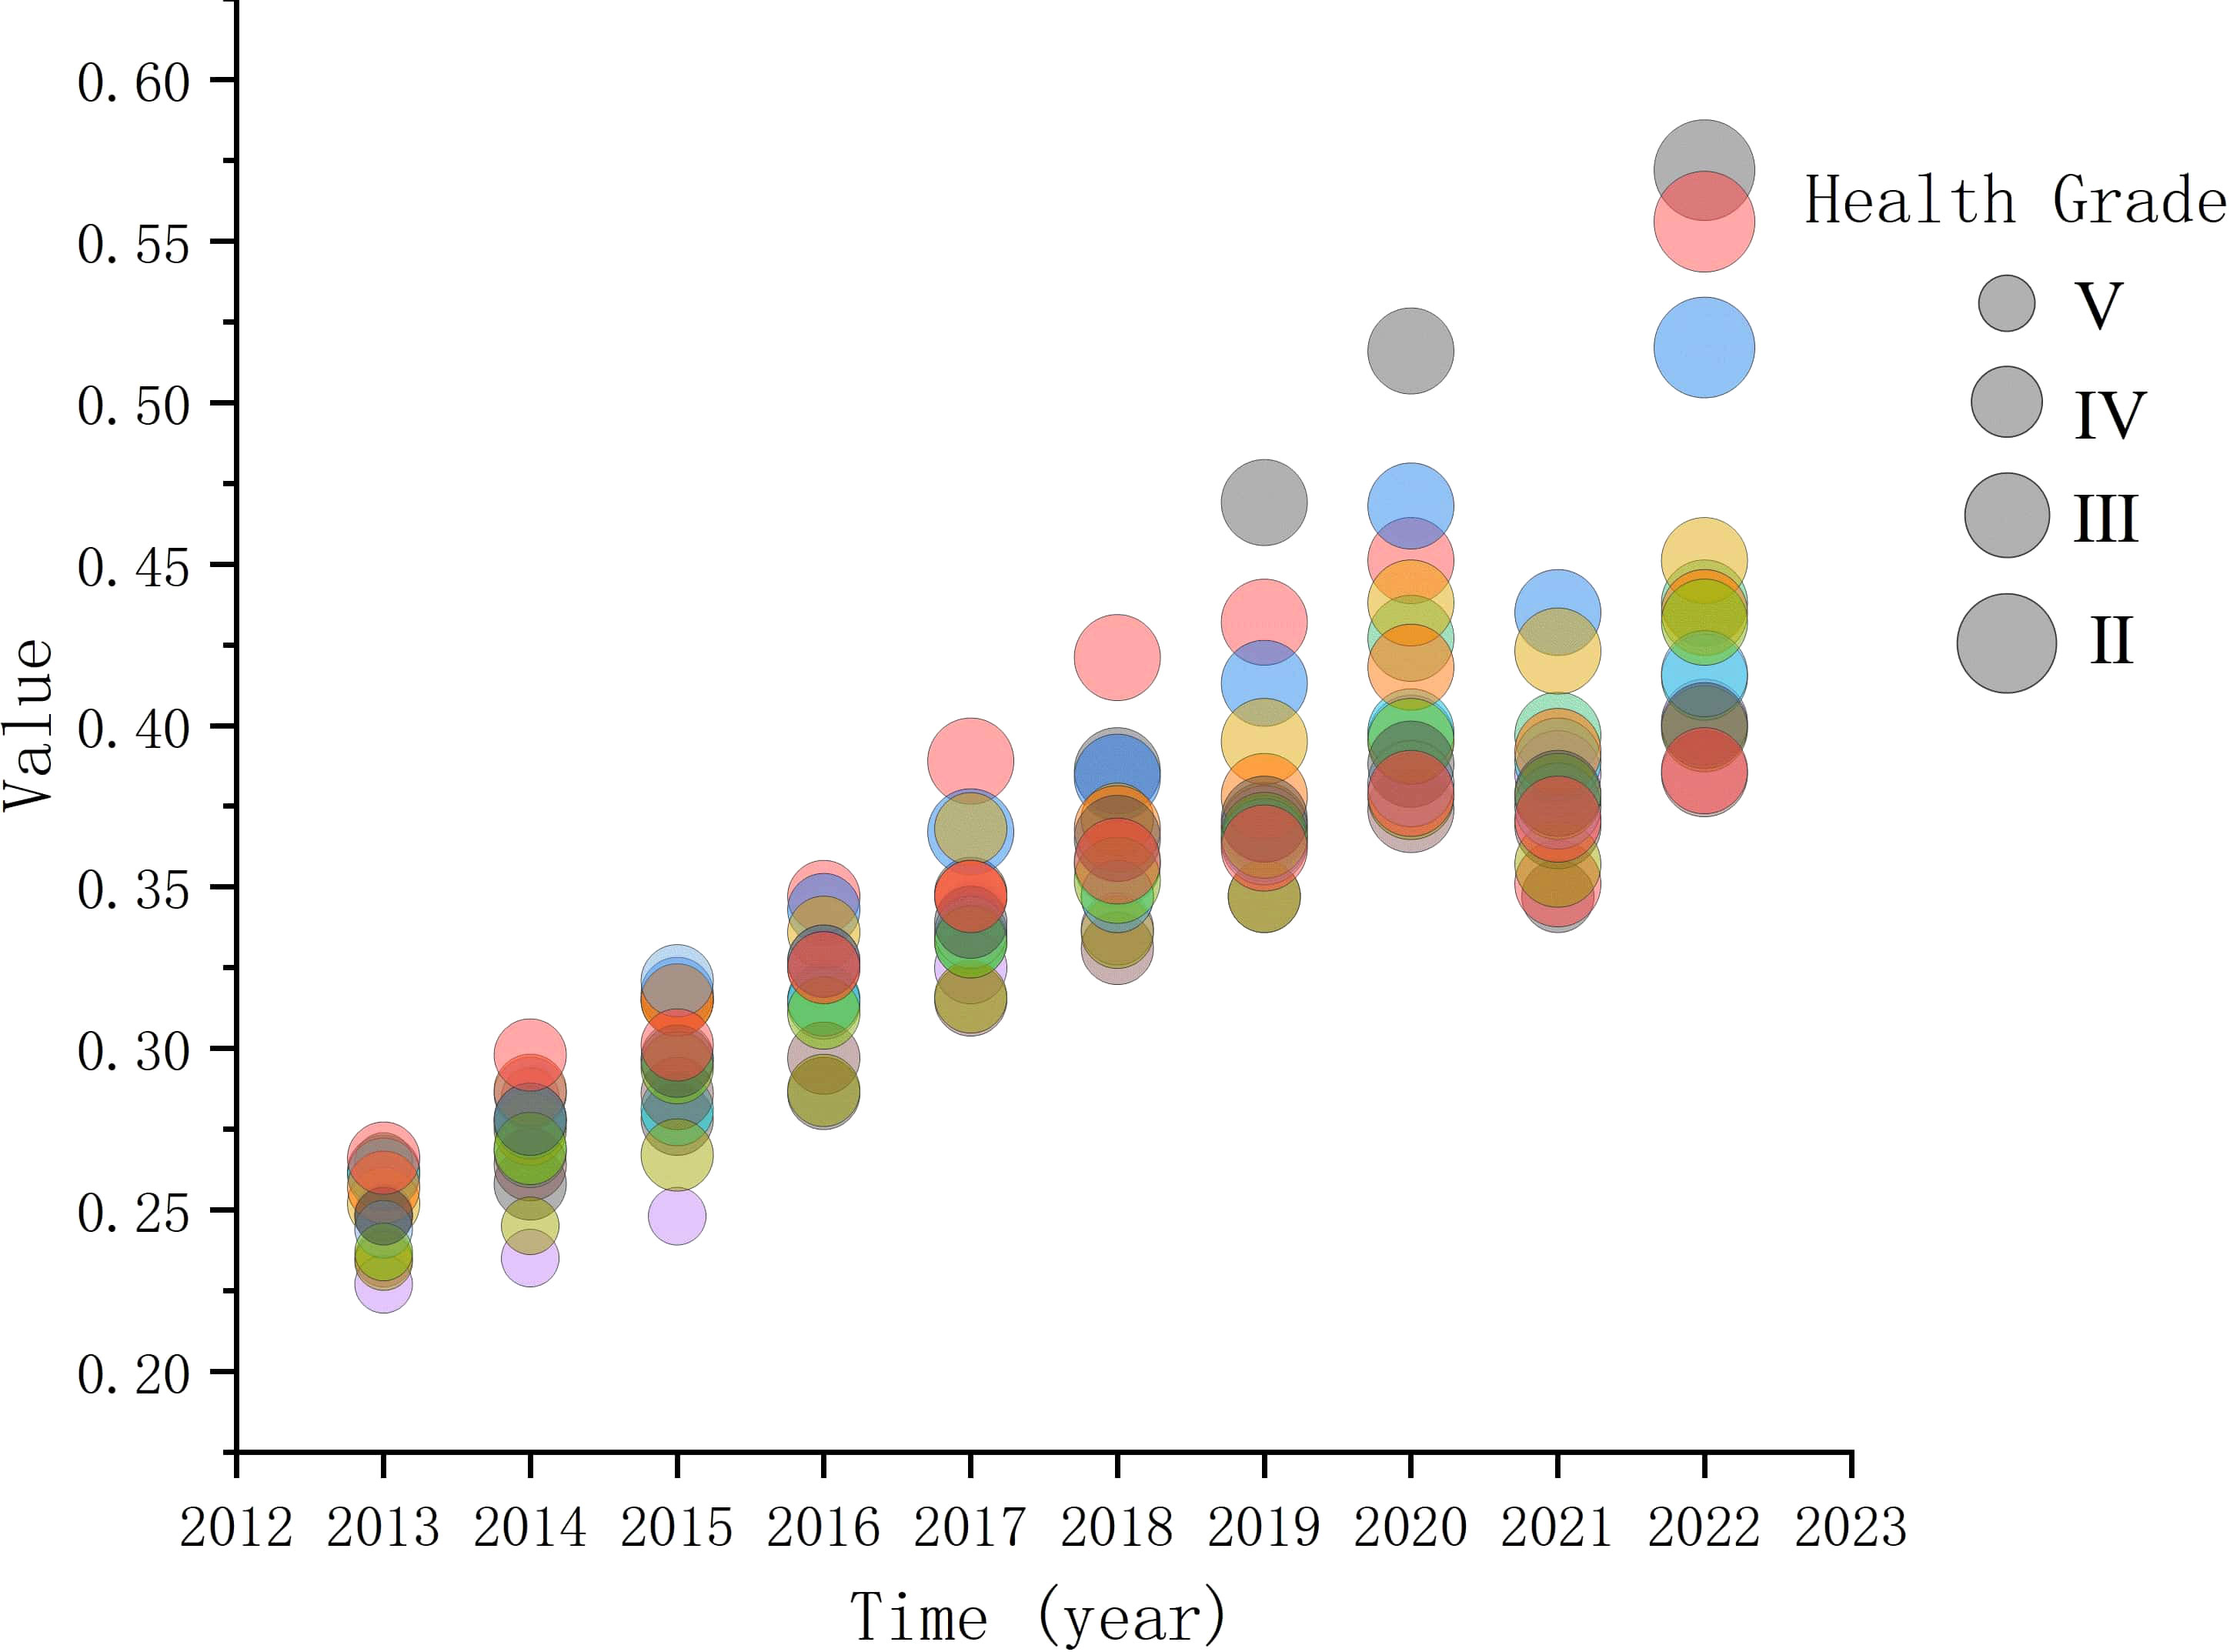
Figure 5 Bubble Chart of Water Ecological Health Evaluation Results in the Core Area of the Central Plains Urban Agglomeration from 2013 to 2022.
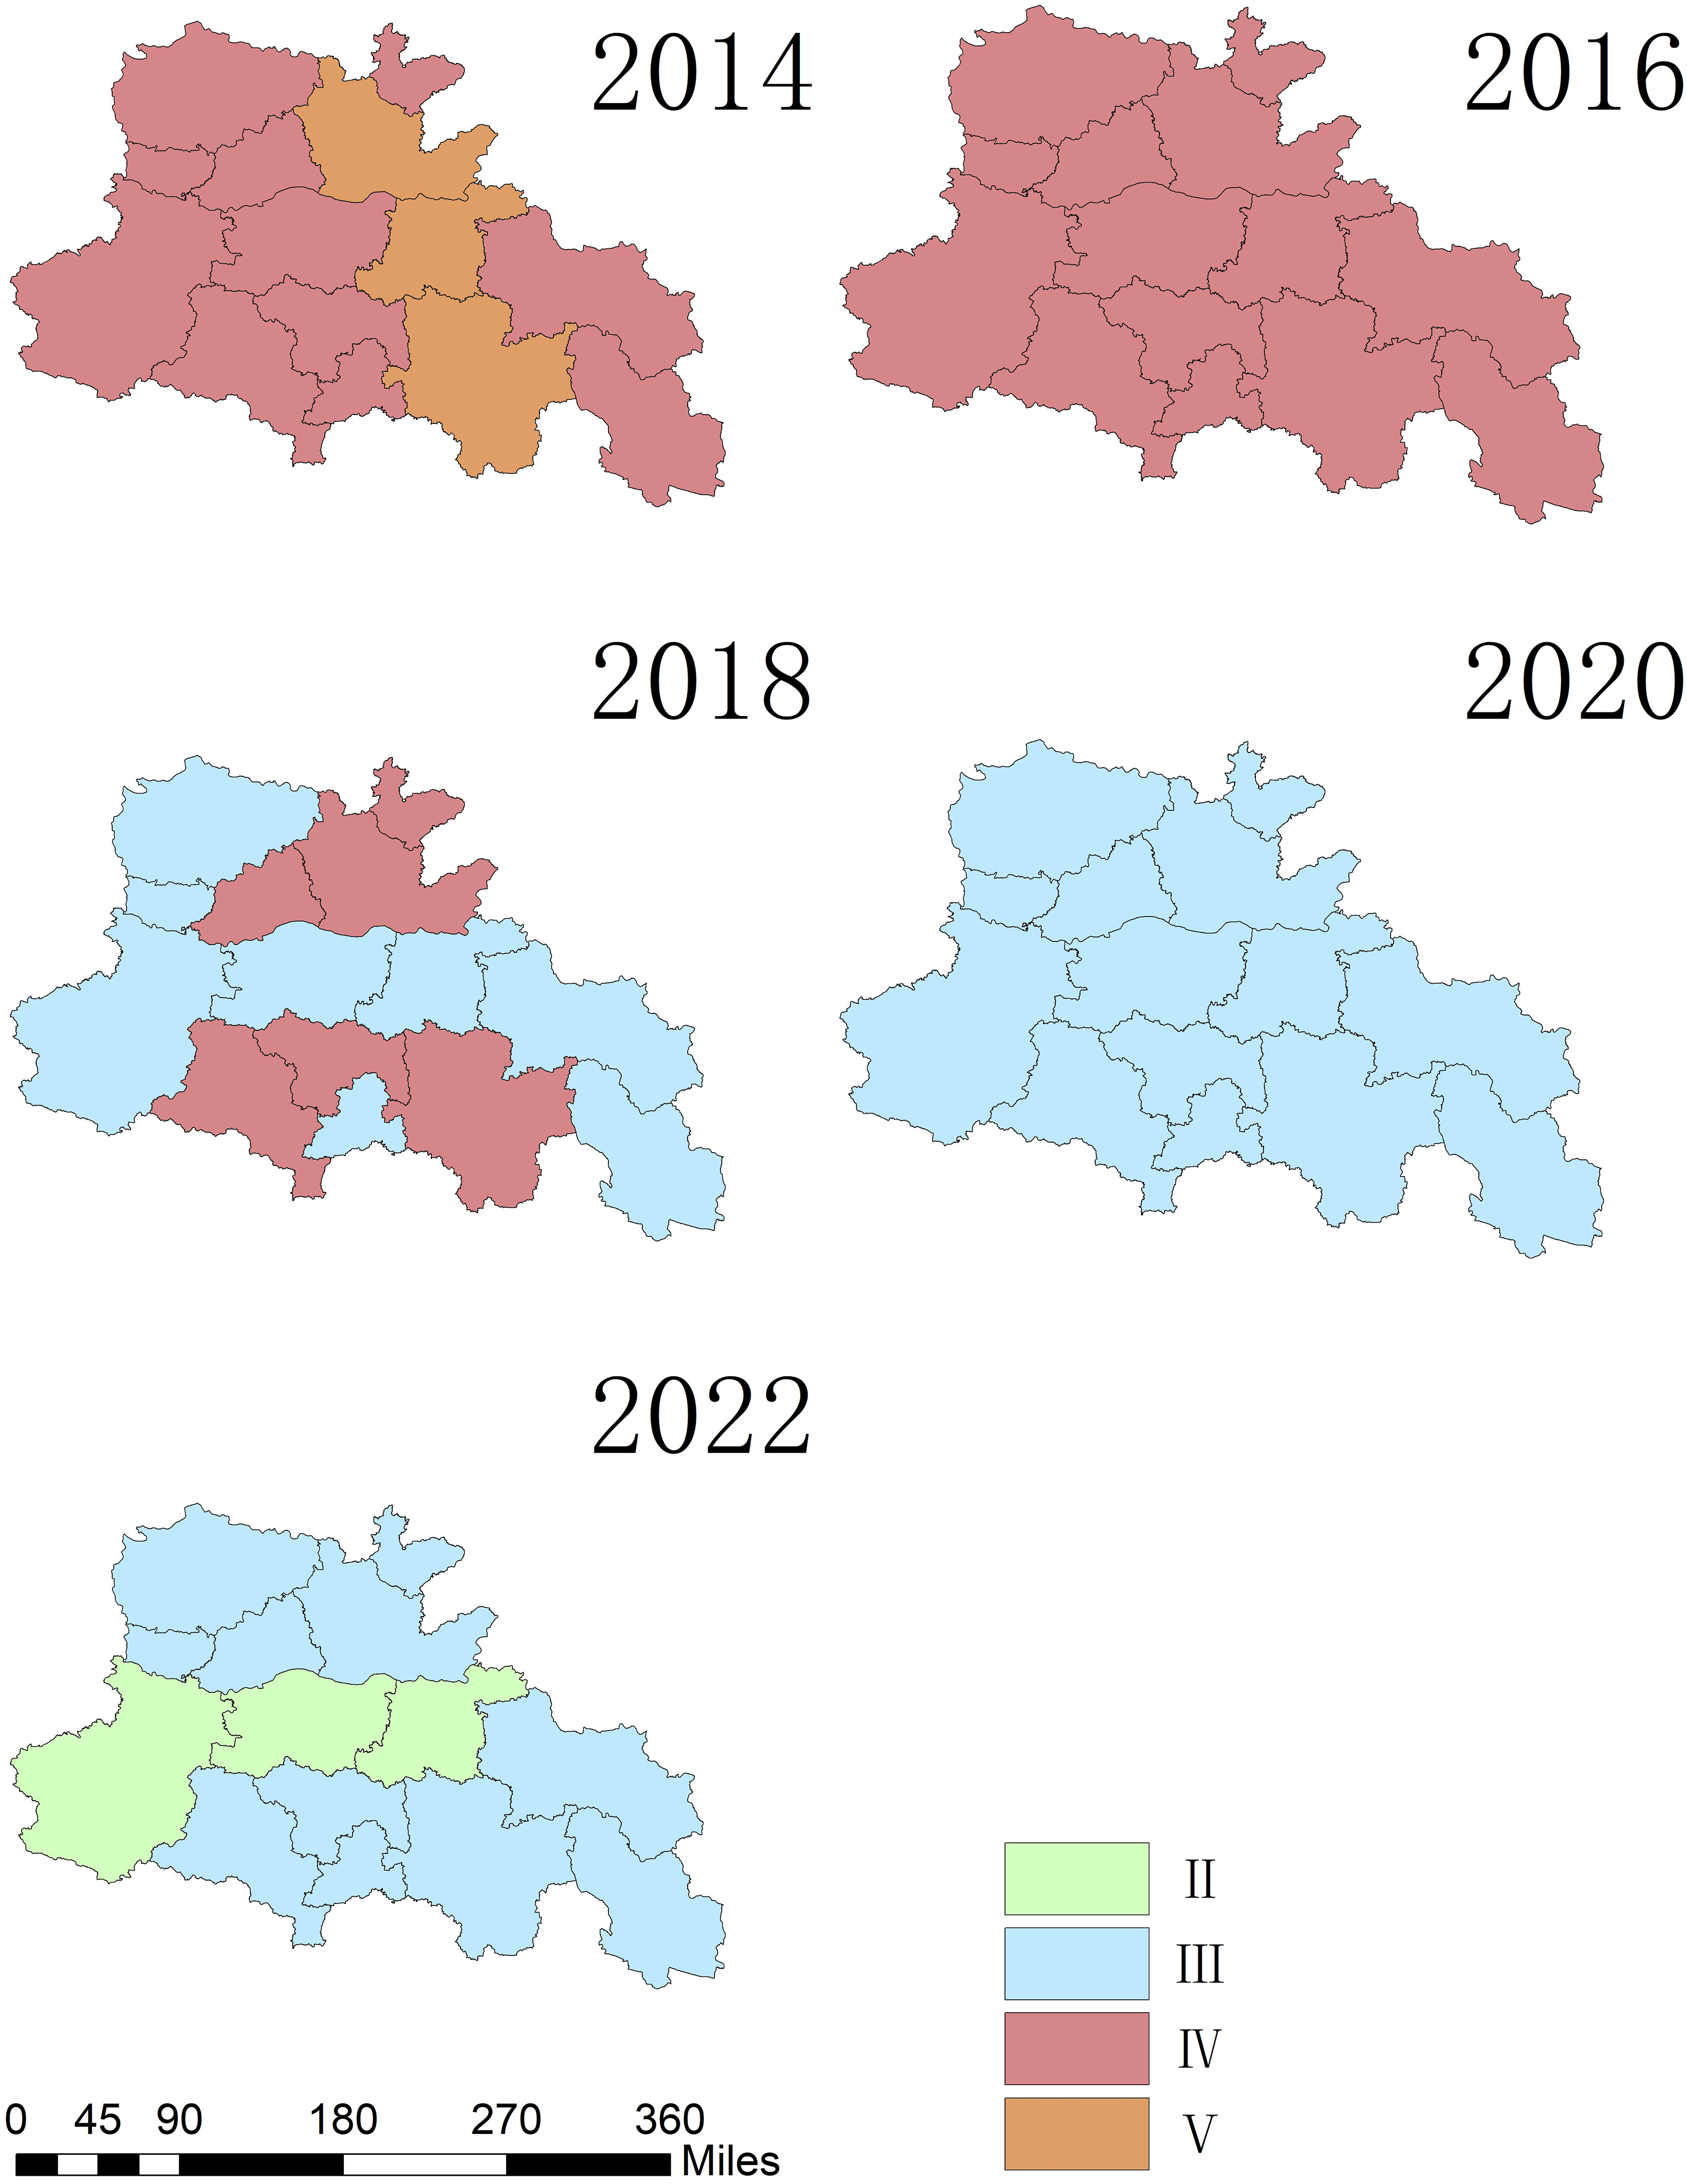
Figure 6 GIS Map of Water Ecological Health Evaluation Results in the Core Area of the Central Plains Urban Agglomeration from 2013 to 2022.
During the period from 2013 to 2015, the overall ecological health of water resources in the Central Plains Urban Agglomeration core area was relatively low. This was mainly due to the strong emphasis on socio-economic development by local governments during that period, while neglecting the protection of ecological resources such as water resources. However, the government has continuously optimized policies for the protection of ecological resources, leading to a gradual improvement in the ecological health of water resources in various cities from 2013 to 2015.
From 2016 to 2020, there was a qualitative improvement in the ecological health of water resources in the core area urban agglomeration. This was primarily because local governments gradually increased their attention to ecological resources such as water resources and implemented various related policies. The active implementation of these policies by cities greatly enhanced the ecological health of water resources.
However, in 2021, the ecological health of water resources in cities such as Zhengzhou experienced a certain degree of decline. This was mainly due to the occurrence of an extremely rare heavy rainstorm in Zhengzhou, which resulted in a daily rainfall of 552.5 millimeters from 20:00 on July 19th to 20:00 on July 20th, 2021. The extreme rainfall caused significant harm to people’s lives and property, leading to a decrease in the ecological health of water resources. Nevertheless, the implementation of smart water management and the construction of sponge cities in China have greatly mitigated the damage caused by heavy rain to the ecological environment of water resources. Additionally, the experience gained from dealing with extreme weather events during this period has greatly improved the ecological health of water resources in the core area urban agglomeration from 2021 to 2022.
The protection policies for various ecological resources in the Central Plains Urban Agglomeration core area, along with the capacity to handle extreme weather events, can provide valuable experience and theoretical basis for achieving sustainable development in urban agglomerations worldwide.
4.1.2 Analysis of factors hindering water resource ecological health in the core area of the Central Plains urban agglomeration
This study introduces the obstruction degree model and identifies eight major influencing factors that affect the ecological health of water resources in the core area of the Central Plains Urban Agglomeration. According to Figure 7, the obstruction factor with the highest impact value is the “Proportion of river length above class III water quality” (W7). This indicates that the water quality of rivers has a significant influence on the ecological health of water resources. Local governments should strengthen river protection and purification efforts and improve the capacity to purify river water quality. The average obstruction degree of “Rate of ecological water consumption” (W6) is second only to W7, suggesting that the water consumption rate for ecological environments should be increased during urban development, and efforts should be made to enhance ecological protection. The obstruction degrees of “Water resources per capita” (W2), “Water consumption per mu for farmland irrigation” (W4), “Water use per 104 Yuan of industrial production” (S3), “Water use per 104 Yuan of GDP” (S4), “Annual COD discharge” (E4), and “Percentage of forest cover” (E7) are higher compared to other selected indicators. This implies that local governments should focus on water resource protection while promoting economic development, minimize the discharge of harmful substances like COD, and improve urban greening in order to enhance the ecological health of urban water systems and achieve sustainable social development.
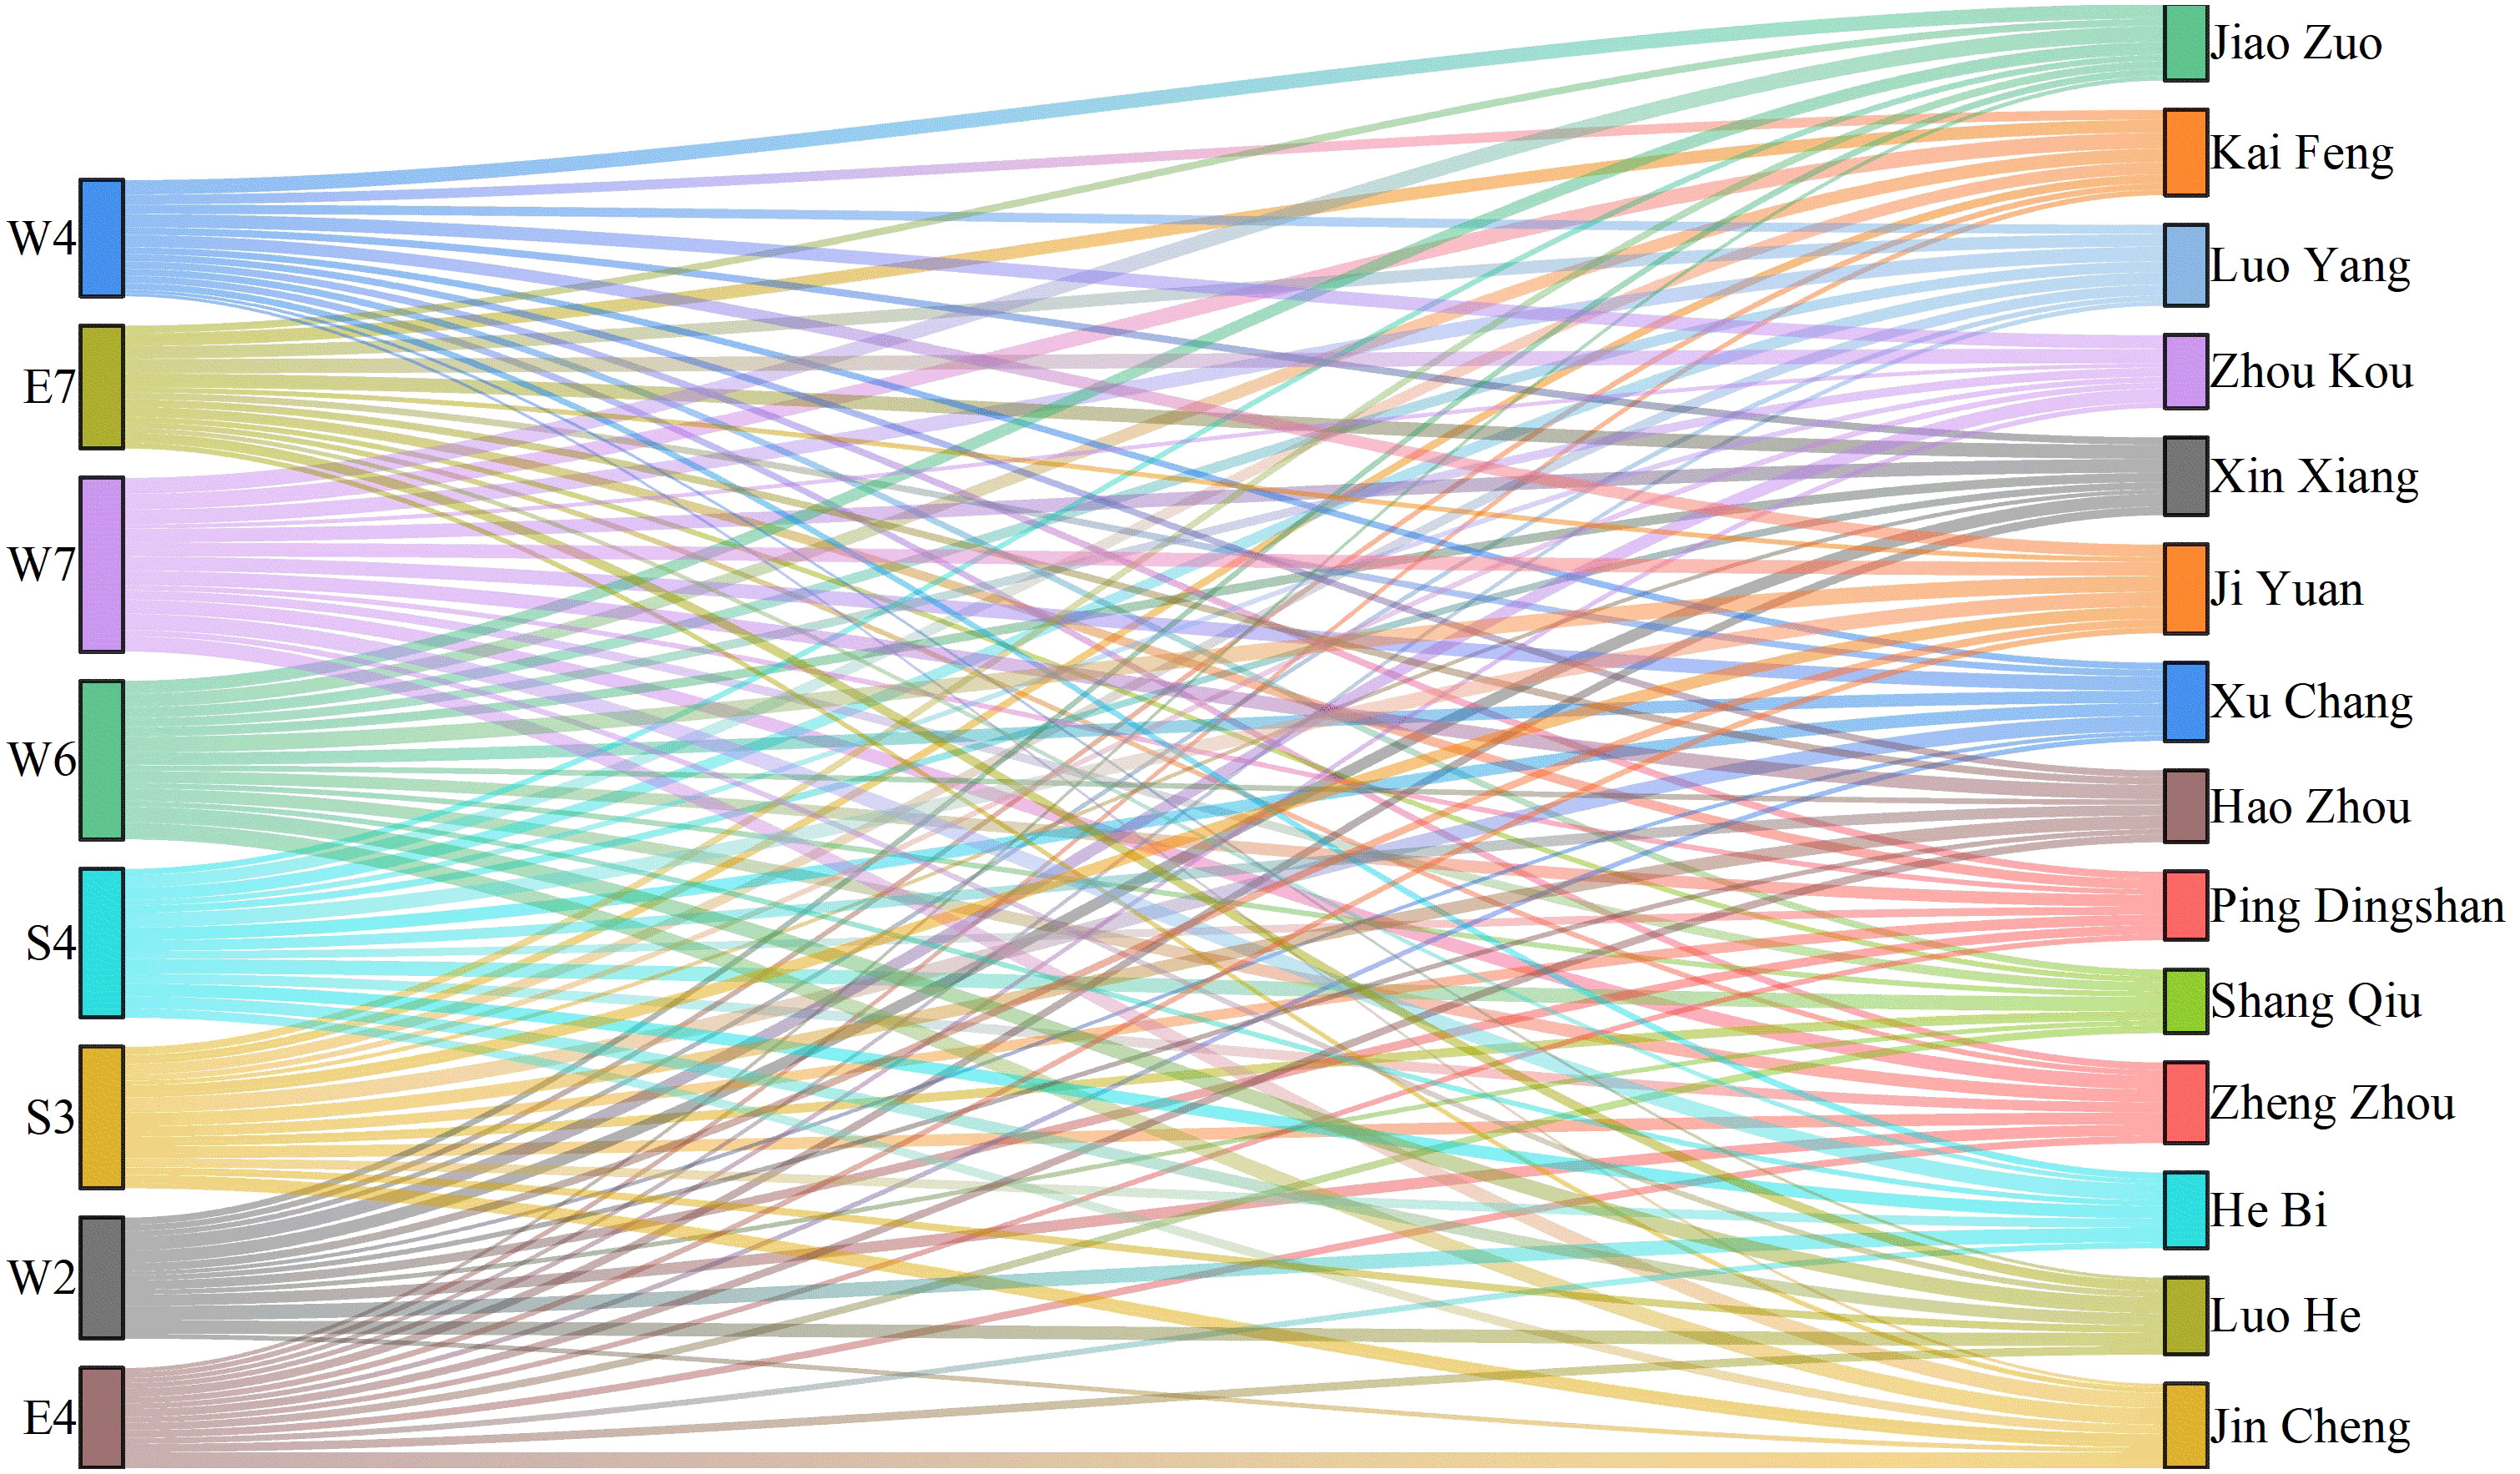
Figure 7 Water Ecological Health Obstruction Factor Results Map for the Core Area of the Central Plains Urban Agglomeration in 2022.
4.2 Discussion on the results of the barrier factor analysis
The Barrier Degree model presents a novel and comprehensive approach to understand the intricate dynamics of water ecological health in densely populated urban areas like the Central Plains agglomeration. One of the primary strengths of this model is its emphasis on identifying specific hindering factors, which can pave the way for targeted interventions. This targeted approach, coupled with broad-spectrum solutions like green urban development, underscores the need for cities to harmoniously blend nature with urbanization. The concept of ‘sponge cities’, for instance, resonates with the idea of harnessing nature-based solutions to urban challenges, marking a departure from traditional engineering-heavy methods. Furthermore, the model’s recommendation on shifting the focus of water usage towards ecological purposes emphasizes the importance of viewing water not merely as a resource for consumption but as an integral part of urban ecosystems. With rapid urbanization and changing climate patterns posing significant challenges to water security, the Barrier Degree model serves as a timely reminder of the need for innovative, holistic, and environmentally-aligned strategies in urban water management. It will be interesting to see how cities adopt and adapt these recommendations in the years to come, and the resultant impacts on water ecological health.
5 Conclusions
This article adopts the Water Resources - Socio-Economic - Ecological Environment model framework to construct an evaluation index system for the water ecological health level in the core area of the Central Plains urban agglomeration. The system includes three criterion layers and 22 indicator layers. Based on this, the Improved Entropy Weighting Method is used to calculate the weights of the indicators. Combining these weights with the ITOPSIS model, the water ecological health conditions of a total of 14 cities in the core area of the Central Plains urban agglomeration from 2013 to 2022 are evaluated. By introducing the Barrier Degree model, the eight main influencing factors of the water ecological health level in the core area of the Central Plains urban agglomeration in 2022 are calculated. The following conclusions are drawn:
1. The overall water resource ecological health level in the core area of the Central Plains urban agglomeration from 2013 to 2022 showed a generally improving trend. Although there were a few cities that experienced a decline in water resource ecological health in 2021 due to the influence of extreme weather, proactive measures taken by the government quickly restored the water resource ecological health level to its normal and steadily improving state. The promotion of smart water management and the ability to handle extreme weather in the Central Plains urban agglomeration can serve as a theoretical basis for cities worldwide.
2. The introduction of the Barrier Degree model helps to deepen the understanding of the formation mechanism and key factors of the water ecological health level in the core area of the Central Plains urban agglomeration. According to the Barrier Degree model, the eight major hindering factors indicate that cities should focus on green urban development while promoting the construction of smart water management systems and sponge cities. In terms of water usage, it is important to promote water-saving appliances and shift the emphasis of water usage towards ecological environmental purposes, in order to enhance the health level of water resources and the ecological environment. This study provides an evaluation index system and methodology for assessing the water ecological health level in the core area of the Central Plains urban agglomeration, and offers scientific basis for relevant decision-making and management.
Data availability statement
The raw data supporting the conclusions of this article will be made available by the authors, without undue reservation.
Author contributions
JL: Conceptualization, Data curation, Writing – original draft. MZ: Formal Analysis, Funding acquisition, Investigation, Writing – review & editing. YH: Methodology, Project administration, Resources, Writing – original draft. JW: Software, Supervision, Validation, Visualization, Writing – review & editing.
Funding
The author(s) declare financial support was received for the research, authorship, and/or publication of this article. This research was funded by the National Natural Science Foundation of China (52009045) and Postdoctoral funding in Henan Province (202102086).
Conflict of interest
Author MZ was employed by the Yellow River Survey Planning and Design Institute Co., Ltd.
The remaining authors declare that the research was conducted in the absence of any commercial or financial relationships that could be construed as a potential conflict of interest.
Publisher’s note
All claims expressed in this article are solely those of the authors and do not necessarily represent those of their affiliated organizations, or those of the publisher, the editors and the reviewers. Any product that may be evaluated in this article, or claim that may be made by its manufacturer, is not guaranteed or endorsed by the publisher.
Supplementary material
The Supplementary Material for this article can be found online at: https://www.frontiersin.org/articles/10.3389/fevo.2023.1263601/full#supplementary-material
References
Bertrand L., Iturburu F. G., Valdés M. E., Menone M. L., Amé M. V. (2023). Risk evaluation and prioritization of contaminants of emerging concern and other organic micropollutants in two river basins of central Argentina. Sci. total Environ. doi: 10.1016/J.SCITOTENV.2023.163029
Chen N., Guo H., Xiang H. (2023). Evaluation of urban resilience level and analysis of obstacle factors: A case study of Hunan Province, China. Front. Earth Sci. doi: 10.3389/FEART.2022.1033441
Huang B., Lu F., Wang X., Wu X., Zheng H., Su Y., et al. (2023). The impact of ecological restoration on ecosystem services change modulated by drought and rising CO2. Global Change Biol. doi: 10.1111/GCB.16825
Li W., Sha D., Sui J. (2023). Research on fuzzy comprehensive evaluation of the quality of teaching work in teaching and research offices. Front. Educ. Res. (10). doi: 10.25236/FER.2023.061011
Li M., Wang G., Li H., Chen T., Tang S. (2023). Identifying the optimization potential for urban GI by linking supply and demand of ecosystem services under multi-scenarios a case study of Tianjin, China. Ecol. Indic. doi: 10.1016/J.ECOLIND.2023.110570
Lu Q., Hua D., Li Y., Wang D. (2022). Estimation of water resource ecosystem service value inTarim river basin—From a full value chain perspective. Water (15). doi: 10.3390/W14152355
Melstrom R. T., Malone T. (2023). Voter evaluations regarding the tradeoffs between agricultural production and water quality in Lake Erie. Agric. Water Manage. doi: 10.1016/J.AGWAT.2023.108449
Mohammadyari F., Tavakoli M., Zarandian A., Abdollahi S. (2023). Optimization land use based on multi-scenario simulation of ecosystem service for sustainable landscape planning in a mixed urban - Forest watershed. Ecol. Model. doi: 10.1016/J.ECOLMODEL.2023.110440
Mu W., Zhu X., Ma W., Han Y., Huang H., Huang X. (2023). Impact assessment of urbanization on vegetation net primary productivity: A case study of the core development area in central plains urban agglomeration, China. Environ. Res. doi: 10.1016/J.ENVRES.2023.115995
Peng J., Liu T., Chen J., Li Z., Ling Y., De Wulf A., et al. (2023). The conflicts of agricultural water supply and demand under climate change in a typical arid land watershed of Central Asia. J. Hydrol.: Region. Stud. doi: 10.1016/J.EJRH.2023.101384
Sun S., Lü Y., Fu B. (2022). Relations between physical and ecosystem service flows of freshwater are critical for water resource security in large dryland river basin. Sci. total Environ. (P3). doi: 10.1016/J.SCITOTENV.2022.159549
Tefera G. W., Dile Y. T., Srinivasan R., Baker T., Ray R. L. (2023). Hydrological modeling and scenario analysis for water supply and water demand assessment of Addis Ababa city, Ethiopia. J. Hydrol.: Region. Stud. doi: 10.1016/J.EJRH.2023.101341
van Dijk A. I.J.M., Beck H. E., Crosbie R. S., de Jeu R. A.M., Liu Y., Podger G. M., et al. (2013). The Millennium Drought in southeast Australia, (2001–2009): Natural and human causes and implications for water resources, ecosystems, economy, and society. Water Resour. Res. (2). doi: 10.1002/wrcr.20123
Xi L., Qin Z., Feng Y. (2022). The improved entropy weighting model in water quality evaluation based on the compound function. Environ. Monit. Assess. (9). doi: 10.1007/S10661-022-10304-4
Xu C., Xu Z., Cai Y., Zhu Z., Tan Q. (2023). Impact of reservoir operation policies on nitrogen cycling processes and water quality dynamics in a large water supply reservoir. J. Clean. Product. doi: 10.1016/J.JCLEPRO.2023.137975
Yang J., Chen F., Wang Y., Mao J., Wang D. (2023). Performance evaluation of ecological transformation of mineral resource-based cities: From the perspective of stage division. Ecol. Indic. doi: 10.1016/J.ECOLIND.2023.110540
Yang H., Tan Y., Sun X., Cheng X., Liu G., Zhou G. (2021). Comprehensive evaluation of water resources carrying capacity and analysis of obstacle factors in Weifang City based on hierarchical cluster analysis-VIKOR method. Environ. Sci. pollut. Res. Int. 36. doi: 10.1007/S11356-021-14236-3
Zeng J., Cui Y., Du X., Wei Y., Zhang L., Li Y., et al. (2023). The spatial and temporal evolution of water resources ecological footprint and ecological carrying capacity in the Shiyang river basin, China. Environ. Res. Ecol. J. (3). doi: 10.23977/EREJ.2023.070308
Zhang S., Fan W., Yi Y., Liu J. (2017). Evaluation method for regional water cycle health based on nature-society water cycle theory. J. Hydrol., 352–364. doi: 10.1016/j.jhydrol.2017.06.013
Zhang Q., Sun J., Zhang G., Liu X., Wu Y., Sun J., et al. (2023). Spatiotemporal dynamics of water supply–demand patterns under large-scale paddy expansion: Implications for regional sustainable water resource management. Agric. Water Manage. doi: 10.1016/J.AGWAT.2023.108388
Zhang S., Xiang M., Xu Z., Zhang C. (2020). Evaluation of water cycle health status based on a cloud model. J. Clean. Product., 118850. doi: 10.1016/j.jclepro.2019.118850
Zhao M., Li J., Zhang Y., Han Y., Wei J. (2023). Water cycle health assessment based on combined weight and hook trapezoid fuzzy TOPSIS model: A case study of nine provinces in the Yellow River basin, China. Ecol. Indic. doi: 10.1016/J.ECOLIND.2023.109977
Zhao M., Li J., Zhang J., Han Y., Cao R. (2022). Research on evaluation method for urban water circulation health and related applications: A case study of Zhengzhou city, Henan province. Int. J. Environ. Res. Public Health 17. doi: 10.3390/IJERPH191710552
Zhao Z., Zhou Y., Wang X., Wang Z., Bai Y. (2022). Water quality evolution mechanism modeling and health risk assessment based on stochastic hybrid dynamic systems. Expert Syst. Appl. doi: 10.1016/J.ESWA.2021.116404
Keywords: water resource ecological, WSE model framework, analysis of obstruction factors, the Central Plains urban agglomeration core area, policy suggestion
Citation: Li J, Zhao M, Han Y and Wei J (2023) Analysis of water resource ecological optimization and obstacles based on the water resources – socio – economic – ecological environment model framework – a case study of the core area of the Central Plains urban agglomeration. Front. Ecol. Evol. 11:1263601. doi: 10.3389/fevo.2023.1263601
Received: 20 July 2023; Accepted: 12 October 2023;
Published: 27 October 2023.
Edited by:
Hualin Xie, Jiangxi University of Finance and Economics, ChinaReviewed by:
Zhongfan Zhu, Beijing Normal University, ChinaYing Zhu, Xi’an University of Architecture and Technology, China
Copyright © 2023 Li, Zhao, Han and Wei. This is an open-access article distributed under the terms of the Creative Commons Attribution License (CC BY). The use, distribution or reproduction in other forums is permitted, provided the original author(s) and the copyright owner(s) are credited and that the original publication in this journal is cited, in accordance with accepted academic practice. No use, distribution or reproduction is permitted which does not comply with these terms.
*Correspondence: Mengdie Zhao, emhhb21lbmdkaWVAbmN3dS5lZHUuY24=