 Yinan Wang
 Xiangbing Kong
 Kai Guo
95% of researchers rate our articles as excellent or good
Learn more about the work of our research integrity team to safeguard the quality of each article we publish.
Find out more
ORIGINAL RESEARCH article
Front. Ecol. Evol. , 27 December 2023
Sec. Interdisciplinary Climate Studies
Volume 11 - 2023 | https://doi.org/10.3389/fevo.2023.1261210
In this paper, we investigate the features of spatiotemporal change in fractional vegetation cover (FVC) throughout the Yellow River Basin between 2000 and 2022 and identify the driving factors behind the change using the MODIS normalized difference vegetation index (NDVI) as a data source. On that basis, our research involves trend analysis and the center migration model to examine the correlation between vegetation cover changes and various factors, such as climates, topographies, soils, and human activities. In this way, we aim to uncover how such correlation contributed to the reduction in suspended sediment concentration (SSC) in surface runoff. Results suggest that (1) the FVC of the Yellow River Basin has been trending upward over the past 23 years, and vegetation growth has been remarkably improved; (2) the center of medium-high and denser vegetation cover has progressively migrated from the upper reaches of the Yellow River down to its middle-lower segments; (3) soil erosion control measures are critical to improve vegetation cover, given the great impact of the shifting natural elements on vegetation cover changes on a local basis; (4) an improvement in vegetation cover leads to considerable positive change in the runoff and SSC of the Yellow River mainstem. This study has yielded noteworthy contributions in correctly understanding the current vegetation changes and related factors in the Yellow River Basin. Furthermore, it has laid the groundwork for further research in improving the accuracy of basic data and deepening the correlation between factors.
As the “cradle” of Chinese civilization spanning millennia, the Yellow River Basin has been the political and cultural center of China. However, given its vulnerable ecosystems with prominent soil erosion, its water management has been a top priority since the pre-Qin period (221 BC). Integral to the terrestrial ecosystem, above-ground vegetation can decrease the kinetic energy of raindrops, diminish the flood peak, and delay runoff while enhancing soil erosion resistance and reducing soil erosion (Zou et al., 1981; Zhong and Cheng, 2001; Wu, 2005; Wang and Shi, 2022; Liu et al., 2023; Wei et al., 2023). Fractional vegetation cover (FVC) has long been used as an indicator for above-ground vegetation cover and growth status (Gitelson et al., 2002; Peng et al., 2017; Cui et al., 2022; Ren et al., 2023). Research on FVC changes in the Yellow River Basin carries great importance in evaluating achievements of basin management, tackling management conundrums, and developing follow-up plans, as it showcases how the Yellow River has been managed. As a ratio between the reflectance recorded in the near-infrared (NIR) and red (R) bands of remote-sensing imagery, the normalized difference vegetation index (NDVI) can best indicate the growth status, spatial distribution, and density of vegetation (Pettorelli, 2005; Li and He, 2009; Li and Zhang, 2023; Wang et al., 2023). Therefore, it is extensively employed to study vegetation growth status on a regional and global basis as basic data for FVC calculation (Mu et al., 2012; Hou et al., 2022; Shen et al., 2022; Wang et al., 2022; Yin et al., 2022).
Research on changes in vegetation throughout the Yellow River Basin has been productive. By leveraging AVHRR-NDVI data (a spatial resolution of 8 km), Sun et al. (2001) and Yang et al. (2002) explored spatial changes in the Yellow River Basin’s vegetation cover from 1982 through 1999 and their correlation with rainfall. They discovered that the basin’s FVC had been on an upward trend over the two decades and that interannual variations in vegetation cover were dominated by the amount of rainfall in flood seasons. With MOD3Q1 data (a spatial resolution of 250 m), Yuan et al. (2013) examined the spatiotemporal features of the NDVI of vegetated areas in the Yellow River Basin between 2000 and 2010 and profiled how the index changed under trend analysis and the M-K test. Their results indicated that the NDVI of the basin’s vegetated areas had registered rapid growth since 2005, with improved areas much larger than degraded ones. Building on SPOT-VGT data (a spatial resolution of 1 km) between 1998 and 2011, He and He (2012) explored the spatiotemporal distribution, temporal change features, and interannual variation trends of the NDVI of the Yellow River Basin before concluding that an increasing NDVI of the basin throughout the research period had fundamentally improved the environment. Liu et al. (2019) investigated the NDVI changes in the Yellow River source region from 2000 to 2016 and its contributing factors using MODIS-NDVI statistics. During the research period, they found that there was no abrupt NDVI change in the region and that meteorological factors remarkably facilitated the growth of vegetation in the region.
Based on MODIS-NDVI data, pixel dichotomy, transition matrix, and the center migration model, we understood and profiled the spatiotemporal distribution and change patterns of vegetation cover in the Yellow River Basin for the past two decades. On that basis, data such as temperatures, rainfalls, soils, topographies, and human activities were utilized to dissect the catalysts for the spatiotemporal change in the FVC of the basin over the last 23 years under the center migration model of migration and analyses involving the transition matrix and partial correlation. This study can provide scientific basis and decision-making support for the high-quality development of soil and water conservation in the Yellow River Basin in the future.
As is shown in Figure 1, the Yellow River originates from the Yueguzonglie Basin on the north foot of the Bayan Har mountains of the Qinghai-Tibet Plateau, traveling through the provinces and autonomous regions of Qinghai, Sichuan, Gansu, Ningxia, Inner Mongolia, Shanxi, Shaanxi, Henan, and Shandong into the Bohai Sea in Shandong’s Kenli County, with a total length of 5,646 km. The expansive Yellow River Basin (32°35’~41°49’N; 95°10’~119°06’E) covers an area of 795,000 km2 (including the endorheic area of 42,000 km2). The basin has a significant altitude difference and is topographically high in the west and low in the east, descending like a three-step staircase from the Qinghai-Tibet Plateau and the Inner Mongolian Plateau eastward to the Loess Plateau and the North China Plain (Yellow River Conservancy Commission of MWR, 2011a; Yellow River Conservancy Commission of MWR, 2011b). The Yellow River Basin is overall marked by a continental climate, with a sub-humid climate in the southeast, a semi-arid climate in the central region, and an arid climate in the northwest. The emergence and growth of various vegetation types are attributed to the diverse landforms and complex natural habitats the basin offers (Liu and Xiao, 2006). From southeast to northwest, natural vegetation within the basin is represented by the forest steppe, dry steppe, and desert steppe, respectively (He et al., 2010). All the abovementioned features have created diverse ecosystems.
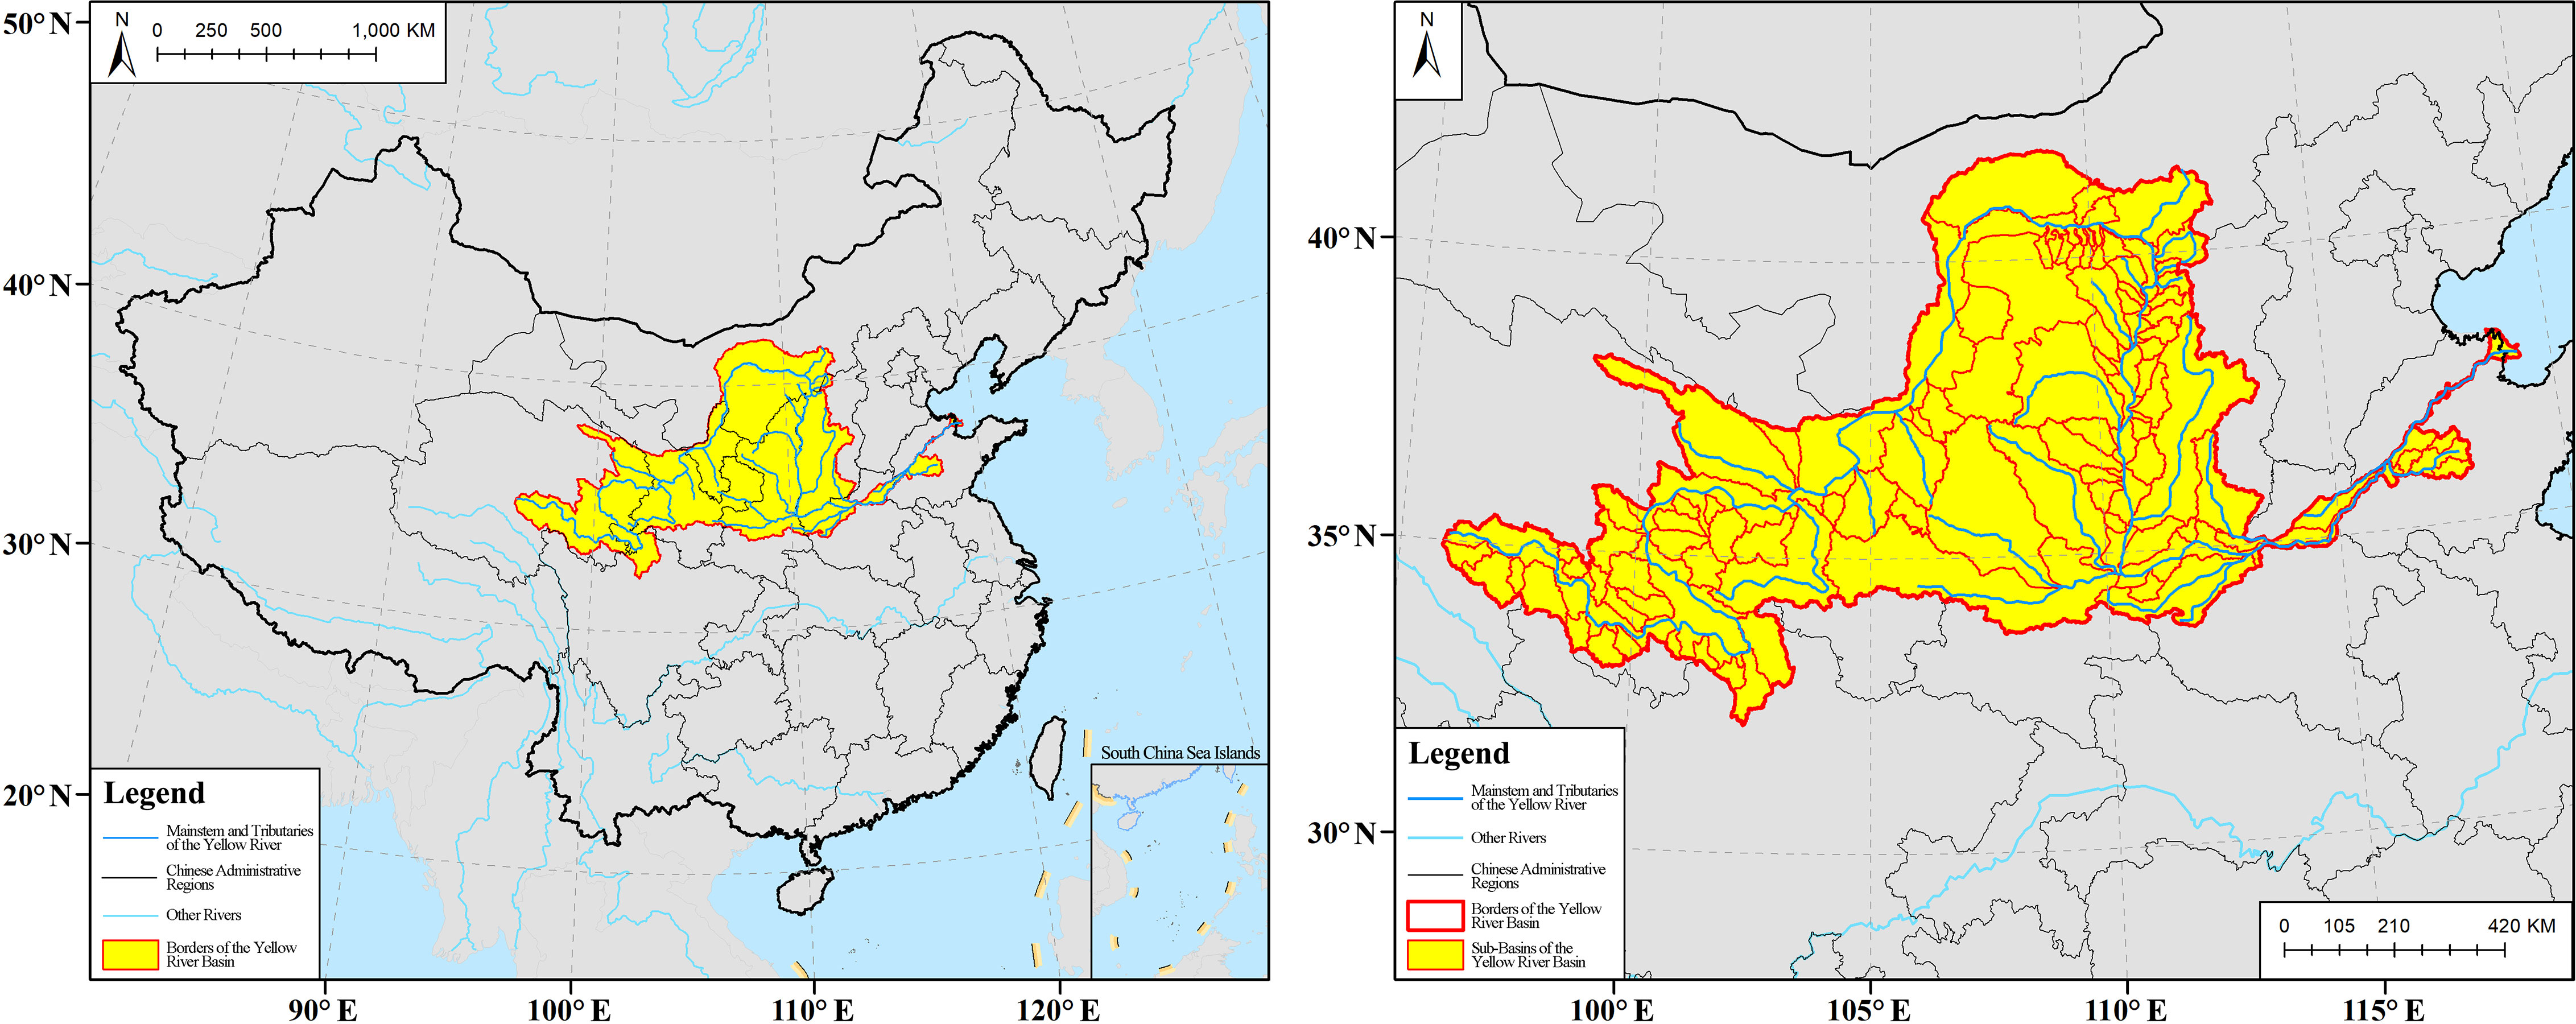
Figure 1 Schematic diagrams of the Yellow River Basin.
Data on vegetation and relevant factors were employed in our research. Based on the MODIS-NDVI provided by the Earth Resource Observation System Data Center in the US (https://ladsweb.modaps.eosdis.nasa.gov/), we obtained the NDVI dataset for the June-to-September period between 2000 and 2022 using data extraction and maximum-value composite procedures, with the data serial number as MOD13Q1. Land use data were sourced from GlobeLand30 datasets (http://www.globallandcover.com/) and specifically for the years 2000, 2010, and 2020. Statistics on temperature, rainfall, and evapotranspiration came from monthly datasets (a spatial resolution of 1 km) offered by the National Tibetan Plateau Data Center (http://data.tpdc.ac.cn/) for the June-to-September period from 2000 and 2020, and the datasets on these factors were generated yearly under the methods of data conversion and maximum-value composite. The elevation data for the Yellow River Basin were generated under the digital elevation model (DEM) from the Geospatial Data Cloud (http://www.gscloud.cn/), having undergone operations such as mosaicking and clipping. On this basis, slope and aspect statistics were calculated. Datasets on soil in the Yellow River Basin were produced through projection and clipping based on data from the Scientific Data Center of the Chinese Academy of Sciences (http://www.scdb.cn/). Topographic factor data, including topographic relief amplitude, together with data on soil erosion, areas of and projects on water and soil conservation in the basin, were obtained from the National Cryosphere Desert Data Center (http://www.ncdc.ac.cn/).
As a crucial indicator for measuring the extent of vegetation cover on the Earth’s surface, FVC exhibits a strong positive correlation with the NDVI. By utilizing a dimidiate pixel model, we calculated FVC based on NDVI data under the inversion model (Meroni et al., 2019). The equation for calculating FVC is presented as follows:
where FVC stands for fractional vegetation cover; NDVIi represents the NDVI value of a given pixel for the corresponding period; NDVImin and NDVImax are the minimum and maximum NDVI values at the confidential intervals (Jia et al., 2013) ranging from 5% to 95% in the corresponding area.
Building on the established FVC grading standards and methods (Li et al., 2018; Rhyma et al., 2020) and considering vegetation features in the research area, we divided the area’s vegetation types into sparse vegetation (FVC ≤ 0.3), medium-low vegetation (0.3 < FVC ≤ 0.45), medium vegetation (0.45 < FVC ≤ 0.6), medium-high vegetation (0.6 < FVC ≤ 0.75), and high vegetation (FVC > 0.75), as is shown in Figure 2.

Figure 2 Vegetation cover types in the Yellow River Basin in 2022.
With available data spanning from 2000 through 2022, we measured how the FVC of the Yellow River Basin had varied, and based on its variation, categorized the region into the area with an extremely significant increase (variation value > 0.5), area with a significant increase (0.5 ≥ variation value > 0.3), area with non-apparent change (0.3 ≥ variation value > −0.3), area with a significant decrease (−0.3 ≥ variation value > −0.5), and area with an extremely significant decrease (variation value ≤ −0.5) (Idowu et al., 2020). As is shown in Figure 3, such division facilitated an analysis of the changing FVC.
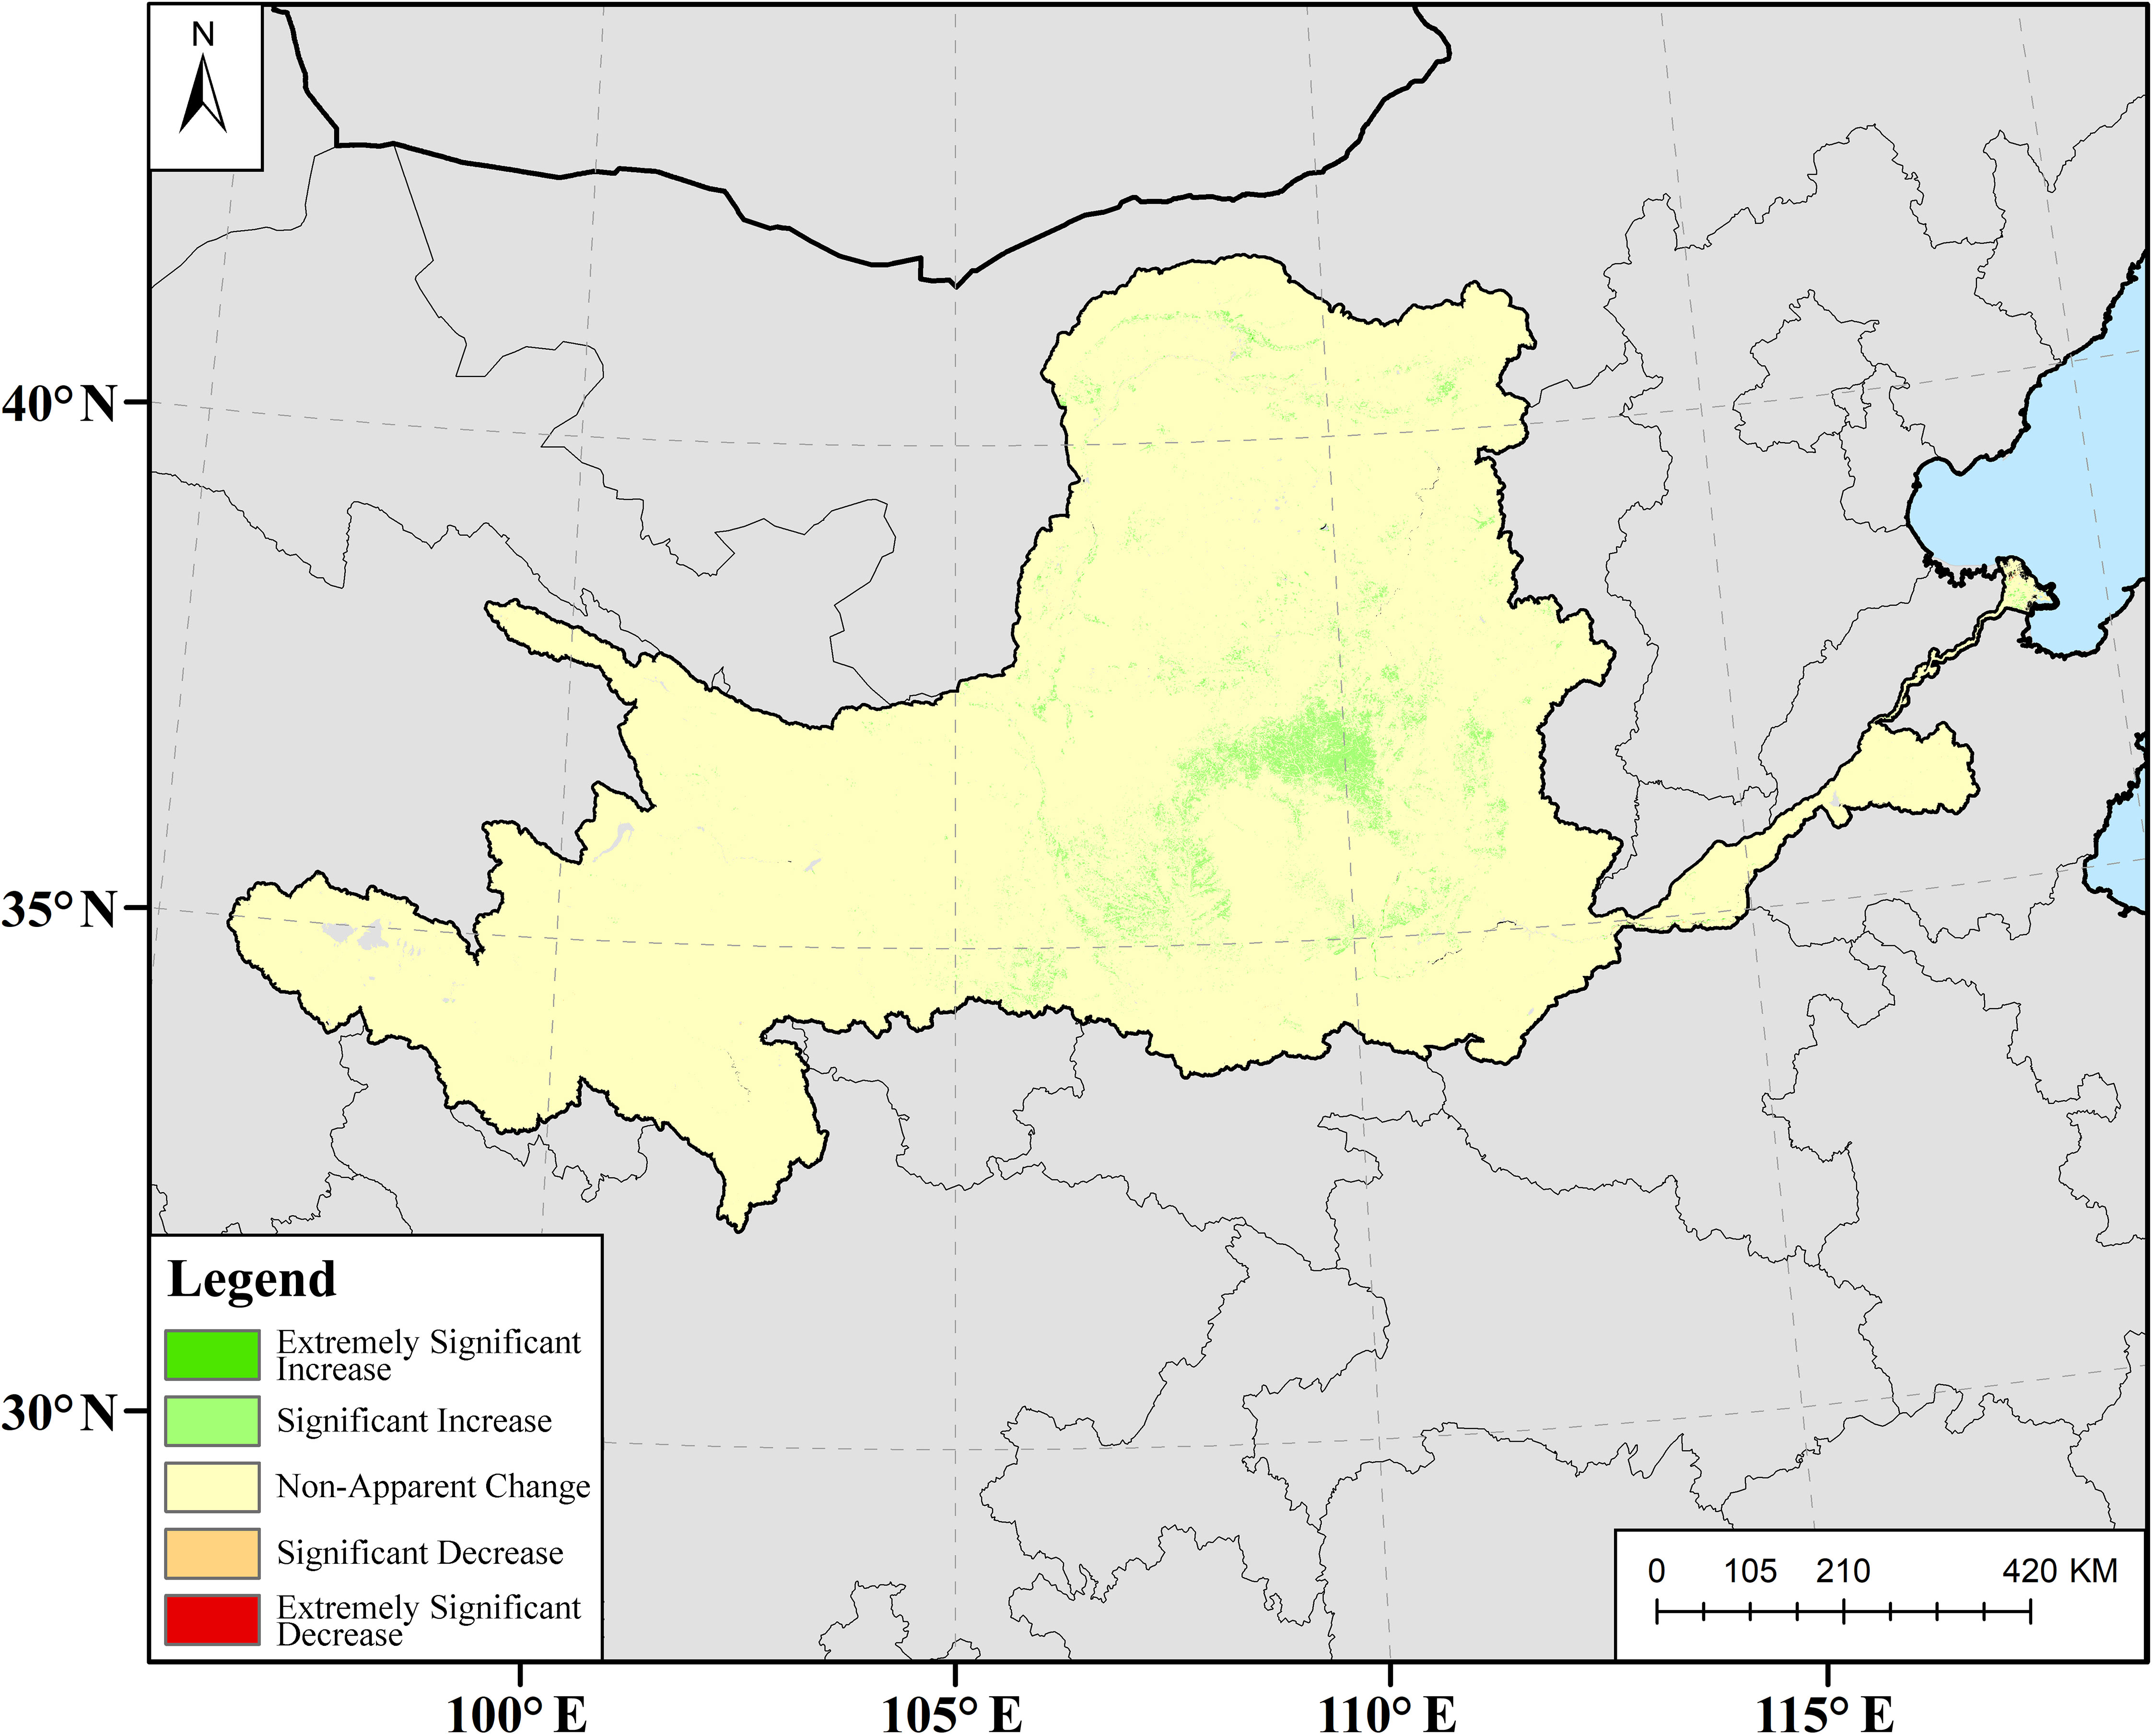
Figure 3 FVC changes in the Yellow River Basin for the research period.
Factors, such as climate, soil, topography, and human activity, can lead to a change in FVC (Liu et al., 2016; Xie, 2016). To investigate the correlation between FVC changes and various factors in the Yellow River Basin, the collected factor data were processed in this study. The processing involved rasterizing and spatially referencing the factor data to align with the spatial location of FVC data. Furthermore, all factor data were resampled to keep spatial resolution consistent with FVC data. To deliver accurate analysis results, the factor data were dimensionalized (Mu et al., 2018).
Trend analysis presents how a region has experienced spatiotemporal evolution, as it can show overall spatial change patterns based on the changing trends of individual pixels over time (Liu and Du, 2015; Hashemi et al., 2016; Zhang et al., 2016). As the calculated FVC results are processed under simple linear regression, the slope (S) of the equation represents the changing trend of each raster pixel. When S > 0, it indicates an upward trend of FVC values over time for the corresponding raster pixel, while a downward trend will show in the S < 0 scenario.
As is displayed above, S is the slope of the regression equation of FVC for a single pixel; pi denotes the FVC value for the year i; n represents the number of years in the research period.
A t-test was conducted to test the significance of pixel-by-pixel changes (Wu et al., 2014), and when the significance level P was less than 0.05, the trend was considered significant, while P smaller than 0.01 was deemed extremely significant. To better evaluate the significance of FVC changes in the Yellow River Basin, the calculation results were classified into four levels based on S and P (Guo et al., 2014): significantly improved (S ≥ 0 and P < 0.05), not significantly improved (S ≥ 0 and P ≥ 0.05), not significantly deteriorated (S < 0 and P > 0.05), and significantly deteriorated (S < 0 and P ≤ 0.05).
In a transition matrix, the transition probability of the area between image pixels acts as an element, and the matrix model is:
where each element, expressed as Pij, is a transition probability of vegetation cover type i developing into type j. With Pij, it is non-negative, and the sum of each line of elements amounts to one.
While quantifying the mutual transformation between vegetation cover types, the transition matrix can also reveal their transition probabilities to more accurately capture the spatiotemporal variation of vegetation cover (Zhou et al., 2010). By calculating the confusion matrix of vegetation cover types in the Yellow River Basin in 2000 and 2022, we developed the FVC transition matrix that reflects the quantitative relationship of the mutual transformations between vegetation cover types.
Upon measuring the center (or “barycenter”) of all designated vegetation cover types for different periods, we could spatially describe how the FVC of each type had changed over time and would migrate going forward (Zhou, 2020). The barycentric coordinates and migration distance of vegetation plaques for the year t are expressed as:
where Xt and Yt are the longitude and latitude of the barycenter of a certain vegetation cover type’s plaque for the year t; Xi and Yi denote the coordinates of the geometric center of the plaque i in the vegetation cover type for the year t, respectively; Cti suggests the area of the plaque i in the vegetation cover type for the year t; n represents the number of plaques in the vegetation cover type for the year t; D is migration distance; ΔXt and ΔYt imply the longitude and latitude changes in the barycenter of the vegetation cover type for the year t.
Partial correlation analysis observes the extent to which two variables relate to each other without considering the impact of other factors. When investigating the extent of the interrelation between two factors within a model or system containing numerous factors, with the influence of other elements held constant, the analytical outcomes are denoted as partial correlation coefficients (Xu, 2022), as shown below:
where rxy·z is the partial correlation coefficient of variables x and y, with variable z unchanged; rxy represents the correlation coefficient of variables x and y; rxz indicates the correlation coefficient of variables x and z; ryz denotes the correlation coefficient of variables y and z.
The statistical analysis of the mean and standard deviation of the Yellow River Basin’s FVC between 2000 and 2022 is presented in Figure 4. Compared to the year 2000, the FVC mean had overall trended upward with slight fluctuations for 23 years. Specifically, there was a drop between 2000 and 2001, and a surge in the following two years before a moderate decrease during the 2002–2005 period; the subsequent years (2006–2011) followed the same pattern as the previous four years, except for the fact that it witnessed a slight increase in the FVC mean; from 2012 through 2015, the value increased significantly, followed by a slow drop, with the lowest level being comparable to the highest for the previous six years; the 2016–2022 period saw a substantial increase in the FVC mean after initial recovery four years before, and the value had remained within a relatively high range with slight fluctuations over the four years ending in 2022. The minimum and maximum mean values of FVC were observed in 2001 (0.4831) and 2020 (0.5975), respectively.
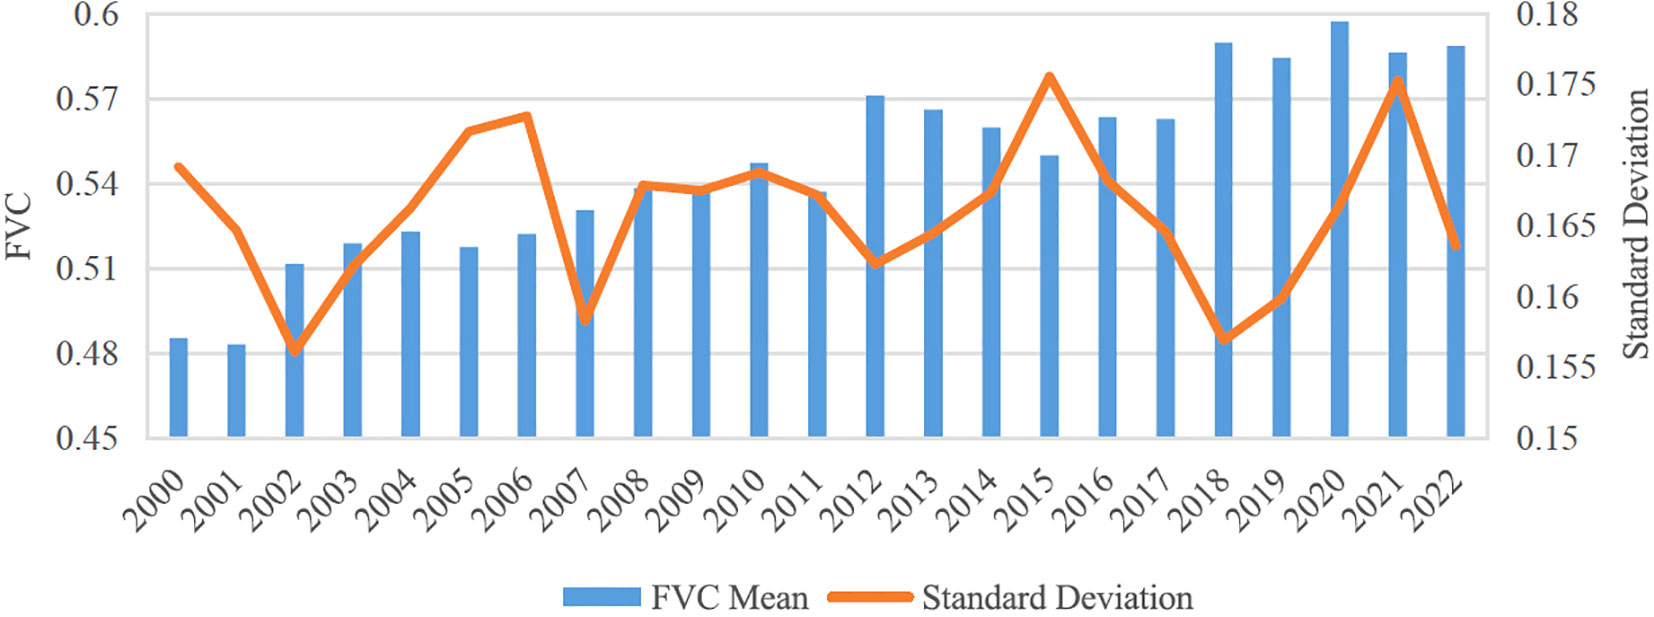
Figure 4 FVC changes in the Yellow River Basin from 2000 to 2022.
As is shown in Figure 4, the standard deviation of FVC between 2000 and 2022 ranged from 0.155 to 0.180. The years 2000, 2006, 2015, and 2021 witnessed an FVC mean lower than that for their previous and following years, and all these time intervals registered the peak value of standard deviation among fluctuations. In contrast, the FVC mean for 2002, 2007, 2012, and 2018 increased considerably from their previous years, with the FVC standard deviation at the trough. The minimum standard deviation, at 0.1561 in 2002, came as the FVC mean experienced its first increase, and this was the year when FVC was least dispersed, suggesting vegetation cover was significantly improved between 2001 and 2002. Moreover, the fourth saddle point corresponded to the maximum standard deviation at 0.1756 in 2015, when FVC was dispersed to the greatest extent. That indicated progressive deterioration in vegetation cover since 2012.
Upon simple linear regression and fitting of the FVC mean of the Yellow River Basin between 2000 and 2022, we found the fitting slope was at 4.6 × 10⁻³ and R2 at 0.9141, meaning the basin’s FVC had overall been on an upward trend since 2000. Results from pixel-by-pixel analysis, displayed in Figure 5, showed that across the basin area of 795,000 km2, an area of 7,075 km2, or 0.89% of the total, was significantly improved in terms of vegetation cover; 92.59% of the basin, amounting to an area of 736,149 km2 witnessed insignificant improvement; the areas that were insignificantly and significantly deteriorated accounted for 6.45% (or 51,300 km2) and 0.06% (or 476 km2) of the total, respectively.
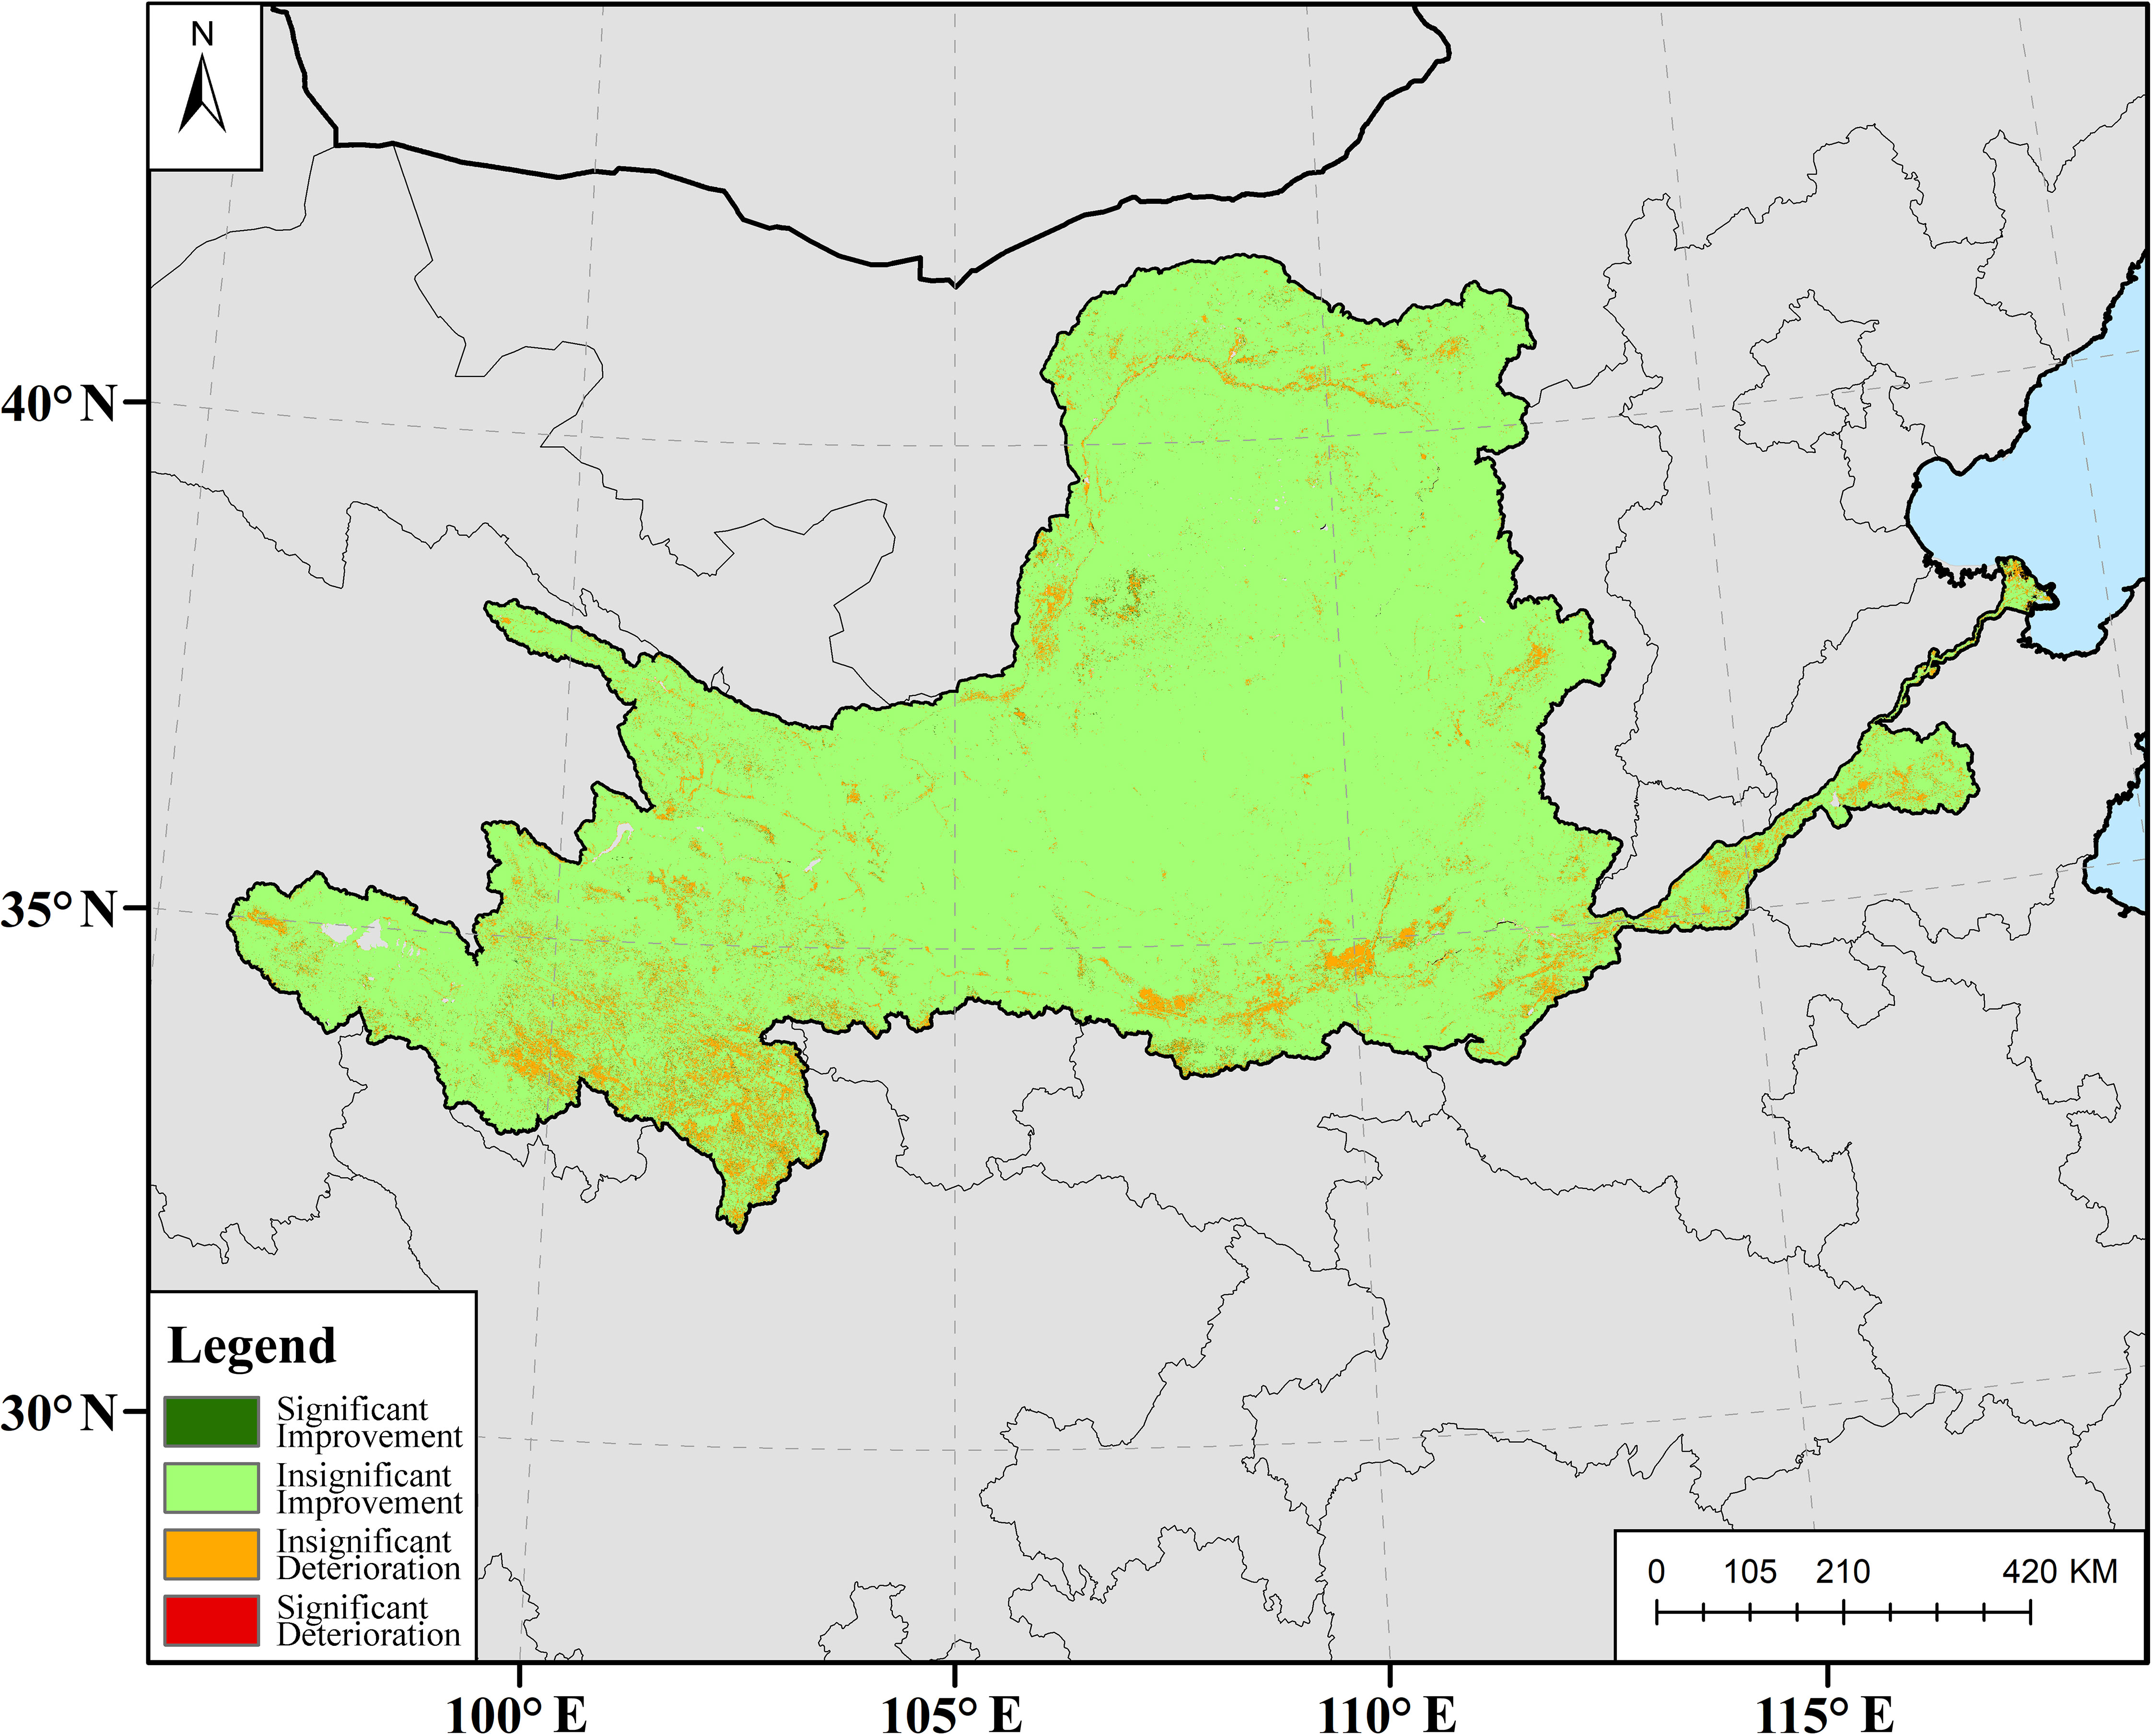
Figure 5 Significance distribution of changes in the FVC of the Yellow River Basin.
Changes in different vegetation cover types in the Yellow River Basin from 2000 to 2022 are shown in Figure 6. The sparsely vegetated area in the basin shrank, reducing by 72,176 km2 (69.22%). The area of medium-low vegetation cover decreased by 44.12%, or 123,572 km2. Nonetheless, the areas of medium, medium-high, and high vegetation cover were up by 6.95%, 59.87%, and 127.67%, respectively, accounting for 12,472 km2, 98,881 km2, and 84,395 km2, respectively. As illustrated in Figure 7, the proportion of different vegetation cover types varied over the years. During the 2000–2004 and 2006–2007 periods, medium-low vegetation cover was proportionately higher than any other type, while in 2005, 2009, and 2010, medium vegetation cover prevailed. And the years 2008, 2011, and 2012 were dominated by medium-high vegetation cover. Over the 23 years, there was a shift in vegetation cover from being predominantly medium-low to medium-high. The proportion of sparse and medium-low vegetation cover was highest in 2000, at 13.12% and 35.23%, respectively, and lowest in 2018, at 3.07% and 17.37%, respectively. The percentage of medium vegetation cover was greatest in 2002, at 31.84%, and smallest in 2000, at 22.87%. The ratio of medium-high and high vegetation cover to the total was highest in 2020, at 35.21% and 20.35%, respectively, and lowest in 2001, at 20.62% and 7.18%, respectively.
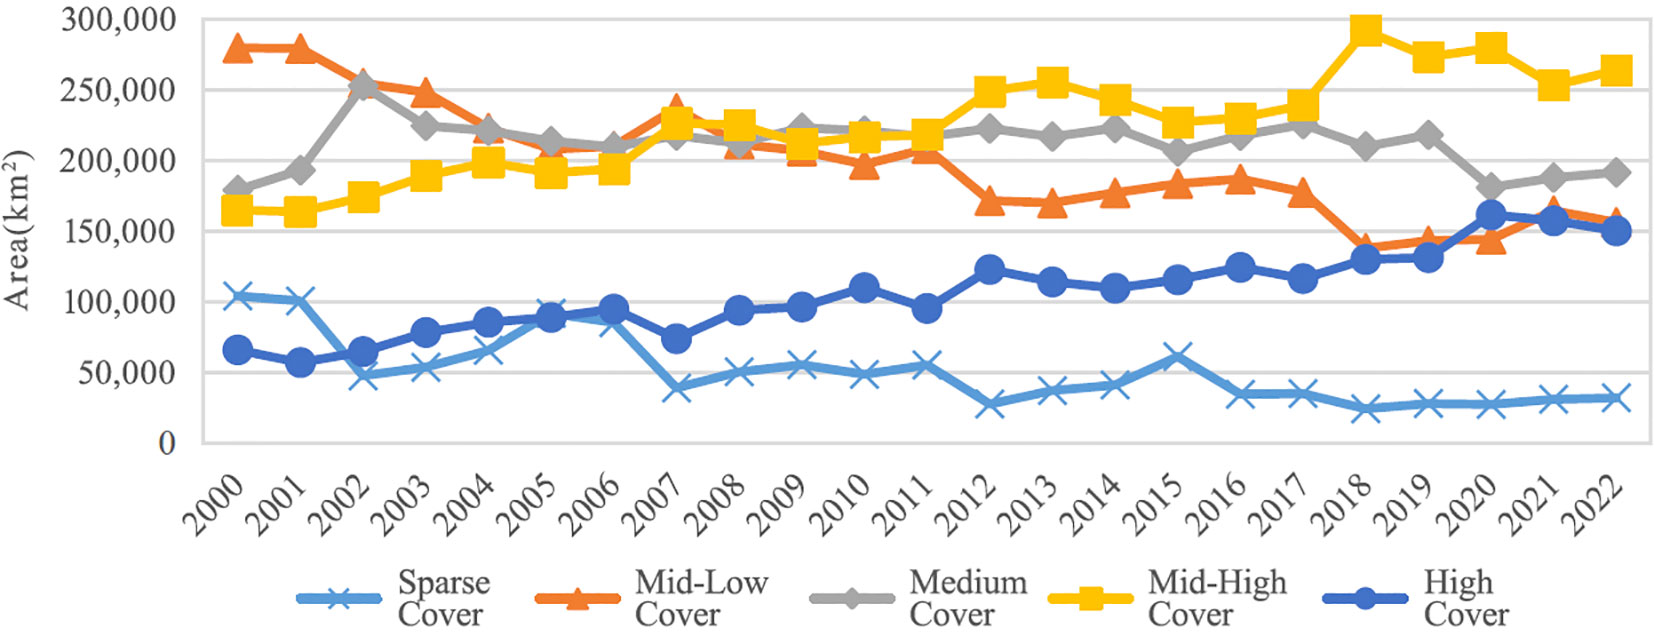
Figure 6 Changes in all vegetation cover types in the Yellow River Basin between 2000 and 2022.
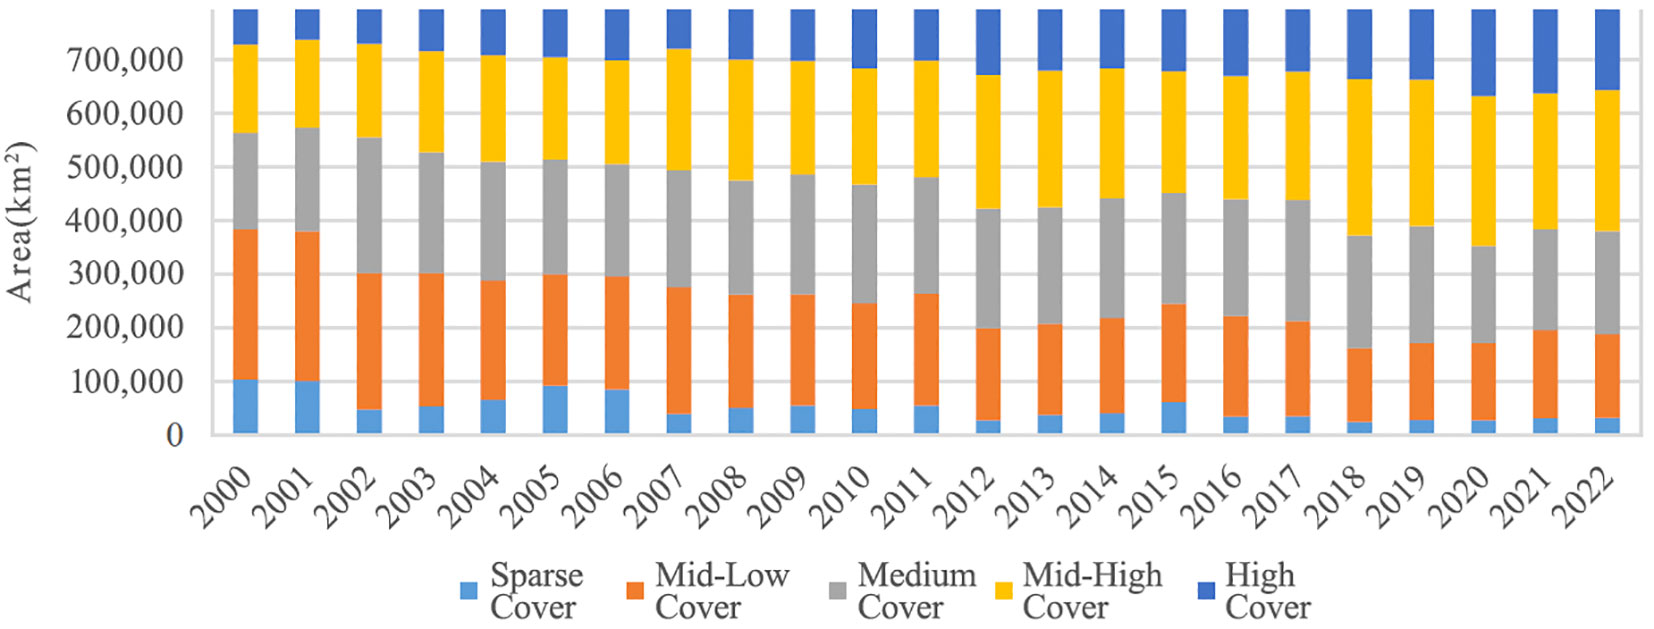
Figure 7 Proportions of all vegetation cover types in the Yellow River Basin between 2000 and 2022.
The confusion matrix concerning different vegetation cover types in the Yellow River Basin from 2000 through 2022 is presented in Table 1. Up to 70.97% (74,007 km2) of the basin’s sparsely vegetated area recorded in 2000 was transformed, 69.76% of which was turned into areas with medium-low and medium vegetation cover in 2022, and 1.21% into the area with medium-high and high vegetation cover. In 2022, an area of 1,831 km2 was reduced to be sparsely vegetated, accounting for 5.7% of the total area with sparse vegetation cover. That suggested since 2000, a shift in vegetation cover from medium-low, medium, medium-high, and high to sparse had been barely seen. As for medium-low vegetation cover, an area of 193,224 km2 was changed starting from 2000, of which 99.24% of the transformed area became greener, with 62.10% and 34.44% for areas with medium and medium-high vegetation cover, respectively. An area of 69,652 km2 developed into the medium-low vegetation cover type in 2022, 92.17% of which was changed from the sparsely vegetated area in 2000. An area of 123,876 km2 with medium vegetation cover was changed starting from 2000, with 92.17% becoming the greener type. In 2022, an area of 136,348 km2 was covered by medium vegetation, 88.01% of which came from medium-low vegetation cover of the year 2000.
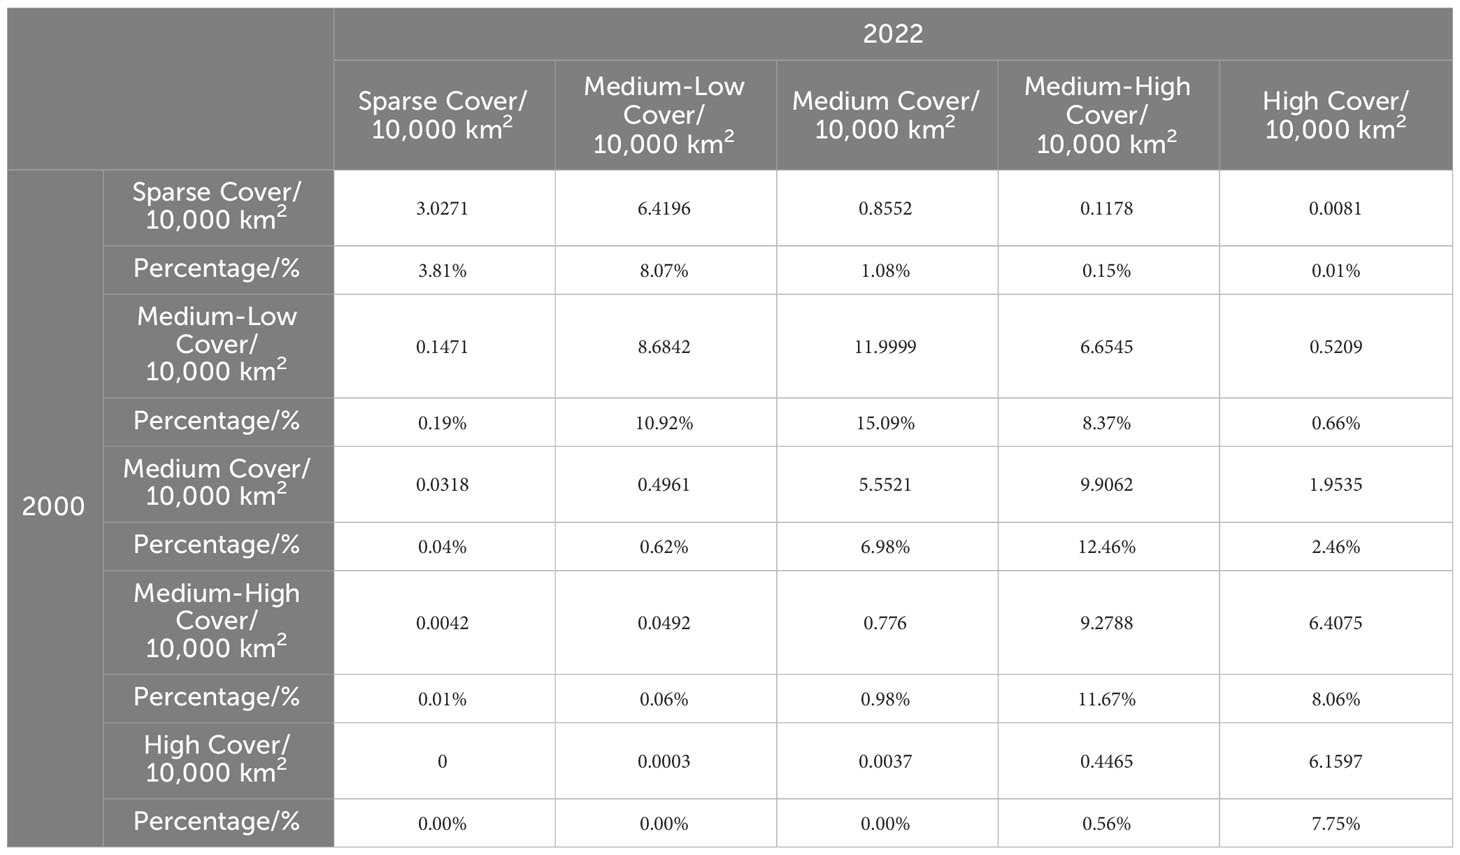
Table 1 Transition matrix on vegetation cover in the Yellow River Basin in 2000 and 2022.
An area of 72,369 km2 with medium-high vegetation cover in 2000 was transformed, with 88.54% of the area turned into the high vegetation cover type, 11.46% into less vegetated areas, and 56.18% of the area covered by medium-high vegetation staying unchanged. In 2022, medium-high vegetation cover expanded by an area of 171,250 km2, with most turned from areas with medium-low and medium vegetation cover in 2000, accounting for 38.86% and 57.85% of the newly added area, respectively.
A total area of 4,505 km2 covered by high vegetation in 2000 was mostly changed into areas with medium-high and medium (or sparser) vegetation cover, taking up 99.11% and 0.89% of the turned area, respectively. In 2022, a mere 27.92% of the high vegetation cover area was changed from areas with sparse, medium-low, and medium vegetation cover recognized in 2000. Throughout the 23 years, most areas with sparse, medium-low, medium, and medium-high vegetation cover had all been transformed, most witnessing significant improvement. The area with high vegetation cover in 2000 remained largely unchanged.
Under a transfer model, we calculated the barycentric coordinates of each vegetation cover type for the period 2000–2022. A diagram showing how the barycenter of each vegetation cover type in the Yellow River Basin migrated was generated based on these coordinates, as shown in Figure 8. Calculation results for 2022 suggested that the areas covered by sparse and medium-low vegetation were mainly in the northwest, while the areas with medium vegetation cover were primarily in the central region. The areas with medium-high and high vegetation cover were mostly found in the southeast, indicating that vegetation cover in the basin gradually improved from the northwest to the southeast. The barycenter of areas in all vegetation cover types migrated in a wave-like manner between 2000 and 2022. To be specific, the barycenter of the sparsely vegetated areas moved from 38°38′41.1252″N, 106°43′39.2772″E to 38°50′50.2404″N, 106°8′47.7708″E, with a migration distance of 68.4912 km; that of the areas with medium-low vegetation cover migrated from 37°29′34.9728″N, 107°20′31.9200″E to 38°4′29.8380″N, 106°12′55.3032″E, with a migration distance of 141.1781 km; that of the areas covered by medium vegetation from 36°17′32.8092″N, 107°22′53.4144″E to 37°7′27.0804″N, 106°51′25.6032″E, with a migration distance of 109.4555 km; that of the areas with medium-high vegetation cover from 35°19′31.0800″N, 105°52′33.2616″E to 36°7′4.3968″N, 107°14′44.0520″E, with a migration distance of 176.1593 km; that of the areas with high vegetation cover from 34°53′47.3388″N, 106°50′46.1328″E to 35°24′26.8560″N, 107°25′50.3832″E, with a migration distance of 86.4258 km. The distance that the barycenter of the sparsely vegetated areas migrated was the shortest, followed by that of areas with high, medium, medium-low, and medium-high vegetation cover. That justified the fact that throughout the 2000–2022 period, the mutual transformation of vegetation cover types in the Yellow River Basin was dominated by the shift of vegetation cover from medium-low to medium-high.
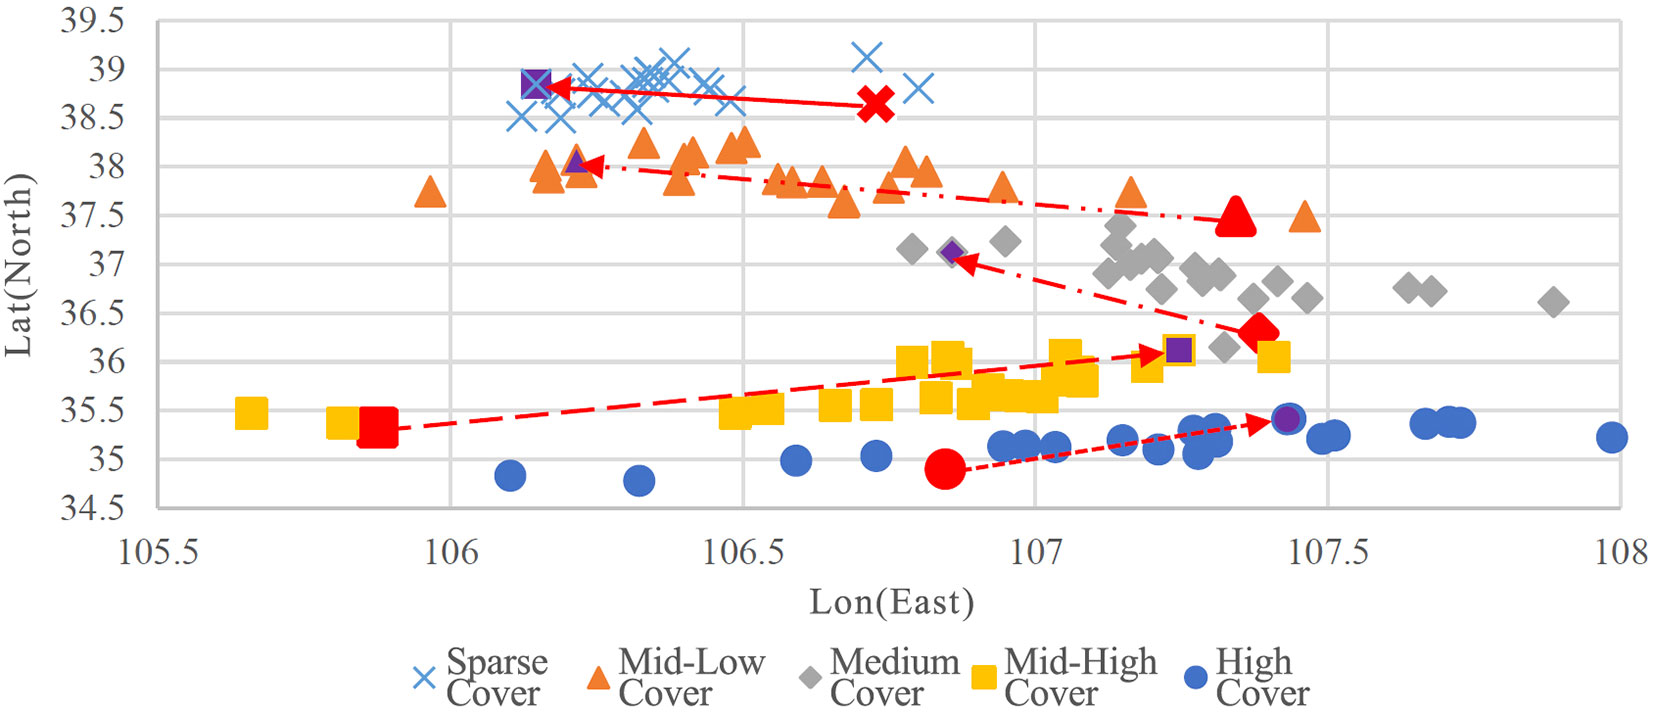
Figure 8 Migration of the barycenter of all vegetation cover types in the Yellow River Basin.
Based on GlobeLand30 datasets, we examined the data on vegetation cover types in 2000, 2010, and 2020 and quantified changes in land areas and their corresponding vegetation cover types, as presented in Figure 9. The Yellow River Basin was mostly covered by grassland, whose area was 387,229 km2, 379,838 km2, and 366,101 km2 in 2000, 2010, and 2020, respectively, accounting for 48.71%, 47.78%, 46.05% of the basin, respectively. Coming next was arable land, the area of which reached 247,366 km2, 243,442 km2, and 241,537 km2 in the three years as mentioned above, respectively, taking up 31.12%, 30.62%, and 30.38% of the basin, respectively. What followed was forest, and its area in 2000, 2010, and 2020 was 90,642 km2, 97,826 km2, and 99,666 km2, respectively, occupying 11.40%, 12.31%, and 12.54% of the basin. Evidently, the areas of grassland, arable land, and bare land shrank progressively, with a decrease of 21,128 km2, 5,829 km2, and 3,329 km2, respectively. On the contrary, the areas of artificial land, forest, shrubland, water, glacier, and snow, as well as wetland, increased by 14,905 km2, 9,024 km2, 2,966 km2, 1,349 km2, 1,292 km2, and 75 km2, respectively. Data on the tundra for 2000, 2010, and 2020 were not included.
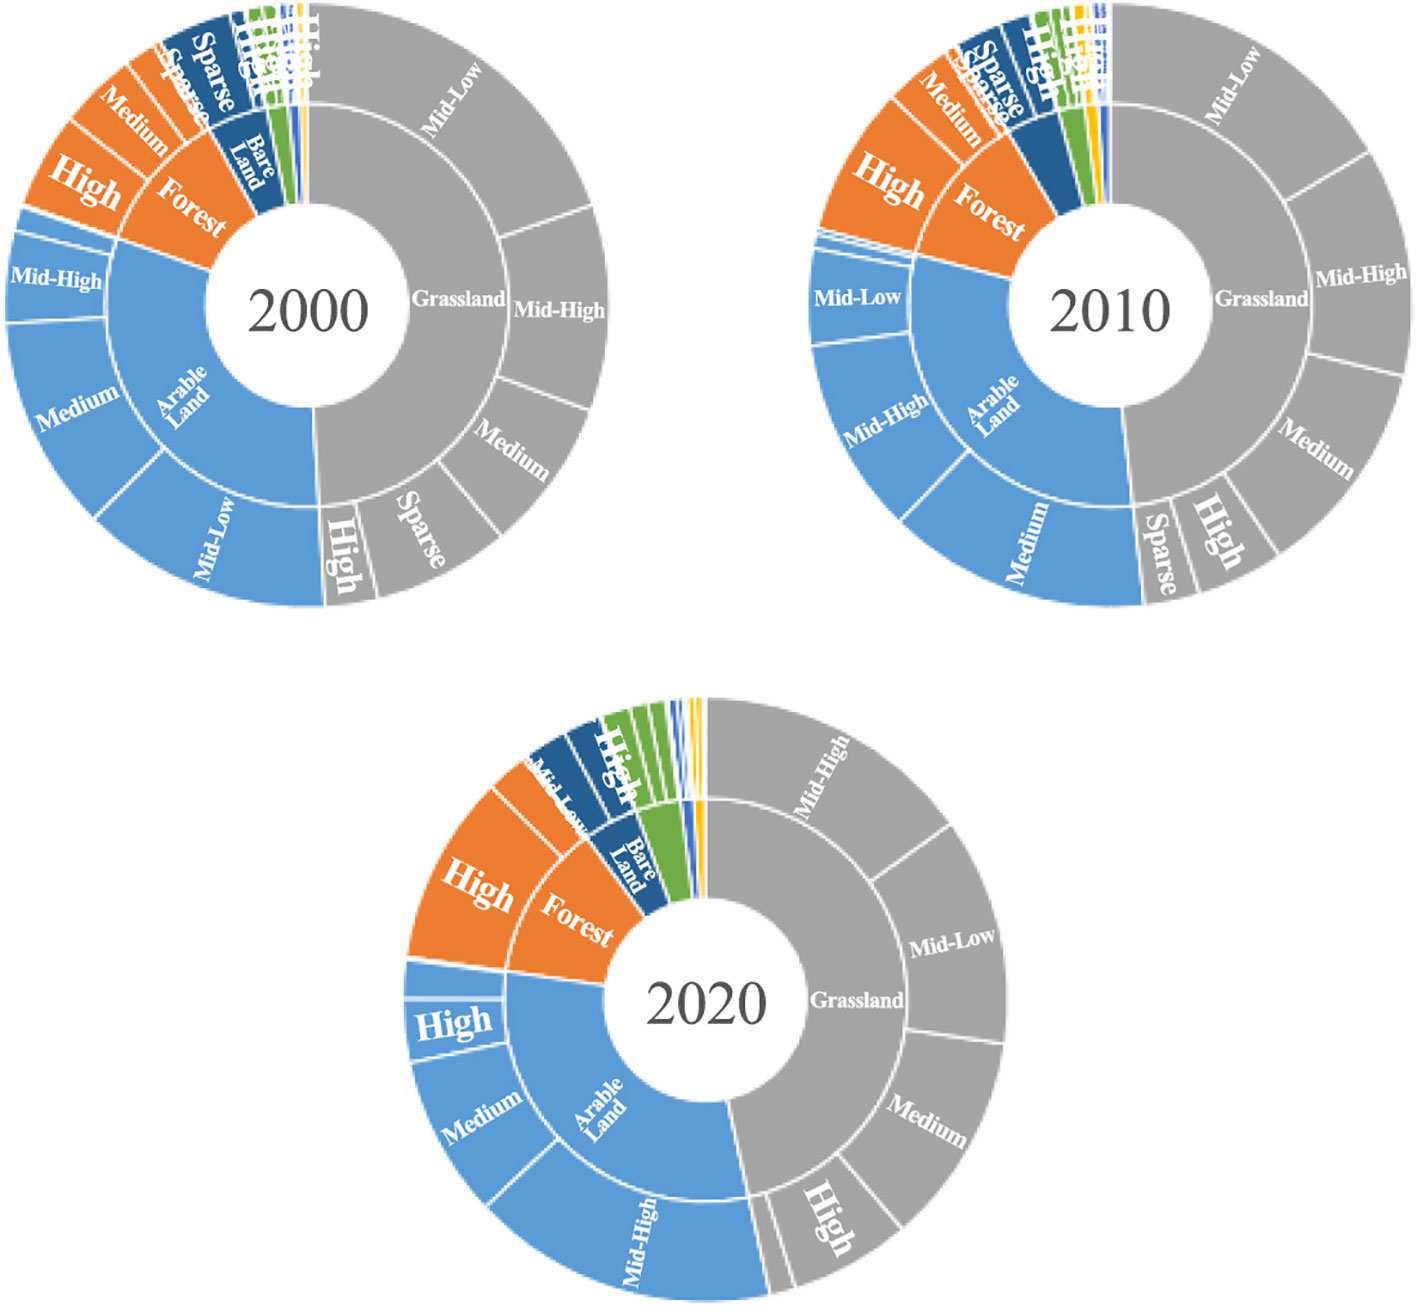
Figure 9 Overlay analysis of areas of land and vegetation cover types in the Yellow River Basin in 2000, 2010 and 2020.
In terms of vegetation cover, the arable land was mostly covered by medium-low vegetation that occupied a space of 105,941 km2 in 2000, followed by medium vegetation that took up 91,129 km2; in 2010, medium and medium-high vegetation cover prevailed, extending to 111,192 km2 and 83,176 km2, respectively; in 2020, medium and medium-high vegetation cover remained predominant, with an area of 68,190 km2 and 129,219 km2, respectively. In 2000, forests were largely covered by high and medium-high vegetation, occupying an area of 40,796 km2 and 33,107 km2, respectively; high and medium-high vegetation cover remained dominant in 2010, which spread out 63,199 km2 and 29,069 km2, respectively; but in 2020, high vegetation cover dominated, with an area of 80,084 km2, whereas the area of medium-high vegetation cover shrank to 17,399 km2. In 2000, grassland was mostly medium-low vegetation cover that occupied an area of 154,707 km2, with the areas of medium and medium-high vegetation cover standing at 64,575 km2 and 87,349 km2, respectively; the year 2010 was still dominated by medium-low vegetation cover, which spanned 129,715 km2, and medium and medium-high vegetation cover filled an area of 92,635 km2 and 97,025 km2, respectively; the year 2020 was marked by medium-high vegetation cover that occupied an area of 118,596 km2, with the areas of medium-low and medium vegetation cover standing at 96,223 km2 and 89,468 km2, respectively. As for shrubland, it was mostly covered by medium-low vegetation in 2000, which spanned across 2,489 km2; in 2010, medium vegetation cover dominated with an area of 1,802 km2; the same pattern was true for 2020, except that its area increased to 3,074 km2. When it comes to wetland, it was defined by medium-high vegetation cover in 2000, which spread out 3,353 km2; in 2010, high and medium-high vegetation cover dominated with an area of 3,547 km2 and 2,158 km2, respectively; in 2020, the dominating types remained medium-high and high vegetation, which occupied an area of 3,709 km2 and 2,457 km2. On artificial land, it was largely marked by medium vegetation cover in 2000 that extended for 6,767 km2; in 2010, medium vegetation cover still prevailed, with an area of 7,237 km2; the same was true for the year 2020, except that the area of medium vegetation cover expanded greatly to 12,406 km2. Bare land was sparsely vegetated with an area of 31,151 km2 in 2000, and was defined by sparse and medium-low vegetation cover by 2010, which took up 19,991 km2 and 12,899 km2, respectively; in 2020, medium-low vegetation cover became predominant, with an area of 18,375 km2. There was a lack of data on waterbodies, glaciers, and firn since no vegetation cover was found in them.
Vegetation cover changes are closely related to various factors, including climate, topography, soil, and human activity. Beyond researching data on the FVC of the Yellow River Basin between 2000 and 2022, we examined FVC changes and investigated how they had been correlated to data on their corresponding climatic factors (such as temperature, precipitation, and potential evapotranspiration), topographic factors (including elevation, slope, aspect, and topographic relief amplitude), edaphic factors, and anthropogenic factors (such as data on water and soil conservation area and ecological engineering). By identifying the main driving forces behind vegetation cover changes in the basin, we elucidated the impact of these changes on soil erosion.
Climatic factor data and calculated FVC results concerning the Yellow River Basin between 2000 and 2020 underwent time-series and spatial overlay analyses. The results of the time-series analysis are presented in Figure 10. The correlation coefficient between the basin’s FVC and average temperature was 0.1580, while the coefficients between FVC and highest and lowest temperatures were 0.2233 and 0.3169, respectively. Considering that change in average temperature is influenced by both the highest and lowest temperatures, these coefficients can more accurately exhibit how temperatures changed over the 21 years. As such, the relationship between average temperature and FVC changes was investigated in our study. The average temperature between 2000 and 2008 was largely affected by the highest temperature, which resulted in two peaks and corresponded with a lower FVC compared to adjacent years. Overall, the average temperature was declining, yet FVC was rising. From 2008 through 2016, changes in the highest and lowest temperatures were consistent, and the change in FVC was comparable to that in average temperature. Notably, the average and lowest temperatures, together with FVC, stayed at relatively high levels in 2010, 2013, and 2016. In the 2016–2020 period, the highest temperature increased before decreasing, while the lowest temperature fluctuated upward. Changes in the average and lowest temperatures, as well as in FVC, were largely consistent. Prior to 2008, the correlation between changes in temperature and FVC was negative, whereas the shifting FVC was greatly impacted by temperature changes after 2008. The basin’s FVC was strongly correlated with average precipitation, with the correlation coefficient at 0.5378. Changes in FVC and average precipitation diverged starting from 2000 before turning consistent in the 2000–2002 period. The correlation coefficient between the basin’s FVC and potential evapotranspiration stood at −0.1412. This was largely attributed to the fact that between 2009 and 2018, there was no obvious correlation between FVC changes and average potential evapotranspiration, while a negative correlation was observed during the remaining time periods.
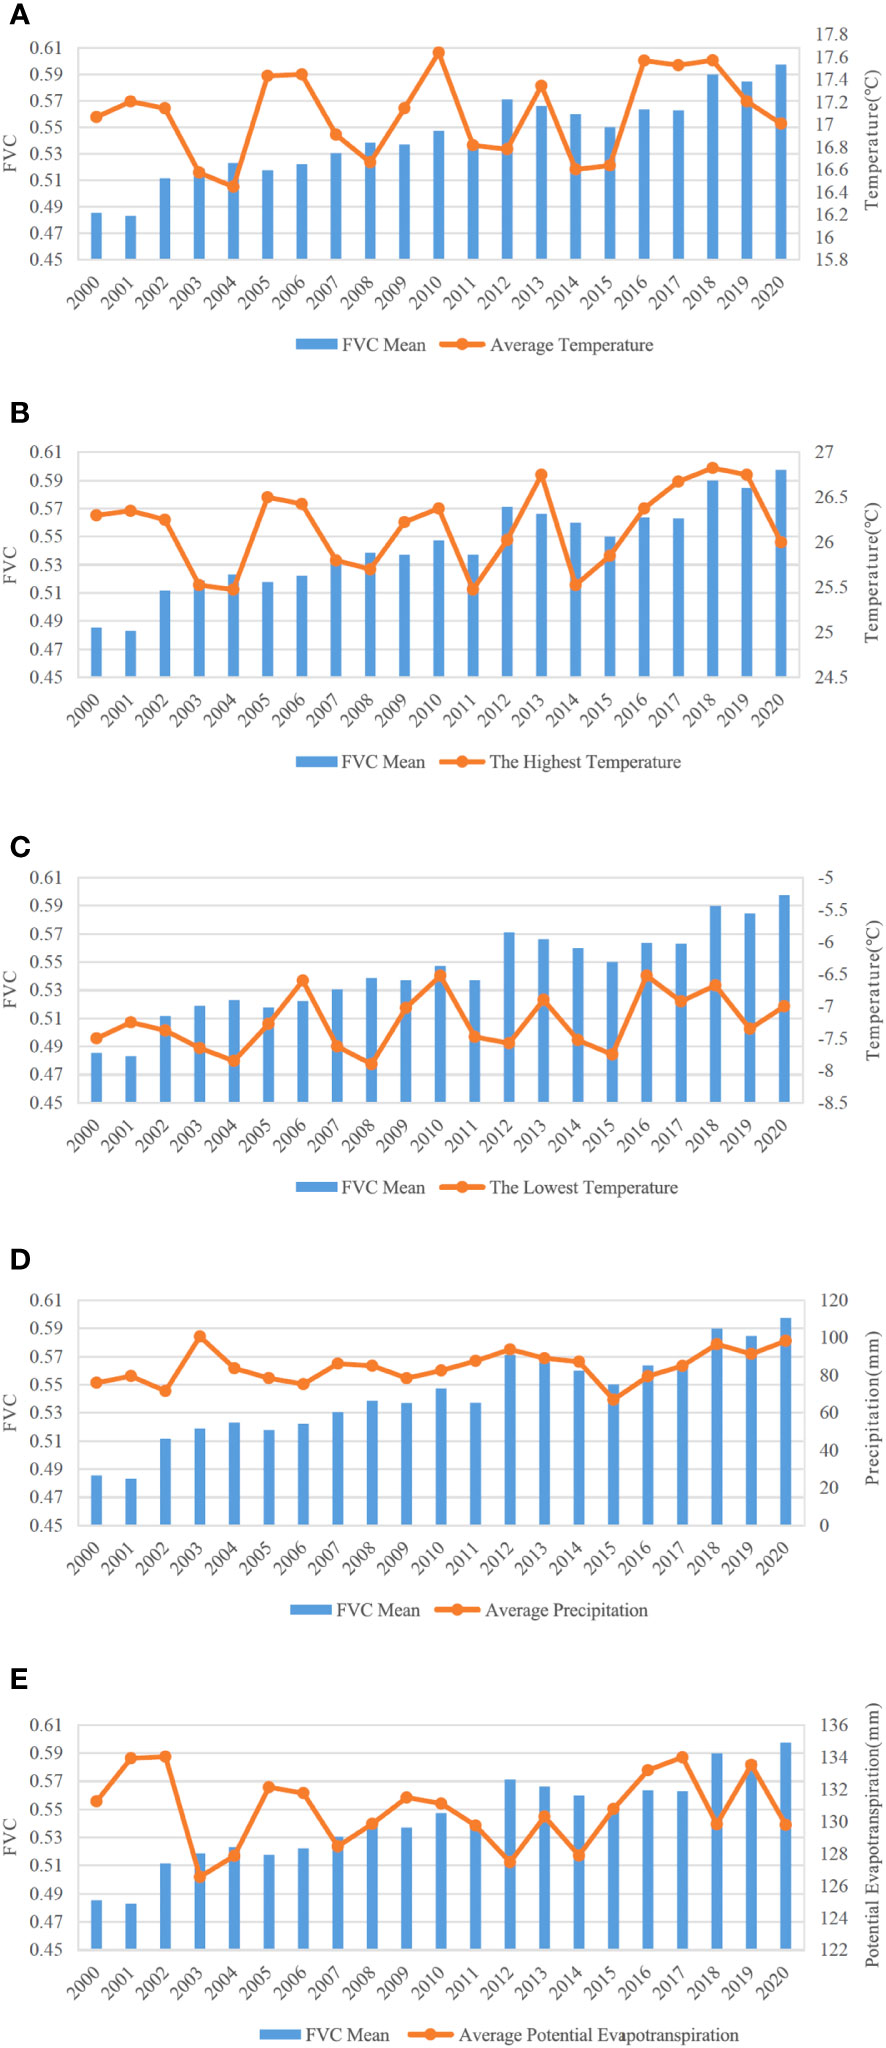
Figure 10 Relationships between FVC and climatic factors in the Yellow River Basin between 2000 and 2020. (A) Average temperature; (B) The highest temperature; (C) The lowest temperature; (D) Average precipitation; (E) Average potential evapotranspiration.
Results of spatial overlay analysis were generated upon the calculation of correlation coefficients between FVC and data on temperature, precipitation, and potential evapotranspiration, respectively, as shown in Figure 11. On the FVC-temperature correlation, the significant positive correlation region, with a total area of 55,474 km2, was concentrated in the upper and northern middle reaches of the Yellow River Basin, including the Daxia River, Taohe River, Ulansu Lake, Kundulun River, Dahei River, and Hunhe River; the significant negative correlation region, spanning across 679 km2, is mainly located in the south of the basin, such as the Weihe River and Yiluo River. With regard to FVC’s correlation with precipitation and potential evapotranspiration, the significant positive correlation region was at the source of the Yellow River and in the central and southern regions of the Yellow River Basin, including Kari Qu River, Duo Qu River, Qushian River, Heihe River, Huangshui River, Lanyi River, Yiluo River, and covered a total area of 1,183 km2; the significant negative correlation region, with an area of 828 km2, was located in the middle-lower reaches of the Yellow River, such as the Qinhe River, Fenhe River, Sushui River, Jindi River, and Dawen River.
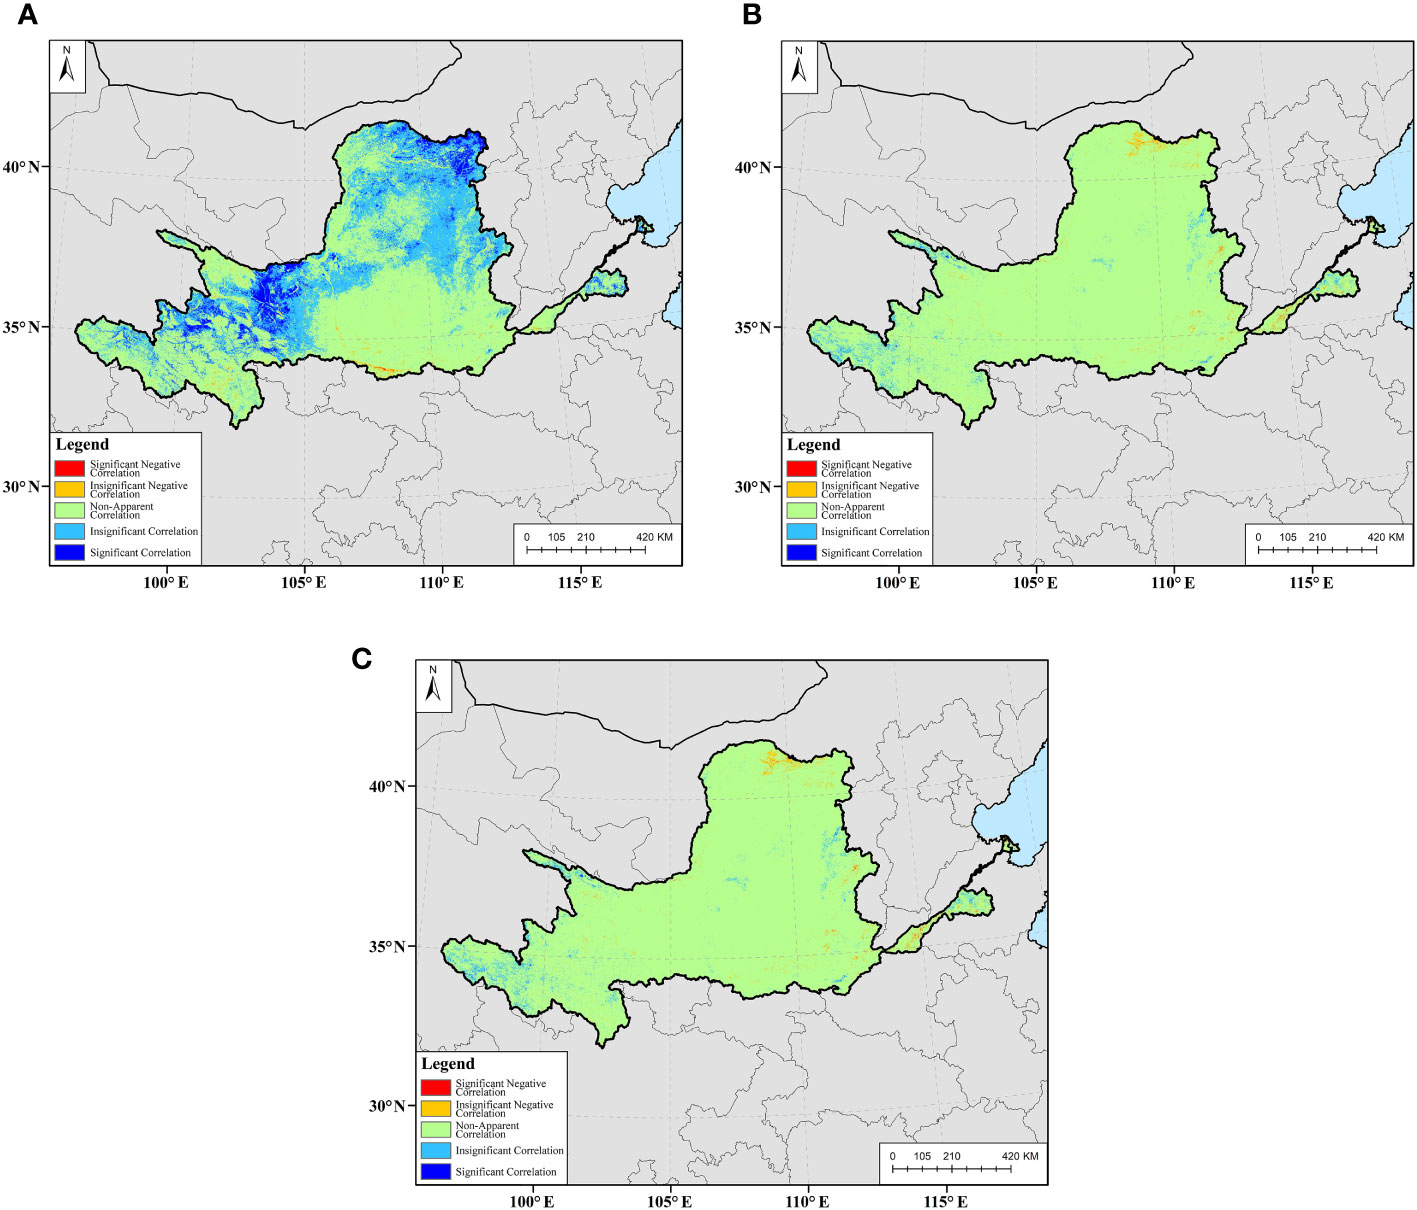
Figure 11 Spatial correlations between FVC and factors of temperature, precipitation, and potential evapotranspiration in the Yellow River Basin. (A) Temperature; (B) Precipitation; (C) Potential evapotranspiration.
A spatial overlay analysis of data on FVC changes in the Yellow River Basin between 2000 and 2022 and on topographic factors, which included elevation, slope, aspect, and topographic relief amplitude, was conducted, with results illustrated in Figure 12. Depending on elevation, we categorized landforms (Lu, 2002) into plains (≤200 m), hills (200~500 m), low-altitude mountains (500~1000 m), medium-altitude mountains (1000~3500 m), high-altitude mountains (3500~5000 m), and extremely high-altitude mountains (>5000 m), and obtained corresponding data. If divided in terms of slope (Liu, 2013), data on flat ground (<3°), flat slope (3°~7°), gentle slope (7°~15°), mild slope (15°~25°), and steep slope (>25°) were generated. Upon calculation, aspect data were azimuthally categorized (Cheng et al., 2022): northward (>337.5° or ≤22.5°), northeastward (22.5°~67.5°), eastward (67.5°~112.5°), southeastward (112.5°~157.5°), southward (157.5°~202.5°), southwestward (202.5°~247.5°), westward (247.5°~292.5°), northwestward (292.5°~337.5°). According to topographic relief amplitude, landforms were divided into areas of flat relief (<30), areas of gentle relief (30~150), areas of moderate relief (150~300), mountains (a relief amplitude of 300~600), and high mountains (a relief amplitude of more than 600) (Li et al., 2006). Results showed that among changes in topographic factors, areas with a non-apparent FVC change accounted for most of the basin, and besides them, areas with a significant FVC increase and an extremely significant increase were far larger than those with a significant decrease and an extremely significant decrease.
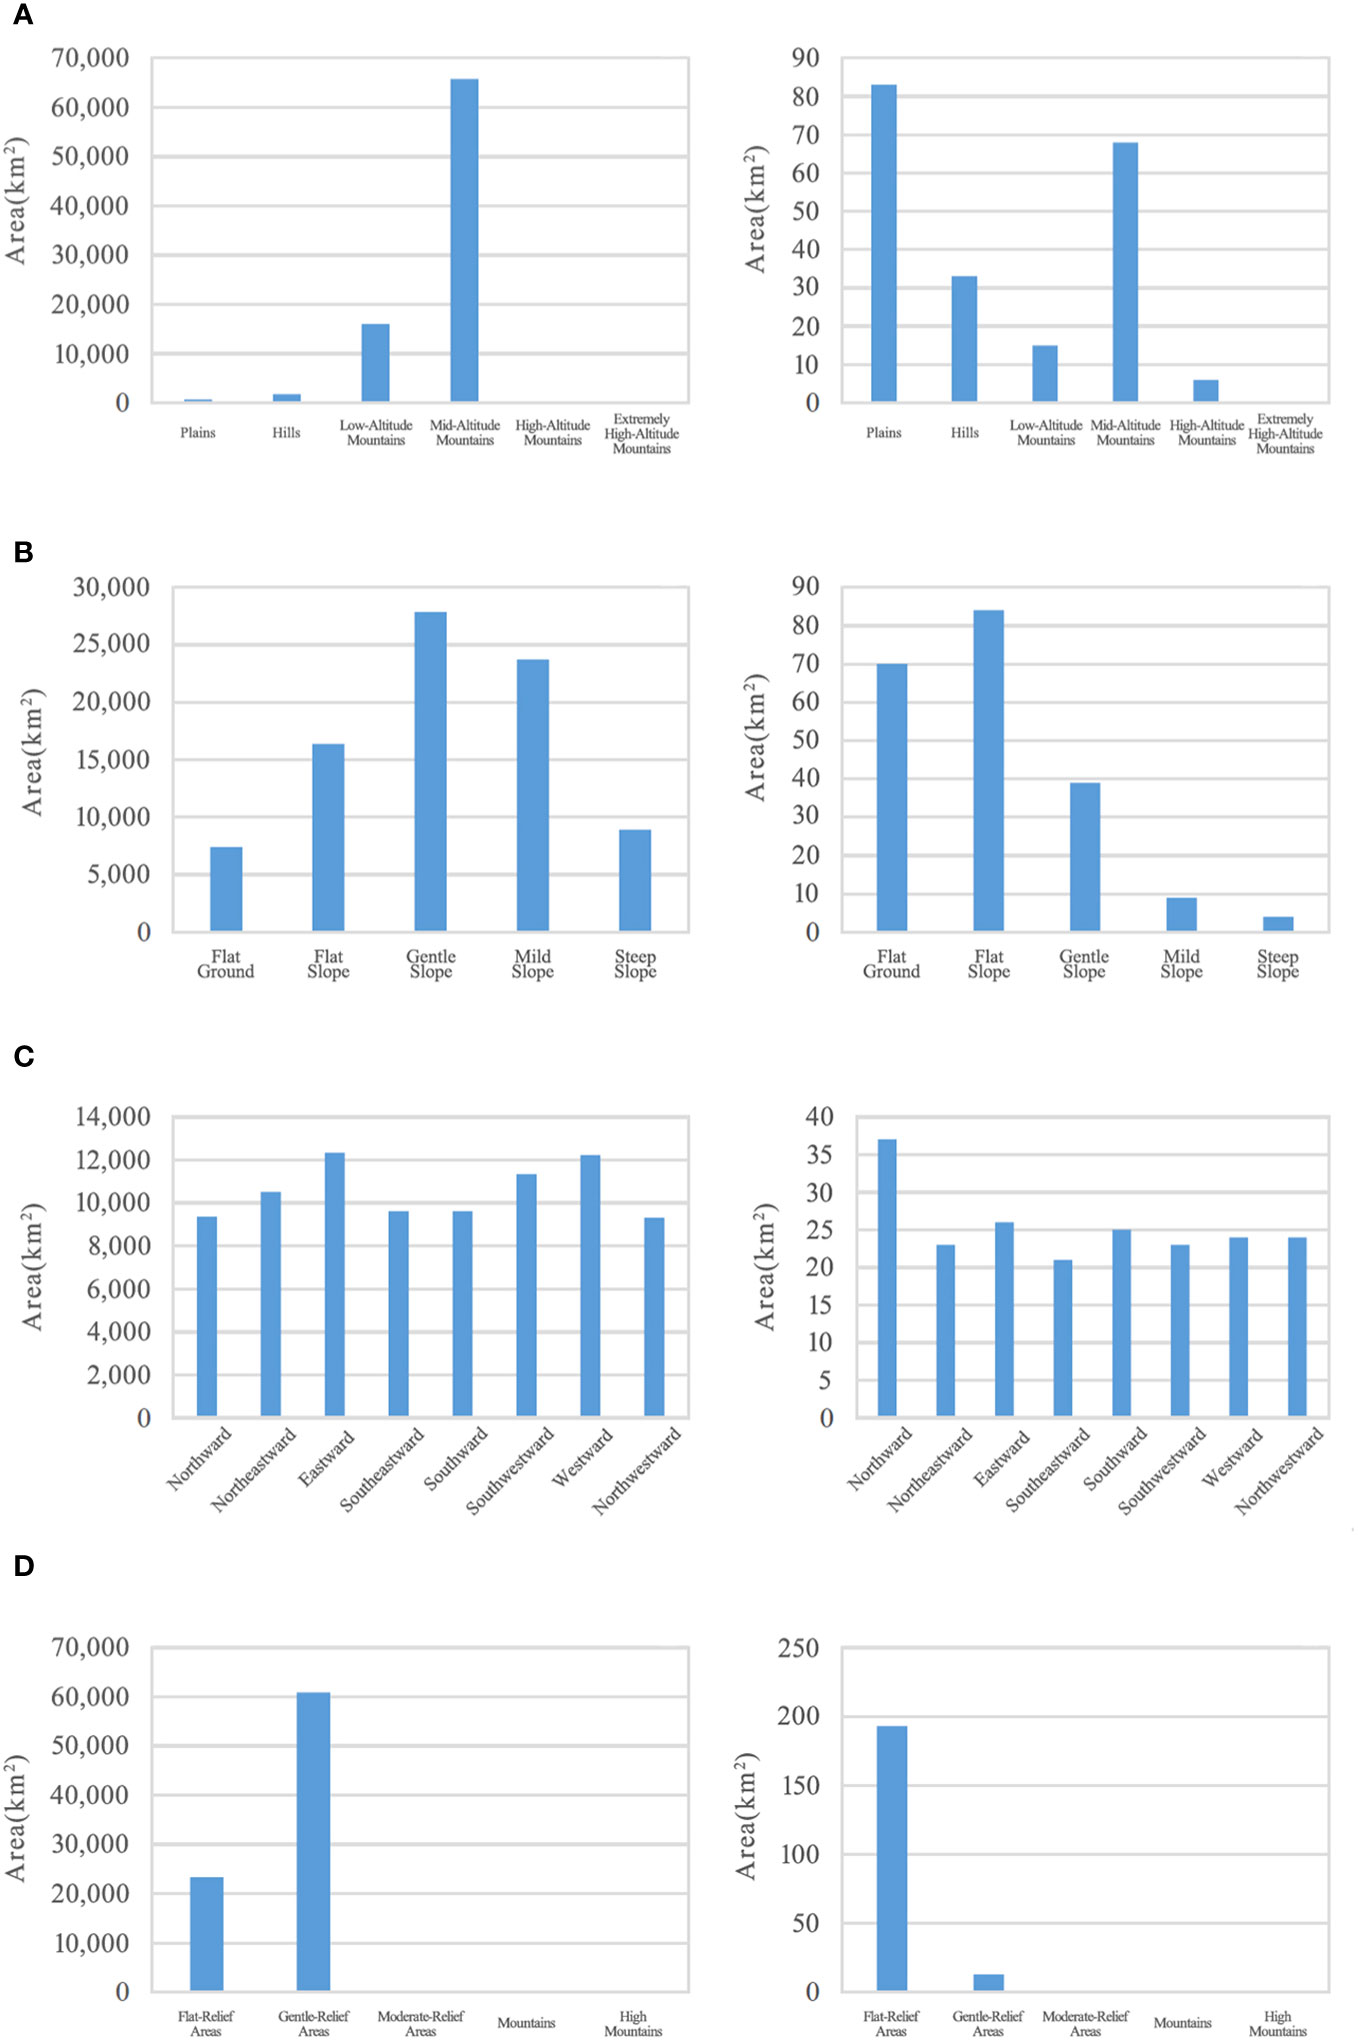
Figure 12 Vegetation cover changes relating to topographic factors in the Yellow River Basin. (A) Landforms (left: increase; right: decrease); (B) Types of slope (left: increase; right: decrease); (C) Types of aspect (left: increase; right: decrease); (D) Topographic relief amplitude (left: increase; right: decrease).
On landforms, a total area of 84,519 km2 experienced FVC changes. To be specific, the areas of plains with a decrease and increase in FVC were 83 km2 and 681 km2, respectively; the area of hills with a decrease in FVC was 33 km2, and that with an FVC increase 1,735 km2; areas of low-altitude mountains with a fall and rise in FVC stood at 15 km2 and 15,980 km2, respectively, suggesting no extremely significant decrease; the area of medium-altitude mountains with a rise in FVC represented 68 km2 and that with an FVC increase reached 65,757 km2; areas of high-altitude mountains with a decrease and increase in FVC were 6 km2 and 158 km2, respectively, indicating no extremely significant decrease; the area of extremely high-altitude mountains with an FVC increase stood at 3 km2, with no decrease in FVC shown.
In terms of slope, a total area of 84,475 km2 witnessed variation in FVC. Specifically, the area of flat ground with an FVC decrease was 70 km2 and that with an FVC increase was 7,400 km2; areas of flat slopes with a fall and rise in FVC were 84 km2 and 16,380 km2, respectively; the area of gentle slopes with a falling FVC represented 39 km2, and that with a rising FVC stood at 27,842 km2; areas of mild slopes with a decrease and increase in FVC were 9 km2 and 23,730 km2, respectively, showing no extremely significant decrease; the area of steep slopes with a dropping FVC spanned 4 km2, while that with a rising FVC reached 8,917 km2, with no extremely significant decrease presented.
In terms of aspect, a total area of 84,521 km2 saw a change in FVC. Precisely, an area of 37 km2 in northward slope areas experienced a decrease in FVC, while an area of 9,354 km2 saw an FVC increase; areas of northeastward slopes with a fall and rise in FVC stood at 23 km2 and 10,513 km2, respectively; the area of eastward slopes with an FVC decrease was 26 km2, while that with a rising FVC represented 12,336 km2; areas of southeastern slopes with a fall and rise in FVC were 21 km2 and 9,618 km2, respectively; an area of 25 km2 in southward slopes saw a decrease in FVC and an area of 9,622 km2 posted an increase; areas of southwestward slopes with a decrease and increase in FVC were 23 km2 and 11,344 km2, respectively; the area of westward slopes with an FVC decrease shrank by 24 km2, and that with an FVC increase was up by 12,230 km2; areas of northwestward slopes with a fall and rise in FVC stood at 24 km2 and 9,301 km2. The area of all the above slopes with an extremely significant decrease in FVC was less than 1 km2.
In terms of topographic relief amplitude, a total area of 84,520 km2 experienced a change in FVC. To be exact, the area of flat relief with a falling FVC was 193 km2 and that with a rising FVC 23,333 km2; areas of gentle relief with a decrease and increase in FVC stood at 13 km2 and 60,948 km2, respectively, showing no extremely significant decrease; the area of moderate relief with an FVC increase reached 33 km2, with no area showing a dropping FVC; change in vegetation cover in mountainous regions was barely seen, while high mountains were not included in our research.
In the Yellow River Basin, there are 13 soil orders (water bodies and glaciers are combined into one order), with 45 classes and 91 subclasses. For ease of statistical analysis, the data were reclassified by soil orders. Spatial overlay analysis was conducted on data on FVC changes and edaphic factors between 2000 and 2022, as shown in Figure 13. Within each soil type, a considerable proportion of the area displayed negligible FVC changes, totaling 84,049 km2. Apart from these areas, the significant and extremely significant increases in FVC were both greater in area than the significant and extremely significant decreases. Among all soil types, the most significant changes were found in entisols. Among these soil types, the area of alfisols with an FVC decrease stood at 5 km2, and that with an FVC increase reached 218 km2, showing no extremely significant decrease in vegetation cover; in semi-alfisols, the area with a falling FVC represented 14 km2 and that of a rising FVC 6,815 km2, suggesting there was no extremely significant decrease in FVC; areas of pedocals with a decrease and increase in FVC were 3 km2 and 8,674 km2, respectively, indicating no extremely significant decrease in FVC; an decrease in FVC was found in an area of 1 km2 of xerosols, while the area of xerosols with an FVC increase reached 1,548 km2, registering no extremely significant decrease in FVC; the area of aridisols with an increase in FVC was 84 km2, with no decrease in FVC found in the soil type; areas of entisols with a fall and rise in FVC stood at 43 km2 and 62,579 km2, respectively, which, collectively, were larger than areas of other soil types in terms of FVC changes; the area of semi-hydromorphic soils with a falling FVC represented 33 km2 and that with a rising FVC 2,403 km2; a decrease in FVC was found in an area of 5 km2 of hydromorphic soils, while an increase in FVC was observed in an area of 89 km2, indicating no extremely significant decrease in vegetation cover; areas of saline-alkali soils with a declining and rising FVC were 42 km2 and 896 km2, respectively; an area of 8 km2 of anthrosols saw a fall in FVC, while an area of 434 km2 of the soil type witnessed an FVC rise; areas of alpine soils with a decrease and increase in FVC represented 5 km2 and 150 km2, respectively, showing no extremely significant drop in FVC. The areas of urban regions, waterbodies, glaciers, and snow cover were not calculated.
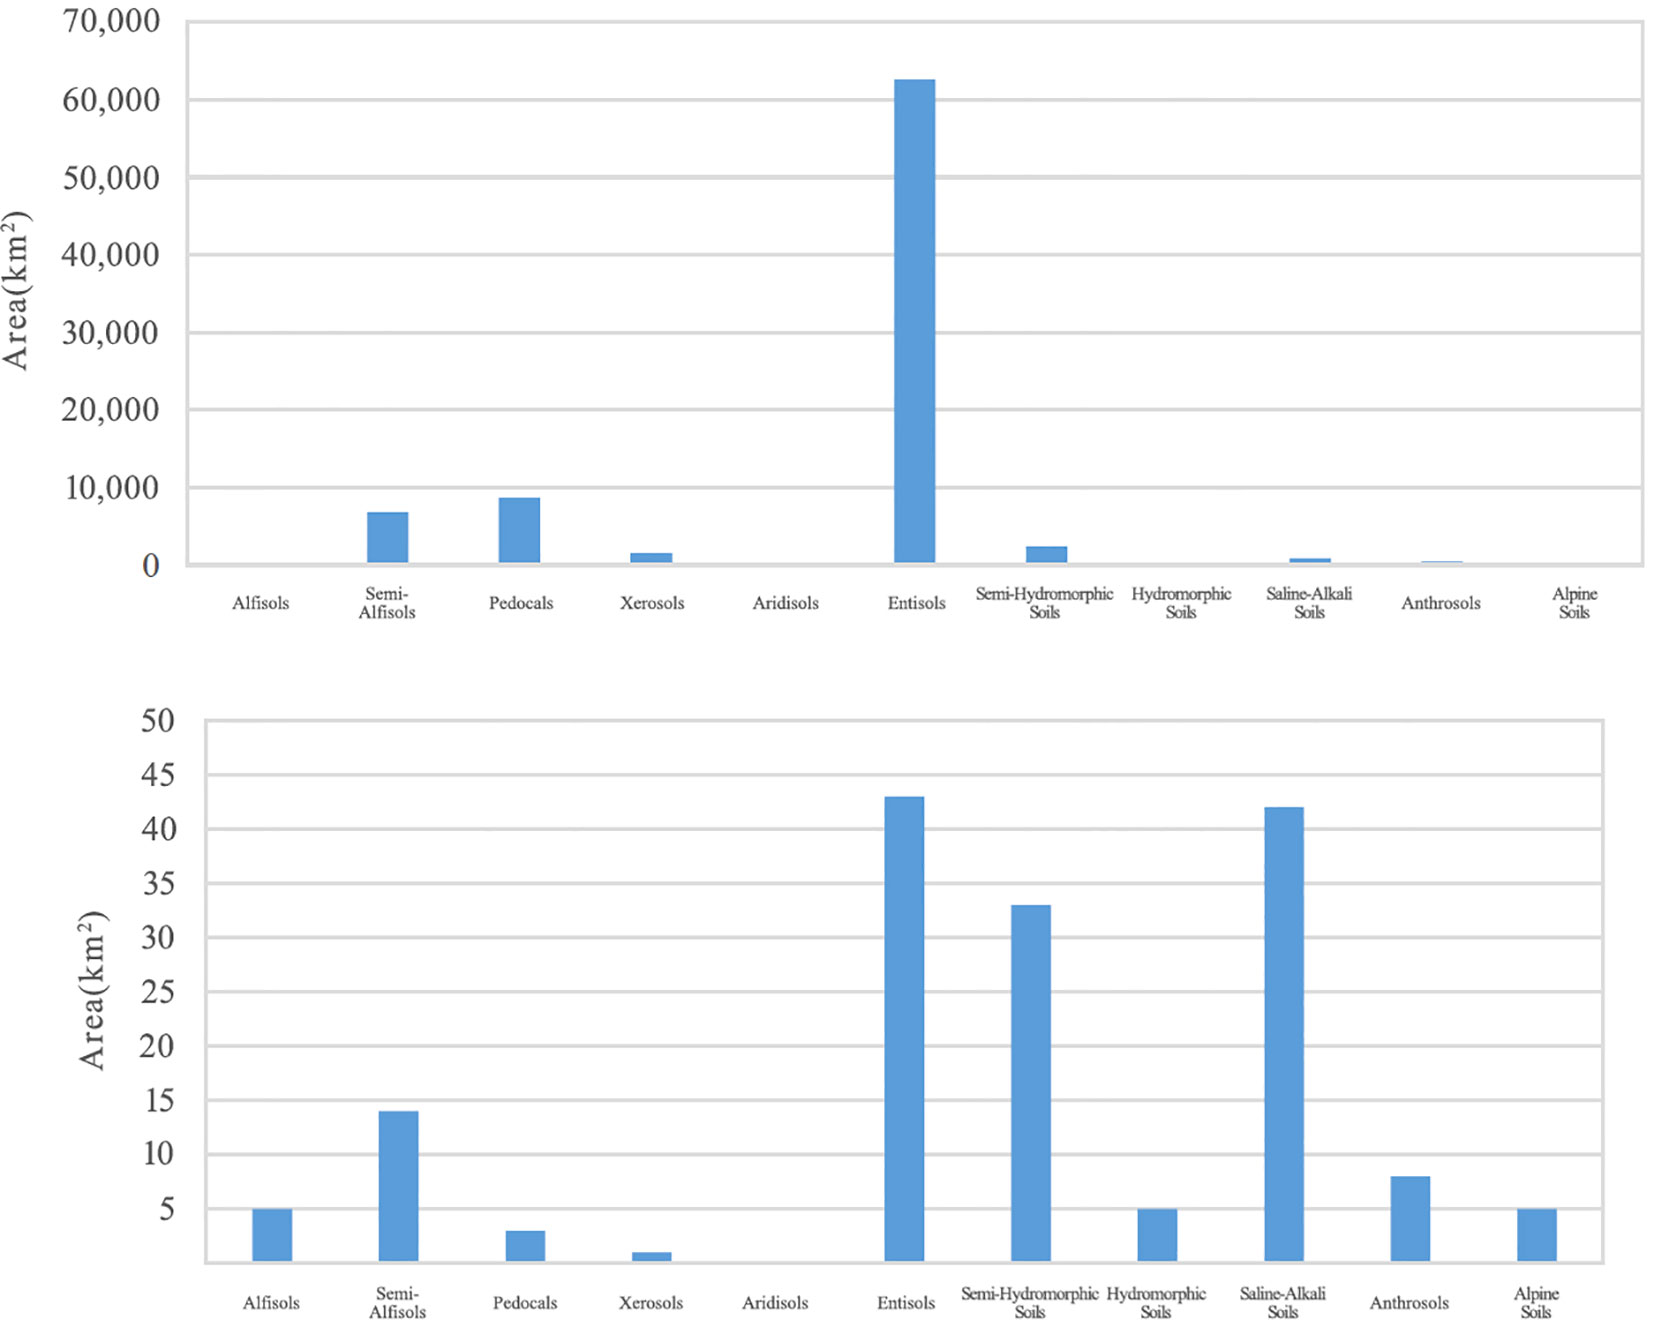
Figure 13 Vegetation cover changes relating to edaphic factors in the Yellow River Basin (upper: increase; lower: decrease).
For the past two decades, China has bolstered its efforts to implement a host of sustainable development policies, including policies on the returning of cropland to forests, protection of natural forests, creation of eco-security barriers, and industrial restructuring, resulting in a significant impact on FVC changes in the Loess Plateau region. Moreover, the Chinese government has since 2000 sealed the areas returned from cropland, pursued afforestation, and prohibited grazing (Jiang, 2018; Jiang, 2019; Liu, 2020), a key to accelerating vegetation restoration and increasing the area and extent of vegetation cover. This study collected statistical data on comprehensive soil and water conservation measures in various provincial-level administrative regions across the Yellow River Basin between 2002 and 2006, as shown in Table 2. The comprehensive conservation area exceeded 14,000 km2 in 2003, the highest in the five years, followed by 2002, 2004, 2005, and 2006. Among the various conservation measures, the agricultural conservation area, grass planting area, and the number of small-scale water conservancy projects were the highest in 2002, while the integrated conservation area of forests for soil and water conservation and the number of silt dams were the highest in 2003. The sealed area for conservation was the highest in 2006. Among the provincial-level administrative regions, such provinces as Shaanxi and Shanxi, located in the Loess Plateau region, made greater soil and water conservation efforts. As we observed changes in the FVC mean in the Yellow River Basin, it could be seen that the FVC mean was annually increasing in the 2002–2004 and 2005–2007 periods and that the FVC mean for 2002 had been a leap forward from the previous year. As such, the implementation of various measures for biological control and soil and water conservation contributes not just to an increase in the FVC of the Loess Plateau, but also to the improvement of vegetation cover in this region.
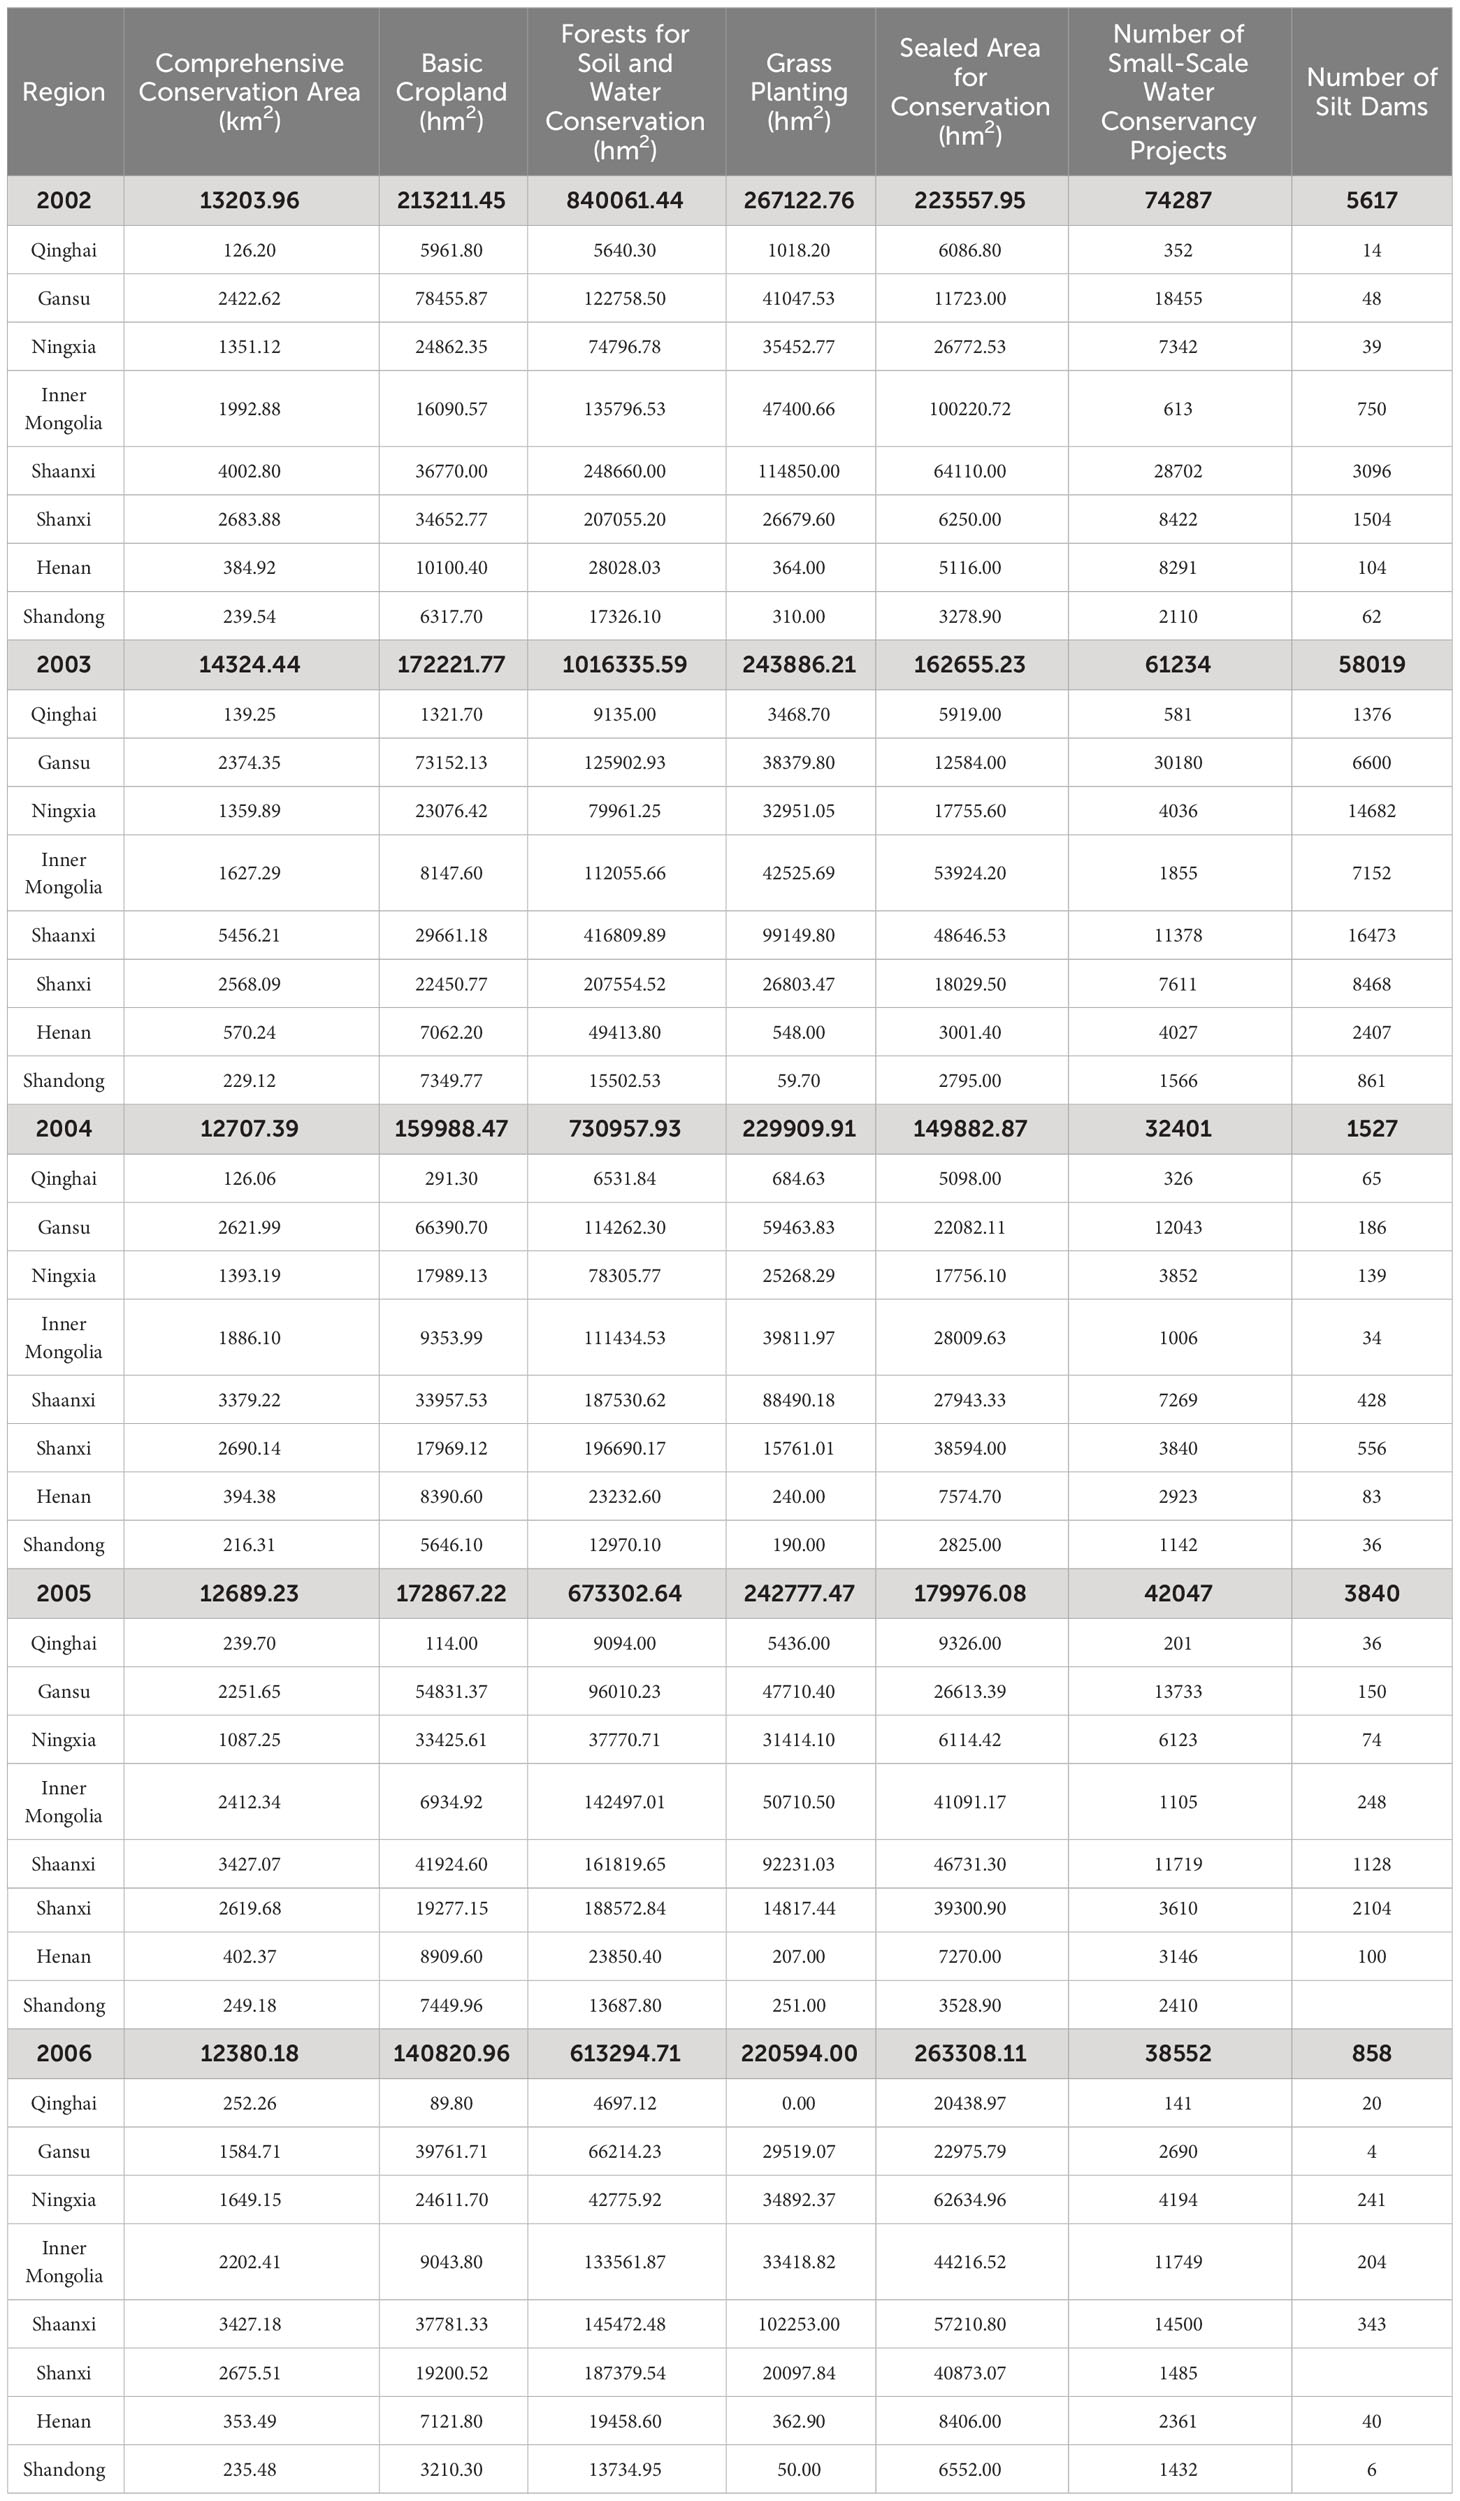
Table 2 Comprehensive soil and water conservation measures by provincial-level administrative regions in the Yellow River Basin between 2002 and 2006.
Vegetation plays a pivotal role in soil conservation and water retention, making it an essential component of comprehensive soil erosion management (Shen et al., 2020). By regulating soil water distribution and surface runoff, vegetation significantly impacts various aspects of the soil water balance, with implications for runoff generation and sediment transport processes within watersheds (Wang, 2017). As is shown in Tables 3, 4 and Figures 14, 15, considering the mean runoff and data on its interannual variation of important hydrological stations along the Yellow River mainstem from 2015 to 2021, it was illustrated that the FVC of the Yellow River Basin remained largely unchanged between 2015 and 2017, with runoff data at each station staying consistent and only a slight SSC increase. From 2017 through 2021, however, an FVC surge led to a noticeable increase in runoff at each station from the previous time period, all of which surpassed long-time mean runoff, with SSC on a downward trend. For the 2015–2021 period, the basin experienced a significant increase in FVC compared to the pre-2012 era, making SSC below the long-time average value except for upper reaches. The FVC increase has substantially benefited water diversion and sediment reduction in the basin.
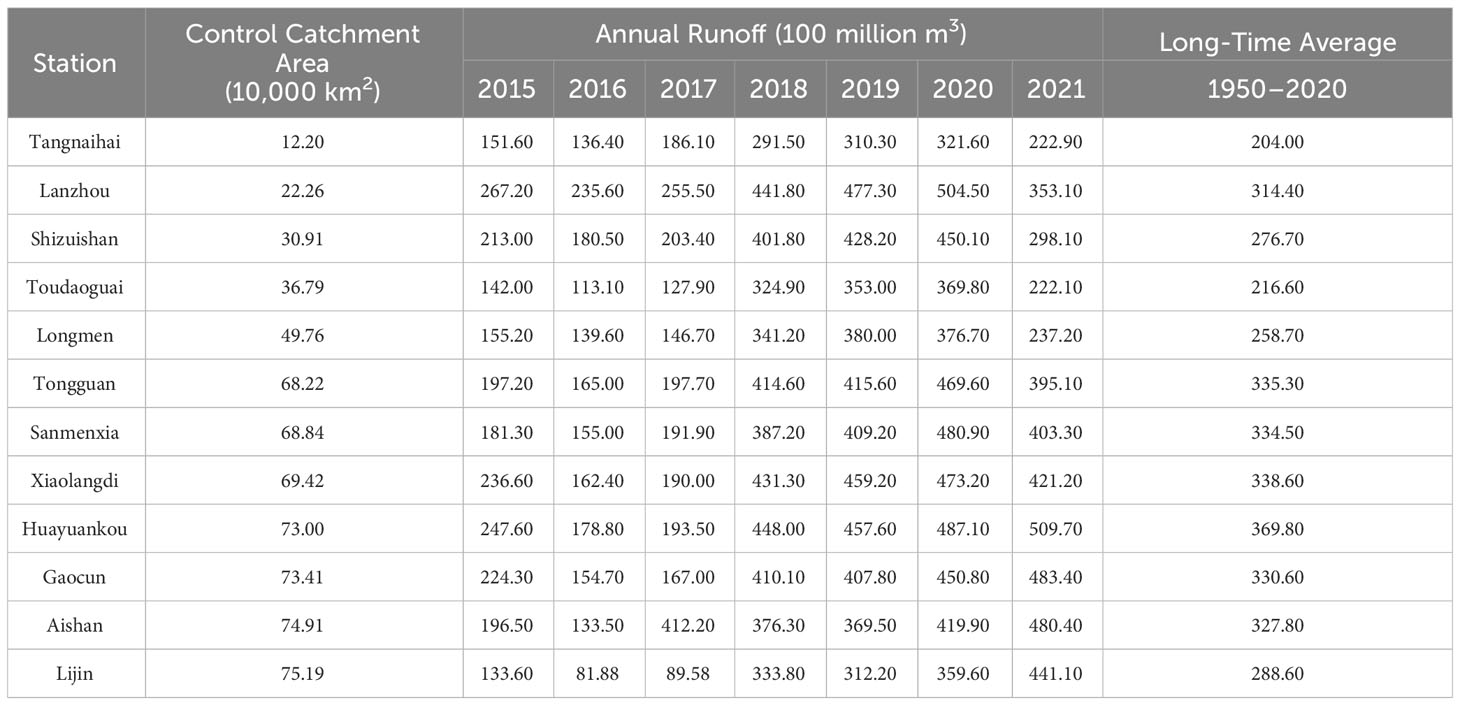
Table 3 Statistical table on annual runoff of hydrologic monitoring stations along the Yellow River mainstem between 2015 and 2021.
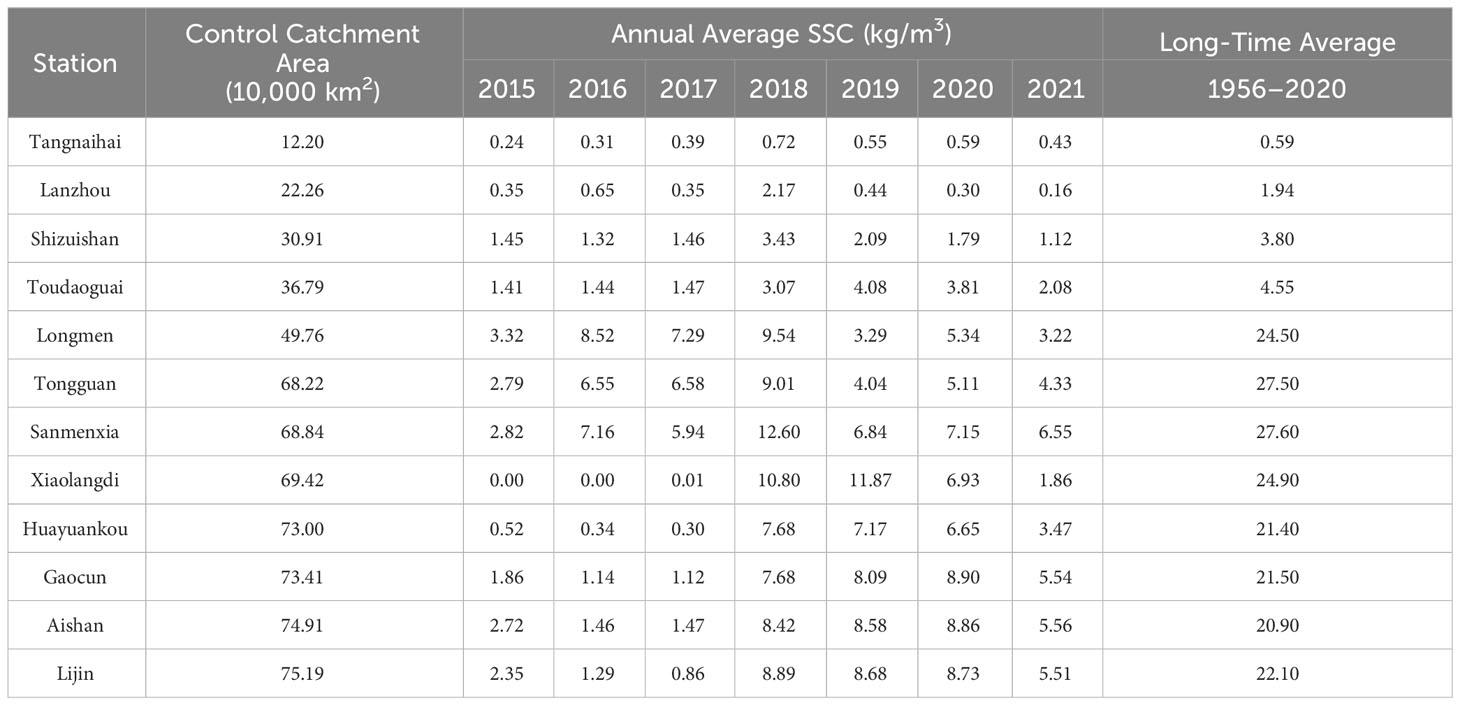
Table 4 Statistical table on annual average SSC of hydrologic monitoring stations along the Yellow River mainstem between 2015 and 2021.
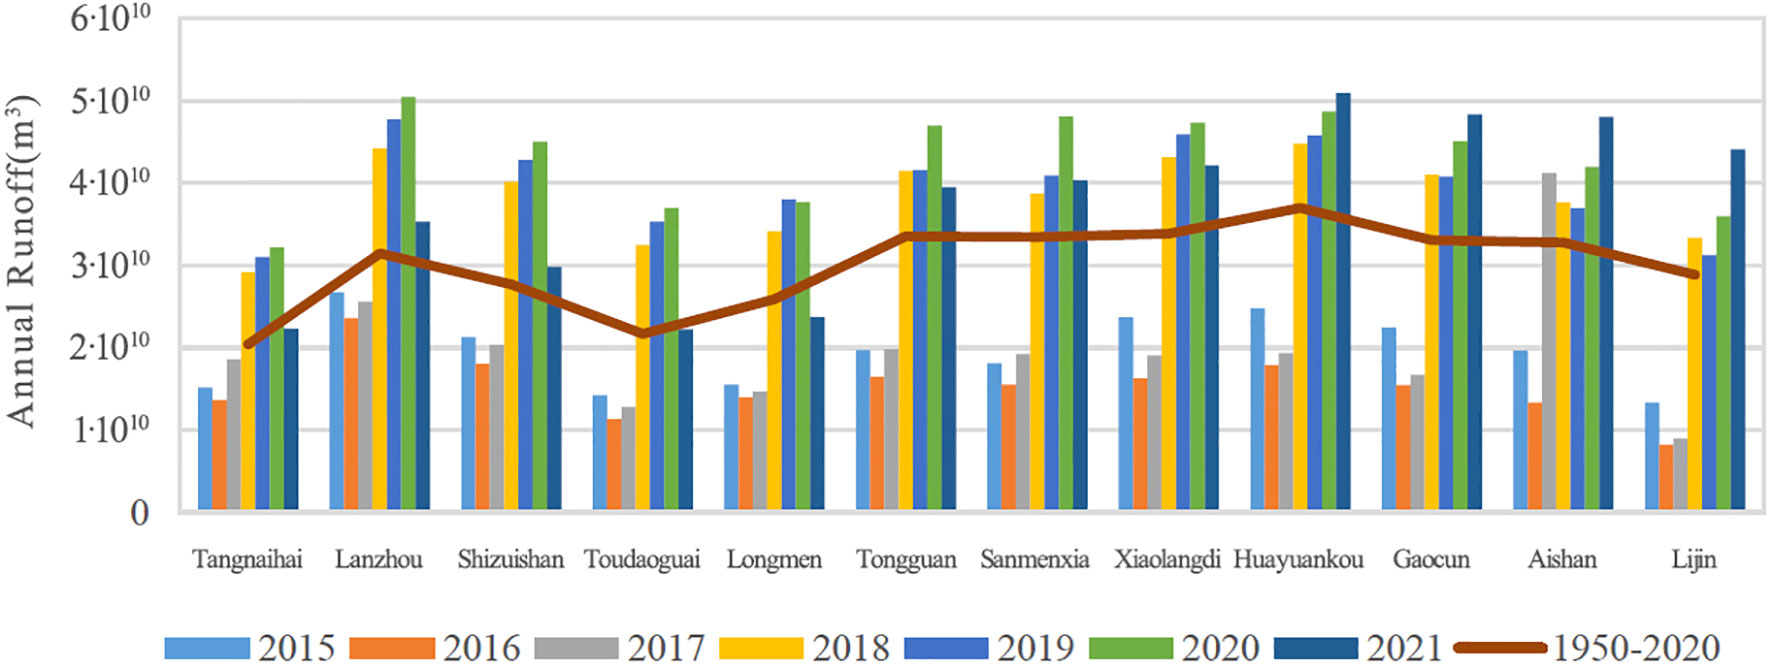
Figure 14 Statistical diagram on annual runoff of hydrologic monitoring stations along the Yellow River mainstem between 2015 and 2021.
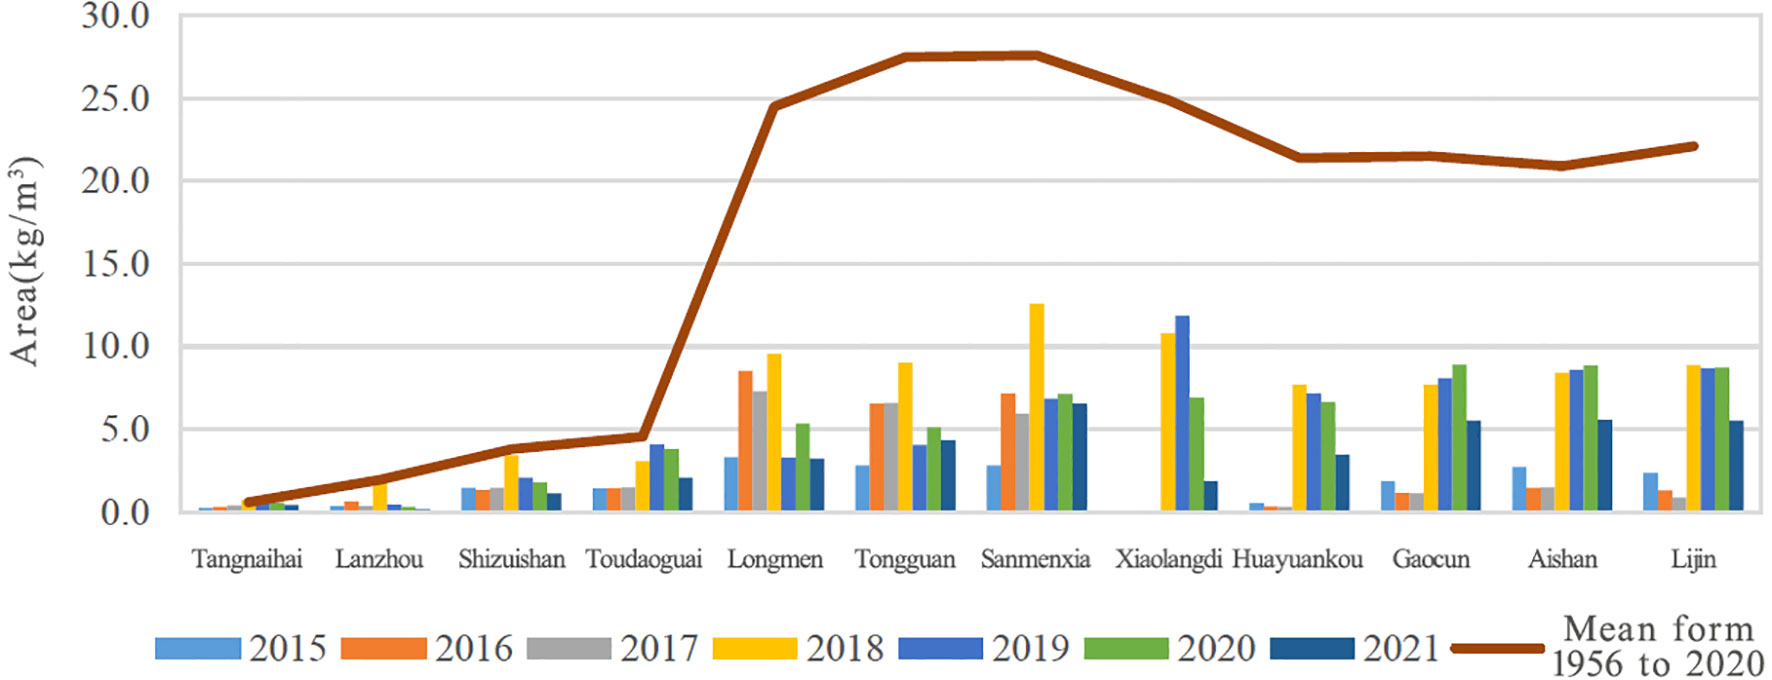
Figure 15 Statistical diagram on annual average SSC of hydrologic monitoring stations along the Yellow River mainstem between 2015 and 2021.
The conclusions of this paper are as follows:
(1) With MODIS-NDVI from 2000 to 2022 as the data source, the FVC data of the Yellow River Basin was inverted and calculated. Over this period, there was an overall upward trend in the average FVC, indicating a significant improvement in vegetation growth. When comparing the FVC differences between 2000 and 2022, we observed that over 97% of the area had seen significant vegetation improvement. In this way, the region’s previously dominant medium and lower vegetation cover has gradually been replaced by medium and higher vegetation cover types.
(2) From the analysis of the vegetation cover transition matrix and center migration in the Yellow River Basin in 2000 and 2022, it can be found that the transfer area from lower vegetation cover to higher vegetation cover is relatively large, reflecting the trend of gradually improving vegetation cover. The center of gravity of medium-high and above vegetation cover types gradually shifts from the upper reaches of the Yellow River to its middle and lower reaches.
(3) We analyzed the relationship between the spatiotemporal changes in vegetation cover in the Yellow River Basin and such factors as temperature, precipitation, terrain, soil, and human activity. The vegetation cover changes in the Yellow River Basin from 2000 to 2022 are highly correlated with temperature in some areas of the upper and middle reaches, while there is a certain correlation between precipitation and potential evapotranspiration in some areas of the central and southern regions. Since 2000, there has been a significant improvement in vegetation cover in areas with moderate terrain and geomorphic types, with the most significant improvement in vegetation cover with primary soil types (entisols). The implementation of national policies and soil and water conservation measures, especially the various soil and water conservation control measures implemented in early 2000, plays an important role in improving vegetation cover in the Yellow River Basin.
(4) We explored the impact of vegetation cover changes on the variation in runoff and SSC in the Yellow River Basin and demonstrated that improving vegetation cover plays an important role in regulating runoff and reducing SSC in the Yellow River Basin.
This study explores the changes in vegetation cover in the Yellow River Basin from 2000 to 2022, reveals their change regularity and influencing factors, and has certain significance for a macro understanding of vegetation dynamics in the Yellow River Basin, predicting its trends and impacts.
Based on the existing problems in current research, the future research directions are as follows Going ahead, our research will focus on the following aspects:
A large majority of data employed in current research on monitoring large-scale vegetation cover are medium- and low-resolution remote-sensing imagery, suggesting a lack of diverse data sources. Given that, spaceborne hyperspectral and radar images will be integrated with multi-source remote-sensing data under our follow-up research to monitor the structure, types, and growth of vegetation upon the inversion of their corresponding indicators. As the research goes further, the impact of vegetation changes on the basin’s hydrologic process and runoff will be revealed. At the same time, changes in vegetation cover and mechanisms for the basin’s carbon sinks related to soil and water conservation will also be researched from the perspectives of ecology and soil and water conservation.
The original contributions presented in the study are included in the article/supplementary material. Further inquiries can be directed to the corresponding author.
YW: Conceptualization, Data curation, Formal analysis, Investigation, Methodology, Project administration, Resources, Software, Supervision, Validation, Visualization, Writing – original draft, Writing – review & editing. XK: Conceptualization, Funding acquisition, Writing – original draft. KG: Methodology, Validation, Writing – original draft. CZ: Investigation, Validation, Writing – review & editing. JZ: Resources, Software, Writing – review & editing.
The author(s) declare financial support was received for the research, authorship, and/or publication of this article. This research was funded by the Basic R&D Special Fund of the Central Government for Non-profit Research Institutes (Grant No. HKY-JBYW-2023-08), the Excellent Young Talents Project of Yellow River Conservancy Commission (Grant No. HQK-202308), and the High-Resolution Earth Observation System Major Special Project (Grant No. 00-Y30B01-9001-22/23-CY-06).
The authors would like to acknowledge the data centers which provided data for this research, and the scholars who were engaged in relevant research.
The authors declare that the research was conducted in the absence of any commercial or financial relationships that could be construed as a potential conflict of interest.
All claims expressed in this article are solely those of the authors and do not necessarily represent those of their affiliated organizations, or those of the publisher, the editors and the reviewers. Any product that may be evaluated in this article, or claim that may be made by its manufacturer, is not guaranteed or endorsed by the publisher.
Cheng C., Shi J. H., Zhang S. W., Shui J. F., Cao X. P. (2022). A dataset of hydrogeomorphic quantitative analysis with 12.5 m spatial resolution in the Yellow River Basin. China Sci. Data 7 (04), 150–163. doi: 10.11922/11-6035.ncdc.2021.0019.zh
Cui J., Zhu M., Liang Y., Qin G., Li J., Liu Y. (2022). Land use/land cover change and their driving factors in the Yellow River Basin of Shandong Province based on Google Earth Engine from 2000 to 2020. ISPRS Int. J. Geo-Information 11 (3), 163. doi: 10.3390/ijgi11030163
Gitelson A. A., Kaufman Y. J., Stark R., Rundquist D. (2002). Novel algorithms for remote estimation of vegetation fraction. Remote Sens. Environ. 80 (1), 76–87. doi: 10.1016/S0034-4257(01)00289-9
Guo M. J., Zhang T. T., Zhang J. J., Chen L. L., Zhang X. P. (2014). Response of vegetation coverage to climate change in the Loess Plateau in 1982-2006. Res. Soil Water Conserv. 21 (5), 35–40.
Hashemi R., Madoliat R., Afshar A. (2016). Prediction of forming limit diagrams using the modified M-K method in hydroforming of aluminum tubes. Int. J. Material Forming 9 (3), 297–303. doi: 10.1007/s12289-014-1207-6
He Z., He J. P. (2012). Spatio-temporal variation of vegetation cover based on SPOT-VGT in Yellow River Basin. Ecol. Environ. Sci. 21 (10), 1655–1659.
He Z. J., Huang J. H., Pan Y. M., Zhang X. Y. (2010). Ecosystem characteristics and the lower reach ecology rehabilitation practice of the Yellow River Basin. Environ. Sustain. Dev. 35 (4), 9–13.
Hou P., Zhai J., Gao H. F., Xu Y. D., Wan H. W., Liu X. M. (2022). Spatiotemporal evolution characteristics and protection and restoration strategies of ecosystem in the Yellow River Basin. Environ. Prot. 50 (14), 26–28.
Idowu E. O., Johnson T. F., Ayorinde A. O., Akinola A. K. (2020). GIS and remote sensing-based analysis of the impacts of land use/ land cover change (LULCC on the environmental sustainability of Ekiti State, southwestern Nigeria). Environ. Dev. Sustainability 22 (2), 661–692. doi: 10.1007/s10668-018-0214-z
Jia K., Yao Y. J., Wei X. Q., Gao S., Jiang B., Zhao X. (2013). A review on fractional vegetation cover estimation using remote sensing. Adv. Earth Sci. 28 (7), 774–782.
Jiang D. W. (2018). Advancing with times and soil and water conservation moving forward in the reform and opening up. Soil Water Conserv. China 12, 20–23,84.
Jiang D. W. (2019). Soil and water conservation for ecological protection and high-quality development in the Yellow River Basin. China Water Resour. 21, 3–5,20.
Li J., You S. C., Huang J. F. (2006). Spatial distribution of ground roughness length based on GIS in China. J. Shanghai Jiaotong Univ. (Agricultural Science) 02, 185–189.
Li L. Y., Tian M. R., Liang H., Chen Y. M., Feng C. Y., Qu K. Y., et al. (2018). Spatial and temporal changes of vegetation coverage and influencing factors in Hulun Buir Grassland during 2000-2016. J. Ecol. Rural Environ. 34 (7), 584–591.
Li M., Zhang Y. (2023). Temporal and spatial variation characteristics and influencing factors of vegetation cover in the middle Yellow River Basin. J. Guizhou Normal University(Natural Sciences) 41 (1), 10–20.
Li Y. G., He D. M. (2009). The spatial and temporal variation of NDVI and its relationships to the climatic factors in the Red River basin. J. Mountain Res. 27 (3), 333–340.
Liu Z. P. (2013). Spatial distribution of soil nutrients and the impact factors across the Loess Plateau of China (China: Graduate School of the University of Chinese Academy of Sciences (Research Center of Soil & Water Conservation and Ecological Environment, Ministry of Education).
Liu Q. X., Dong G. T., Jing H. T., Zhou J. L., Dang S. Z., Jia P. P. (2019). Change trend of vegetation NDVI and its influencing factors in the source region of the Yellow River in the period from 2000 to 2016. Res. Soil Water Conserv. 26 (03), 86–92.
Liu G. B., Du S. (2015). Ecological functions of vegetation restoration in the loess plateau (Beijing: Science Press).
Liu C. M., Li Y. Z., Liu X. M., Bai P., Liang K. (2016). Impact of vegetation change on water transformation in the middle Yellow River. Yellow River 38 (10), 7–12.
Liu Y. H., Liu W. Y., Qiu P. Y., Zhou J., Pang L. K. (2023). Spatiotemporal Evolution and Correlation Analysis of Carbon Emissions in the Nine Provinces along the Yellow River since the 21st Century Using Nighttime Light Data. Land 12 (7), 1469. doi: 10.3390/land12071469
Liu L. L., Xiao F. J. (2006). Spatial-temporal correlations of NDVI with precipitation and temperature in Yellow River Basin. Chin. J. Ecol. 25 (5), 477–481.
Lu J. F. (2002). Effect of basin morphology on sediment yield in the middle reaches of the Yellow River. Geographical Res. 02, 171–178.
Meroni M., Fasbender D., Rembold F., Atzberger C., Klisch A. (2019). Near real-time vegetation anomaly detection with MODIS NDVI: Timelinessvs. Accuracy and effect of anomaly computation options. Remote Sens. Environ. 221, 508–521. doi: 10.1016/j.rse.2018.11.041
Mu S. J., Li J. L., Chen Y. Z., Gang C. C., Zhou W., Ju W. M. (2012). Spatial differences of variations of vegetation coverage in Inner Mongolia during 2001-2010. Acta Geographica Sin. 67 (9), 1255–1268.
Mu X. H., Song W. J., Gao Z., Mcvicar TR Donohue R. J., Yan G. J. (2018). Fractional vegetation cover estimation by using multi-angle vegetation index. Remote Sens. Environ. 216, 44–56. doi: 10.1016/j.rse.2018.06.022
Peng F., Fan W. J., Xu X. R., Liu X. (2017). Analysis of temporal-spatial change of vegetation coverage in Hulunbuir Steppe (2000-2014). Acta Scientiarum Naturalium Universitatis Pekinensis 53 (3), 563–572. doi: 10.1109/IGARSS.2016.7730177
Pettorelli N. (2005). Using the satellite-derived NDVI to assess ecological responses to environmental change. Trends Ecol. Evol. 20 (9), 503–510. doi: 10.1016/j.tree.2005.05.011
Ren T. C., Chen J. F., Liu N., Fan Q. (2023). Temporal and spatial variation characteristic and driving factors of seasonal vegetation coverage in the Yellow River Basin in Recent 40 Years. China Rural Water Hydropower 7, 94–104.
Rhyma P. P. A., Norizah K., Hamdan O., Faridah H., Zulfa W. A. (2020). Integration of normalized difference vegetation index and Soil Adjusted Vegetation Index for mangrove vegetation delineation. Remote Sens. Applications: Soc. Environ. 17 (C), 1–14. doi: 10.1016/j.rsase.2019.100280
Shen Z. Z., Yao W. Y., Xiao P. Q., Yao L. Y., Li M., Yang J. S., et al. (2020). Research progress of spatial distribution about geomorphology-vegetation-water erosion in the Pisha stone area of Yellow River. Hydro-Science Eng. 04, 64–71.
Shen W. C., Zhang J. J., Wang K., Zhang S. G., Lei H. Y., Song Y. K. (2022). Identification and differentiation of dominant ecological risks in the Loess Plateau: A case study of the middle Yellow River Basin. Acta Ecologica Sin. 42 (18), 7417–7429. doi: 10.5846/stxb202109272708
Sun R., Liu C. M., Zhu Q. J. (2001). Relationship between the fractional vegetation cover change and rainfall in the Yellow River Basin. Acta Geographica Sin. 56 (6), 667–672.
Wang J. H. (2017). Research on the impact of vegetation cover changes in water-wind erosion crisscross region of a basin on SSC variation. (China: Xi’an University of Technology).
Wang X. L., Shi S. H. (2022). Spatio-temporal changes of vegetation in the Yellow River Basin and related effect of landform based on GEE. J. Geo-information Sci. 24 (6), 1087–1098.
Wang X. L., Shi S. H., Chen J. Z. X. (2022). Change and driving factors of vegetation coverage in the Yellow River Basin. China Environ. Sci. 42 (11), 5358–5368.
Wang L., Zhu Q. A., Zhang J., Liu J., Zhu C. F., Qu L. S. (2023). Characteristics of water use efficiency during the changing process of vegetation in the Yellow River Basin. Acta Ecologica Sin. 43 (8), 1–13. doi: 10.5846/stxb202201040020
Wei X., Zhang L. F., He Y., Cao S. P., Sun Q., Gao B. H. (2023). Spatial and temporal variation characteristics of different vegetation types in Yellow River Basin and their influencing factors from 2000 to 2020. Remote Sens. Natural Resour 1–13.
Wu Q. X. (2005). Mechanisms and function regulation technics of soil and water conservation in forests (Beijing: Science Press).
Wu L. N., Yang S. T., Liu X. Y., Luo Y., Zhou X., Zhao H. G. (2014). Response analysis of land use change to the degree of human activities in the Beiluo River basin since 1976. Acta Geographica Sin. 69 (1), 54–63.
Xie B. N. (2016). Vegetation cover changes in the Loess Plateau and its response to climate change over the past 30 years. PhD Thesis (China: Northwest A&F University).
Yang S. T., Liu C. M., Sun R. (2002). The vegetation cover over last 20 years in Yellow River Basin. Acta Geographica Sin. 57 (6), 679–684.
Yellow River Conservancy Commission of MWR (2011a). Major characteristics of climate. (China, August: Yellow River Conservancy Commission of MWR). Report.
Yellow River Conservancy Commission of MWR (2011b). The scope and historical change of the basin (China, August: Yellow River Conservancy Commission of MWR). Report.
Yin Z. L., Feng Q., Wang L. G., Chen Z. X., Chang Y. B., Zhu R. (2022). Vegetation coverage change and its influencing factors across the northwest region of China during 2000-2019. J. Desert Res. 42 (04), 11–21.
Yuan L. H., Jiang W. G., Shen W. M., Liu Y. H., Wang W. J., Tao L. L., et al. (2013). The spatiotemporal variations of vegetation cover in the Yellow River Basin from 2000 to 2010. Acta Ecologica Sin. 33 (24), 7798–7806. doi: 10.5846/stxb201305281212
Zhang C. S., Hu Y., Shi X. L. (2016). Analysis of spatial-temporal evolution of vegetation cover in Loess Plateau in recent 33 years based on AVHRR NDVI and MODIS NDVI. J. Appl. Sci. 34 (6), 702–712.
Zhong X. H., Cheng G. W. (2001). An analysis of affection of forest vegetation change on flood: Take typical small watersheds and historical flood events in the upper reaches of the Yangtze River as examples. J. Mountain Res. 18 (5), 413–417.
Zhou Z. Y. (2020). Change in temporal-spatial pattern of vegetation coverage in Weichang County based on Landsat remote sensing image. Hydrogeology Eng. Geology 296 (06), 87–96.
Zhou X. S., Sun B. P., Zhao Y., Li J. R., Zhou W. Y., Wang T. S., et al. (2010). Study on the change and prediction of the land use/vegetation dynamic: Take the Shexian County in Hebei Province as an example. Chin. Agric. Sci. Bull. 26 (19), 306–311.
Keywords: fractional vegetation cover, Yellow River Basin, spatiotemporal change, driving force, MODIS
Citation: Wang Y, Kong X, Guo K, Zhao C and Zhao J (2023) Spatiotemporal change in vegetation cover in the Yellow River Basin between 2000 and 2022 and driving forces analysis. Front. Ecol. Evol. 11:1261210. doi: 10.3389/fevo.2023.1261210
Received: 19 July 2023; Accepted: 07 December 2023;
Published: 27 December 2023.
Edited by:
Nallapaneni Manoj Kumar, HICCER – Hariterde International Council of Circular Economy Research, IndiaReviewed by:
Yaohui Liu, Shandong Jianzhu University, ChinaCopyright © 2023 Wang, Kong, Guo, Zhao and Zhao. This is an open-access article distributed under the terms of the Creative Commons Attribution License (CC BY). The use, distribution or reproduction in other forums is permitted, provided the original author(s) and the copyright owner(s) are credited and that the original publication in this journal is cited, in accordance with accepted academic practice. No use, distribution or reproduction is permitted which does not comply with these terms.
*Correspondence: Xiangbing Kong, a29uZ3hiQGZveG1haWwuY29t
Disclaimer: All claims expressed in this article are solely those of the authors and do not necessarily represent those of their affiliated organizations, or those of the publisher, the editors and the reviewers. Any product that may be evaluated in this article or claim that may be made by its manufacturer is not guaranteed or endorsed by the publisher.
Research integrity at Frontiers
Learn more about the work of our research integrity team to safeguard the quality of each article we publish.