 Jinyu Li
 Yi Mao1,2
 Wei Chen
 Linyang Sun
- 1Tea Research Institute, Fujian Academy of Agricultural Sciences, Fuzhou, China
- 2State Key Laboratory of Ecological Pest Control for Fujian and Taiwan Crops, Institute of Applied Ecology, Fujian Agriculture and Forestry University, Fuzhou, China
In the context of anthropogenic global change, the study of landscape effects on species movement has garnered increasing attention. Landscape genetics offer indirect yet attractive means to capture species dispersal events across generations and their interaction with landscapes. However, landscape genetic patterns tend to exhibit significant variations across taxa and rely on the molecular makers adopted. Here, we investigated how landscapes influence population connectivity of an important tea pest, Empoasca onukii, using mitochondrial DNA sequences of 1,518 individuals from 57 locations in mainland China and offshore islands. We analyzed the inter-population genetic divergence and integrated multiple models to explicitly quantify their association with geographic distance, environmental heterogeneity, and landscape barriers. Analyses revealed a reduction in gene flow on islands, along the Yangtze River, and across mountainous regions of Western China. Models explicitly detected the predominant contributions of topographic complexity to population divergence and evidenced that mountains may serve as effective dispersal barriers for E. onukii. These results suggest that the limited gene exchange resulting from low population connectivity among mountains might generate the observed patterns of mitochondrial genetic variations, which contrasts the climate-related pattern previously observed on microsatellites. The findings enhance our comprehension of the evolutionary and epidemic dynamics of E. onukii, and highlight the demand of considering species-specific traits when studying population landscape genetic patterns. Moreover, the study emphasizes the necessity of employing multiple molecular markers to comprehensively elucidate landscape effects on population connectivity across diverse species for valuable insights into biodiversity conservation, pest control, and other management decisions.
1 Introduction
Dispersal, a fundamental biological process, plays a pivotal role in the spatial distribution, population dynamics, and functional connectivity of organisms (Trense et al., 2021). Within naturally diverse habitats where species navigate through a patchwork of landscapes, certain landscape features facilitate dispersal, which promotes genetic connectivity. However, other landscape features can emerge as barriers. Hence, the investigation of landscape-mediated effects on movement has become significant focus in the fields of anthropogenic global change, encompassing conservation biology (Bonnin et al., 2023) and the management of pest species (Bishop et al., 2021).
Historically, investigations into dispersal have mainly relied on traditional approaches, such as telemetry or tracking analyses (Villemey et al., 2016). However, these direct methods present challenges when studying species with small insects or when attempting to reveal past dispersal events and estimate long-distance movement (Trense et al., 2021). In this regard, molecular genetic techniques employed within the field of landscape genetics can offer alternative methods to capture dispersal events across generations and explore their relationship with landscape features. This indirect approach concentrates on the fact that dispersal coupled with reproduction can lead to gene flow, thereby enabling the investigation of how landscape features impede or facilitate dispersal through linking genetic patterns to landscape structure. Recently, an increasing number of studies have combined high-resolution genetic markers with informative spatial data through robust analytical models. This approach has proven effective in the evaluation of landscape resistance to dispersal and gene flow in diverse species (Bonnin et al., 2023). Although these studies have highlighted the taxon-specific factors influencing population connectivity (Myers et al., 2019), some of them have revealed that landscape genetic patterns can also be influenced by the molecular makers utilized (Balkenhol et al., 2015). For example, nuclear loci, such as microsatellites, exhibit high variability and can identify fine-scale contemporary patterns of gene flows and genetic structures, which can provide insights into recent connectivity losses (Blanton et al., 2019). In contrast, organelle DNA sequences which evolve at comparably slower mutation rates are more efficient at elucidating historical variations across extensive spatial scales and can shed light on long-standing connectivity losses (Blakney et al., 2014). Therefore, a comparative analysis of these two marker types can offer a more integrative understanding of the associations between population genetic connectivity and landscape dynamics.
The tea green leafhopper, Empoasca onukii Matsuda, stands as the predominant and widespread arthropod pest inflicting damage upon tea plants (Camellia sinensis (L.) O. Kuntze) in East Asia (Li et al., 2022). Nymphs and adult leafhoppers can employ their piercing-sucking mouthparts to sap the vital fluids from tender tea shoots and leaves. This can result in distinct symptoms, such as yellowing or hennaing along leaf edges, curling or withering of leaf tines, reddening of veins, and slowed or stunted growth of apical shoots. Adult female leafhoppers lay eggs into tender tea shoots and leaves, which can also stunt the growth of the tender shoots. Despite its diminutive size, E. onukii inflicts severe declines in tea yield and quality, leading to annual economic losses ranging from 15% to 50% (Li et al., 2022). However, the interaction between this pest’s movement patterns/genetic connectivity and heterogeneous habitats remains poorly understood. Small insects, including leafhoppers, are generally considered to have limited natural dispersal capabilities (Lo et al., 2019), which suggests that dispersal limitations enforced by landscape barriers might play a prominent role in shaping population structure. Interestingly, our previous landscape genetic study with the application of microsatellite data revealed that climatic differences, rather than landscape barriers, primarily structured the genetic divergence among E. onukii populations (Li et al., 2023). Nonetheless, it remains unknown whether analyses based on mitochondrial DNA (mtDNA) sequences would indicate different landscape genetic patterns and identify robust associations between long-standing landscape features and genetic differentiation. The integration of complementary analyses through applying both types of markers can greatly enhance our understanding of the dispersal mechanisms of this vital pest within natural populations. Such insights hold the potential to facilitate the predictions regarding their spread and damage potential, as well as can contribute to effective pest management strategies (Bishop et al., 2021).
In this study, we employed mtDNA sequence data to delve deeper into the characterization of spatially distinct genetic connectivity among populations of E. onukii. Furthermore, we conducted statistical assessments to determine the correspondence between this genetic connectivity and dissimilarities in environmental conditions (IBE), isolation driven by geographical distance (IBD), and landscape resistances (IBR) through adopting landscape genetic models. We tested the hypothesis that, in comparison to previous findings based on microsatellites, mtDNA analyses would reveal different landscape patterns and natural landscape features, such as mountains, rivers, and ravines, would act as barriers which could impede dispersal in E. onukii to consequently influence genetic connectivity.
2 Methods
2.1 Empoasca onukii sampling
During the outbreak season of E. onukii (June to October 2017), individuals were collected from 59 sites encompassing all 22 tea-growing provinces in China (Figure 1A; Supplementary Table S1). This comprehensive sampling approach facilitated the inclusion of a wide range of climate conditions, elevation gradients, and soil pH variations. Furthermore, the sampled locations were characterized by intricate topography, including towering mountains (e.g., Qinling Mountain), expansive plateaus (e.g., Tibetan Plateau), large rivers (e.g., Yangtze River), as well as nearby seas. This meticulous sampling scheme enabled the researchers to disentangle the influences of IBD, IBE, and IBR on the population genetic connectivity of E. onukii.
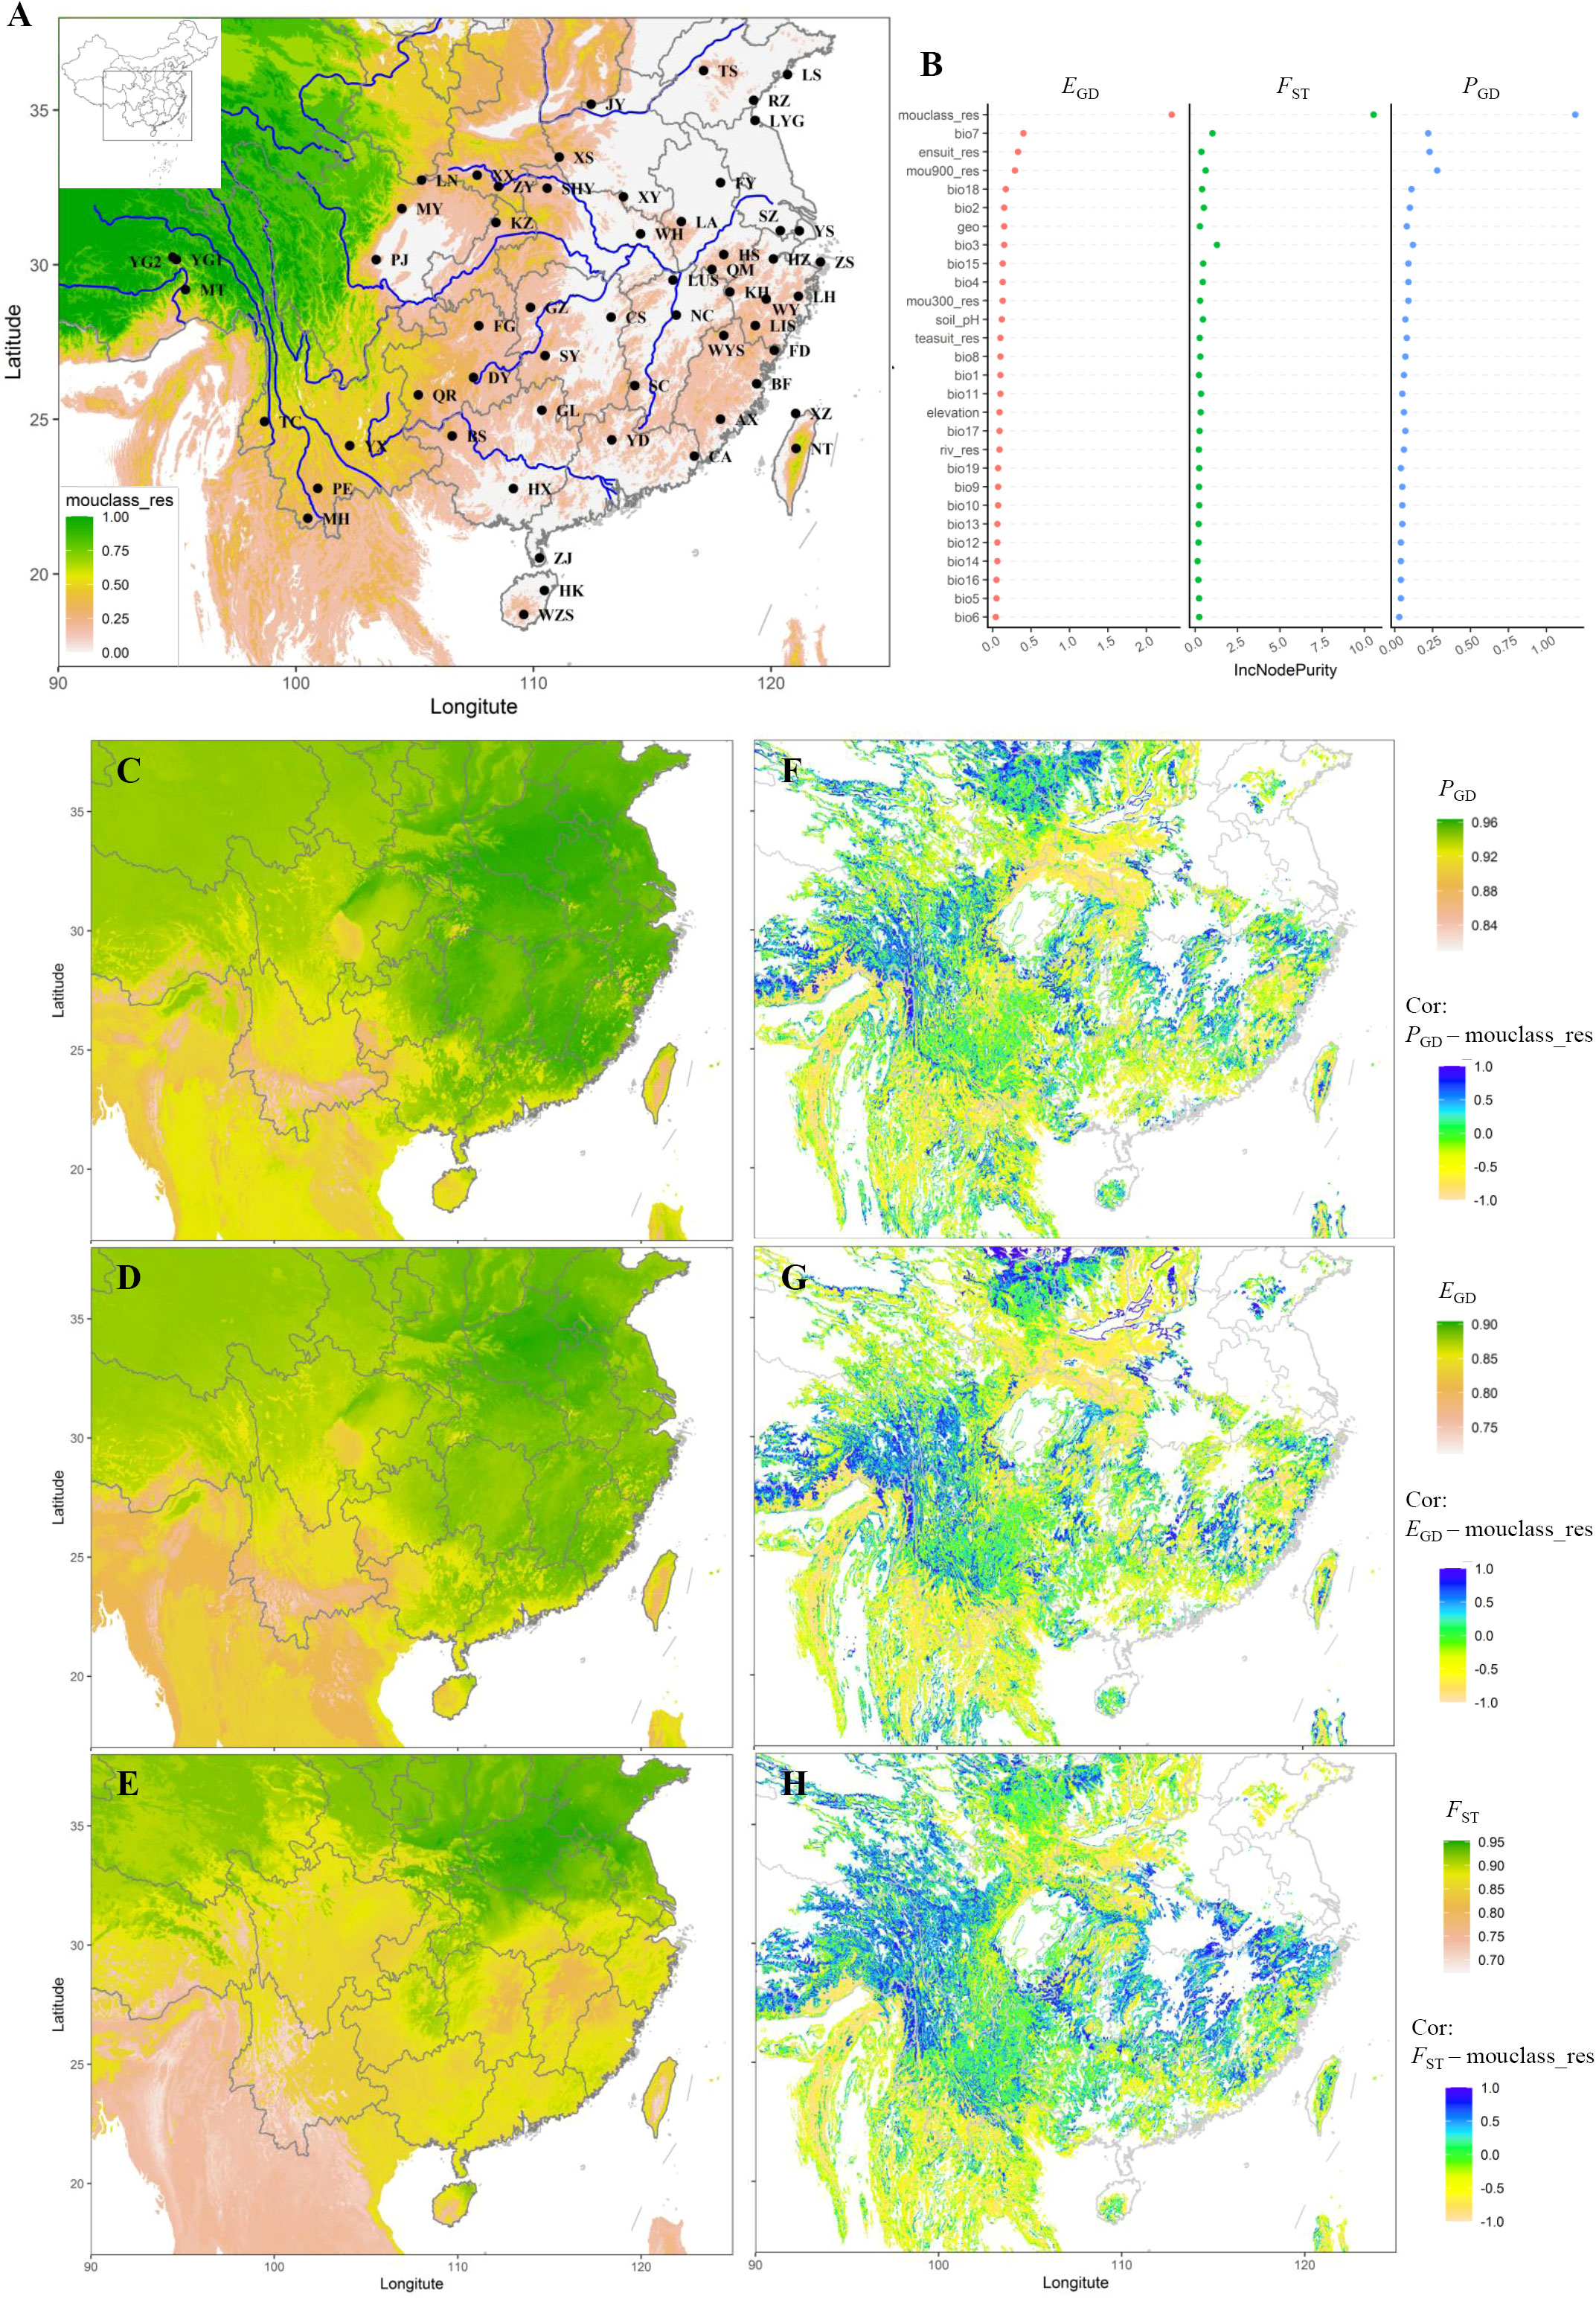
Figure 1 Geography, sampling locations, and predicted genetic connectivity of Empoasca onukii. (A) Locations of the 57 collection sites (see Supplementary Table S1) along with the main geographic barriers (rivers and mountains), shown by a mountain resistance (mouclass_res, the mountain resistance variable defining all mountains as barriers but modeling the resistance increasing with the height of mountains) gradient from white-pink (low) to yellow-green (high). (B) Variable importance plots for the final genetic connectivity models. Bio1-bio19 are the 19 bioclimatic variables, of which the detailed information are presented on https://worldclim.org and also in Supplementary Table S3. Riv_res, ele_res, ensuit_res, and teasuit_res are the explanatory variables related with landscape resistances, i.e., river, elevation, habitat suitability, and host availability, respectively. Mou300_res, mou900_res, and mouclass_res are the explanatory variables related with mountain resistances, but differ in defining only the mountains above 300m, only the mountains above 900m, and all mountains as barriers, respectively. (C–E) Scaled and transformed (1-scaled genetic distance) maps of genetic connectivity predicted by machine learning (random forest) models, shown by a connectivity gradient from white-pink (lowest) to yellow-green (highest). (F–H) Maps displaying the local Pearson’s correlations between the predicted genetic connectivity (1-scaled genetic distance) models and the top predictor variable (mouclass_res), shown by a correlation gradient from pink-yellow (negatively high) to green (low) to blue (positively high). The connectivity models were constructed using PGD (Prevosti’s genetic distance; C, F), EGD (Edward’s genetic distance; D, G), FST (pairwise FST; E, H) as response variables, respectively.
Field sampling was systematically conducted in old tea plantations situated in the prominent and historically significant tea-cultivating counties of each province. In each plantation, a minimum of 50 adult individuals were meticulously sampled from five to ten randomly selected plots. These selected plots were spaced at distances ranging from 20 to 100 m, and kept away from the edges of the tea plantation to prevent unintended sampling of other leafhopper species. To preserve the collected leafhoppers, individual specimens were placed in vials containing absolute ethanol. Subsequently, these samples were transported back to the laboratory and then stored at −80°C for further analyses.
2.2 Genetic data
Following a thorough morphological examination under a stereomicroscope (Qin et al., 2015) to validate their taxonomic identity, individual DNA extractions were performed with the TIANamp Micro DNA Kit (TIANGEN, Beijing, China). Subsequently, the extracted DNA was utilized for amplifying three mtDNA genes (COI, COII, and 16S rRNA), which successfully differentiated species of Empoascini leafhoppers or exhibited variation among E. onukii populations in previous studies (Demichelis et al., 2010; Fu et al., 2014; Zhou, 2014). Following the primers and protocols described by Demichelis et al. (2010), Zhou (2014), and Fu et al. (2014), the amplifications were conducted with a BIO-RAD C1000 TOUCH Thermal Cycler (Bio-Rad, Hercules, CA, USA). The resulting PCR products were then subjected to the analysis with an ABI 3730XL capillary sequencer (Applied Biosystems, Foster City, CA, USA). Each of the successfully amplified sequences was blasted with the complete mitochondrial genome (Liu et al., 2017) of E. onukii available in the NCBI database, and multiple sequence alignments were performed separately for each of the three genes through MAFFT (Katoh and Standley, 2013). The sequence data obtained from 1518 individuals sampled from 57 sites were utilized for subsequent analyses. However, individuals from the ES (Enshi) and RC (Rongcheng) sites were excluded from the analysis due to poor sequencing quality. To maintain consistent sequence lengths and ensure reliable alignment, the poorly aligned ends of the sequences were filtered, resulting in sequence lengths of 763 bp, 679 bp, and 435 bp for COI, COII, and 16S rRNA, respectively.
2.3 Environmental data
To obtain the most influential variables in predicting the mitochondrial genetic divergence of leafhoppers, we conducted a comprehensive analysis that simultaneously examined the impacts of IBD, IBE, and IBR.
For IBD (geographic distance, Supplementary Table S2), we employed the “Vincenty (ellipsoid)” method (Vincenty, 1975) implemented in the R package ‘geosphere’ (Hijmans et al., 2022) to calculate the shortest geographic distances between sites.
For IBE, we utilized climatic variables, elevation, and soil pH. The soil pH was particularly selected due to its significant association with tea plant growth (Han et al., 2018), which, in turn, can influence the productivity, distribution, and evolutionary dynamics of the leafhopper populations. For climatic and elevation factors, we obtained data of the current 19 bioclimatic variables (Supplementary Table S3; Fick and Hijmans, 2017) and elevation at a resolution of 30 s (approximately 1 km) from https://worldclim.org. Soil pH data at a resolution of 250 m (at a depth of 30 cm) were acquired from http://data.isric.org specifically for the pH analysis. The soil pH data were subsequently transformed to a resolution of 30 s in the R package ‘raster’ (Hijmans et al., 2023) for analyses. To mitigate collinearity or autocorrelation issues, we initially examined the correlations among these 21 variables in the R package ‘enmtools’ (Warren et al., 2010). Variables with correlations (|r|) below 0.7 were remained, while for the two variables with correlations (|r|) above 0.7, the one known to be important determinants of insect growth was selected for the following analyses. The selection ultimately resulted in the retention of soil pH and five bioclimatic variables (Supplementary Table S2): Isothermality, Max Temperature of Warmest Month, Precipitation Seasonality, Precipitation of Warmest Quarter, and Precipitation of Coldest Quarter. Through applying the R package ‘raster’, we extracted the environmental variation associated with each sampling site from these six layers at a resolution of 30 s.
For IBR, we generated seven resistance surfaces (Supplementary TableS2) to represent the hypothesized resistance of specific landscape features to leafhopper gene flow. These surfaces were created for mountains, rivers, elevation, habitat suitability of E. onukii, and availability of tea plants. Rivers and mountains were selected due to their known influence as barriers to gene flows in previous studies, particularly the Yangtze River, Huaihe River, Qinling Mountain, and Tibetan Plateau (e.g., Wei et al., 2015). For the rivers, we obtained a shape file of rivers from https://www.naturalearthdata.com and assigned a value of 1 to rivers and 0 to land, with the rivers defined as barriers, so as to generate a resistance surface (“riv_res”). For the mountain resistance surfaces, we utilized the K1 and K3 mountain resources from https://rmgsc.cr.usgs.gov/gme/. Three types of resistance surfaces were generated as follows: (a) through utilizing the K3 resource, we defined mountains above 300 m as barriers and employed this criterion as a threshold to assign low versus high resistance (assigning values of 0 and 1 to mountains below and above 300 m, respectively) (“mou300_res”); (b) with the K3 resource, we defined mountains above 900 m as barriers and used this criterion as a threshold to assign low versus high resistance (assigning values of 0 and 1 to mountains below and above 900 m, respectively) (“mou900_res”); (c) based on the K1 resource, we defined all mountains as barriers, with resistance increasing proportionally to mountain height, as well as assigning normalized values ranging from 0 to 1 (“mouclass_res”). In addition to investigating elevation dissimilarity in IBE, we generated a resistance surface to model the potential impact of topographic complexity on dispersal routes and gene flow patterns. Through the application of the same digital elevation data, we defined resistance values based on elevation, assigning normalized values ranging from 0 to 1 to generate a surface (“ele_res”). Finally, habitat suitability and tea plant availability were selected as resistance surfaces because these factors tended to restrict the potential dispersal routes and gene flows among populations. To obtain resistance surfaces related to habitat suitability and tea plant availability, we employed MaxEnt 3.4.1 (Phillips et al., 2006) to construct ecological niche models for E. onukii (“ensuit_res”) and C. sinensis (“teasuit_res”) as detailed in Li et al. (2023). From the seven generated resistance surfaces at a resolution of 30 s (ele_res, riv_res, mou300_res, mou900_res, mouclass_res, ensuit_res, and teasuit_res; Supplementary Table S2), we calculated resistance-distance values between each pair of the 57 locations through applying Circuitscape 5.0 (McRae et al., 2016) implemented in Julia, based on circuit theory. In the analysis, rivers, mountains, and elevation were considered as dispersal barriers, and thus regarded as “resistance” in the Circuitscape analysis, where higher surface values indicated increased limitation rates of leafhopper gene flows. Regarding habitat suitability and tea plant availability, we assumed that E. onukii could be more likely to occur (or to exist) in its suitable habitats and in habitats suitable for its host plant (tea). In addition, we assumed a stepping-stone dispersal model for E. onukii, based on its limited flight capabilities (Bian et al., 2014), and considering the observed patterns of isolation by geographic distance among the sampled populations. Consequently, high values of habitat suitability and tea plant availability were regarded as facilitators of dispersal and were employed as “conductance” parameters in the Circuitscape analysis. Greater surface values of these two factors indicated higher rates of gene flows in E. onukii.
2.4 Analyses of population genetic diversity
Genetic diversity was firstly evaluated for each population through calculating the number of haplotypes (H) and haplotype diversity (h) in DnaSP 6.12.1 (Rozas et al., 2017), and estimating nucleotide diversity (π) with ARLEQUIN 3.5.2 (Excoffier and Lischer, 2010).
2.5 Analyses of population genetic differentiation
Previously, population differentiation was examined through the calculation of pairwise FST values (FST) in ARLEQUIN 3.5.2, with coalescent tree construction and phylogenetic relationship analysis conducted (Li et al., 2022). In this study, to further capture discrete genetic variation and explore potential correlations with geographical and landscape factors, we additionally calculated pairwise Prevosti’s genetic distance (PGD; Prevosti et al., 1975; Kamvar et al., 2014) and Edwards’ genetic distance (EGD; Cavalli-Sforza and Edwards, 1967) using the R package ‘adegenet’ 2.0.0 (Jombart et al., 2010), based on the concatenated three mitochondrial genes. PGD has been recognized as an absolute genetic distance (Prevosti et al., 1975), while EGD has been estimated as a Euclidean distance and has demonstrated robust performance in the presence of missing data (Bishop et al., 2021). Notably, FST differed from PGD and EGD in that it exclusively considered the data pertaining to only the two populations concerned, rather than encompassing the entire pool of population data simultaneously (Weir, 1990). Hence, all three distinct measures of genetic distance were estimated and subsequently utilized as response variables associated with spatial data.
Principal coordinates analysis (PCoA) was then performed using GenAlEx 6.503 (Peakall and Smouse, 2012) to better understand how the populations genetically grouped. Analyses were conducted based on the generated matrices of the PGD, EGD, and FST, respectively.
To identify non-IBD patterns in genetic differentiation across China, we employed the Estimated Effective Migration Surface (EEMS; Petkova et al., 2016) based on matrices of the PGD, EGD, and FST, respectively. The EEMS can model genetic variation by considering migration rates in relation to geographic factors, which can generate an estimated effective migration surface to reveal the regions where population divergence and gene flows deviated from the expected patterns of the IBD. By utilizing EEMS as an exploratory tool, we aimed to identify regions of the landscape that could potentially serve as dispersal corridors, exhibiting higher-than-expected gene flows, as well as those acting as biogeographic barriers which might impede gene flow. To capture the explicit and continuous genetic variations, we partitioned the landscape into demes and modeled the dispersal of individuals between neighboring demes. The EEMS analysis was run with a deme size of 1,200. Each analysis consisted of three independent chains, running for 5 × 10⁶ Markov chain Monte Carlo (MCMC) iterations, after a burn-in of 1 × 10⁶ iterations. The thinning was performed at intervals of 5,000 iterations, and distinct starting seeds were adopted for each run. To ensure convergence, posterior plots from independent runs were compared with the R package ‘rEEMSplots’ (Petkova et al., 2016). Subsequently, outputs from the three runs were combined and visualized.
2.6 Effects of ecological factor on population genetic differentiation
In landscape genetics analyses, it has been recommended to employ various approaches and models to ensure robust conclusions (Balkenhol et al., 2015). Thus, to elucidate the relationship between dissimilarity in leafhopper mitochondrial variation among sites and the environmental distance (IBE), as well as the degree of isolation between these sites (IBD and IBR), we adopted a comprehensive approach which combined Mantel tests, multiple regression models, and machine learning methods.
2.6.1 Mantel tests
To examine the presence of IBD, we initially conducted simple Mantel tests to evaluate the correlation between leafhopper genetic distance (PGD, EGD, and FST) and geographic distance. Subsequently, we performed partial Mantel tests to investigate the relationships between genetic distance and all landscape and environmental dissimilarity matrices, when controlling for the geographic distance. We separately applied the Mantel analyses for PGD, EGD, and FST using the R package ‘ecodist’ (Goslee and Urban, 2007) with 10,000 permutations.
2.6.2 Multiple regression models
Multiple regression on distance matrices (MRM) The matrices representing landscape resistance, environmental dissimilarity, and geographic distance were simultaneously subjected to the application of MRM analysis with the R package ‘ecodist’, against the genetic distance matrices (PGD, EGD, and FST). Prior to the MRM analyses, all matrices underwent correlation testing by the cor function in R. Only the matrices without strong correlations (r < 0.8) were retained for subsequent analysis. In the initial full MRM model, we thus included 10 matrices (Isothermality, Precipitation Seasonality, Precipitation of Warmest Quarter Precipitation of Coldest Quarter, mou300_res, mou900_res, mouclass_res, riv_res, ensuit_res, and geographic distance; Supplementary Table S2) as the predictors of genetic distance. To identify the final models, a backward elimination procedure was implemented, incorporating 10,000 permutations. Non-significant variables (P > 0.05) were progressively eliminated from the initial full model, and the significance of the remaining variables was reevaluated until no additional variable achieved statistical significance.
Generalized dissimilarity modelling (GDM) In addition to the MRM analysis, we employed GDM (Ferrier et al., 2007) to fit non-linear relationships between environmental and distance variables and leafhopper genetic variation. Similar to MRM, GDM aimed to identify the variables that significantly contributed to genetic divergence and assess the model fit by reporting the percentage of deviance explained. We utilized it to estimate the percentage of leafhopper genetic variation explained by a specific predictor or a set of predictors. Seven independent models were constructed, each incorporating different combinations of predictor variables: (1) IBD, IBE, and IBR; (2) IBD and IBE; (3) IBD and IBR; (4) IBE and IBR; (5) IBD only; (6) IBE only; and (7) IBR only. These models were implemented through applying the R package ‘gdm’ (Fitzpatrick et al., 2022), with separate analyses conducted for PGD, EGD, and FST as response variables.
Redundancy analysis (RDA) We also utilized distance-based redundancy analyses (dbRDA; Legendre and Anderson, 1999), a constrained linear ordination technique, to further investigate the impact of geography and environment on leafhopper genetic differentiation. The dbRDA analysis was performed with the R package ‘vegan’ (Oksanen et al., 2022). To perform dbRDA, the genetic distance matrices (PGD, EGD, and FST) were initially transformed into continuous rectangular vectors using principal coordinates analyses with the cmdscale function. These vectors served as response variables, while the predictors included point estimates of the five bioclimatic variables (Isothermality, Max Temperature of Warmest Month, Precipitation Seasonality, Precipitation of Warmest Quarter, and Precipitation of Coldest Quarter), soil pH, habitat suitability (ensuit_res), and host availability (teauit_res) at each sampling site. Additionally, the coordinates of sampling sites (latitude; longitude) were included as predictors to account for the influence of IBD, as distance matrices cannot be directly used in RDA. Furthermore, considering its significance in other analyses, the matrices related to mouclass_res were transformed into principal components of neighborhood matrices (PCNM) through utilizing the pcnm function. The first half of positive eigenvectors (PCNM1–14) was retained as explanatory variables for the RDA. To mitigate high multicollinearity among predictors, a series of RDAs were performed. Initially, all 24 variables were included in the first model. In subsequent rounds, the variable with the highest variation inflation factor (VIF) was excluded until all VIFs were below 10. Forward model selection was employed with the ordiR2step function to identify a minimal (optimal) model, with the estimation of variable importance. The significance of both the initial full model and the final optimal model were independently assessed with 9,999 permutations through the anova.cca function, and the percentage of genetic variation explained by these models was reported. With the optimal model, partial RDAs were conducted to estimate the independent effects of the environmental variables while controlling for geographic location, as well as the effect of geographic location when controlling for environmental variables.
2.6.3 Machine learning approach
In contrast to the conventional link-based approaches utilized in our studies, machine learning methods offer an alternative approach to enhance our comprehension of landscape impacts on genetic variation within species. These methods can directly model the genetic connectivity of species through adopting ecological raster layers and distinguish the true layers that contribute to genetic differentiation. This approach can eliminate the reliance on calculating ecological distances, such as geographic distance, cost distance, or environmental dissimilarity, without subsequently relating them to pairwise genetic distances between individuals or populations.
In this study, we adopted random forest regression (RF), a widely employed machine learning technique, which has been known for its ability to model nonlinear relationships in landscape analysis without overfitting, while accommodating correlated ecological variables and data (Bishop et al., 2021). Our RF model was constructed based on the predictors derived from ecological raster layers at a 30-s (1-km) resolution, encompassing 21 IBE variables (i.e., 19 bioclimatic variables, elevation, and soil pH) and 6 IBR variables (i.e., mou300_res, mou900_res, mouclass_res, teasuit_res, ensuit_res, and riv_res). Considering the distinct representation of surface values between suit_res (i.e., ensuit_res and teasuit_res) and other IBR layers, we transformed the suit_res projection to 1-suit_res, and generate new layers where increasing values indicated higher limitation rates of connectivity. Additionally, IBD was incorporated by creating a uniform raster where each 1 × 1 km pixel was assigned a value of 1. For each of the 21 IBE variables, we extracted the median value along straight paths (n = 1,596 paths) between sampling sites (n = 57 sampling sites). Similarly, for IBR and IBD variables, we calculated the sum of resistance values along the 1,596 straight paths. Through applying this extracted spatial dataset encompassing 28 variables, 57 sampling sites, and 1,596 paths, we constructed an RF model with genetic distance (PGD, EGD, and FST) between pairs of sampling sites serving as a proxy for genetic connectivity. The model was projected to generate a map depicting predicted genetic connectivity with certain R packages, including ‘random Forest’ (Liaw and Wiener, 2001), ‘raster’, ‘spatstat’ (Baddeley and Turner, 2005), and ‘sp’ (Pebesma and Bivand, 2005). To assess the performance of the model, we employed the R-squared metric which was generated through a bootstrapping procedure that involved randomly selecting training sets and comparing the average predictions with the respective testing sets excluded from the model. Furthermore, to evaluate the model’s performance across different subsets of the data, we employed leave-one-out cross-validation, calculating the root mean square error (RMSE) for each of the 57 cross-validation runs (representing all 57 sampling sites; Figure 1). We also calculated RMSE values to reflect the accuracy of our projected connectivity map for each run of leave-one-out cross-validation, through extracting the predicted median genetic distance values along straight paths between sampling sites from the testing data and comparing them to the observed genetic distance values. Additionally, variable importance was evaluated based on the increase in node purity, a parameter that remains unaffected by correlations between variables. This measure was estimated by assessing the decrease in the residual sum of squares resulting from splitting on each variable, and the values were averaged across all trees in the RF model. To better understand the ecological drivers of genetic connectivity, we used the corLocal function in the R package ‘raster’ to compute the Pearson’s correlation coefficient between projections of genetic connectivity and the top predictor variables reported by our RF models.
2.7 Correlation between elevation and population genetic diversity
To gain a better understanding of the interaction between the top predictor variable (mountain resistance) and genetic connectivity, we constructed generalized linear models (GLM) between populations genetic diversity (H, h, and π) and elevation using the R package ‘stats’ (R Core Team, 2022).
3 Results
3.1 Population genetic diversity
The genetic diversity (Supplementary Table S1) varied among populations, with H ranging from 7 (MH, BF) to 34 (TS), h from 0.639 (YX) to 1 (DY), and π from 0.0014 (MH) to 0.0102 (BS). The mean values of H, h, and π across populations were 16.842 (SD = 5.441), 0.898 (SD = 0.097), and 0.005 (0.001), respectively.
3.2 Spatial pattern of population genetic differentiation
The estimations of PGD, EGD, and FST between sampling sites ranged from 0.02 to 0.30, 0.07 to 0.42, and −0.03 to 0.55, respectively, with the mean values of 0.07 (SD = 0.05), 0.16 (SD = 0.06), and 0.10 (SD = 0.12), respectively (Supplementary Figure S1).
The YX population was genetically unique in all of the three Principal Coordinate Analyses (PCoA; Figure 2). Additionally, results showed that most of the populations from the mountainous regions of Wester China (e.g., MH, PE, TC, PJ, MT, QR, MY, BS, DY) and some populations located at the South China region (e.g., BF, WZS, HZ, NC) tended to be genetically segregated from each other and also from other populations.
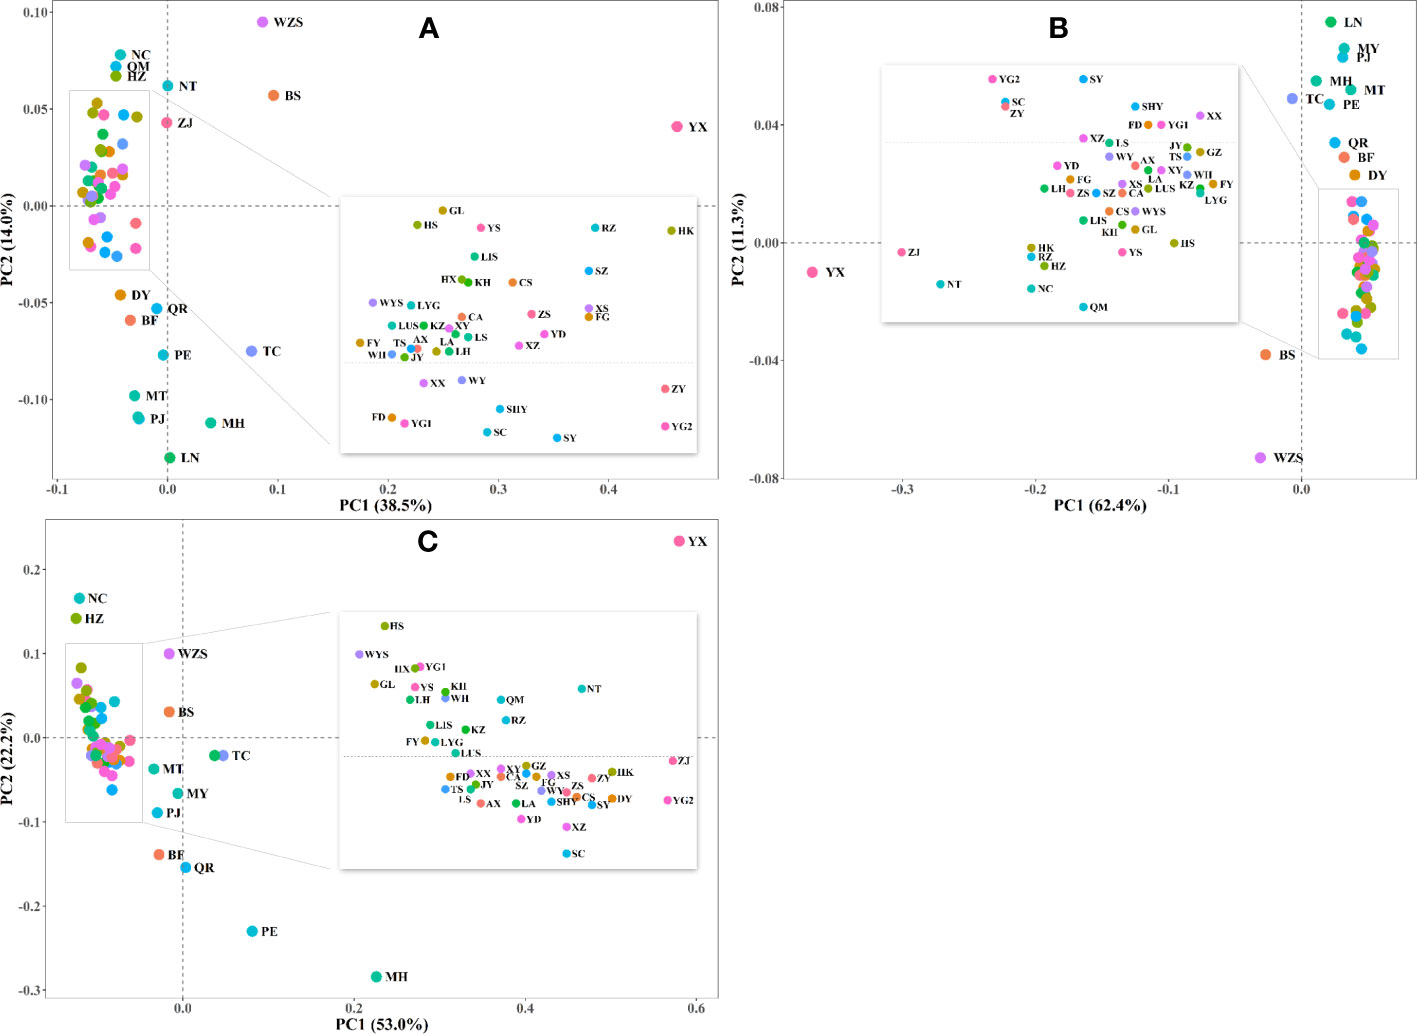
Figure 2 Principal Coordinate Analysis (PCoA) of Empoasca onukii based on (A) EGD (Edward’s genetic distance); (B) PGD (Prevosti’s genetic distance); and (C) FST (pairwise FST). Populations from different sample sites are indicated by circles with different colors. Information for sampling sites is presented in Figure 1 and Supplementary Table S1.
The EEMS analysis conducted on PGD, EGD, and FST (Supplementary Figure S3) consistently revealed the notable reductions in gene flows, across the majority of the populations inhabiting the mountainous regions of Western China, as well as the islands of Taiwan and Hainan. Additionally, similar patterns were observed among the populations situated along the middle and lower reaches of the Yangtze River.
3.3 Effects of ecological factors on population genetic differentiation
The results from the simple Mantel tests indicated a significant correlation between the geographic distance and all three genetic distance measures. When controlling for the impact of geographic distance through applying the partial Mantel tests, the variables significantly associated with all three genetic distance measures consisted of isothermality, max temperature of warmest month, mou300_res, mouclass_res, and ele_res (Table 1).
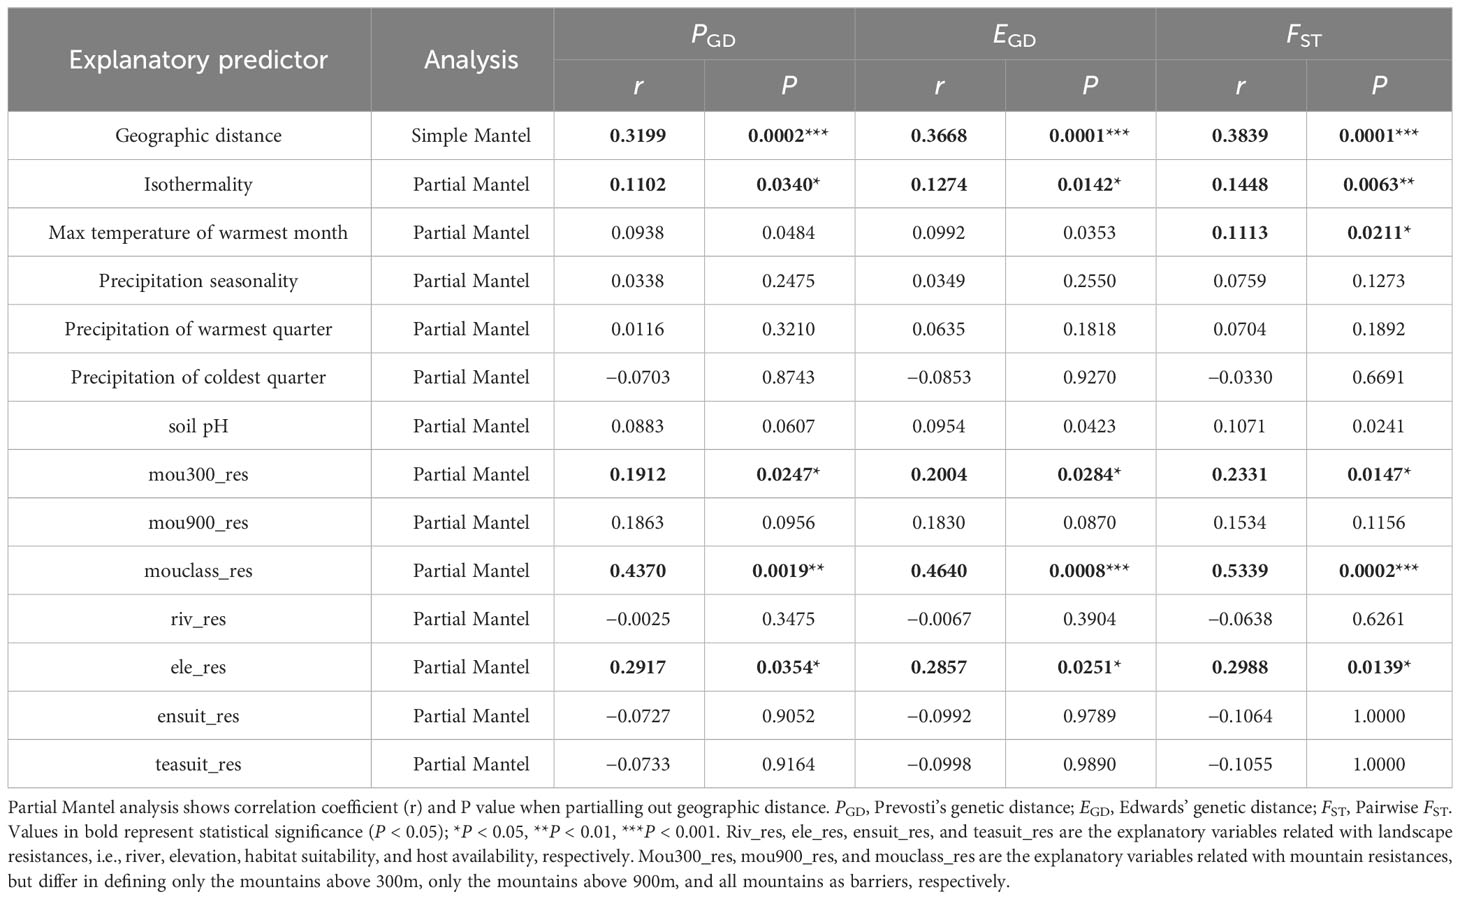
Table 1 Simple and partial Mantel tests between Empoasca onukii genetic differentiation and geographic distance/environmental dissimilarity/landscape resistance.
The MRM analyses (Table 2) utilizing PGD, EGD, and FST yielded similar results, with the final model including only geographic distance and mouclass_res after the backward selection procedure. These two predictors significantly explained 27.38% of the variation in PGD, 32.08% in EGD, and 35.39% in FST.
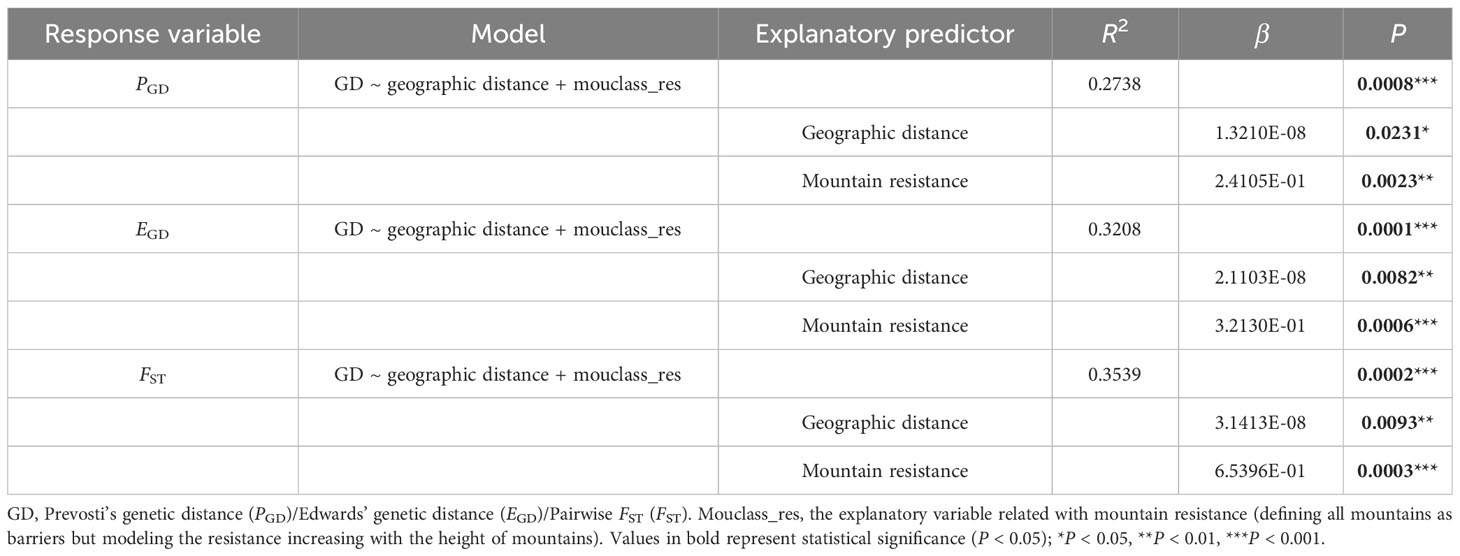
Table 2 Multiple regressions on distance matrices (MRM) with the inclusion of the explanatory variables and the proportion of the variation they contribute in the final model.
The GDM models (Table 3; Supplementary Tables S4–S6) combining all possible predictor variables significantly explained 37.71%, 38.95%, and 42.65% of the variation in PGD, EGD and FST, respectively. The variables contributing significantly to the full models remained consistent irrespective of the genetic indices, including geographic distance and mouclass_res. The GDM models incorporating IBR variables demonstrated similar predictive power to the full model, while those exclusively utilizing IBD, IBE or both tended to be insignificant and accounted for a smaller proportion of the variation. Among models incorporating IBR variables, mouclass_res consistently emerged as the main predictor, effectively explaining a substantial portion of the observed genetic dissimilarity. In models formed solely by IBD, IBE, or both, the variables of importance were geographic distance, isothermality, and max temperature of warmest month, though their significance was not consistently observed.
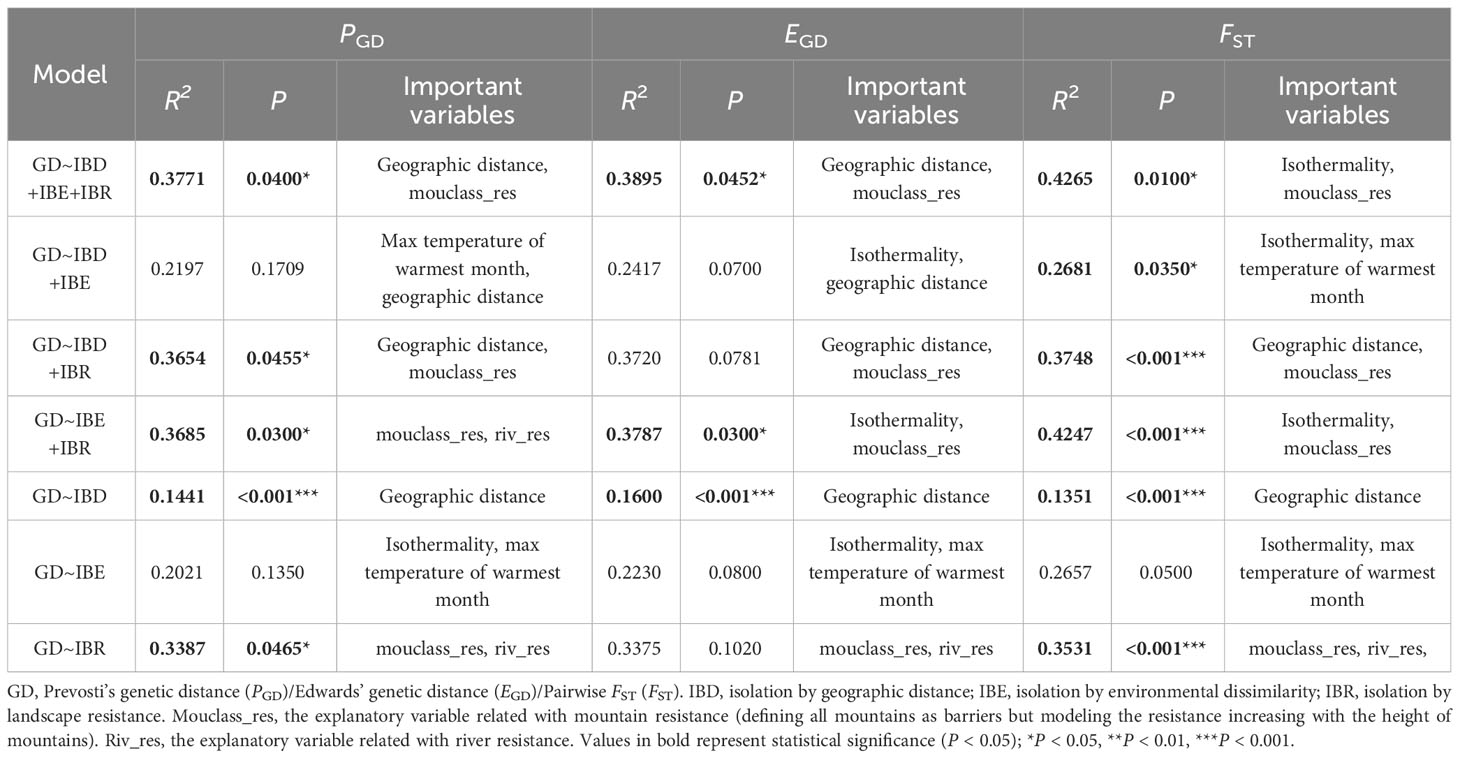
Table 3 Generalized dissimilarity modelling analyses (GDM) demonstrating the proportion of genetic divergence explained by geographic distance, environmental dissimilarity and landscape resistance, the statistical significance, and the particular variable that best explains genetic divergence in each of the models.
The RDA models (Supplementary Figure S3; Supplementary Table S7) incorporating all variables and the optimal models with selected minimal variables exhibited significant associations with the three genetic distance measures. Moreover, the optimal models, in particular, accounted for a considerable proportion of the genetic variance, explaining 29.34% in PGD, 28.49% in EGD, and 13.32%in FST. When controlling for geographic location (longitude) with partial RDAs, the environmental variables included in the optimal models consistently predicted nearly the same amount of genetic variance as the full optimal models (22.19% for PGD, 20.88% for EGD, and 8.36% for FST). In contrast, when controlling for environmental factors, the percentage of variation explained by geographical location was substantially lower (4.64% for PGD, 5.35% for EGD, and 2.50% for FST), while still statistically significant. The variables involved in the optimal models varied depending on the specific genetic indices, with PCNM4, PCNM2, and longitude being consistently present for all three indices.
The RF models demonstrated a substantial R-squared value of 0.63 for PGD, 0.65 for EGD, and 0.69 for FST, which indicated that the predictor variables accounted for 63% of the genetic variance in PGD, 65% in EGD, and 69%in FST. While the increase in node purity analyses consistently highlighted the prominent role of mouclass_res in the RF models (Figure 1B), irrespective of the genetic indices, the projected maps vividly illustrated diminished genetic connectivity across the mountainous region of Western China (Figures 1C–H). For assessing the performance of the models through leave-one-out cross-validation, the mean RMSE for model evaluation (Supplementary Figure S4A) across all 57 runs was 0.03 (SD = 0.00), 0.04 (SD = 0.00), and 0.06 (SD = 0.00) for PGD, EGD, and FST, respectively. Furthermore, the spatial evaluation (Supplementary Figure S4B) yielded RMSE values of 0.03 (SD = 0.02), 0.04 (SD = 0.02), and 0.07 (SD = 0.04) for PGD, EGD, and FST, respectively.
3.4 Correlation between elevation and genetic diversity
The GLM analyses (Figure 3; Supplementary Table S8) demonstrated that both the number of haplotypes (H; r = –0.350, R2 = 0.106, P = 0.008), haplotype diversity (h; r = –0.365, R2 = 0.117, P = 0.007) significantly decreased with increasing elevation.
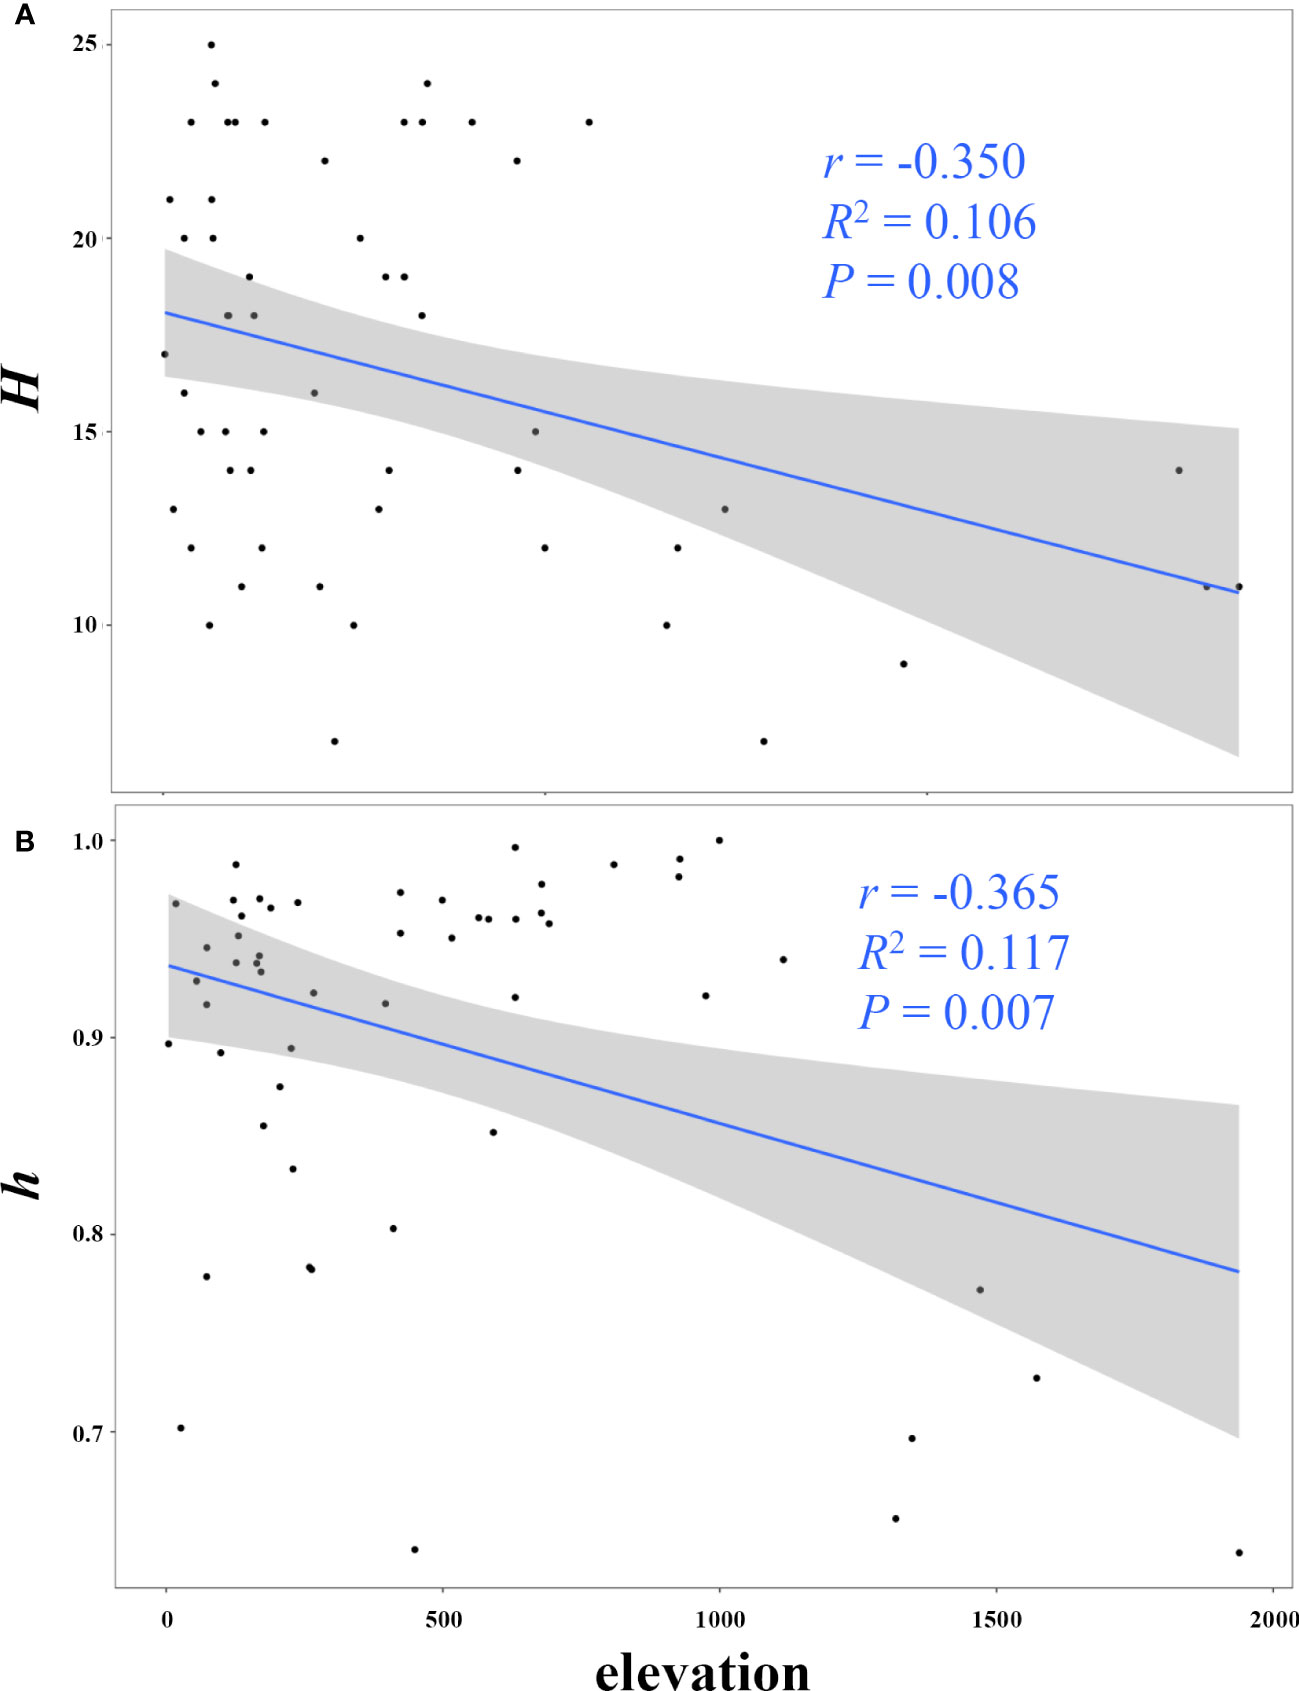
Figure 3 Linear correlation between elevation and mitochondrial genetic diversity (A, the number of haplotypes H; B, haplotype diversity h).
4 Discussion
In this study, we employed complementary analytical models to integrate spatial data with the mtDNA sequences of 1518 individuals of E. onukii sampled from 57 geographic locations across mainland China and offshore islands. Our findings revealed a distinct landscape genetic pattern in comparison to a previous study conducted on microsatellites (Li et al., 2023), with features of mountains detected to constrain dispersal and genetic connectivity in E. onukii and resistances from mountains identified as the predominant variable structuring mitochondrial variation in E. onukii populations.
4.1 Predominant role of mountains resistances in shaping mitochondrial genetic connectivity of Empoasca onukii populations
Previous studies have extensively documented the significance of long-standing landscape features, such as mountains and rivers, as prominent barriers to gene connectivity and drivers of genetic variation in various organisms (e.g., Noguerales et al., 2016; Trense et al., 2021). In the case of small-sized insect species characterized by limited dispersal capacity, strong associations between biogeographic barriers and genetic differentiation have been expected. Within our study region, the Yangtze River, as well as the complex topography of the Qinling Mountains and Tibetan Plateau, which are characterized by deep valleys and high mountains, have been previously recognized as effective impediments to gene flow in diverse species (e.g., Chilo suppressalis in Meng et al., 2008; Grapholita molesta in Wei et al., 2015; Pinus tabuliformis in Xia et al., 2018). Through our EEMS analysis, we observed distinct patterns of reduced gene flow on islands, along the course of the Yangtze River, and in the mountainous regions of Western China. Building upon these findings, in conjunction with our spatial clustering-based population structure analysis of E. onukii (Li et al., 2022), we postulated that landscape features might play a crucial role in driving genetic differentiation among E. onukii populations in China.
Our comprehensive analyses employing multiple models have consistently indicated the potential prominence of IBR in driving population divergence within E. onukii. Although the resolution of the raster layer representing river resistance (at 30-s resolution, approximately 1,000 m) may limit our ability to detect a direct association between functional connectivity and river permeability in this study, it is noteworthy that resistances associated with mountainous emerged as significant and predominant drivers of genetic variation in E. onukii. Additionally, our GLM analysis revealed that elevation was significantly and negatively associated with the number of haplotypes and haplotype diversity. And although the analysis did not detect a significant correlation between nucleotide diversity and elevation, populations at higher elevation tended to exhibit slightly higher nucleotide diversity. Nucleotide diversity is known as the average number of nucleotide differences per site in pairwise comparisons among DNA sequences, while haplotype diversity (also defined as gene diversity) refers to the probability that two randomly sampled alleles differ (Nei, 1987; de Jong et al., 2011). These lines of information suggest that the E. onukii populations at higher elevations show fewer haplotypes but greater nucleotide sequence difference from other populations, pointing towards genetically distinct populations with smaller effective size at high mountains compare those within low elevations. While this pattern observed here may be attributable to that the populations in high mountains more frequently experience sharp population contraction and strong environment selection due to the more variable climate there, it could also be a phenomenon formed because gene flow is restricted by mountain ridges as had previously been observed in other organisms (e.g., Rana luteiventris; Funk et al., 2005). Hence, mountains may impede genetic connectivity among E. onukii populations, aligning with the situations observed in other insect species that inhabit regions characterized by pronounced landscape heterogeneity (e.g., Noguerales et al., 2016).
Interestingly, the significant role of IBR in driving genetic divergence is not a universal outcome observed in numerous other organisms. For example, in Tetragonisca angustula bees across southern Brazil, the population divergence is primarily associated with ecological conditions and geographic distance rather than physical barriers (Francisco et al., 2017). Similarly, for 13 snake species across western North America, environmental heterogeneity rather than biogeographic barriers has been identified as the main driver of the population divergence (Myers et al., 2019). These findings suggest that species-specific traits play a crucial role in shaping population structure (Zamudio et al., 2016), and landscape genetic patterns are closely linked to life-history traits, dispersal capacities, and habitat preferences of each species (Myers et al., 2019). In the case of the leafhopper species we studied, the observed isolating mechanism of mountains in its populations could be attributed to its limited long-distance migration and weak dispersal ability. E. onukii serves as a small-sized insect, with adults measuring only about 3 mm in length (Qin et al., 2015). Although long-distance migration with the assistance of air streams has been documented in certain small insects such as Nilaparvata lugens (Hu et al., 2019), no such behavior has been observed in E. onukii. Due to their small size, E. onukii adults tend to be able to actively fly for only a few kilometers. Indoor tethered flight mill tests have confirmed the sedentary nature of E. onukii, as they tend to feed or perch behind tea leaves for most of their time and fly distances of less than 6 m (Bian et al., 2014). Furthermore, the species’ short generation time (9–15 generations per year; Qin et al., 2015) may also contribute to the observed patterns. It is widely recognized that species with short generation times are more likely to retain genetic signals left by historical dispersal routes interacting with habitat barriers and corridors (Noguerales et al., 2016). Additionally, the species’ limited feeding preferences likely augmented the pronounced isolating effects of mountains on its populations. E. onukii exhibits a marked preference for tea trees as its primary host plants (Shi et al., 2015). Feeding on other plants is sparsely reported, while elevation gradients have been evidenced as an important factor influencing the distribution of tea plants. Consequently, these host–plant associations may further limit population connectivity among mountain barriers (Noguerales et al., 2016). In addition to these species-specific traits, the successful detection of mountain resistances in this study may also be relevant with the marker type we employed, which will be discussed further in the following section.
Collectively, it is crucial to emphasize the significance of understanding species-specific traits in elucidating the landscape features that can promote gene flow and functional connectivity among populations, though determining the exact traits that contribute to these processes can be challenging. Furthermore, in theory, our findings can provide insights for E. onukii management strategies. Our multiple landscape genetics models demonstrated that mountains can serve as effective barriers to dispersal for E. onukii, which indicated a high likelihood of low population connectivity among mountainous regions. The potential for high isolation among mountains suggested that internal management efforts can be effective and highlight the demand of focusing on and controlling human-mediated dispersal from outside regions into these areas. Additionally, the presence of low-connected populations among mountains presented an opportunity to explore innovative pest control methods and to locally eradicate the leafhoppers. Moreover, the knowledge of mountains acting as dispersal barriers can aid in identifying regions with a low risk of reinvasion when planning spatially explicit management strategies. This information can also guide the placement of treatment technologies to block human-mediated dispersal from outside regions, such as the inter-regional transportation of tea plants. In fact, the recognition of isolated tsetse fly populations through population genetics has previously been applied to successfully plan pest control efforts in Senegal, which has led to the eradication of tsetse flies in specific areas and the opening of new agricultural zones (Bishop et al., 2021).
4.2 Understanding of the difference in landscape genetics patterns between mtDNA sequences and microsatellites
In contrast to the climate-related pattern observed in our previous study on microsatellites (Li et al., 2023), where ecology was proved to play a more prominent role than biogeography in population diversification, our mitochondrial analyses indicated that geography and gene flow were of more significance than ecology and selection in driving population differentiation. The combination of microsatellites and mtDNA sequences has been widely employed in population genetics studies across various species (e.g., Bonnin et al., 2023). However, a recent debate has emerged regarding the incongruence of the results obtained from these two markers and the preferred marker for population structure analysis or long-term monitoring of species in management programs (Muñoz-Valencia et al., 2023). Certain researchers have raised concerns about the utility of single-locus mtDNA and argued that limited mtDNA sequence data may not provide sufficient information to determine spatial genetic structure and a species’ true dispersal potential (e.g., Teske et al., 2018). On the other hand, others have reported that mtDNA still serves as an effective tool for broad-scale geographic studies, and simple mtDNA studies can serve as powerful initial surveys to gain insights into phylogeographic patterns and demographic history across environments. These insights can then guide more detailed investigations of selection and local adaptation in populations using nuclear genomic approaches (e.g., Bowen et al., 2014; Fonseca et al., 2023).
Despite the challenge of mitochondrial-nuclear microsatellite discordance and the criticism of single-locus studies, it has been widely acknowledged that these two markers evolve at different rates and can provide insights into different evolutionary events over time. Specifically, the evolutionary rates of mtDNA and microsatellites have been observed to be 5–10 and 100–1,000 times faster, respectively, than those of single-copy nuclear DNA (Wan et al., 2004). In other words, microsatellites evolve 10–200 times faster than mtDNA. The rapid mutation rate of microsatellites can lead to issues of saturation and homoplasy, where genetic information about past events may be effectively lost. As a result, microsatellites are more informative for studying recent and/or contemporary genetic mutations and are suitable for investigating patterns of genetic diversity and gene flow over shorter timescales. Comparatively, mtDNA retains more information about historical changes in genetic variation, making it the optimal option for resolving spatial patterns of gene flow and colonization over long timescales. These differences in evolutionary rates and the information captured by each marker may be the reason underlying the incongruent findings commonly reported among studies utilizing different markers, and can also explain the comparative results found between this study and our previous investigation based on microsatellites. The present distribution and connectivity of E. onukii populations across the landscape are the combined result of historical and contemporary forces. Long-standing natural barriers, such as mountains, represent historical mechanisms that have naturally and geographically isolated E. onukii populations, which has led to evolutionary processes such as changes in genetic diversity, population differentiation, and potentially even speciation. In addition to these long-term landscape features that have hindered population dispersal and exhibited their DNA signatures, contemporary factors, such as recent climate changes, can also impact the movement and gene connectivity of individuals among populations, leaving their marks on genetic structure. Thus, our mtDNA analyses successfully identified the prominent role of mountains as barriers to E. onukii population divergence, while the previous microsatellite study (Li et al., 2023) based on the same sampling system revealed that the spatial population structure of E. onukii has been primarily shaped by climatic differences. In light of these findings, it is evident that unrelated phenomena can leave their marks on genetic structure, and these different genetic signatures can be captured by diverse types of molecular markers. Hence, there is a demand of the combination of multiple markers to obtain a comprehensive understanding of intraspecific diversification and to facilitate the management of a species’ evolutionary history and contemporary interconnectedness.
Undoubtedly, both microsatellites and mtDNA genes are commonly utilized to investigate neutral processes and may not fully capture the genomic-wide variations associated with environmental adaptation (Álvarez et al., 2021). However, the identification of candidate adaptive loci is widely recognized as a valuable approach for gaining insights into potential adaptive divergence among populations and the capacity for local adaptation (Zimmerman et al., 2020). Although both marker types can generally inform us about population-level genetic differentiation and diversity, addressing questions related to local adaptation and evolutionary independence necessitates the inclusion of non-neutral loci. Notably, genomic-wide evidence can benefit the exploration of the candidate genes responsible for adapting to ecological gradients in natural populations, which consisting of not only responses to heat, but also precipitation, cold, and other environmental factors under strong selection pressures (Waldvogel et al., 2018). Considering E. onukii, conducting further studies through the application of the genomic-wide approaches would be valuable for elucidating the underlying mechanisms driving adaptive evolution in this species.
5 Conclusion
Our analyses, which integrated multiple landscape genetics models, have revealed the prominent role of topographic complexity in shaping the spatial distribution of mitochondrial genetic variation in a significant agricultural pest. This suggested that restricted gene flow, owing to limited population connectivity among mountainous regions, tended to cause the observed mitochondrial genetic structure in our study system. These findings represented a departure from those of our previous study employing microsatellite markers on similar populations (Li et al., 2023), and highlighted the importance of considering species-specific traits when investigating landscape-driven genetic patterns. This study emphasized the significance of employing multiple molecular markers concurrently to comprehensively understand the contribution of the landscape to spatial patterns of genetic differentiation across diverse species. In the future, investigations employing high-throughput sequencing at a genomic scale in conjunction with landscape genomic models, will offer further insights into the potential relationship between patterns of genetic variation and environmental features. A systematic exploration of the association between population genetic variation and various ecological factors holds the potential to provide valuable insights for biodiversity conservation, pest control, and other management decisions.
Data availability statement
The original contributions presented in the study are publicly available. This data can be found here: Figshare, doi: 10.6084/m9.figshare.23828526.
Ethics statement
The manuscript presents research on animals that do not require ethical approval for their study.
Author contributions
JL: Conceptualization, Data curation, Formal Analysis, Funding acquisition, Investigation, Methodology, Project administration, Resources, Software, Supervision, Validation, Visualization, Writing – original draft, Writing – review & editing. YM: Conceptualization, Data curation, Formal Analysis, Investigation, Writing – review & editing. KL: Data curation, Formal Analysis, Investigation, Methodology, Writing – review & editing. WC: Data curation, Formal Analysis, Investigation, Writing – review & editing. LS: Data curation, Investigation, Methodology, Writing – review & editing. BZ: Data curation, Investigation, Writing – review & editing.
Funding
This work was funded by Fujian Provincial Department of Science and Technology (2022J05080, 2022R1029007), and Fujian Academy of Agricultural Sciences (ZYTS202208).
Acknowledgments
We are thankful to Haifang He, Liwei Han, Hengyu Lu, Ruibin Xu for their help with the sample collections.
Conflict of interest
The authors declare that the research was conducted in the absence of any commercial or financial relationships that could be construed as a potential conflict of interest.
Publisher’s note
All claims expressed in this article are solely those of the authors and do not necessarily represent those of their affiliated organizations, or those of the publisher, the editors and the reviewers. Any product that may be evaluated in this article, or claim that may be made by its manufacturer, is not guaranteed or endorsed by the publisher.
Supplementary material
The Supplementary Material for this article can be found online at: https://www.frontiersin.org/articles/10.3389/fevo.2023.1257453/full#supplementary-material
References
Álvarez I., Fernández I., Traoré A., Menéndez-Arias N. A., Goyache F. (2021). Population structure assessed using microsatellite and SNP data: an empirical comparison in West African cattle. Animals 11 (1), 151. doi: 10.3390/ani11010151
Baddeley A., Turner R. (2005). SPATSTAT: an R package for analyzing spatial point patterns. J. Stat. Software 12 (6), 1–42. doi: 10.18637/jss.v012.i06
Balkenhol N., Cushman S., Storfer A., Waits L. (2015). Landscape genetics: concepts, methods, applications (USA: John Wiley & Sons).
Bian L., Sun X., Chen Z. (2014). Studies on daily flight activity and adult flight capacity of Empoasca vitis Göthe. J. Tea Sci. 34 (3), 248–252. doi: 10.13305/j.cnki.jts.2014.03.006
Bishop A. P., Amatulli G., Hyseni C., Pless E., Bateta R., Okeyo W. A., et al. (2021). A machine learning approach to integrating genetic and ecological data in tsetse flies (Glossina pallidipes) for spatially explicit vector control planning. Evol. Appl. 14 (7), 1762–1777. doi: 10.1111/eva.13237
Blakney J., Loxterman J., Keeley E. (2014). Range-wide comparisons of northern leatherside chub populations reveal historical and contemporary patterns of genetic variation. Conserv. Genet. 15 (4), 757–770. doi: 10.1007/s10592-014-0576-1
Blanton R. E., Cashner M. F., Thomas M. R., Brandt S. L., Floyd M. A. (2019). Increased habitat fragmentation leads to isolation among and low genetic diversity within populations of the imperiled Kentucky Arrow Darter (Etheostoma sagitta spilotum). Conserv. Genet. 20 (5), 1009–1022. doi: 10.1007/s10592-019-01188-y
Bonnin N., Piel A., Brown R., li Y., Connell A., Avitto A., et al. (2023). Barriers to chimpanzee gene flow at the south-east edge of their distribution. Mol. Ecol. 32, 3842–3858. doi: 10.1111/mec.16986
Bowen B., Shanker K., Yasuda N., Malay M. C., von der Heyden S., Paulay G., et al. (2014). Phylogeography unplugged: Comparative surveys in the genomic era. Bull. Mar. Sci. 90 (1), 13–46. doi: 10.5343/bms.2013.1007
Cavalli-Sforza L. L., Edwards A. (1967). Phylogenetic analysis: Models and estimation procedures. Am. J. Hum. Genet. 21 (3), 550–570. doi: 10.1111/j.1558-5646.1967.tb03411.x
de Jong M. A., Wahlberg N., van Eijk M., Brakefield P. M., Zwaan B. J. (2011). Mitochondrial DNA signature for range-wide populations of Bicyclus anynana suggests a rapid expansion from recent refugia. PloS One 6 (6), e21385. doi: 10.1371/journal.pone.0021385
Demichelis S., Manino A., Sartor C., Cifuentes D., Patetta A. (2010). Specific identification of some female Empoascini (Hemiptera: Cicadellidae), using morphological characters of the ovipositor and isozyme and mtCOI sequence analyses. Can. Entomol. 142 (6), 513–531. doi: 10.4039/n10-008
Excoffier L., Lischer H. E. (2010). Arlequin suite ver 3.5: a new series of programs to perform population genetics analyses under Linux and Windows. Mol. Ecol. Resour. 10 (3), 564–567. doi: 10.1111/j.1755-0998.2010.02847.x
Ferrier S., Manion G., Elith J., Richardson K. (2007). Using generalized dissimilarity modelling to analyse and predict patterns of beta diversity in regional biodiversity assessment. Divers. Distrib. 13 (3), 252–264. doi: 10.1111/j.1472-4642.2007.00341.x
Fick S. E., Hijmans R. J. (2017). WorldClim 2: new 1-km spatial resolution climate surfaces for global land areas. Int. J. Climatol. 37 (12), 4302–4315. doi: 10.1002/joc.5086
Fitzpatrick M., Mokany K., Manion G., Nieto-Lugilde D., Ferrier S., Lisk M., et al. (2022) gdm: Generalized Dissimilarity Modeling. R package version 1.5.0–9.1. Available at: https://CRAN.R-project.org/package=gdm.
Fonseca E. M., Pelletier T. A., Decker S. K., Parsons D. J., Carstens B. C. (2023). Pleistocene glaciations caused the latitudinal gradient of within-species genetic diversity. Evol. Lett., qrad030. doi: 10.1093/evlett/qrad030
Francisco F. O., Santiago L. R., Mizusawa Y. M., Oldroyd B. P., Arias M. C. (2017). Population structuring of the ubiquitous stingless bee Tetragonisca angustula in southern Brazil as revealed by microsatellite and mitochondrial markers. Insect Sci. 24 (5), 877–890. doi: 10.1111/1744-7917.12371
Fu J. Y., Han B. Y., Xiao Q. (2014). Mitochondrial COI and 16sRNA evidence for a single species hypothesis of E. vitis, J. formosana and E. onukii in East Asia. PloS One 9 (12), e115259. doi: 10.1371/journal.pone.0115259
Funk W. C., Blouin M. S., Corn P. S., Maxell B. A., Pilliod D. S., Amish S., et al. (2005). Population structure of Columbia spotted frogs (Rana luteiventris) is strongly affected by the landscape. Mol. Ecol. 14 (2), 483–496. doi: 10.1111/j.1365-294X.2005.02426.x
Goslee S. C., Urban D. L. (2007). The ecodist package for dissimilarity-based analysis of ecological data. J. Stat. Software 22 (7), 1–19. doi: 10.18637/jss.v022.i07
Han W., Li X., Ahammed G. J. (2018). Stress physiology of tea in the face of climate change (Singapore: Springer Nature Singapore Pte Ltd).
Hijmans R. J., Karney C., Williams E., Vennes C. (2022) geosphere: Spherical Trigonometry. R package version 1.5–18. Available at: https://CRAN.R-project.org/package=geosphere.
Hijmans R. J., van Etten J., Sumner M., Cheng. J., Baston D., Bevan A., et al. (2023) raster: Geographic Data Analysis and Modeling. R package version 3.6–23. Available at: https://CRAN.R-project.org/package=raster.
Hu G., Lu M. H., Reynolds D. R., Wang H. K., Chen X., Liu W. C., et al. (2019). Long-term seasonal forecasting of a major migrant insect pest: the brown planthopper in the Lower Yangtze River Valley. J. Pest Sci. 92 (2), 417–428. doi: 10.1007/s10340-018-1022-9
Jombart T., Devillard S., Balloux F. (2010). Discriminant analysis of principal components: a new method for the analysis of genetically structured populations. BMC Genet. 11 (1), 94. doi: 10.1186/1471-2156-11-94
Kamvar Z. N., Tabima J. F., Grünwald N. J. (2014). Poppr: an R package for genetic analysis of populations with clonal, partially clonal, and/or sexual reproduction. PeerJ 2, e281. doi: 10.7717/peerj.281
Katoh K., Standley D. M. (2013). MAFFT: multiple sequence alignment software version 7: improvements in performance and usability. Mol. Biol. Evol. 30 (4), 772–780. doi: 10.1093/molbev/mst010
Legendre P., Anderson M. J. (1999). Distance-based redundancy analysis: testing multispecies responses in multifactorial ecological experiments. Ecol. Monogr. 69 (1), 1–24. doi: 10.1890/0012-9615(1999)069[0001:DBRATM]2.0.CO;2
Li J., Shi L., Chen W., Mao Y., Vasseur L., Gurr G., et al. (2023). Environmental heterogeneity drives population genetic divergence of a key agricultural pest, Empoasca onukii. Entomol. Gen. 43 (2), 305–313. doi: 10.1127/entomologia/2023/1695
Li J., Shi L., Vasseur L., Zhao Q., Chen J., You M., et al. (2022). Genetic analyses reveal regional structure and demographic expansion of the predominant tea pest Empoasca onukii (Hemiptera: Cicadellidae) in China. Pest Manage. Sci. 78 (7), 2838–2850. doi: 10.1002/ps.6908
Liaw A., Wiener M. (2001). Classification and regression by randomForest. R News 2 (3), 18–22. Available at: https://cran.r-pro-ject.org/doc/Rnews/.
Liu J. H., Sun C. Y., Long J., Guo J. J. (2017). Complete mitogenome of tea green leafhopper, Empoasca onukii (Hemiptera: Cicadellidae) from Anshun, Guizhou Province in China. Mitochondrial DNA B 2 (2), 808–809. doi: 10.1080/23802359.2017.1398616
Lo N., Montagu A., Noack A., Nahrung H., Wei H., Eldridge M., et al. (2019). Population genetics of the Australian eucalypt pest Thaumastocoris peregrinus: evidence for a recent invasion of Sydney. J. Pest Sci. 92 (1), 201–212. doi: 10.1007/s10340-018-0995-8
McRae B., Shah V., Edelman A. (2016). Circuitscape: modeling landscape connectivity to promote conservation and human health. Nat. Conserv. 14. doi: 10.13140/RG.2.1.4265.1126
Meng X. F., Shi M., Chen X. X. (2008). Population genetic structure of Chilo suppressalis (Walker)(Lepidoptera: Crambidae): strong subdivision in China inferred from microsatellite markers and mtDNA gene sequences. Mol. Ecol. 17 (12), 2880–2897. doi: 10.1111/j.1365-294X.2008.03792.x
Muñoz-Valencia V., Montoya-Lerma J., Seppä P., Diaz F. (2023). Landscape genetics across the Andes mountains: Environmental variation drives genetic divergence in the leaf-cutting ant Atta cephalotes. Mol. Ecol. 32 (1), 95–109. doi: 10.1111/mec.16742
Myers E. A., Xue A. T., Gehara M., Cox C. L., Davis Rabosky A. R., Lemos-Espinal J., et al. (2019). Environmental heterogeneity and not vicariant biogeographic barriers generate community-wide population structure in desert-adapted snakes. Mol. Ecol. 28 (20), 4535–4548. doi: 10.1111/mec.15182
Noguerales V., Cordero P. J., Ortego J. (2016). Hierarchical genetic structure shaped by topography in a narrow-endemic montane grasshopper. BMC Evol. Biol. 16 (1), 96. doi: 10.1186/s12862-016-0663-7
Oksanen J., Simpson G. L., Blanchet F. G., Kindt R., Legendre P., Minchin P. R., et al. (2022) vegan: Community Ecology Package. R package version 2.6–4. Available at: https://CRAN.R-project.org/package=vegan.
Peakall R., Smouse P. E. (2012). GenAlEx 6.5: genetic analysis in Excel. Population genetic software for teaching and research—an update. Bioinformatics 28 (19), 2537–2539. doi: 10.1093/bioinformatics/bts460
Pebesma E., Bivand R. (2005). Classes and methods for spatial data in R. R News 5 (2), 9–13. Available at: https://cran.r-pro-ject.org/doc/Rne.
Petkova D., Novembre J., Stephens M. (2016). Visualizing spatial population structure with estimated effective migration surfaces. Nat. Genet. 48 (1), 94. doi: 10.1038/ng.3464
Phillips S. J., Anderson R. P., Schapire R. E. (2006). Maximum entropy modeling of species geographic distributions. Ecol. Model. 190 (3-4), 231–259. doi: 10.1016/j.ecolmodel.2005.03.026
Prevosti A., Ocana J., Alonso G. (1975). Distances between populations of Drosophila subobscura, based on chromosome arrangement frequencies. Theor. Appl. Genet. 45 (6), 231–241. doi: 10.1007/BF00831894
Qin D., Zhang L., Xiao Q., Dietrich C., Matsumura M. (2015). Clarification of the identity of the tea green leafhopper based on morphological comparison between Chinese and Japanese specimens. PloS One 10 (9), e0139202. doi: 10.1371/journal.pone.0139202
R Core Team. (2022). R: A language and environment for statistical computing. Vienna, Austria. Available at: https://www.R-project.org/.
Rozas J., Ferrer-Mata A., Sánchez-DelBarrio J. C., Guirao-Rico S., Librado P., Ramos-Onsins S. E., et al. (2017). DnaSP 6: DNA sequence polymorphism analysis of large data sets. Mol. Biol. Evol. 34 (12), 3299–3302. doi: 10.1093/molbev/msx248
Shi L. Q., Zeng Z. H., Huang H. S., Zhou Y. M., Vasseur L., You M. S. (2015). Identification of Empoasca onukii (Hemiptera: Cicadellidae) and monitoring of its populations in the tea plantations of south China. J. Econ. Entomol. 108 (3), 1025–1033. doi: 10.1093/jee/tov054
Teske P., Golla T. R., Sandoval-Castillo J., Emami-Khoyi A., van der Lingen C., von der Heyden S., et al. (2018). Mitochondrial DNA is unsuitable to test for isolation by distance. Sci. Rep. 8, 8448. doi: 10.1038/s41598-018-25138-9
Trense D., Schmidt T. L., Yang Q., Chung J., Hoffmann A. A., Fischer K. (2021). Anthropogenic and natural barriers affect genetic connectivity in an Alpine butterfly. Mol. Ecol. 30 (1), 114–130. doi: 10.1111/mec.15707
Villemey A., Peterman W. E., Richard M., Ouin A., van Halder I., Stevens V. M., et al. (2016). Butterfly dispersal in farmland: a replicated landscape genetics study on the meadow brown butterfly (Maniola jurtina). Landscape Ecol. 31 (7), 1629–1641. doi: 10.1007/s10980-016-0348-z
Vincenty T. (1975). Direct and inverse solutions of geodesics on the ellipsoid with application of nested equations. Surv. Rev. 23 (176), 88–93. doi: 10.1179/sre.1975.23.176.88
Waldvogel A. M., Wieser A., Schell T., Patel S., Schmidt H., Hankeln T., et al. (2018). The genomic footprint of climate adaptation in Chironomus riparius. Mol. Ecol. 27 (6), 1439–1456. doi: 10.1111/mec.14543
Wan Q. H., Wu H., Fujihara T., Fang S.-G. (2004). Which genetic marker for which conservation genetics issue? Electrophoresis 25 (14), 2165–2176. doi: 10.1002/elps.200305922
Warren D. L., Glor R. E., Turelli M. (2010). ENMTools: a toolbox for comparative studies of environmental niche models. Ecography 33 (3), 607–611. doi: 10.1111/j.1600-0587.2009.06142.x
Wei S. J., Cao L. J., Gong Y. J., Shi B. C., Wang S., Zhang F., et al. (2015). Population genetic structure and approximate Bayesian computation analyses reveal the southern origin and northward dispersal of the oriental fruit moth Grapholita molesta (Lepidoptera: Tortricidae) in its native range. Mol. Ecol. 24 (16), 4094–4111. doi: 10.1111/mec.13300
Weir B. S. (1990). Genetic data analysis: methods for discrete population genetic data (Sunderland: Sinauer Associates).
Xia H., Wang B., Zhao W., Pan J., Mao J. F., Wang X. R. (2018). Combining mitochondrial and nuclear genome analyses to dissect the effects of colonization, environment, and geography on population structure in Pinus tabuliformis. Evol. Appl. 11 (10), 1931–1945. doi: 10.1111/eva.12697
Zamudio K. R., Bell R. C., Mason N. A. (2016). Phenotypes in phylogeography: Species’ traits, environmental variation, and vertebrate diversification. Proc. Natl. Acad. Sci. 113 (29), 8041–8048. doi: 10.1073/pnas.1602237113
Zhou N. N. (2014) Study on genetic variation of geographic population of Empoasca Vitis (Göthe) in tea plantation based on the mitochondrial CO I and COII genes. [master's thesis]. (Hangzhou: China Jiliang University).
Keywords: landscape genetics, multivariate model, biogeographic barriers, population connectivity, leafhopper
Citation: Li J, Mao Y, Li K, Chen W, Sun L and Zhang B (2023) Genetic connectivity constrained by natural barriers in a key agricultural pest: insights from mitochondrial DNA analysis. Front. Ecol. Evol. 11:1257453. doi: 10.3389/fevo.2023.1257453
Received: 12 July 2023; Accepted: 04 September 2023;
Published: 21 September 2023.
Edited by:
Sankar Subramanian, University of the Sunshine Coast, AustraliaReviewed by:
Yiguan Wang, University of Edinburgh, United KingdomKevin Emerson, St. Mary’s College, United States
Copyright © 2023 Li, Mao, Li, Chen, Sun and Zhang. This is an open-access article distributed under the terms of the Creative Commons Attribution License (CC BY). The use, distribution or reproduction in other forums is permitted, provided the original author(s) and the copyright owner(s) are credited and that the original publication in this journal is cited, in accordance with accepted academic practice. No use, distribution or reproduction is permitted which does not comply with these terms.
*Correspondence: Jinyu Li, anlsaV9mYWFzQDE2My5jb20=