 Li Wang1
 Yike Li
- 1PowerChina Chengdu Engineering Corporation Limited, Chengdu, China
- 2Chengdu Institute of Biology, Chinese Academy of Sciences, Chengdu, China
Wilderness plays a crucial role in biodiversity conservation, and its preservation represents a pivotal objective emphasized in the Post-2020 Global Biodiversity Framework (GBF). Nonetheless, wilderness frequently faces threats from the escalating impact of human activities, leading to significant repercussions on diverse ecological processes. Despite the abundance of previous studies on wilderness, there has been a limited focus on the temporal dynamics at the local scale, as well as on identifying the conservation priorities in terms of their ecosystem services. In this study, taking the Lhasa River Basin in the Qinghai-Tibet Plateau of China as an example, the spatio-temporal variations of wilderness were analyzed, and conservation priorities of them were further identified based on ecosystem services. The results revealed a persistent decline in the wilderness from 1990 to 2020, particularly in terms of bare land and grassland. Furthermore, we identified that 33.56% of the remaining wilderness necessitated special attention. These findings offer valuable insights into potential future threats to wilderness and hold critical importance for formulating regional conservation strategies at the local scale.
1 Introduction
The current rates of global biodiversity loss are approximately 100~1000 times greater than the expected background rate of extinction, and further increases in this biodiversity loss are anticipated in the future (Pimm et al., 2014). Preserving wilderness areas is the primary means to address biodiversity loss, and they are the foundation of resiliency for the changing earth. The term “wilderness” refers to areas predominantly influenced by natural processes with zero or minimal human interference, characterized by their intrinsic natural features (Cao and Yang, 2017). In recognition of their importance, the Post-2020 Global Biodiversity Framework (GBF) identified “retaining existing intact and wilderness areas” as the principal objective among the 2030 action targets, underscoring the paramount significance of wilderness in biodiversity conservation (CBD, 2021). Moreover, the IUCN Wilderness Protected Areas Management Guidelines emphasize the intrinsic value of wilderness, which encompasses a wide range of ecosystem services and fosters diversity (Casson et al., 2016). Given the vital role that wilderness plays in addressing the global biodiversity crisis and preserving ecosystem integrity, the protection and rewilding of wilderness are imperative for nations committed to genuinely achieving Sustainable Development Goals (Di Marco et al., 2019).
There is a lack of consensus on how wilderness should be identified. Pertinent efforts in delineating wilderness primarily revolve around the notion of a “wilderness continuum,” indicative of the absence of concrete demarcations, instead proposing more blurred, indistinct boundaries (Lesslie and Maslen, 1995; Comber et al., 2010). However, the absence of specific frontiers for wilderness impedes scientific inquiry and management initiatives related to these areas. To mitigate the challenges stemming from the indeterminate boundaries, numerous academic explorations have sought to establish well-defined peripheries of wilderness. For example, Lin et al. (2016) employed a cluster analysis encompassing five variables, categorizing the Three Parallel Rivers region of China into ten distinct classes, with only level 1 patches exceeding 1.0 km² qualifying as wilderness. Similarly, Radford et al. (2019) formulated four distinct criteria to assess wilderness quality on a continuous scale, applying this methodology to the terrain of Switzerland. However, the absence of a consistent, universally accepted criterion for interpreting the wilderness continuum during these analyses results in substantial discrepancies in wilderness recognition across varying studies. Addressing this inconsistency, a growing number of researchers are opting to characterize wilderness by pinpointing regions minimally impacted by human activities, utilizing the human footprint index (Di Marco et al., 2019; Sanderson et al., 2022). Specifically, post the delineation of the regional human footprint index, regions exhibiting a human footprint of less than 1 are designated as wilderness using the Boolean method, with the residual regions classified as non-wilderness (Venter et al., 2016; Mu et al., 2022). This methodology yields a clear-cut cartographic representation, segregating wilderness and non-wilderness, and has ascended to mainstream prominence for furnishing unambiguous demarcations.
With the help of wilderness boundary, previous efforts have attempted to discern the spatio-temporal changes of wilderness at different scales. For instance, at the global scale, researchers have employed diverse approaches to identify wilderness, such as analyzing human footprints (Venter et al., 2016; Mu et al., 2022), delineating roadless areas (Ibisch et al., 2016), or assessing human modification (Kennedy et al., 2019). At the national scale, several scholars have identified wilderness in various countries (Cao et al., 2019; Carver et al., 2023). Additionally, some researchers have mapped the spatial extent of wilderness at the regional scale (Lin et al., 2016; Măntoiu et al., 2016). These studies have offered valuable insights to facilitate the effective conservation of wilderness. However, current large-scale assessments inadequately provide practical guidelines for on-ground implementation, highlighting the critical need to identify wilderness at local scales as a pivotal undertaking to enhance public awareness of their protection (Caro et al., 2012). Regrettably, to the best of our knowledge, relatively limited studies have investigated wilderness at the local scale, impeding conservation efforts on the ground (Watson et al., 2016; Mu et al., 2022). More importantly, current local scale researches rarely explored the temporal dynamics of wilderness, resulting in a situation that we still know very little about the land types where the loss and increase in wilderness is primarily occurring, which indirectly hinders wilderness preservation efforts.
Despite the significance of preserving wilderness as a proactive measure for biodiversity and ecosystem conservation (Watson et al., 2016; Di Marco et al., 2019), not all wilderness exhibits high conservation value in conservation practice or in a legal sense according to current knowledge (Mittermeier et al., 2003; Cao et al., 2022). Meanwhile, the constraints of conservation resources, including human and financial capacities, render it nearly impractical to encompass all wilderness within protected area networks, which will undoubtedly undermine the global target of protecting 30% of the planet by 2030 (Wu et al., 2014). Therefore, substantial efforts are still required to identify priority wilderness to establish practical conservation guidelines. Consequently, several studies have investigated the conservation priorities related to wilderness, mainly by measuring the degree of congruence between wilderness and protected areas (Watson et al., 2009; Kuiters et al., 2013). However, these studies lack the appropriate quantitative assessment of conservation value for wilderness. In recent years, with diverse models such as InVEST and ARIES, ecosystem services maps can be generated at various scales. Hence, it is reasonable to identify priority conservation regions for wilderness based on their ecosystem services (Cao et al., 2022).
The Lhasa River Basin is the most developed and populated area in Tibet Autonomous Region of China, and is also an ecological fragile area (Han et al., 2023). Given the rapid growth experienced since the 21st century, it is facing a series of ecological and environmental problems (Shui et al., 2018; Zhang et al., 2021; Han et al., 2023). Recent pan-China mapping of wilderness indicates that the Qinghai-Tibet Plateau contain some significant wilderness areas (Cao et al., 2019). However, due to limitations on the resolution, the spatio-temporal pattern of wilderness for the Lhasa River Basin remain poorly understood. Therefore, there is a distinct need for researches to map and evaluate wilderness of the Lhasa River Basin, in order to focus conservation efforts in terms of their ecosystem services. Given these, this study takes the Lhasa River Basin as a case study to examine the following two questions: (1) How has wilderness changed over the past three decades? (2) Which wilderness regions should be designated as conservation priorities?
2 Methods
2.1 Study areas
Situated in the southern region of the Qinghai-Tibet Plateau, the Lhasa River basin serves as the economic and demographic center of Tibet prefecture, encompassing a drainage area of 32,592 km2 that stretches from 29°20’ to 31°15’ N and 90°05’ to 93°20’ E (Figure 1). It represents the largest and most significant tributary of the Yarlung Zangbo River, functioning as the primary water source for the city of Lhasa. The basin features mountains and deep gorges that span an elevation range of 3,538 to 7,114 meters, characterized by a gentle slope from the northeast to the southwest. The basin exhibits a typical continental plateau semi-arid monsoon climate, characterized by an average annual temperature of 7.7°C and mean annual precipitation of approximately 440 mm (Bai et al., 2014). The basin predominantly encompasses vegetation types such as alpine shrub-steppe, alpine steppe, alpine meadow, and cushion vegetation (Yang et al., 2023).
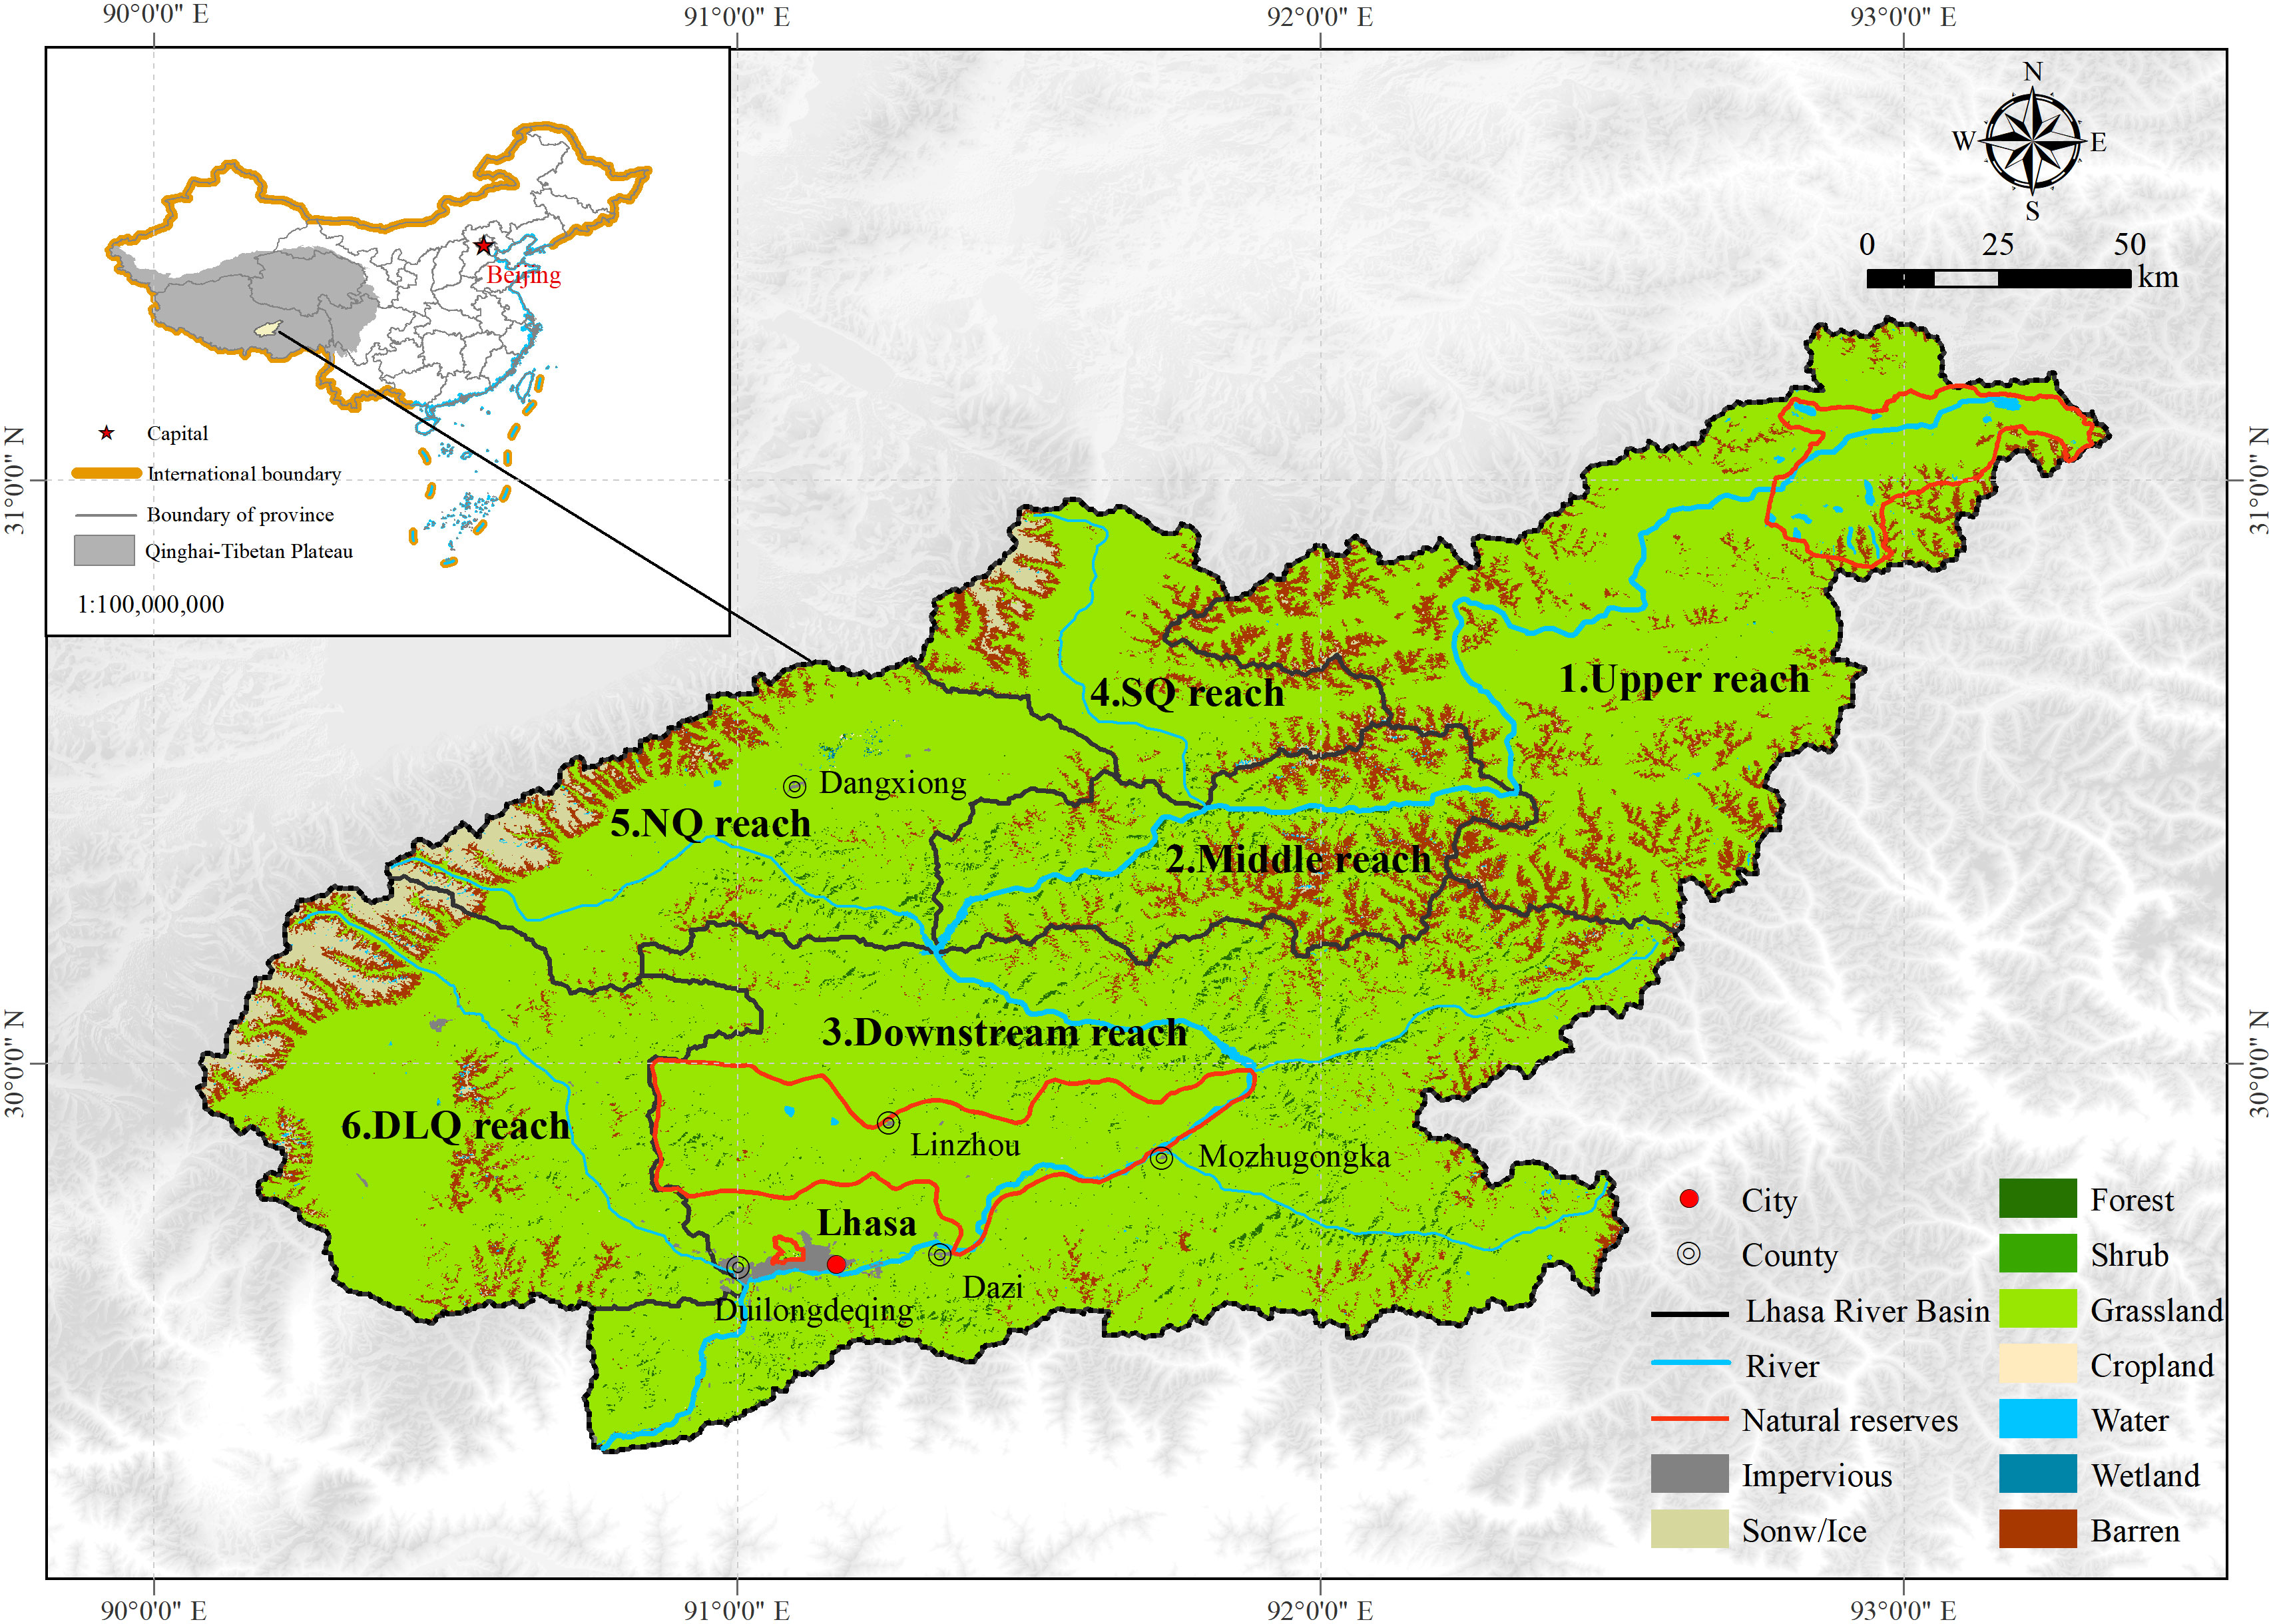
Figure 1 Location of the study area in Lhasa River Basin. Based on the boundary data from HydroSHEDS (www.hydrosheds.org), the Lhasa River Basin can be divided into six sub-regions: 1-upper reach, 2-middle reach, 3-downstream reach, 4-Sang Qu River reaches (SQ), 5-Na Qu River reach (NQ), and 6-Dui Long Qu River reach (DLQ).
2.2 Data collection and processing
2.2.1 Wilderness areas
In this study, wilderness areas are defined as regions that maintain their inherent natural characteristics while experiencing minimal human influence (Casson et al., 2016). Drawing upon previous research (Venter et al., 2016; Mu et al., 2022), we employed the Human Footprint index to assess the extent of human activity disturbance and identify wilderness areas, which is a measurement of human pressure on the landscape scaled between 0 and 1 (Di Marco et al., 2019). Specifically, we initially gathered seven variables encompassing different aspects of human pressures, such as human population density, cropland extent, built environments, grazing density, nighttime lights, roads and railways, and hydropower projects. Subsequently, we produced a time series dataset depicting the human footprint with a resolution of 100 meters. Consequently, wilderness was defined as regions exhibiting a human footprint index value lower than 1. Additional details pertaining to each indicator can be found in the following section.
2.2.1.1 Population density
Human population density is generally regarded as a key indicator of resource consumption and has been extensively employed to evaluate the influence of human activities on natural ecosystems (Sanderson et al., 2002). The human population density data for the years 2000, 2010 and 2020 were obtained from Worldpop (https://hub.worldpop.org/geodata/, accessed on 23rd Feb 2023), while the data for the years 1990 and 2000 were acquired from the Resource and Environment Science and Data Center (https://www.resdc.cn/, accessed on 22nd Feb 2023). Due to the discrepancies observed in the two datasets, linear regression was employed to correct the 1990 and 2000 population density data downloaded from the Resource and Environment Science and Data Center, and the population data in 2000 was used for accuracy verification. The results showed that there is general agreement for the population density in 2000 between the two datasets, with the Mean Absolute Error (MAE) and Root Mean Square Error (RMSE) of 0.0002 and 0.038, respectively. Thus, after data processing, these two population density datasets can be used together for long time series analysis.
Areas with population densities surpassing 10 persons/hm2 were assigned a pressure score of 10, while areas with densities below 10 persons/hm2 were assigned scores on a logarithmic scale ranging from 0 to 10, following a mathematical equation (Zeng et al., 2022).
where represents human population density unit person/hm2, represents the score of , and is a constant. To ensure that when = 10 person/hm2, reaches its maximum value of 10, is set to 9.602525678 in this study.
2.2.1.2 Cropland and built environments
Cropland and built environments, including settlements, industrial and mining land, and all impervious surfaces, are human-created zones that serve as the backdrop for human activity, which may possibly contribute to biodiversity degradation (Folberth et al., 2020; Hua et al., 2022). The cropland and built environments data for the Lhasa River Basin were extracted from the initial Landsat-derived annual China land cover dataset, spanning the period from 1990 to 2020 (Yang and Huang, 2021). Accordingly, a pressure score of 7 and 10 was assigned to cropland and built environments, respectively (Venter et al., 2016).
2.2.1.3 Grazing density
Grazing represents the predominant human activity on the Qinghai-Tibet Plateau (Liu et al., 2022). In this study, we used seven indicators including livestock numbers, human population density, altitude, slope, temperature, precipitation, river distance, and human-induced net primary productivity (HNPP) to simulate the distribution of grazing intensity. Livestock data were obtained from the Tibet Statistical Yearbook of each year (Statistical Bureau of Tibet, 2021). Digital Elevation Model (DEM) data were downloaded from the Geospatial Data Cloud platform (https://www.gscloud.cn/, accessed 21st Dem 2022). Monthly air temperature and precipitation were acquired from the National Earth System Science Data Center of China (http://www.geodata.cn, accessed on 18th May 2022). HNPP was determined by calculating the difference between climate-driven potential NPP and actual NPP (Zhou and Lu, 2022). In addition, we developed a livestock spatialization model using extra tree algorithms to map the grazing density pattern (Li et al., 2021). Subsequently, we assigned values ranging from 0 to 10 to the respective areas using the following equation as population density do.
where represents grazing density, unit sheep/hm2 and represents the score of , respectively. is a constant, to ensure that when = 10 sheep/hm2, reaches its maximum value of 10, is set to 9.602525678.
2.2.1.4 Nighttime lights
Nighttime lights data exhibits a robust correlation with electricity consumption and serves as a reliable proxy for measuring human development. In this study, we downloaded the DMSP-OLS dataset and the SNPP-VIIRS dataset from the National Earth System Science Data Center of China (http://www.geodata.cn, accessed on 19th May 2022). Subsequently, according to previous study (Venter et al., 2016), the nighttime lights data were then divided into 11 categories from 0–10 by using an equal quintile approach.
2.2.1.5 Roads and railways
Roads and railways exert a significant influence on natural land by causing fragmentation, connecting human settlements, and providing land access (Trombulak and Frissell, 2000). The road and railway data were acquired from the National Earth System Science Data Center of China (www.geodata.cn, accessed on 2nd February 2023). Considering the greater impact of higher-level roads compared to lower-level roads (Li S. et al., 2018), we assigned distinct scores based on five road types and their proximity to map both direct and indirect influences (refer to Table 1). Moreover, a value of 8 was assigned to regions located within a 500 m distance from the railways (Venter et al., 2016).
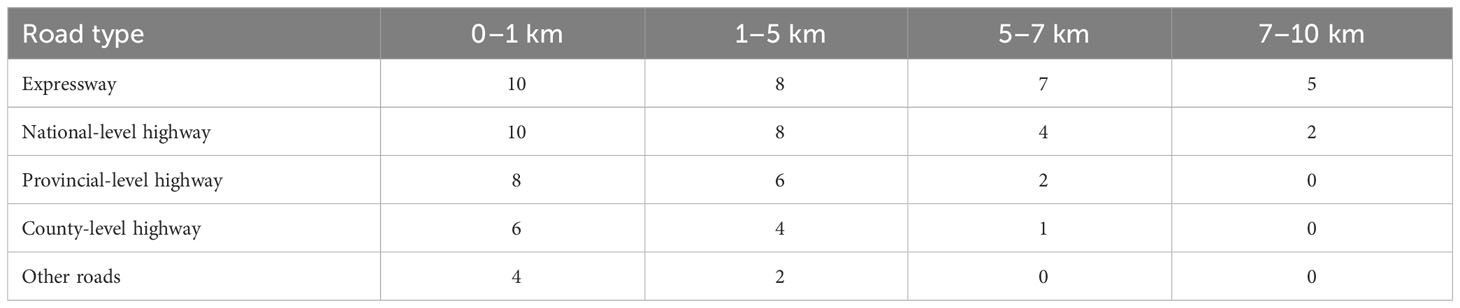
Table 1 Human footprint scores for different road types.
2.2.1.6 Hydropower projects
Hydropower projects are prevalent human activities in the Qinghai-Tibet Plateau, serving as a significant energy source. However, they also have unavoidable adverse impacts on the ecosystem (Li et al., 2015). The hydropower dams on the Tibet Plateau were obtained from the Large Dam Safety Supervision Centre, National Energy Administration of China (https://dam.nea.gov.cn). We assigned varied scores to the dams based on their power generation capacity and proximity (refer to Table 2) (Venter et al., 2016).
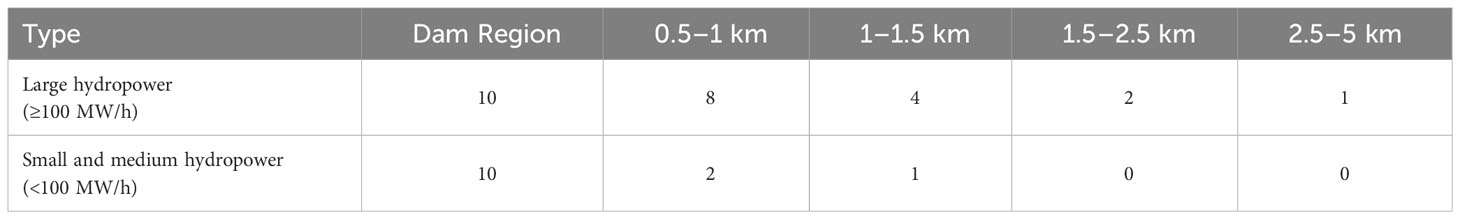
Table 2 Human footprint scores for hydropower projects.
2.2.2 Land use and land cover
The land use and land cover data were acquired from the Land-sat-derived annual China land cover dataset at a resolution of 30 m (Yang and Huang, 2021). The datasets contain nine land use types in the Lhasa River basin, including cropland, forest, shrub, grassland, water, snow/ice, barren land, impervious surfaces, and wetland. Subsequently, we applied the nearest neighbor interpolation method to resample the land use and land cover data to a spatial resolution of 100 m, ensuring consistency across all datasets.
2.2.3 Ecosystem service
The dataset for ecosystem services was obtained from the National Tibetan Plateau Data Center (http://data.tpdc.ac.cn/, accessed on January 12th, 2023). It includes five ecosystem services, including soil retention, water yield, carbon fixation, biodiversity, and climate regulation. We then calculated the total values of ecosystem services per hectare and classified the patches into five levels using the natural breaks method, including.
2.2.4 Vector data
The boundary of Lhasa River Basin and its sub-regions were downloaded from HydroSHEDS (www.hydrosheds.org). The boundary of nature reserves were obtained from National Forestry and Grassland Data Center (http://www.forestdata.cn).
2.3 Trends analysis of Wilderness
In this study, we selected the index of status, direction and trend (), net change (), total change () to characterize the dynamic changes in wilderness areas from 1990 to 2020 (Luo et al., 2008). The net change () and total change () are defined as:
where and represent the area of wilderness at the initial and last stages, respectively. and represents the gain and loss of wilderness areas over the period, respectively.
Based on Equal (3) and (4), is defined as follows:
when indicates that wilderness areas have remained unchanged. If , the index indicates wilderness is expanding with an increasing trend. When , the index indicates wilderness is shrinking with a decreasing trend. Additionally, the value of is further divided into the following four types.
(1) : wilderness change is interpreted to reach a balance, and wilderness gained equal to or slightly differ from the lost.
(2) : wilderness change is in quasi-balanced status, and the gained area is prominently larger or less than the lost
(3) : wilderness change is characterized by an unbalanced status, and the gained area is much greater or much less than the lost.
(4) : wilderness change is in extremely unbalanced status. Wilderness keeps increasing without or with little loss, or keeps decreasing without or with little increase.
2.4 Identifying conservation priorities of wilderness
Wilderness patches exhibiting higher ecosystem service values were ascertained to possess elevated conservation priority. The per-hectare total ecosystem service value, denoted as , for each wilderness patch was computed. This metric incorporates five distinct ecosystem services: soil retention, water yield, carbon fixation, biodiversity, and climate regulation. The formulation is delineated as follows:
where represents the sum value of five ecosystem service provided by wilderness patch, unit yuan, represents the area of the patch.
Based on the value of each patch, the wilderness patches were categorized into five levels from 0–5 using the natural break method. A higher value corresponds to a higher level, signifying an increased conservation priority for the patch.
3 Results
3.1 Contemporary pattern of wilderness
The wilderness covered a total area of 4,393 km2 in 2020, representing 13.5% of the Lhasa River Basin (Figure 2). It consisted of 16,805 patches ranging in size from 0.01 km2 to 995 km2. Despite only 1.6% of these patches were larger than 1 km2, they constituted 83.9% of the total wilderness areas. Spatially, the wilderness had a predominant distribution in the upper reach, accounting for 26% of the total wilderness area. It was followed by the DLQ reach (19.4%), downstream reach (18.3%), middle reach (15.6%), NQ reach (12.2%), and SQ reach (8.6%). Notably, there were extensive wilderness patches in the NQ reach and DLQ reach, primarily situated in the northwest of the study area. Furthermore, there was limited wilderness along the rivers, as the majority of the large patches were observed in mountainous areas. Regarding the ratio of the wilderness area to the total land area in each reach, the middle reach had the highest ratio (22.2%), followed by the DLQ reach (18.9%), SQ reach (18.5%), upper reach (17%), NQ reach (14.6%), and downstream reach (5.7%).
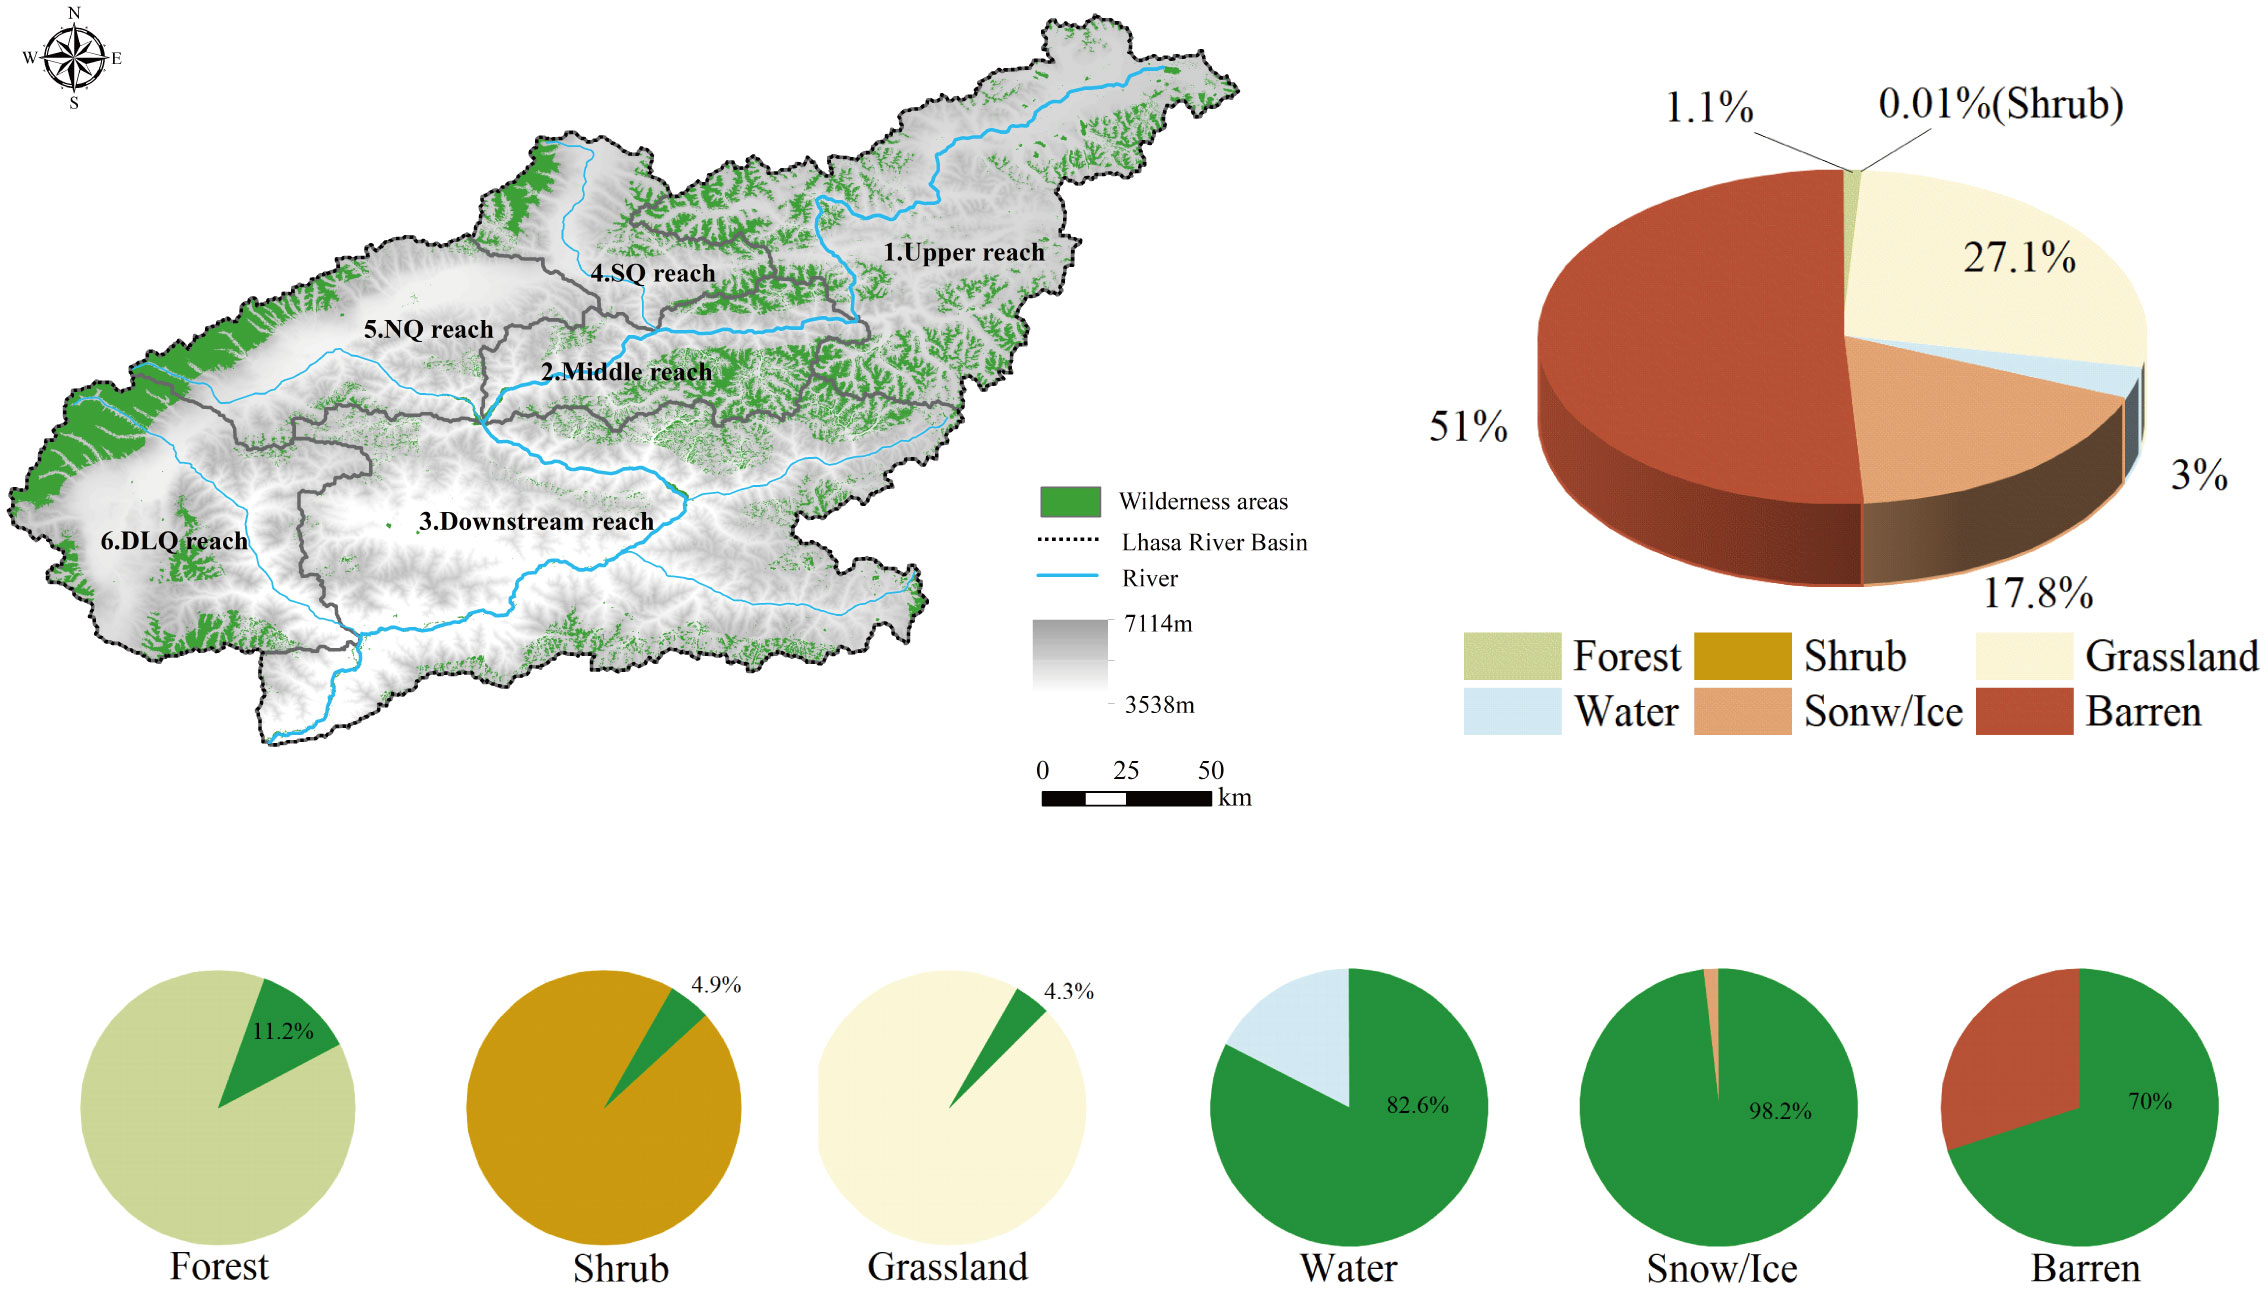
Figure 2 The wilderness map for the year 2020. The pie charts represent the proportion of each land use composition of wilderness.
Barren was the dominant component of the wilderness, covering an area of 2,242 km2 (51%), followed by grassland (1,190 km2, 27%), snow/ice (782 km2, 17.8%), water (131 km2, 3%), and forest (48 km2, 1.1%). Nearly all snow/ice areas within the Lhasa River Basin were classified as wilderness (98.2%), followed by water (82.6%) and barren (69.9%). In contrast, forest, shrub, and grassland accounted for a small proportion of the wilderness, accounting for 11.2%, 4.9% and 4.3%, respectively. Importantly, despite only 4.3% of the grassland being identified as wilderness, it constituted more than 85% of the total basin area, establishing grassland as the primary component of the wilderness.
3.2 Spatio-temporal changes from 1990 to 2020
3.2.1 Spatial changes
Figure 3 illustrates the spatial distribution changes of wilderness from 1990 to 2020. The wilderness accounted for 21.4% in 1990, 17.3% in 2000, 16.6% in 2010, and 13.5% in 2020, respectively. Furthermore, the wilderness was predominantly concentrated in the mountainous regions of the upper and middle reaches of the Lhasa River, characterized by less human inhabitation. In addition, the wilderness was also observed in the western study area, primarily in the NQ reach and the DLQ reach.
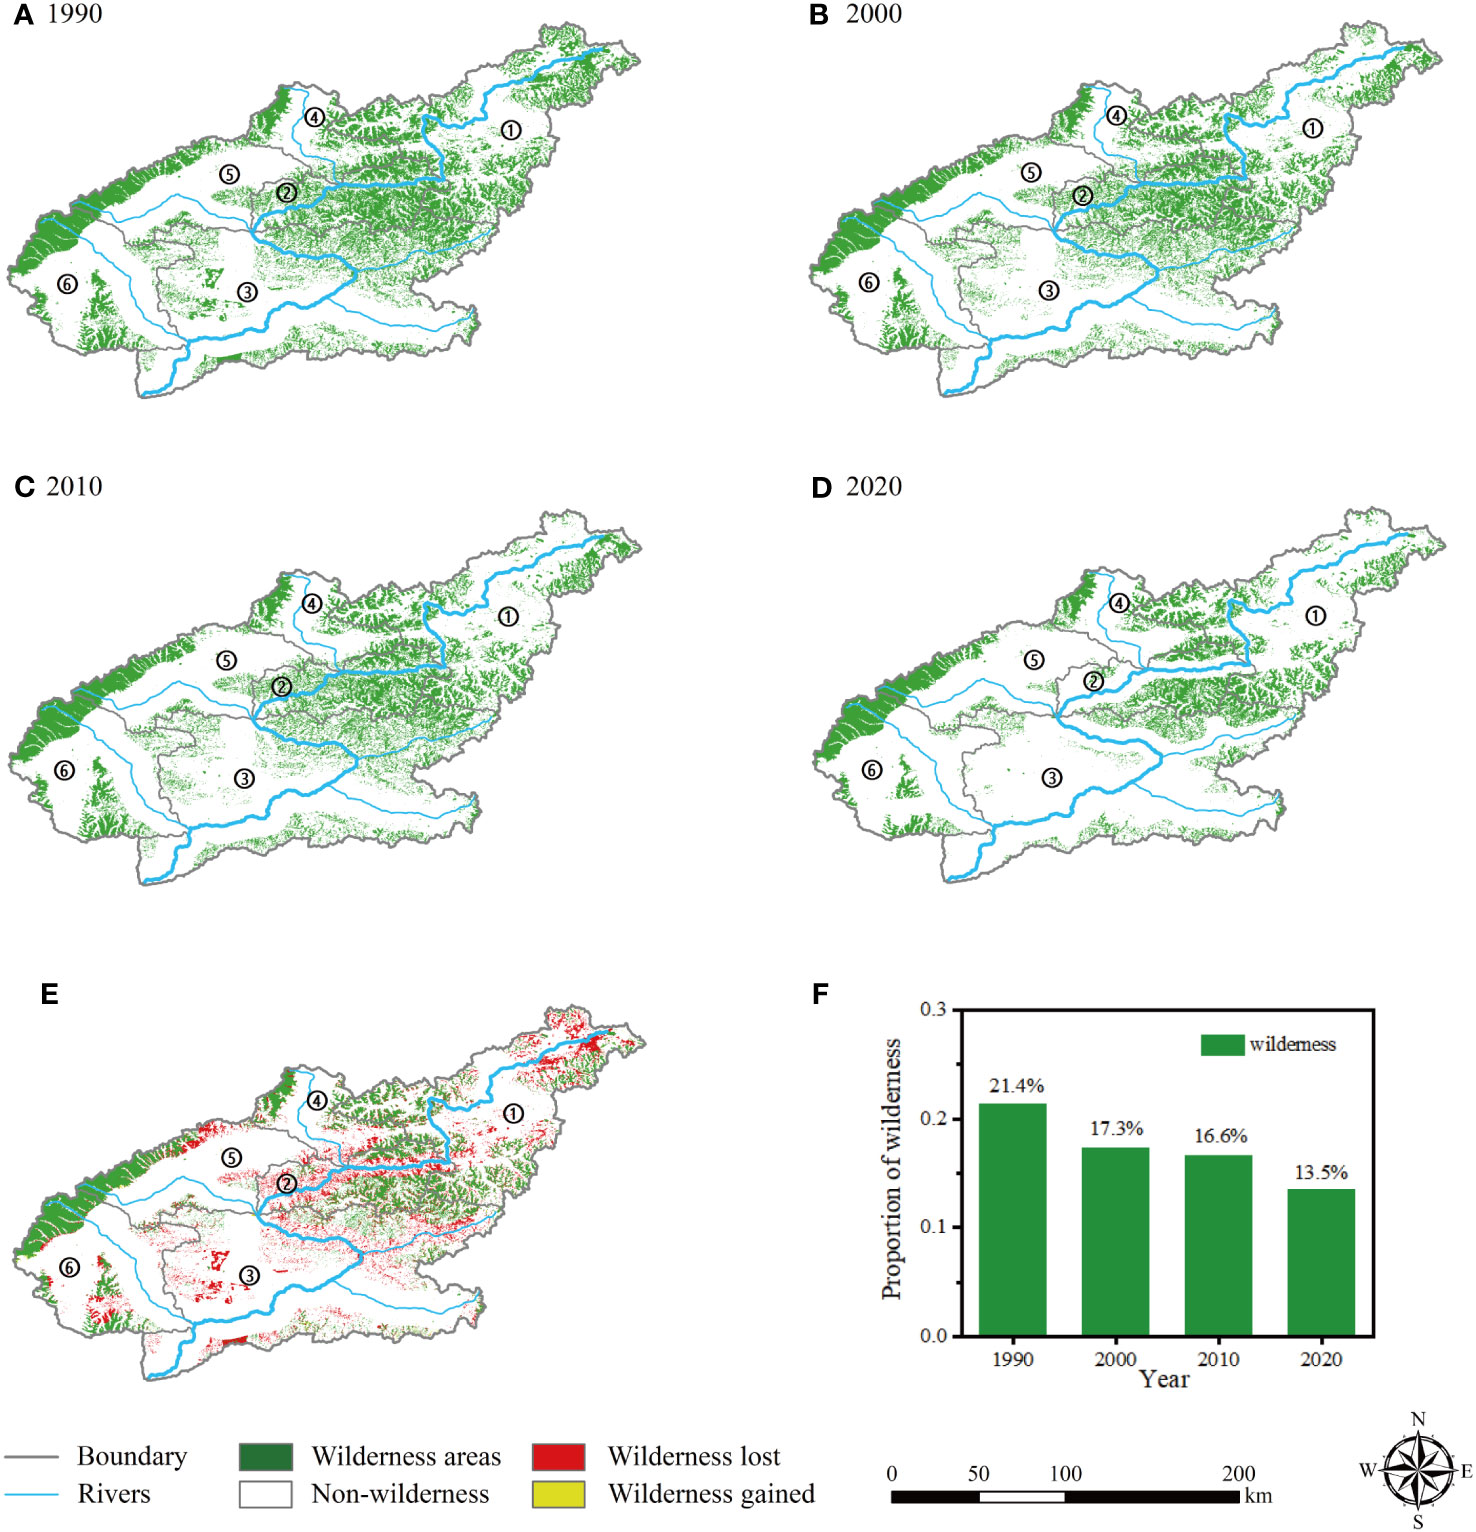
Figure 3 Spatial distribution of wilderness in Lhasa River Basin during 1990–2020 (A–D), overall change of wilderness during 1990–2020 (E), and the dynamic changes for the proportion of wilderness (F). ①-upper reach, ②-middle reach, ③-downstream reach, ④-SQ reach, ⑤-NQ reach, ⑥-DLQ reach.
In terms of the spatial dynamics between 1990 and 2000, the wilderness experienced a loss of 1,459 km2, while 136 km2 of land underwent transformation into wilderness. The most significant changes in the wilderness took place in the grassland, accounting for 79.2% of the loss and 82.7% of the gain. During the period from 2000 to 2010, the wilderness experienced minor changes, with a loss of 681 km2 and a gain of 447 km2. Likewise, the loss of wilderness primarily occurred in the grassland, accounting for 72.70%, whereas the gain was predominantly observed in both the grassland (44.3%) and barren (43.2%). Nevertheless, there was a significant intensification of wilderness loss during the 2010–2020 period, which predominantly occurred in the relatively flat areas on both sides of the river due to the higher intensity of human activities in those regions. Specifically, there was a total area of 1,445 km2 of wilderness loss and a gain of 437 km2. The wilderness changes were mainly observed in grassland and barren, with 66.1% of the loss occurring in grassland and 23.1% in barren, and 35.5% of the gain occurred in grassland and 52.8% in barren. It is worth noting that the wilderness in the SQ reach, NQ reach, and DLQ reach remained stable due to minimal human activities in the alpine regions characterized by perennial snow.
3.2.2 Temporal changes
Figure 4A illustrates the changes in wilderness areas between 1990 and 2020. It can be seen that the total area of wilderness has decreased from 6,957 km2 in 1990 to 4,393 km2 in 2020, indicating an average reduction rate of 85 km2 per year. Notably, the most substantial decline in wilderness occurred from 1990 to 2000, with a reduction rate of 132 km2/a. The loss rate of wilderness decreased to 23 km2/a from 2000 to 2010. However, the development of infrastructure for economic purposes has resulted in an increased loss of wilderness areas during the period from 2010 to 2020, with a reduction rate of 100.73 km2/a. Regarding each sub-reach, the upper reach of the Lhasa River experienced the highest loss rate of wilderness at 26.74 km2/a, followed by the middle reach (16 km2/a), upper reach (23.31 km2/a), NQ reach (7 km2/a), DLQ (6.8 km2/a), and SQ reach (5.2 km2/a).
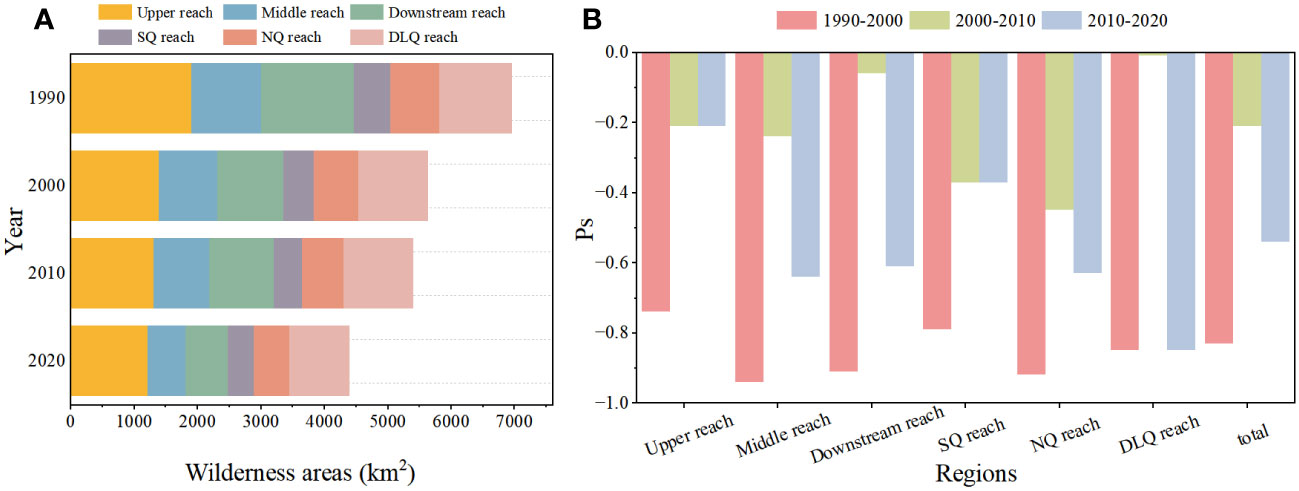
Figure 4 Changes in (A) areas and (B) trends of wilderness in the Lhasa River Basin from 1990 to 2020. represents the index of status, direction and trend.
The dynamic changes of wilderness were characterized by calculating the indices of status, direction, and trend (), net change (), and total change () (Table 3 and Figure 4B). It can be seen that throughout the entire period, remained below zero, indicating a persistent loss of wilderness. In the period from 1990 to 2000, was –0.83, indicating a highly unbalanced one-way transition where wilderness areas consistently declined with minimal gains. Conversely, from 2000 to 2010, decreased to –0.21, indicating a balanced two-way transition with a slight wilderness loss exceeding the gain. However, in the period from 2010 to 2020, was –0.54, indicating an imbalanced status where the loss of wilderness surpassed the gain. Notably, reached its maximum value of 0.35 in the 2010–2020 period, reflecting the most substantial changes in wilderness areas. Specifically, a total of 1,444.7 km2 of wilderness was lost, whereas 437.44 km2 of land underwent transition to wilderness. Among the sub-reaches, the downstream reach experienced the most notable change, with an average of –0.22 and T_c of 0.39. Furthermore, apart from the upper reach, the in other reaches represented an unbalanced status (), suggesting that the loss of wilderness was much greater than the gain.
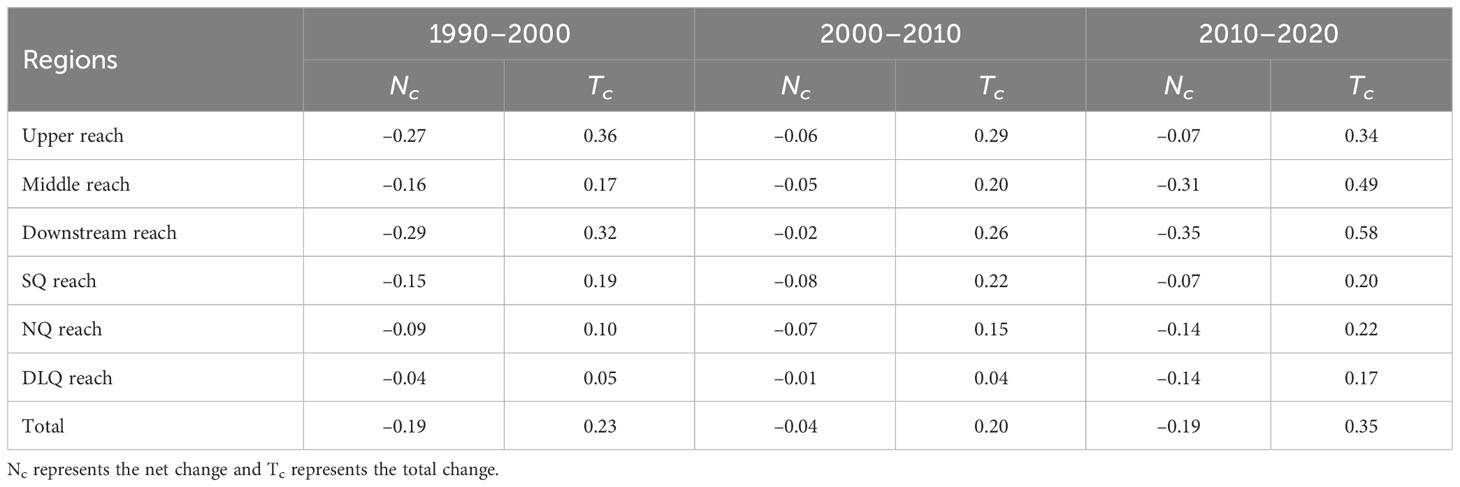
Table 3 Changes in wilderness areas in the Lhasa River Basin from 1990 to 2020.
3.3 Conservation priorities of wilderness
The conservation priority regions of wilderness in the Lhasa River Basin were mapped, taking into account the combined value of five ecosystem services (Figure 5). Consequently, a total of 502 wilderness patches were classified as conservation priority regions, exhibiting relatively higher values of ecosystem services (levels 4 and 5). These regions spanned an area of 1,475 km2, representing 33.6% of the entire wilderness area. In particular, the DLQ reach and NQ reach exhibited the highest concentration of conservation priority patches, accounting for 49.2% and 33.5% of the total identified regions, respectively. The downstream reach followed with 8.8%, while the upper reach, middle reach, and SQ reach accounted for 5.8%, 2.6%, and 0.1%, respectively.
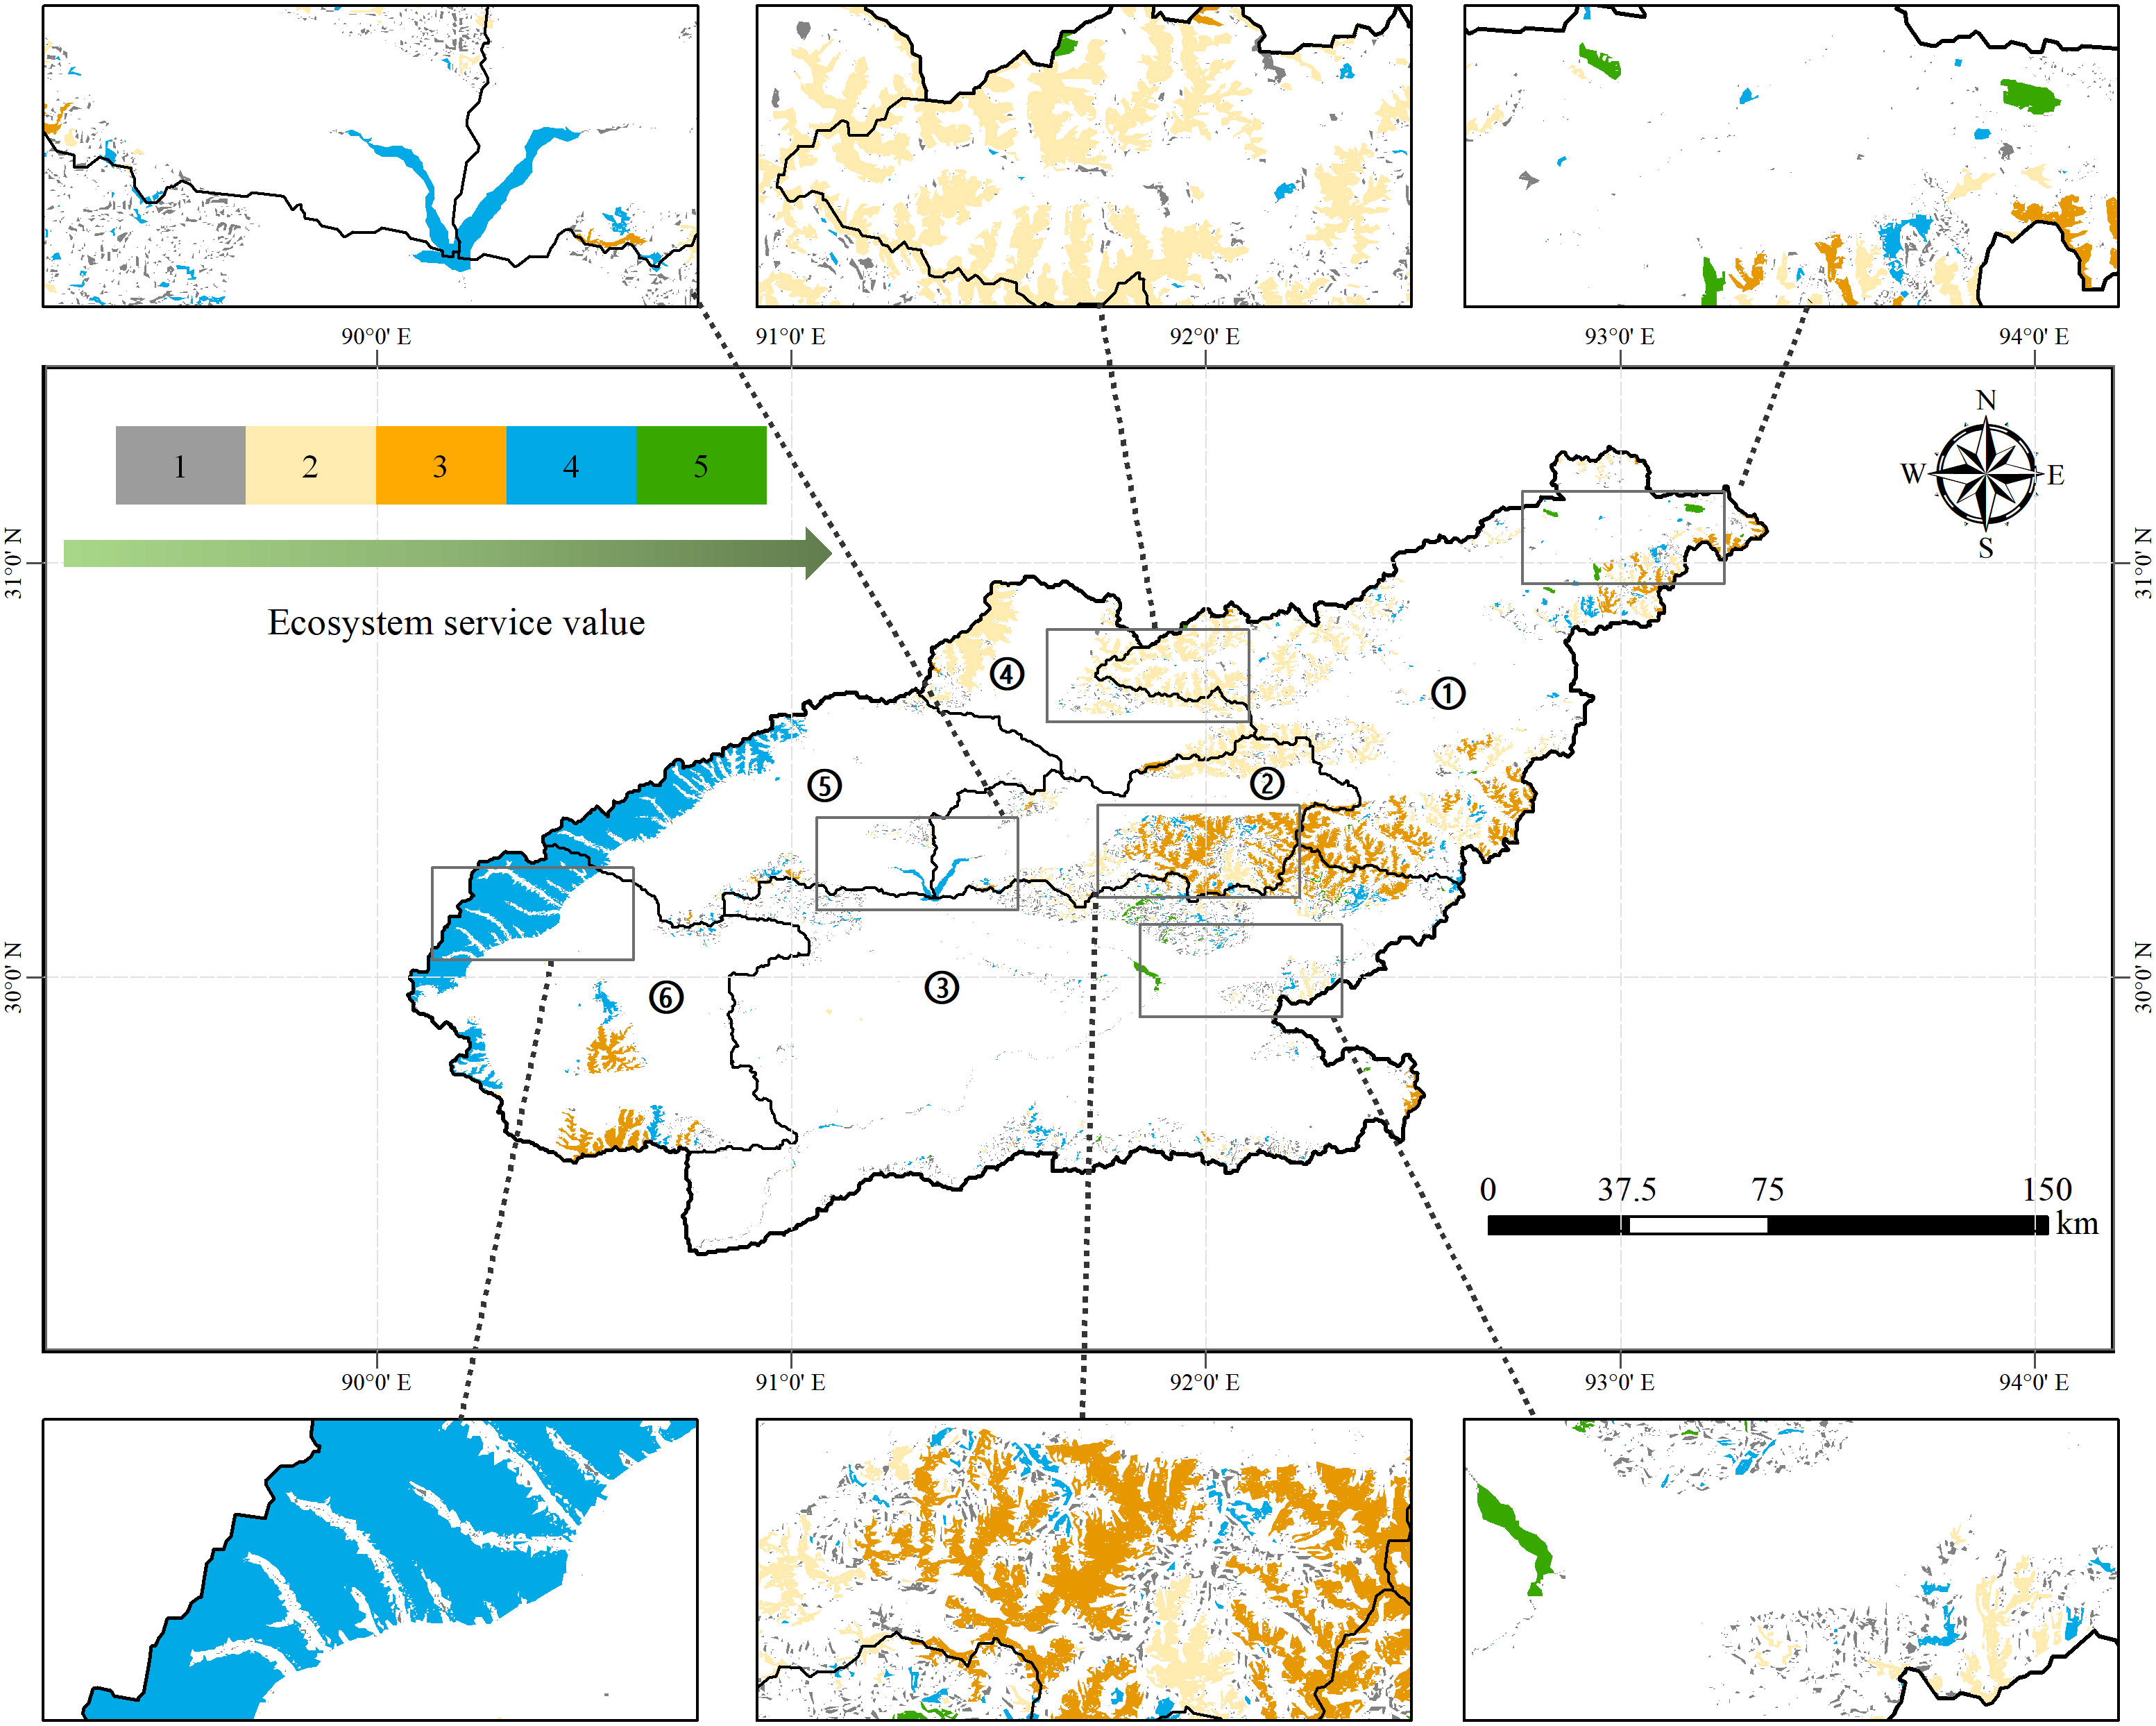
Figure 5 Conservation priorities of wilderness patches in the Lhasa River Basin. ①–⑥ represent the same reach as in Figure 3.
Spatially, wilderness patches classified as level 5 were observed in the northeastern upper reach and the eastern downstream reach. Furthermore, many wilderness patches categorized as level 4 were situated in the western section of the study area, primarily encompassing alpine regions characterized by perennial snow. These wilderness patches classified as level 5 and level 4 were identified as the core conservation regions due to their capacity to provide substantial ecosystem services. Wilderness patches categorized as level 3 were predominantly distributed in the eastern portion of the study area, at the confluence of the upper and middle reaches. Conversely, wilderness patches classified as level 2 were mainly observed in the SQ reach and the western upper reach. These regions provided relatively limited ecosystem services and are classified as general conservation regions. Wilderness patches categorized as level 1 were dispersed throughout the entire basin, with each patch generally being small in size. However, due to their vulnerability to human activities stemming from their proximity to human habitation, these scattered patches pose challenges for effective management and may entail substantial conservation costs. Consequently, we classified these areas as extensive conservation regions.
4 Discussion
4.1 Spatio-temporal variations of wilderness
Previous global examinations mapping wilderness areas utilizing the human footprint index reveal a mere 20% to 25% of the world’s untouched territories persisting (Williams et al., 2020; Mu et al., 2022). Specifically within China, approximately 21.3% of extant wilderness is dispersed across Tibet (Cao and Yang, 2017). Nonetheless, attributable to the constraints of resolution inherent in large-scale investigations, these studies fall short in accurately depicting the distinct attributes of local-scale wilderness. For instance, findings from this research indicate that wilderness within the Lhasa River Basin constitutes merely 13.5% of the entire basin, a crucial feature has not been effectively demonstrated in previous studies.
Wilderness areas in the Lassa River basin exhibit significant spatial heterogeneity. In general, the middle and upper reaches exhibit a greater proportion of wilderness compared to the relatively flat downstream areas. This distribution pattern is largely consistent with the findings of previous studies, such as in the three parallel rivers region in southwest China, which showed that wilderness areas predominantly exist within high mountainous and deep valley regions (Lin et al., 2016). The underlying reasons for this pattern primarily stem from the harsh natural environment in the upper reaches and the steep and rugged terrain in the mountainous areas of the middle reach, which act as barriers to human activities. Consequently, these factors contribute to the preservation of a higher proportion of wilderness in these regions. Unfortunately, most of the remaining wilderness in the Lhasa River Basin is barren land that cannot be directly used by human beings.
This study also reveals that the areas adjacent to the Lhasa River have experienced significant wilderness loss, particularly in the downstream regions, indicating their higher vulnerability to human activities. In contrast, the wilderness in the middle and upper reaches of the Lhasa River has remained relatively stable, consistent with findings in other watersheds (Zhang et al., 2021; Cao et al., 2022; Zhang et al., 2023). Consequently, the smaller and fragmented wilderness in the lower Lhasa River region faces a greater risk of loss compared to the relatively larger and more intact wilderness in the middle and upper reaches.
Over the past few decades, the Lhasa River Basin has experienced a consistent decline in the wilderness, which was in line with global trends (Venter et al., 2016; Mu et al., 2022). This decline can be attributed primarily to the intensification of human activities. For example, the resident population of Lhasa city has surged by approximately 510,000 people, or 143.38%, between 1990 and 2020. This population growth has undoubtedly escalated resource consumption, directly or indirectly contributing to the continuous loss of wilderness. Furthermore, barren constitutes a significant component of the wilderness in the Lhasa River basin, and the reduction of bare land over the past three decades has also resulted in the loss of wilderness (Wang et al., 2023). In this study, the loss of wilderness is predominantly observed in grasslands. On one hand, the expansion of towns and roads in the Lassa River basin has encroached upon grasslands, leading to the loss of wilderness in these areas (Nie et al., 2023). On the other hand, intensified grazing activities have transformed previously undeveloped grasslands into grazing areas, further exacerbating wilderness loss (Meng et al., 2023). In contrast, the study also reveals instances of wilderness expansion in certain areas of the Lhasa River basin. This is primarily due to grassland degradation caused by overgrazing, rendering some grassland originally used for grazing unsuitable for grazing and resulting in rewilding and an increase in “wilderness” (Niu et al., 2019; Xiang et al., 2021).
4.2 Wilderness requiring proactive conservation
There are currently three nature reserves in the Lhasa River basin, including the Lhalu wetland nature reserve, Mcdika wetland nature reserve, and Black-necked crane national nature reserve (Figure 6). These reserves collectively cover an area of approximately 2,574 km2, accounting for 7.9% of the total basin area. Overlay analysis of wilderness and protected areas reveals that only about 109 km2 of wilderness is situated within protected areas, representing less than 3% of the total wilderness area. Considering the crucial importance of wilderness in biodiversity conservation, it becomes evident that the existing nature reserves in the Lhasa River basin are far from adequate. Therefore, this study identifies priority conservation areas for wilderness, and provides a scientific foundation for establishing and planning future protected areas in the Lhasa River Basin.
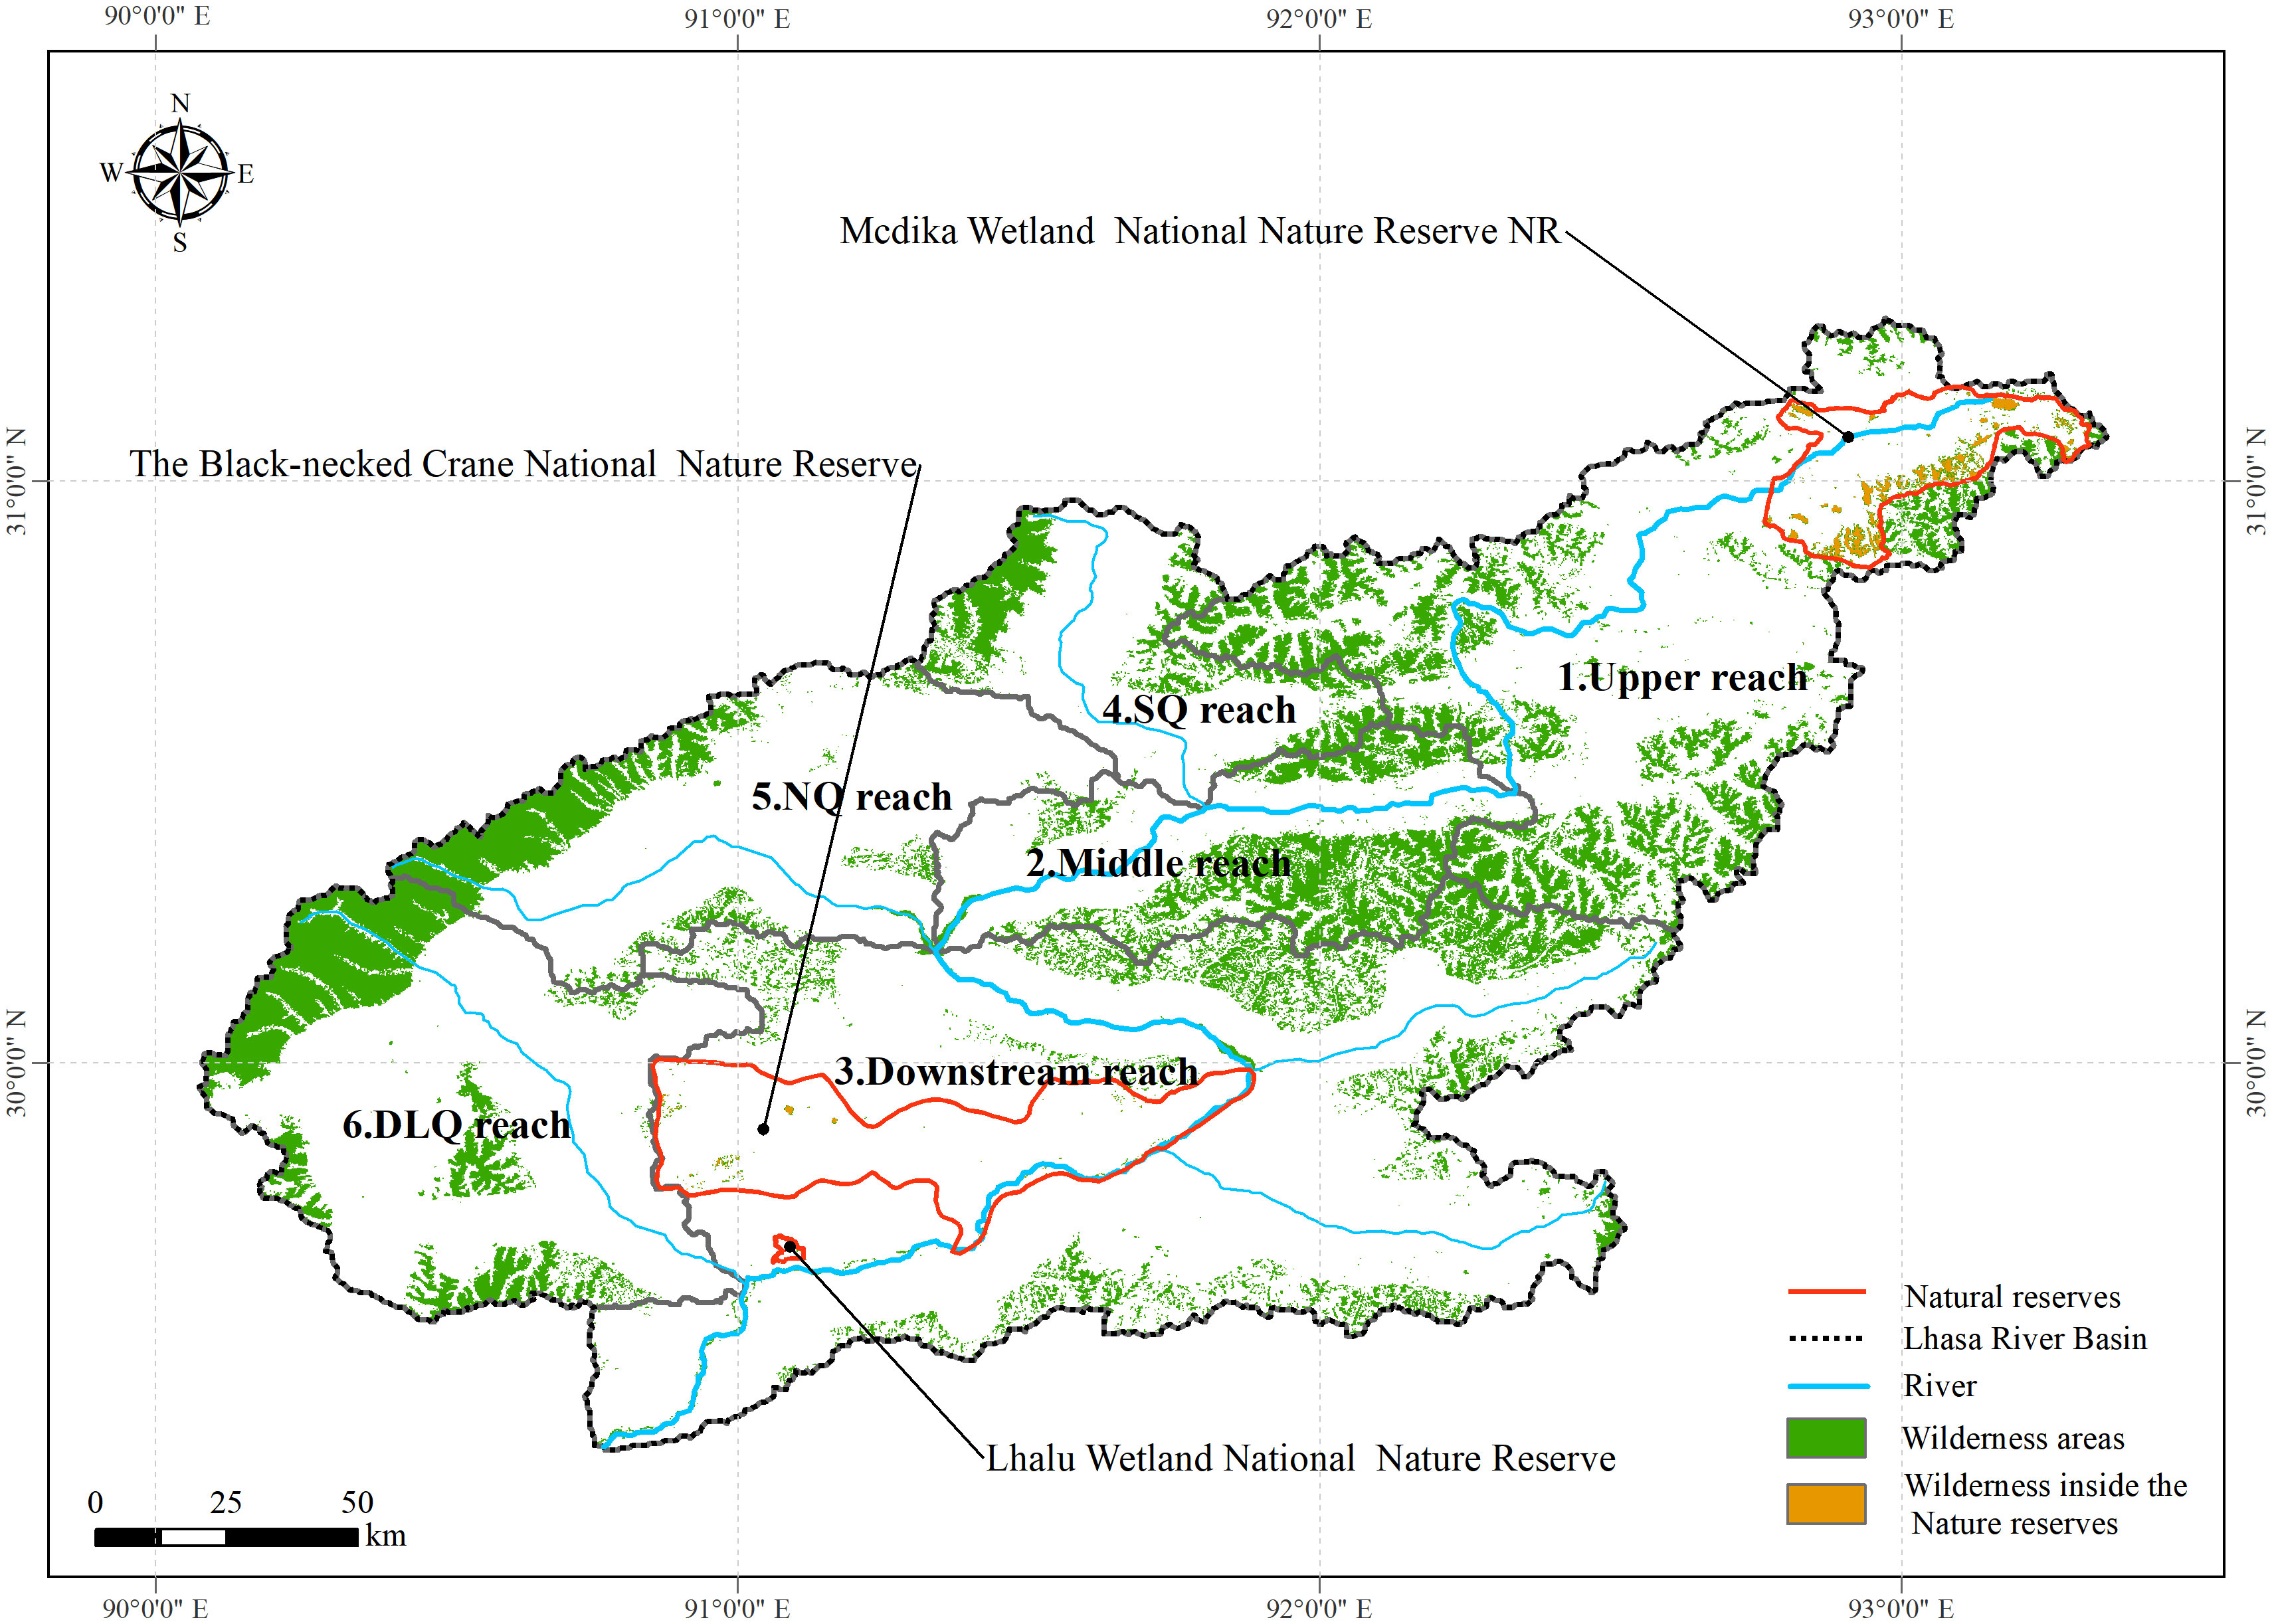
Figure 6 The spatial distribution of Nature Reserves and wilderness in the Lhasa River Basin.
The identification of priority protection areas for wilderness highlights certain regions that deserve special attention. First of all, the wilderness in the upper Lhasa River, particularly the surrounding area of Mcdika Wetland, holds significant conservation value. However, the Mcdika Wetland has experienced a decline in size and a weakening of its ecological services in recent decades, primarily due to intensified human activities (Li Y. et al., 2018). Consequently, it is crucial to implement effective controls or even prohibitions on human activities in this area to enhance the protection of the remaining wilderness and ensure ecosystem stability in the upstream region.
Additionally, it is essential to prioritize the conservation of the clusters of wilderness patches located in the middle reaches of the Lassa River (NQ and DLQ reaches) and at the junction of the upper and middle reaches. In comparison to other areas, these regions contain larger wilderness patches and exhibit superior connectivity. Regions with larger wilderness are considered to possess greater buffering capacity against extinction risks and are more effective in ensuring species persistence (Di Marco et al., 2019). Unfortunately, these areas lack any existing protected areas. Consequently, these areas also deserve special attention.
Lastly, special attention should be directed towards the small wilderness patches with high ecosystem service values surrounding the city of Lhasa in the lower Lhasa River. These areas face significant threats from increasing traffic development, urban expansion, and grazing activities, posing a serious risk to their natural ecosystems (Meng et al., 2023; Nie et al., 2023). It is crucial to acknowledge that these small wilderness patches are more susceptible to loss compared to larger and more intact wilderness (Cao et al., 2022). Nevertheless, considering the vital role these small wildernesses play in local biodiversity conservation, rigorous control measures or ecological restoration projects should be implemented to facilitate land rewilding in these areas.
4.3 Uncertainties and future research directions
There are inevitably some uncertainties and limitations associated with this study, particularly pertaining to data integrity, wilderness conceptualization, and the delineation of classification thresholds. Although seven variables were employed to encapsulate diverse human-induced pressures, they inadequately mirror actual human endeavors and the full spectrum of biodiversity conservation threats (Fu et al., 2021), thereby introducing potential result inaccuracies. Notably, the inability to factor in the entirety of human impacts might have led to an understated human footprint index (Venter et al., 2016). Additionally, while the ecosystem services dataset harnessed here is among the most comprehensive, its omission of certain ecosystem services may inject ambiguity into conservation priority assessments for wilderness. The metrics and scales chosen for wilderness quantification can introduce variabilities in wilderness cartography, contingent on their inherent values (Carver et al., 2012; Feizizadeh et al., 2014). Such combined uncertainties mean that area and percentage of wilderness presented in this study might either be overestimates or underestimates.
Thus, further researches should be paid more attention to the above uncertainties and limitations related to data gaps. To illustrate, the human pressures and the ecosystem services in the Lhasa River Basin need to be investigated further at adequate resolutions to craft more detail information across different spatial and temporal scales. Moreover, the results need further validation and optimization using relevant data with higher resolution and accuracy in the future.
5 Conclusions
Municipal governments must intensify endeavors to effectively enact the post-2020 global biodiversity framework, aimed at halting and reversing the worsening biodiversity trends to achieve the 2050 Vision. This study analyzed the spatio-temporal changes of wilderness within the Lhasa River Basin on the Qinghai-Tibet Plateau over the preceding three decades, and further determined conservation priorities of wilderness according to their ecosystem service. The findings revealed that wilderness in the Lhasa River Basin predominantly distributed in the eastern and northwestern territories of the basin, mainly comprising barren, grasslands, and glaciers. Throughout 1990 to 2020, wilderness overall experienced a continuous decline, with a substantial loss outweighing any gains. Notably, wilderness loss predominantly occurred in grasslands, whereas wilderness increases were primarily observed in barren. From a spatial perspective, the most significant decline in wilderness occurred in areas along the rivers, particularly in the lower reaches of the Lhasa River. Additionally, the study indicates that not all wilderness is remote, positing important implications for conservation practice. This research also highlight that the attention needs to be strengthened, particularly to wilderness in the upper Lhasa River, the northwestern region, and small patches of wilderness surrounding cities. We call for urgent conservation actions to prevent further wilderness loss in the Lhasa River Basin, a critical step toward achieving the post-2020 global biodiversity conservation objectives.
Data availability statement
The raw data supporting the conclusions of this article will be made available by the authors, without undue reservation.
Author contributions
LW: Data curation, Formal Analysis, Investigation, Methodology, Software, Writing – original draft. JF: Investigation, Methodology, Software, Writing – original draft. XJ: Software, Writing – original draft. PT: Methodology, Software, Writing – original draft. YL: Conceptualization, Funding acquisition, Project administration, Supervision, Validation, Writing – review & editing.
Funding
The author(s) declare financial support was received for the research, authorship, and/or publication of this article. This research was supported by the Lhasa Municipal Water Resources Bureau (Grant No. 54010021210200003594).
Conflict of interest
Authors LW, JF, XJ and PT were employed by the company Power China Chengdu Engineering Corporation Limited.
The remaining authors declare that the research was conducted in the absence of any commercial or financial relationships that could be construed as a potential conflict of interest.
Publisher’s note
All claims expressed in this article are solely those of the authors and do not necessarily represent those of their affiliated organizations, or those of the publisher, the editors and the reviewers. Any product that may be evaluated in this article, or claim that may be made by its manufacturer, is not guaranteed or endorsed by the publisher.
References
Bai W., Yao L., Zhang Y., Wang C. (2014). Spatial-temporal dynamics of cultivated land in recent 35 years in the lhasa river basin of tibet. J. Natural Resour. 29 (4), 623–632. doi: 10.11849/zrzyxb.2014.04.007
Cao Y., Carver S., Yang R. (2019). Mapping wilderness in China: Comparing and integrating Boolean and WLC approaches. Landscape Urban. Plann. 192, 103636. doi: 10.1016/j.landurbplan.2019.103636
Cao Y., Wang F., Tseng T. H., Carver S., Chen X., Zhao J., et al. (2022). Identifying ecosystem service value and potential loss of wilderness areas in China to support post-2020 global biodiversity conservation. Sci. Total. Environ. 846, 157348. doi: 10.1016/j.scitotenv.2022.157348
Cao Y., Yang R. (2017). Identification of wilderness areas from global to China: review and prospect on wilderness mapping. Environ. Prot. 45 (14), 39–44. doi: 10.14026/j.cnki.0253-9705.2017.14.0
Caro T., Darwin J., Forrester T., Ledoux-Bloom C., Wells C. (2012). Conservation in the anthropocene. Conserv. Biol. 26 (1), 185–188. doi: 10.1111/j.1523-1739.2011.01752.x
Carver S., Comber A., McMorran R., Nutter S. (2012). A GIS model for mapping spatial patterns and distribution of wild land in Scotland. Landscape Urban. Plann. 104 (3), 395–409. doi: 10.1016/j.landurbplan.2011.11.016
Carver S., Konraosdottir S., Guomundsson S., Carver B., Kenyon O. (2023). New approaches to modelling wilderness quality in Iceland. Land 12 (2), 446–446. doi: 10.3390/land12020446
Casson S., Martin V., Watson A., Stringer A., Kormos C. (2016). Wilderness protected areas: management guidelines for IUCN category 1b protected areas (Gland, Switzerland: IUCN).
CBD (2021). 1st draft of the post-2020 global biodiversity framework. (Montreal, Canada: Secretariat of the Convention on Biological Diversity).
Comber A., Carver S., Fritz S., McMorran R., Washtell J., Fisher P. (2010). Different methods, different wilds: Evaluating alternative mappings of wildness using fuzzy MCE and Dempster-Shafer MCE. Computers. Environ. Urban. Syst. 34 (2), 142–152. doi: 10.1016/j.compenvurbsys.2009.10.006
Di Marco M., Ferrier S., Harwood T. D., Hoskins A. J., Watson J. E. M. (2019). Wilderness areas halve the extinction risk of terrestrial biodiversity. Nature 573 (7775), 582–58+. doi: 10.1038/s41586-019-1567-7
Feizizadeh B., Jankowski P., Blaschke T. (2014). A GIS based spatially-explicit sensitivity and uncertainty analysis approach for multi-criteria decision analysis. Comput. Geosci. 64, 81–95. doi: 10.1016/j.cageo.2013.11.009
Folberth C., Khabarov N., Balkovic J., Skalsky R., Visconti P., Ciais P., et al. (2020). The global cropland-sparing potential of high-yield farming. Nat. Sustainabil. 3 (4), 281–289. doi: 10.1038/s41893-020-0505-x
Fu B., Ouyang Z., Shi P., Fan J., Wang X., Zheng H., et al. (2021). Current condition and protection strategies of qinghai-tibet plateau ecological security barrier. Bull. Chin. Acad. Sci. 36 (11), 1298–1306. doi: 10.16418/j.issn.1000-3045.202109190
Han W., Su X., Lu H., Li T., Jin T., Zhang M., et al. (2023). Impacts of human activity intensity on ecosystem services for conservation in the lhasa river basin. Ecosyst. Health Sustainabil. 9, Article 0008. doi: 10.34133/ehs.0088
Hua T., Zhao W., Cherubini F., Hu X., Pereira P. (2022). Continuous growth of human footprint risks compromising the benefits of protected areas on the Qinghai-Tibet Plateau. Global Ecol. Conserv. 34, e02053. doi: 10.1016/j.gecco.2022.e02053
Ibisch P. L., Hoffmann M. T., Kreft S., Pe’er G., Kati V., Biber-Freudenberger L., et al. (2016). A global map of roadless areas and their conservation status. Science 354 (6318), 1423–1427. doi: 10.1126/science.aaf7166
Kennedy C. M., Oakleaf J. R., Theobald D. M., Baruch-Mordo S., Kiesecker J. (2019). Managing the middle: A shift in conservation priorities based on the global human modification gradient. Global Change Biol. 25 (3), 811–826. doi: 10.1111/gcb.14549
Kuiters A. T., Kuiters A. T., van Eupen M., Carver S., Fisher M., Kun Z., et al. (2013). Wilderness register and indicator for Europe-Final report (Brussels, Belgium: European Commission).
Lesslie R. G., Maslen M. (1995). National wilderness inventory: Handbook of procedures, content and usage (Canberra: Australian Government Publishing Service).
Li X., Hou J., Huang C. (2021). High-resolution gridded livestock projection for western China based on machine learning. Remote Sens. 13 (24), 5038. doi: 10.3390/rs13245038
Li Y., Wang J., Shui Y., Chen X., Zheng G., Liu W., et al. (2018). Analysis of landscape pattern and ecological service function of the Mcdika wetland reserve. Acta Ecol. Sin. 38 (24), 8700–8707. doi: 10.5846/stxb201807171549s
Li S., Zhang Y., Wang Z., Li L. (2018). Mapping human influence intensity in the Tibetan Plateau for conservation of ecological service functions. Ecosyst. Serv. 30, 276–286. doi: 10.1016/j.ecoser.2017.10.003
Li X. J., Zhang J., Xu L. Y. (2015). An evaluation of ecological losses from hydropower development in Tibet. Ecol. Eng. 76, 178–185. doi: 10.1016/j.ecoleng.2014.03.034
Lin S., Wu R., Hua C., Ma J., Wang W., Yang F., et al. (2016). Identifying local-scale wilderness for on-ground conservation actions within a global biodiversity hotspot. Sci. Rep. 6, 25898. doi: 10.1038/srep25898
Liu Y., Liu S., Sun Y., Sun J., Wang F., Li M. (2022). Effect of grazing exclusion on ecosystem services dynamics, trade-offs and synergies in Northern Tibet. Ecol. Eng. 179, 106638. doi: 10.1016/j.ecoleng.2022.106638
Luo G. P., Zhou C. H., Chen X., Li Y. (2008). A methodology of characterizing status and trend of land changes in oases: A case study of Sangong River watershed, Xinjiang, China. J. Environ. Manage. 88 (4), 775–783. doi: 10.1016/j.jenvman.2007.04.003
Măntoiu D. Ş., Nistorescu M. C., Şandric I. C., Mirea I. C., Hăgătiş A., Stanciu E. (2016). “Wilderness areas in Romania: A case study on the south western carpathians,” in Mapping wilderness: concepts, techniques and applications. Eds. Carver S. J., Fritz S. (Dordrecht, Holland: Springer Netherlands), 145–156. doi: 10.1007/978-94-017-7399-7_10
Meng N., Wang L., Qi W., Dai X., Li Z., Yang Y., et al. (2023). A high-resolution gridded grazing dataset of grassland ecosystem on the Qinghai-Tibet Plateau in 1982-2015. Sci. Data 10 (1), 68. doi: 10.1038/s41597-023-01970-1
Mittermeier R., Mittermeier C., Brooks T., Pilgrim J., Konstant W., Fonseca G., et al. (2003). Wilderness and biodiversity conservation. Proc. Natl. Acad. Sci. United. States America 100, 10309–10313. doi: 10.1073/pnas.1732458100
Mu H., Li X., Wen Y., Huang J., Du P., Su W., et al. (2022). A global record of annual terrestrial Human Footprint dataset from 2000 to 2018. Sci. Data 9 (1), 176. doi: 10.1038/s41597-022-01284-8
Nie Y., Zhang X., Yang Y., Liu Z., He C., Chen X., et al. (2023). Assessing the impacts of historical and future land-use/cover change on habitat quality in the urbanizing Lhasa River Basin on the Tibetan Plateau. Ecol. Indic. 148, 110147. doi: 10.1016/j.ecolind.2023.110147
Niu Y., Zhu H., Yang S., Ma S., Zhou J., Chu B., et al. (2019). Overgrazing leads to soil cracking that later triggers the severe degradation of alpine meadows on the Tibetan Plateau. Land. Degradation. Dev. 30 (10), 1243–1257. doi: 10.1002/ldr.3312
Pimm S. L., Jenkins C. N., Abell R., Brooks T. M., Gittleman J. L., Joppa L. N., et al. (2014). The biodiversity of species and their rates of extinction, distribution, and protection. Science 344 (6187), 987–98+. doi: 10.1126/science.1246752
Radford S. L., Senn J., Kienast F. (2019). Indicator-based assessment of wilderness quality in mountain landscapes. Ecol. Indic. 97, 438–446. doi: 10.1016/j.ecolind.2018.09.054
Sanderson E., Fisher K., Robinson N., Sampson D., Duncan A., Royte L. (2022). The march of the human footprint. doi: 10.32942/OSF.IO/D7RH6
Sanderson E. W., Jaiteh M., Levy M. A., Redford K. H., Wannebo A. V., Woolmer G. (2002). The human footprint and the last of the wild. Bioscience 52 (10), 891–904. doi: 10.1641/0006-3568(2002)052[0891:Thfatl]2.0.Co;2
Shui Y., Lu H., Wang H., Yan Y., Wu G. (2018). Assessment of habitat quality on the basis of land cover and NDVI changes in Lhasa River Basin. Acta Ecol. Sin. 38 (24), 8946–8954. doi: 10.5846/stxb201806141331
Statistical Bureau of Tibet (2021). Tibet statistical yearbook, (1991-2021) (Beijing, China: China Statistics Press).
Trombulak S., Frissell C. (2000). Review of ecological effects of roads on terrestrial and aquatic communities. Conserv. Biol. 14, 18–30. doi: 10.1046/j.1523-1739.2000.99084.x
Venter O., Sanderson E. W., Magrach A., Allan J. R., Beher J., Jones K. R., et al. (2016). Sixteen years of change in the global terrestrial human footprint and implications for biodiversity conservation. Nat. Commun. 7, 12558. doi: 10.1038/ncomms12558
Wang P., Qin S., Hu H. (2023). Spatial-temporal evolution characteristics of land use change and habitat quality in the Lhasa River Basin over the past three decades. Arid. Zone. Res. 40 (3), 492–503. doi: 10.13866/j.azr.2023.03.15
Watson J. E. M., Fuller R. A., Watson A. W. T., Mackey B. G., Wilson K. A., Grantham H. S., et al. (2009). Wilderness and future conservation priorities in Australia. Diversity Distributions. 15 (6), 1028–1036. doi: 10.1111/j.1472-4642.2009.00601.x
Watson J. E. M., Shanahan D. F., Di Marco M., Allan J., Laurance W. F., Sanderson E. W., et al. (2016). Catastrophic declines in wilderness areas undermine global environment targets. Curr. Biol. 26 (21), 2929–2934. doi: 10.1016/j.cub.2016.08.049
Williams B. A., Venter O., Allan J. R., Atkinson S. C., Rehbein J. A., Ward M., et al. (2020). Change in terrestrial human footprint drives continued loss of intact ecosystems. One Earth 3 (3), 371–382. doi: 10.1016/j.oneear.2020.08.009
Wu R., Long Y., Malanson G. P., Garber P. A., Zhang S., Li D., et al. (2014). Optimized spatial priorities for biodiversity conservation in China: A systematic conservation planning perspective. PloS One 9 (7), e103783. doi: 10.1371/journal.pone.0103783
Xiang M., Wu J., Wu J., Guo Y., Lha D., Pan Y., et al. (2021). Heavy grazing altered the biodiversity–productivity relationship of alpine grasslands in lhasa river valley, tibet. Front. Ecol. Evol. 9. doi: 10.3389/fevo.2021.698707
Yang M., Chen A., Zhang M., Gu Q., Wang Y., Guo J., et al. (2023). Relationship between plant species diversity and aboveground biomass in alpine grasslands on the Qinghai–Tibet Plateau: Spatial patterns and the factors driving them. Front. Ecol. Evol. 11. doi: 10.3389/fevo.2023.1138884
Yang J., Huang X. (2021). The 30 m annual land cover dataset and its dynamics in China from 1990 to 2019. Earth Syst. Sci. Data 13 (8), 3907–3925. doi: 10.5194/essd-13-3907-2021
Zeng Y., Wang L.-e., Zhong L. (2022). Spatiotemporal variations of human pressure on key biodiversity areas in the qinghai-tibet plateau: A comparative analysis. Front. Ecol. Evol. 10. doi: 10.3389/fevo.2022.960634
Zhang Y., Hu Q., Tao J. (2023). Impacts of climate change on hulless barley security in plateau region: A case study of Lhasa River basin in Tibet, China. Food Energy Secur. 12 (3), e446. doi: 10.1002/fes3.446
Zhang Z., Li Y., Wang X., Li H., Zheng F., Liao Y., et al. (2021). Assessment of river health based on a novel multidimensional similarity cloud model in the Lhasa River, Qinghai-Tibet Plateau. J. Hydrol. 603, 127100. doi: 10.1016/j.jhydrol.2021.127100
Keywords: human footprint, landscape change, biodiversity conservation, ecosystem services, conservation strategies
Citation: Wang L, Fu J, Ji X, Tan P and Li Y (2023) Spatio-temporal variation and conservation priorities of wilderness in Lhasa River Basin, Tibetan Plateau. Front. Ecol. Evol. 11:1254540. doi: 10.3389/fevo.2023.1254540
Received: 07 July 2023; Accepted: 11 October 2023;
Published: 24 October 2023.
Edited by:
Pedro Gonçalves Vaz, University of Lisbon, PortugalReviewed by:
Steve Carver, University of Leeds, United KingdomShicheng Li, China University of Geosciences Wuhan, China
Copyright © 2023 Wang, Fu, Ji, Tan and Li. This is an open-access article distributed under the terms of the Creative Commons Attribution License (CC BY). The use, distribution or reproduction in other forums is permitted, provided the original author(s) and the copyright owner(s) are credited and that the original publication in this journal is cited, in accordance with accepted academic practice. No use, distribution or reproduction is permitted which does not comply with these terms.
*Correspondence: Yike Li, bGl5a0BjaWIuYWMuY24=