
94% of researchers rate our articles as excellent or good
Learn more about the work of our research integrity team to safeguard the quality of each article we publish.
Find out more
ORIGINAL RESEARCH article
Front. Ecol. Evol. , 03 August 2023
Sec. Environmental Informatics and Remote Sensing
Volume 11 - 2023 | https://doi.org/10.3389/fevo.2023.1253328
This article is part of the Research Topic Advances in Development and Utilization of Underground Space, volume II View all 13 articles
 Jiqiang Lyu1,2,3,4*
 Yuanjia Huang1,2,3,4
 Qiyang Nie1Chen Lu1,2,3,4Yueyan Zhang1,2,3,4Xianghang Fu1,2,3,4Peng Guo5,6
 Pingping Luo1,2,3,4
With increasing human activities, regional substrate conditions have undergone significant changes. These changes have resulted in temporal and spatial variations of non-point source pollution sources, which has a significant impact on the quality of the regional soil, surface water, and groundwater environments. This study focused on the human-disturbed Loess Plateau region and used an enhanced potential non-point-source pollution index (PNPI) model to explore the dynamic changes of regional potential non-point-source pollution (PNP) and the associated risk due to land use and land cover change (LUCC) over the past 31 years. The Loess Plateau region is mainly composed of cultivated land, grassland and forest, which together account for 93.5% of the watershed area. From 1990 to 2020, extensive soil and water conservation measures were implemented throughout the Loess Plateau region, resulting in a significant reduction in the non-point source pollution risk. Using the quantile classification method, the study area’s PNP risk values were categorized into five distinct levels. The results revealed a polarization phenomenon of PNP risk in the region, with an increase in non-point source pollution risk in the human-influenced areas and a rapid expansion of the very high-risk area. However, the non-point source pollution risk in the upstream water source area of the watershed reduced over the study period. In recent years, the rapid urbanization of the Loess Plateau region has been the primary reason for the rapid expansion of the very high PNP risk area throughout the watershed. This study highlights the significant impact of LUCC on the dynamic changes in PNP risk within the Loess Plateau region, providing crucial insights into future conservation and urban planning policies aimed at enhancing the ecological health and environmental quality of the region.
The Loess Plateau region in China is a unique ecological environment, known for its dramatic landscapes, including the Yellow River and the high mountains of the Tibetan Plateau. However, the poor soil and water resources in the region make it vulnerable to non-point source pollution, which is a major issue (Wang, 2006; Ting, 2010; Sun et al., 2012; Shen et al., 2015; Guo et al., 2022). In recent years, the Chinese government has taken active steps to protect the regional environment because the rapid urbanization of the region has had a significant impact on the quality of both surface water and groundwater within the watershed (Ritter et al., 2002; Zhang et al., 2014; Shen et al., 2015; Yang et al., 2017). As a result, water resource scarcity and pollution have emerged as serious challenges to sustainable development and the well-being of local populations (Shen et al., 2013; Lyu et al., 2019; Tao et al., 2020). While government policies and land managers have effectively controlled many water pollution problems, non-point source pollution still has an impact on environmental quality. Non-point source pollution is complex, widespread, and latent, making governance and control more difficult (Yang et al., 2013; Park et al., 2019).
Non-point source pollution, resulting from the uncontrolled runoff of various contaminants from agricultural land, urban areas, and other sources, is a significant threat to the environment (Cecchi et al., 1982; Puccinelli et al., 2013; Yang et al., 2013). Its destructive impacts include reductions in water quality, accelerated soil erosion, and increased air pollution levels (Lyu et al., 2018). This is a major cause of concern for environmental scientists and policymakers worldwide because it poses a formidable challenge to achieving the sustainable development goals (Xu et al., 2022). Non-point source pollution has been linked to the degradation of natural habitats and biodiversity loss, and has negative impacts on human health (Vörösmarty et al., 2010; Puccinelli et al., 2013; Ouyang et al., 2016; Ge et al., 2022). To address this issue, it is imperative to adopt a comprehensive and integrated approach that considers the unique characteristics of each pollution source and their interactions with the environment. Effective management strategies, such as land-use planning, implementation of best management practices, and the promotion of sustainable agricultural practices, are essential to mitigate the negative impacts of non-point source pollution (Novotny and Chesters, 1981; Mohammadi, 2001; Loague and Corwin, 2005; Gémesi et al., 2011; Yang et al., 2013). To mitigate non-point source pollution and soil erosion in the Loess Plateau, the Chinese government has implemented various projects and initiatives since 1995. These include sustainable agricultural practices since 2001, afforestation since 1999, and sediment control structures since 1995. These measures have been implemented to improve the ecological health and overall environmental quality of the region (Munafò et al., 2005; Zhang, 2008; Wang et al., 2010; Hao and Lu, 2021). These efforts have significantly decreased soil erosion and non-point source pollution, leading to improved water quality, better agricultural productivity, and increased biodiversity. However, quantifying non-point source pollution remains a challenge, because it is highly variable and difficult to predict.
Quantifying non-point source pollution is critical for effective watershed management. There has been significant progress in recent years in measuring and modeling non-point source pollution using methods such as remote sensing, watershed modeling, and field sampling (Munafò et al., 2005; Cotman et al., 2008; Lee et al., 2009; Zhang and Huang, 2011; Geng et al., 2015; Liu et al., 2019; Alnahit et al., 2020; Luo et al., 2022). There are still many challenges in accurately measuring the sources and impacts of non-point source pollution because they are highly variable and difficult to predict (Ouyang et al., 2010). The current methods used to quantify non-point source pollution in watersheds are mostly based on modeling, with the most widely used models being the Soil and Water Assessment Tool, Areal Nonpoint Source Watershed Environment Response Simulation (Borah and Bera, 2004; Cecchi et al., 2005; Sharma and Tiwari, 2019; de Mello et al., 2020; Hou et al., 2022). However, these models have high data volume and accuracy requirements, making them less applicable in areas with a lack of monitoring data (Borah and Bera, 2004; Cecchi et al., 2005). The potential non-point-source pollution index (PNPI) is a geographical information system (GIS)-based watershed non-point source pollution risk assessment tool (Cecchi et al., 2007; Shen et al., 2014), which describes the PNP risk of a region by generalizing the production, degradation, and transportation processes of pollutants, and has received increasing attention from researchers due to its low data requirements (Loague and Corwin, 1996; Gossweiler et al., 2021; Liu et al., 2021; Qian et al., 2021; Xu et al., 2021; Li et al., 2022). Researchers have used the PNPI model to assess the PNP risk in various regions, including the middle of Italy’s Viterbo Province (Cecchi et al., 1982) and typical watersheds in China (Munafò et al., 2005; Fan and Fang, 2020; Li H. L. et al., 2021; Ouyang et al., 2010). However, studies using the PNPI and its incorporation in improved models have mostly focused on evaluating the current situation regarding PNP in small watersheds, with much less research on the evolutionary characteristics of PNP risk in watersheds under the influence of historical land use change (Ierodiaconou et al., 2005; Clément et al., 2017; Li et al., 2020; Li et al., 2022).
The Loess Plateau region is known for having one of the highest population densities in the world, and has unfortunately experienced non-point source pollution due to human activities in the region. This has led to pollution of the water environment throughout the area (Wang, 2006; Ting, 2010; Ai et al., 2015; Shen et al., 2015; Li L. et al., 2021; Shi et al., 2022). The far-reaching effects of this pollution have had a substantial impact on both the environment and health of local inhabitants. With the continuous urbanization, water pollution levels have been rising throughout the region (Shen et al., 2015; Yang et al., 2017; Lyu et al., 2019). This study investigated the temporal and spatial variations of PNP and the risk it presents in the Loess Plateau region, considering the impact of historical LUCC from 1990 to 2020. The results will enable a better understanding of non-point source pollution in the region and enable effective strategies for pollution management and control to formulated. The findings of the study will be critical for implementing effective policies and regulations to mitigate the negative impacts of non-point source pollution. Ultimately, it is hoped that this research will contribute to a more sustainable and equitable future for the inhabitants of the Loess Plateau region, where the natural environment and human populations can thrive in harmony.
The Loess Plateau, also referred to as the Huangtu Plateau, is a region situated in the upper and middle reaches of the Yellow River in China, ranging in latitude from 34°N to 42°N and in longitude from 105°E to 117°E. With an area covering approximately 640,000 km², it constitutes 12.5% of the total area of China (Fu, 2010; Wang et al., 2010; Lyu et al., 2019; Zhang et al., 2020). The vast area of the Loess Plateau in northern and northwestern China encompasses several provinces, including Inner Mongolia, Shanxi, Ningxia, Shaanxi, and Gansu. This area is home to approximately 40 million inhabitants and is characterized by unique geological features, which have significant ecological and environmental implications.
Characterized by its yellow-brown loess soil, steep mountains, and deep valleys, the Loess Plateau has an average elevation of 1000-1500 m. Its temperate continental climate is defined by strong winds, significant temperature differences between day and night, and abundant precipitation. This region is highly significant ecologically and serves as a critical source of water for the Yellow River, hence it has been referred to as the “water tower of the Yellow River.” The Loess Plateau is also renowned for its agricultural significance, with its loess soil proving highly suitable for cultivating crops such as wheat (Ierodiaconou et al., 2005; Li et al., 2020; Li et al., 2022). Figure 1 shows the geographic location of the Loess Plateau in the northwestern region of China. This region remains a critical area for ecological preservation and agricultural development within China.
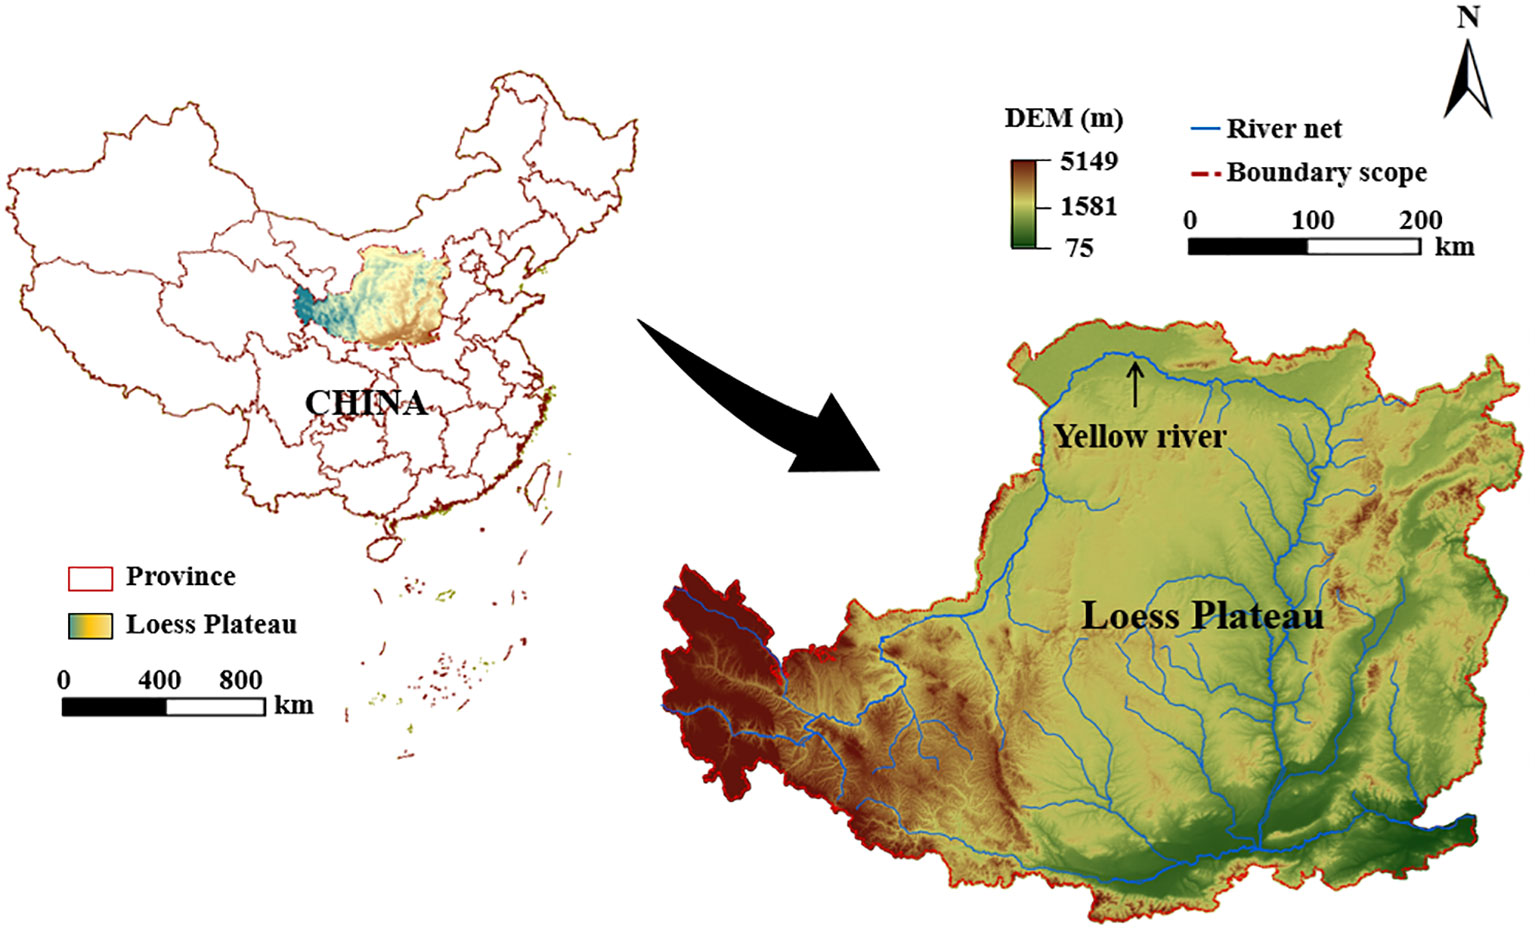
Figure 1 Location of the Loess Plateau.
The PNPI is a widely recognized tool that has been used to quantitatively assess the potential risk of non-point source pollution across various land use types within the Loess Plateau region (Ritter et al., 2002; Shen et al., 2013; Tao et al., 2020). It simplifies the processes of pollutant generation, degradation, and transport into a land cover index (LCI), distance index (DI), and runoff index (ROI), with a spatial distribution. The spatial PNP risk of the watershed can be expressed as a function of these three indexes. The enhanced PNPI model structure is shown in Figure 2.
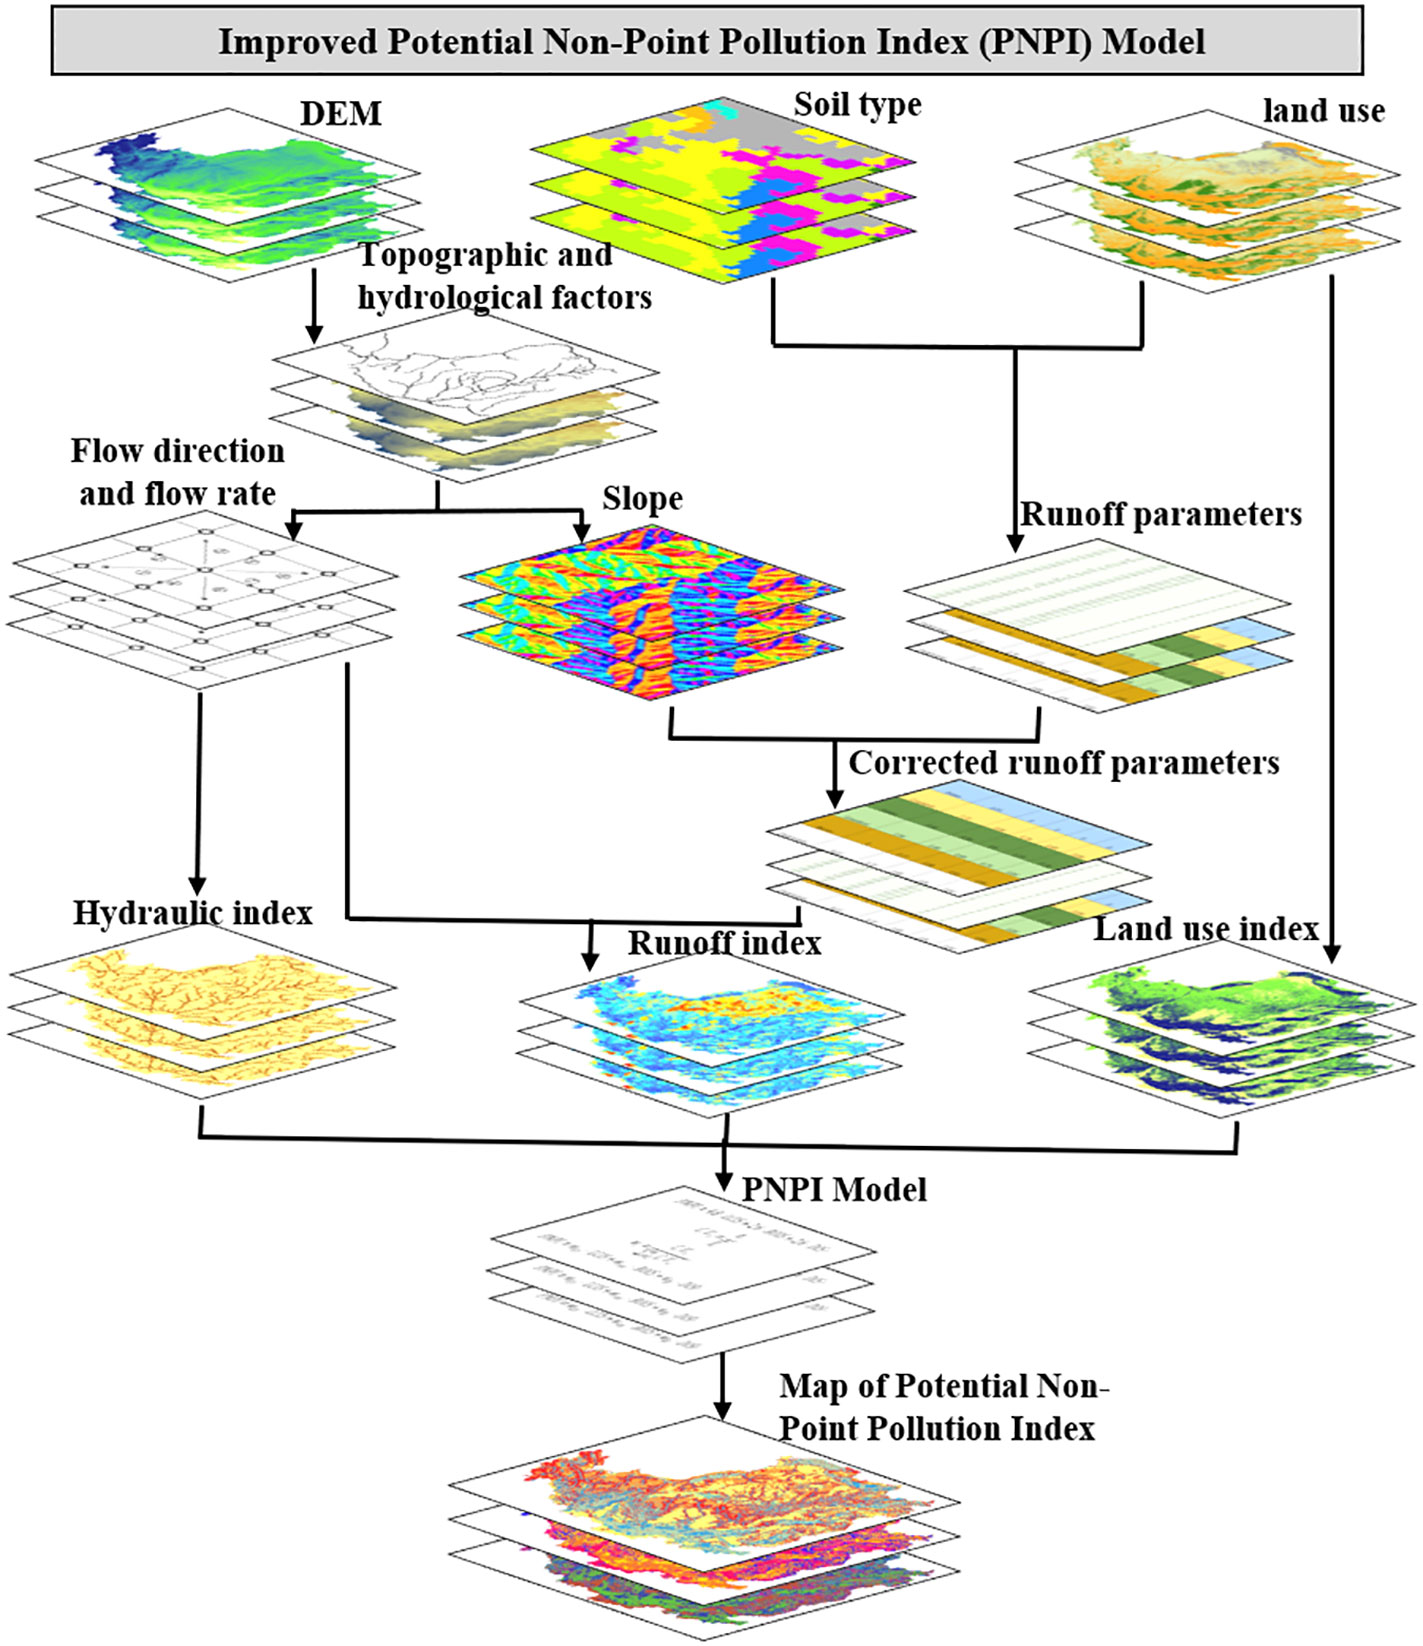
Figure 2 Improved PNPI Model Structure.
The PNPI integrates the function expressions of the LCI, DI, and ROI into fixed weights, which are then divided by an expert scoring method (Munafò et al., 2005). This approach lacks objectivity and applicability, making it necessary to adopt an objective weighting method based on the principle of information entropy and the coefficient of variation decision-making to improve the model. Figure 2 shows the new weighting method for the improved PNPI model. Using the enhanced PNPI model, this study simulated the temporal and spatial dynamics of PNP risk in the study area over the past 31 years, considering the influence of land use changes. By combining the results of this model with an analysis of the temporal and spatial changes in land use, this study explored the primary evolutionary characteristics of PNP risk in the Loess Plateau region and identified its dominant factors. To achieve this goal, this study developed an objective and applicable weighting method to enhance the rationality and accuracy of the PNPI model. This enhanced model was then used to investigate the potential risk of non-point source pollution in the study area. The results of this analysis revealed the distribution characteristics and dominant factors controlling the PNP risk in the Loess Plateau region.
The data used in the PNPI model was primarily composed of spatial and attribute data. The former encompassed digital elevation model (DEM) data, soil types, and land use and land cover change (LUCC) data (Lyu et al., 2019; Yang and Huang, 2021; Shi et al., 2022). The latter included soil permeability and land use attributes. Table 1 presents the data sources required for model calculation.
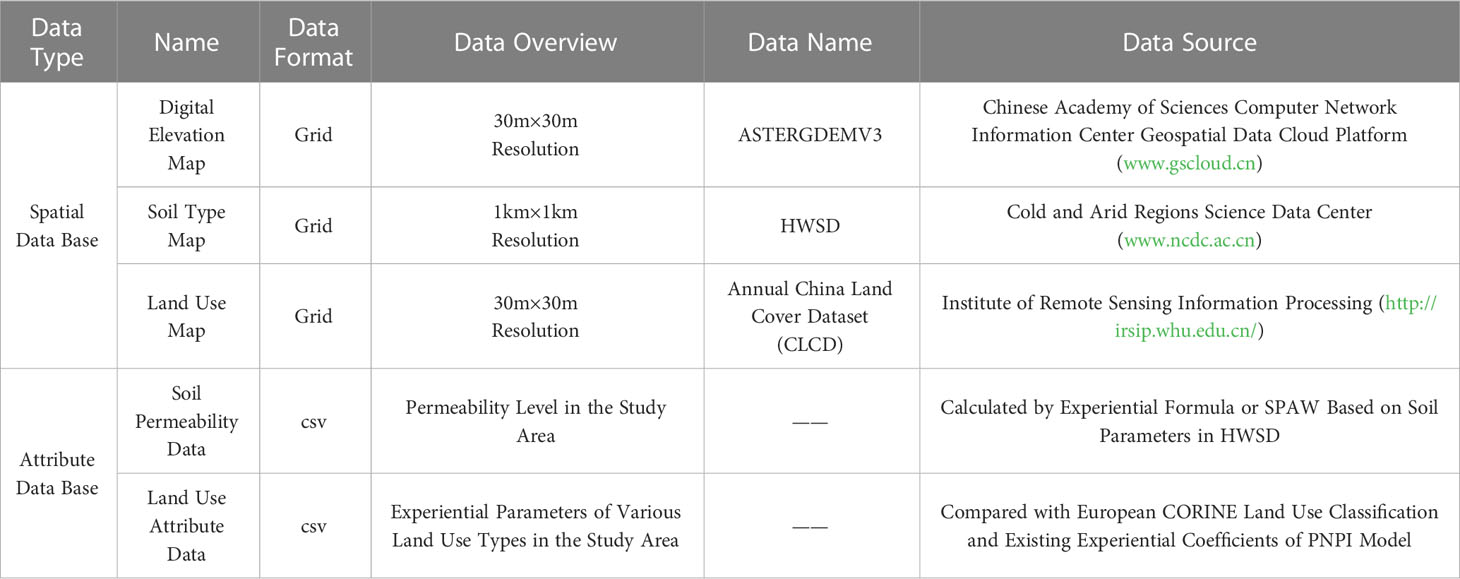
Table 1 The satellite data used in the PNPI model.
The soils in the Loess Plateau region are diverse and can be classified into several types based on their physical, chemical, and biological properties (Fu, 2010; Zhang et al., 2020; Li L. et al., 2021; Shi et al., 2022). The Harmonized World Soil Database (HWSD) provides a comprehensive dataset of the distribution of soil types in the region. According to the HWSD, the dominant soil types in the Loess Plateau include Cambisols, Calcisols, and Luvisols, which together account for more than 80% of the total area. Cambisols are mainly distributed in the northwestern and northeastern parts of the plateau, while Calcisols are distributed in the central and southeastern areas. Luvisols are mainly found in the western and southern parts of the plateau. In addition to these dominant soil types, there are also other soil types present in the region, such as Fluvisols, Gleysols, and Vertisols. Fluvisols are distributed along the rivers and streams in the plateau, while Gleysols are found in low-lying areas with poor drainage. Vertisols are mainly distributed in the southern and southeastern parts of the plateau. The HWSD database provides valuable information on the distribution and characteristics of soil types in the Loess Plateau.
The soil permeability classification was based on the HWSD database. The saturated infiltration rate of each soil was determined using the SPAW 6.02 software developed by the US Department of Agriculture. This value was then compared with the hydrological group (HYDGRP) standard of the US National Natural Protection Agency (NRCS) to categorize the soil permeability into one of four groups: A, B, C, or D. The soil hydrological groups in the study area were predominantly B and C. Land use attribute data comprises index values for each land use and the runoff parameters associated with different hydrological groups. These data were acquired from the existing expert rating and parameter system of PNPI. In some cases, field measurements and experimental research were used to supplement the data. Because of the diverse sources of spatial data, varying coordinate systems were used. Consequently, these systems should be projected or transformed to a consistent projection coordinate system to facilitate subsequent calculations. The soil types in the Loess Plateau are shown in Figure 3.
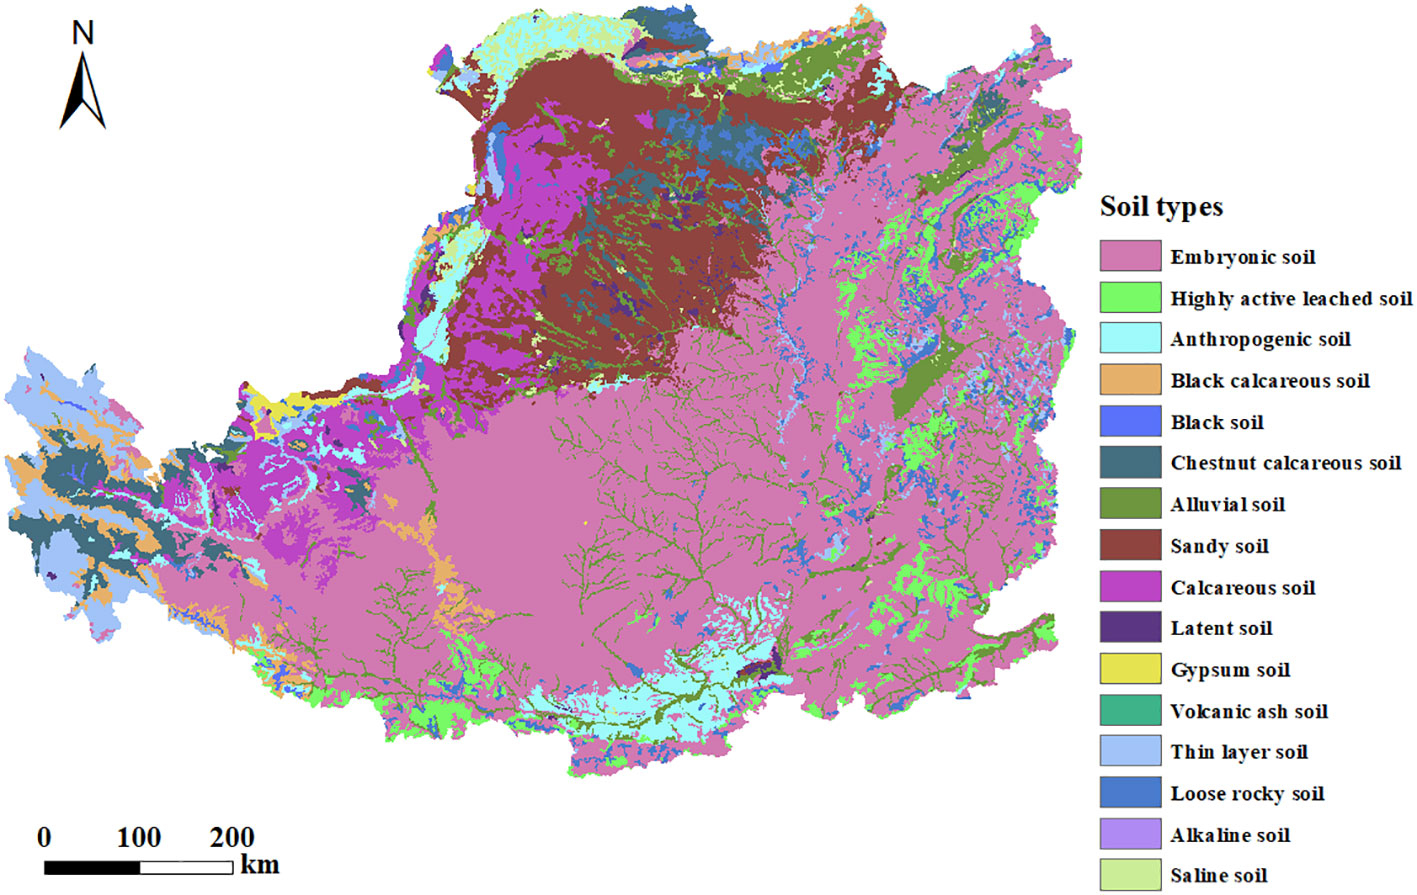
Figure 3 Soil type map of the Loess Plateau.
The LCI denotes the potential pollution load produced by various land use types to the receiving water body. Higher LCI values indicate a greater potential for pollution, and therefore, pose a higher pollution risk. To determine the LCI in this study, the LCI value obtained through expert scoring in the PNPI model was adopted, as detailed in previous studies (Munafò et al., 2005). Experts assigned potential pollutant production scores to different land use types based on their professional knowledge, using a scoring system ranging from 0 to 10. The involvement of more experts in the scoring process, along with a wider research field and lower scoring standard deviation, yielded more reliable results. The LCI values and scoring standard deviations associated with the research area were screened and are presented in Table 2, as per Cecchi and Munafo (Munafò et al., 2005; Cecchi et al., 2007).

Table 2 The LCI values.
The DI was used to generalize the degradation processes occurring along the migration path of the pollution source in the confluence (Cecchi et al., 2007). A higher DI value indicates a shorter confluence distance, closer proximity to the river network, smaller degradation effect, and greater pollution risk. The DI was calculated by equation (1):
where DI is the value of the distance index, D is the confluence distance in units of cells, and k is a constant. Referring to Cecchi et al. (Shen et al., 2013; Tao et al., 2020), the value of k was determined as 0.090533.
The ROI is used to generalize the process of pollutant transport and the influence of terrain, soil, and land use on infiltration filtration. A high ROI value indicates lower infiltration filtration intensity, greater pollutant inflow into the receiving water body, and a higher pollution risk. The ROI was calculated by equation (2):
where ROI is the value of the runoff index, and CROPi is the runoff parameter of the i-th unit on the runoff path after slope correction, which ranges from 0 to 1. When the calculated result of (3) is greater than 1, the value is taken as 1. The value of n corresponds to the number of units on the runoff path, while ROP is the runoff parameter. This study used the runoff coefficient table (Table 3) and slope correction coefficient C provided by Cecchi and Wu (Shen et al., 2013; Tao et al., 2020) for different land use and hydrological groups in the study area.
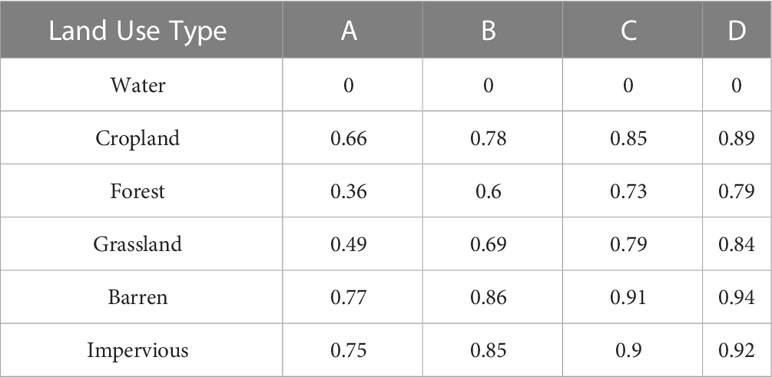
Table 3 Runoff coefficients for different land use types [11].
The PNPI was used to comprehensively assess the intensity of the pollution load to rivers and other surface water bodies from the various land use types in the study area. It is a comprehensive function that integrates the LCI, DI, and ROI. However, the original PNPI uses the expert scoring method (Munafò et al., 2005; Cecchi et al., 2007), and the weight is fixed, which results in insufficient objectivity and practicability.
The original PNPI formula is expressed as follows,
where PNPI is the potential non-point source pollution index, LCIS is the standardized land use index value, ROIS is the standardized ROI, and DIS is the standardized DI.
To overcome the limitations of the original PNPI model, this study used the coefficient of variation decision-making method to assign weights to variables according to the relative changes of each index, which was not affected by subjective factors and was a more rigorous approach (Cecchi et al., 2007). The weight assigned to each index was optimized by employing the coefficient of variation decision-making method. The following calculations were undertaken:
1. The coefficient of variation of each index was calculated,
where C.V.i is the coefficient of variation of the ith index set, i is the mean of the ith index set, and σi is the standard deviation of the ith index set.
2. The weights of each index were calculated and the PNPI was obtained,
where wi is the weight of the ith index set, and wlci, wroi and wdi are the weight coefficients of the LCI, ROI, and DI, respectively. The use of the coefficient of variation decision-making method improved the objectivity and practicability of the PNPI model.
The Loess Plateau region has undergone significant changes in LUCC in the past 31 years. A statistical analysis of LUCC in the region from 1990 to 2020 was conducted, and regional maps of land use types were obtained for each year. The distribution of land uses for the representative years is shown in Figure 4. Grassland and cropland were the dominant land use types, accounting for approximately 79.8% of the total area. The area of water bodies remained relatively stable from 1990 to 2020. However, the area of cropland and barren land displayed a decreasing trend, with cropland displaying the most significant reduction. In contrast, forest, grassland, and impervious surfaces displayed an increasing trend, with the speed of impervious surface expansion being the most substantial.
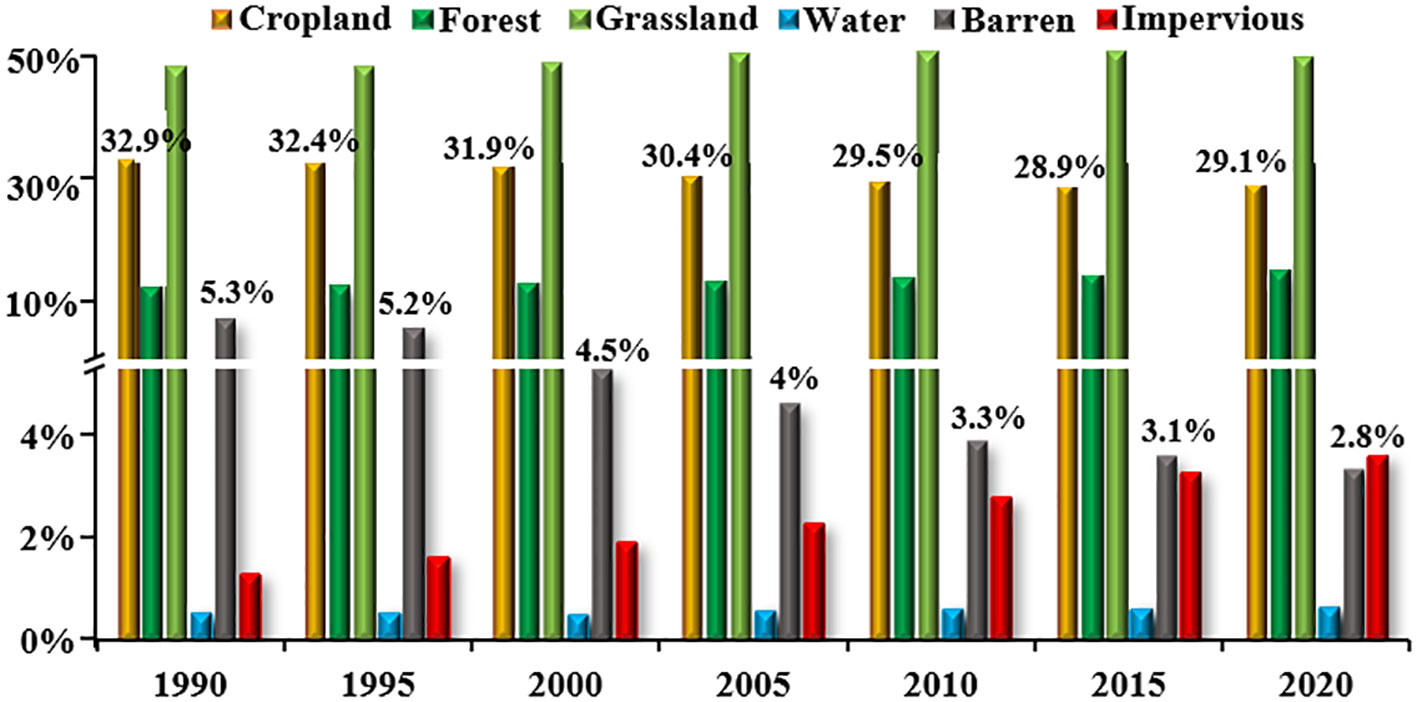
Figure 4 Proportional area of different land uses on the Loess Plateau from 1990 to 2020.
The different land uses in the Loess Plateau region between 1990 and 2020 are presented in Figures 4, 5. They include cropland, forest, grassland, water bodies, barren land, and impervious surfaces. These different land uses provide an insight into how the region has been used over the past three decades. The figures show that the Loess Plateau region has experienced significant changes in land use over the past three decades, with some land uses experiencing declines and others experiencing increases. These changes are likely to have significant impacts on the environment, the local ecosystems, and the livelihoods of people living in the region.
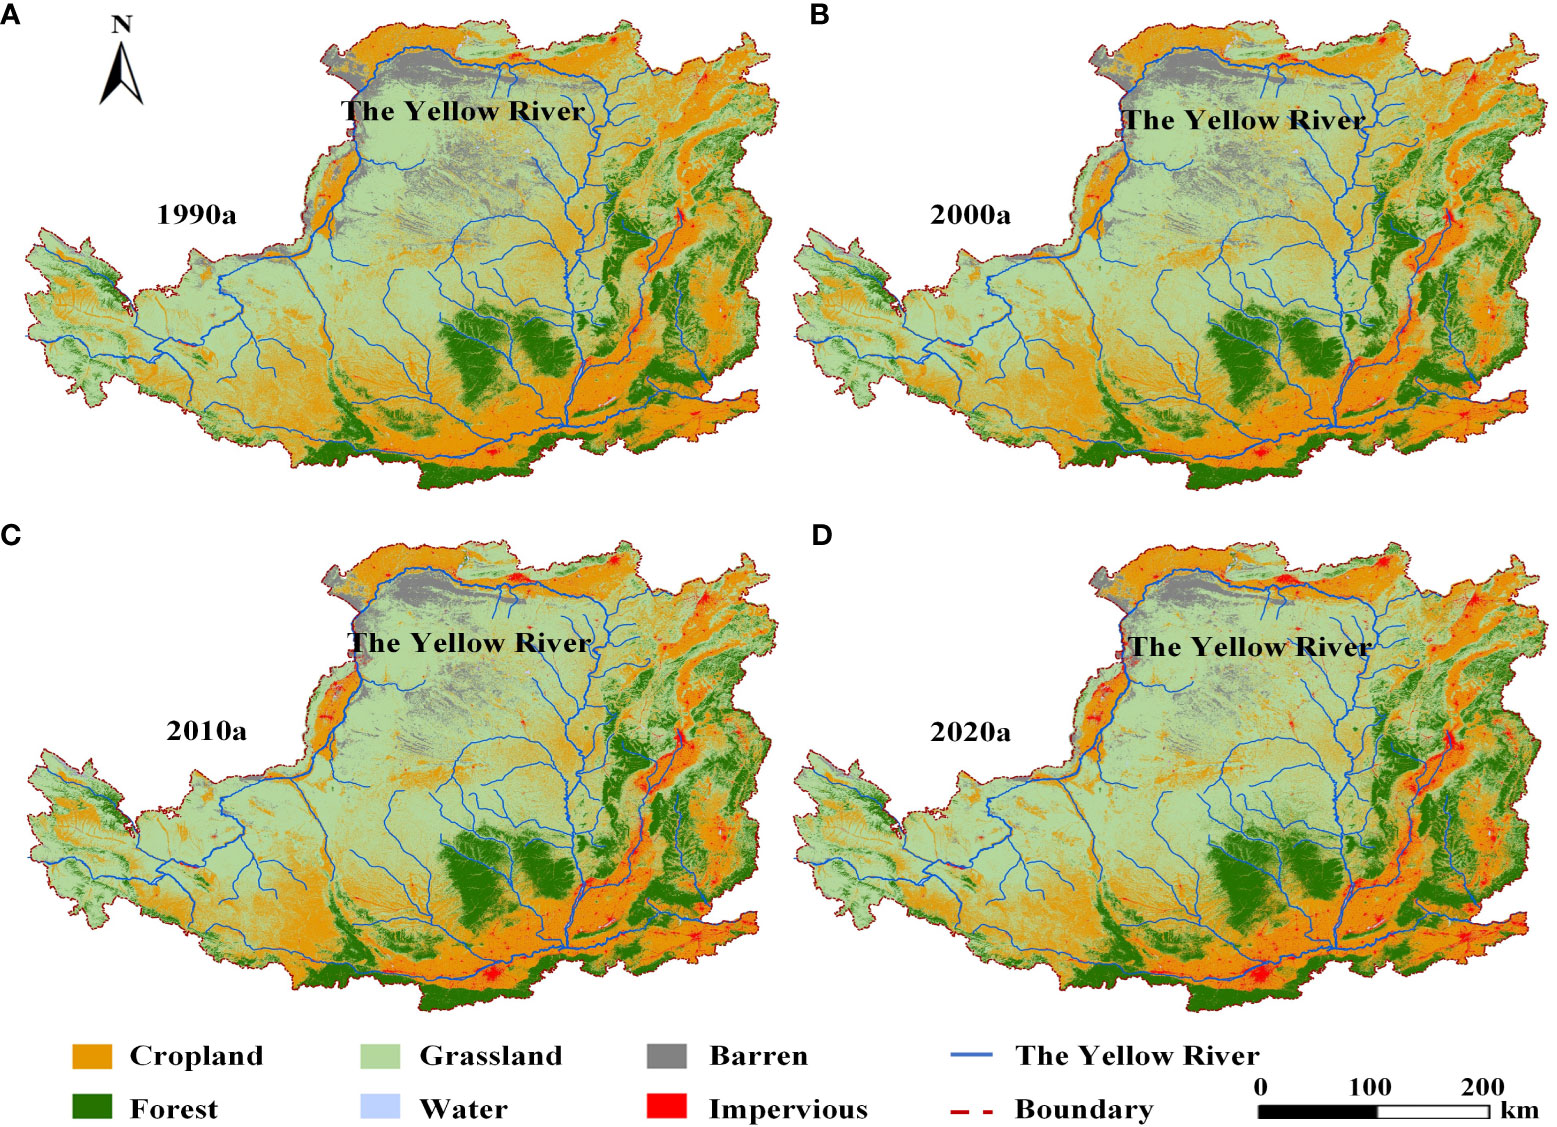
Figure 5 Land uses in the representative years. [(A) year 1990, (B) year 2000, (C) year 2010 (D) year 2020].
Figures 4, 5 show a decline in cropland over the past 30 years. In 1990, the total area of cropland was 19,539.927 km², which reduced to 17,324.595 km² in 2020, accounting for approximately 3.8% of the region. In contrast, the area of forest and grassland increased slightly over the study period, with forest cover increasing from 7,477.452 km² in 1990 to 9,074.907 km² in 2020 and grassland cover increasing from 28,370.457 km² in 1990 to 29,236.518 km² in 2020. The area of water bodies, barren land, and impervious surfaces remained relatively stable over the three decades, with only minor fluctuations. The area of barren land also increased slightly from 3,176.451 km² in 1990 to 1,687.104 km² in 2020. The area of impervious surfaces increased from 630.918 km² in 1990 to 1,818.351 km² in 2020, accounting for approximately 2.0% of the region.
The changes in land use in the Loess Plateau region of China were likely driven by a combination of factors, including urbanization, economic development, and environmental degradation. The reduction in the area of cropland, forest, and grassland may have negative consequences for the region’s ecosystem services, while the increase in the area of barren land and impervious surfaces may exacerbate environmental problems, such as soil erosion, water scarcity, and non-point source pollution.
The large-scale expansion of impervious surfaces in the downstream and middle-upper stream of the basin resulted in the conversion of grassland, barren land, and cropland to impervious surfaces from 1995 to 2020. In contrast, the establishment of ecological protection and returning farmland to forest projects in the upper stream caused the conversion of shrubland, barren land, and cropland to forest, resulting in an increase of nearly 1597.5 km² of forest in the region. To better understand the intrinsic conversion relationship of each land use type, a spatial data analysis was performed on the land use spatial data in 1990, 2000, 2010, and 2020, resulting in a land use transfer matrix (Table 4) and a land use conversion map (Figure 6) for the study area during four time periods. Combined with the results of Table 4 and Figure 6, the conversion of cropland to forest and grassland resulted in a slight increase in the area of these two types of land uses from 1990 to 2000. In the subsequent period of 2000 to 2010, the conversion of a large amount of barren land and cropland to impervious surfaces caused the rapid expansion of impervious surfaces. The small decrease in the area of grassland was mainly due to the conversion to cropland, and the small increase of forest was mainly due to the reduction of cropland and grassland from 2015−2020. Finally, the expansion of impervious surfaces from 2015 to 2020 was mainly due to the conversion from cropland.
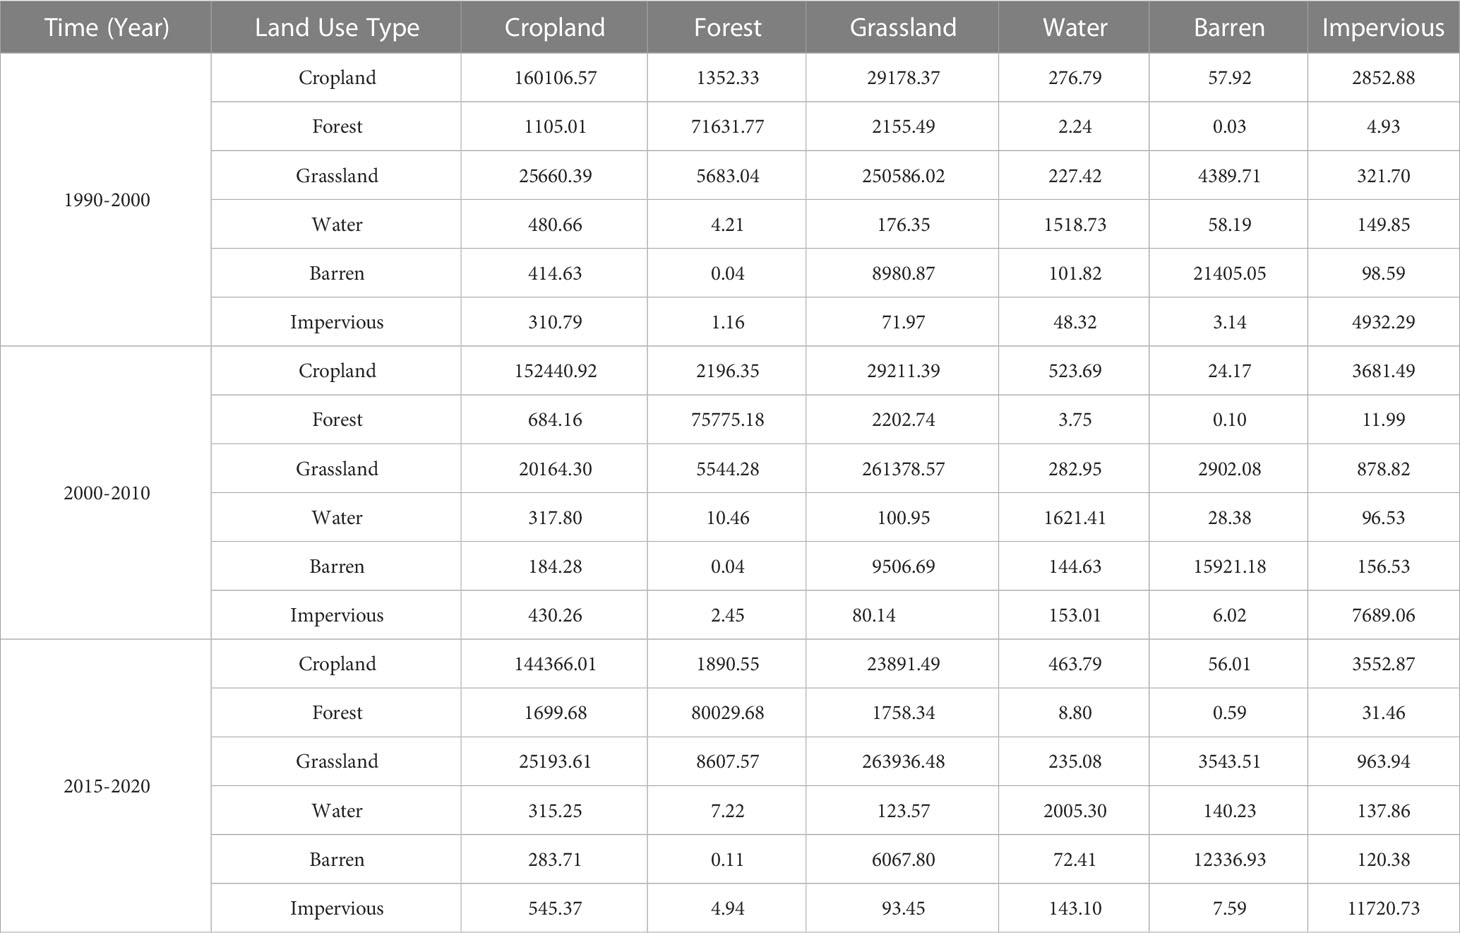
Table 4 Land Use Transfer Matrix in the Loess Plateau region (Unit: km²).
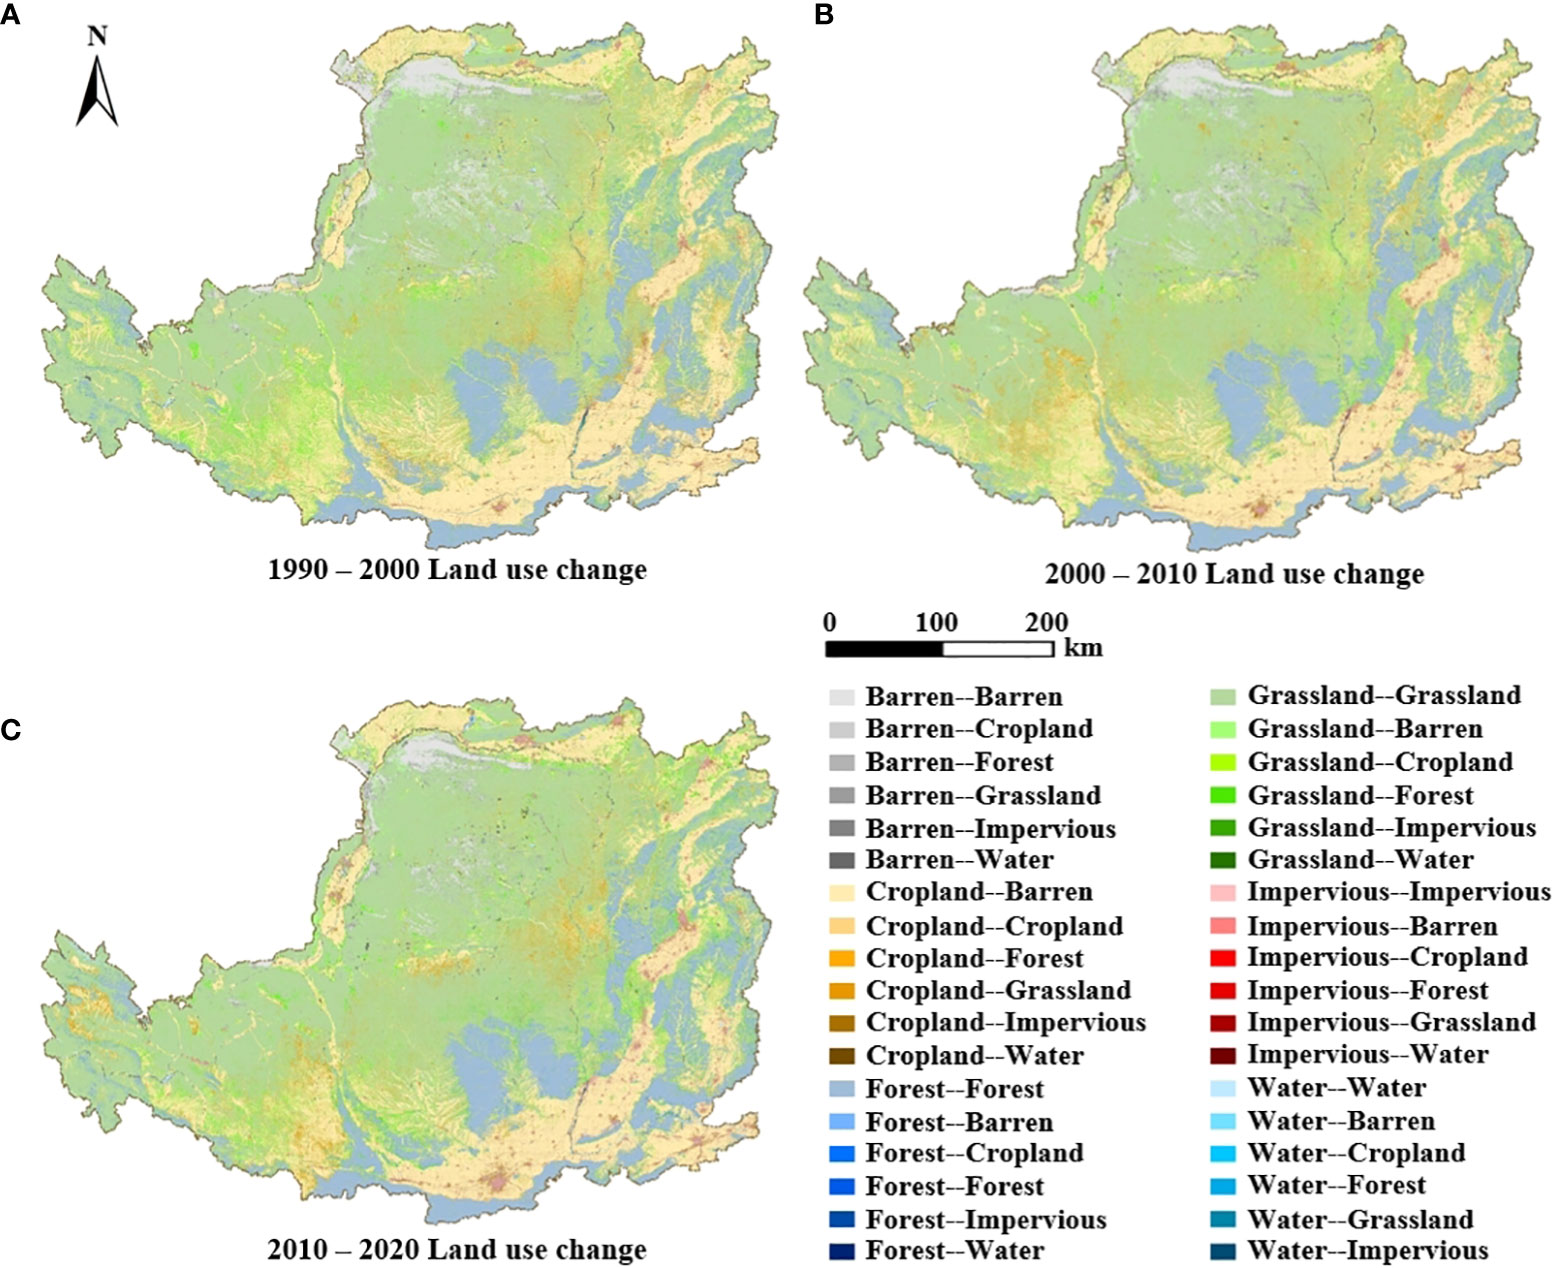
Figure 6 Land use conversion in the Loess Plateau from 1990 to 2020. [(A) 1990-2020 Land use change. (B) 2000-2010 Land use change. (C) 2010-2020 Land use change].
A comprehensive analysis of the LUCC patterns and spatiotemporal transformations of the Loess Plateau region over the past two decades was conducted. The results highlight the significant impact of urbanization and ecological protection policies on LUCC in the region, providing valuable information for decision-makers to manage and utilize the region’s natural resources sustainably.
Using the quantile classification method, the PNPI in the Loess Plateau was categorized into five risk levels: very low, low, moderate, high, and very high. Taking 1990 as the reference year, the changes in PNP risk levels in the Loess Plateau from 1990 to 2020 were assessed (Figure 7). The results showed a significant change in the distribution of PNP risk levels, with an increase in high and very high-risk areas downstream of urban areas along the Yellow River. The temporal changes of the proportional area of PNP risk in the Loess Plateau (Table 5) indicated that the very low-risk area remained stable from 1990 to 2020. However, the area of moderate-risk and very high-risk areas decreased, with very high-risk areas decreasing by almost 5.6% in 2020 compared to 1990. In contrast, the region designated as low-risk and moderate-risk expanded progressively over time. Specifically, the low-risk area increased by 6.45% between 1990 and 2005, followed by additional growth of 2% between 1990 and 2020. However, between 2005 and 2020, the low-risk area reduced by nearly 4.2%.
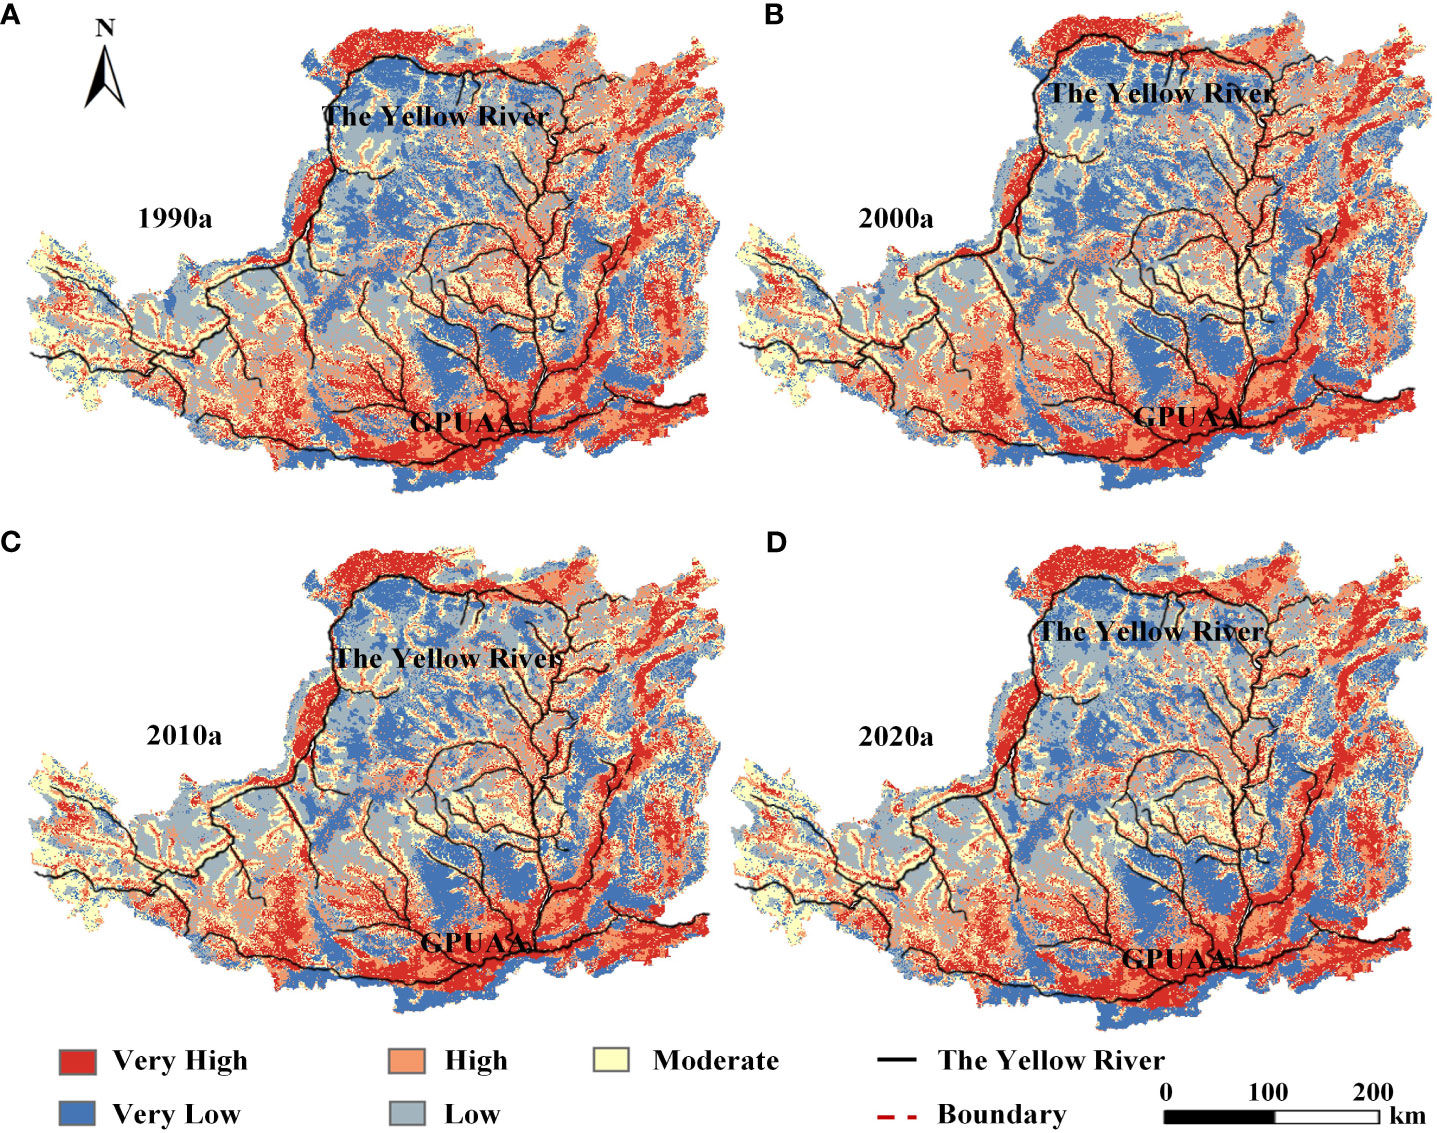
Figure 7 Distribution of the PNP risk on the Loess Plateau over time. [(A) year 1990, (B) year 2000, (C) year 2010, (D) year 2020].
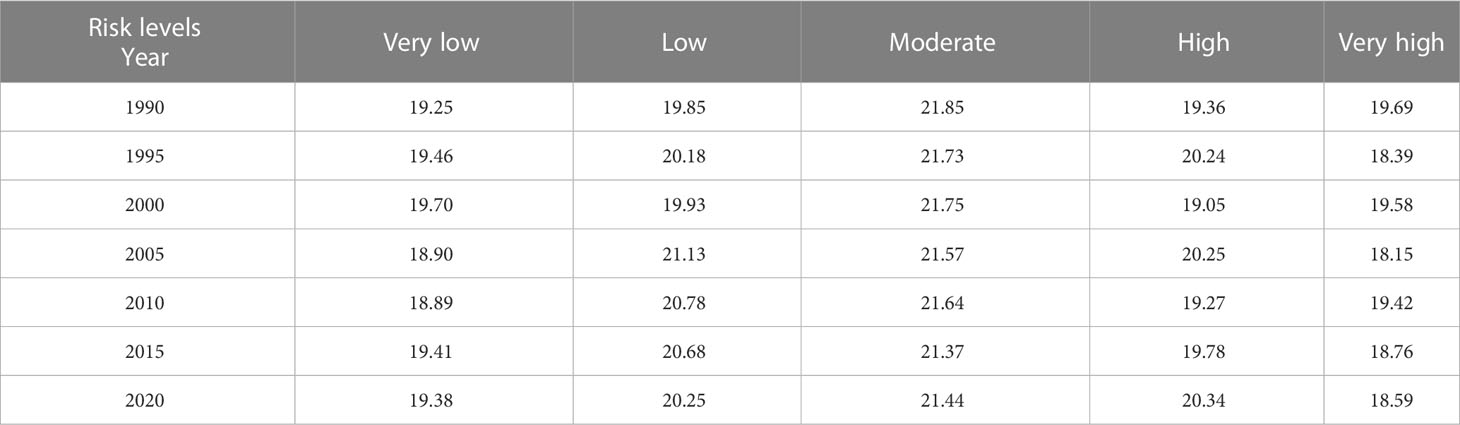
Table 5 Proportional Areas of Different Non-Point Source Pollution (PNP) Risk Levels from 1990 to 2020 (Unit: %).
To accurately depict the inherent transformation in the area of each risk level, a comprehensive spatial analysis of the PNPI data from 1990 to 2020 was conducted. The aim was to provide a detailed assessment of the PNP risk distribution over time. The results of the analysis are presented in Figure 8, which shows a PNP risk distribution map, and Figure 9, which shows the proportional area of PNP risk grading. The area under each risk level changed slightly from 1990 to 2020. There was a modest transformation from moderate risk areas to low-risk areas, resulting in a slight increase in the latter category. Similarly, there was a partial shift from very high-risk to high-risk areas, which led to a slight increase in high-risk areas. These changes were consistent over the entire study period and were supported by the statistical analyses.
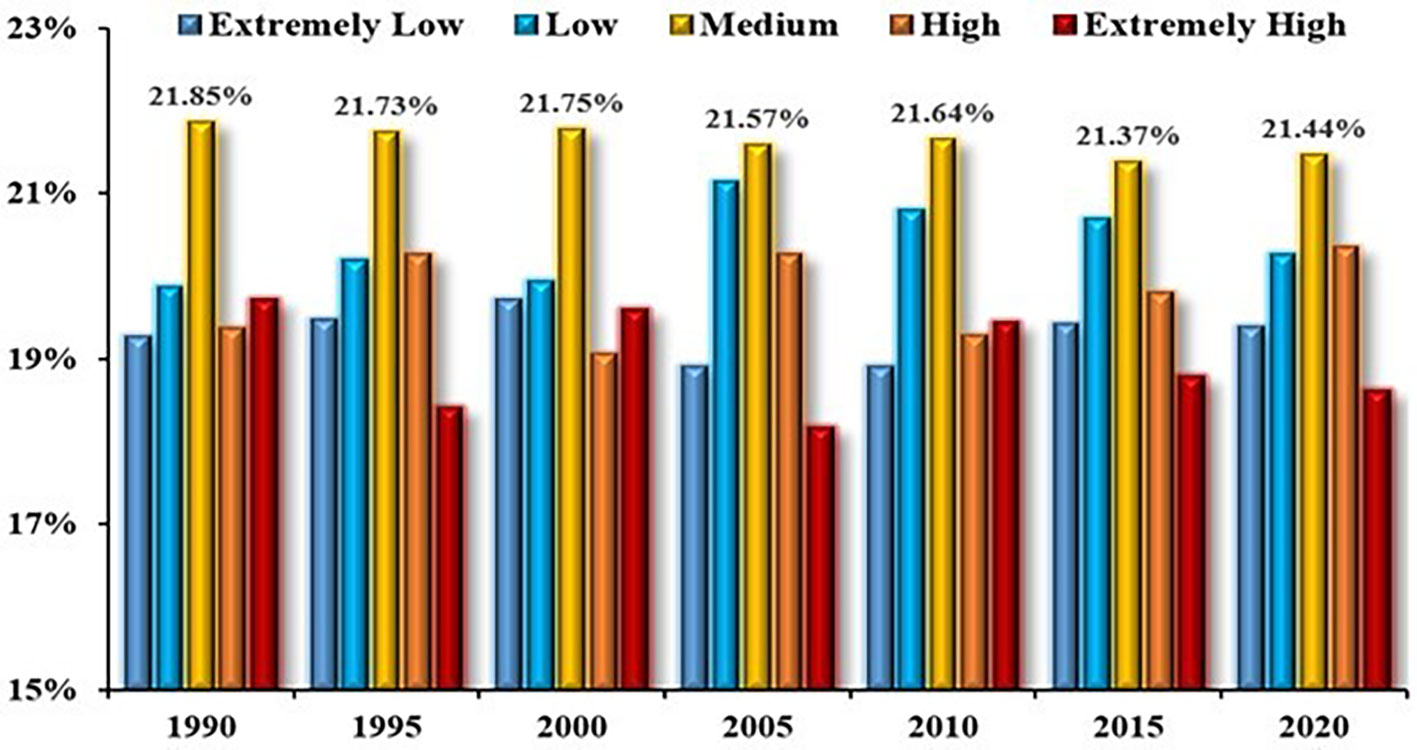
Figure 8 Proportional areas of the different PNP risk levels on the Loess Plateau from 1990 to 2020.
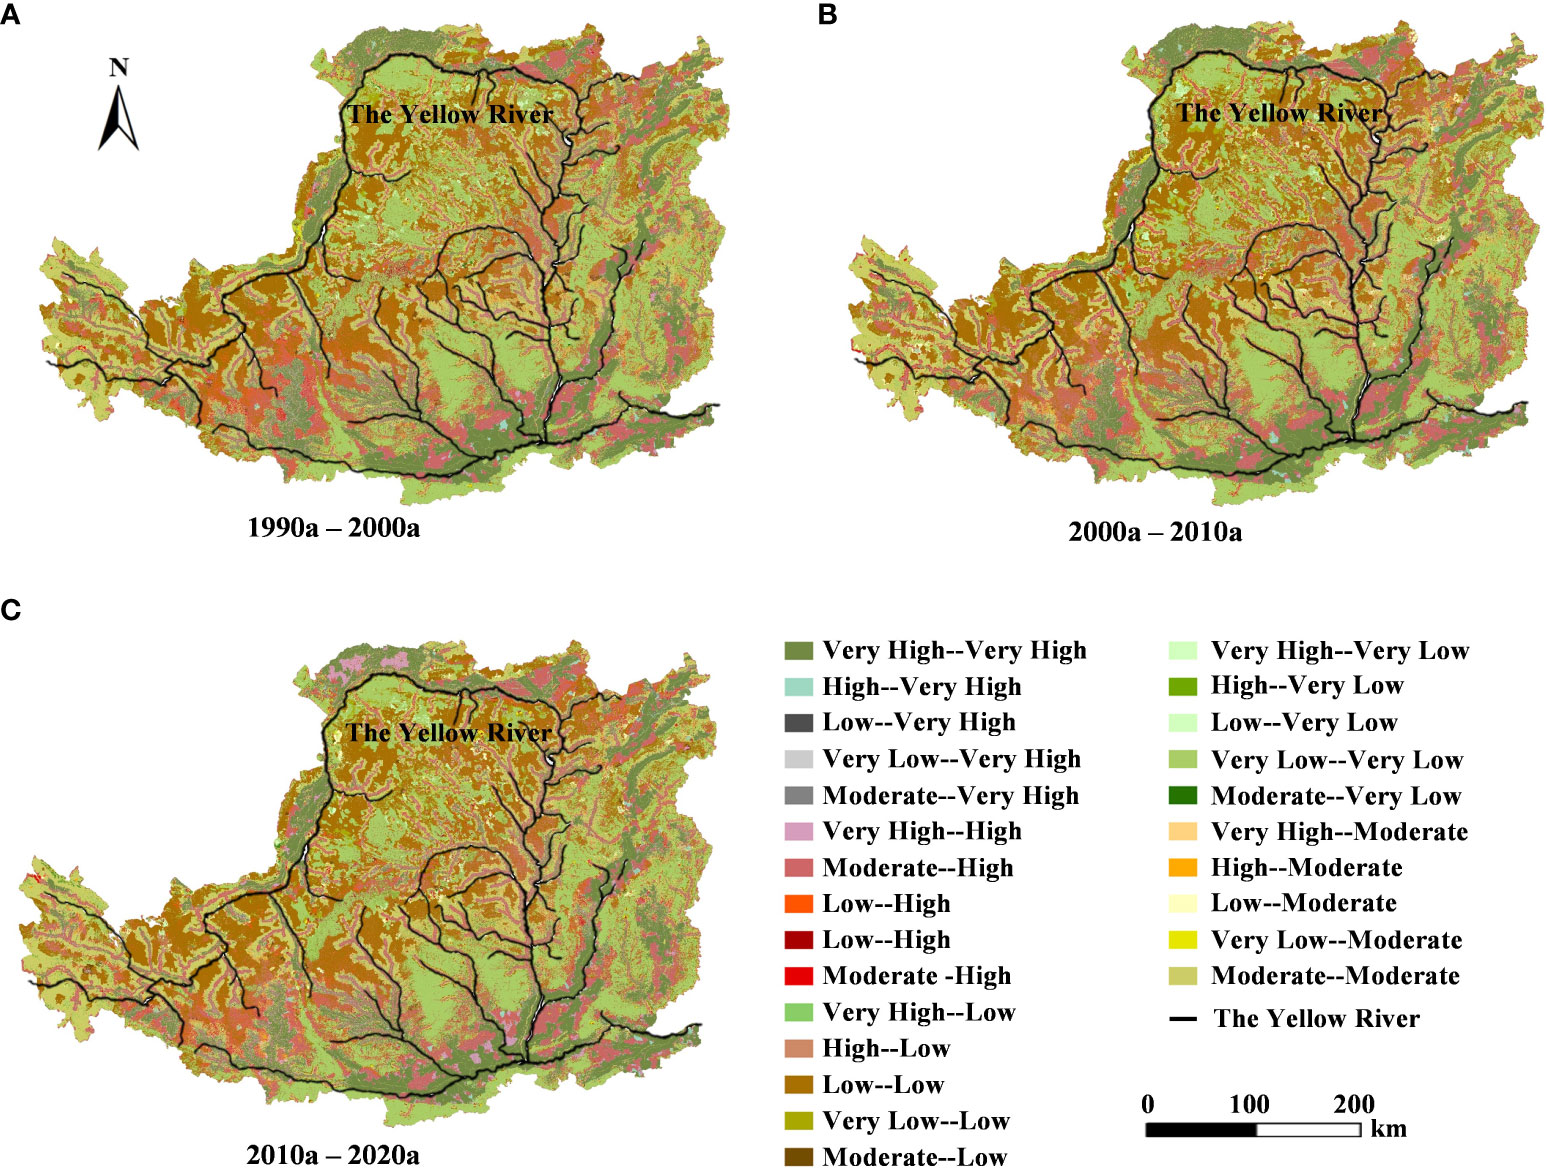
Figure 9 Conversion of PNP risk levels on the Loess Plateau from 1990 to 2020. [(A) 1990-2000 PNP risk levels change, (B) 2000-2010 PNP risk levels change, (C) 2010-2020 PNP risk levels change].
From 1990 to 2000, the area of each risk level experienced relatively minimal changes, except for a considerable increase in the very low-risk area. The observed increase in the very low-risk area was primarily due to the transformation from moderate-risk, high-risk, and very high-risk areas to very low-risk areas. Between 2000 and 2005, the area of each risk level underwent significant changes, with a considerable decrease in very high-risk areas. The observed decrease in the very high-risk area was primarily transformed to moderate and high-risk areas. Additionally, there was a partial increase in the low-risk area, which was attributable to the transformation from moderate-risk areas to low-risk areas. From 2005 to 2010, there was a slight decrease in the number of low-risk areas and an increase in the proportion of very high-risk areas. mainly due to the shift from high-risk areas and low-risk areas to very high-risk areas. Between 2010 and 2015, the area of each level of risk underwent significant changes, while the proportion of very high risk areas decreased, shifting towards high risk areas and low risk areas. Finally, from 2015 to 2020, there was a further change in each level of risk, with an increase in the high-risk area mainly due to the transformation from moderate-risk, very low-risk, low-risk, and high-risk areas to very high-risk areas. These findings provide valuable insights into the dynamic nature of risk level transformations and highlight the importance of the ongoing monitoring and assessment of such areas.
High-risk and very high-risk areas were concentrated in the middle and lower reaches of the Yellow River for much of the study period. From 1990 to 2020, the PNP risk in the Loess Plateau region changed in a polarized manner. Moderate-risk areas in heavily affected urban areas, such as Guanzhong Plain urban agglomeration area (GPUAA) (Figure 7), transformed into high-risk areas, while very high-risk areas expanded radially along the downstream riverbank, increasing by 40%. The increase in very high-risk areas was the result of transformation from a large area of high-risk areas. Additionally, the PNP risk decreased upstream toward the water source area.
The dynamic characteristics of PNP risk in the Loess Plateau region were analyzed by considering the LUCC and PNP risks. To accurately capture the spatiotemporal transformation relationships of different risk level areas, a rigorous analysis of the spatial PNPI data transformation process was conducted for three distinct periods:1990−2000, 2000−2010, and 2010−2020. The results obtained from this analysis were expressed as a PNPI risk transfer matrix (Table 6) and PNPI risk transformation diagram (Figure 9), which offered valuable insights into the dynamics of risk transfer and transformation across time and space.
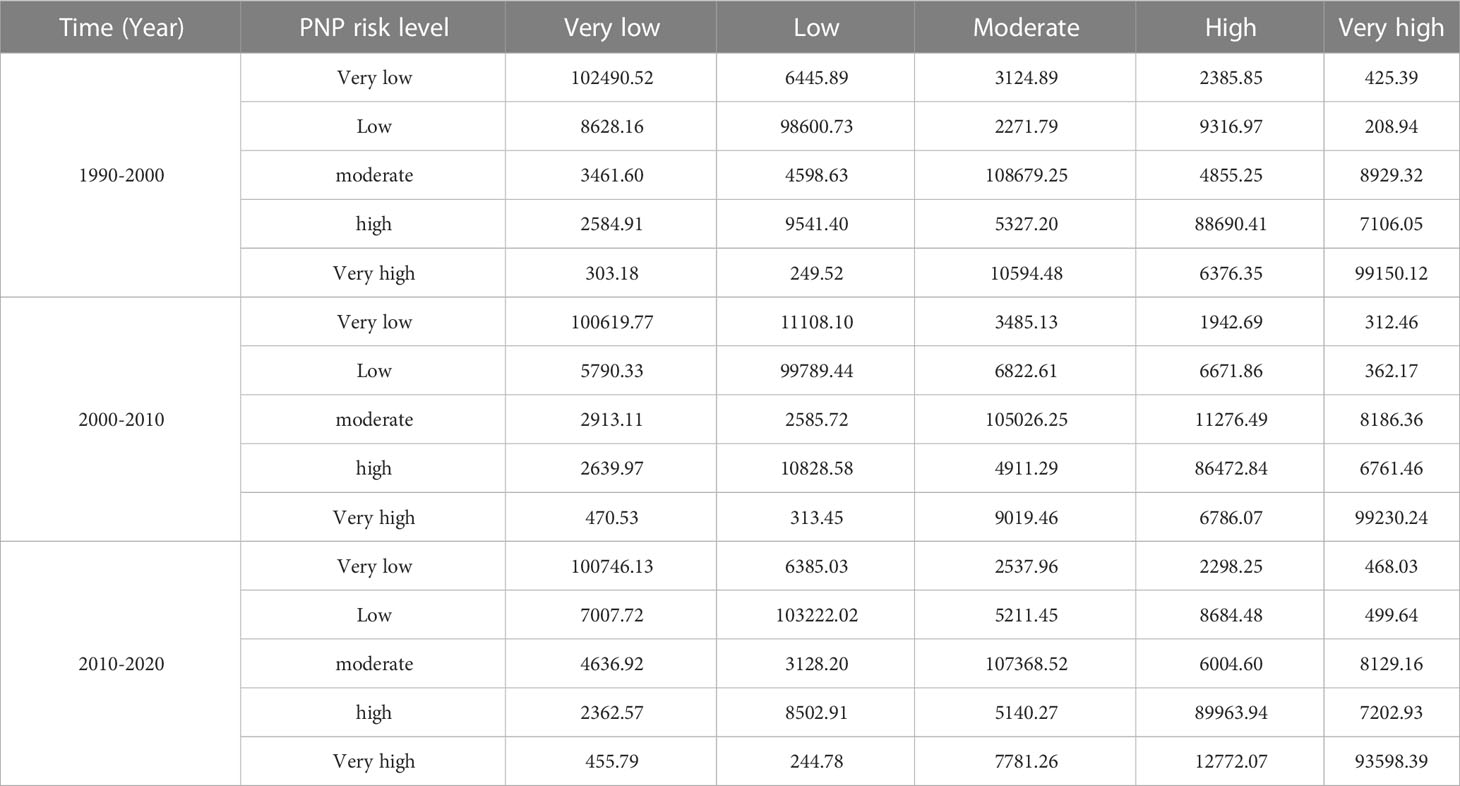
Table 6 Transfer matrix of PNP risk levels from 1990 to 2020 (Unit: km²).
It was observed that the downstream basin areas of towns and farmland were consistently identified as high-risk and very high-risk areas. Specifically, during the period of 1990−2020, the downstream basin was primarily dominated by irrigated farmland, and the urbanization level was relatively low. The very high PNP risk areas were mainly concentrated in downstream towns and along the riverbanks. Since 2005, the towns in the Loess Plateau have undergone rapid expansion, leading to a corresponding rapid expansion of very high PNP risk areas surrounding these towns. The expansion of towns is considered the main contributing factor for the increase in very high-risk areas.
Additionally, since 1999, ecological protection projects such as returning farmland to forest and afforestation have been implemented in the Loess Plateau (Fu, 2010; Zhang et al., 2020). This has led to the transformation of shrubland, agroforestry land, and arable land into forest, resulting in a year-on-year increase in the forest area. This has ultimately led to a decrease in PNP risk in the upstream basin. The spatial transformation of PNP risk from 1990 to 2020 is shown in Figure 9.
1. The Loess Plateau region is characterized by a dominant land use pattern of grassland, cropland and forest, which are primarily concentrated in the middle and lower reaches of the watershed, accounting for approximately 93.5% of the total watershed area. From 1990 to 2020, there was a significant increase in the area of impervious surfaces in the middle and lower reaches of the watershed, which replaced a substantial portion of the original grassland and cropland. In the upper reaches of the watershed there was a transformation of barren land, grassland, and cultivated land into forest, resulting in an annual increase in forest area of approximately 1600 km² over the 31-year period.
2. Over the 31-year period spanning from 1990 to 2020, the Loess Plateau region experienced significant spatiotemporal changes in the risk of non-point source pollution, which exhibited a clear bipolarization trend. Specifically, the risk of PNP in the middle and lower reaches of the watershed and the cultivated land along the river channel, which are highly influenced by human activities, exhibited a notable increase of 40%. This increase was accompanied by a significant expansion of the high-risk area. In contrast, the risk of PNP in the upper reaches of the watershed exhibited a decreasing trend over the same period. These findings indicate the need for targeted management strategies aimed at mitigating the risk of PNP in the middle and lower reaches of the watershed, especially in cultivated areas that are highly influenced by human activities.
3. The spatiotemporal changes of PNP risk showed a high degree of consistency with land use patterns, with the high-risk and very high-risk areas mainly concentrated in the urban land in the middle and lower reaches and the cultivated land along the river channel. Low-risk and very low-risk areas were mainly concentrated in forest areas in the upper reaches. The expansion of urban areas in the watershed was the primary reason for the growth of very high-risk PNP areas, while the growth of forest areas was the primary reason for the expansion of low-risk and very low-risk PNP areas.
4. From 1990 to 2020, the combination of urbanization development and ecological protection measures had a significant impact on land use changes in the Loess Plateau region. Consequently, the PNP risk faced by the downstream water environment increased year-on-year, while the PNP risk in the upper reaches of the watershed decreased annually.
5. In the future, the urban land in the lower reaches and the cultivated land along the river channel should be prioritized as the key management areas for watershed comprehensive management. To mitigate pollution risks, low impact development measures such as vegetation filtration belts and artificial wetlands should be implemented. The implementation of these measures can significantly reduce the NPSP risk and improve the ecological health and environmental quality of the region.
6. As a decision support system, the PNPI model has several advantages, including its simplicity, ease of use, minimal data requirements, and production of results that are easy to understand. The model can quickly provide the spatial distribution of PNP and evaluate the environmental impact of different land use plans in areas with limited or no data. However, due to climate conditions, land use intensity, and land use management patterns in different regions, some empirical parameters and weights in the PNPI model may not be universally applicable. They will require adjustments based on the specific characteristics of each region to ensure their universality and applicability. Overall, the PNPI model can effectively evaluate the PNP risk and spatial distribution in the Loess Plateau region, and it has the potential for application in other regions with similar characteristics.
7. The present study has shed light on the underlying causes and patterns of non-point source pollution in the Loess Plateau, thereby enabling the development of more effective and sustainable management strategies.
Despite the contributions of this study, some limitations should be acknowledged. For instance, the study area was not analyzed from multiple perspectives. Therefore, future research should be conducted on the Loess Plateau from different angles, such as sustainable agricultural practices, afforestation, and sediment control structures. This will allow for a more comprehensive investigation of measures to control non-point source pollution from various perspectives.
This study examined the spatiotemporal changes of PNP risk in the Loess Plateau region over the past 31 years using an improved PNPI model. The Loess Plateau, which is heavily influenced by human activities, was selected as a case study to explore the impact of different historical environmental conditions on PNP risk.
To accurately reflect the actual situation in the watershed, the PNPI model, which was originally developed by Italian researchers to measure PNP, was improved in three aspects: the land use categories were expanded, comparisons of land use categories were made, and the soil types were divided into different permeability levels. This enhanced model could comprehensively evaluate non-point source pollution characteristics in a watershed influenced by human activities. The spatial distribution maps of the LCI, ROI, and DI, as well as the PNPI and qualitative analysis results, were consistent with the actual situation in the Loess Plateau region (Wang et al., 2010; Liang et al., 2015; Li H. L. et al., 2021; Liu et al., 2021; Qian et al., 2021; Li et al., 2022; Shi et al., 2022). Therefore, the model was found to be applicable to the study area.
Our study provides valuable insights into the spatial and temporal distribution of PNP risk. The results of this study could serve as a basis for the development of effective policies and strategies aimed at mitigating the risk of PNP. It is recommended that future studies should further investigate the underlying causes of the observed changes and assess their potential implications on the environment and public health.
The original contributions presented in the study are included in the article/supplementary material. Further inquiries can be directed to the corresponding author.
QN: Methodology, Software, Writing – original draft. XF: Conceptualization, Data curation, Writing – original draft. CL: Data curation, Methodology, Writing – original draft. YZ: Conceptualization, Data curation, Writing –original draft. PG: Data curation, Formal Analysis, Writing – original draft. YH: Data curation, Methodology, Writing – original draft. PL: Conceptualization, Writing – review and editing. JL: Conceptualization, Supervision, Writing – original draft, Writing – review and editing.
This research was funded by the Shaanxi Postdoctoral Science Foundation 2018 (2018BSHEDZZ21), the National Natural Foundation of China (51679185), and the General Financial Grant from the China Post-doctoral Science Foundation (2017M623088). Yinshanbeilu Grassland Eco-hydrology National Observation and Research Station, China Institute of Water Resources and Hydropower Research, Beijing 100038, China, Grant NO. YSS2022004. And the APC was funded by the Fundamental Research Funds for the Central Universities, CHD (300102292903).
We express our sincere gratitude to the esteemed Key Laboratory of Subsurface Hydrology and Ecological Effects in the Arid Region, Ministry of Education, for their invaluable support and contributions to our research endeavor.
The authors declare that the research was conducted in the absence of any commercial or financial relationships that could be construed as a potential conflict of interest.
All claims expressed in this article are solely those of the authors and do not necessarily represent those of their affiliated organizations, or those of the publisher, the editors and the reviewers. Any product that may be evaluated in this article, or claim that may be made by its manufacturer, is not guaranteed or endorsed by the publisher.
Ai L., Shi Z. H., Yin W., Huang X. (2015). Spatial and seasonal patterns in stream water contamination across mountainous watersheds: linkage with landscape characteristics. J. Hydrol. 523, 398–408. doi: 10.1016/j.jhydrol.2015.01.082
Alnahit A. O., Mishra A. K., Khan A. A. (2020). Quantifying climate, streamflow, and watershed control on water quality across Southeastern US watersheds. Sci. Total Environ. 739, 139945. doi: 10.1016/j.scitotenv.2020.139945
Borah D. K., Bera M. (2004). Watershed-scale hydrologic and nonpoint-source pollution models: review of applications. Trans. ASAE 47 (3), 1553–1566. doi: 10.13031/2013.16110
Cecchi G., Fabiani C., Mancini L., Munafò M. (2005). “Pollutant loading in the Tevere river basin,” in Tevere - Pilot River Basin Article 5 Report - Pursuant to the Water Framework Directive. Eds. Ruisi M., Prati A., Traversa P.(Roma: Gangemi), 81–87.
Cecchi G., Mancini L., et al. (1982). Assessment of Potential River Pollution From Non-Point Sources in the Viterbo Province[M] (Academic Press).
Cecchi G., Munafò M., Baiocco F., Andreani P., Mancini L. (2007). Estimating river pollution from diffuse sources in the Viterbo province using the potential non-point pollution index. Annali dell'Istituto superiore di sanità 43 (3), 295–301.
Clément F., Ruiz J., Rodríguez M. A., Blais D., Campeau S. (2017). Landscape diversity and forest edge density regulate stream water quality in agricultural catchments. Ecol. Indic. 72, 627–639. doi: 10.1016/j.ecolind.2016.09.001
Cotman M., Drolc A., Koncan J. Z. (2008). Assessment of pollution loads from point and diffuse sources in small river basin: case study Ljubljanica river. Environ. Forensics 9 (2-3), p.246–p.251. doi: 10.1080/15275920802122965
de Mello K., Taniwaki R. H., de Paula F. R., Valente R. A., Randhir T. O., Macedo D. R., et al. (2020). Multiscale land use impacts on water quality: assessment, planning, and future perspectives in Brazil. J. Environ. Manage. 270, 110879. doi: 10.1016/j.jenvman.2020.110879
Fan Y. P., Fang C. L. (2020). A comprehensive insight into water pollution and driving forces in Western China—case study of Qinghai. J. Clean. Prod. 274, 123950. doi: 10.1016/j.jclepro.2020.123950
Fu B. (2010). Soil erosion and its control in the loess plateau of China. Soil Use Manage. 5 (2), 76–82. doi: 10.1111/j.1475-2743.1989.tb00765.x
Ge X. J., Huang B., Yuan Z. J., Wang D. D., Wang Q. Q., Chen J. C., et al. (2022). Temporal and spatial variation characteristics and source analysis of agricultural non-point source pollution load in Guangdong during the past 20 years. Huan Jing Ke Xue. 43 (6), 3118–3127.
Gémesi Z., Downing J. A., Cruse R. M., Anderson P. F. (2011). Effects of watershed configuration and composition on downstream lake water quality. J. Environ. Qual. 40 (2), 517–527. doi: 10.2134/jeq2010.0133
Geng R., Li M., Wang X., Pang S. (2015). Effect of land use/landscape changes on diffuse pollution load from watershed based on swat model. Trans. Chin. Soc. Agric. Eng. 31 (16), 241–250.
Gossweiler B., Wesström I., Messing I., Villazón M., Joel A. (2021). Impact of land use change on non-point source pollution in a semi-arid catchment under rapid urbanisation in Bolivia. Water 13 (4), 410. doi: 10.3390/w13040410
Guo P., Lyu J. Q., Yuan W. N., Zhou X., Mo S., Mu D., et al. (2022). Detecting the quantitative hydrological response to changes in climate and human activities at temporal and spatial scales in a typical gully region of the loess plateau, China. Water 14, 257–280. doi: 10.3390/w14020257
Hao Y., Lu J. (2021). Teleconnection between climate oscillations and riverine nutrient dynamics in southeast China based on wavelet analysis. Environ. Sci. Pollut. Res., 28, 41807–41820. doi: 10.1007/s11356-021-13715-x
Hou L., Zhou Z., Wang R., Li J., Dong F., Liu J. (2022). Research on the non-Point source pollution characteristics of important drinking water sources. Water 14, 211. doi: 10.3390/w14020211
Ierodiaconou D., Laurenson L., Leblanc M., Stagnitti F., Duff G., Salzman S., et al. (2005). The consequences of land use change on nutrient exports: a regional scale assessment in south-west Victoria, Australia. J. Environ. Manage. 74 (4), 305–316. doi: 10.1016/j.jenvman.2004.09.010
Lee S. W., Hwang S. J., Lee S. B., Hwang H. S., Sung H. C. (2009). Landscape ecological approach to the relationships of land use patterns in watersheds to water quality characteristics. Landscape Urban Plann. 92 (2), 80–89. doi: 10.1016/j.landurbplan.2009.02.008
Li L., Gou M., Wang N., Ma W., La L. (2021). Landscape configuration mediates hydrology and nonpoint source pollution under climate change and agricultural expansion. Ecol. Indic., 129, 1470–1160. doi: 10.1016/j.ecolind.2021.107959
Li C., Zhang H., Hao Y., Zhang M. (2020). Characterizing the heterogeneous correlations between the landscape patterns and seasonal variations of total nitrogen and total phosphorus in a peri-urban watershed. Environ. Sci. Pollut. Res. 27 (27), 34067–34077. doi: 10.1007/s11356-020-09441-5
Li H. L., Zhang J. J., Zhang Y. F., Chang G. L., Shi D. D., Xu W. J., et al. (2021). Analysis of spatial-temporal variation characteristics of potential non-point source pollution risks in the upper beiyun river basin using different weighting methods. Huan Jing Ke Xue 42 (6), 2796–2809. doi: 10.13227/j.hjkx.202010225
Li H., Zhang J., Zhang S., Zhang W., Zhang S., Yu P., et al. (2022). A framework to assess spatio-temporal variations of potential non-point source pollution risk for future land-use planning. Ecol. Indic. 137, 108751. doi: 10.1016/j.ecolind.2022.108751
Liang W., Bai D., Wang F., Fu B., Yan J., Wang S., et al. (2015). Quantifying the impacts of climate change and ecological restoration on streamflow changes based on a budyko hydrological model in China's loess plateau. Water Resour. Res. 51 (8), 6500–6519. doi: 10.1002/2014WR016589
Liu Q., Yang Z., Shi H., Wang Z. (2019). Ecological risk assessment of geohazards in natural world heritage sites: an empirical analysis of Bogda, Tianshan. Open Geosci. 11, 327–340. doi: 10.1515/geo-2019-0026
Liu Y., Yang C., Yu X., Wang M., Qi W. (2021). Monitoring the landscape pattern and characteristics of non-point source pollution in a mountainous river basin. Int. J. Environ. Res. Public Health 18 (21), 11032. doi: 10.3390/ijerph182111032
Loague K., Corwin D. L. (1996). “Uncertainty in regional-scale assessments of non-point source pollutants,” in Applications of GIS to the Modeling of Non-Point Source Pollutants in the Vadose Zone. Eds. Corwin D. L., Loague K. (Madison: Soil Science Society of America), 131–152.
Loague K., Corwin D. L. (2005). “Point and nonpoint source pollution,” in Encyclopedia of Hydrological Sciences. Ed. Anderson M. G. (Chichester, UK: John Wiley & Sons, Ltd), 1427–1439.
Luo P., Zheng Y., Wang Y., Zhang S., Yu W., Zhu X., et al. (2022). Comparative assessment of sponge city constructing in public awareness, Xi’an, China. Sustainability 14 (18), 11653. doi: 10.3390/su141811653
Lyu J. Q., Liu J., Shen B., Sun X. L., Hou Z. Q., Mu D. R., et al. (2018). Study on regulation and control of urban river dams based on distributed hydrological model GBHM. Hydrol. Res. 40 (9), 63–69.
Lyu J., Mo S., Luo P., Zhou M., Shen B., Nover D. (2019). A quantitative assessment of hydrological responses to climate change and human activities at spatiotemporal within a typical catchment on the loess plateau, China. Quaternary Int. 527 (2019), 1–11. doi: 10.1016/j.quaint.2019.03.027
Mohammadi H. (2001). Hydrological analysis of flood forecastin: Kasilaian watershed[D] (University of Mazandaran).
Munafò M., Cecchi G., Baiocco F., Mancini L. (2005). River pollution from non-point sources: a new simplified method of assessment. J. Environ. Manage. 77 (2), 93–98. doi: 10.1016/j.jenvman.2005.02.016
Novotny V., Chesters G. (1981). Handbook of Nonpoint Source Pollution: Sources and Management (New York, N.Y: Van Nostrand Reinold Co), ISBN: ISBN 0-442-00559-8. 1.
Ouyang W., Jiao W., Li X. M., Giubilato E., Critto A. (2016). Long-term agricultural non-point source pollution loading dynamics and correlation with outlet sediment geochemistry. J. Hydrol. 540, 379–385. doi: 10.1016/j.jhydrol.2016.06.043
Ouyang W., Skidmore A. K., Toxopeus A. G., Hao F. (2010). Long-term vegetation landscape pattern with non-point source nutrient pollution in upper stream of Yellow River basin. J. Hydrol. 389 (3–4), 373–380. doi: 10.1016/j.jhydrol.2010.06.020
Park M., Choi Y. S., Shin H. J., Song I., Yoon C. G., Choi J. D., et al. (2019). A comparison study of runoff characteristics of non-point source pollution from three watersheds in South Korea. Water 11, 966. doi: 10.3390/w11050966
Puccinelli C., Marcheggiani S., Munafò M., Andreani P., Mancini L. (2013). Evaluation of Aquatic Ecosystem Health Using the Potential Non-Point Pollution Index (PNPI) Tool. Diversity of Ecosystems, InTech, Crossref. doi: 10.5772/36330
Qian Y., Sun L., Chen D., Liao J., Tang L., Sun Q. (2021). The response of the migration of non-point source pollution to land use change in a typical small watershed in a semi-urbanized area. Sci. Total Environ. 785, 147387. doi: 10.1016/j.scitotenv.2021.147387
Ritter L., Solomon K., Sibley P., Hall K., Keen P., Mattu G., et al. (2002). Sources, pathways, and relative risks of contaminants in surface water and ground-water: a perspective prepared for the Walkerton inquiry. J. Toxicol. Environ. Health Part A 65 (1), 1–142. doi: 10.1080/152873902753338572
Sharma A., Tiwari K. N. (2019). Predicting non-point source of pollution in maithon reservoir using a semi-distributed hydrological model. Environ. Monit. Assess. 191 (8), 522.1–522.13. doi: 10.1007/s10661-019-7674-y
Shen Z., Chen L., Ding X., Hong Q., Liu R. (2013). Long-term variation, (1960–2003) and causal factors of non-point-source nitrogen and phosphorus in the upper reach of the Yangtze River. J. Hazard. Mater. 252–253, 45–56. doi: 10.1016/j.jhazmat.2013.02.039
Shen Z. Y., Hou X. S., Li W., Aini G. (2014). Relating landscape characteristics to non-point source pollution in a typical urbanized watershed in the municipality of Beijing. Landscape Urban Plann. 123, 96–107. doi: 10.1016/j.landurbplan.2013.12.007
Shen Z., Zhong Y., Huang Q., Chen L. (2015). Identifying non-point source priority management areas in watersheds with multiple functional zones. Water Res. 68 (1), 563–571. doi: 10.1016/j.watres.2014.10.034
Shi J., Jin R., Zhu W. (2022). Quantification of effects of natural geographical factors and landscape patterns on non-point source pollution in watershed based on geodetector: Burhatong river basin, Northeast China as an example. Chin. Geogr. Sci. 32, 707–723. doi: 10.1007/s11769-022-1295-z
Sun B., Zhang L., Yang L., Zhang F., Norse D., Zhu Z. (2012). Agricultural non-point source pollution in China: causes and mitigation measures. Ambio 41 (4), 370–379. doi: 10.1007/s13280-012-0249-6
Tao Y., Liu J., Guan X., Chen H., Ren X., Wang S., et al. (2020). Estimation of potential agricultural non-point source pollution for Baiyangdian Basin, China, under different environment protection policies. PloS One 15 (9), e0239006. doi: 10.1371/journal.pone.0239006
Ting L. I. (2010). Study on assessment of pollution load in small watershed based on PNPI[D] (Tsinghua University).
Vörösmarty C. J., McIntyre P. B., Gessner M. O., Dudgeon D., Prusevich A., Green P., et al. (2010). Global threats to human water security and river biodiversity. Nature 467 (7315), 555–561. doi: 10.1038/nature09440
Wang X. Y. (2006). Management of agricultural nonpoint source pollution in China: current status and challenges. Water Sci. Technol. 53 (2), 1–9. doi: 10.2166/wst.2006.033
Wang Y., Shao M., Shao H. (2010). A preliminary investigation of the dynamic characteristics of dried soil layers on the loess plateau of China. J. Hydrol. 381 (1–2), 9–17. doi: 10.1016/j.jhydrol.2009.09.042
Xu W. J., Chang G. L., Shi D. D., Ye Z. H., Zhang Y. F., Zhang S. H. (2021). Spatial distribution of non-point source pollution risk in the upper Beiyun River Watershed. Acta Scientiae Circumstantiae 41 (1), 7–14. doi: 10.13671/j.hjkxxb.2020.0368
Xu B., Niu Y., Zhang Y., Chen Z., Zhang L. (2022). China’s agricultural non-point source pollution and green growth: interaction and spatial spillover. Environ. Sci. pollut. Res. 29, 60278–60288. doi: 10.1007/s11356-022-20128-x
Yang J., Huang X. (2021). The 30 m annual land cover dataset and its dynamics in China from 1990 to 2019. Earth Syst. Sci. Data 13 (8), 3907–3925. doi: 10.5194/essd-13-3907-2021
Yang X., Liu Q., Luo X., Zheng Z. (2017). Spatial regression and prediction of water quality in a watershed with complex pollution sources. Sci. Rep. 7 (1), 8318. doi: 10.1038/s41598-017-08254-w
Yang F., Xu Z., Zhu Y., He C., Wu G., Qiu J. R., et al. (2013). Evaluation of agricultural nonpoint source pollution potential risk over China with a Transformed-Agricultural Nonpoint Pollution Potential Index method. Environ. Technol. 34 (21-24), 2951–2963. doi: 10.1080/09593330.2013.796008
Zhang X. (2008). Responses of streamflow to changes in climate and land use/cover in the loess plateau, China. Water Resour. Res 44 (7). doi: 10.1029/2007WR006711
Zhang Y., et al. (2014). Modeling potential non-point source pollution in a large-scale watershed using SWAT. Environ. Sci. pollut. Res. 21 (18), 10718–10733.
Zhang T., Gao Y., Xie Z., Zhang B. (2020). How human activity has changed the regional habitat quality in an eco-economic zone: evidence from poyang lake eco-economic zone, China. Int. J. Environ. Res. Public Health 17 (17), 6253. doi: 10.3390/ijerph17176253
Keywords: LUCC, non-point pollution, Loess Plateau Region, PNPI model, Potential non-point-source pollution risk
Citation: Lyu J, Huang Y, Nie Q, Lu C, Zhang Y, Fu X, Guo P and Luo P (2023) Spatiotemporal variations and risk characteristics of potential non-point source pollution driven by LUCC in the Loess Plateau Region, China. Front. Ecol. Evol. 11:1253328. doi: 10.3389/fevo.2023.1253328
Received: 05 July 2023; Accepted: 18 July 2023;
Published: 03 August 2023.
Edited by:
Naifei Liu, Xi’an University of Architecture and Technology, ChinaReviewed by:
Yajiao Li, Xi’an University of Science and Technology, ChinaCopyright © 2023 Lyu, Huang, Nie, Lu, Zhang, Fu, Guo and Luo. This is an open-access article distributed under the terms of the Creative Commons Attribution License (CC BY). The use, distribution or reproduction in other forums is permitted, provided the original author(s) and the copyright owner(s) are credited and that the original publication in this journal is cited, in accordance with accepted academic practice. No use, distribution or reproduction is permitted which does not comply with these terms.
*Correspondence: Jiqiang Lyu, bHZqaXFpYW5nMDcyMUBjaGQuZWR1LmNu
Disclaimer: All claims expressed in this article are solely those of the authors and do not necessarily represent those of their affiliated organizations, or those of the publisher, the editors and the reviewers. Any product that may be evaluated in this article or claim that may be made by its manufacturer is not guaranteed or endorsed by the publisher.
Research integrity at Frontiers
Learn more about the work of our research integrity team to safeguard the quality of each article we publish.