
94% of researchers rate our articles as excellent or good
Learn more about the work of our research integrity team to safeguard the quality of each article we publish.
Find out more
ORIGINAL RESEARCH article
Front. Ecol. Evol., 20 December 2023
Sec. Behavioral and Evolutionary Ecology
Volume 11 - 2023 | https://doi.org/10.3389/fevo.2023.1252632
This article is part of the Research TopicEffects of Noise on Organisms: From Mechanisms to Ecological ConsequencesView all 8 articles
 Morgan L. Rhodes1
 T. Brandt Ryder2†
 Brian S. Evans2Jennifer C. To1
 Elizabeth Neslund1Christopher Will1
 Lauren E. O’Brien1
 Dana L. Moseley1,2*
In urban and human-modified landscapes, animals face novel selection pressures resulting from differences in habitat structure and increased anthropogenic noise. Urban noise pollution can negatively impact songbirds because low-frequency noise often masks portions of birds’ mating signals and reduces signal transmission. Previous research has demonstrated that the songs of birds in more urban habitats have structural differences that can enhance signal transmission when noise is present. The majority of these studies have focused on species that deliver short, stereotyped songs and have limited repertoires. Gray catbirds (Dumetella carolinensis, family: Mimidae) sing long bouts containing imitated, improvised, and invented song elements, and therefore may have an increased ability to vary songs in response to noise. We hypothesized that aspects of developed habitats including loud anthropogenic noise and changes to land cover would impact catbirds’ song structural parameters, including song minimum, peak, and maximum frequency, frequency bandwidth, and entropy. We recorded and processed songs from 42 male catbirds and analyzed over 18,000 song elements from sites along an urban gradient from western Virginia to the Washington, DC metropolitan region. We quantified the urban intensity at each site-centroid based on percent canopy cover, percent impervious surface, and noise level. Song features such as minimum, maximum, and peak frequency increased significantly as noise levels increased, demonstrating that catbirds in noisier areas sing higher frequency songs compared to individuals in quieter habitats. Land cover variables also significantly predicted certain song features such as maximum frequency (impervious surface) or entropy (canopy cover). These structural differences in catbird song can limit the negative effects of environmental noise-masking, even for their long song bouts, and suggest that vocal mimics respond to anthropogenic noise. Future studies could investigate repertoire size and composition along an urban gradient and if these structural differences lead to functional consequences for the songs of vocal mimics.
As habitats are increasingly urbanized, developed, or modified by humans, animals are faced with novel selection pressures such as anthropogenic light and noise, different predators, altered community structures, and highly modified habitats (reviewed by Slabbekoorn and Ripmeester, 2008; Evans et al., 2011; Swaddle et al., 2015). Specifically, anthropogenic noise pollution is an obstacle for animals that communicate acoustically, because this noise is high amplitude and can overlap and mask the frequencies at which animals signal (reviewed by Slabbekoorn and Ripmeester, 2008; Barber et al., 2010; Shannon et al., 2016). For example, reduced signal transmission can affect organisms’ ability to give alarm signals warning others of predators, maintain group cohesion, attract mates, compete with rivals, and defend territories (Swaddle et al., 2015).
Many previous studies have investigated how anthropogenic noise affects communication in various vertebrates (e.g., amphibians, Grenat et al., 2019; cetaceans, Buckstaff, 2004, Melcón et al., 2012, Blair et al., 2016; and birds, Halfwerk and Slabbekoorn, 2009, Nemeth and Brumm, 2009). When exposed to traffic noise, American ground frogs (Odontophrynus americanus) increase the dominant frequency of their calls (Grenat et al., 2019). Similarly, Asian particolored bats (Vespertilio sinensis) significantly decrease call complexity and increase call amplitude in response to simulated traffic noise, which increases signal transmission (Jiang et al., 2019). Bottlenose dolphins (Tursiops truncatus) increase whistle production as sea vessels approach, which potentially increases the number of signals and thus would improve signal detection (Buckstaff, 2004). Blue whales (Balaenoptera musculus) have been shown to decrease calling rates in the presence of mid-frequency active sonar, but they appear to increase calling in relation to ship noise (Melcón et al., 2012). While an association between anthropogenic noise and acoustic communication has been shown in a wide variety of vertebrate taxa, songbirds represent two-thirds of the literature on the subject (reviewed by Shannon et al., 2016) and the majority of these studies address the response of songbirds inhabiting urban environments (Slabbekoorn and Ripmeester, 2008).
Increased anthropogenic noise is one of myriad features of urban and developed habitats that can impact bird song and behavior (Naquib, 2003; Warren et al., 2006). Many aspects of urban environments, such as the physical structure, can act in concert with anthropogenic noise to degrade or mask avian vocal signals and limit signal transmission (Warren et al., 2006). For example, impervious surfaces alter signals through reverberation off buildings and hard ground surfaces (e.g., Slabbekoorn et al., 2007; Phillips et al., 2020), similar to reverberation caused in forests (Richards and Wiley, 1980), which changes how signals propagate through the environment (Wiley, 2006). Concomitantly, loud, low-frequency anthropogenic noise masks any overlapped frequencies of birdsong, specifically at lower song frequencies, and generally lowers the signal-to-noise ratio (SNR) (reviewed by Brumm and Slabbekoorn, 2005; Warren et al., 2006; Slabbekoorn and Ripmeester, 2008). Consequently, birdsong signals may not be detectible by receivers over the anthropogenic noise as song features do not transmit well through the noisy environment (reviewed by Brumm and Slabbekoorn, 2005).
In the last two decades, numerous studies have found a variety of differences in the way birds sing in noisy habitats compared to quieter habitats. Reported strategies that birds employ include raising of minimum song frequency, singing with increased amplitude, and singing with more energy concentrated in a narrower bandwidth – all of which increase signal detectability (reviewed by Brumm and Slabbekoorn, 2005; Slabbekoorn and den Boer-Visser, 2006). Slabbekoorn and Peet (2003) first found evidence of differences in birdsong with increased anthropogenic noise in birds and showed a correlation between noise level and birds singing with higher minimum frequencies in great tits (Parus major). Raising minimum song frequency avoids the masking effects of low-frequency noise, resulting in increased signal transmission. Nemeth and Brumm (2009) found that European blackbirds (Turdus merula) in cities sing with higher minimum frequencies and with shorter intervals between bouts than forest blackbirds. They proposed that these song differences may be an adaptation to urban noise, or alternatively, that this song divergence may be a side-effect of physiological adaptation to urban habitats (Nemeth and Brumm, 2009). When experimentally broadcasting increased noise that overlaps the frequency of song, some species are able to increase the amplitude (loudness) of their song (e.g., Cynx et al., 1998; Brumm and Todt, 2002; Derryberry et al., 2017) or immediately change song features, which is known as “immediate flexibility” (reviewed by Brumm and Zollinger, 2013; Slabbekoorn, 2013). White-crowned sparrows, for example, sing with greater song amplitude, but do not raise their minimum frequencies in response to playback of urban noise (Derryberry et al., 2017). In a follow-up study on this same species, urban males responded to noise playback with songs of more narrow frequency bandwidth, while rural males showed no immediate flexibility in song frequency (Gentry et al., 2017). However, not all bird species tested show population differences in songs nor are all species able to immediately shift their songs in response to a noisy environment (Brumm and Zollinger, 2013; Slabbekoorn, 2013; Swaddle et al., 2015; Shannon et al., 2016). When these mixed results are added to the tendency for negative data to go unpublished, it is not a foregone conclusion that all Passeriform birds have vocally adapted to increase the detectability of vocal signals in noisy environments.
While the impact of urban noise is well documented for bird species with short, stereotyped songs and limited repertoire sizes there is an incomplete understanding of how anthropogenic noise and urban development affect the song features of more complex singers, such as vocal mimics (c.f., Brumm and Todt, 2002; Gough et al., 2014; Deoniziak and Osiejuk, 2019; Walters et al., 2019). For species with short songs (such as species in Passerellidae or Paridae), or those spanning a narrow frequency range, often only a portion of song frequencies are overlapped (Nemeth and Brumm, 2010) as peak amplitudes from anthropogenic noise are usually in the 1–2 kHz range (e.g., Luther and Derryberry, 2012; reviewed by Brumm and Slabbekoorn, 2005; Slabbekoorn and Ripmeester, 2008). For birds living in cities with lower-frequency noise (<1 kHz) that also have songs naturally at higher frequencies, shifting of song frequency upwards may not offer much release from noise-masking because minimal signal content may be masked (Nemeth and Brumm, 2010). One would expect the greater proportion of song frequency overlapped by noise would lead to a greater benefit of shifting song parameters, such as raising minimum frequencies, which would enhance signal transmission and detection under noisy conditions (reviewed by Brumm and Slabbekoorn, 2005; Slabbekoorn and Ripmeester, 2008). Alternatively, we reason that species with a wide vocal range may already vocalize with substantial signal content outside of the range usually overlapped by noise, and thus may not benefit from raising or eliminating lower frequencies. Therefore, it remains an open question whether a species with a very wide vocal range would show differences in song frequency in urban populations.
Here, we study the gray catbird (Dumetella carolinensis), a species found along rural-to-urban gradients that produces long, complex, mimicked song. They are common summer residents of areas in the urban–suburban matrix, although whether suburban habitats lead to high population growth rates seems to be highly variable (e.g., Balogh et al., 2011; Pharr et al., 2023). For catbirds, adult survival increases in urban environments (Evans et al., 2015), daily nest survival tends to increase (Ryder et al., 2010), but fledgling success decreases with increasing prevalence of impervious surface (Balogh et al., 2011). Recently, catbird survival was reported to decrease with increased anthropogenic light, but there was wide variation at the brightest sites (Pharr et al., 2023). While Breeding Bird Survey data suggest that gray catbird populations are currently stable overall (Ziolkowski et al., 2023), some catbird populations, however, are declining and the species is listed in the state of Virginia as a Tier IV Species of Moderate Conservation Need (VDGIF, 2020).
During the breeding season, catbirds regularly sing bouts of song exceeding a duration of several seconds to several minutes without a 1-second gap between song elements (Figure 1). Their songs cover a wide frequency bandwidth from about 1.2 kHz up to 9.5 kHz (as recorded in this study). To our knowledge only three studies have described catbird song in much detail (c.f., Thompson and Jane, 1969, n = 3 males; Fletcher and Smith, 1978, n = 5 males; Kroodsma et al., 1997, n = 7 lab-reared males’ songs analyzed in depth, and roughly 27 wild catbirds). Catbirds’ continuous songs include imitated, improvised, and invented elements (Thompson and Jane, 1969; Kroodsma et al., 1997), and appear to have hundreds of unique elements that are often individually distinct. Thompson and Jane (1969) suggested some song sharing in similar geographical regions while Kroodsma et al. (1997) concluded the opposite, that repertoires are individually distinct, by comparing males at similar and widely different geographic areas.
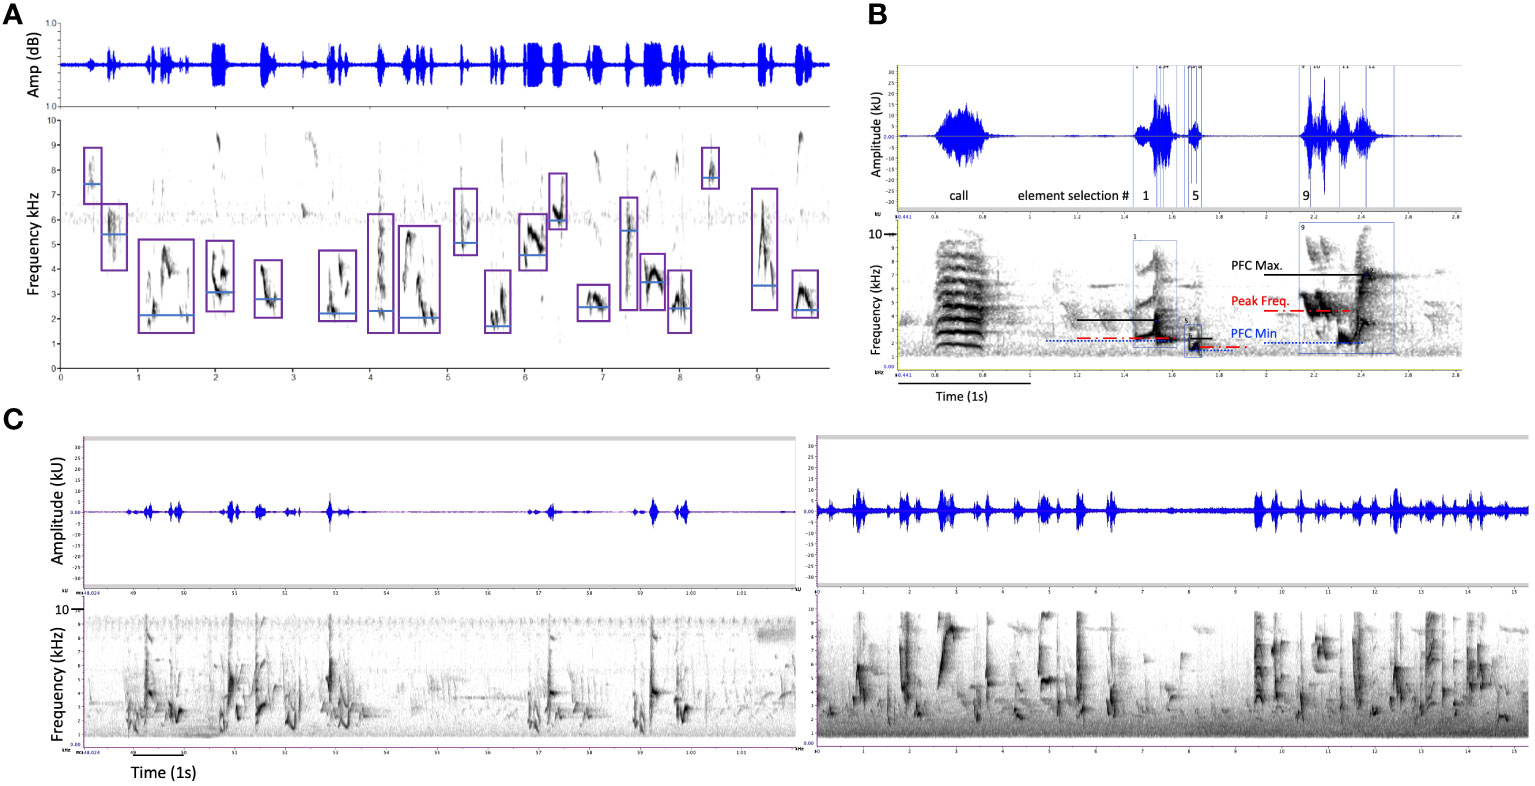
Figure 1 Examples of gray catbird song visualized in waveform, amplitude (kU) versus time (s), and corresponding spectrogram, frequency (kHz) versus time (s). (A) A song bout with a duration of ten seconds. Purple boxes indicate 19 song elements selected for analyses in Raven Pro, each following the previous within less than one second. Blue lines represent the Peak Frequency Contour (PFC) Minimum Frequency of each element as generated by Raven Pro by dividing the element selection box into time bins, generating one peak frequency per time bin, and calculating the lowest peak frequency across a contour per element. (B) A zoomed in (x-axis expanded) example of one “mew” call, not selected, and three song elements with PFC minimum (blue, dotted lines), PFC maximum (black, solid lines), and peak (red, dashed lines) frequencies as generated by Raven Pro. Values were not chosen “by eye”, instead, Raven Pro calculations for these song parameters were marked on the spectrogram using the cross-hair tool. (C) two additional exemplars of catbird songs from a rural farm (CRUSHR, left) and campus arboretum (JMUARB, right) with durations of nearly 15 sec, with Raven Pro settings of 60 in brightness and contrast and 512 sampling rate, band-filtered for view here between 800 and 9700 Hz.
With such a diverse repertoire and wide frequency range, catbirds may have an increased ability to vary songs in response to noise, given that syllables and elements with frequencies outside of the range masked by anthropogenic noise are common in the repertoire. In our study region, anthropogenic noise can overlap a substantial portion of their lower frequencies and, while noise amplitudes peak between 1–2 kHz, anthropogenic noise often occurs up to 3 kHz or higher. Alternatively, catbirds may not show differences between noisy and quieter habitats since many of their high-frequency syllables and elements would likely transmit over background noise. Studying how urban and modified habitats affect multiple aspects of gray catbird song behavior would provide insights into related species or other species with similarly complex singing styles.
However, to address the topic of urban impacts to song in continuous singers with a wide vocal range poses methodological hurdles and constraints. First for consideration is the question of song duration sample size. While 3–10 songs per individual may appropriately reflect repertoires for short, stereotyped singers, a longer duration of song sampled is likely necessary for mimics and continuous singers (Figure 1C). Accurately measuring frequency can be difficult for song-bouts spanning minutes as even the recordings with the highest SNR have the occasional sound from another bird species or sudden anthropogenic noise in the background. We aim to tackle these hurdles by processing large sample sizes of song per individual and using peak frequencies as calculated per time bin for each song element and deriving minimums and maxima from these peak frequencies. In part, our study was an investigation into whether or not catbird songs vary across an urban gradient, and, if so, what features of urban habitats drive any song differences.
We hypothesized that catbird song features would be impacted by various aspects of urban and modified habitats such as anthropogenic noise and built-up landscape features. We determined the degree of urbanization of sampling sites on a continuous basis by measuring spatially varying aspects such as impervious surface and canopy cover as well as ambient noise levels. Specifically, we predicted that song characteristics such as minimum and peak frequencies will increase with increased levels of urbanization and noise, as increasing these parameters would likely lead to enhanced signal transmission. We predicted that increased impervious surface would predict increases in song minimum frequency but decreases in song maximum frequency, frequency bandwidth (Gentry et al., 2017), and song entropy. Song entropy is generally higher for more complex and widely frequency dispersed (less tonal) songs (Briefer et al., 2010), which we predict higher song entropy in less urban habitats with less noise. We aim to expand previous findings through analyzing a large dataset of over 18,000 elements of catbird songs and using an expanded urban-to-rural gradient from rural Virginia to the Washington, DC metro region including city centers, urban and suburban parks, agricultural land, and National Forest habitats. Examining how various levels of urbanization and noise affect avian communication, especially mating signals, is essential to better understanding how songbird species may persist or thrive in urban habitats.
From early May to early August, two field teams sampled along an urban gradient in the Shenandoah River Valley (2018–2019) and metropolitan Washington, DC (2017–2019). Birds were sampled from multiple locations throughout both regions. Site nodes were selected based on the following criteria – having five or more breeding pairs of catbirds, receiving permission for access, varying in percent impervious surface cover (0–36%) and percent canopy cover (0–50% as described below), and having a likelihood to vary in anthropogenic noise based on proximity to roads and urban development. Sites in the Shenandoah River Valley region included an arboretum at James Madison University, urban and suburban parks, a local farm, and a National Forest campground. Field sites in the metropolitan area included the Smithsonian National Zoological Park, National Mall, and Rock Creek National Park in Washington, DC and suburban parks and botanical gardens in Maryland (see Table 1 for corresponding site codes and descriptions).
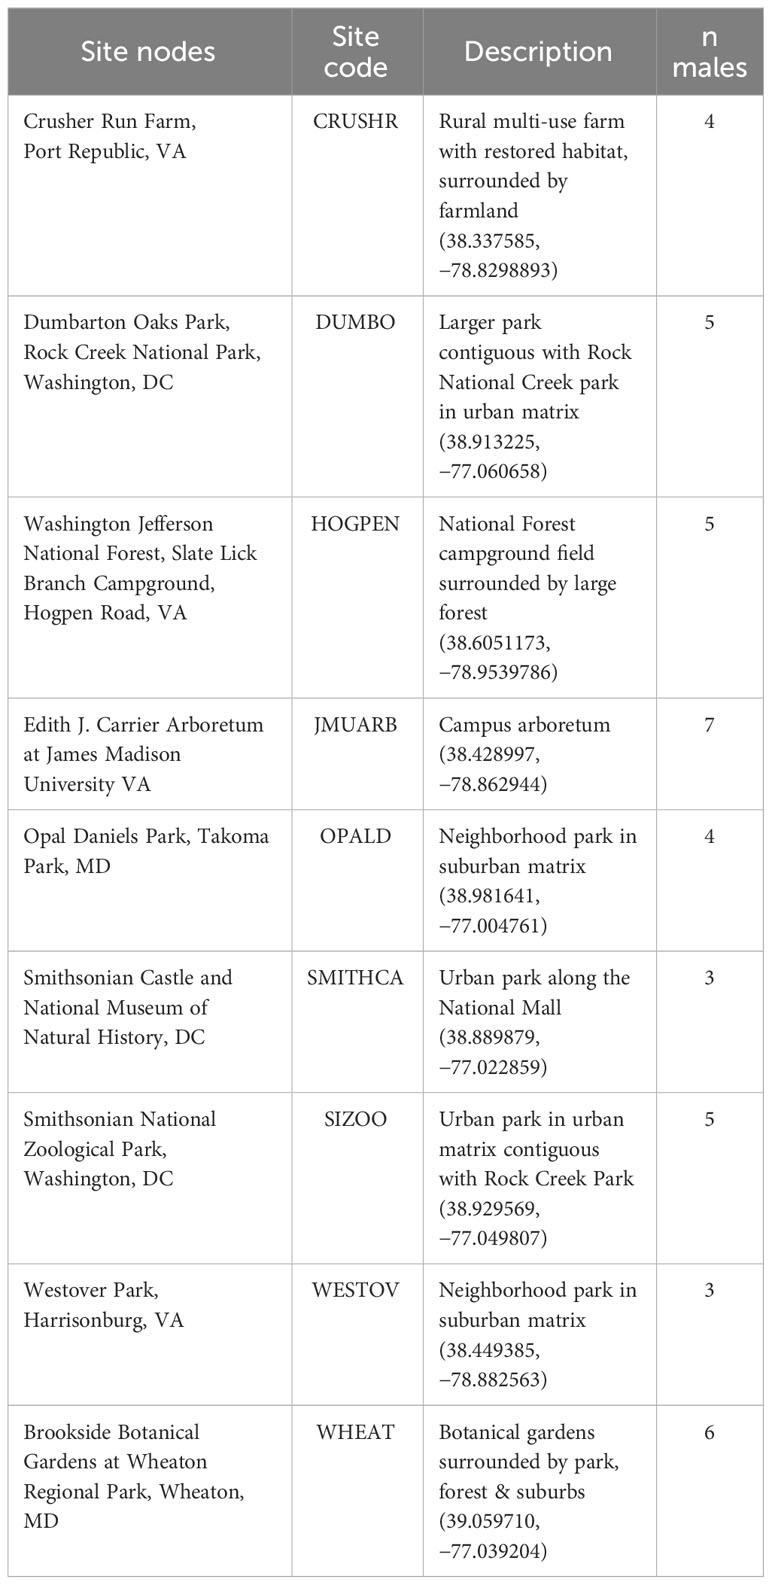
Table 1 Names and locations of site nodes around which males were sampled, site codes, a brief description, and the number of males analyzed from each site node, totaling 42 males.
We obtained land cover raster data (30 m resolution), including percent impervious surface cover, percent tree canopy cover, and categorical land cover from the Multi-Resolution Land Characteristics Consortium (Homer et al., 2020). To ensure that proportional land cover metrics were comparable across sites that may contain open water, we used the categorical land cover layer to set the values of open water pixels to NA. For each site, we determined the site centroid as the median location of all catbird nesting location records. Within sites, the distances between catbird nests range between 25–82 meters for urban and suburban parks, and from 129–373 m for rural farms and forests. We then calculated the proportion of impervious surface and canopy cover (30 m resolution, Homer et al., 2020) within buffer distances of 100, 500, and 1000 m radii of the site centroids (Table 2). These buffer distances are expected to represent biologically relevant scales for gray catbirds, as previous research has shown that they are predictive of catbird abundance (100 m, Evans et al., 2018), adult survival (500 m, Evans et al., 2015), and nest success (1000 m, Ryder et al., 2010). Especially in more urban sites, catbirds in our study have been observed off-territory at water and food sources, as well as associating with other catbirds (DLM pers. obs; c.f., Ryder et al., 2012), therefore catbirds likely experience habitat structure and noise at scales beyond their own territory.
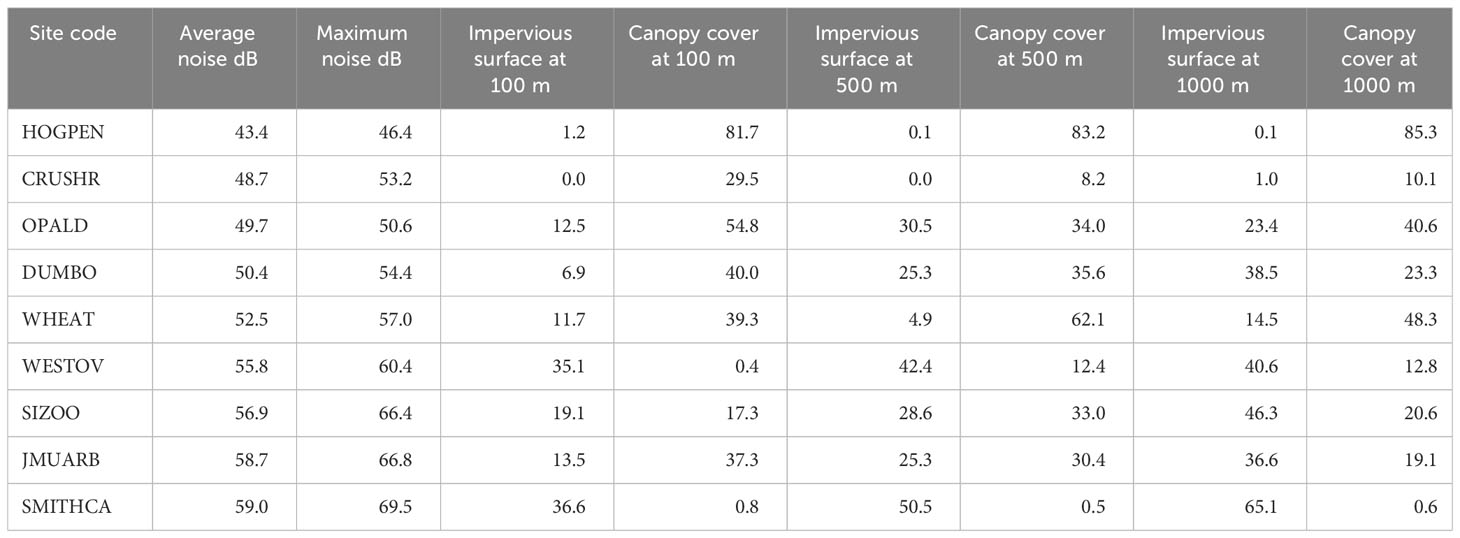
Table 2 Sites were quantified for level of urbanization with three broad categories: noise levels in dB and two land cover variables – percent impervious surface and percent canopy cover from buffer distances (radii from site centroid) of 100, 500, or 1000 m.
We measured ambient noise levels in catbird territories in the mornings (5 am–11 am EDT) throughout the breeding season using a sound pressure level meter (SPL meter Galaxy Audio CM-170 IEC 61672-1 Type II SPL fast C setting). We performed noise-sampling within catbird territories across each site covering all areas of the site “haphazardly” (i.e., aiming at random; Quinn and Keough, 2002) from which we recorded catbirds. We sampled noise levels from within catbird territories but avoided times when catbirds or any other species were actively singing close by, as well as avoiding immediate noise events such as a truck passing nearby. Because noise fluctuates over time, for each measurement recorded, we configured the SPL meter and allowed it to sample noise until it reached a stable number for a few seconds and recorded this value in decibels (dB). We repeated this process throughout the morning to correspond to times of day for which we had made catbird recordings. From these measurements, we calculated the average, maximum, and median of all SPL meter readings in decibels per site node (Table 2). These noise values correlate strongly and significantly (p < 0.0015, Pearson’s R = 0.886) with anthropogenic noise readings taken in the years since with a Larson Davis SoundAdvisor 831C class 1 sound level meter.
We captured catbirds using mist-nets and banded birds with a USGS band and a unique combination of plastic color bands to allow for later visual identification. For adults, we determined sex, age and measured tarsus, wing, tail, and beak lengths (mm) in addition to body mass (g). After measurements were taken, we then released the birds. Two observers took all measurements in VA (DLM and MLR), and four observers took measurements in DC (DLM, TBR, GD, DLA). Two observers, DLM and TBR, compared measurements with field trainees to minimize variation and error. All protocols involving the use of live vertebrates were approved by Animal Care Committees and the federal bird banding lab (IACUC (JMU #20-1653, SI-NZP #16-16, BBL 23407).
We visited each of the nine field sites 1–3 times per week (1–3 sites per day) and made focal recordings of males during mornings (5–11 am EST). We used directional, shotgun microphones (Sennheiser ME67) and digital recorders (Marantz Professional PMD561 handheld solid-state recorder) at a sample rate of 44.1 kHz and 16-bit encoding. We identified males by color bands if possible; otherwise, unbanded territory-holding males were identified based on nest location and regular singing perches and were at least two territories apart from another unbanded male. A total of 69 banded and unbanded males were recorded across 2017–2019. Some recordings were of males that were recorded for only brief stints or were unbanded and not incontrovertibly attributable to a territory and nesting location, and therefore disregarded for processing in this study.
We used sound analysis software (Raven Pro v1.5, The Cornell Lab of Ornithology) to view waveforms and spectrograms and assess the quality of recordings based on the signal-to-noise ratio (SNR) and amount of catbird song. For spectrograms and waveforms, view axes were configured to have a time scale of approximately 22 seconds and a frequency scale of 15,600 Hz, using a Hann window, window size 256 samples per a 3-dB filter bandwidth at 124 Hz. We set window overlap to 50%, hop size to 128 samples and the discrete Fourier transformation size to 512 samples with grid spacing of 86.1 Hz, and we batch filtered out sounds below 1 kHz.
The authors and a team of twelve students and technicians trained by DLM viewed and selected catbird songs, avoiding the “mew” call or other call types, from the recording files and processed these files in order of priority for low background noise (i.e., high SNR) and the presence of at least 3–5 song bouts per recording file. Importantly, the student observers were blind to noise levels and to estimates of land cover at the time of bout and element selection. Recordings with high levels of background noise (low SNR) were not processed. Bouts were defined as a minimum of three syllables occurring within less than one second of the previous syllable, and bouts were separated by a minimum of one second of silence (Thompson and Jane, 1969). Bout selection boxes were bounded by 1000 Hz and 11,000 Hz in frequency. We then selected elements, defined as the smallest distinct unit of song with no silent gaps as visible on both the spectrogram and waveform. Previous literature on catbird song has also referred to the sounds within bouts with the term “syllable” (Thompson and Jane, 1969) or “song-phrase” (Dolby et al., 2005), but this term can incorporate sounds that are separated by silences (multiple notes or elements could be within a “syllable”), and so we refer to sounds separated by any amount of silence as “elements”. We selected individual elements from within a minimum of five clear bouts per individual recording file (Figure 1), and, for a subset of males, we selected all elements in all recordings, for a total of 18,255 elements from 868 bouts across 42 males (bouts per male range = 2–133, mean = 21; elements per male range = 63–1476, mean = 434.6). Elements were selected with slim margins below the lowest and above highest visible frequency (range: min 1033 – max 9560.7 Hz) to avoid bias from potential noise masking, however, confusion from masking noise was unlikely as we only used recordings with high SNR. Finally, we removed males that had less than 50 total song elements that met the above criteria. Combined, this selection process yielded 97 high quality recordings from 42 males, which represented 25 banded and 17 unbanded individuals (Table 1).
Using the subsetted data, we then calculated our variables of interest, which include minimum and maximum peak frequency, frequency bandwidth, average entropy, and phase rate. We used the “Peak Frequency Contour” (PFC) measurement tool in Raven Pro to measure minimum and maximum frequency and frequency bandwidth of individual song elements (Figure 1B). Within a selection, this PFC tool calculates a peak frequency (Hz) for each time slice and plots a contour of these peak-energy frequencies across time for an entire selection, in this case, song element (Table 3; Figure 1B). Importantly, this tool avoids the problems of the “by-eye” method by calculating frequency from peak energy (Ríos-Chelén et al., 2016; Brumm et al., 2017), and the contour calculation increases robustness against falsely detecting noise as birdsong. PFC minimum frequency is the lowest frequency of the peaks in the contour for that selection, while maximum frequency is the highest peak of the contour for any selection (Figure 1B). These measurements are robust to measurement error because they are based on the highest amplitude per time bin. Frequency bandwidth was calculated in two ways; first, we calculated frequency bandwidth using the difference between the average of the 10% lowest PFC minimum frequencies subtracted from the average of the 10% highest PFC maximum frequencies per male per bout. Second, we also calculated measurements for frequency bandwidth from whole bouts using the Raven Pro measurement tools BW90 (Hz), i.e., 90% of the bandwidth (Hz), which measures the frequency excursion for 90% of the energy in the bout selection. This method of measuring bandwidth is conservative as the frequencies with the lowest energy (both background noise and actual song) are not included. We also used whole song-bout selections to measure average entropy (bits) (Table 3). Entropy measures the disorder in a sound – sounds with more disorder have higher entropy whereas a pure tone would have an entropy of zero. Raven Pro calculates entropy in bits because it uses a log base 2 and iterates over spectrogram slices by frequency alone within the selection box. Average entropy is an average across spectrogram slices over time within a selection. Finally, we calculated phrase rate by generating a value for time-on singing divided by the duration of the whole bout by using the sum of element duration (sum of “Dur90” tool, which gives the time across which 90% of the energy spans) of each element divided by the length of the bout in seconds measured from the onset of the first element in the bout to the cessation of the last element in the bout.
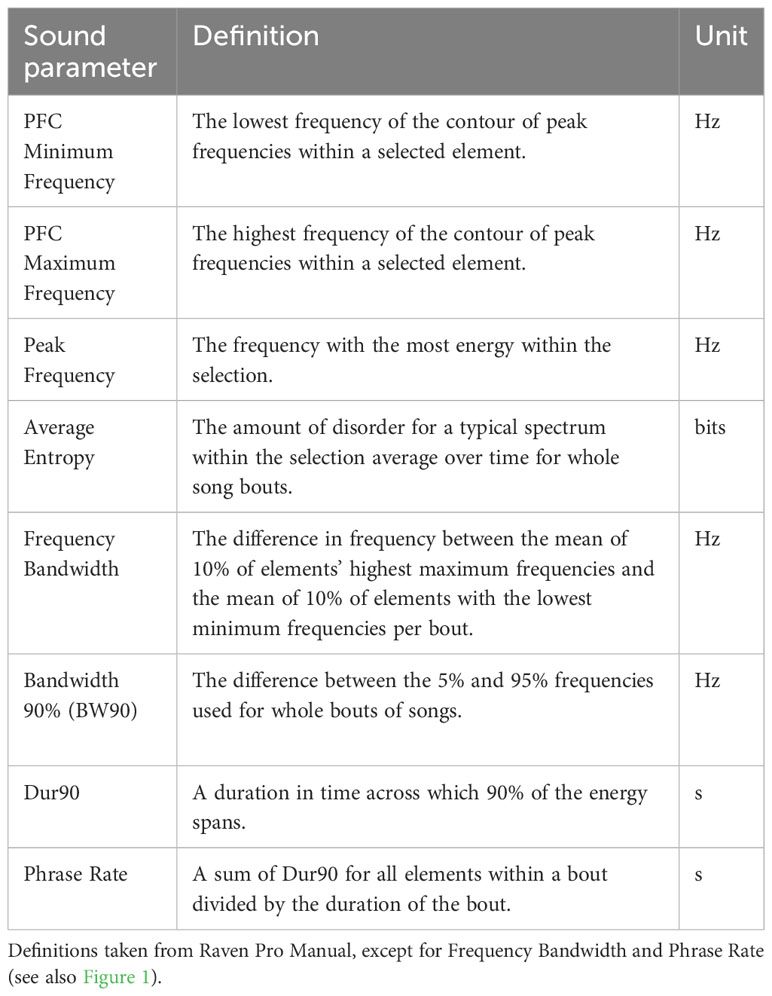
Table 3 Measurements taken in Raven Pro sound analysis software or used in calculations.
We used R version 3.6.2 (R Core Team, 2019) for all data processing and statistical analyses. All selection tables of song measurements from Raven were read into R and joined with raster land cover data (Hijmas, 2019) and noise data from our sites. Our aim was to test the effect of habitat modification and anthropogenic noise on the following song parameters: song elements measured for minimum, maximum, and peak frequencies, frequency bandwidth, whole song bouts measured for 90% of bandwidth, and average entropy. Environmental predictor variables included: percent impervious surface cover and percent canopy cover each at 100, 500, or 1000 m radii, and mean noise level (dB). Fixed effects were checked for collinearity and the in variance inflation factor indicated only moderate collinearity (vif = 2.15–3.37; correlation 0.25–0.60). Generalized linear mixed models (GLMMs), which included male as a random effect and standardized (i.e., scaled and centered; Lüdecke, 2018) environmental predictors as fixed effects, were fit by maximum likelihood with t-tests using Satterthwaite’s method in the package lme4 (Bates et al., 2015) using the function lmer. Models were constructed for each of the seven response variables with all potential combinations of anthropogenic noise and land cover predictors and a null model that only included the random effect. We used model selection based on Akaike’s Information Criteria, adjusted for a small sample size (AICc; R package AICcmodavg, Mazerolle, 2023), to assess the degree of support for each model. Top models were identified as models with the lowest AICc, and models with a ΔAICc ≤ 2, relative to the top model, were considered to have substantial support (Anderson and Burnham, 2004). We used the R packages broom.mixed (Bolker and Robinson, 2022) and sjstats (Lüdecke, 2022) to explore model results and sjPlot to visualize beta estimates and fitted values (Lüdecke, 2023). We report all model selection output including model weights and visualization of estimates in the Supplementary Material. We opted not to perform multi-model averaging (Anderson, 2008) because estimates become rather complex to interpret and, recent literature recommends against this practice with moderate collinearity as is commonplace in habitat data (Cade, 2015).
We evaluated song parameters from more than 18,200 elements and over 800 song bouts from 42 males. There was considerable model support for an association between the level of anthropogenic noise recorded at sites and the minimum, maximum, and peak song frequencies – each response variable increased with increasing noise levels. Model selection also supported an association between land cover predictor variables and the song parameters, but the top models varied in terms of the exact combination of fixed effects, the land cover buffer radius (100, 500 or 1000 m), and the song parameter measured (model selection, see Supplementary Tables S1 and S2. Summary output for all top models with the lowest AICc is shown in Table 4. All top models included mean noise except for the top model for song entropy. Top models for minimum frequency, peak frequency, and both measures of frequency bandwidth include noise and canopy cover as predictor variables, with noise being identified as statistically significant within all of these models. The top model for maximum frequency included noise and impervious surface cover at 1000 m. Additionally, three song response variables – minimum, peak, and maximum frequencies – were equally supported (ΔAICc ≤ 2) by models that included mean noise, impervious surface, and canopy cover at 1000 m for each song frequency response variable (Table 5; Supplementary Material). Generally, song frequency increased as noise levels and (surprisingly) percent canopy cover increased.
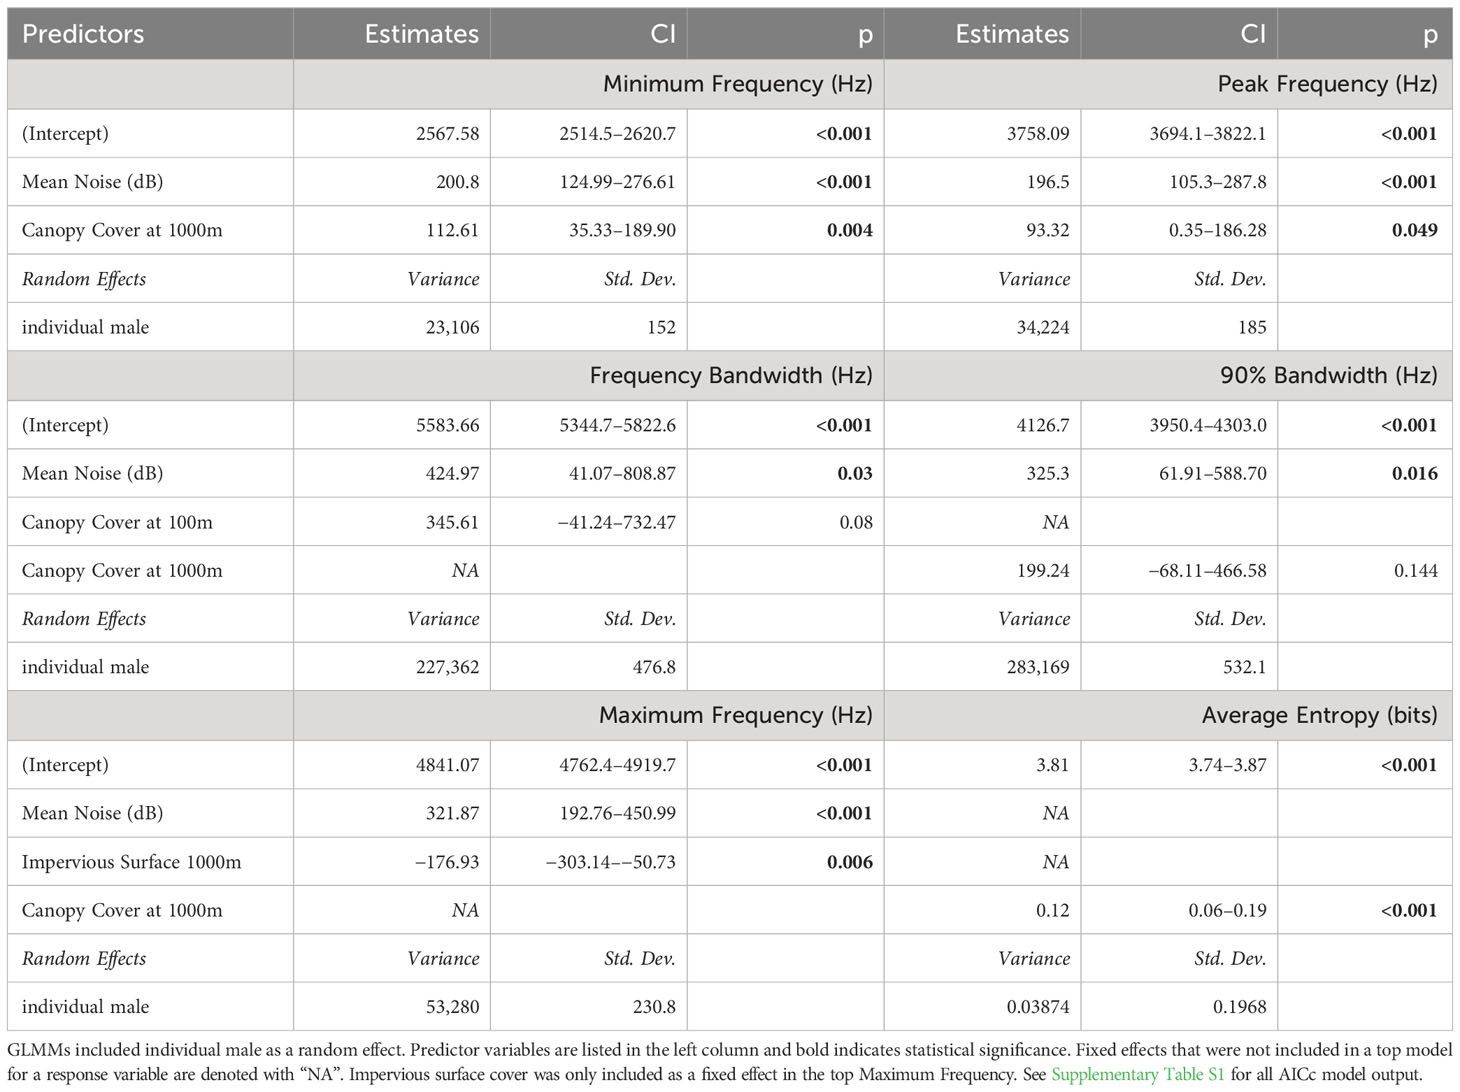
Table 4 Estimates and confidence intervals presented for top models using model selection for lowest AICc for six song parameters of catbird song.
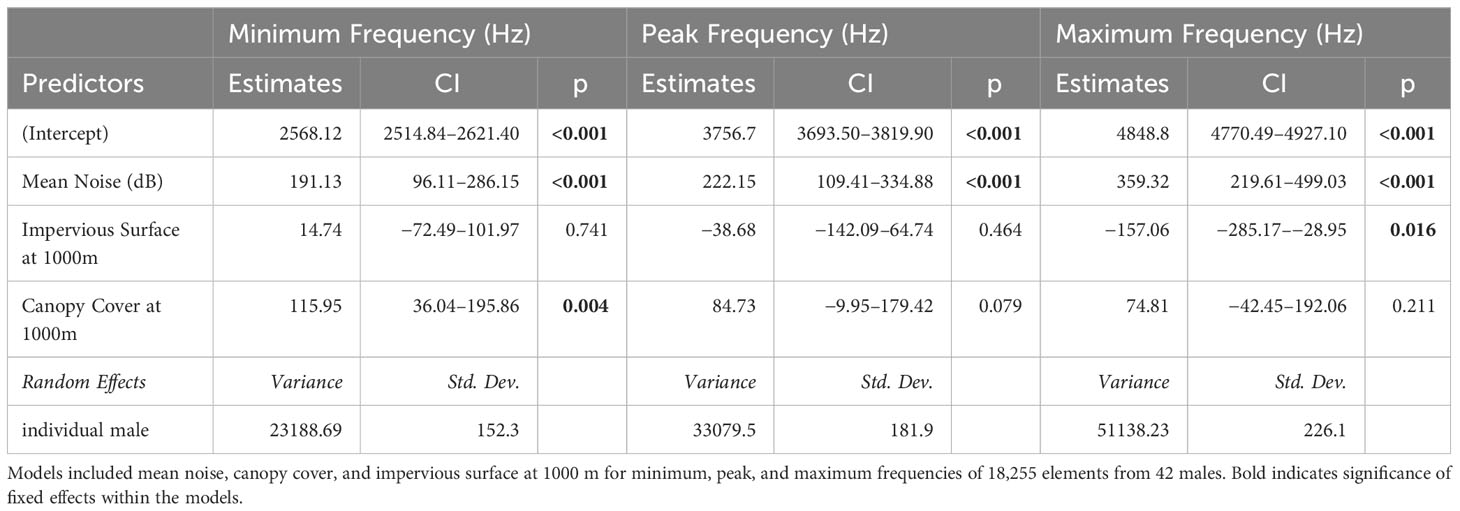
Table 5 Estimates and confidence intervals for models with the next lowest AICc (delta AIC <2) from GLMM using model selection for three song parameters of catbird song.
Top models for the two measures of frequency bandwidth included noise and either canopy cover at 100 or 1000 m. Frequency bandwidth (measured from the difference between PFC max and min frequencies of elements) and 90% Bandwidth (measured from the BW90 tool of bouts) were not significantly predicted (or only marginally predicted p = 0.059) by average noise alone. For Bandwidth90, a model with noise alone had the next lowest AICc. Noise, however, was a significant predictor in the top models for bandwidth, when including canopy cover (at 100 m for frequency bandwidth and at 1000 m for 90%BW) (Table 4).
Song entropy differed from the other parameters in that the top model included canopy cover at 1000 m alone, indicating entropy increased significantly with increasing canopy cover. Noise alone also significantly predicted entropy (p < 0.004) and was included in a model with canopy cover at 1000 m which had a ΔAICc of less than 2, indicating equivalent model support (ΔAICc = 1.63, ESM). Finally, element phrase-rate was not significantly predicted by any model. For phrase-rate, only one model with canopy cover (1000 m) as a fixed effect was ranked with a lower AICc than the null, but this model with canopy cover was not significant (p > 0.05, CI crossed zero, ESM, Supplementary Table S2).
Our study finds that male gray catbirds in noisier habitats sing at higher minimum, peak, and maximum frequencies, and marks one of the few studies on the topic of noise impacting a complex and continuous singer. Generally, our results support the hypothesis that catbird songs differ structurally along an urban gradient and are in line with our predictions that males in louder, more urban habitats would have higher minimum song frequencies as do many species studied to date (e.g., Halfwerk and Slabbekoorn, 2009; Nemeth and Brumm, 2009; Hu and Cardoso, 2010; Dowling et al., 2011). In contrast to many previous studies, we studied a species with a singing style of long, continuous, complex song bouts with a wide vocal range that also imitates the sounds of other species. Only two other studies, to our knowledge, have focused on anthropogenic noise impacting the song of vocal mimics, the northern mockingbird, Mimus polyglottos (Walters et al., 2019), and the song thrush Turdus philomelos (Deoniziak and Osiejuk, 2019). Walters et al. (2019) similarly found increases in average peak frequency overall and peak frequency of the lowest syllable types under increasing noise levels. Urban song thrushes were shown to sing higher minimum and peak frequencies as well as to sing with a greater syllable repertoire (Deoniziak and Osiejuk, 2019). Previously, few species that do not deliver short, stereotyped songs had been examined for the impacts of noise on song, likely because of the difficulty in song recording and analyses (c.f., Brumm and Todt, 2002; Gough et al., 2014).
Results that catbirds sing higher minimum and peak frequencies are in line with the noise-masking avoiding hypothesis, as higher minimum and peak frequencies would escape masking effects and increase signal transmission in the presence of low-frequency anthropogenic noise. Avoidance of low-frequency noise by shifting song minimum frequency may help to limit signal masking and enhance signal transmission (Nemeth and Brumm, 2009; Hu and Cardoso, 2010; Bermúdez-Cuamatzin et al., 2011). Although, it is possible that raised minimum frequencies could be a by-product of birds singing with higher amplitude as described by the Lombard effect (Brumm and Zollinger, 2013), in our study, birds in noisier habitats sang with considerably higher minimum and, notably, peak frequencies differing by about 400–500 Hz between habitats with less noise (minimums ~2300–2430 Hz) and noisier sites (minimums ~2700–2870 Hz) (Figure 2).
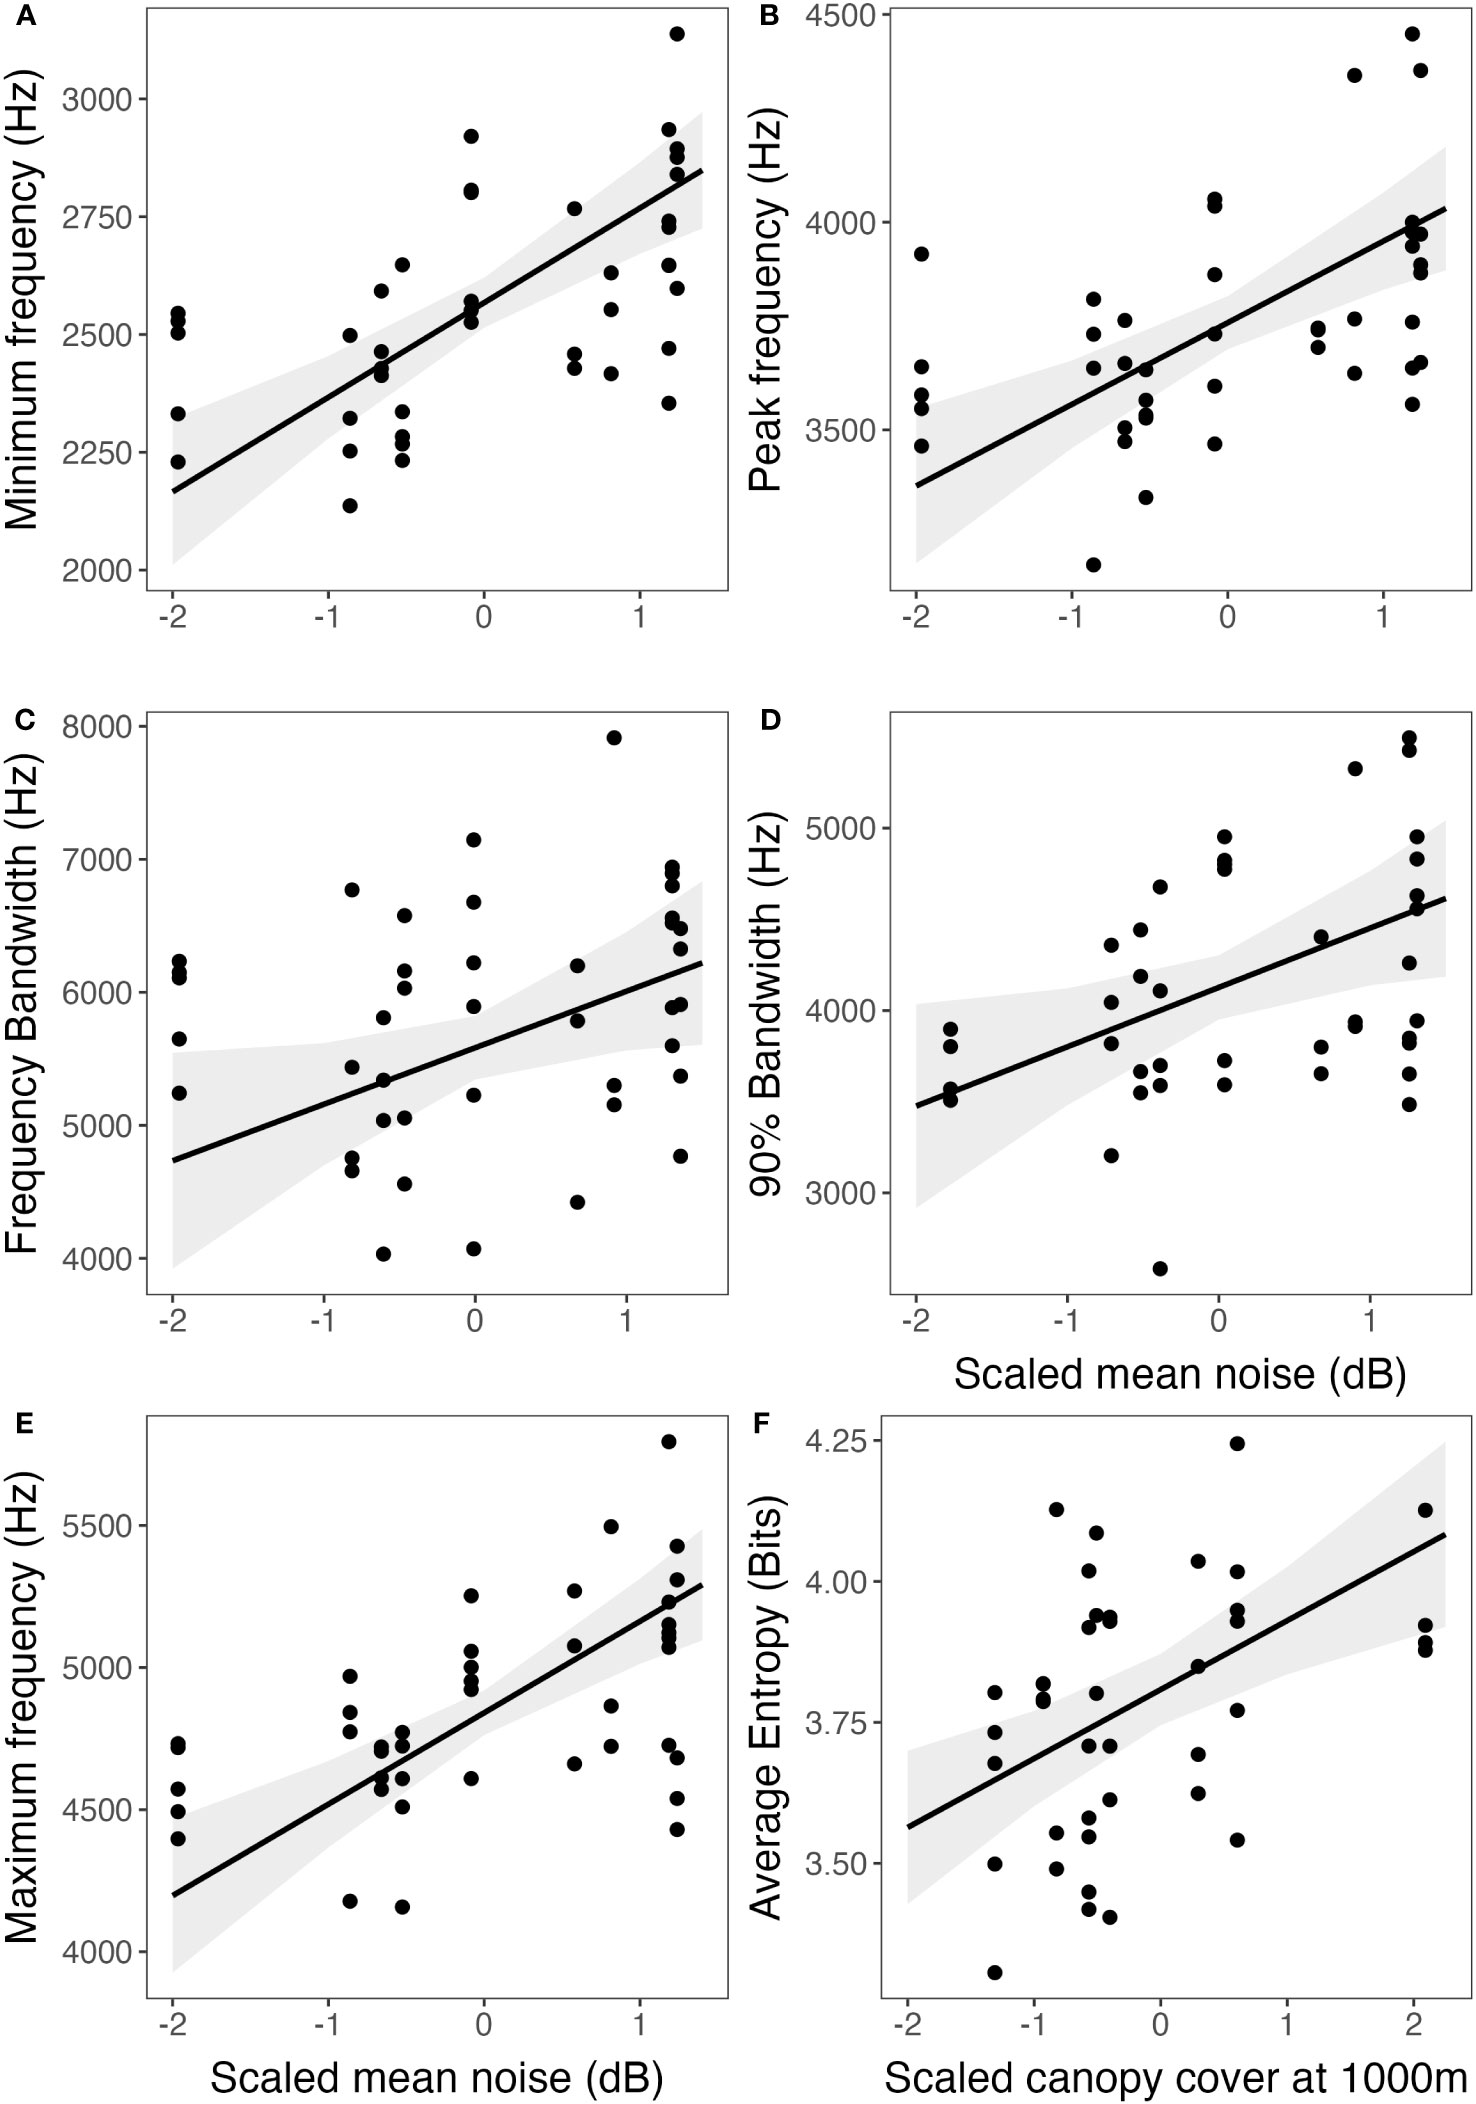
Figure 2 Six song response variables (A–F) plotted against the predictor variable with the greatest effect size from the top model from GLMMs, which was mean noise level (dB) for all song parameters (A–E) except for average entropy (F), for which the top model included canopy cover at 1000 m as the sole fixed effect. Fit lines were derived from the top model of song elements with male as random effect, and five top models included an additional land cover fixed effect not shown (Table 4; ESM, Supplementary Table S1). Notably, lines and confidence intervals were generated from model estimates specifically for one predictor variable within the context of the top model, and the output for a single fixed effect is influenced by the whole top model. Points are raw averages per male of song data from elements or bouts (Y axis) and graphed against the fixed effect scaled (X axis).
It is unclear if urban catbirds have adapted across generations to sing higher minimum frequency or if catbirds exhibit vocal flexibility to immediately shift their song frequency in response to low-frequency noise (Bermúdez-Cuamatzin et al., 2011). Moseley et al. (2018) found that nestling white-crowned sparrows (Zonotrichia leucophrys) tutored with noise learned less-masked songs significantly more often, suggesting that cultural evolution may be a potential mechanism for acoustic adaptation. The possibility of cultural selection may also be the case for gray catbirds, but a similar experiment would need to be conducted.
In addition to noise levels, canopy cover received model support for minimum, peak, and frequency bandwidth, as well as entropy (discussed below), though canopy cover was not always significant within the model as a fixed effect and parameter estimates were smaller than for noise (Supplementary Figure S1). Surprisingly, minimum and peak frequencies increased with increasing canopy cover, perhaps because some urban parks can be heavily forested (e.g., Rock Creek Park, and the arboretum at JMU), but reside within an urban matrix including high anthropogenic noise and large cover of impervious surfaces. Because all top models for song frequency included anthropogenic noise and noise estimates were significant within the top and second-to-top models (based on lowest AICC), we opted not to perform multi-model averaging, as interpretation of averaged estimates can be complex (Cade, 2015).
Few studies have examined bird species with complex, long, or versatile songs in terms of how anthropogenic noise affects song structure. Of species that have been studied to date, those with the most complex songs include nightingales (Luscinia megarhynchos, Brumm and Todt, 2002; Brumm, 2004), Pacific wrens (Troglodytes pacificus, Gough et al., 2014), and song thrushes (Deoniziak and Osiejuk, 2019). A previous study by Dowling et al. (2011) modeled the songs of six backyard bird species including recordings from eight catbirds. They found that gray catbird minimum frequency increased with higher noise levels for eight individuals, while song bandwidth and maximum frequency decreased with increased urbanization for only four catbirds at low-noise sites. The decrease in maximum frequency in Dowling et al. (2011) could have been a response to the urban structural environment and would make the song more tonal and better able to transmit without reverberation, while the increase in minimum frequency avoids low-frequency masking noise. However, their study analyzed few song structural features and had a sample size of 4–8 individual catbirds, as the goal of their study focused on trends across several backyard bird species. Lowering maximum frequency and the narrowing frequency bandwidth may increase signal transmission but may trade-off with attracting mates if singing broad frequency bandwidths is preferred by females (e.g., Halfwerk et al., 2011).
We found the opposite effect on maximum frequency in that catbirds in our study sang with significantly higher maxima in noisier habitats, as compared to previous studies, (e.g., Slabbekoorn et al., 2007; Dowling et al., 2011; Gentry et al., 2017). Gentry et al. (2017) found that urban white-crowned sparrows sang with lower maximum frequencies and narrower bandwidths than rural birds in a noise-playback experiment, and Phillips et al. (2020) found similar results for naturally varying song at more urban sites, but also at one rural site. While maximum frequencies increased with increasing anthropogenic noise for gray catbirds, maxima decreased with increasing impervious surface cover. Decreasing maximum frequencies in habitats with greater amounts of hard surfaces could be a response to the tendency for hard surfaces to increase reverberation, which attenuates signals (Phillips et al., 2020). These findings support the acoustic adaptation hypothesis (AAH), as songs with narrower bandwidths may transmit better in urban areas. The AAH states that signals are endowed with optimal characteristics for transmission to overcome environmental constraints (Morton, 1975; Endler, 1992). With an expanded sample size, we found that gray catbirds sang with a higher maximum frequency as noise level increased, but that frequency bandwidth only marginally differed. Even though urban catbirds have higher minimum song frequencies, it appears that there is compensation through higher maximum frequencies as well, resulting in a similar or slightly higher bandwidth. This compensation may be a result of sexual selection acting on male body size in these urban populations (Ryder et al., 2012). Males singing at higher minimum frequencies may be less appealing to females. However, through increasing maximum frequency, urban males are able to maintain a similar bandwidth, which has been shown to be attractive to females in other bird species (e.g., Ballentine et al., 2004).
Unlike previous studies on gray catbirds, we also measured entropy and phrase rate across an urban-to-rural gradient. We found no effects on phrase rate of element durations per bout durations. From our observations in the field, catbirds appear to sing longer and with a more rapid delivery of elements either early in the season, between nesting bouts, or in aggressive encounters (DLM pers. obs), but we do not have data to quantitatively assess this observation. Dolby et al. (2005) found phrase rate predicted feeding rates of nestlings, and thus phrase rate may indicate paternal quality to females. Average entropy was not predicted by noise level but was significantly higher in habitats with greater canopy cover. Notably, canopy cover did not change evenly across our urban gradient as rural farm sites had very low canopy cover and some very urban parks (Rock Creek Nat. Park in DC) had higher canopy cover especially at close radius distances from site centroids. The result of higher entropy with increasing canopy cover indicates that catbirds in more forested areas sing with less tonality and more disorder across a wider frequency range. Perhaps the high entropy in the songs of catbirds in more forested sites could be influenced by mimicry of forest heterospecifics (i.e., greater species and song diversity). Generally, entropy can potentially indicate vocal function, the effects of habitual conditions, and cognitive or song complexity of individuals (Briefer et al., 2010). For instance, song entropy decreases between early and late developmental periods of zebra finches, Taeniopygia guttata (Saar et al., 2008). Contrastingly, higher entropy has been associated with the trills of java sparrows that are signaled during aggressive encounters (Furutani et al., 2018). Call entropy of female vermilion flycatchers, Pyrocephalus obscurus, is significantly greater than call entropy of males, and potentially functions as a method for sex differentiation (Ríos-Chelén et al., 2020). For gray catbirds, a future direction would be to assess entropy across age or in the context of song repertoire and mimicry.
Further study of gray catbird song and what factors impact structural song differences is warranted to better understand what aspects of their invented, improvised, or imitated song repertoire differ. As vocal mimics, gray catbirds are unique in their ability to copy the sounds of other species; future studies could investigate interplay of urbanization, noise, and the incidence of song mimicry. It is well-established that many bird species in urban environments sing with a higher minimum frequency than rural birds, but the impact on female choice (Halfwerk et al., 2011) or mating success has received considerably less attention. Additionally, the effect of these song differences on reproductive success in urban catbirds is unknown. While shifting song minimum frequency may assist in signal transmission, certain aspects that make song attractive to females may be negatively impacted (e.g., Halfwerk et al., 2011). For example, lower frequency vocalizations are correlated with larger body size, which may mean that urban males are perceived as smaller and less threatening by rural males and may be less appealing to females. A study conducted by Francis et al. (2011) suggested that masking of lower-frequency signals, which are associated with higher quality males, may result in maladaptive mating decisions made by females. Alternatively for gray catbirds, if males are able to exhibit immediate flexibility in their songs, large-bodied males could potentially shift song frequency in real time to better transmit their signal acoustically, but still gain benefits through visual assessment for body size at close range by females. Since our results show that urban males do sing with higher minimum, peak, and maximum frequencies, there may be increased sexual selection for other traits such as body size as found by Ryder et al. (2012).
Examining the impacts of urbanization on birds is vital from a conservation perspective, as populations have decreased by 29% since 1970, resulting in a net loss of approximately 3 billion individuals (Rosenberg et al., 2019). Urbanization and its consequences, such as increased traffic noise and large-scale artificial surfaces, influence the vocalizations and behavior of multiple bird species (e.g., Halfwerk and Slabbekoorn, 2009; Nemeth and Brumm, 2009; Hu and Cardoso, 2010; Bermúdez-Cuamatzin et al., 2011). Determining how increased urbanization affects avian communication, reproductive success, and behavior is essential to future conservation efforts of vulnerable songbird species as well as understanding how humans influence the natural world.
The raw data supporting the conclusions of this article will be made available by the authors, without undue reservation.
The animal study was approved by James Madison University Institute of Animal Care and Use Committee Smithsonian Migratory Bird Center IACUC Bird Banding Lab. The study was conducted in accordance with the local legislation and institutional requirements.
DM and MR designed the hypotheses and song sampling techniques. DM, TR, and BE designed the study in terms of the urban gradient and choosing sites in Washington, DC and DM chose sites in Virginia. DM, MR, JT, CW, and field technicians made song recordings, MR, JT, LO, EN, CW, and DM processed song recordings. BE computed the geospatial metrics, managed banding data, and contributed code for model selection. MR and DM performed statistical analyses and led the writing, while all authors contributed to revising versions of the manuscript.
The author(s) declare financial support was received for the research, authorship, and/or publication of this article. We thank our funding sources from 4-VA of James Madison University, JMU Biology Department and College of Science and Math, Washington Biologists’ Field Club, Smithsonian National Zoological Park and Migratory Bird Center, as well as student support from Elizabeth M. Bliss scholarship to CW.
We are grateful to the catbird field technicians including K. Ebert, G.R. DiPetto, A. Huysman, D.L. Aube, K. McGee, R. Carrasco, F. Commercon, and to Moseley Lab students for song processing. For access to field sites, we thank Bibb and Dolly Frasier, Charles Ziegenfus, Harrisonburg City Parks, Smithsonian Institution, Montgomery County Parks, GWTJ National Forest, Rock Creek National Park and Dumbarton Oaks staff. We thank Rocky Parker for comments on MLR’s master’s thesis and on EN’s honors thesis, and Peter Marra for advice on the project. Thank you to Ben Zipperer for advice on data wrangling in R.
The authors declare that the research was conducted in the absence of any commercial or financial relationships that could be construed as a potential conflict of interest.
All claims expressed in this article are solely those of the authors and do not necessarily represent those of their affiliated organizations, or those of the publisher, the editors and the reviewers. Any product that may be evaluated in this article, or claim that may be made by its manufacturer, is not guaranteed or endorsed by the publisher.
The Supplementary Material for this article can be found online at: https://www.frontiersin.org/articles/10.3389/fevo.2023.1252632/full#supplementary-material
Anderson D. (2008). Model based inference in the life sciences: a primer on evidence Vol. 31 (New York: Springer).
Anderson D., Burnham K. (2004). Model selection and multi-model inference Vol. 63 (Second. NY: Springer-Verlag), 10.
Ballentine B., Hyman J., Nowicki S. (2004). Vocal performance influences female response to male bird song: An experimental test. Behav. Ecol. 15, 163–168. doi: 10.1093/beheco/arg090
Balogh A. L., Ryder T. B., Marra P. P. (2011). Population demography of Gray Catbirds in the suburban matrix: Sources, sinks and domestic cats. J. Ornithol. 152, 717–726. doi: 10.1007/s10336-011-0648-7
Barber J. R., Crooks K. R., Fristrup K. M. (2010). The costs of chronic noise exposure for terrestrial organisms. Trends Ecol. Evol. 25, 180–189. doi: 10.1016/j.tree.2009.08.002
Bates D., Martin M., Bolker B., Walker S. (2015). Fitting linear mixed-effects models using lme4. J. Stat. Software 67 (1), 1–48. doi: 10.18637/jss.v067.i01
Bermúdez-Cuamatzin E., Ríos-Chelén A. A., Gil D., Garcia C. M. (2011). Experimental evidence for real-time song frequency shift in response to urban noise in a passerine bird. Biol. Lett. 7, 36–38. doi: 10.1098/rsbl.2010.0437
Blair H. B., Merchant N. D., Friedlaender A. S., Wiley D. N., Parks S. E. (2016). Evidence for ship noise impacts on humpback whale foraging behaviour. Biol. Lett. 12. doi: 10.1098/rsbl.2016.0005
Bolker B., Robinson D. (2022) broom.mixed: tidying methods for mixed models. Available at: https://CRAN.R-project.org/package=broom.mixe.
Briefer E., Osiejuk T. S., Rybak F., Aubin T. (2010). Are bird song complexity and song sharing shaped by habitat structure? An information theory and statistical approach. J. Theor. Biol. 262 (1), 151–164. doi: 10.1016/j.jtbi.2009.09.020
Brumm H. (2004). The impact of environmental noise on song amplitude in a territorial bird. J. Anim. Ecol. 73, 434–440. doi: 10.1111/j.0021-8790.2004.00814.x
Brumm H., Slabbekoorn H. (2005). Acoustic communication in noise. Adv. Study Behav. 35, 151–209. doi: 10.1016/S0065-3454(05)35004-2
Brumm H., Todt D. (2002). Noise-dependent song amplitude regulation in a territorial songbird. Anim. Behav. 63, 891–897. doi: 10.1006/anbe.2001.1968
Brumm H., Zollinger S. A. (2013). Avian vocal production in noise. Anim. communication noise 2, 187–227. doi: 10.1007/978-3-642-41494-7_7
Brumm H., Zollinger S. A., Niemelä P. T., Sprau P. (2017). Measurement artefacts lead to false positives in the study of birdsong in noise. Methods Ecol. Evol. 8 (11), 1617–1625. doi: 10.1111/2041-210X.12766
Buckstaff K. C. (2004). Effects of watercraft noise on the acoustic behavior of bottlenose dolphins , tursiops truncatus, in Sarastota Bay, Florida. Mar. Mammal Sci. 20, 709–725. doi: 10.1111/j.1748-7692.2004.tb01189.x
Cade B. S. (2015). Model averaging and muddled multimodel inferences. Ecology 96 (9), 2370–2382. doi: 10.1890/14-1639.1
Cynx J., Lewis R., Tavel B., Tse H. (1998). Amplitude regulation of vocalizations in noise by a songbird, Taeniopygia guttata. Anim. Behav. 56, 107–113. doi: 10.1006/anbe.1998.0746
Deoniziak K., Osiejuk T. S. (2019). Habitat-related differences in song structure and complexity in a songbird with a large repertoire. BMC Ecol. 19, 1–11. doi: 10.1186/s12898-019-0255-7
Derryberry E. P., Gentry K., Derryberry G. E., Phillips J. N., Danner R. M., Luther D. A. (2017). White-crowned sparrow males show immediate flexibility in song amplitude but not in song minimum frequency in response to changes in noise levels in the field. Ecol. Evol. 7, 4991–5001. doi: 10.1002/ece3.3037
Dolby A. S., Clarkson C. E., Haas E. T., Miller J. K., Havens L. E., Cox B. K. (2005). Do song-phrase production rate and song versatility honestly communicate male parental quality in the gray catbird? J. Field Ornithology 76 (3), 287–292. doi: 10.1648/0273-8570-76.3.287
Dowling J. L., Luther D. A., Marra P. P. (2011). Comparative effects of urban development and anthropogenic noise on bird songs. Behav. Ecol. 23, 201–209. doi: 10.1093/beheco/arr176
Endler J. (1992). Signals, signal conditions, and the direction of evolution. Am. Nat. 139, 125–153. doi: 10.1086/285308
Evans K. L., Chamberlain D. E., Hatchwell B. J., Gregory R. D., Gaston K. J. (2011). What makes an urban bird? Global Change Biol. 17 (1), 32–44. doi: 10.1111/j.1365-2486.2010.02247.x
Evans B. S., Reitsma R., Hurlbert A. H., Marra P. P. (2018). Environmental filtering of avian communities along a rural-to-urban gradient in Greater Washington, D.C., USA. Ecosphere 9. doi: 10.1002/ecs2.2402
Evans B. S., Ryder T. B., Reitsma R., Hurlbert A. H., Marra P. P. (2015). Characterizing avian survival along a rural-to-urban land use gradient. Ecology 96, 1631–1640. doi: 10.1890/14-0171.1
Fletcher L. E., Smith D. G. (1978). Some parameters of song important in conspecific recognition by gray catbirds. Auk 95 (2), 338–347. doi: 10.1093/auk/95.2.338
Francis C. D., Ortega C. P., Cruz A. (2011). Noise pollution filters bird communities based on vocal frequency. PloS One 6 (11). doi: 10.1371/journal.pone.0027052
Furutani A., Mori C., Okanoya K. (2018). Trill-calls in Java sparrows: Repetition rate determines the category of acoustically similar calls in different behavioral contexts. Behav. Processes 157, 68–72. doi: 10.1016/j.beproc.2018.08.010
Gentry K. E., Derryberry E. P., Danner R. M., Danner J. E., Luther D. A. (2017). Immediate signaling flexibility in response to experimental noise in urban, but not rural, white-crowned sparrows. Ecosphere 8. doi: 10.1002/ecs2.1916
Gough D. C., Mennill D. J., Nol E. (2014). Singing seaside: Pacific Wrens (Troglodytes pacificus) change their songs in the presence of natural and anthropogenic noise. Wilson J. Ornithology 126 (2), 269–278. doi: 10.1676/13-088.1
Grenat P. R., Pollo F. E., Ferrero M. A., Martino A. L. (2019). Differential and additive effects of natural biotic and anthropogenic noise on call properties of Odontophrynus americanus (Anura, Odontophryinidae): Implications for the conservation of anurans inhabiting noisy environments. Ecol. Indic. 99, 67–73. doi: 10.1016/j.ecolind.2018.12.014
Halfwerk W., Bot S., Buikx J., van der Velde M., Komdeur J., ten Cate C., et al. (2011). Low-frequency songs lose their potency in noisy urban conditions. Proc. Natl. Acad. Sci. 108 (35), 14549–14554. doi: 10.1073/pnas.1109091108
Halfwerk W., Slabbekoorn H. (2009). A behavioural mechanism explaining noise-dependent frequency use in urban birdsong. Anim. Behav. 78, 1301–1307. doi: 10.1016/j.anbehav.2009.09.015
Hijmas R. (2019) raster: geographic data analysis and modeling. Available at: https://CRAN.R-project.org/package=raster.
Homer C., Dewitz J., Jin S., Xian G., Costello C., Danielson P., et al. (2020). Conterminous United States land cover change patterns 2001–2016 from the 2016 National Land Cover Database. ISPRS J. Photogramm. Remote Sens. 162, 184–199. doi: 10.1016/j.isprsjprs.2020.02.019
Hu Y., Cardoso G. C. (2010). Which birds adjust the frequency of vocalizations in urban noise? Anim. Behav. 79, 863–867. doi: 10.1016/j.anbehav.2009.12.036
Jiang T., Guo X., Lin A., Wu H., Sun C., Feng J., et al. (2019). Bats increase vocal amplitude and decrease vocal complexity to mitigate noise interference during social communication. Anim. Cogn. 22, 199–212. doi: 10.1007/s10071-018-01235-0
Kroodsma D. E., Houlihan P. W., Fallon P. A., Wells J. A. (1997). Song development by grey catbirds. Anim. Behav. 54 (2), 457–464. doi: 10.1006/anbe.1996.0387
Lüdecke D. (2018). sjmisc: data and variable transformation functions. J. Open Source Software 3 (26), 754. doi: 10.21105/joss.00754
Lüdecke D. (2022). sjstats: statistical functions for regression models (Version 0.18.2). doi: 10.5281/zenodo.1284472
Lüdecke D. (2023) sjPlot: data visualization for statistics in social science. Available at: https://CRAN.R-project.org/package=sjPlot.
Luther D. A., Derryberry E. P. (2012). Birdsongs keep pace with city life: changes in song over time in an urban songbird affects communication. Anim. Behav. 83 (4), 1059–1066. doi: 10.1016/j.anbehav.2012.01.034
Mazerolle M. J. (2023) AICcmodavg: Model selection and multimodel inference based on (Q)AIC(c). Available at: https://cran.r-project.org/package=AICcmodavg.
Melcón M. L., Cummins A. J., Kerosky S. M., Roche L. K., Wiggins S. M., Hildebrand J. A. (2012). Blue Whales Respond to Anthropogenic Noise. PloS One 7, 1–6. doi: 10.1371/journal.pone.0032681
Morton E. S. (1975). Ecological sources of selection on avian sounds. Am. Nat. 109, 17–34. doi: 10.1086/282971
Moseley D. L., Derryberry G. E., Phillips J. N., Danner J. E., Danner R. M., Luther D. A., et al. (2018). Acoustic adaptation to city noise through vocal learning by a songbird. Proc. R. Soc. B 285 (1888), 20181356. doi: 10.1098/rspb.2018.1356
Naquib M. (2003). Reverberation of rapid and slow trills: Implications for signal adaptations to long-range communication. J. Acoust. Soc Am. 113, 1749–1756. doi: 10.1121/1.1539050
Nemeth E., Brumm H. (2009). Blackbirds sing higher-pitched songs in cities: adaptation to habitat acoustics or side-effect of urbanization? Anim. Behav. 78, 637–641. doi: 10.1016/j.anbehav.2009.06.016
Nemeth E., Brumm H. (2010). Birds and anthropogenic noise: are urban songs adaptive? Am. Nat. 176 (4), 465–475. doi: 10.1086/656275
Pharr L. D., Cooper C. B., Evans B., Moorman C. E., Voss M. A., Vukomanovic J., et al. (2023). Using citizen science data to investigate annual survival rates of resident birds in relation to noise and light pollution. Urban Ecosyst. doi: 10.1007/s11252-023-01403-2
Phillips J. N., Rochefort C., Lipshutz S., Derryberry G. E., Luther D., Derryberry E. P. (2020). Increased attenuation and reverberation are associated with lower maximum frequencies and narrow bandwidth of bird songs in cities. J. Ornithol 161, 593–608. doi: 10.1007/s10336-020-01751-2
Quinn G. P., Keough M. J. (2002). Experimental design and data analysis for biologists (New York, NY, USA: Cambridge university press).
R Core Team (2019). R: A language and environment for statistical computing (Vienna, Austria: R Foundation for Statistical Computing). Available at: https://www.R-project.org/.
Richards D. G., Wiley R. H. (1980). Reverberations and amplitude fluctuations in the propagation of sound in a forest: implications for animal communication. Am. Nat. 115 (3), 381–399. doi: 10.1086/283568
Ríos-Chelén A. A., Díaz-Lezama X., Montoya B. (2020). Acoustic differentiation in a sub-oscine calls: females call with more entropy than males. J. Ornithology 161, 429–437. doi: 10.1007/s10336-019-01740-0
Ríos-Chelén A. A., Lee G. C., Patricelli G. L. (2016). A comparison between two ways to measure minimum frequency and an experimental test of vocal plasticity in red-winged blackbirds in response to noise. Behaviour 153 (12), 1445–1472. doi: 10.1163/1568539X-00003390
Rosenberg K. V., Dokter A. M., Blancher P. J., Sauer J. R., Smith A. C., Smith P. A., et al. (2019). Decline of the North American Avifauna. Science 366, 120–124. doi: 10.1126/science.aaw1313
Ryder T. B., Fleischer R. C., Shriver W. G., Marra P. P. (2012). The ecological–evolutionary interplay: density-dependent sexual selection in a migratory songbird. Ecol. Evol. 2 (5), 976–987. doi: 10.1002/ece3.254
Ryder T. B., Reitsma R., Evans B., Marra P. P. (2010). Quantifying avian nest survival along an urbanization gradient using citizen- and scientist-generated data. Ecol. Appl. 20, 419–426. doi: 10.1890/09-0040.1
Saar S., Mitra P. P., Deregnaucourt S., Tchernichovski O. (2008). “Developmental song learning in the zebra finch” in Neuroscience of birdsong. Eds. Zeigler H. P., Marler P. (Cambridge, UK: Cambridge University Press), 217–227.
Shannon G., McKenna M. F., Angeloni L. M., Crooks K. R., Fristrup K. M., Brown E., et al. (2016). A synthesis of two decades of research documenting the effects of noise on wildlife. Biol. Rev. 91 (4), 982–1005. doi: 10.1111/brv.12207
Slabbekoorn H. (2013). Songs of the city: noise-dependent spectral plasticity in the acoustic phenotype of urban birds. Anim. Behav. 85 (5), 1089–1099. doi: 10.1016/j.anbehav.2013.01.021
Slabbekoorn H., den Boer-Visser A. (2006). Cities change the songs of birds. Curr. Biol. 16, 2326–2331. doi: 10.1016/j.cub.2006.10.008
Slabbekoorn H., Peet M. (2003). Birds sing at a higher pitch in urban noise. Nature 424, 267. doi: 10.1038/424267a
Slabbekoorn H., Ripmeester E. A. P. (2008). Birdsong and anthropogenic noise: Implications and applications for conservation. Mol. Ecol. 17, 72–83. doi: 10.1111/j.1365-294X.2007.03487.x
Slabbekoorn H., Yeh P., Hunt K. (2007). Sound transmission and song divergence: a comparison of urban and forest acoustics. Condor 109, 67. doi: 10.1650/0010-5422(2007)109[67:stasda]2.0.co;2
Swaddle J. P., Francis C. D., Barber J. R., Cooper C. B., Kyba C. C. M., Dominoni D. M., et al. (2015). A framework to assess evolutionary responses to anthropogenic light and sound. Trends Ecol. Evol. 30, 550–560. doi: 10.1016/j.tree.2015.06.009
VDGIF. (2020). Special status faunal species in Virginia. Available at: https://www.dgif.virginia.gov/wp-content/uploads/virginia-threatened-endangered-species.pdf.
Walters M. J., Guralnick R. P., Kleist N. J., Robinson S. K. (2019). Urban background noise affects breeding song frequency and syllable-type composition in the Northern Mockingbird. Condor 121 (2), duz002. doi: 10.1093/condor/duz002
Warren P. S., Katti M., Ermann M., Brazel A. (2006). Urban bioacoustics: it's not just noise. Anim. Behav. 71 (3), 491–502. doi: 10.1016/j.anbehav.2005.07.014
Wiley R. H. (2006). Signal detection and animal communication. Adv. Study Behav. 36, 217–247. doi: 10.1016/S0065-3454(06)36005-6
Keywords: anthropogenic noise, birdsong, urban ecology, behavioral adaptation, acoustic communication, human impacts, gray catbird, Dumetella carolinensis
Citation: Rhodes ML, Ryder TB, Evans BS, To JC, Neslund E, Will C, O’Brien LE and Moseley DL (2023) The effects of anthropogenic noise and urban habitats on song structure in a vocal mimic; the gray catbird (Dumetella carolinensis) sings higher frequencies in noisier habitats. Front. Ecol. Evol. 11:1252632. doi: 10.3389/fevo.2023.1252632
Received: 04 July 2023; Accepted: 31 October 2023;
Published: 20 December 2023.
Edited by:
Chris Templeton, Western Washington University, United StatesReviewed by:
Felipe N. Moreno-Gómez, Universidad Católica del Maule, ChileCopyright © 2023 Rhodes, Ryder, Evans, To, Neslund, Will, O’Brien and Moseley. This is an open-access article distributed under the terms of the Creative Commons Attribution License (CC BY). The use, distribution or reproduction in other forums is permitted, provided the original author(s) and the copyright owner(s) are credited and that the original publication in this journal is cited, in accordance with accepted academic practice. No use, distribution or reproduction is permitted which does not comply with these terms.
*Correspondence: Dana L. Moseley, bW9zZWxlZGxAam11LmVkdQ==
†Present address: T. Brandt Ryder, Bird Conservancy of the Rockies, Fort Collins, CO, United States
Disclaimer: All claims expressed in this article are solely those of the authors and do not necessarily represent those of their affiliated organizations, or those of the publisher, the editors and the reviewers. Any product that may be evaluated in this article or claim that may be made by its manufacturer is not guaranteed or endorsed by the publisher.
Research integrity at Frontiers
Learn more about the work of our research integrity team to safeguard the quality of each article we publish.