 Gerald G. Singh
 Zaman Sajid
 Faisal Khan2
 Charles Mather
 Joey R. Bernhardt
95% of researchers rate our articles as excellent or good
Learn more about the work of our research integrity team to safeguard the quality of each article we publish.
Find out more
METHODS article
Front. Ecol. Evol. , 15 September 2023
Sec. Models in Ecology and Evolution
Volume 11 - 2023 | https://doi.org/10.3389/fevo.2023.1249567
This article is part of the Research Topic Modeling the Human Well-being Benefits of Ecosystem Restoration and Management for Environmental Decision Making View all 11 articles
While disaster events are consequential, they are rare. Ecological risk assessment processes tend to estimate risk through an “expected value” lens that focuses on the most probable events, which can drastically underappreciate the importance of rare events. Here, we show that expected value and average risk-based calculations underappreciate disaster events through questionable assumptions about equally weighing high probability low impact events with low probability high impact events, and in modeling probability as a chance among an ensemble of possible futures when many contexts of ecological risk assessment are focused on a single entity over time. We propose an update to ecological risk assessment that is specifically inclusive of disaster risk potential by adopting analytical processes that estimate the maximum hazard or impact that might be experienced in the future, borrowing from the practice of modeling “Value at Risk” in financial risk contexts. We show how this approach can be adopted in a variety of data contexts, including situations where no quantitative data is available and risk assessment is based on expert judgement, which is common for ecological risk assessment. Increased exposure to environmental variation requires assessment tools to better prepare for, mitigate, and respond to disasters.
Many environmental and development disasters such as floods, oil spills, droughts, heatwaves, landslides, and dam breaches have caused tremendous financial losses, displacements of millions of people, and devastated natural ecosystems and species (Frölicher and Laufkötter, 2018; IPCC, 2022a), but were often predicted to be low-risk events (Bull-Kamanga et al., 2003; Garcia et al., 2017; Ide et al., 2020; IPCC, 2021; IPCC, 2022a; IPCC, 2022b). There has been increased attention placed on rare events across disciplines including finance (Beamish and Hasse, 2022), conflict studies (Ide et al., 2020), public health (Mishra, 2020), and environmental management (Garcia et al., 2017). Intellectually, this turn to thinking specifically towards extreme events can be traced in part to ideas of “Black Swans” – unexpected and highly consequential events that disproportionately characterize systems and are very hard to predict – proposed and popularized by Taleb (2007).
Environmental and development disasters are the product of environmental hazards capable of catastrophic impact (whether from the biophysical environment or human activities) and a human or valued natural system that is exposed and vulnerable to the hazard (Aven, 2010; Sajid et al., 2020; IPCC, 2022a). Disaster hazards have highly consequential effects across a range of topics relevant to environmental management and sustainable development including wildlife disease (Beauvais et al., 2019), dam breaches (Jakob et al., 2016), glacial calving and coastal erosion (Overland, 2021), flooding (also due to climate change) and coastal development (Tsoukala et al., 2016), wildfire (Taylor et al., 2013), oil and gas spills (Afenyo et al., 2020; Sajid et al., 2020) and mining (Yang et al., 2021). Indeed, rare events and natural disasters have been recognized as contributing to species declines and extinctions (Penn and Deutsch, 2022), and development disasters (such as oil spills and mine tailings releases) have contributed to environmental devastation and severe social disruption in many contexts (Garcia et al., 2017). Currently, interest in “compound events” (where a combination of processes leads to a significant impact event, like a heatwave combined with a drought event) in climate change studies also recognizes the importance of understanding rare events for risk management (Zscheischler et al., 2018; Gruber et al., 2021). Disasters pose disproportionate risks to ecosystem services, and some studies trying to track impacts on ecosystem services have attempted to pay special attention to disasters as they impact ecosystem services (Singh et al., 2017a; Singh et al., 2020). Conversely, the ability of natural systems to protect against disasters is an ecosystem service, and managing ecosystems as nature-based solutions promises to protect against some disasters (such as floods), but evaluating the efficacy of nature-based solutions often depends on adequately estimating the magnitude of impacts (Kumar et al., 2021). Despite increased attention to disasters and rare events, many formal risk assessment processes neglect these rare, consequential events.
Risk is often defined as the product of the probability of an event and its associated consequences (Aven, 2010). By multiplying consequences by their probability, risk is often calculated as the “expected value” of something unfavorable or harmful occurring. Risk analysis, sometimes referred to as risk assessment, aims to estimate the probabilities of adverse impact events occurrences and the quantification of associated damages. Because risk is inherently future-oriented, risk assessment is an anticipatory tool for planning and is often employed in environmental impact assessment and other tools for environmental protection and sustainability (Bull-Kamanga et al., 2003; Aven, 2010; Mishra, 2020). The expected value risk model is pervasive in environmental management and science, from environmental impact assessments of individual projects to the Intergovernmental Panel on Climate Change (IPCC) (IPCC, 2022a).
Using expected value to model risk in rare events can be misleading (Haimes, 2005; Verma and Verter, 2007; Shaw, 2016; Baillon et al., 2018). This common formulation for risk can equate the risks of two events: one having a large likelihood and low consequence and another with low likelihood and high consequence. Both types of situations are calculated as being equivalently “risky” according to an expected value model, but here we argue that there are important cases where the latter cases require special consideration and tools of analysis.
Existing environmental risk assessment (ERA) techniques and subsequent environmental policies are often based on the hypothesis that “rare events are rare,” dismissing events with low chances as posing little threat. Technically speaking, this assumption indicates that the “tail” of the probability distribution rapidly approaches zero and relatively little weight is given to extreme risks (Farber, 2010). While the expectation of risk based on its probability is low, the consequences can be very influential if the event materializes. For example, the risk of the sudden release of mine tailings waste into the deep sea has a very small chance of occurrence in any single event, but its harmful impacts could last years to centuries, and may be irreversible (Hughes et al., 2015; Miller et al., 2018) – causing significant damage to the environment and ecosystem. Mine tailings release is a repeat exposure problem – which means it is not something that might occur at one point in time during the lifespan of a mine operation (and therefore low probability when spread over time), but rather there is the same probability throughout the lifespan of the mine operation (or greater, if stability decays over time) and thus total probability is higher due to repeated risk of occurrence. While the occurrence probability for tail events is low in any given time, their repeated exposure over a long timescale increases the chances of catastrophic outcomes.
An additional problem with expected value models is that they can provide the appearance that many small risk events are equivalent to a single large one. This idea is promoted in publications to rank and evaluate risk events together, including the IPCC (IPCC, 2012; Roux et al., 2022). However, a single catastrophic event can overwhelm an ecosystem’s ability to recover, while a series of small impacts may be recoverable between events (Garcia et al., 2017; Mishra, 2020). Events with low occurrence probability (fewer chances to occur) but high consequences (catastrophic outcomes) may be of primary interest to environmental management once they occur, but may be classified as “low risk” in anticipatory decision-making (Farber, 2010). While the occurrence probability for tail events is low at any given time, their repeated exposure over a long timescale increases the chances of catastrophic outcomes. Here, we show how expected value models can underappreciate the risk of rare events and propose a framework for ERA that can better account for rare but highly consequential events.
The expected value risk model suffers two issues as they relate to disasters in ERA. The first issue is the fact that the model is symmetric with its treatment of the factors that contribute to a risk “value”. In other words, these models can treat proportionally low consequence yet high probability risks equivalently with proportionally high consequence yet low probability risks. However, as has been noted in the project management literature, high impact events intuitively and analytically should be given greater concern than low impact events (Haimes, 2005). Suppose that a particular risk value “r” has a probability “P” of occurrence and can incur a consequence “C” if it does occur. Using calculations of risk based on the Bernoulli distribution of event probability combined with a consequence, greater risk consequence carries greater variance of risk and therefore a requires a greater contingency to manage it (Williams, 1996). Mathematically this is represented as,
Where “μr” is the mean risk and “σ2r” is the variance of risk. This equation shows that for a constant value of “μr”, larger values of “C” equate to larger variance in risk.
Relatedly, the expected value of risk model neglects the presence of non-linear and “tipping-point” threshold impacts. The literature on climate change and ecosystem management highlights a diverse array of tipping-point examples, whereby, for example, ecosystems can change from one state to another due to some environmental threshold being crossed as a result of an impact, and our certainty about such events tends to be low (Dakos et al., 2019; Martin et al., 2020; Armstrong McKay et al., 2022). Moreover, as a non-linear change results in a qualitatively different ecosystem, the assumption of multiple, small quantitative changes being equivalent to a single large qualitative change is unlikely to hold.
The second issue with the expected value approach in ERA is in the treatment of probability. Probability has different relevance when thinking about the likelihood of an ensemble of cases where a proportion of cases will experience an event at a point in time, versus whether a single system will be exposed to an event over time. In the first case, a rare event is rare, no matter how extreme the consequence of an event is and will affect a small proportion of cases at a given point in time. In the second case, exposure to a rare event is repeated over time, and the probability of facing it over the duration of the lifespan of the system is often different (and far greater) than the probability of an ensemble of cases facing an event. The path dependency of risk (where experiencing an impact can have drastically different consequences if faced at the beginning of a time series versus at the end, or if facing multiple impacts at shorter intervals versus longer) means that evaluating risk by its expected consequence is misleading. Moreover, the impact of disasters is not mediated once they manifest; put another way, in path dependent systems once a consequence is experienced the probability that the consequence may have occurred no longer matters (Hopkins, 2016). The expected value model of risk equates many small but frequent impacts with a single large but infrequent impact, but the two do not express the same concern, especially where the large impact is irreversible. For example, a tailings dam at the Córrego do Feijão iron ore mine near Brumadinho, Brazil burst in 2019, causing a mudslide that killed 232 people. The dam likely failed because of time-dependent decay processes affecting its stability. Prior to collapse, the dam was rated as a small structure with a low risk of high damage, based on short-term monitoring and laboratory experiments which failed to account for long-term decay (Santamarina et al., 2019; Primo et al., 2021). That is, the probability of dam burst increased as time passed, meaning the likelihood of disaster was unappreciated. Perhaps more importantly, once the impact was realized, the “low risk” assessment of disaster and risk management led to distrust in institutions responsible for risk management (Primo et al., 2021).
Research on ecological communities has shown that changes in the variation in some hazards may pose a greater threat than changes in mean hazard effects (such as warming effects) because of exposure to extremes (Vasseur et al., 2014). Many ecological communities also respond non-linearly to hazards and disturbances, so that ecological processes at average conditions are rarely equal to the average ecological processes across a range of conditions (a phenomenon known as Jensen’s inequality, Denny, 2017). Therefore, where ecological systems are more vulnerable to more severe hazards (such as toxicological thresholds and thermal effects), considering the consequence of the average or most likely hazard may underestimate the impact (Denny, 2017; Bernhardt et al., 2018). Social-ecological systems are subject to path-dependence (such as whether a 1 in 200-year rain event occurs before or after the accumulation of toxins in a mine tailings pond designed with retaining walls to withstand a 1 in 100-year rain event), face nonstationary processes contributing to extreme events (where processes change in space and/or time, such as through climate change), and subject to non-linear changes where environments can change qualitatively (not just quantitatively) into new states (Leonard et al., 2014; Dakos et al., 2019). Single events can have radical consequences and one cannot understand the system by assessing just the weighted average of possibilities. Therefore, there is a need to develop a risk assessment framework that could reflect these dynamics.
In economics, expected utility theory has been recently criticized for its treatment of probability. Ole Peters has coined the term “ergodicity economics” to differentiate the use of probability in dynamic contexts, where economic models are interested in understanding consequences for a single person making a series of choices over time, from static contexts where probability is formulated for understanding consequences among an ensemble of people in a given point of time (Peters, 2019). Peters’ critique is inspired by the idea of “ergodicity” from equilibrium statistical mechanics, which is a condition where the state of a particle over time is equivalent to the state of a particle across all possible spaces (Palmer, 1982). This assumption accurately describes the thermodynamic behavior of gases. In economics, Peters calls economic systems ergodic where an object’s time-averaged utility equals the expected value of utility. However, because economic systems rarely have economic agents exposed to all possible states (because path dependencies affect their economic prospects, and the number of possibilities that an economic agent can experience over their life rarely if ever meets the total number of possibilities that could come about), the ergodic condition is rarely if ever met. In situations where the ergodic condition is not met, an expected value model is inadequate because its treatment of probability assumes that an agent will experience all possible states. The lessons from economics can inform ERA because for environmental assessment, individual ecosystem components rarely experience all possible states over time – that is, ecosystem components are often not exposed to all possibilities, partly because a disaster event can permanently change ecosystems before it has experienced all possible events. An expected value model of risk assumes ecosystem components will experience all conditions, and so the expected value of risk is inadequate.
There are criticisms of ergodicity economics, notably that economists have already been able to address utility dynamically (Doctor et al., 2020), though these alternative approaches also highlight the limitations of static expected value models. In addition, other authors have proposed the “dismal theorem” of economics modifying expected value formulations (Weitzman, 2009). Using the dismal theorem, the declining probability of disaster (which declines polynomially) is outstripped by the increasing impact of disaster (which increases exponentially) (Weitzman, 2009). While the technical aspects of the dismal theorem have been challenged for its critiques of standard economic analysis, even the critiques acknowledge the legitimacy of the caution that the dismal theorem raises about the underlying distribution and treatment of extreme risks over time (Nordhaus, 2009). Again, the lessons from economics for ERA is to pay special attention to rare but consequential events.
In science and technology studies, a rich literature is developing on “manufactured risk”, whereby efforts to deepen and extend natural resource development into new frontier zones significantly raise the risk of disasters, especially in variable environments (Knowles, 2012; Fortun et al., 2017). The empirical material for this work involves careful analysis of well-known and documented disasters including the Deepwater Horizon blowout (Watts, 2016), Hurricane Katrina (Frickel and Vincent, 2007; Hilgartner, 2007), the Fukushima nuclear power disaster (Pritchard, 2012) and the Bhopal chemical disaster (Lerner, 2017), amongst many other socio-ecological disasters. These analyses across cases reveal a number of key insights leading to the disaster including the problem of weaker state regulatory systems, the financialization of resource development and intense corporate competition (Watts, 2016; Lerner, 2017). The manufactured risk literature is valuable to ERA in arguing that disasters should not be seen as unexpected or exceptional, but are instead built into new and existing technological systems for resource extraction and development, and are partly a consequence of human decisions and infrastructure (Knowles, 2014).
Climate research is documenting that climate change is creating more variable or extreme environments in many places, which can increase disaster potential (Hallegatte, 2016). For example, extreme ocean events such as marine heatwaves have strongly increased in frequency over the last few decades and are projected to strongly increase under further global warming (Frölicher et al., 2018; Oliver et al., 2018). Critical thresholds for some ecosystems (e.g. kelp forests or coral reefs) will be reached at relatively low levels of future global warming (Collins et al., 2019). In addition, the IPCC AR6 WGII report concluded that widespread, pervasive impacts to people, ecosystems, settlements and infrastructure have resulted from observed increases in the frequency and intensity of climate and weather extremes, including hot extremes, heavy precipitation events and drought and fire weather events (IPCC, 2022a). As a result, millions of people have been exposed to food insecurity and reduced water security, and extreme heat events on land have resulted in human mortality and morbidity.
Climate studies are also increasingly concerned with understanding compound disaster events, and have proposed methods to investigate them. The use of influence diagrams has been proposed to understand the conditional dependencies of risk when they are consequences of compound events (e.g. a heat-drought event: Ridder et al., 2022; or a marine heatwaves-high acidity event in the ocean: Burger et al., 2022), and usually studied in climate disaster contexts (Leonard et al., 2014). In a similar way, influence diagrams can be usefully employed to model the causal (or even statistically associated) processes that lead to extreme events for ERA. Influence diagrams are a generalization of Bayesian networks, and can graphically be used to explore the relationship between variables in a system (Leonard et al., 2014). While climate studies have mostly proposed the study of compound events when considering climate disasters, we propose that the methods can also be used to understand how climate and other stressors contribute to natural and industrial disasters.
In statistics, extreme value theory (EVT) has been widely used to model rare events, especially in natural sciences and engineering (Coles et al., 2001; Ahmad et al., 2019; Owusu-Ansah et al., 2019). EVT has also been used in dealing with rare events problems in ERA, such as air quality analysis (Sharma et al., 2012), flood analysis (Morrison and Smith, 2002) and system reliability studies (Grigoriu and Samorodnitsky, 2014). The focus of EVT is not to study the central tendency (data around the central or mean value) of the data; instead, the focus has been on the tail sides of the probability distribution. EVT aims to approximate mathematical formulations for tail probability using either two or three parameters. Classical EVT represents the probability tail using scale and location parameters, while generalized EVT uses a third exponent parameter (Chryssolouris et al., 1994). Extreme value distribution parameters are estimated assuming that the data’s original distribution is unknown, and that parameter estimation is not performed on the whole population of data but rather the population of the extrema (maximum or minimum) (Lazoglou and Anagnostopoulou, 2017). Therefore EVT quantifies the probabilistic tail behavior (McNeil and Frey, 2000; Fernández, 2003). EVT provides appropriate tools for ERA to quantify extreme risk where expected value models do not.
To explore risk assessment and extreme events, we model a wildlife population at carrying capacity (K=10,000 individuals), under logistic growth dynamics and subject to varying impacts from development. We simulate two scenarios using stochastic model where both growth rate and annual impact on the population are stochastic. In the first scenario, impact magnitude follows a normal distribution, so extreme events have truly negligible probabilities. In the second scenario, extreme events are rare but still plausible (modeled using a fat-tailed Cauchy distribution that includes the rare possibility for catastrophe whereby the full population of 10,000 individuals may die at once). Both scenarios show continuous exposure to impact, but only the second has continuous exposure to potential disasters. According to the expected value of risk, the risk of the development is a mortality of 123 individuals in each scenario, which should easily be offset by the mean implicit birth rate in the model of 0.2 and a starting population of 10,000.
When modeling this expected value using the normal distribution, we indeed show that risk is low (the population maintains a healthy population over 100 years across all 1000 simulations (Figure 1A). However, over 1000 simulations of 100 years of the model, where the population is exposed to the potential for disaster, we find that in approximately 30% of cases the population experiences impacts that reduce it to under 75% of carrying capacity at some time during the 100 years (often taking decades to recover – if the population does fully recover). Of this subset of cases where catastrophes are experienced, approximately 40% of simulations see the population collapse completely (Figure 1B). Within a simulation where catastrophic impacts are realized, the expected value of risk severely underestimates the realized effects. Crucially, a single catastrophic event can counteract years to a century of population growth. In other cases, sequential catastrophic events can collapse a population (that is, multiple sequential years of substantial impact can compound and fully depress the population). The expected value model of risk would neglect the importance of the rare catastrophic event or the sequential, compound event.
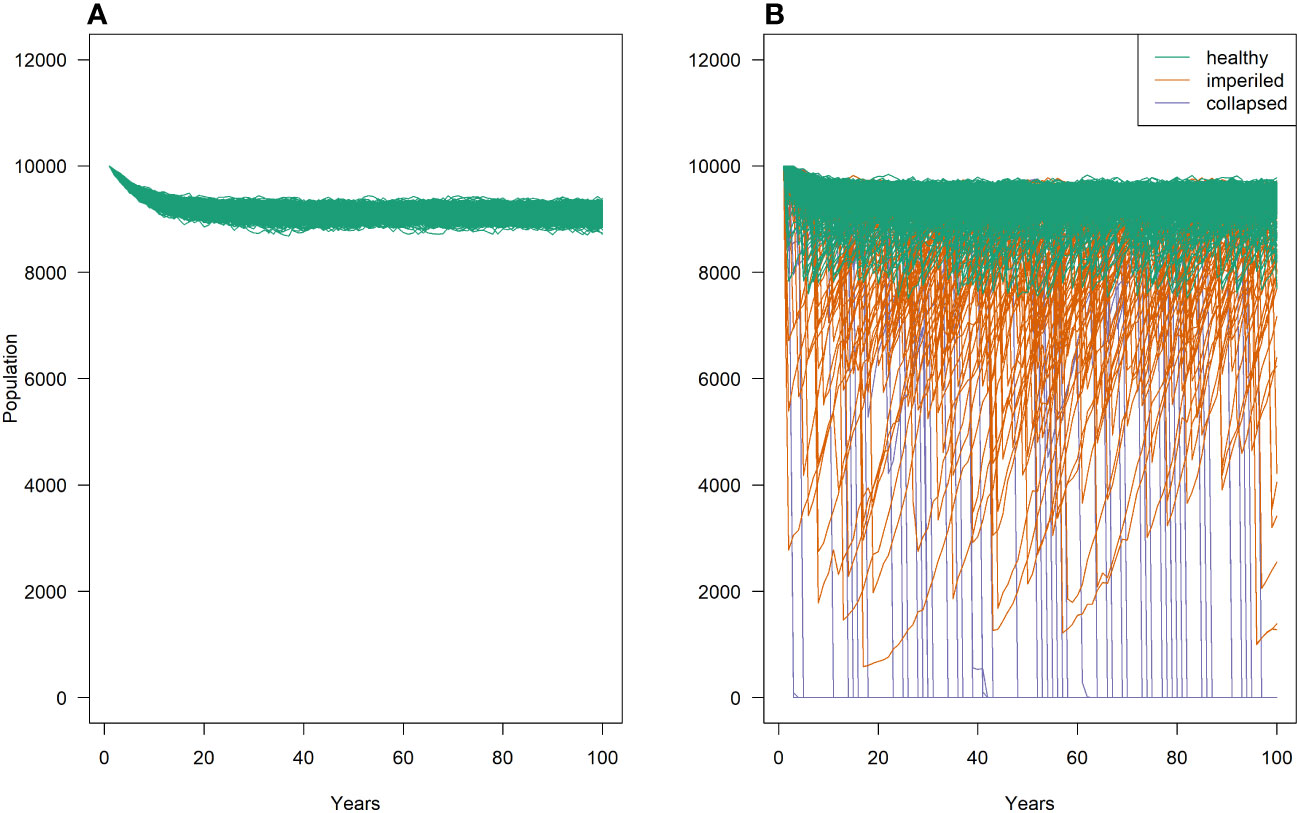
Figure 1 One thousand stochastic simulations of a wildlife population under logistic growth dynamics and facing repeat exposure of catastrophic impacts. An expected value model of risk would estimate risk at 123 individuals per year, which represents approximately 1% of the starting population, which should be offset by the intrinsic growth rate of 20%. Under dynamics where this “expected value” trulv,y represents impacts year to year, the risk of development is indeed low (A). However, simulations allowing for repeat exposure and path dependence where there are low probabilities of catastrophic effects in any given year show that in approximately 30% of cases, the population loses a quarter of its population during the time span, and in 8% of cases, the population collapses (B). In these simulations, “healthy” runs never had the population dip below 75% of the carrying capacity, “imperiled” runs had populations dip below 75% of their carrying capacity at some point during the time span, and “collapsed” runs had the entire population collapse.
To better assess risk that is reflective of the importance of low-probability high-consequence events, we propose a conceptual framework for their inclusion in ERA (Figure 2). The first step in the proposed conceptual framework is identifying and assessing the hazards. This step systematically identifies and assesses the potential sources and the type of harm to the environment. As a core element to define environmental risk problems, this step establishes the scope of the study and specifies what needs to be protected. This step is similar to typical ERA; however, rather than moving immediately to quantifying the expected value of risk from the hazard or identifying what level of risk is most likely, assessment should consider whether hazards include extreme impacts or disasters.
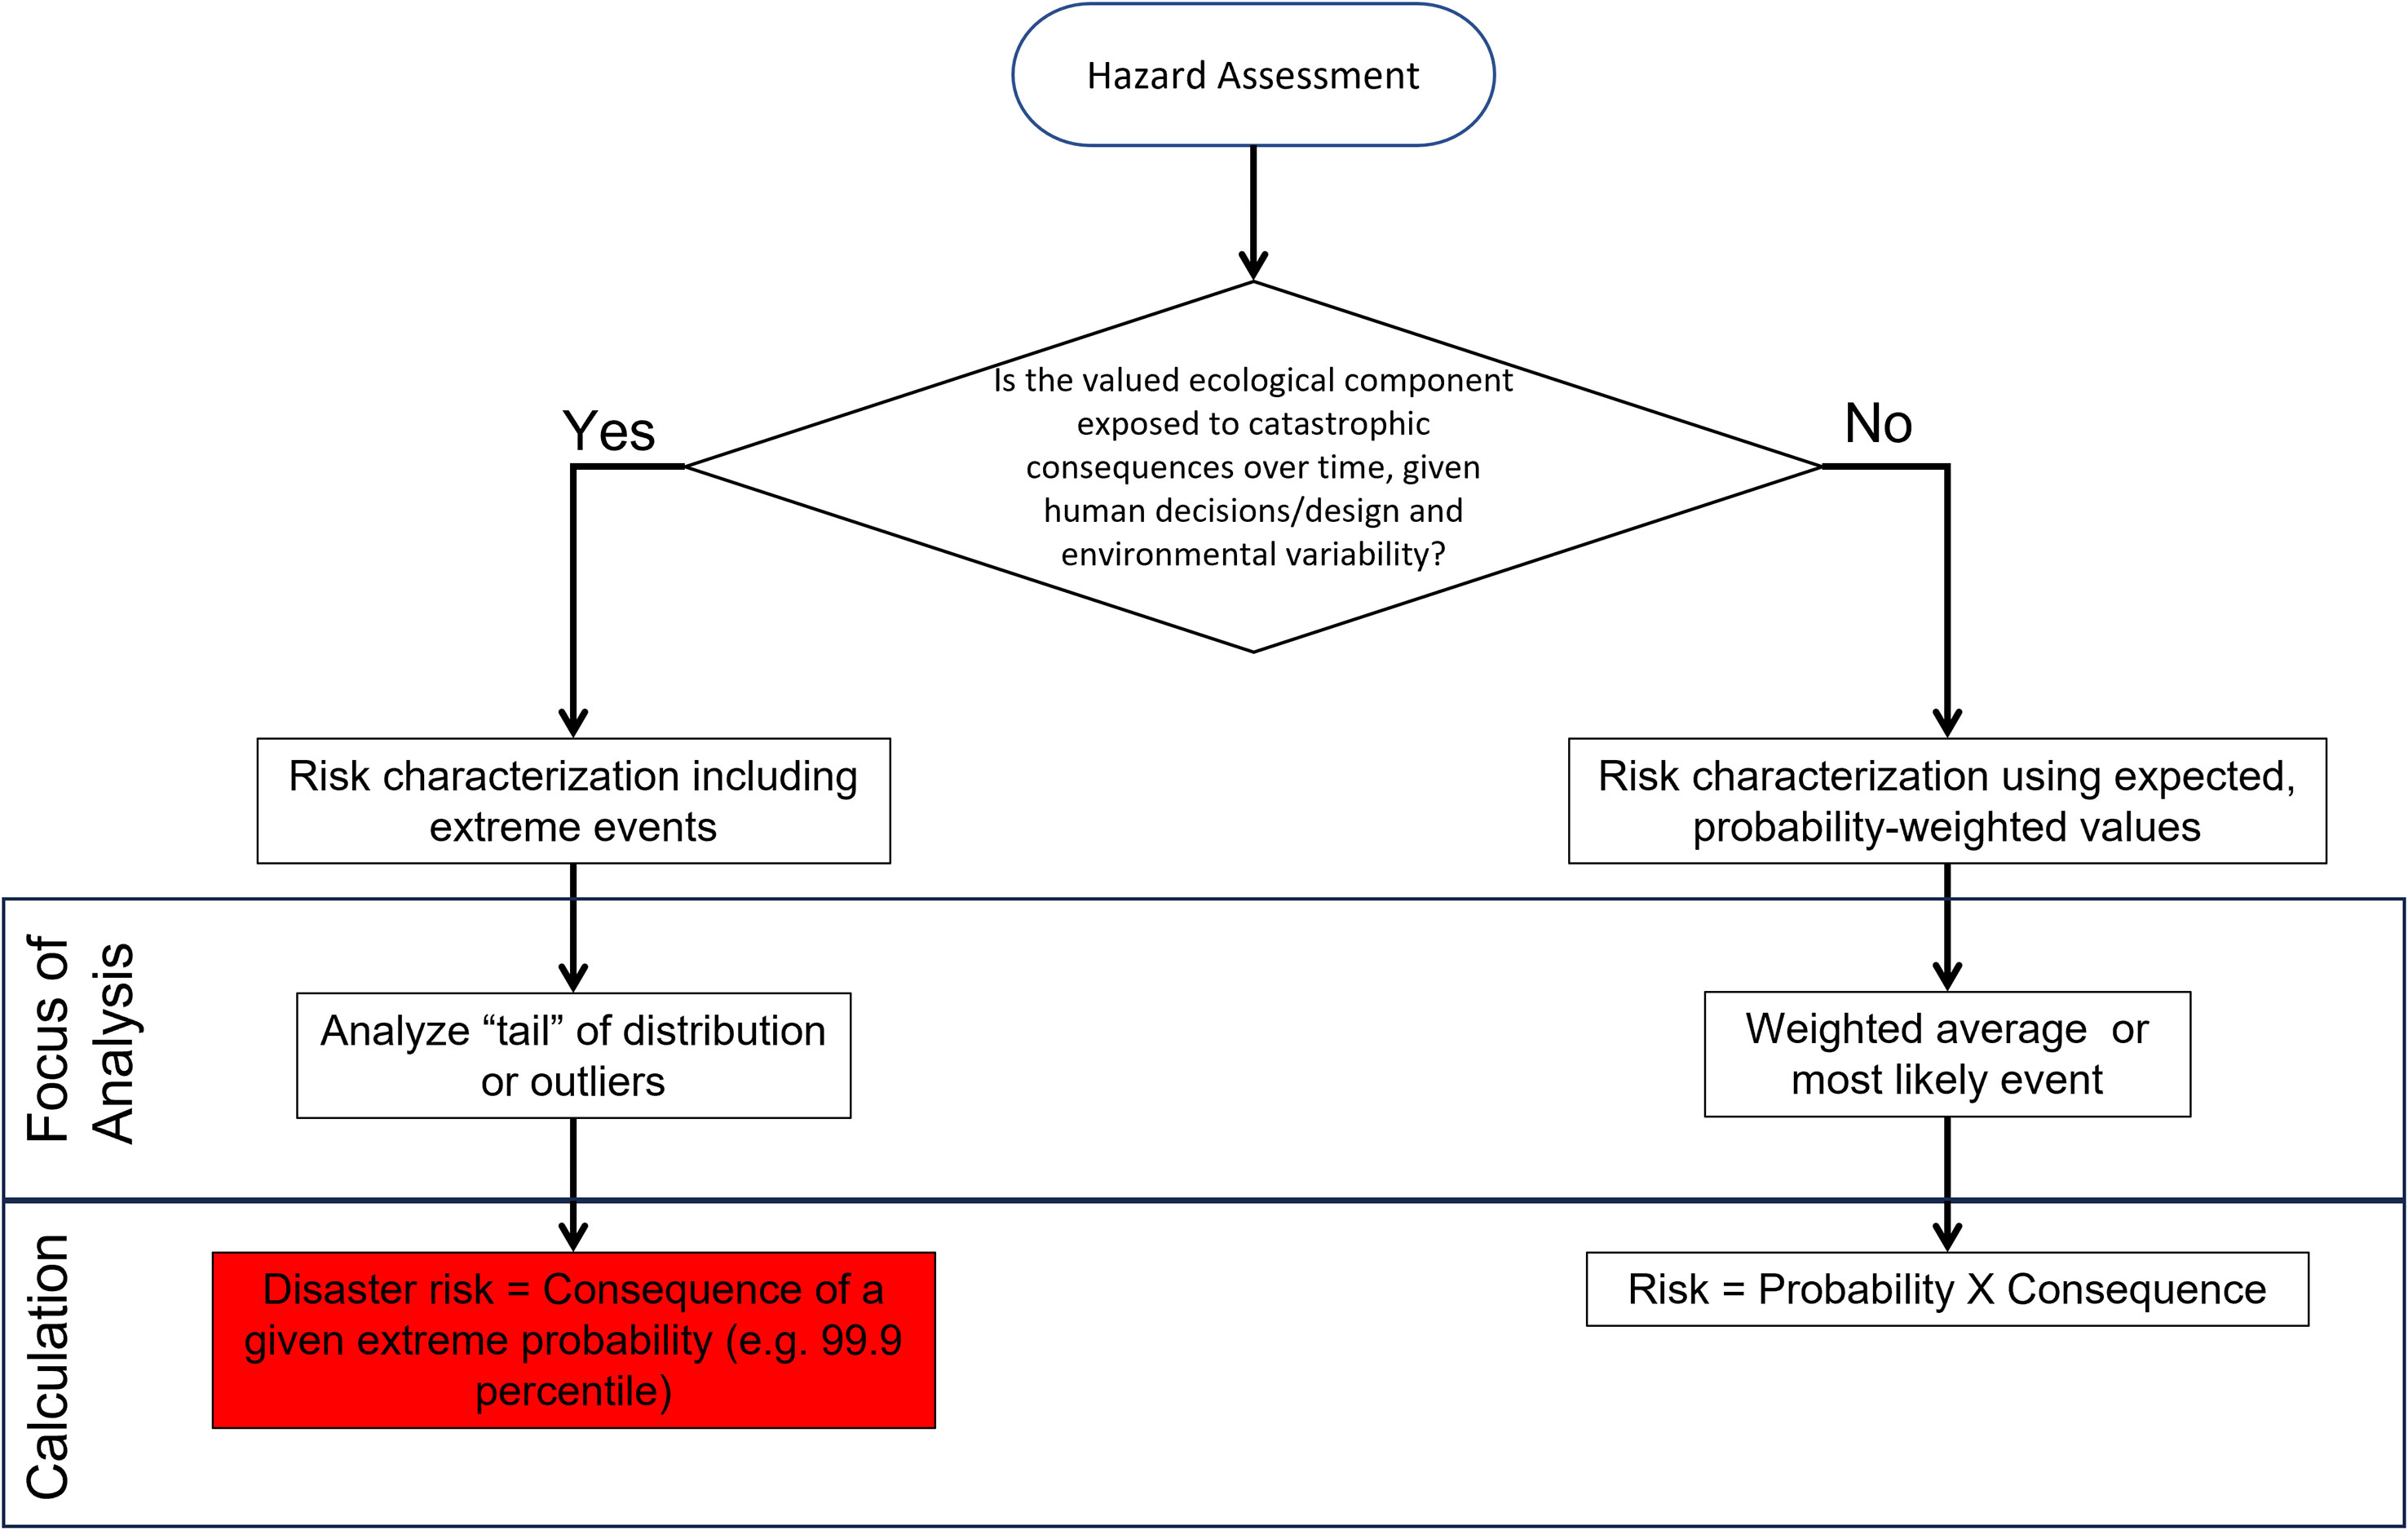
Figure 2 Theoretical framework for environmental risk assessment including disaster potential.
In assessing hazards inclusive of extreme events, we suggest the following criteria. First, there should be a deliberate search for hazards that have catastrophic consequences. Second, if there are hazards that present possibilities for low-probability yet high-consequence impacts, it should be determined if these are events that will only occur once or if environments and communities face repeat or continuous exposure to them. Third, we argue that hazards need to be considered in a larger social-ecological context, including both human decisions that can introduce disaster hazards (such as neglecting maintenance that can increase the chances of oil spills) and environmental variability (especially climatic conditions) that can introduce or increase the probability for disasters.
Our proposal is to use influence diagrams to model a system and explore the human decisions and environmental variables that can introduce or increase the probability of disasters. Where these situations are present, we propose that risk characterization include an explicit quantification of extreme events.
After hazard identification and assessment, risk characterization is the next step. Where extreme events are possible, we propose that risk characterization for that hazard should focus on the extreme value of risk rather than an expected value of risk. Such an approach mirrors the practice of Value at Risk (VaR) used within financial risk to estimate the extent of financial losses to an organization within a specific time period under a given confidence level (Duffie and Pan, 1997). VaR approaches are often used to assess the extent of risk exposure for banks and other lenders toward ventures they fund. We think ERA often operates in an analog case, where government regulators must determine if a development project poses too much risk to the environment and public interest. In both cases, there is an assessment of risk to protect the interests of a benefactor (the lenders or public agency) from potential harm while furthering the interest of a recipient (a business or a developer).
Determining what counts as low-probability high-impact, extreme risks, or disasters is an important consideration (Aven, 2012). While there are no hard rules, there are some substantive criteria around the “consequence” of risk that should be considered, and some analytical tools that can help. First, risk events should be judged in accordance to the severity of their consequence in context, absent of their probability. Risk events that could have catastrophic impacts should be given this special treatment, especially if they are events that communities and ecosystems will be exposed to repeatedly or continuously. As discussed earlier, catastrophic risk can be from natural catastrophic events and it could be a product of manufactured conditions or human decisions.
When identifying high-consequence events, it is important to identify them inclusive of the most likely events, the presence of outliers, and rare events (extreme outliers). The importance of evaluating extreme outliers (even potential ones) in the tail of distributions should not be neglected because failing to include them can lead to a substantial underappreciation of risk (Devore, 2008; Weisent et al., 2014).
While we outline a process to identify extreme risk, any risk assessment should feed into environmental decisions. Identifying the scale of extreme risks can help determine the potential scale of loss that decision-makers will need to be ready for. In contexts where the ERA is used to determine whether and what kinds of development to pursue (such as in Environmental Impact Assessment), extreme risk evaluations can help determine which options pose less disaster risk. In contexts where decision-makers are determining mitigation plans, we warn that repeat exposure problems may mean that efforts to reduce exposure may do less to limit risk than managers intend. In some cases, exposure to disaster can be eliminated (such as if plans allow for vulnerable ecosystem components to be separated from a potential hazard, or if processes that contribute to disaster risk were eliminated), which the influence diagram used in our approach can help determine. However, in cases where exposure to disasters cannot be eliminated, our analysis can instead indicate the scale of impact that managers should prepare post-disaster response measures for.
In this case study, we used a past oil spill example of the Gulf of Mexico (GOM) to showcase and validate the operationalization of the proposed framework. We study the feasibility of using our framework for extreme oil spills by comparing it against an assessment using expected value models of risk. The GOM’s Outer Continental Shelf (OCS) is a major source of oil production in the United States. The Minerals Management Service (MMS) of the United States Department of the Interior was responsible for its operations. The past oil spill database maintained by MMS has been extensively used for statistical analysis to predict the volume of future oil spills in GOM (Us, 2006).
From 1990 to 2005, GOM experienced a series of oil spills (Figure 3 – see Table S1 and Eschenbach et al., 2010 for data). The causes of the oil spills can be categorized as human-caused (which include operational and mechanical failures) and natural disasters (such as hurricanes). Existing models for ERA for oil spills in this duration are often based on using “average” measurements of the oil spill. However, two rare events triggered oil spill disasters within the span of seven years, while the ERA employed predicted such events so rare as to be low risk. As shown in Figure 3 these two rare events caused oil spills much higher than spills due to standard operational and mechanical failures. The first rare event occurred on September 29, 1998, due to Hurricane Georges and caused an oil spill of 8,212 bbl. The second rare event occurred on September 24, 2005, and it was due to Hurricane Rita which caused an oil spill of 8,162 bbl. Both hurricanes caused exceptional damage to oil and gas structures and drove significant ecological losses (Eschenbach et al., 2010). Hurricane Rita damaged 103 platforms and extensively damaged 33 drilling rigs and is known as the 4th most intense Atlantic hurricane in history.
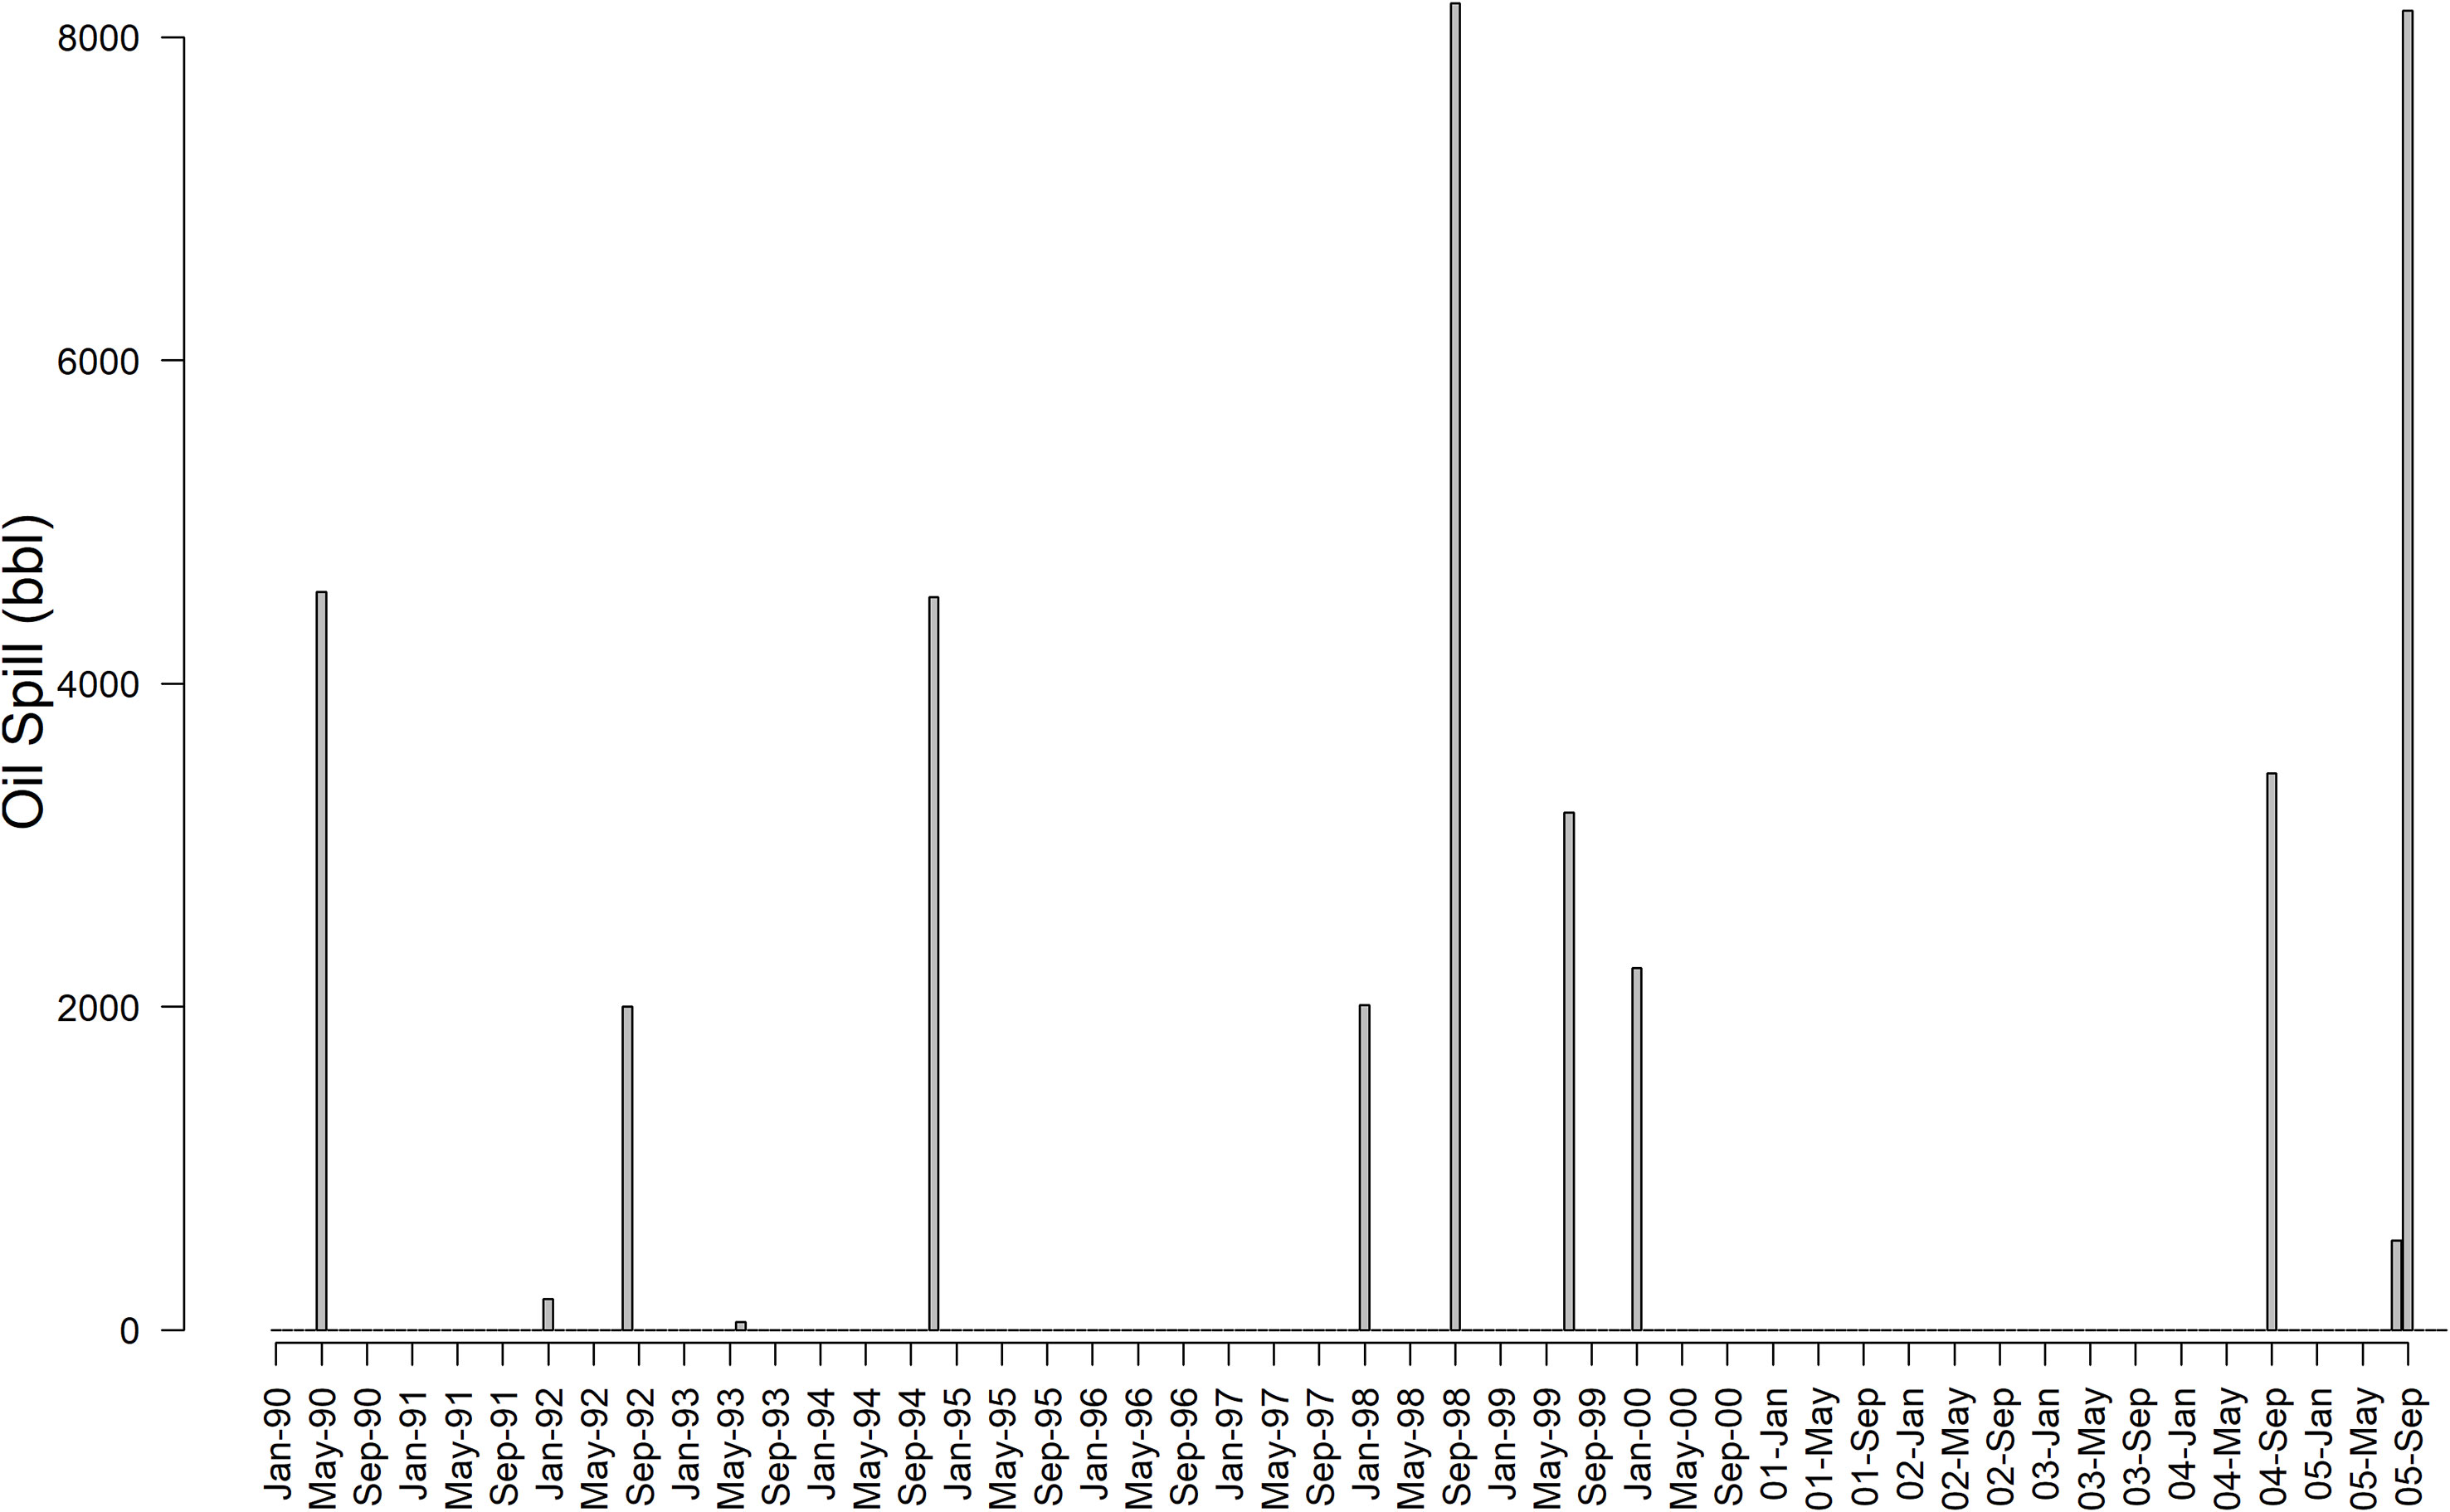
Figure 3 Gulf of Mexico 15 years Pipeline Oil Spills from May 1990 to September 2005.
To compare the efficacy of our proposed approach to quantify the risk of extreme events compared to an approach fitting an expected value model, we first note that our hazard identification shows climate change as increasing the probability of oil spills, triggering our risk characterization to quantify extreme events (Figure 4). We performed our analysis on the oil spill data by excluding the September 24, 2005, event (the extreme spill of 8,162 bbl) and then used it to validate our analysis. First, we quantified the expected value of spills, as the weighted sum of the products of probability and magnitudes of spills of given sizes. Mathematically,
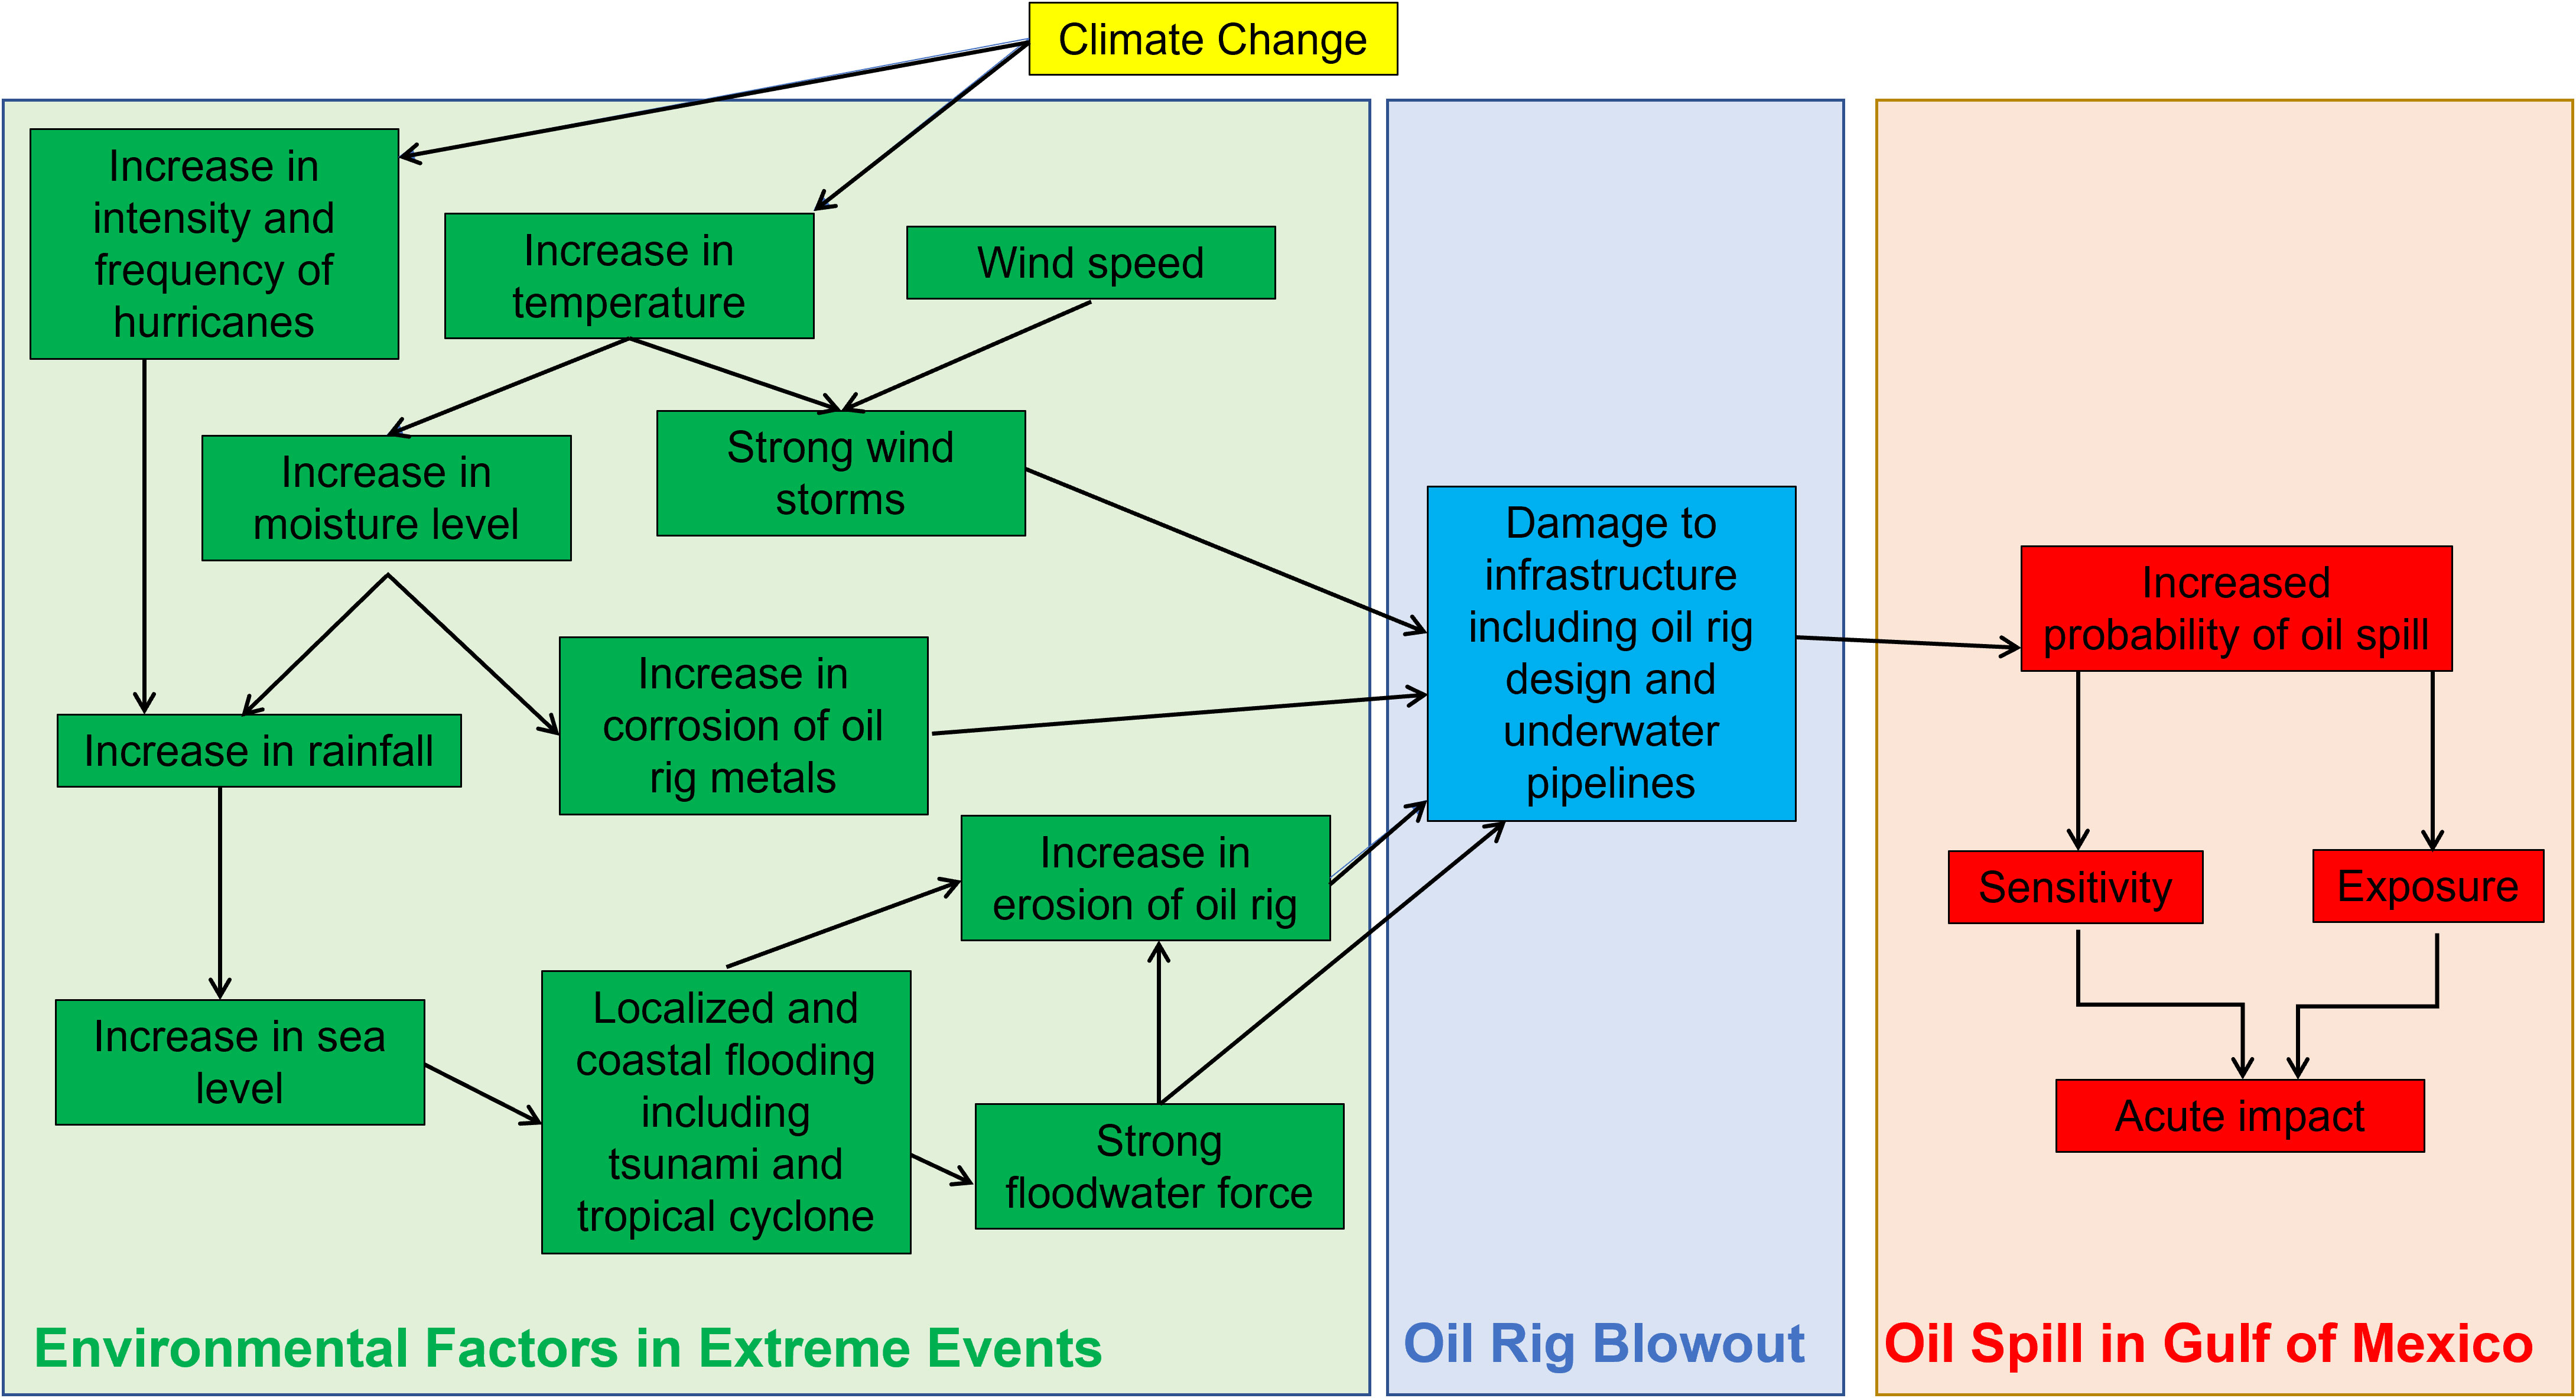
Figure 4 Influence diagram of the risk factors contributing to oil spill risk. Climate change is understood to increase spill risk and spill magnitude (based on Eschenbach et al., 2010).
where xi indicates the value of the random variable (spill size) and P(xi) is the probability of the random variable occurrence. For comparability across approaches, we fit the same distribution to the data in each case. We fit a Weibull distribution to the data (a flexible continuous probability distribution that can accommodate many datasets, including non-negative skewed data, and which we determined to fit the data better than other probability distributions). focused on extreme events). We calculated the expected value of a spill risk to be 2730 bbl of oil. In fact, calculating the product of spill magnitude by probability (the expected value), a spill of 2766 bbl contributes the most risk to the expected value calculation, and is weighted 2.4 times the risk of the extreme spill of 8162 bbl.
To compare these results with an analysis inclusive of catastrophic risks, we estimate the extreme value of spills from the oil spill data. Our results show that at a 99 percent confidence level, an oil spill can be 12803 bbl or more. In fact, even excluding both historic extreme spills (1998, 2005), the 99 percent confidence level of how big an oil spill could be 9398 bbl (Figure 5). These results adequately capture the experienced extreme oil spills, including the 2005 spill of 8,162 bbl. Hence, comparing the results using the expected value of risk against our proposed framework of including extreme events supports our argument that tail risk assessment captures or comes closer to the size of a near actual oil spill and the predictions of the disasters should not be solely based on weighing the consequences and their probabilities. Therefore, tail risk assessment is more reflective of the reality than using the expected value for rare events. The inclusion of tail risk assessment in assessing oil spill risk could have helped the company to estimate potential oil spills due to rare events such as that of September 24, 2005, event.
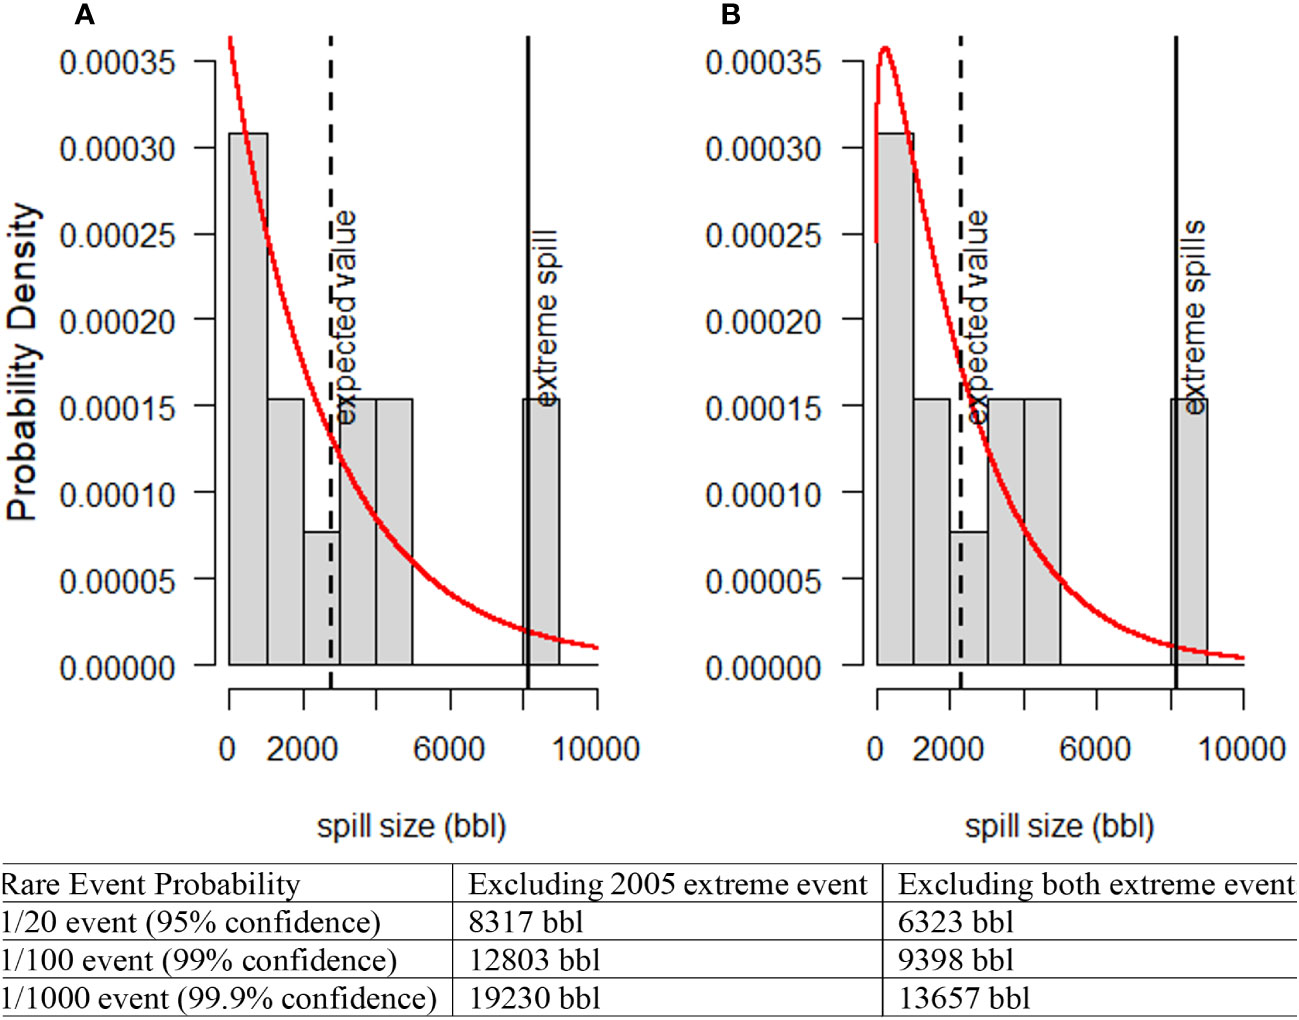
Figure 5 Histograms of the historic oil spills in the Gulf of Mexico. Red curves represent fitted Weibull distributions for a case where the 2005 extreme spill is excluded from the model fit (A), and where both extreme spills from 1998 and 2005 are excluded from the model fit (B). Broken vertical lines show the expected value of risk given the model fit in each case, and the solid vertical lines show the extreme spills of 1998 and 2005. The table below shows the modeled rare events given different levels of confidence for each modeled distribution, showing that a focus on the tails of the distribution rather than the most probable better predicts the extreme spills experienced.
Risk communicators could take this analysis to decision-makers as “worst-case” scenarios that should be prepared for. Given that climate impacts (through storm events) could increase the chances for large-scale spills, and these impacts may be hard or impossible to fully mitigate, disaster response planning may be a more responsible decision than a mitigation plan focused on reducing the probability of disaster (especially where the disaster cannot be fully avoided). This analysis could help inform decisions regarding disaster response – it could allow the MMS to prepare to respond to spills multiple times larger than what an expected value model would predict. Importantly, well-resourced governance structures allowing for rapid response plans are critical for reducing the severity of oil spills (Chang et al., 2014; Sajid et al., 2020), and being ready for extreme spills can help contain their effects better than being ready for “expected” spills.
In practice, there is often a severe paucity of data to conduct formal probabilistic assessments of risk (Singh et al., 2017b). This is particularly true for emerging industries where there is little or no precedence (Singh et al., 2020). In such cases, risk assessment often relies on risk matrices. These matrices are qualitative or semi-quantitative tools to assess risk based on the likelihood and consequence of events and guide analysts to an overall “risk score” (Anthony Cox, 2008; Thomas et al., 2014). Risk matrices provide a framework to rate risk based on scorings of likelihood and consequence. In a typical qualitative risk assessment, a risk matrix will contain tiers of high, medium, and low values to approximate both the risk likelihood and impact, but some instances may have more tiers of likelihood and consequence (Figure 6). These matrices are often constructed with symmetry, so low-probability high-consequence events and high-probability low-consequence events receive the same scoring and follow similar logic to expected value models of risk, where the likelihood of impact regulates the final risk score (Figure 6A).
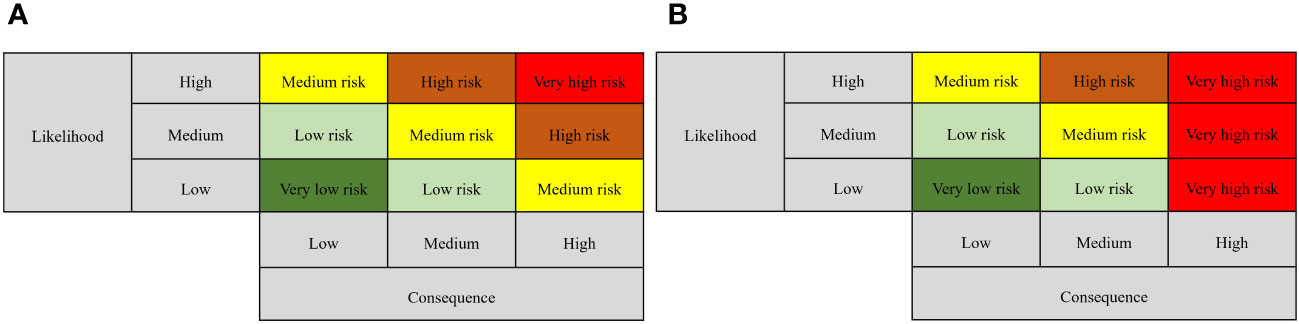
Figure 6 Examples of a three-tiered risk matrix. A typical risk matrix is symmetric, where tiers of likelihood and consequence can influence the resulting risk judgement (A). We suggest a modified risk matrix where disasters may occur under repeat exposure, with an asymmetric risk scoring so likelihood cannot influence high consequence outcomes (B).
The applications of these matrices range from environmental impact assessments of individual development projects to government risk assessment guidelines (Anthony Cox, 2008; Thomas et al., 2014). The IPCC AR5 and AR6 WGII reports also employ the logic of risk matrices and model “tolerable vs. intolerable risk” via a symmetric consideration of the intensity and frequency of impacts (IPCC, 2014; IPCC, 2022a).
In situations where rare events with disaster consequences can occur in repeat exposure settings, we recommend risk matrices follow an asymmetric structure, so that all cases of high consequence be labeled as “high risk”, regardless of the probability (Figure 6B)
By modeling risk as an ensemble of outcomes at a point in time, the conventional expected value model of environmental risk inadequately captures threats posed to a single entity over time. Disasters are not moderated by the low probability of occurrence when exposure to them is continuous. By providing a decision framework to consider disaster risk in parallel with more common risks, we propose an update to how ERA could be conducted. With greater emphasis placed on low-probability high-impact events, we believe better practices can be implemented to prepare for, mitigate, and respond to disaster occurrence. The implications of this also affect how analysis informs risk management strategies, including assessments of risk equivalences, which are assessments aimed at informing management in order to maintain comparable risk given different management decisions (Roux et al., 2022). If there are risks to the environment that include repeat exposure of potential catastrophe, we argue that a risk equivalency approach based on expected value models cannot meaningfully compare between low-consequence and high-consequence risks.
Further, common risk management approaches to decrease the probability of exposure to impacts may only be reliable in contexts of repeat exposure catastrophe where these high consequence risks are eliminated and not simply less likely at any given time. Importantly, understanding the scope and magnitude of disasters are important to not only evaluate how ecosystem services may be impacted – so response planning can be adequately done – but also to design and evaluate environmental management to withstand and recover from disasters. Designing nature-based solutions to climate impacts depends on adequately estimating and modeling disasters, and our proposal attempts to better quantify disaster risk.
We suspect that our proposed approach can also aid in evaluating compounding or cascading disaster events. By incorporating influence diagrams to assess the association between events, our approach should be able to connect the possibility of cascading disaster events, including when natural disaster events can cascade into industrial disaster events (such as when an extreme weather event leads to an oil spill or tailings release). However, because our approach relies on using extreme value theory, which fits probability distributions around past events to evaluate tails of the distribution, our approach may still be inadequate to address the magnitude of impacts of unprecedented events (which may be the case with some cascading disasters). There may be more opportunities to combine our approach with disaster simulation models, to first build a simulation database and then conduct an analysis of extreme values.
Our suggested approach is intended to be simultaneously rigorous but flexible to use, which can be employed and recommended in individual environmental impact assessments to large regional and global scale analysis of risk, from situations allowing for complex and data-driven probabilistic assessments to data-poor contexts. We hope that recent and renewed attention to disasters will generate efforts to understand their risk with new tools that do not discount the threats they pose.
The original contributions presented in the study are included in the article/Supplementary Material, further inquiries can be directed to the corresponding author.
GS and ZS, FK, and CM conceived the paper. Analysis and figures were conducted and produced by GS and ZS. GS, ZS, FK, CM, JB, and TF provided examples and perspectives on the topic from their relevant disciplines, and all authors contributed to the writing and editing of the paper. All authors approved the submitted version.
The authors acknowledge support from the Department of Industry, Energy, and Technology in the Government of Newfoundland and Labrador, Canada (grant number 20210487), as well as support from the Ocean Frontier Institute through an award from the Canada First Research Excellence Fund. GS would like to acknowledge support from the Nippon Foundation Ocean Nexus Center at EarthLab, University of Washington.
The authors thank Riccardo Rebonato for the considerable time and enjoyable discussion and debate regarding risk, probability and considerations of extremes in environmental science, physics, finance, and other risk settings, as well as providing friendly reviews of the manuscript.
The authors declare that the research was conducted in the absence of any commercial or financial relationships that could be construed as a potential conflict of interest.
All claims expressed in this article are solely those of the authors and do not necessarily represent those of their affiliated organizations, or those of the publisher, the editors and the reviewers. Any product that may be evaluated in this article, or claim that may be made by its manufacturer, is not guaranteed or endorsed by the publisher.
The Supplementary Material for this article can be found online at: https://www.frontiersin.org/articles/10.3389/fevo.2023.1249567/full#supplementary-material
Afenyo M., Khan F., Veitch B., Ng A. K., Sajid Z., Fahd F. (2020). An explorative object-oriented Bayesian network model for oil spill response in the Arctic Ocean. Saf. Extreme Environments 2, 3–14. doi: 10.1007/s42797-019-00012-7
Ahmad I., Almanjahie I. M., Asgher M., Ehtsham H. (2019). Probability modeling and estimation of risk measures for fire loss severity in Pakistan: An application of extreme value theory. Economic Comput. Economic Cybernetics Stud. Res. 53 (4), 919-929. doi: 10.24818/18423264/53.4.19.17
Anthony Cox J. L. (2008). What's wrong with risk matrices? Risk Analysis: Int. J. 28 (2), 497–512. doi: 10.1111/j.1539-6924.2008.01030.x
Armstrong McKay D. I., Staal A., Abrams J. F., Winkelmann R., Sakschewski B., Loriani S., et al. (2022). Exceeding 1.5°C global warming could trigger multiple climate tipping points. Science 377 (6611), eabn7950. doi: 10.1126/science.abn7950
Aven T. (2010). On how to define, understand and describe risk. Reliability Eng. System Saf. 95 (6), 623–631. doi: 10.1016/j.ress.2010.01.011
Aven T. (2012). Foundational issues in risk assessment and risk management. Risk Analysis: Int. J. 32 (10), 1647–1656. doi: 10.1111/j.1539-6924.2012.01798.x
Baillon A., Huang Z., Selim A., Wakker P. P. (2018). Measuring ambiguity attitudes for all (natural) events. Econometrica 86 (5), 1839–1858. doi: 10.3982/ECTA14370
Beamish P. W., Hasse V. C. (2022). The importance of rare events and other outliers in global strategy research. Global Strategy J. 12 (4), 697–713. doi: 10.1002/gsj.1437
Beauvais W., Zuther S., Villeneuve C., Kock R., Guitian J. (2019). Rapidly assessing the risks of infectious diseases to wildlife species. R. Soc. Open Sci. 6 (1), 181043. doi: 10.1098/rsos.181043
Bernhardt J. R., Sunday J. M., Thompson P. L., O'Connor M. I. (2018). Nonlinear averaging of thermal experience predicts population growth rates in a thermally variable environment. Proc. R. Soc. B: Biol. Sci. 285 (1886), 20181076. doi: 10.1098/rspb.2018.1076
Bull-Kamanga L., Diagne K., Lavell A., Leon E., Lerise F., MacGregor H., et al. (2003). From everyday hazards to disasters: the accumulation of risk in urban areas. Environ. Urbanization 15 (1), 193–204. doi: 10.1177/095624780301500109
Burger F. A., Terhaar J., Frölicher T. L. (2022). Compound marine heatwaves and ocean acidity extremes. Nat. Commun. 13 (1), 4722. doi: 10.1038/s41467-022-32120-7
Chang S. E., Stone J., Demes K., Piscitelli M. (2014). Consequences of oil spills a review and framework for informing planning. Ecol. Soc. 19 (2), 25. doi: 10.5751/ES-06406-190226
Chryssolouris G., Subramanian V., Lee M. (1994). Use of extreme value theory in engineering decision making. J. manufacturing Syst. 13 (4), 302–312. doi: 10.1016/0278-6125(94)90037-X
Coles S., Bawa J., Trenner L., Dorazio P. (2001). An introduction to statistical modeling of extreme values. (London: Springer).
Collins M., Sutherland M., Bouwer L., Cheong S.-M., Froülicher T., DesCombes H. J., et al. (2019). Extremes, abrupt changes and managing risk. In IPCC Special Report on the Ocean and Cryosphere in a Changing Climate (Geneva: World Meteorological Organization).
Dakos V., Matthews B., Hendry A. P., Levine J., Loeuille N., Norberg J., et al. (2019). Ecosystem tipping points in an evolving world. Nat. Ecol. Evol. 3 (3), 355–362. doi: 10.1038/s41559-019-0797-2
Denny M. (2017). The fallacy of the average: on the ubiquity, utility and continuing novelty of Jensen's inequality. J. Exp. Biol. 220 (2), 139–146. doi: 10.1242/jeb.140368
Devore J. L. (2008). Probability and Statistics for Engineering and the Sciences (Boston: Brooks/Cole).
Doctor J. N., Wakker P. P., Wang T. V. (2020). Economists’ views on the ergodicity problem. Nat. Phys. 16 (12), 1168–1168. doi: 10.1038/s41567-020-01106-x
Duffie D., Pan J. (1997). An overview of value at risk. J. derivatives 4 (3), 7–49. doi: 10.3905/jod.1997.407971
Eschenbach T. G., Harper V., Anderson C. M., Prentki R. (2010). Estimating oil spill occurrence rates: a case study for outer continental shelf areas of Gulf of Mexico. J. Environ. Stat. 1 (1), 1–19.
Fernández V. P. (2003). Extreme value theory: value at risk and returns dependence around the world (Universidad de Chile: Centro de Economía Aplicada).
Fortun K., Knowles S. G., Choi V., Jobin P., Matsumoto M., de la Torre P. III, et al. (2017). “Researching disaster from an STS perspective,” in The handbook of science and technology studies (Cambridge: MIT Press), 1003–1028.
Frickel S., Vincent M. B. (2007). Hurricane Katrina, contamination, and the unintended organization of ignorance. Technol. Soc. 29 (2), 181–188. doi: 10.1016/j.techsoc.2007.01.007
Frölicher T. L., Fischer E. M., Gruber N. (2018). Marine heatwaves under global warming. Nature 560 (7718), 360–364. doi: 10.1038/s41586-018-0383-9
Frölicher T. L., Laufkötter C. (2018). Emerging risks from marine heat waves. Nat. Commun. 9 (1), 650. doi: 10.1038/s41467-018-03163-6
Garcia L. C., Ribeiro D. B., de Oliveira Roque F., Ochoa-Quintero J. M., Laurance W. F. (2017). Brazil's worst mining disaster: corporations must be compelled to pay the actual environmental costs. Ecol. Appl. 27 (1), 5–9. doi: 10.1002/eap.1461
Grigoriu M., Samorodnitsky G. (2014). Reliability of dynamic systems in random environment by extreme value theory. Probabilistic Eng. mechanics 38, 54–69. doi: 10.1016/j.probengmech.2014.08.005
Gruber N., Boyd P. W., Frölicher T. L., Vogt M. (2021). Biogeochemical extremes and compound events in the ocean. Nature 600 (7889), 395–407. doi: 10.1038/s41586-021-03981-7
Haimes Y. Y. (2005). Risk modeling, assessment, and management (Hoboken, New Jersey: John Wiley & Sons).
Hilgartner S. (2007). Overflow and containment in the aftermath of disaster. Soc. Stud. Sci. 37 (1), 153–158. doi: 10.1177/0306312706069439
Hopkins A. (2016). How much should be spent to prevent disaster?: A critique of consequence times probability. Aust. Pipeliner: Off. Publ. Aust. Pipelines And Gas Assoc. 165).
Hughes D. J., Shimmield T. M., Black K. D., Howe J. A. (2015). Ecological impacts of large-scale disposal of mining waste in the deep sea. Sci. Rep. 5 (1), 9985. doi: 10.1038/srep09985
Ide T., Brzoska M., Donges J. F., Schleussner C.-F. (2020). Multi-method evidence for when and how climate-related disasters contribute to armed conflict risk. Global Environ. Change 62, 102063. doi: 10.1016/j.gloenvcha.2020.102063
IPCC (2012). Managing the risks of extreme events and disasters to advance climate change adaptation. (Cambridge, UK: Cambridge University Press).
IPCC (2014). Climate Change 2014: Impacts, Adaptation, and Vulnerability. Part A: Global and Sectoral Aspects. Contribution of Working Group II to the Fifth Assessment Report of the Intergovernmental Panel on Climate Change. (Cambridge, UK and New York, NY, USA: Cambridge University Press).
IPCC (2021). Climate Change 2021: The Physical Science Basis. Contribution of Working Group I to the Sixth Assessment Report of the Intergovernmental Panel on Climate Change. (Cambridge, UK, and New York, NY, USA: Cambridge University Press).
IPCC (2022a). Climate change 2022: Impacts, adaptation and vulnerability. (Cambridge, UK and New York, NY, USA: Cambridge University Press).
IPCC (2022b). Climate Change 2022: Mitigation of Climate Change. Contribution of Working Group III to the Sixth Assessment Report of the Intergovernmental Panel on Climate Change. (Cambridge, UK and New York, NY: Cambridge, UK, and New York, NY, USA).
Jakob M., Clague J. J., Church M. (2016). Rare and dangerous: Recognizing extra-ordinary events in stream channels. Can. Water Resour. Journal/Revue Can. Des. ressources hydriques 41 (1-2), 161–173. doi: 10.1080/07011784.2015.1028451
Knowles S. G. (2012). The disaster experts: Mastering risk in modern America (Philadelphia, Pennsylvania: University of Pennsylvania Press).
Knowles S. (2014). Engineering risk and disaster: Disaster-STS and the American history of technology. Eng. Stud. 6 (3), 227–248. doi: 10.1080/19378629.2014.967697
Kumar P., Debele S. E., Sahani J., Rawat N., Marti-Cardona B., Alfieri S. M., et al. (2021). Nature-based solutions efficiency evaluation against natural hazards: Modelling methods, advantages and limitations. Sci. Total Environ. 784, 147058. doi: 10.1016/j.scitotenv.2021.147058
Lazoglou G., Anagnostopoulou C. (2017). An overview of statistical methods for studying the extreme rainfalls in Mediterranean. Proceedings: MDPI) 1, 681.
Leonard M., Westra S., Phatak A., Lambert M., van den Hurk B., McInnes K., et al. (2014). A compound event framework for understanding extreme impacts. Wiley Interdiscip. Reviews: Climate Change 5 (1), 113–128. doi: 10.1002/wcc.252
Lerner A. B. (2017). Manufactured silence: political economy and management of the 1984 bhopal disaster. Economic Political Weekly 52 (30), 57–65.
Martin R., Schlüter M., Blenckner T. (2020). The importance of transient social dynamics for restoring ecosystems beyond ecological tipping points. Proc. Natl. Acad. Sci. 117 (5), 2717–2722. doi: 10.1073/pnas.1817154117
McNeil A. J., Frey R. (2000). Estimation of tail-related risk measures for heteroscedastic financial time series: an extreme value approach. J. empirical finance 7 (3-4), 271–300. doi: 10.1016/S0927-5398(00)00012-8
Miller K. A., Thompson K. F., Johnston P., Santillo D. (2018). An overview of seabed mining including the current state of development, environmental impacts, and knowledge gaps. Front. Mar. Sci. 4. doi: 10.3389/fmars.2017.00418
Mishra P. K. (2020). COVID-19, Black Swan events and the future of disaster risk management in India. Prog. Disaster Sci. 8, 100137. doi: 10.1016/j.pdisas.2020.100137
Morrison J. E., Smith J. A. (2002). Stochastic modeling of flood peaks using the generalized extreme value distribution. Water Resour. Res. 38 (12), 41–41-41-12. doi: 10.1029/2001WR000502
Oliver E. C. J., Donat M. G., Burrows M. T., Moore P. J., Smale D. A., Alexander L. V., et al. (2018). Longer and more frequent marine heatwaves over the past century. Nat. Commun. 9 (1), 1324. doi: 10.1038/s41467-018-03732-9
Overland J. E. (2021). Rare events in the arctic. Climatic Change 168, 1–13. doi: 10.1007/s10584-021-03238-2
Owusu-Ansah E., Barnes B., Donkoh E., Appau J., Effah B., Mccall M. (2019). Quantifying economic risk: An application of extreme value theory for measuring fire outbreaks financial loss. Finan. Math. Appl. 4, 1–12.
Penn J. L., Deutsch C. (2022). Avoiding ocean mass extinction from climate warming. Science 376 (6592), 524–526. doi: 10.1126/science.abe9039
Peters O. (2019). The ergodicity problem in economics. Nat. Phys. 15 (12), 1216–1221. doi: 10.1038/s41567-019-0732-0
Primo P. P. B., Antunes M. N., Arias A. R. L., Oliveira A. E., Siqueira C. E. (2021). Mining dam failures in Brazil: comparing legal post-disaster decisions. Int. J. Environ. Res. Public Health 18 (21), 2021-11346. doi: 10.3390/ijerph182111346
Pritchard S. B. (2012). An envirotechnical disaster: Nature, technology, and politics at Fukushima. Environ. History. 17, 219–243. doi: 10.1093/envhis/ems021
Ridder N. N., Ukkola A. M., Pitman A. J., Perkins-Kirkpatrick S. E. (2022). Increasedoccurrence of high impact compound events under climate change. npj Climate and Atmospheric Science, 5, 3. doi: 10.1038/s41612-021-00224-4
Roux M.-J., Duplisea D. E., Hunter K. L., Rice J. (2022). Consistent risk management in a changing world: risk equivalence in fisheries and other human activities affecting marine resources and ecosystems. Front. Climate 3, 188. doi: 10.3389/fclim.2021.781559
Sajid Z., Khan F., Veitch B. (2020). Dynamic ecological risk modelling of hydrocarbon release scenarios in Arctic waters. Mar. pollut. Bull. 153, 111001. doi: 10.1016/j.marpolbul.2020.111001
Santamarina J. C., Torres-Cruz L. A., Bachus R. C. (2019). Why coal ash and tailings dam disasters occur. Science 364 (6440), 526–528. doi: 10.1126/science.aax1927
Sharma P., Chandra A., Kaushik S., Sharma P., Jain S. (2012). Predicting violations of national ambient air quality standards using extreme value theory for Delhi city. Atmospheric pollut. Res. 3 (2), 170–179. doi: 10.5094/APR.2012.017
Shaw W. D. (2016). Environmental and natural resource economics decisions under risk and uncertainty: A survey. Int. Rev. Environ. Resource Economics 9 (1-2), 1–130. doi: 10.1561/101.00000074
Singh G. G., Eddy I. M., Halpern B. S., Neslo R., Satterfield T., Chan K. M. (2020). Mapping cumulative impacts to coastal ecosystem services in British Columbia. PloS One 15 (5), e0220092. doi: 10.1371/journal.pone.0220092
Singh G. G., Sinner J., Ellis J., Kandlikar M., Halpern B. S., Satterfield T., et al. (2017a). Group elicitations yield more consistent, yet more uncertain experts in understanding risks to ecosystem services in New Zealand bays. PloS One 12 (8), e0182233. doi: 10.1371/journal.pone.0182233
Singh G. G., Sinner J., Ellis J., Kandlikar M., Halpern B. S., Satterfield T., et al. (2017b). Mechanisms and risk of cumulative impacts to coastal ecosystem services: An expert elicitation approach. J. Environ. Manage. 199, 229–241. doi: 10.1016/j.jenvman.2017.05.032
Taylor S. W., Woolford D. G., Dean C., Martell D. L. (2013). Wildfire prediction to inform fire management: statistical science challenges. Statistical Science 28, 586-615.
Thomas P., Bratvold R. B., Eric Bickel J. (2014). The risk of using risk matrices. SPE Economics Manage 6 (02), 56–66. doi: 10.2118/166269-MS
Tsoukala V. K., Chondros M., Kapelonis Z. G., Martzikos N., Lykou A., Belibassakis K., et al. (2016). An integrated wave modelling framework for extreme and rare events for climate change in coastal areas–the case of Rethymno, Crete. Oceanologia 58 (2), 71–89. doi: 10.1016/j.oceano.2016.01.002
Us M. (2006). Alternative Oil Spill Occurrence Estimators for the Beaufort/Chukchi Sea OCS (Statistical Approach) (Department of the Interior).
Vasseur D. A., DeLong J. P., Gilbert B., Greig H. S., Harley C. D. G., McCann K. S., et al. (2014). Increased temperature variation poses a greater risk to species than climate warming. Proc. R. Soc. B: Biol. Sci. 281 (1779), 20132612. doi: 10.1098/rspb.2013.2612
Verma M., Verter V. (2007). Railroad transportation of dangerous goods: Population exposure to airborne toxins. Comput. operations Res. 34 (5), 1287–1303. doi: 10.1016/j.cor.2005.06.013
Watts M. (2016). “Accumulating insecurity and manufacturing risk along the energy frontier,” in Risking capitalism (Bingley, UK: Emerald Group Publishing Limited), 197–236.
Weisent J., Seaver W., Odoi A., Rohrbach B. (2014). The importance of climatic factors and outliers in predicting regional monthly campylobacteriosis risk in Georgia, USA. Int. J. biometeorology 58, 1865–1878. doi: 10.1007/s00484-014-0788-6
Weitzman M. L. (2009). On modeling and interpreting the economics of catastrophic climate change. Rev. economics Stat 91 (1), 1–19. doi: 10.1162/rest.91.1.1
Williams T. (1996). The two-dimensionality of project risk. Int. J. Project Manage. 14 (3), 185–186. doi: 10.1016/0263-7863(96)00030-0
Yang B., Bai Z., Zhang J. (2021). Environmental impact of mining-associated carbon emissions and analysis of cleaner production strategies in China. Environ. Sci. pollut. Res. 28, 13649–13659. doi: 10.1007/s11356-020-11551-z
Keywords: ecological risk assessment, disasters, compound events, extreme values, repeat exposure, hazard
Citation: Singh GG, Sajid Z, Khan F, Mather C, Bernhardt JR and Frölicher TL (2023) Rethinking disaster risk for ecological risk assessment. Front. Ecol. Evol. 11:1249567. doi: 10.3389/fevo.2023.1249567
Received: 28 June 2023; Accepted: 29 August 2023;
Published: 15 September 2023.
Edited by:
Susan Harrell Yee, United States Environmental Protection Agency, United StatesReviewed by:
Nathaniel K. Newlands, Agriculture and Agri-Food Canada (AAFC), CanadaCopyright © 2023 Singh, Sajid, Khan, Mather, Bernhardt and Frölicher. This is an open-access article distributed under the terms of the Creative Commons Attribution License (CC BY). The use, distribution or reproduction in other forums is permitted, provided the original author(s) and the copyright owner(s) are credited and that the original publication in this journal is cited, in accordance with accepted academic practice. No use, distribution or reproduction is permitted which does not comply with these terms.
*Correspondence: Gerald G. Singh, c2luZ2hnQHV2aWMuY2E=
‡ORCID: Joey R. Bernhardt, orcid.org/0000-0003-1824-2801
Disclaimer: All claims expressed in this article are solely those of the authors and do not necessarily represent those of their affiliated organizations, or those of the publisher, the editors and the reviewers. Any product that may be evaluated in this article or claim that may be made by its manufacturer is not guaranteed or endorsed by the publisher.
Research integrity at Frontiers
Learn more about the work of our research integrity team to safeguard the quality of each article we publish.