- Xinjiang Key Laboratory of Grassland Resources and Ecology, College of Grassland Science, Xinjiang Agricultural University, Urumqi, China
Northern Xinjiang is the center of gravity for Xinjiang's economic development, and "production-living-ecological space" (PLES) is of great significance to the optimization of regional territorial spatial structure. Taking northern Xinjiang as our study area, we analyze the spatial and temporal variations of the ecological and environmental effects of PLES evolution from 2000 to 2020. To do so, we apply the grid cell method, the ecological and environmental quality index, the global autocorrelation model, and the kernel density estimation. Additionally, we use a geographic detector model to reveal the drivers of spatial variation in ecological and environmental quality. Results show that from 2000 to 2020, PLES in the study area is mainly ecological accommodation land. However, there is an obvious trend showing a decrease in ecological accommodation land area and an increase in other land types. Production land and living land increased the most, among which agricultural land and industrial land were mainly converted from grassland ecological land and water ecological land, respectively. The quality of the ecological environment is basically stable during the study period, with an overall slight declining trend, which indicates the quality of ecological environment has decreased slightly. The spatial distribution of the eco-environmental effect shows a significant spatial autocorrelation pattern of "dense in the west and sparse in the east", along with a spatial clustering phenomenon. The main factor of spatial variation in ecological quality is elevation, and the interactions between the factors are mainly non-linearly and double-factor enhanced. The spatial differentiation of ecological environmental quality in the study area is the result of multiple factors. Exploring the ecological and environmental effects of PLES evolution and its driving factors can provide a scientific basis for the implementation of territorial spatial planning and ecological environmental protection in northern Xinjiang.
1 Introduction
Rapid economic and social development as well as urbanization and industrialization have triggered the continuous spatial reconstruction of land use in the region north of the Tianshan Mountains in Xinjiang, China. The structure and function of natural ecosystems have also changed in this area, threatening the regional ecological security and sustainability of ecosystem services (Han et al., 2019). In general, when cities grow and expand, problems such as crowding out of cultivated land and rapid urbanization typically follow (Yu et al., 2021). As the main mode of land-use transformation, land-use function (i.e., production, living, and ecological function) transformation has become a new approach for land use and cover change (LUCC) research, and is widely regarded as one of the causes of global ecological environment change (Li et al., 2022).
Development requires continuous acquisition of resources, and land is the carrier and body of those resources (Luo et al., 2022). However, land’s scarcity and non-renewability can lead to intensifying conflicts between land functions. Spatial dysfunction has become the primary factor hindering high-quality regional development. Therefore, gaining a better under-standing of land-use patterns is conducive to coordinating land functions and promoting long-term sustainable development (Fan et al., 2017).
Production-living-ecological space (PLES) is a theory proposed by the Chinese government in the ecological civilization construction strategy with the goal of achieving sustainable utilization and focusing on the perspective of multi-functional land use. According to the functional attributes of land, China’s land is divided into production space, living space and ecological space, which can more intuitively observe the evolution of land use kinetic energy. At present, the relevant research on “production-living-ecological space” (PLES) mainly focuses on the connotation framework (Lin et al., 2022), classification system (Fu et al., 2022), function recognition (Tao and Wang, 2021), structure evolution (Gao et al., 2022), driving mechanism (Wang et al., 2022), coupling coordination (Cui et al., 2022), function conflict (Fang et al., 2022), scenario simulation (Jiang et al., 2022), and spatial optimization (Wang et al., 2023). Few studies have linked the evolution of PLES with the eco-environmental quality of grid cells or discussed the evolution characteristics and spatial differentiation mechanism of eco-environmental effects of land-use transition (Dong J. H. et al., 2022; Li and Wu, 2022; Li et al., 2022). Land-use transition mainly affects ecological environmental elements (atmosphere, soil, and water) and thus leads to changes in ecosystem structure and function (Liu et al., 2015). There are two main ways to measure the eco-environmental effect of land-use transition. The first way is by employing Net Primary Productivity (NPP) (Martinez et al., 2019), Normalized Difference Vegetation Index, NDVI) (Li et al., 2017), Remote Sensing Ecological Index (RSEI) (Wang et al., 2023), or other indicators that reflect surface biomass. The second way is to employ quantitative measurement based on the LUCC process, such as the Eco-Environmental Quality Index (EV) (Dong Y. K. et al., 2022) and the ecosystem service value model (Zhang et al., 2023).
Of these techniques, EV is currently widely used. It constructs the correlation between LUCC and eco-environmental quality based on fully considering the ecological differences of terrestrial species, and then describes the evolution process and characteristics of eco-environmental quality (Chen et al., 2019). In addition, the spatial differentiation pattern of ecological environmental quality in cell grids is the spatial characterization result of the complex coupling process of natural environmental conditions and socio-economic factors. The geographical detector model is popular for analyzing the evolution of geographical factor patterns and regional spatial differentiation (Zhou et al., 2020; Huang et al., 2021).
As a province with the largest area and sparse population in China, Xinjiang has a fragile ecological environment. Due to vigorous economic development and excessive exploitation and utilization of natural resources, the ecological environment in this region has been damaged to varying degrees. Yang et al. took the grassland on the north slope of the Tianshan Mountains as the research object, and took the cities and agriculture with frequent human activities as the main research points, and found that the area of desert grassland decreased sharply, while the area of agriculture and other land increased (Yang et al., 2011). From the perspective of natural factors and social factors, it was finally found that human activities and over-utilization of resources led to the reduction of grassland area, coverage and ecological environment. Wang selected the central urban area of Urumqi as the research area to evaluate the ecological environment quality, and found that the ecological environment quality would be affected by climate change to a certain extent (Wang, 2022). Zhai et al. studied the transformation of land use in Xinjiang in the past 40 years to further explore the evolution of deep-seated ecological and environmental effects behind land use transformation (Zhai et al., 2022). It is found that the ecological environment quality of Tianshan Mountains and Altay Mountains in the north of Tianshan Mountains is high, while the ecological environment quality of Junggar and Turpan basins is low. And the continuous reduction of ecological land area is the main reason for the deterioration of ecological environment quality and the continuous reduction of high quality area of ecological environment.
To sum up, while some theoretical analysis and practical research on production-living-ecological space has been conducted in earlier studies, further in-depth discussion is needed. Our area of focus is northern Xinjiang district in arid northwest China, a region whose ecological environment is immensely fragile. However, in pursuit of economic benefits, local, regional and national authorities have broken the original form of PLES, causing the region to face severe contradictions of water and soil resources. The outcome has been a further restriction of the economy’s sustainable development. Moreover, some studies have described the evolution characteristics of the eco-environmental effects of the transformation of PLES but lack a differentiation mechanism (Deng, 2020; Dong J. H. et al., 2022; Zhai et al., 2022). We take the area north of the Tianshan Mountains in Xinjiang as the study area. Through practical observation and previous relevant data statistics, we speculate that the ecological environment quality in the study area will decline. In order to verify relevant hypotheses, we will first clarify the connotation of PLES based on the classification system principle dominated by land use type, classify and analyze the current situation of land use in northern Xinjiang according to the classification principle of PLES. Secondly, what are the characteristics of the change of PLES pattern from 2000 to 2020? How does the spatial layout and ecological environment quality of PLES change?
In view of this, the present paper explores the evolution characteristics and spatial differentiation mechanism of eco-environmental effects under land-use transition north of the Tianshan Mountains in Xinjiang, China. It adopts the PLES perspective and discusses the mechanisms underlying the evolution of this land-use function classification. We anticipate that the study findings will provide a reference for regional spatial pattern optimization, along with ecological planning policy formulation and ecosystem risk control.
2 Materials and methods
2.1 Study area
Northern Xinjiang region in Xinjiang, China, is the center of gravity for Xinjiang’s economic development. It is situated at 79°54’−96°22’ E, 42°08’–48°03’ N and includes Urumqi City (Figure 1, 1), Wujiaqu City (Figure 1, 2), Changji Hui Autonomous Prefecture (Figure 1, 3), Shihezi City (Figure 1, 4), Yili Kazakh Autonomous Prefecture (Figure 1, 5), Bortala Mongolian Autonomous Prefecture (Figure 1, 6), Tacheng Prefecture (Figure 1, 7), Karamay City (Figure 1, 8), Altay Prefecture (Figure 1, 9), Turpan Prefecture (Figure 1, 10), and Hami Prefecture (Figure 1, 11). Xinjiang is divided into southern Xinjiang, Northern Xinjiang and Eastern Xinjiang. In order to better study, Turpan and Hami Prefecture in the east are put into the northern area to study together. The landform mainly includes mountains, plains, and deserts, and has altitudes ranging from −154 m to 6,236 m. Northern Xinjiang has a continental arid and semi-arid climate with an average annual temperature of −4°C to 9°C, annual precipitation of around 160–300 mm, and extreme temperature differences between day and night (Song et al., 2018). Drought and drought-tolerant vegetation mainly characterize the vast arid area due to less soil water and summertime rain. Nevertheless, and despite its frigid and snowy winters (Wang et al., 2021), this region has become one of the main animal husbandry bases in China.
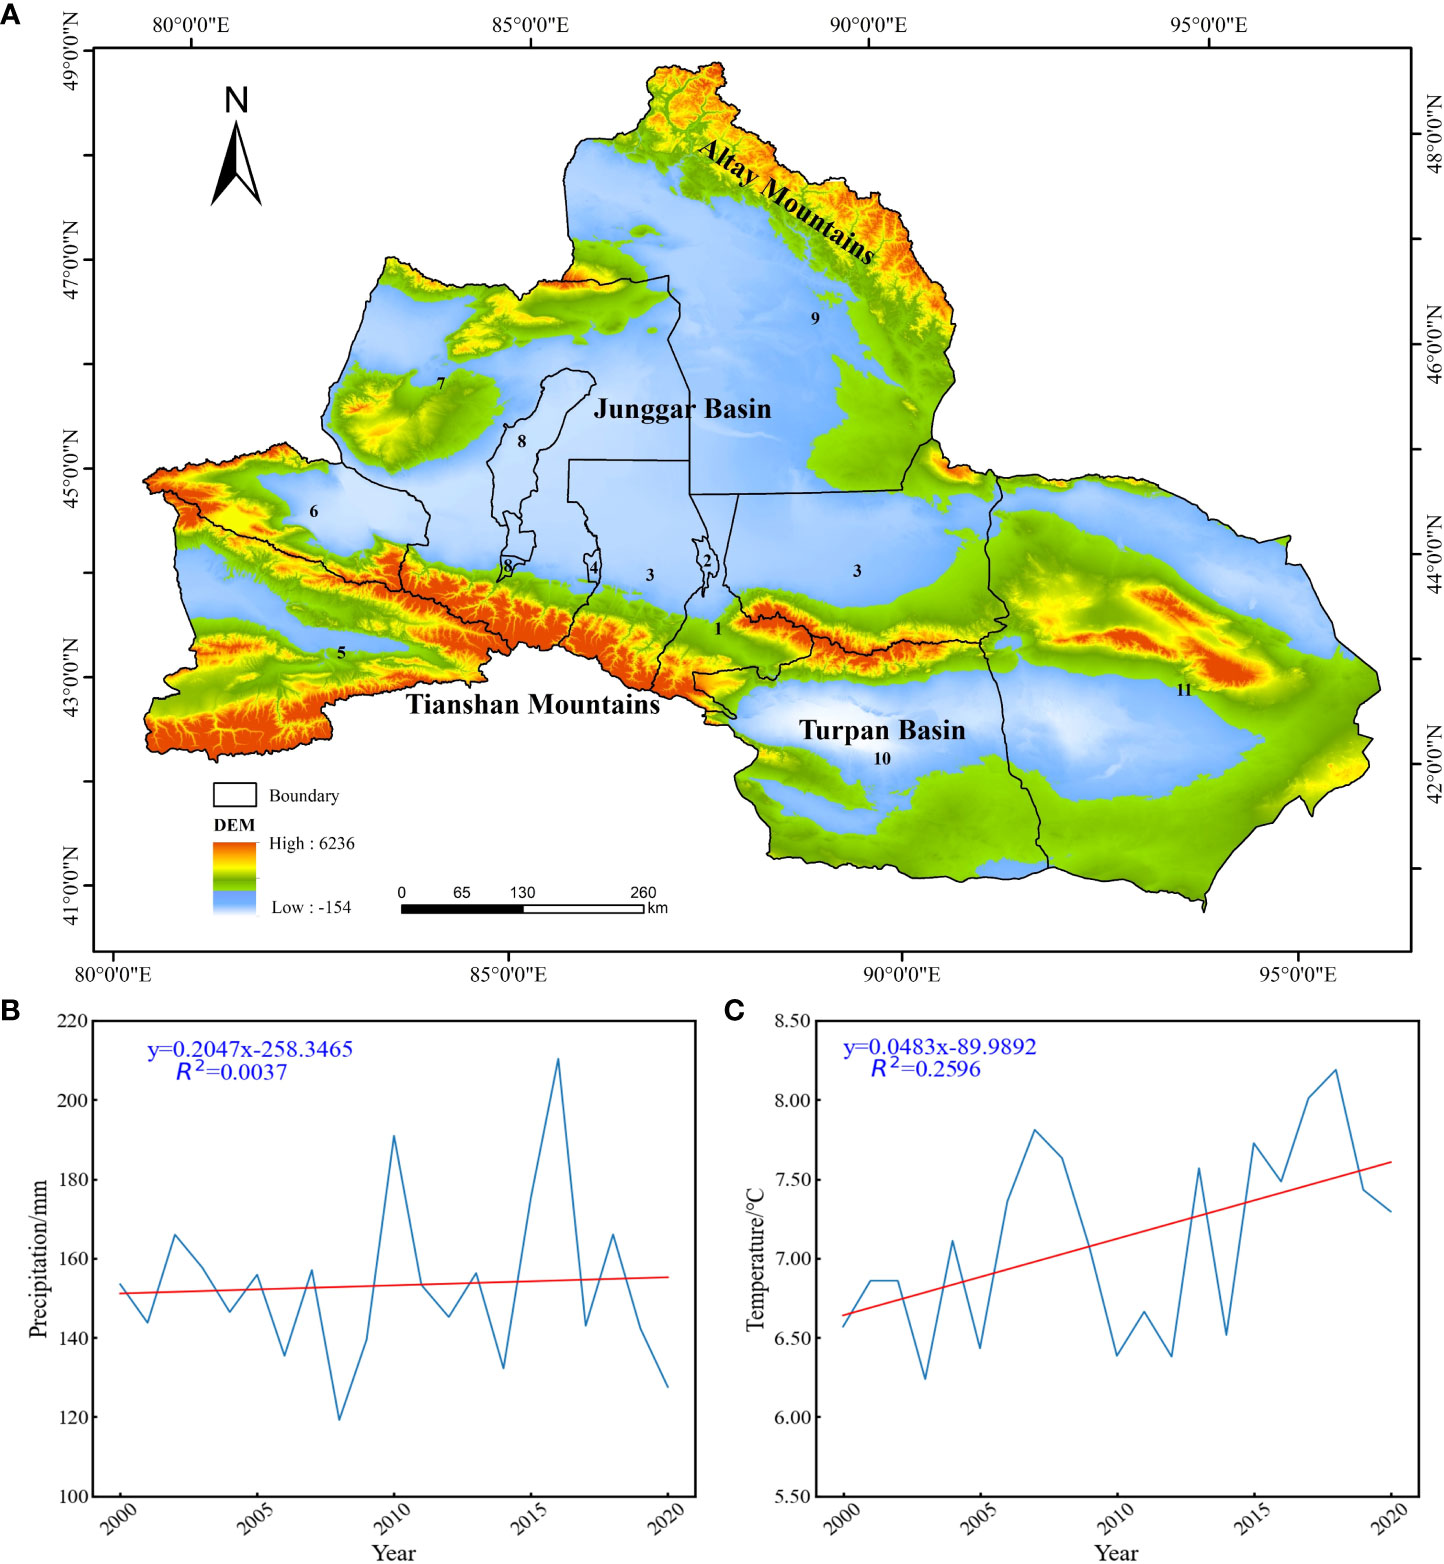
Figure 1 Overview of the study area. Note: 1. Urumqi City; 2. Wujiaqu City; 3. Changji Hui Autonomous Prefecture; 4. Shihezi City; 5. Yili Kazakh Autonomous Prefecture; 6. Bortala Mongolian Autonomous Prefecture; 7. Tacheng Prefecture; 8. Karamay City; 9. Altay Prefecture; 10. Turpan Prefecture; 11. Hami Prefecture; (A) Administrative division and DEM in northern Xinjiang; (B) Average annual precipitation in northern Xinjiang; (C) Average annual temperature in northern Xinjiang.
2.2 Research methods
2.2.1 Data sources
The land-use data for the five periods of 2000, 2005, 2010, 2015, and 2020 (2000–2020) for the study area were obtained from the Data Center for Resource and Environment Science (http://www.resdc.cn/) at a 30m spatial resolution. DEM data comes from Geospatial data cloud (https://www.gscloud.cn/), slope data is calculated using DEM data and ArcGIS 10.2 software, and NDVI, precipitation and temperature data comes from the Data Center for Resource and Environment Science (http://www.resdc.cn/). The monthly average values of temperature and precipitation from 18 meteorological stations with complete data were taken, and the meteorological data were processed by inverse distance weight spatial interpolation according to the latitude and longitude of each meteorological station. Due to the large amount of other ecological land area in this region, and considering the study area’s characteristics, the land-use status data for the five periods were reclassified into four first-level land classes, namely, production land, key ecological land, living land, and ecological accommodation land. The socio-economic and demographic data for the study area were obtained from the “Xinjiang Statistical Yearbook”, “Xinjiang Production and Construction Corps Statistical Yearbook” for the years 2000 to 2020.
2.2.2 Construction of the classification system of production-living-ecological space
Using the land-use remote-sensing monitoring data classification system of the Chinese Academy of Sciences (Liu et al., 2002), the existing system subcategories were reclassified according to their spatial meanings. Based on these meanings, the classification system of production-living-ecological space (PLES) was proposed in this paper (Table 1). The spaces have been classified into categories according to their dominant functions. This classification system covers all land-use types and is highly suitable for the northwest arid zone. However, the study area does not contain all spatial types (tidal flats and oceans), so those land forms are not included in this paper. Therefore, based on the land-use classification system and referring to relevant research results (Yang et al., 2018; Gao et al., 2020), the eco-environmental quality index of different secondary land classes was formulated here, and the area weighting method was adopted to assign the eco-environmental quality index of PLES.
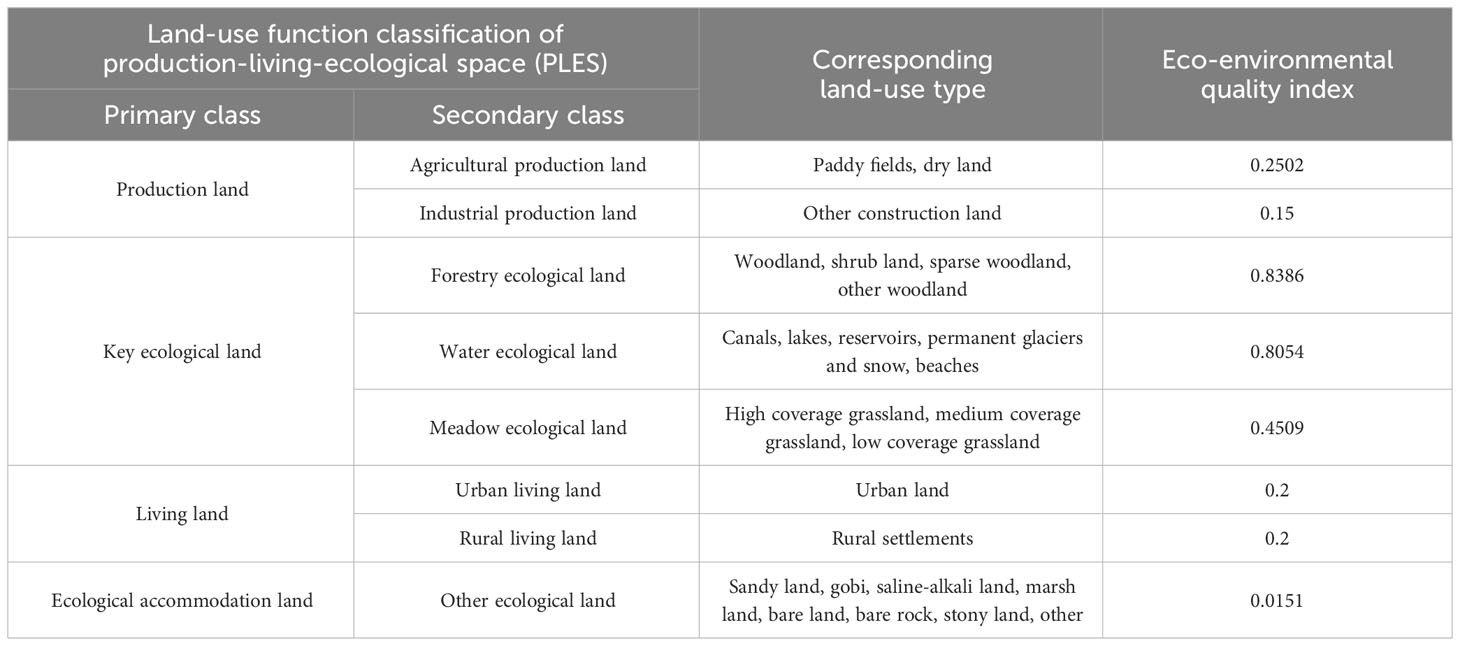
Table 1 Land-use function classification system and eco-environmental quality index in northern Xinjiang.
2.2.3 Dynamic degree of land-use
This model is employed to study the changes of a certain type of land for a specific time period. It can be expressed as:
where K is the dynamic degree of a certain type of ground; Ui and Uj, respectively, represent the area of the beginning stage and the end stage; and t is the research period. Note that the rise in the K value indicates a significant increase in the land cover change in this region (Ding et al., 2019).
2.2.4 Land-use transfer matrix
The transfer matrix can reflect the area of land-use types in a single static period and aids the dynamic analysis of the flow direction of land-use type transfer, source of land-use transfer, and change amount (Nie et al., 2022). The raster calculator function in the ArcGIS10.2 software is used for processing, and Excel is used to calculate and output the final result. The expression of land-use transfer matrix is as follows:
where S is the area; i and j are land-use types at the beginning and end of the study period, respectively; and n is the number of land-use types.
2.2.5 Ecological environment quality index
The ecological environment quality index is the result of the comprehensive action of the ecological environment quality and the area proportion of PLES in the region. In this study, ArcGIS 10.2 software was used, combined with the actual situation of the research area and the research purpose. The grid unit considered most suitable for our purposes, through repeated tests, was 10 km × 10 km. Irregular plots with less than half a grid area at the edge of the study area were incorporated into adjacent regular grids to obtain approximately 6,245 grid units, and the required research data were introduced into corresponding grid units (Hou et al., 2022; Li and Wu, 2022; Pang et al., 2022).
Using the PLES classification, the ecological environment quality of different unit research areas is represented quantitatively through the following formula:
where EVk is the ecological environment quality index of evaluation unit k, Ski is the area of functional land type i in the kth evaluation unit, and Sk is the total land area of the kth evaluation unit. Additionally, Riis the eco-environmental quality index of functional land class i, and n is the number of land resource types, based on PLES.
2.2.6 Global autocorrelation model
Based on the ecological environment quality index of grid cells, Moran’s I index was used to reflect the spatial correlation of the whole study area. The spatial autocorrelation function in the ArcGIS10.2 software is used for analysis and processing. The value of Moran’s I is (–1, 1) under standardization. A value greater than 0 denotes a positive spatial correlation, indicating that the spatial unit distribution of similar attribute values tend to gather in the same area. If the value is less than 0, the spatial correlation is negative, indicating that spatial units with different attribute values tend to gather in the same area. A value equal to 0 means that the space units are not related to each other (Hu and Xu, 2018). The calculation formula is:
where S2 is the variance, xi is the observed value of unit i, n is the number of rasters, and Wij is a binary adjacent space weight matrix. Further, i= 1, 2,…, n; and j=1,2,… m. Finally, when region i and region j are adjacent, Wij=1; when region i and region j are not adjacent, Wij=0.
2.2.7 Kernel density estimation
Kernel density estimation mainly calculates the data aggregation state of the entire region based on the input factors. This calculation generates a continuous density surface and objectively reflects the spatial distribution of ecological environmental quality (Kuang et al., 2017). Using ArcGIS 10.2 software, search radius of 50 km, 100 km, 120 km, and 150 km were set for comparative analysis according to the size of grid cells and the actual situation of the research area. Combined with the global effect and the local recognition effect of kernel density estimation results, 120 km was selected as the search radius. The calculation formula is:
where f(x) is the kernel density estimate at x; r is the search radius (km); n is the total number of samples; x – xi is the distance (km) between two points; and k is the kernel density function.
2.2.8 Geographic detector model
The factors influencing the ecological environment effect were evaluated quantitatively using the geographic detector model. The intensity of these factors was also evaluated. This mathematical statistics analysis method was proposed by Wang Jinfeng and Xu Chengdong (Wang and Xu, 2017) to explore the spatial differentiation of geographical entities and reveal their driving force, including factor detection, ecological detection, interaction detection, and risk detection. In this paper, two types of factors – natural environmental and socio-economic – are discretized. The natural environmental factors include elevation (X1), slope (X2), NDVI (X3), temperature (X4), and precipitation (X5). The socio-economic factors are population density (X6), gross value of primary industry (X7), gross value of secondary industry (X8), distance to water (X9), and road distance to township level and above (X10). The discretization approach mainly uses factor detection and interactive detection.
The raster clipping of the ArcGIS10.2 was applied to DEM and NDVI data to cut out the data required for the study area, and the slope was calculated by ArcGIS. The monthly average values of temperature and precipitation from 18 meteorological stations with complete data were taken, and the meteorological data were processed by inverse distance weight spatial interpolation according to the latitude and longitude of each meteorological station. The population density and the gross value of the first and second industries were input into the corresponding administrative divisions through statistics and calculation. The distance to the water area and the distance to the road above the township level are obtained through the euclidean distance in the ArcGIS10.2 software. All factors are finally classified by the reclassification function, and finally the reclassification results are resampled to obtain the final data form required by the geographic detector model.
Factor detection can measure the interpretation degree of independent variables to the spatial differentiation phenomenon of dependent variables, while interactive detection analyzes the influence degree of different factors’ superposition on the distribution of dependent variables. The calculation formula is:
where q is the detection value of each driving factor; Ni and N are the number of samples in the region and the whole region, respectively; L is the number of evaluation units; and and are the discrete variances of the partition and the whole region, respectively.
3 Results
3.1 Spatiotemporal dynamics of land-use function
3.1.1 Evolution characteristics and dynamic degree of land-use function
By analyzing the distribution and quantitative characteristics of production-living-ecological space north of the Tianshan Mountains (Figure 2), we can see that ecological accommodation land is the main type of land. However, its area decreased 5.97%, dropping from 330,214.1166 km2 in 2000 to 310,485.1275 km2 in 2020. During the study period, the key ecological land at first decreased and then increased by 1439.6769 km2 (0.63%). Production land and living land expanded from 32,838.4944 km2 and 2,482.2288 km2 in 2000 to 49,147.1262 km2 and 3,893.8914 km2 in 2020, for an increase of 49.66% and 56.87%, respectively. The increase in land for production and living stems from the encroachment of ecological accommodation.
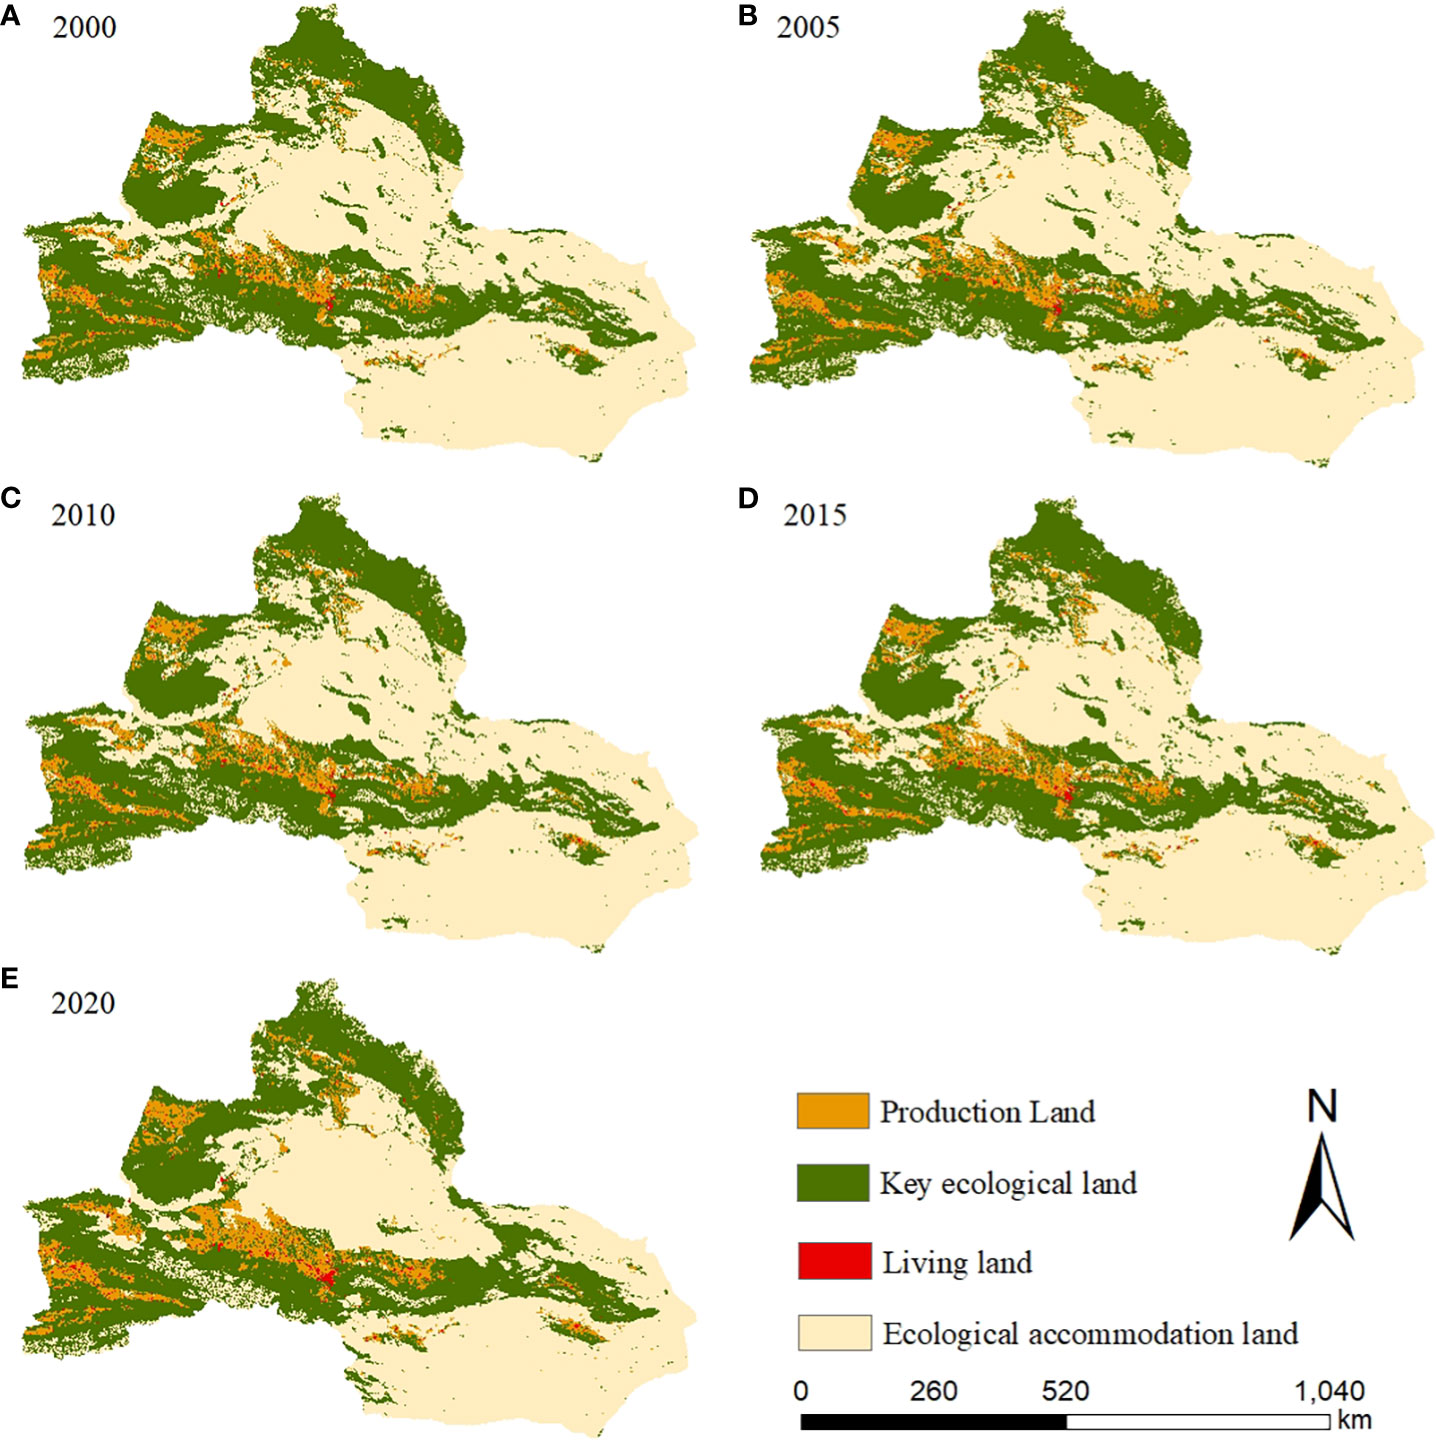
Figure 2 Spatial distribution diagram of production-living-ecological space from 2000 to 2020 (A–E).
In this paper, the land-use dynamic degree model was used to analyze the secondary classification dynamic changes of PLES in northern Xinjiang, reflecting the intensity of the structural evolution of regional PLES. The data reveal that the dynamic degree of land use across the region presents various changes in different periods. As can be seen from Figure 3, from 2000 to 2010, the dynamic degree of forest land, grassland ecological land, and other ecological land was negative. However, the dynamic degree of other land types was positive, indicating that the area of forest land, grassland ecological land, and other ecological land was decreasing, while the other land was expanding.
From 2010 to 2020, species across the study area showed a significant change trend. Agricultural and industrial production land, urban and rural living land, and grassland ecological land showed a major upward trend compared with the previous 10 years, indicating that the area of these land types had increased substantially. Among them, the secondary land category with the fastest expansion was industrial production space (19.9), with an increase of about 14.37 compared with the previous period. This was followed by urban living land, which increased from 1.21 in the previous period to 9.95. Agricultural production land (2.76), grassland ecological land (0.9) and rural living land (2.41) increased only slightly, and the dynamic degree of grassland ecological land changed from negative to positive by 0.75.
These results demonstrate that the study area responded positively to the national policy of returning farmland to grassland. In this period, forestry ecological land, water ecological land and other ecological land showed negative values, with dynamic degrees of −3.96, −3.27, and −0.53, respectively. This may be related to a certain spatial synergy between the substantial growth of production land and living land in the region. The main driving factor was the rapid economic and social development of northern Xinjiang during this period, and the accelerating process of urbanization and industrialization, which increased the demand for industrial production land and urban living land. In addition, due to the excessive development of land and the imbalance of water resources and demand, the area of forest and water shrank sharply, which led to further land desertification.
In general, during the 20a period from 2000 to 2020, the growth trend of industrial production land and urban living land was the most obvious, and the dynamic degree was the highest, measuring 18.26 and 6.18, respectively. Forest ecological land, water ecological land, and other ecological land showed a decreasing trend, among which forest land had the largest decreasing range, with a dynamic value of −1.98. Other ecological land had a relatively stable decreasing trend, with a dynamic index of −0.3.
3.1.2 Transformation mode of land-use function
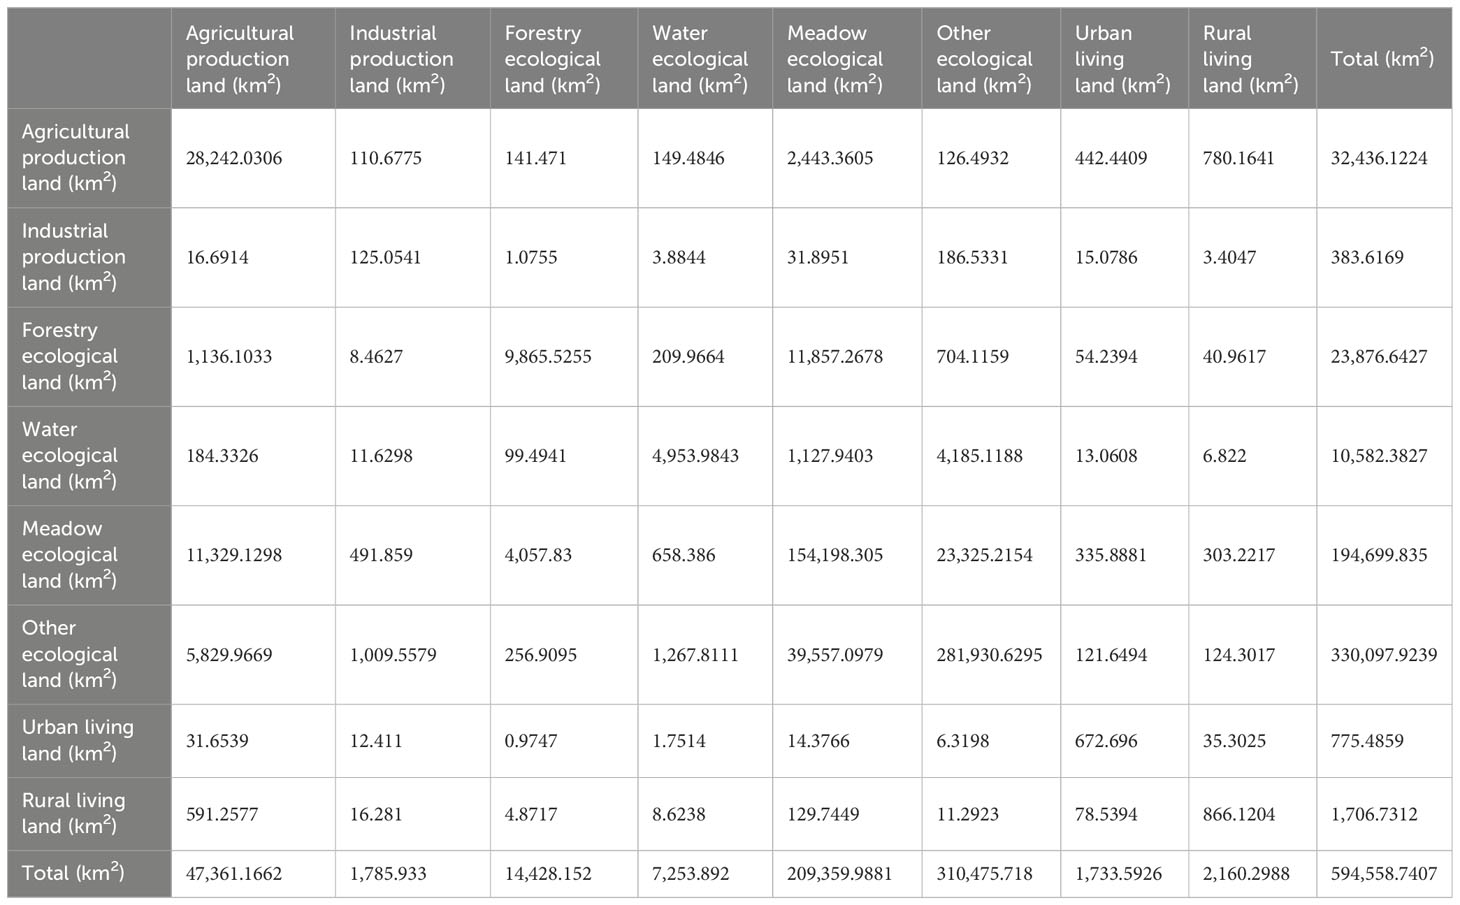
In order to more intuitively observe the internal conversion of land-use types in northern Xinjiang from 2000 to 2020, this paper uses the secondary classification transfer matrix of production-living-ecological space to clarify the transformation direction and quantity of land function transformation (Table 2). During the study period, the largest transferred-in areas were agricultural production land and grassland ecological land, which were 14,925.04 km2 and 14,660.15 km2, respectively, accounting for 46.07% and 45.25% of the total transferred-in areas in the past 20 years. Agricultural land was mainly converted from grassland ecological land and other ecological land, accounting for 59.26% and 30.49% of the land types converted to agricultural land, respectively. The conversion of forest ecological land and other ecological land was the main reason for the increase in grassland ecological land area, and it was also the main type of land converted into grassland ecological land, accounting for 5.73% and 19.12%, respectively. From 2000 to 2020, the ecological land of water and forest was mostly turned into meadow ecological land, which resulted in the reduced the ecological environment quality of the study area.
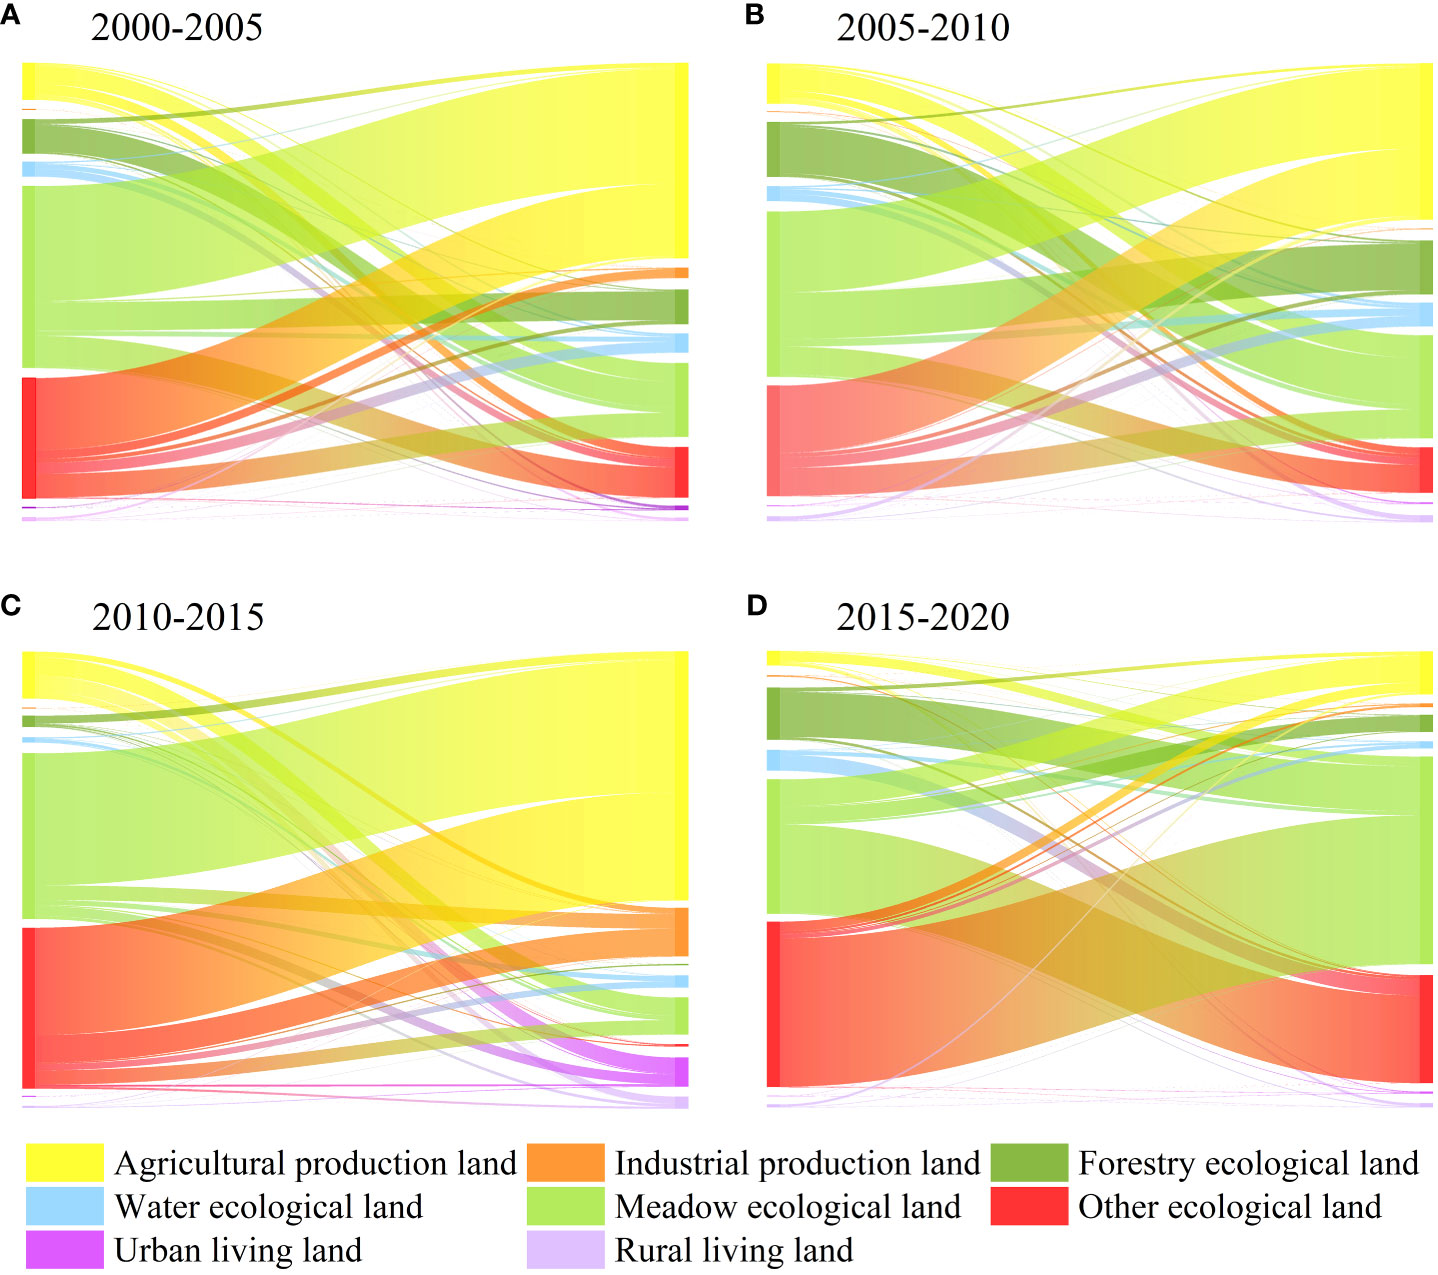
It can be seen from Figure 4 that grassland ecological land changed the most during 2000–2005, and a total of 2,234.21 km2 was transferred out, mainly into agricultural production land and other ecological land. From 2005 to 2010, agricultural production space changed the most (1,379.21 km2), but the transfer of grassland ecological land was still greater, totaling 737.7 km2. From 2010 to 2015, the transfer-in and transfer-out amounts were the same as the previous period, and the other ecological land decreased the most. A total of 2,185.21 km2 was transferred out, which was primarily converted into agricultural production space.
Meanwhile, from 2015 to 2020, grassland ecological land changed from a decreasing state in the first three periods to an increasing one in the fourth one. A total of 19,401.91 km2 was transferred, representing the main type of land change in this period. Additionally, 15,224.85 km2 of other ecological land was transferred in the same period, constituting the largest transfer of the entire four periods. Except for other ecological land, other secondary land classes had the largest change during this period, indicating that the two-point conversion of PLES mainly occurred during 2015–2020.
The main PLES conversion types in the study area were agricultural production land, grassland ecological land, other ecological land, and forest ecological land. From the perspective of spatial distribution (Figure 5), the conversion of grassland ecological land into agricultural land mainly occurred in Tacheng Prefecture (Figure 1, 7) and the south of Karamay City (Figure 1, 8), while additional conversion occurred in western Yili Kazakh Autonomous Prefecture (Figure 1, 5), the middle of Wujiaqu City (Figure 1, 2), and northwest of Altay Prefecture (Figure 1, 5). The conversion of other ecological land into agricultural production space mainly occurred in the junction of Karamay City and Tacheng Prefecture and the center of Altay Prefecture. The conversion of other ecological land into agricultural production space also took place in the central part of Bortala Mongolian Autonomous Prefecture (Figure 1, 6) and the northwest part of Wujiaqu City.
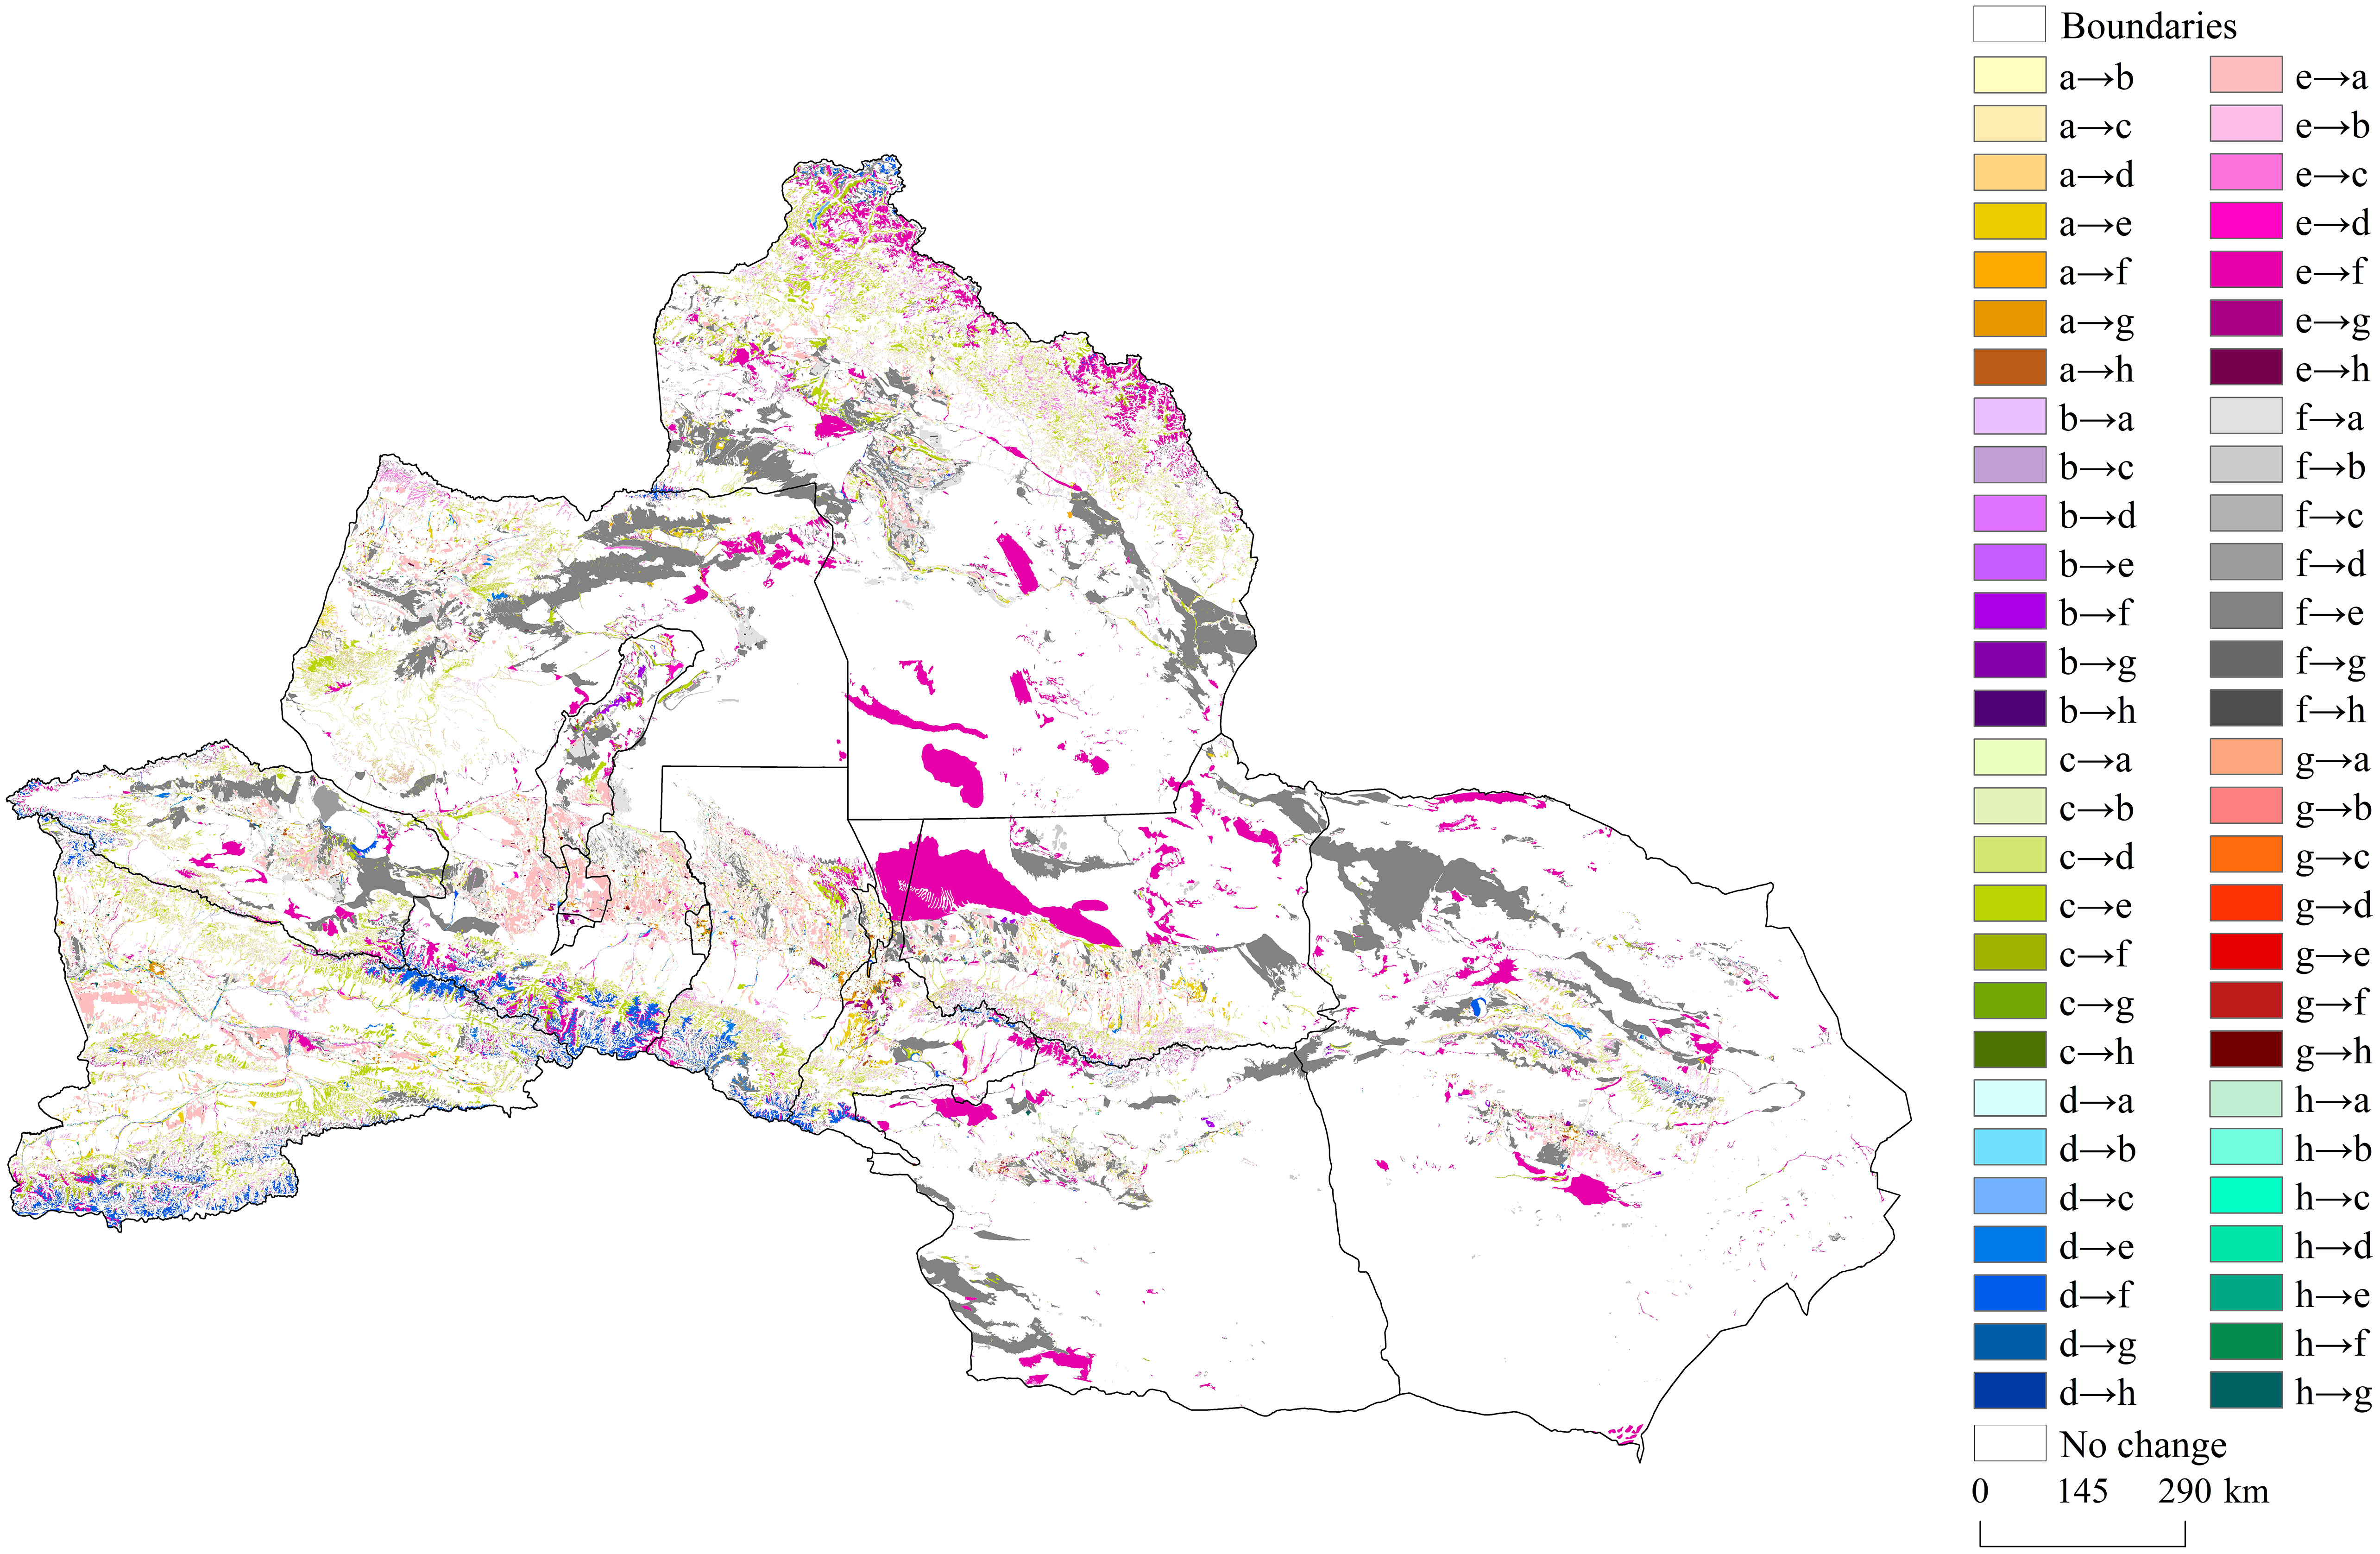
Figure 5 Structural changes of PLES in northern Xinjiang from 2000 to 2020. (a) Agricultural production land; (b) Industrial production land; (c) Forestry ecological land; (d) Water ecological land; (e) Meadow ecological land; (f) Other ecological land; (g) Urban living land; (i) Rural living land.
In the southwestern and northern parts the study area, the conversion of woodland ecological land into grassland ecological land was evenly distributed. At the same time, the phenomenon of unused geostrophes mainly occurred in the midsection and periphery, with a circular distribution. The conversion of grassland ecological land into other ecological land was widespread in the junction of Urumqi (Figure 1, 1) and Wujiaqu City (Figure 1, 2) and the southern part of Altay Prefecture (Figure 1, 9), which is the central part of northern Xinjiang. These phenomena indicate that the unit area of other ecological land drops sharply when there is a rational allocation of resources arising from the implementation of prudent policy and the development of natural conditions, the economy, and society. However, due to the constant occurrence of indiscriminate cutting, deforestation, and reclamation events, the overall forest area charted a shrinking trend.
3.2 Climatic influencing factors of eco-environmental quality index
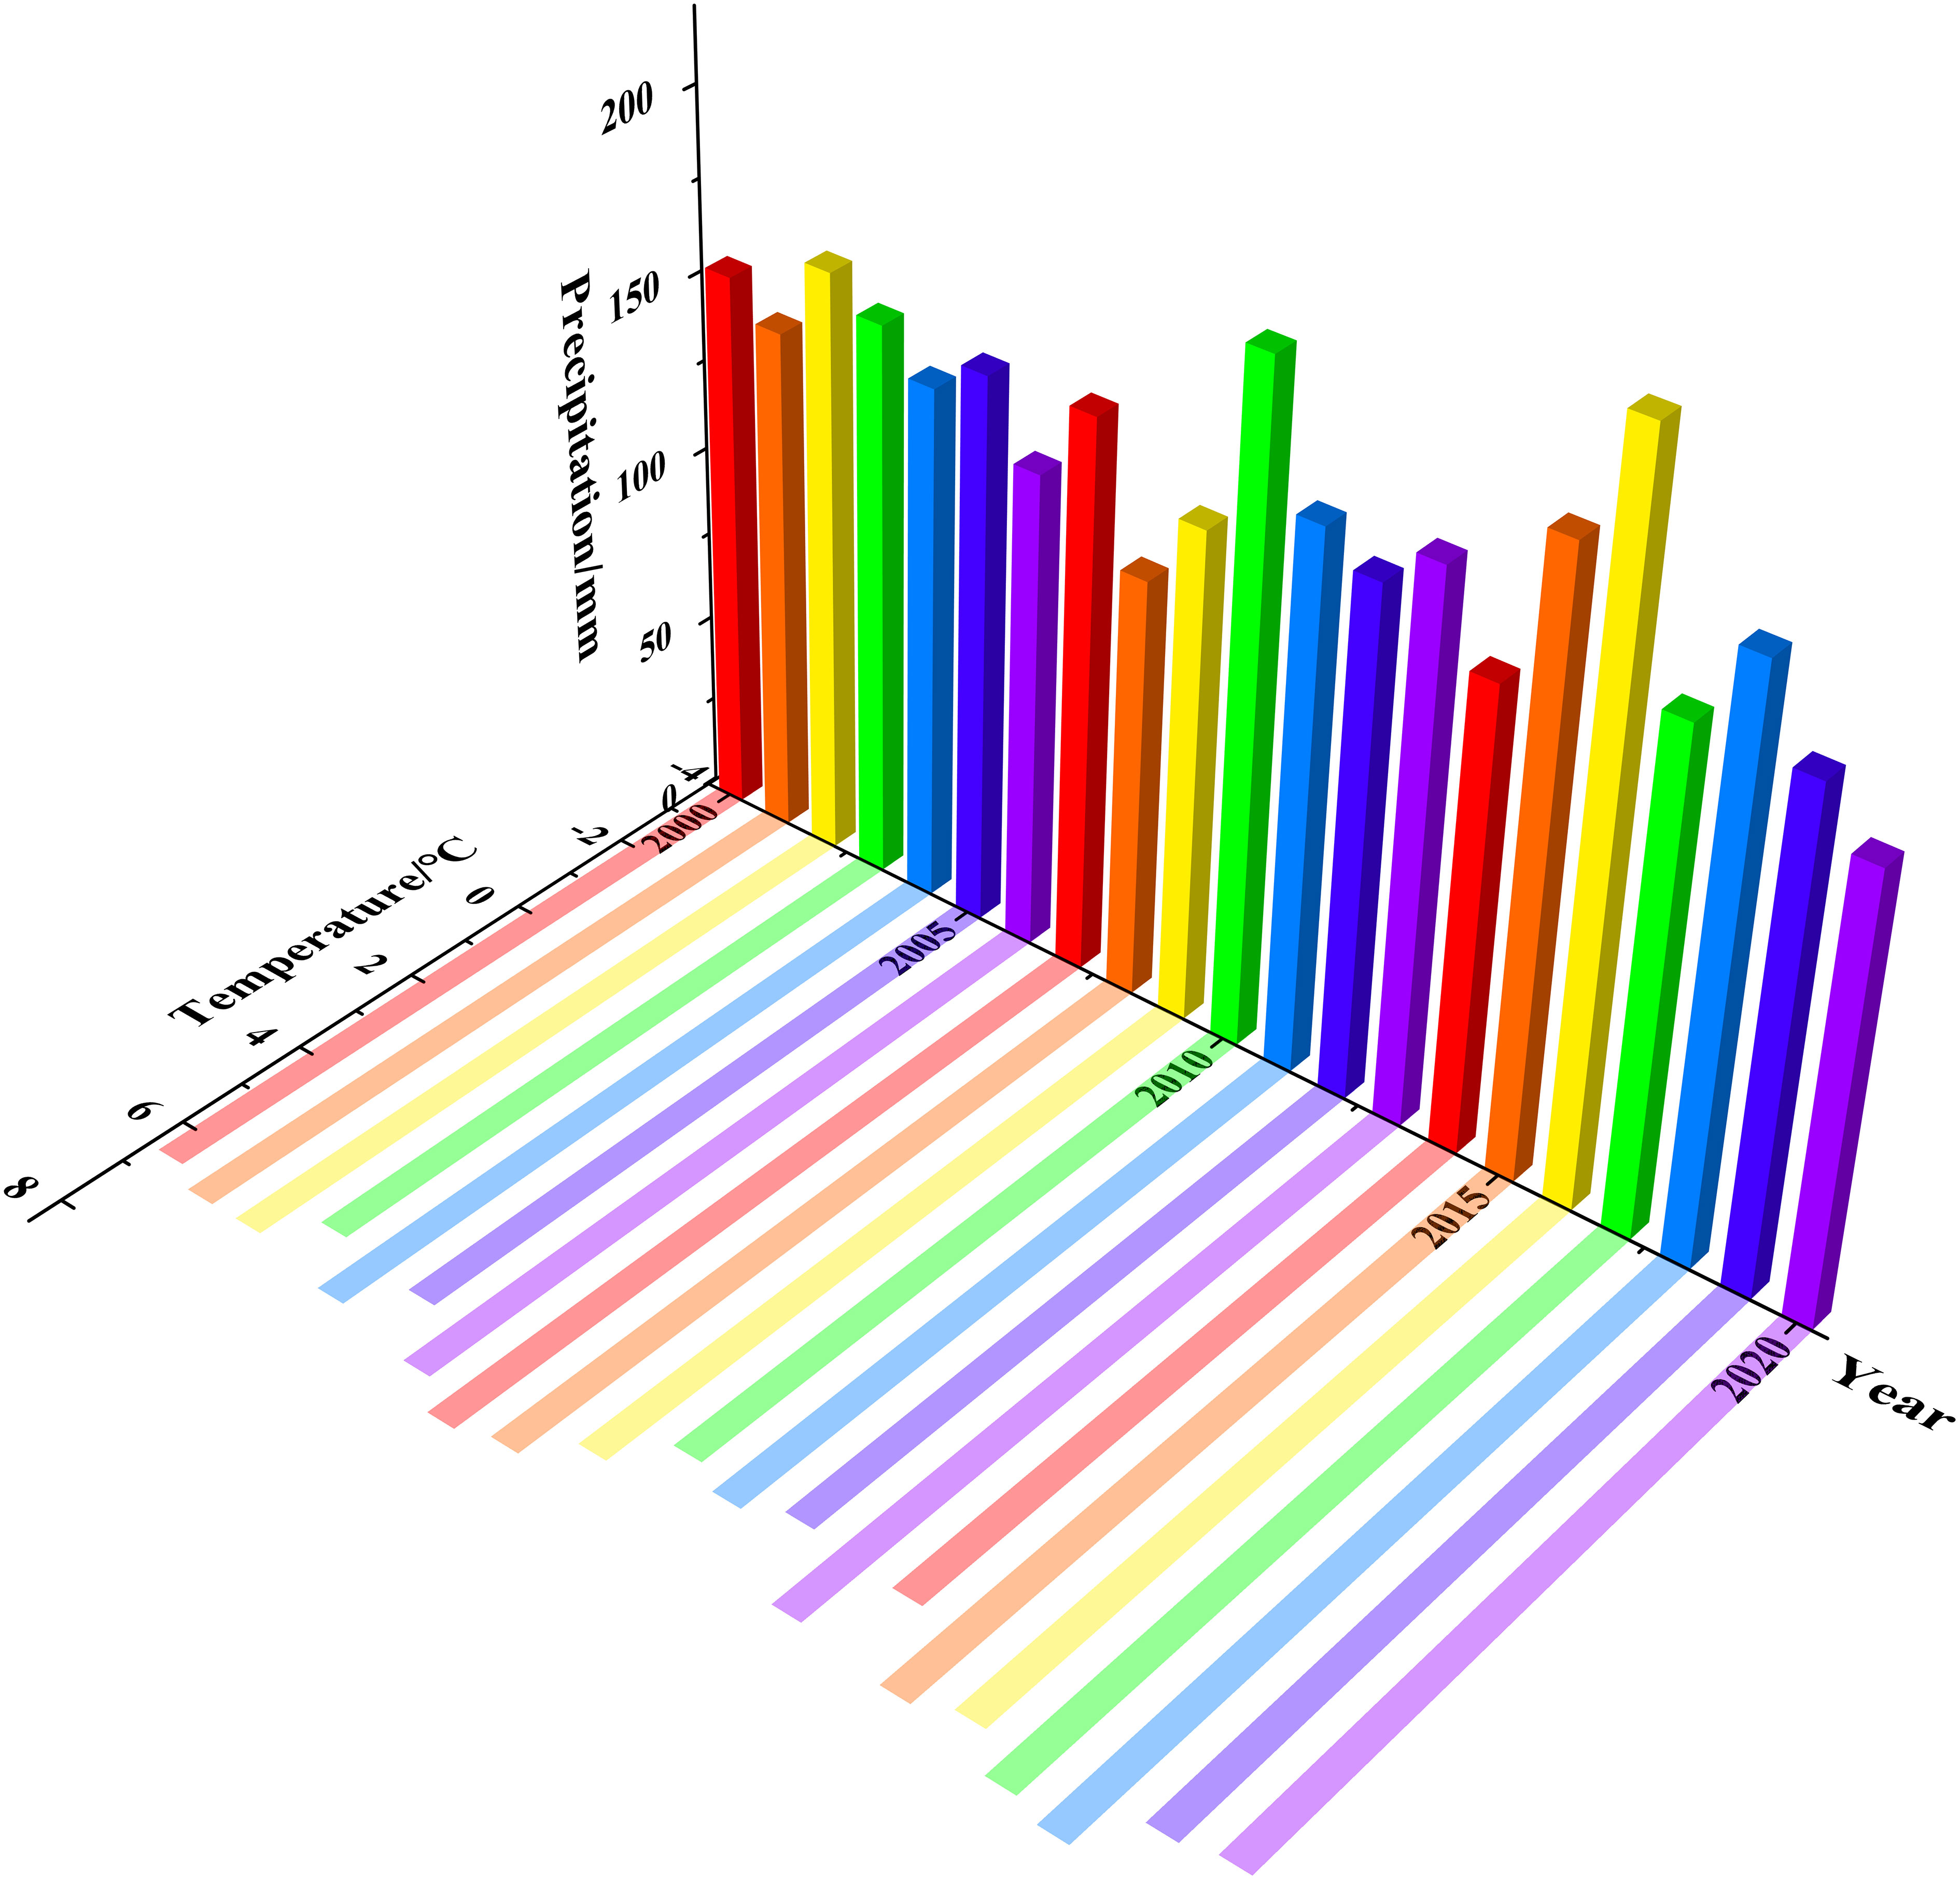
Figure 6 presents the variation trend of mean temperature and precipitation in northern Xinjiang. As can be seen in the figure, the average temperature during the study period was 7.12°C. The lowest temperature was 6.2°C in 2003 and the highest temperature was 8.2°C in 2018, with a difference of 2°C between the lowest and highest temperatures. This indicates that the temperature changed significantly just within 20 years. One of the two major changes occurred in 2013 and the other in 2014. Although there were some small fluctuations in temperature in other periods, the overall change was a rising trend, with a change rate of 0.048. It is not difficult to see from Figure 7A that the highest temperature is mainly concentrated in the Turpan Basin (Figure 1, 10) in the southeast of the study area, and the temperature in the north slope of the Tianshan Mountains is relatively low. Compared with the average temperature, the variation range of average precipitation is larger, and the difference between 2008–2010 and 2014–2016 is more obvious, with the highest difference of 78.2 mm and the trend of change reaching 0.205. The average precipitation in the past 20 years was 153.2 mm, with the highest and lowest values being 210.4 mm in 2016 and 119.2 mm in 2008, respectively. The precipitation is mainly concentrated in Altay Region (Figure 1, 9) in the north of the study area and Tacheng region (Figure 1, 7) in the northwest of the study area (Figure 7B). The overall precipitation showed a distribution pattern of “high in the middle and low on both sides”, while the temperature showed a trend of “low in the middle and high on both sides” on the contrary.
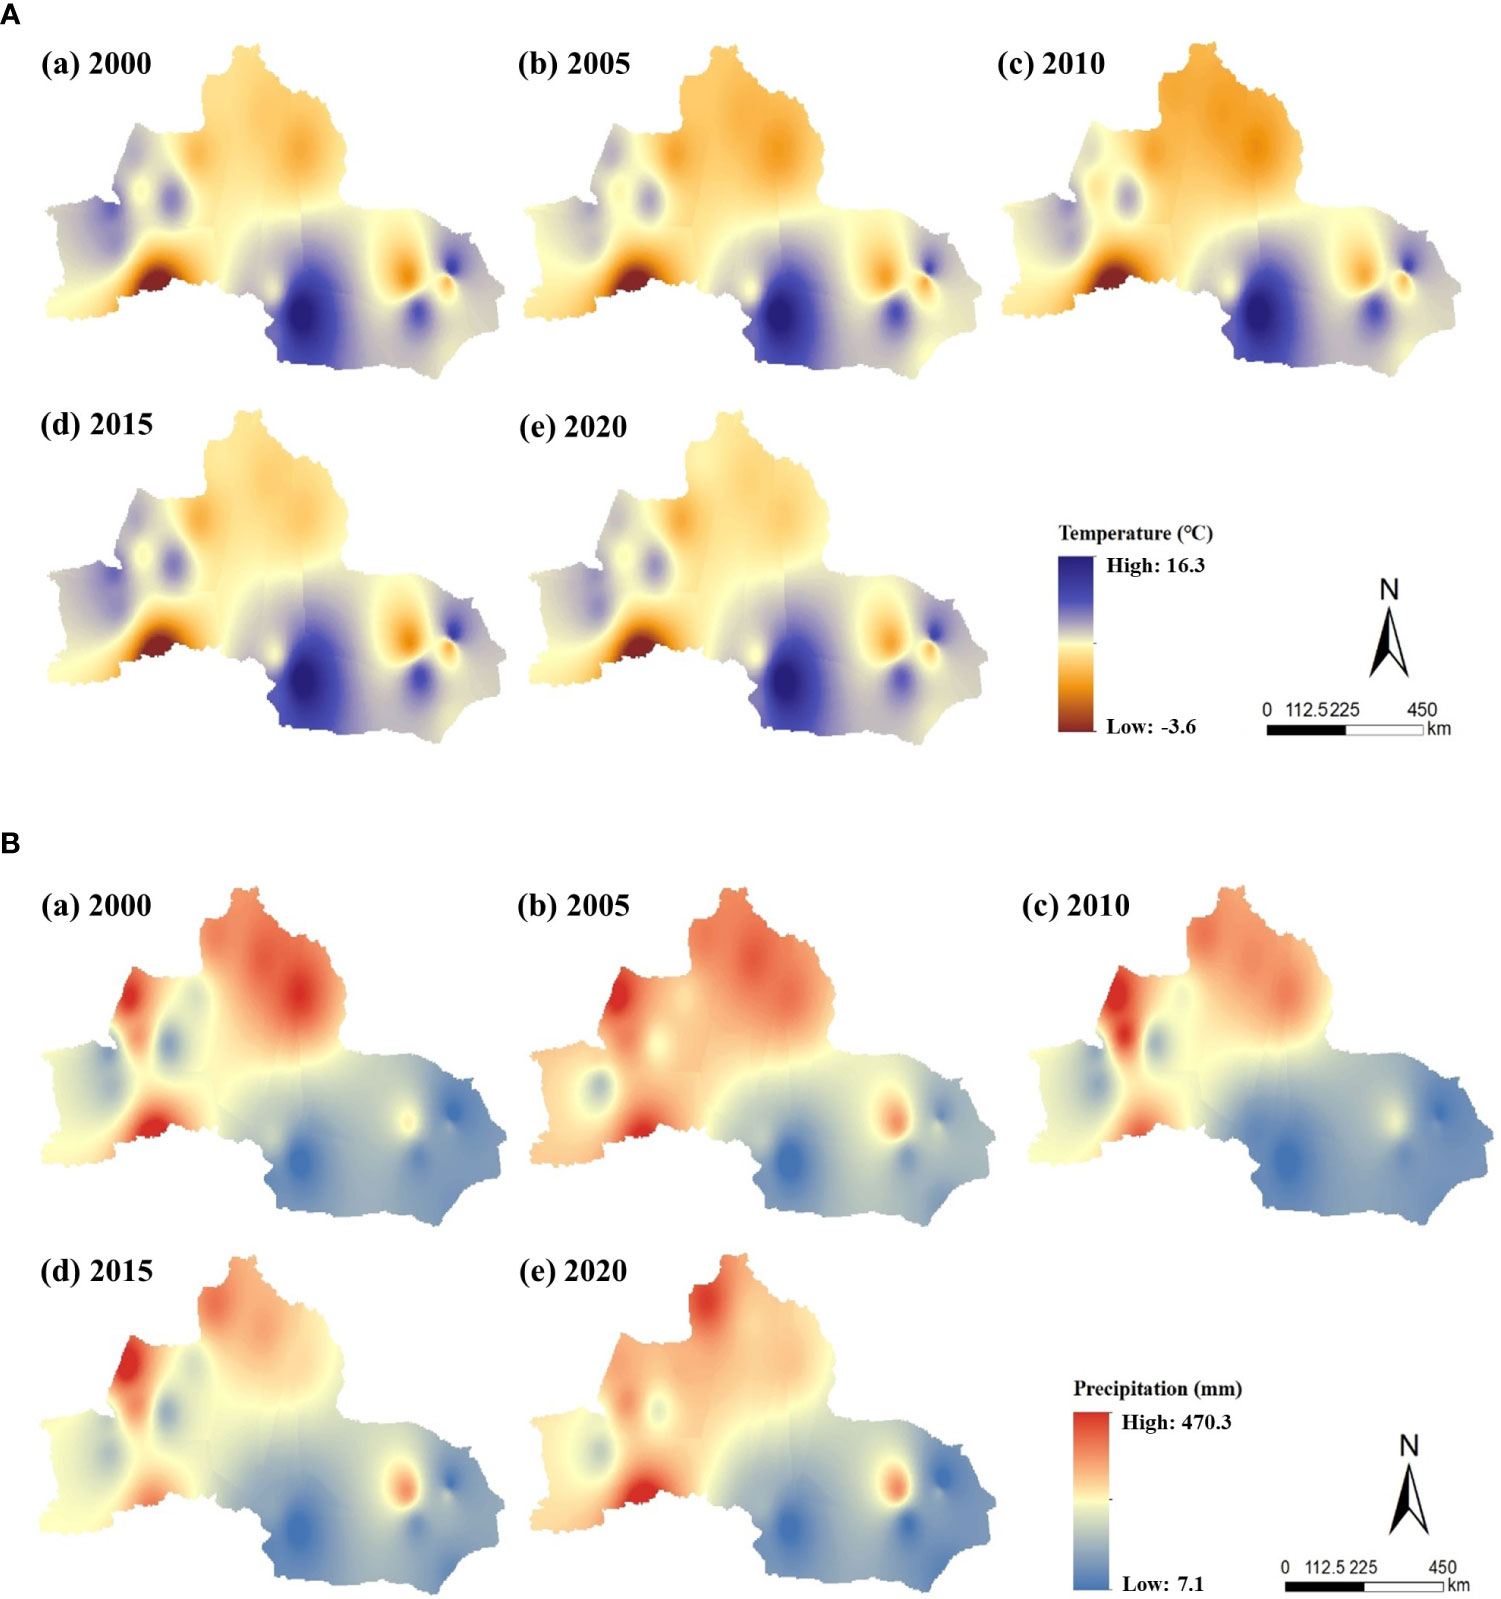
Figure 7 Spatial distribution of climate from 2000 to 2020. (A) Spatial distribution characteristics of air temperature in northern Xinjiang during 2000–2020. (B) Spatial distribution characteristics of precipitation in northern Xinjiang during 2000–2020.
3.3 Temporal and spatial differences of ecological environment quality in the northern Xinjiang
3.3.1 Temporal variation characteristics
The eco-environmental quality index in northern Xinjiang increased from 0.2180 in 2000 to 0.2193 in 2015 before decreasing to 0.2172 in 2020, showing a rising trend followed by a declining one. Overall, however, the eco-environmental quality remained relatively stable. In order to further reveal the correlation between land class transfer and ecological environmental quality, the ecological contribution rate of land-use transformation of each function was calculated. The results (Table 3) show that the improvement of ecological environment quality in the study area from 2000 to 2020 was mainly due to the conversion of other ecological land into grassland ecological land and agricultural production land. This change accounted for 84.79% of the positive effect of the ecological environment, among which the conversion of other ecological land into grassland ecological land accounted for 78.58% of the positive effect of the ecological environment. The conversion of grassland ecological land to woodland ecological land with a higher ecological index is also an important reason for the improvement of ecological environment quality, accounting for 7.10% of the positive effect of the ecological environment. The deterioration of the ecological environment quality was mainly caused by the degradation of grassland ecological land and the encroachment of grassland ecological land on the ecological land of water area, among which the degradation of grassland ecological land into other ecological land accounted for 77.72%.
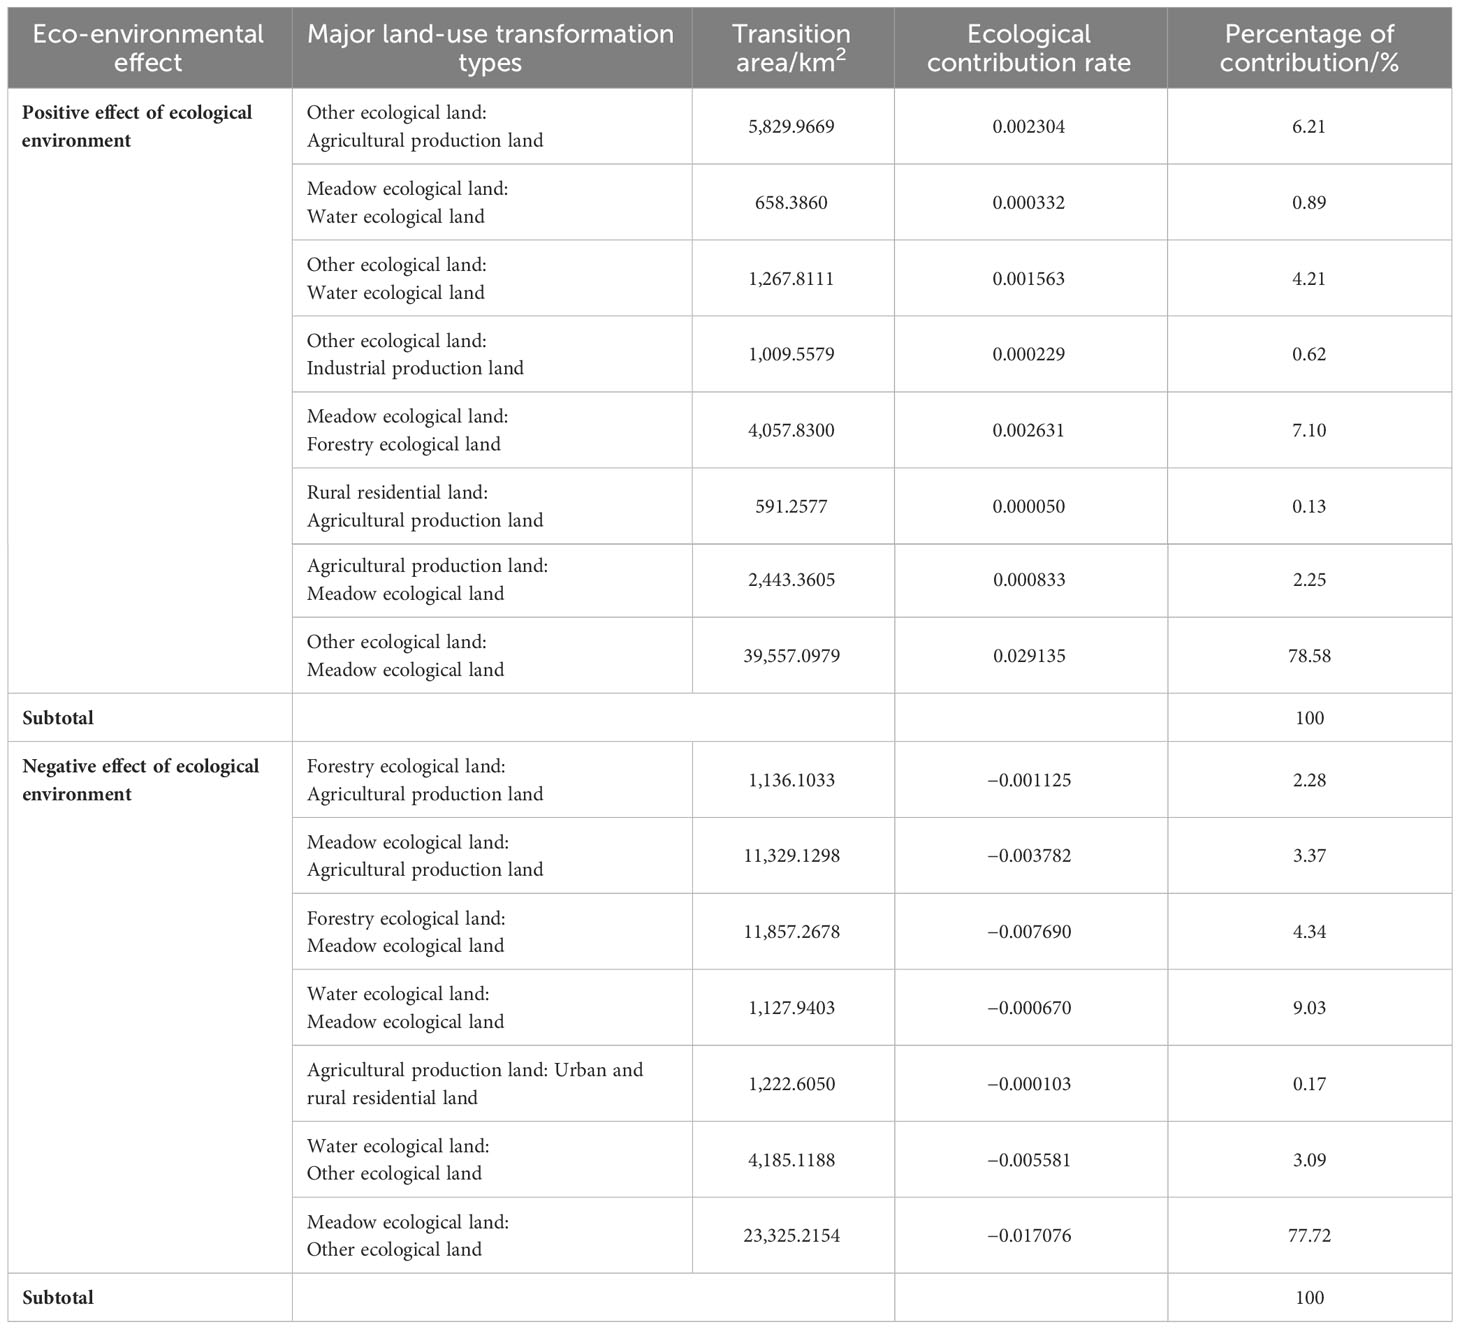
Table 3 Transformation and contribution rate of major functional land types of PLES in northern Xinjiang from 2000 to 2020.
As the trend of ecological environment improvement is slightly smaller than the trend of ecological environment deterioration, the ecological environment quality in the study area decreased slightly. At the same time, given that the region is the key economic zone, occupying an important position in the economic development of Xinjiang, the degree of human activities and resource consumption and utilization was higher than in other regions.
3.3.2 Spatial differentiation characteristics
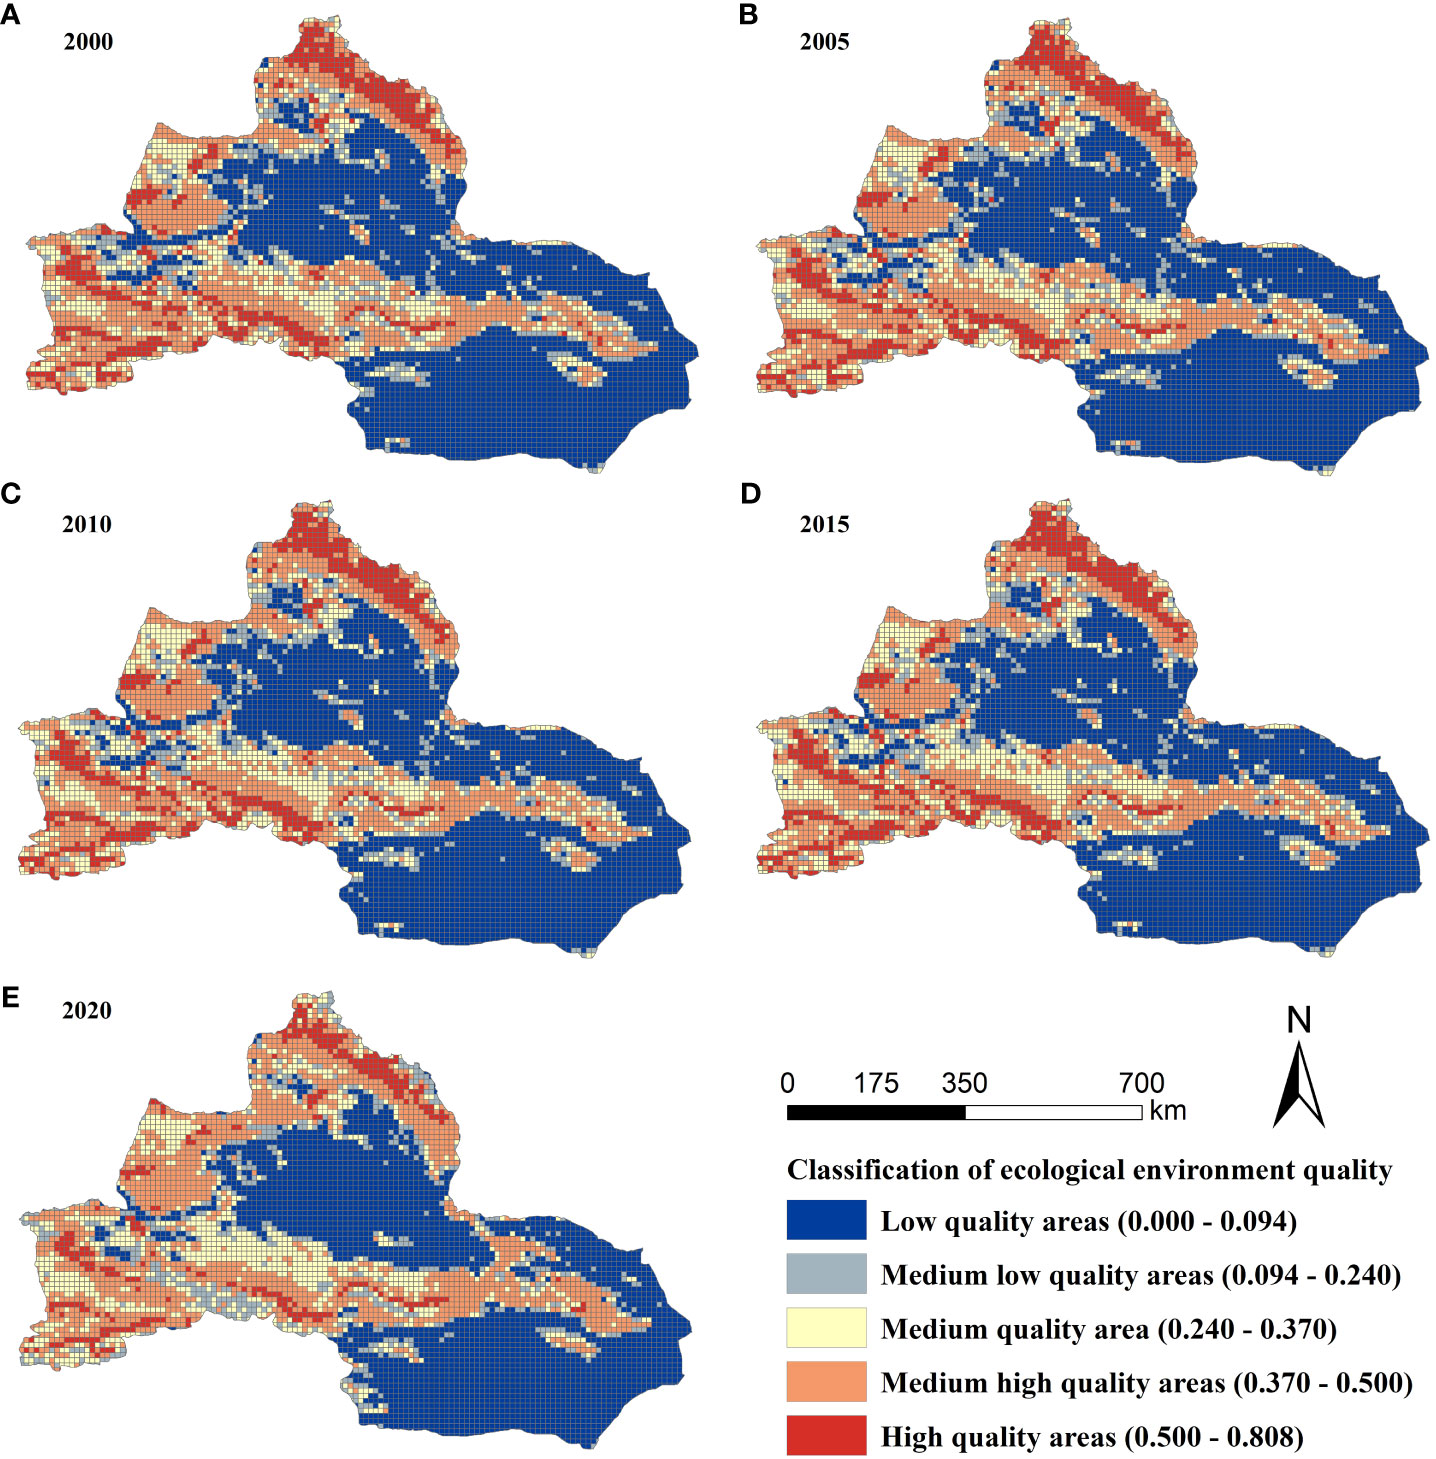
The spatial differentiation of the eco-environmental quality in northern Xinjiang in 2000, 2005, 2010, 2015, and 2020 was characterized based on the grid cell scale and divided into five levels according to the natural break-point method. As can be seen from Figure 8, the spatial differentiation of the eco-environmental quality is significant, showing a pattern of “higher in the southwest, followed by the north, and lower in the southeast and central”. The low-quality areas are mainly concentrated in Turpan Prefecture (Figure 1, 10), Hami Prefecture (Figure 1, 11), Karamay City (Figure 1, 8), and Junggar Basin, and the spatial aggregation characteristics are obvious. The low-quality areas are mainly characterized by more unused land, less vegetation suitable for growth, and more serious desertification. As a typical oasis city in arid region, Karamay City’s ecological environment is relatively fragile, and the overall ecological environment quality level is still not high. The medium low-quality area is mainly distributed in the southern part of Altay Prefecture (Figure 1, 9), which is relatively dispersed. The medium-quality areas, which are mostly located in Urumqi (Figure 1, 1) and Wujiaqu City (Figure 1, 2), are distributed in clusters and situated close to the higher quality areas. From 2015 to 2020, many high-quality regions have been transformed into medium-quality regions, and the level of ecological environment quality has declined, which is mainly attributed to the acceleration of urbanization and the intensification of human activities. High-quality and medium high-quality areas are primarily located in the Yili Kazakh Autonomous Prefecture (Figure 1, 5), the northern slope of the Tianshan Mountains, the Altay Mountains, and west of Tacheng Prefecture (Figure 1, 7), as well as in other mountainous areas with rich forest resources. There are fewer human activities in the mountain and more vegetation types, among which the Altai Mountain has more than 2,000 plant species, and the forest species are mainly Abies sibirica Korsh, larch and aspen. The high level of ecological quality and the abundance of plant species are attributed to the different climatic conditions and the geographical environment with little contact with the outside world.
3.3.3 Ecological environment quality change pattern of nuclear density evolution characteristics
In order to further describe the spatial evolution characteristics of the eco-environmental quality based on the cell grid eco-environmental quality index, the global autocorrelation tool of ArcGIS 10.2 software was used to reveal the spatial pattern. As can be seen from Table 4, Moran’s I index in 2000, 2005, 2010, 2015, and 2020 was 0.8398, 0.8343, 0.8355, 0.8362, and 0.8354, respectively, all with a 99% confidence. The results show that the eco-environmental quality index in the study area has a significant and positive spatial autocorrelation, showing a spatial agglomeration phenomenon. However, from the perspective of index changes, the global Moran’s I index of the research units showed a trend of fluctuation and decline, indicating that the correlation degree of eco-environmental quality index among the research units weakened with the passing of time, such that the trend of strong aggregation turned to weak aggregation.
In order to more intuitively reflect the spatial distribution of the eco-environmental quality index in different time points of the study area, based on the eco-environmental quality index of grid units, the kernel density analysis tool in ArcGIS 10.2 software was used to conduct local spatial autocorrelation analysis. The natural break-point method was used to divide the ecological environment quality index into three equal areas: high-density area, medium-density area, and low-density area (Figure 9).
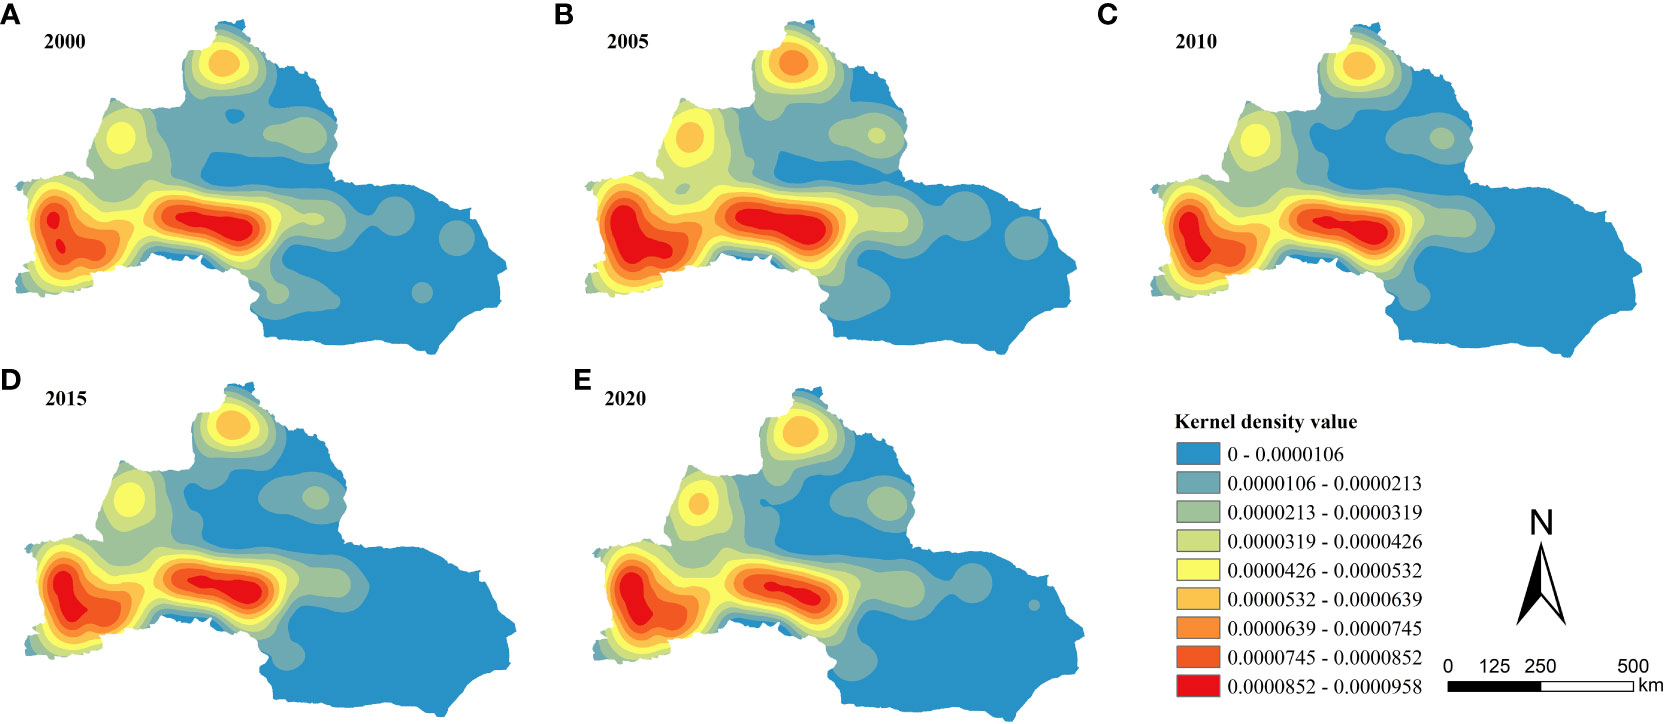
Figure 9 Spatial distribution of ecological environmental quality kernel density from 2000 to 2020 (A–E).
From 2000 to 2020, the kernel density of eco-environmental quality in northern Xinjiang showed a distribution pattern of “dense in the west and sparse in the east”. The high-density area was mainly distributed in the southwest, and the maximum nuclear density showed a trend of fluctuation and decrease, with a gradually weakening aggregation. The medium-density area was mainly distributed in the gathering area of water ecological land and forest ecological land in the northern Altay Prefecture (Figure 1, 9) and Tacheng Prefecture (Figure 1, 7). Low-density areas were widely and evenly distributed in Hami Prefecture (Figure 1, 11), Turpan Prefecture (Figure 1, 10), and southeastern Altay Prefecture.
Specifically, the overall density of the ecological environment quality in 2000 was small, showing a single-core agglomeration pattern. Several sub-agglomeration areas appeared in the northwest and at the edge. Compared with 2000, the ecological environment quality increased significantly in 2005, and the high aggregation area gradually expanded from the core to the outside, with obvious dot distribution. Compared with 2005, the high-density area in 2010 and 2015 gradually narrowed to the center, showing differentiation characteristics of flake, band, and dot coexistence of multi-core aggregation. In 2020, the aggregation difference of the eco-environmental quality was further increased, but the southwest was still the core aggregation area, with an obvious dot distribution pattern. The kernel density index, however, decreased significantly.
3.3.4 Spatial differentiation mechanism of eco-environmental quality
3.3.4.1 Factor detection
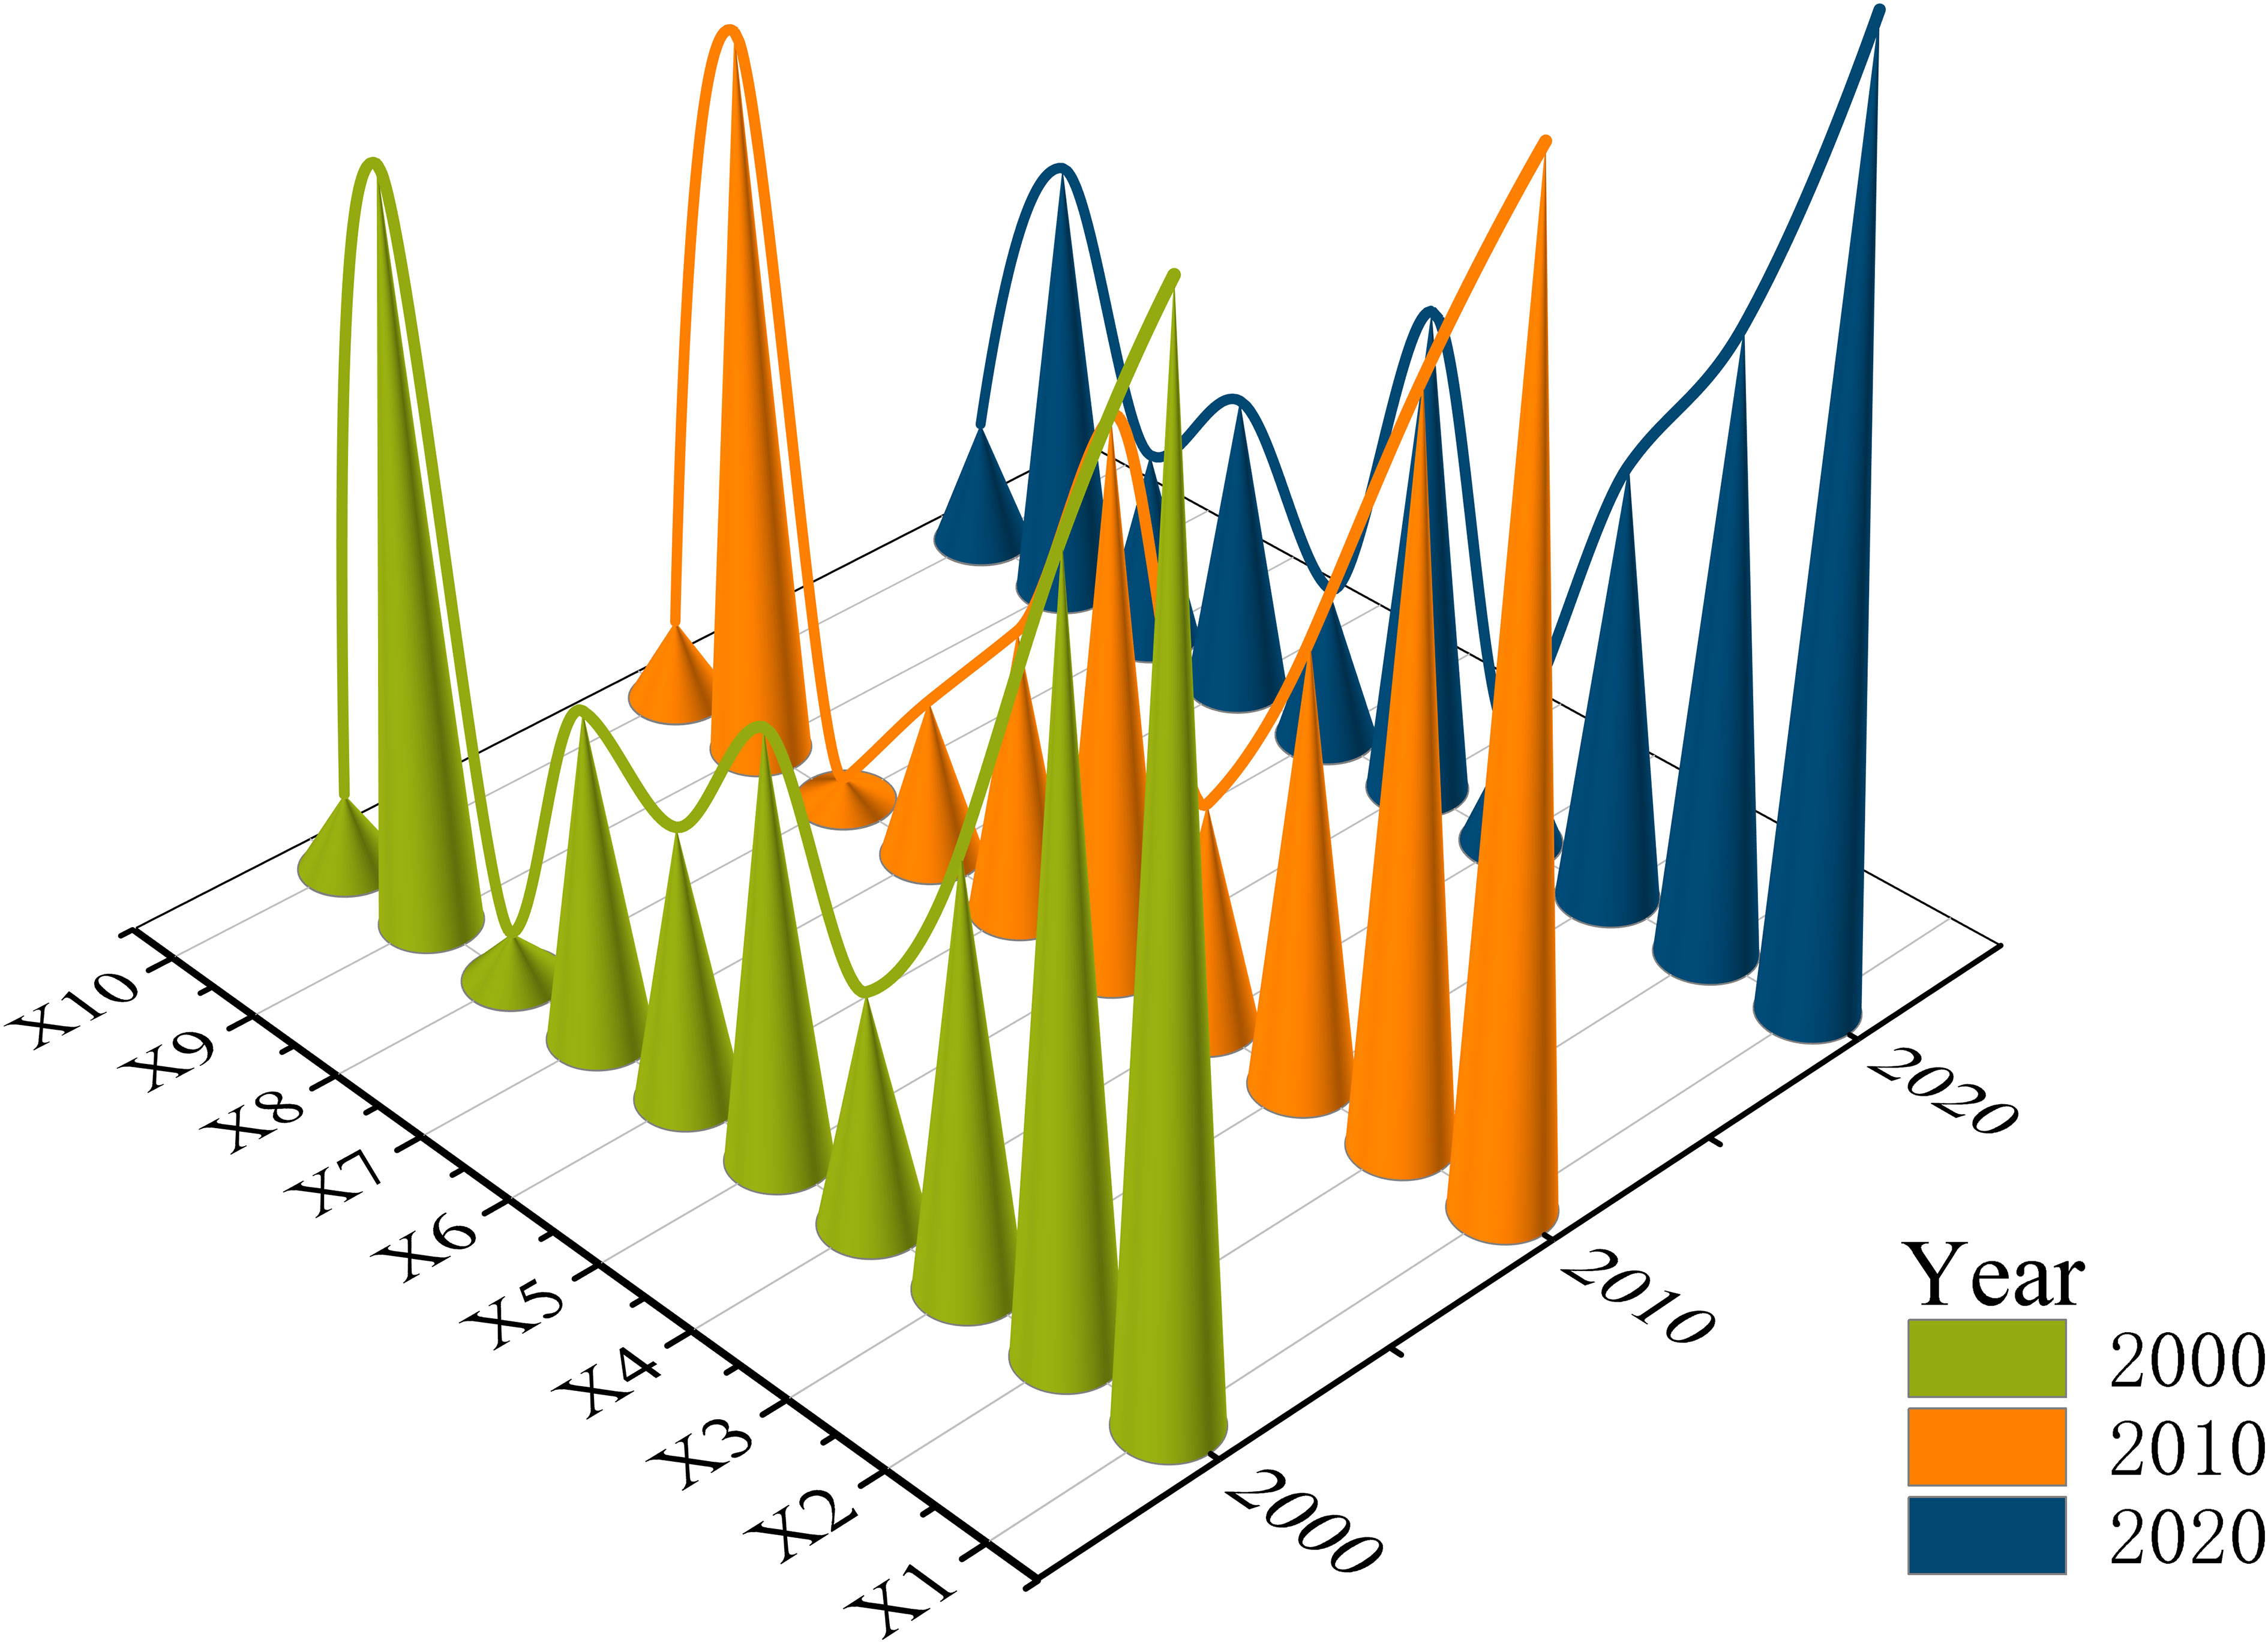
The results for each year represent the interpretation degree of a single driving factor to the distribution of the eco-environmental quality index in PLES. The P values of all factors are 0, indicating that the results pass the significance detection at the 0.05 level, and the models are credible.
The driving factors screened by the study all had a certain degree of influence on the spatial differentiation of the eco-environmental quality in northern Xinjiang (Figure 10). The driving factors in 2000, 2010, and 2020 are sorted according to the size of the q statistic: Elevation (X1) > slope (X2) > distance to water (X9) > precipitation (X5) > NDVI (X3) > gross value of primary industry (X7) > population density (X6) > temperature (X4) > road distance to township level and above (X10) > gross value of secondary industry (X8). The mean value of the q value statistic of natural environmental factors reached 0.871, and the highest value of factor detection in the third phase reached 0.890. The highest q values of elevation and slope were 0.320 and 0.240, respectively, indicating that elevation and slope had the greatest influence on the spatial differentiation of ecological environment quality.
Secondly, the statistic of the q value of distance to water area is close to 0.240, indicating that water resources are also a dominant factor in the spatial differentiation of eco-environmental quality. Finally, the q values of precipitation and NDVI among the natural environmental factors reached above 0.130, wielding a certain degree of influence on the spatial differentiation of regional eco-environmental quality. In addition, along with distance to the water area, the q value of the gross value of the primary industry was more than 10%, and the q value of the remaining factors were all between 5% and 10%, indicating a weak degree of influence on the differentiation of ecological environment quality.
3.3.4.2 Interaction detection
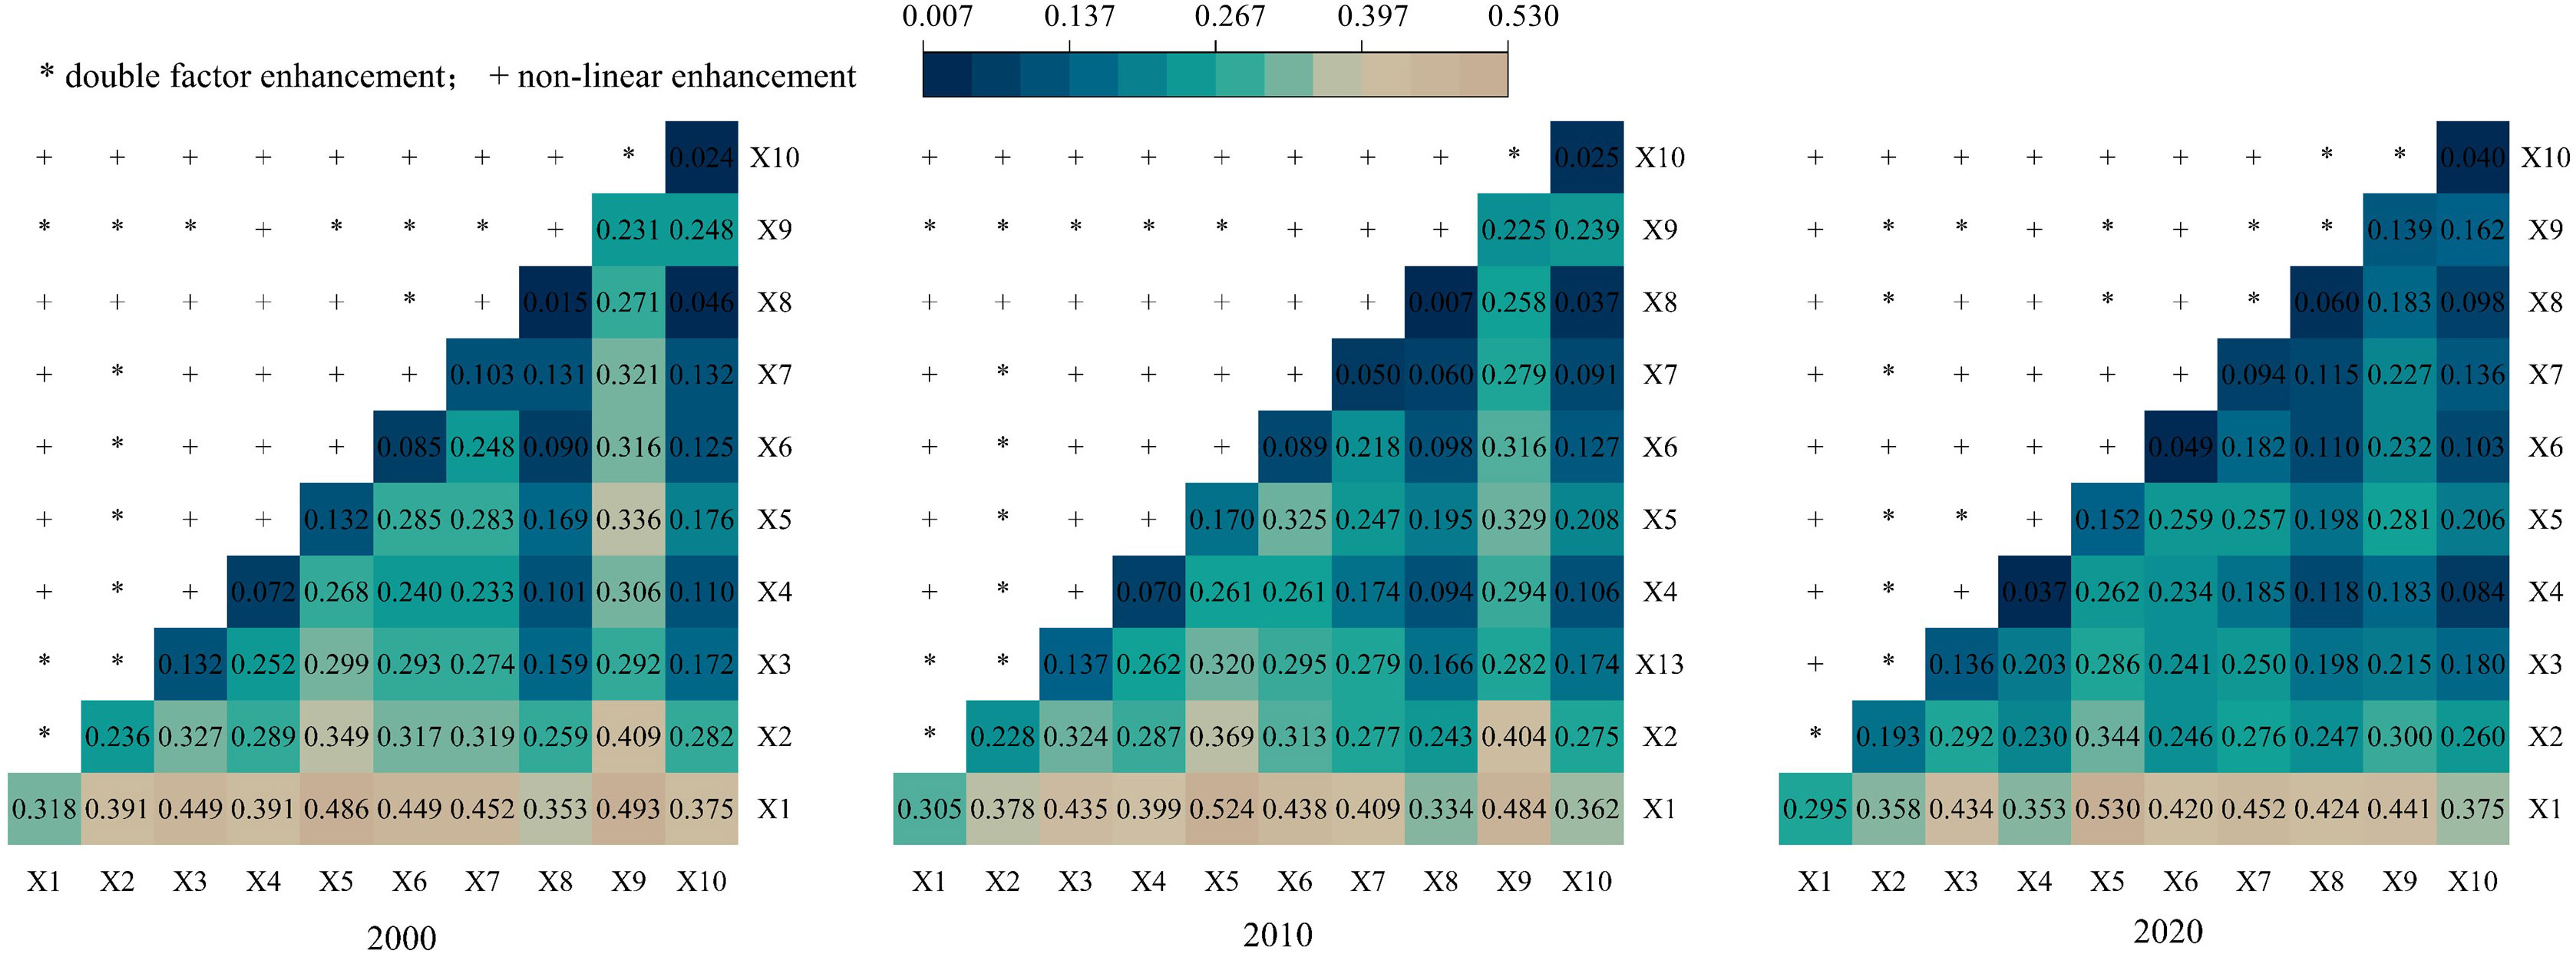
The interaction detection results of the driving factors of spatial differentiation of eco-environmental quality in northern Xinjiang show that the interaction types of the selected factors are mainly double-factor enhancement and non-linear enhancement. This indicates a complex coupling between multiple factors, rather than the existence of a single dominant factor (Figure 11). During 2000–2020, the two factors with the strongest influence on ecological and environmental quality are X1∩X5 (0.530), X1∩X9 (0.493), X1∩X7 (0.452), X1∩X3 (0.449), X1∩X6 (0.449). The interaction within natural environmental factors and between social and economic factors and natural environmental factors is strong, among which the interaction between elevation, slope, and other factors, as well as the interaction between distance to water and other natural environmental factors, is also strong. This is related to the high single-factor explanatory power of elevation itself. The interactive contribution force between elevation and other factors is greater than the contribution force of the largest single factor (X1), and the strongest interaction between them is X1∩X9 (0.493). In particular, the interactive contribution between elevation and other factors is greater than the maximum single factor contribution (X1), while 60% of the interactive contribution between slope and other factors is likewise greater than the maximum single factor contribution (X1). This has a critical impact on the spatial differentiation of ecological environmental quality. The strongest interaction among the natural environment factors is X1∩X5 (0.530) and X1∩X3 (0.449), both of which show significant dual-factor enhancement effect. The interaction among socioeconomic factors was weak, and the strongest one is only X9∩X6 (0.316), but the synergistic enhancement among socioeconomic factors also had a certain impact on the spatial differentiation degree of eco-environmental quality in the study area.
4 Discussion
In this paper, northern Xinjiang region was selected as the research object, and the transformation process of production-living-ecological space and its spatial differentiation mechanism of ecological environment quality were analyzed from the raster and grid cell scales. The results of this study can provide an important reference value for the improvement of micro-scale land-use efficiency as well as the optimization of territorial space and the ecological environment in China’s northwest arid zone. For the study area, the ecological contribution rate of land-use transformation was mainly caused by the conversion between forest, grass and water ecological land, agricultural production land, and other ecological land. In terms of influencing factors of spatial differentiation of eco-environmental quality, the interaction of natural factors and socio-economic factors jointly drove the conversion between land-use types, thus changing the eco-environmental quality. This finding reflects the conclusions of most current research (Chen et al., 2019; Wu et al., 2022; Huang et al., 2023).
The study area is a part of a vast northwest land form. The interaction between the material cycle and energy flow in northern Xinjiang makes the system self-sustaining and regulating. When population and economic development interfere with the system and exceed the range of the system’s adjustable or tolerable capacity, the balance is destroyed (Huang et al., 2022). In recent years, the climate in the study area showed a warming and humidification trend of increasing temperature and precipitation, in which the annual precipitation increased by 20.5%. Spatially, the overall temperature rise in the east and west is greater than that in the north and the south, and the precipitation in the west is greater than that in the east, which is consistent with the research results of Zhang et al. (2019). Under the influence of an arid climate, water ecological land is the key link between production, life, and ecology, and its utilization must be controlled within the range of reasonable system resilience. Moreover, with the implementation of national strategies such as “Western Development” and “Belt and Road”, the economic development pattern, territorial space development, utilization pattern, and ecological security pattern of northern Xinjiang are all in the process of constant evolution and reconstruction (Wu et al., 2016; Xue et al., 2022). For the study area and other similar arid areas, scientific assessment of the scale of production space and ecological space should be made in tandem with accurate calculation of the optimal area proportion of PLES and attention to the coordinated development of the agricultural economy. Ecological protection should be the focus of future decision-making departments and scientific research, not minor afterthoughts (Huang et al., 2022).
Analyzing the data processing results, it is not difficult to find that the industrial production land in northern Xinjiang continues to accelerate the expansion trend, and the urban expansion on the north slope of Tianshan Mountain is particularly prominent, which is the same as the research results of Wang et al (Ma, 2022). Northern Xinjiang has abundant agricultural and mineral resources, and should pay attention to rational exploitation and utilization of resources in the next development. Regions with low tertiary industry development level should combine the advantages of local ecological environment, develop characteristic tourism projects, vigorously develop ecological tourism, improve the level of service industry, and promote the rapid and steady development of economy. Areas with higher development level should vigorously develop new service industries, while improving the efficiency of land and water resources utilization, and controlling the disorderly expansion of construction land area. Therefore, it is necessary to improve and optimize the land-use structure and industrial structure of oases, and appropriately develop city scales according to their local conditions. For densely populated areas with limited ecological carrying capacity, industrial and population dispersal should be strengthened, ecological immigration measures should be implemented, and the coupling and coordinated development of social, economic, and ecological systems should be promoted (Dong J. H. et al., 2022). At the same time, the government should formulate an environmental protection system that conforms to the actual local conditions, return farmland to grass and forest on woodland and grassland, implement specific measures such as closing mountains and cultivating forests, improve environmental pollution control efforts, and increase investment in environmental governance.
Additionally, the present study analyzed the correlation between the evolution of production-living-ecological space and eco-environmental quality, identified the active areas of eco-environmental quality evolution, and revealed its spatial differentiation mechanism. To a large extent, it can thus provide a theoretical basis for the orderly development of territorial space, the intensive use of land resources, and the effective management and control of ecological risks not only in northern Xinjiang district, but across China’s arid northwest. At the same time, this study may have some limitations in the analysis of the evolution and transfer characteristics of PLES and the discussion on the influencing factors of spatial differentiation. With the help of more detailed data, the next research will aim to systematically explore the evolution characteristics and spatial differentiation mechanisms of ecological environmental quality at micro and multi scales.
5 Conclusions
Taking northern Xinjiang as an example, this paper studied the spatiotemporal pattern of production-living-ecological space transformation using the transfer matrix and remote sensing monitoring data. The ecological environmental effect of the transformation of PLES in the study area from 2000 to 2020 was analyzed by applying the methods of the ecological environmental quality index, kernel density estimation, and ecological contribution rate. The main influencing factors of eco-environmental effects were investigated with the geographical detector model, and the spatial differentiation mechanism was analyzed. The main conclusions are as follows:
(1) From the perspective of the distribution, structure, and function evolution, the dominant PLES type in northern Xinjiang was ecological accommodation land, and the overall trend was decreasing. However, the area change was not significant (dynamic degree: −0.3%). Land for living as well as for key ecological and production purposes continued to expand. The production land area increased the most (16,308.6318 km2), and the industrial production land (dynamic degree: 18.26%) and urban living land (dynamic degree: 6.18%) showed the most obvious growth trend.
(2) From the perspective of PLES transformation, the ecological and environmental quality of the study area was basically stable from 2000 to 2020, the ecological and environmental quality index decreased slightly. The eco-environmental quality index increased from 0.2180 in 2000 to 0.2193 in 2015 and finally dropped to 0.2172 in 2020, showing an increasing trend followed by a decreasing one. In terms of spatial distribution, the eco-environmental quality index has a clustering phenomenon. The ecological environment quality of Turpan Prefecture (Figure 1, 10), Hami Prefecture (Figure 1, 11) and Karamay City (Figure 1, 8) is low, and the ecological environment quality of Yili Kazakh Autonomous Prefecture (Figure 1, 5), and Altay Mountains with more vegetation is high.
(3) The main influencing factors and differentiation mechanisms of eco-environmental effects were elevation, slope, and distance from water area, but precipitation and NDVI were also important influencing factors. The interaction between natural environmental factors was stronger than that between social and economic factors, the interaction between elevation and precipitation was the strongest among natural environmental factors (0.530). Ultimately, the constant interaction between the factors (e.g., the positive effects of the ecological environment caused by the reduction of other ecological land, and the negative effects caused by the degradation of the ecological land of water and forest) resulted in a pattern of slight decline in the overall ecological environment quality in the study area.
Data availability statement
The original contributions presented in the study are included in the article/supplementary files, further inquiries can be directed to the corresponding author.
Author contributions
YiW and YaW conceived the study design and implemented the field research. WX and ZS collected and analyzed the data for this study. ZZ and HT applied statistics, mathematics, or other forms of technology to analyze or research data. YiW wrote the paper with the help of YaW. All authors have read and agreed to the published version of the manuscript.
Funding
This research was funded by the Research on Land Use/Cover and Vegetation Dynamics in Weigan-Kaxgar River Basin (Grant No: G2019-02-17).
Acknowledgments
The Research on Land Use/Cover and Vegetation Dynamicsin in Weigan-Kaxgar River Basin is acknowledged for logistical support and funding.
Conflict of interest
The authors declare that the research was conducted in the absence of any commercial or financial relationships that could be construed as a potential conflict of interest.
Publisher's note
All claims expressed in this article are solely those of the authors and do not necessarily represent those of their affiliated organizations, or those of the publisher, the editors and the reviewers. Any product that may be evaluated in this article, or claim that may be made by its manufacturer, is not guaranteed or endorsed by the publisher.
References
Chen W. X., Li J. F., Zeng J., Ran D., Yang B. (2019). Spatial heterogeneity and formation mechanism of eco-environmental effect of land use change in China. Geographical Res. 38 (09), 2173–2187.
Cui X. H., Xu N., Chen W. X., Wang G. Z., Liang J. L., Pan S. P., et al. (2022). Spatio-temporal variation and influencing factors of the coupling coordination degree of production-living-ecological space in China. Int. J. Environ. Res. Public Health 19 (16), 26. doi: 10.3390/ijerph191610370
Deng M. J. (2020). Development pattern of production-living-ecological spaces and construction of a smart water network system for the Economic Belt on the North Slope of the Tianshan Mountains. Arid Land Geogr. 43 (05), 1155–1168.
Ding L. L., Wang Q., Chen X., Tang J. J. (2019). The responses of ecosystem services to land-use change in Dianshan Lake area from 1984 to 2014. Acta Ecologica Sin. 39 (08), 2973–2985. doi: 10.5846/stxb201801220166
Dong Y. K., Ma W., Tan Z. W., Wang Y., Zeng W. J. (2022). Spatial and temporal variation of multiple eco-environmental indicators in Erhai Lake Basin of China under land use transitions. Environ. Sci. pollut. Res. Int. 30 (6), 16236–16252. doi: 10.1007/s11356-022-23279-z
Dong J. H., Zhang Z. B., Liu B. T., Zhang X. H. (2022). Geographical exploration of the spatial differentiation mechanism of eco-environmental quality in northwest China from the perspective of "production-living-ecological" space. Arid Land Geogr. 46 (04), 515–526.
Fan S. P., Cheng C. K., Liu Y. Z., Zhang H. M., Yu R. (2017). Review and prospect on land use /cover research in China. Areal Res. Dev. 36 (02), 94–101.
Fang Y. S., Ai D., Yang Y. T., Sun W. J., Zu J. (2022). Multi-objective spatial suitability evaluation and conflict optimization considering productivity, sustainability, and livability in southwestern mountainous areas of China. Sustainability 14 (1), 23. doi: 10.3390/su14010371
Fu J. Y., Bu Z. Q., Jiang D., Lin G. (2022). Identification and classification of urban PLES spatial functions based on multisource data and machine learning. Land 11 (10), 17. doi: 10.3390/land11101824
Gao X., Liu Z. W., Li C. X., Cha L. S., Song Z. Y., Zhang X. R. (2020). Land use function transformation in the Xiong'an New Area based on ecological-production-living spaces and associated eco-environment effects. Acta Ecologica Sin. 40 (20), 7113–7122.
Gao S. Q., Yang L., Jiao H. Z. (2022). Changes in and patterns of the tradeoffs and synergies of production-living-ecological space: A case study of longli county, guizhou province, China. Sustainability 14 (14), 18. doi: 10.3390/su14148910
Han Z. L., Zhao W. Z., Yan X. L., Zhong J. Q., Meng Q. Q. (2019). The evolution of ecological security pattern based on the profit and loss analysis of ecosystem services: Taking Wafangdian County as a case. Acta Ecologica Sin. 39 (22), 8370–8382. doi: 10.5846/stxb201809071916
Hou Y. F., Chen Y. N., Ding J. L., Li Z., Li Y. P., Sun F. (2022). Ecological impacts of land use change in the arid tarim river basin of China. Remote Sens. 14 (8), 16. doi: 10.3390/rs14081894
Hu X. S., Xu H. Q. (2018). A new remote sensing index for assessing the spatial heterogeneity in urban ecological quality: A case from Fuzhou City, China. Ecol. Indic. 89, 11–21. doi: 10.1016/j.ecolind.2018.02.006
Huang X., Cheng W. S., Li X. D., Yang C. Y., Huang Q. Q. (2023). Recognition on the changes and driving factors of eco-environmental effect of land use transformation in arid inland river basin. Res. Soil Water Conserv. 30 (02), 324–332. doi: 10.13869/j.cnki.rswc.2023.02.040
Huang J., Xue D. Q., Dong C. Y., Wang C. S., Zhang C., Ma B. B., et al. (2022). Eco-environmental effects and spatial differentiation mechanism of land use transition in agricultural areas of arid oasis: A perspective based on the dominant function of production-living-ecological spaces. Prog. Geogr. 41 (11), 2044–2060. doi: 10.18306/dlkxjz.2022.11.005
Huang H., Zhou Y., Qian M. J., Zeng Z. Q. (2021). Land use transition and driving forces in chinese loess plateau: A case study from pu county, shanxi province. Land 10 (1), 15. doi: 10.3390/land10010067
Jiang X. T., Zhai S. Y., Liu H., Chen J., Zhu Y. Y., Wang Z. (2022). Multi-scenario simulation of production-living-ecological space and ecological effects based on shared socioeconomic pathways in Zhengzhou, China. Ecol. Indic. 137, 16. doi: 10.1016/j.ecolind.2022.108750
Kuang B., Lu X. H., Zhou M., Rao Y. X. (2017). Analysis of spatial-temporal evolution of urban land economic density disparity in prefecture-level cities of China [J]. Scientia Geographica Sin. 37 (12), 1850–1858.
Li Y. R., Cao Z., Long H. L., Liu Y. S., Li W. J. (2017). Dynamic analysis of ecological environment combined with land cover and NDVI changes and implications for sustainable urban-rural development: The case of Mu Us Sandy Land, China. J. Clean. Prod. 142, 697–715. doi: 10.1016/j.jclepro.2016.09.011
Li C. X., Wu J. Y. (2022). Land use transformation and eco-environmental effects based on production-living-ecological spatial synergy: evidence from Shaanxi Province, China. Environ. Sci. pollut. Res. 29 (27), 41492–41504. doi: 10.1007/s11356-022-18777-z
Li K., Zhang B. Y., Xiao W. D., Lu Y. (2022). Land use transformation based on production-living-ecological space and associated eco-environment effects: A case study in the yangtze river delta urban agglomeration. Land 11 (7), 15. doi: 10.3390/land11071076
Lin G., Jiang D., Fu J. Y., Zhao Y. (2022). A review on the overall optimization of production-living-ecological space: theoretical basis and conceptual framework. Land 11 (3), 15. doi: 10.3390/land11030345
Liu J. Y., Liu M. L., Deng X. Z., Zhuang D. F., Zhang Z. X., Luo D. (2002). The land use and land cover change database and its relative studies in China. J. Geographical Sci. 12 (3), 275–282. doi: 10.1007/BF02837545
Liu Y. Q., Long H. L., Li T. T., Tu S. S. (2015). Land use transitions and their effects on water environment in Huang-Huai-Hai Plain, China. Land Use Policy 47, 293–301. doi: 10.1016/j.landusepol.2015.04.023
Luo W. Z., Jin C., Shen L. Y. (2022). The evolution of land resource carrying capacity in 35 major cities in China. Sustainability 14 (9), 18. doi: 10.3390/su14095178
Ma H. T. (2022). Spatiotemporal analysis of land use changes and their trade-offs on the northern slope of the Tianshan Mountains, China. Front. Ecol. Evol. 10. doi: 10.3389/FEVO.2022.1016774
Martinez Y. M., Coll D. G., Aguayo M., Casas-Ledon Y. (2019). Effects of landcover changes on net primary production (NPP)-based exergy in south-central of Chile. Appl. Geogr. 113, 11. doi: 10.1016/j.apgeog.2019.102101
Nie W. B., Yang F., Xu B., Bao Z. Y., Shi Y., Liu B. T., et al. (2022). Spatiotemporal evolution of landscape patterns and their driving forces under optimal granularity and the extent at the county and the environmental functional regional scales. Front. Ecol. Evol. 10. doi: 10.3389/fevo.2022.954232
Pang R. Q., Hu N., Zhou J. R., Sun D. Q., Ye H. Y. (2022). Study on eco-environmental effects of land-use transitions and their influencing factors in the central and southern liaoning urban agglomeration: A production-living-ecological perspective. Land 11 (6), 22. doi: 10.3390/land11060937
Song W. J., Zhang Q., Liu S. S., Yang J. N. (2018). LUCC-based human disturbance and ecological security in arid area:A case study in the economic zone on northern slope of the tianshan mountains. Arid Zone Res. 35 (01), 235–242. doi: 10.13866/j.azr.2018.01.29
Tao Y. Y., Wang Q. X. (2021). Quantitative recognition and characteristic analysis of production-living-ecological space evolution for five resource-based cities: zululand, xuzhou, lota, surf coast and ruhr. Remote Sens. 13 (8), 18. doi: 10.3390/rs13081563
Wang J. (2022). Study on the spatiotemporal changes ofecological environment and land use in the central area of Urumqi [D] (Xinjiang University). doi: 10.27429/d.cnki.gxjdu.2021.000590
Wang A. Y., Liao X. Y., Tong Z. J., Du. W. L., Zhang J. Q., Liu X. P., et al. (2022). Spatial-temporal dynamic evaluation of the ecosystem service value from the perspective of "production-living-ecological" spaces: A case study in Dongliao River Basin, China. J. Clean. Prod. 333, 13. doi: 10.1016/j.jclepro.2021.130218
Wang Y., Shataer R., Xia T., Chang X. E., Zhen H., Li Z. (2021). Evaluation on the change characteristics of ecosystem service function in the northern xinjiang based on land use change. Sustainability 13 (17), 9679. doi: 10.3390/su13179679
Wang S., Tian J., Namaiti A., Lu J. M., Song Y. Z. (2023). Spatial pattern optimization of rural production-living-ecological function based on coupling coordination degree in shallow mountainous areas of Quyang County, Hebei Province, China. Front. Ecol. Evol. 11. doi: 10.3389/fevo.2023.1169007
Wang J., Wang J., Xu J. Q. (2023). Spatio-temporal variation and prediction of ecological quality based on remote sensing ecological index - a case study of Zhanjiang City, China. Front. Ecol. Evol. 11. doi: 10.3389/fevo.2023.1153342
Wang J., Xu C. (2017). Geodetector: principle and prospective. Acta Geographica Sin. 72 (1), 116–134.
Wu Y., Wu Y. M., Chen Y. J., Li C., Gao B. P., Zheng K. J., et al. (2022). Eco-environmental effects and driving factors of ecological-production-living spatial evolution in plateau lake basin: A case study in the Dianchi basin. Southwest China J. Agric. Sci. 35 (10), 2265–2275. doi: 10.16213/j.cnki.scjas.2022.10.005
Wu Y. J., Yang Y. Z., Yang L., Zhang C., You Z. (2016). Land spatial development and suitability for city construction based on ecological-living-industrial space——take Ningbo City as an example. Resour. Sci. 38 (11), 2072–2081.
Xue L., Kappas M., Wyss D., Wang C. Q., Putzenlechner B., Thi N. P., et al. (2022). Assessment of climate change and human activities on vegetation development in northeast China. Sensors 22 (7), 2509. doi: 10.3390/s22072509
Yang Q. K., Duan X. J., Wang L., Jin Z. F. (2018). Land use transformation based on ecological-production-living spaces and associated eco-environment effects: A case study in the yangtze river delta. Scientia Geographica Sin. 38 (01), 97–106. doi: 10.13249/j.cnki.sgs.2018.01.011
Yang F., Qian Y. R., Li J. L., Yang Q., Yang Z. M. (2011). Degradation characteristics and causes of desert grassland in the northern tianshan mountains. J. Nat. Resour. 26 (08), 1306–1314.
Yu L., Lyu Y. C., Chen C., Choguill C. L. (2021). Environmental deterioration in rapid urbanisation: evidence from assessment of ecosystem service value in Wujiang, Suzhou. Environ. Dev. Sustainability 23 (1), 331–349. doi: 10.1007/s10668-019-00582-3
Zhai Y. X., Zhang Y. F., Ma L. N. (2022). Changes of production-living-ecology land transformation and eco-environmental effects in xinjiang in last 40 years. Chin. J. Soil Sci. 53 (03), 514–523. doi: 10.19336/j.cnki.trtb.2021073102
Zhang Y., Chu X. Z., Yang S. M., Guo C. (2019). Climate change in north xinjiang in recent 56 years. Arid Zone Res. 36 (01), 212–219. doi: 10.13866/j.azr.2019.01.24
Zhang S., Wang Y., Wang Y., Li Z., Hou Y. F. (2023). Spatiotemporal evolution and influencing mechanisms of ecosystem service value in the tarim river basin, northwest China. Remote Sens. 15 (3), 591. doi: 10.3390/rs15030591
Keywords: PLES, eco-environmental, natural environmental factors, socio-economic factors, geographic detector model, northern Xinjiang
Citation: Wang Y, Wang Y, Xu W, Sheng Z, Zhu Z and Tang H (2023) Eco-environmental effect and driving factors of changing “production-living-ecological space” in northern Xinjiang, China. Front. Ecol. Evol. 11:1248702. doi: 10.3389/fevo.2023.1248702
Received: 27 June 2023; Accepted: 25 August 2023;
Published: 14 September 2023.
Edited by:
Weili Duan, Chinese Academy of Sciences (CAS), ChinaReviewed by:
Zhongsheng Chen, China West Normal University, ChinaChangchun Xu, Xinjiang University, China
Copyright © 2023 Wang, Wang, Xu, Sheng, Zhu and Tang. This is an open-access article distributed under the terms of the Creative Commons Attribution License (CC BY). The use, distribution or reproduction in other forums is permitted, provided the original author(s) and the copyright owner(s) are credited and that the original publication in this journal is cited, in accordance with accepted academic practice. No use, distribution or reproduction is permitted which does not comply with these terms.
*Correspondence: Yang Wang, d2FuZ3lhbmdAeGphdS5lZHUuY24=
 Yin Wang
 Yang Wang*
