 Yanqing Chen
- Tianjin University of Technology, Tianjin, China
Introduction: Carbon-neutral enterprise environmental performance assessment is an important method for evaluating the impact and benefits of enterprises on the environment during the process of achieving carbon neutrality. This paper proposes a method for evaluating the environmental performance of carbon-neutral enterprises using the Transformer-GRU model.
Methods: The proposed method combines the Transformer and GRU models to accurately predict and analyze the environmental performance of carbon-neutral enterprises. The Transformer model is used to extract features, and the GRU model is used for sequence modeling, which improves the model's prediction accuracy and generalization ability. The method is validated using actual enterprise data for experimental verification.
Results: The experiments show that the proposed method has significant practical significance in evaluating the environmental performance of carbon-neutral enterprises. The method accurately predicts and analyzes the enterprise's carbon emissions, energy consumption, wastewater and gas discharge, and solid waste treatment.
Discussion: The proposed method provides a new approach for evaluating the environmental performance of carbon-neutral enterprises. The combination of the Transformer and GRU models can effectively improve the accuracy and generalization ability of the model. The method can be used to help enterprises evaluate their environmental performance and make decisions to achieve carbon neutrality.
1 Introduction
Carbon-neutral enterprise environmental performance assessment is a method to evaluate the impact and benefits of enterprises on the environment in the process of realising carbon neutrality. The evaluation content includes the enterprise’s carbon emissions, energy consumption, wastewater and gas discharge, and solid waste treatment (Vakharia et al., 2023). Under the current background of global climate change and environmental protection, enterprises and society have paid more and more attention to the environmental performance evaluation of carbon-neutral enterprises. More and more companies regard environmental performance as part of corporate social responsibility, actively take measures to reduce carbon emissions and environmental pollution and contribute to realising sustainable development (Desai et al., 2022). Evaluating the environmental performance of enterprises can help enterprises find existing problems and deficiencies, provide a reference for enterprises to set environmental protection and carbon emission reduction goals, and promote sustainable development of enterprises. Therefore, this paper proposes a carbon-neutral enterprise environmental performance evaluation model based on the Transformer-GRU model to help enterprises fully understand their environmental performance in carbon neutrality, discover existing problems and deficiencies, and propose improvement measures. Drive the further development of carbon neutrality and sustainable development.
Transformer-GRU’s carbon-neutral enterprise environmental performance evaluation model, as a relatively novel deep learning algorithm, has self-adaptability advantages, strong feature extraction and high self-attention. It is used to apply carbon-neutral urban enterprise environmental performance evaluation. Good results have been achieved. The system can handle various environmental indicators of enterprises, such as carbon emissions, energy consumption, wastewater and gas emissions, and solid waste treatment. Utilising deep learning techniques, the model can adaptively extract features from these indicators and model the complex relationships among them. In addition, the model can also make predictions based on historical data and other relevant indicators of the enterprise and provide enterprises with personalised environmental performance evaluation services. The prediction results can be visualised, analysed and explained, which will help enterprises better understand the prediction results and formulate corresponding carbon emission reduction measures, thereby promoting the sustainable development of enterprises.
Our study proposes a Transformer-GRU model-based approach to assess the environmental performance of carbon-neutral enterprises, combining natural language processing and sequence modeling techniques to predict and analyze the environmental performance of carbon-neutral enterprises accurately. Our study also achieves experimental validation based on actual enterprise data, which demonstrates the effectiveness and practical application of the proposed method. In addition, our study fills the research gap in the existing literature on the environmental performance assessment of carbon-neutral enterprises based on the Transformer-GRU model. It provides new ideas and methods for research in this field.
The methods commonly used in carbon-neutral corporate environmental performance evaluation mainly include supervised, time series, reinforcement, and deep learning models.
Supervised learning model: Supervised learning is a machine learning method whose basic idea is to use existing labelled data to train the model to realise the prediction and classification of unknown data (Elnour et al., 2022b). In supervised learning, the training data set is divided into a training set and a validation set; the training set is used to train the model, the validation set is used to evaluate the model’s performance, and finally, the model is applied to the test data set.
Common supervised learning models include decision trees, naive Bayesian algorithms, ensemble learning, K-nearest neighbour algorithms, etc (Xi et al., 2021). The advantage of supervised learning applied to carbon-neutral corporate environmental performance evaluation is that it can use existing labelled data for learning, can effectively use existing environmental data, and improve the utilisation efficiency of environmental data; and supervised learning can be used for carbon footprint, energy consumption and other indicators are predicted and classified to help companies understand the sources and influencing factors of carbon emissions and formulate more effective carbon emission reduction strategies. However, the supervised learning model requires much-labelled data support. If the data is insufficient or the labels are inaccurate, the prediction accuracy and generalisation ability of the model may be affected; and the supervised learning model is usually complicated, requiring a large number of computing resources and time for training and Optimization, has relatively large limitations in the field of carbon-neutral corporate environmental performance evaluation.
Time series model: A time series model is a machine learning model for processing time-related data, which can be used to predict and analyse trends and periodic changes in time series data (Lee et al., 2022). The basic idea of time series models is to use patterns and regularities in historical data to predict future changes.
Common time series models include the ARIMA model, seasonal autoregressive moving average model (SARIMA), exponential smoothing model, recurrent neural network model (RNN), etc. In the application of carbon-neutral corporate environmental performance evaluation, the time series model can predict the trend and periodic changes of environmental data, such as carbon emission data, energy consumption data to help enterprises understand the changing trend and influencing factors of carbon emission reduction, and formulate more It is a scientific carbon emission reduction strategy (Elnour et al., 2022a). The time series model can carry out real-time monitoring and early warning of the environmental data of the enterprise, timely discover environmental problems and risks, and help to achieve refined management of environmental protection; compared with the supervised learning model, time series Sequence models are usually relatively simple, with high computational efficiency, and can quickly process and analyse a large amount of environmental data. However, the time series model relies too much on historical data. If the historical data is insufficient or inaccurate, it may affect the prediction effect of the model; because the time series model can only predict and analyse a single variable or a small number of variables when faced When dealing with a complex system such as environmental performance evaluation of enterprises and enterprises, it is usually not possible to conduct a comprehensive evaluation.
Reinforcement Learning Model: Reinforcement learning is a machine learning method that aims to learn optimal behavioural policies through interaction with the environment. Reinforcement learning models usually include three elements: agent, environment and reward signal (Himeur et al., 2022). Through interaction with the environment, the agent adjusts its behaviour strategy according to the reward signal to maximise the cumulative reward.
The reinforcement learning model is applied to the environmental performance evaluation of carbon-neutral enterprises. It can learn and optimise the carbon emission reduction strategy independently. The strategy can be continuously adjusted and improved to achieve the optimal carbon emission reduction effect through the interaction with the environment and the feedback of reward signals (Zhou, 2021). At the same time, the reinforcement learning model has strong adaptability and generalisation ability, can deal with complex environmental and carbon emission reduction issues, and achieve optimal decision-making in different scenarios; the reinforcement model also has strong real-time and dynamic It can make immediate decisions and adjustments based on real-time environmental and data changes, to better support the environmental performance evaluation and carbon emission reduction work of enterprises. Since the reinforcement learning model requires a large amount of experimental data and training time to obtain a better learning effect, and the decision-making process of the reinforcement learning model is relatively complicated, it is difficult to explain and understand, which may have a certain impact on the decision-making and management of the enterprise.
Deep learning model: Deep learning is a machine learning method based on neural networks (Tan and Wang, 2021). Its core idea is to extract advanced data features through multi-layer nonlinear transformation and to achieve data classification, clustering, regression and other tasks. A deep learning model usually includes three parts: an input layer, multiple hidden layers, and an output layer. The hidden layer can contain tens or even hundreds of neurons to achieve advanced feature extraction and data representation.
Common deep learning models include convolutional neural network (CNN), recurrent neural network (RNN), long short-term memory network (LSTM) and auto encoder (AE). In the environmental performance evaluation of carbon-neutral enterprises, the deep learning model has the following advantages: the deep learning model can realise the processing and analysis of large-scale, high-dimensional and complex environmental data, such as carbon emission data, energy consumption data, to achieve Evaluation and prediction of corporate environmental performance; (Wu et al., 2022) the deep learning model has the strong nonlinear fitting ability and generalisation ability, which can deal with complex environmental and carbon emission reduction issues, and achieve more accurate and reliable prediction and decision-making; with this At the same time, the deep learning model has high computational efficiency and scalability, and can accelerate model training and reasoning through parallel computing and distributed computing. However, the deep learning model must improve enterprises’ carbon neutrality and environmental performance evaluation. For example, the deep learning model needs a large amount of training data and computing resources to obtain better learning results; the decision-making process of the deep learning model is more complicated. Explain and understand; the result needs to be more convincing.
Based on the advantages and disadvantages of the above models, this paper proposes a Transformer-GRU-based carbon-neutral corporate environmental performance evaluation model. First, clean and normalise the environmental performance data to facilitate subsequent model training and prediction, then use the Transformer-GRU model to extract the features in the environmental performance data, and then use the existing environmental performance data to transform the Transformer- The GRU model is trained to obtain an accurate environmental performance prediction model. Finally, using the existing historical data and other relevant indicators, predict the environmental performance of the enterprise and perform visual analysis and interpretation of the prediction results to help enterprises better understand and explain the prediction results and formulate corresponding carbon emission reduction measures.
2 Related work
2.1 Genetic algorithm
Genetic Algorithm (GA) is an optimisation algorithm based on biological evolution (Himeur et al., 2023). By simulating the process of biological evolution, it performs operations such as selection, crossover, and mutation to search and optimise problems.
In the genetic algorithm, candidate solutions are encoded into some genes; each gene represents a feature of the solution, and then through operations such as selection, crossover, and mutation on these genes, new candidate solutions are generated. Then the objective function is gradually optimised. The genetic algorithm can be used to optimise the enterprise’s environmental performance and carbon-neutral strategy in the evaluation of carbon-neutral enterprise environmental performance. For example, use genetic algorithms to optimise environmental indicators, find the best carbon-neutral solution, or optimise enterprises’ energy consumption and environmental impact. It should be noted that the genetic algorithm has some disadvantages in applying carbon-neutral corporate environmental performance evaluation: it has high computational complexity. It requires a lot of computing resources and time, especially when dealing with large-scale problems. And the performance of a genetic algorithm sensitive to parameter settings largely depends on the rationality of parameter settings, such as crossover rate, mutation rate, population size. Improper parameter setting may lead to algorithm performance degradation. In some practical problems, multiple constraints make it difficult for genetic algorithms to handle.
2.2 Logistic regression
Logistic Regression is a commonly used classification algorithm for mapping input data into a binary output (0 or 1) (Zhang and Feng, 2022). The goal of logistic regression is to predict the possibility of a binary output variable based on the input variable, that is, to estimate the probability of the output being one given the input variable.
In applying carbon-neutral corporate environmental performance evaluation, logistic regression can be used for classification problems, such as predicting whether a company is environmentally conscious or meets certain environmental indicators (Udemba, 2021). However, it has the following obvious disadvantages in applying carbon-neutral corporate environmental performance evaluation: logistic regression is sensitive to outliers, and if there are some outliers in the data set, it may affect the model’s performance. Logistic regression models are susceptible to data noise and may suffer from over fitting problems. If there is much noise in the training dataset, the model may become more complex, resulting in better performance on new datasets. Logistic regression is a linear classifier and can only model linear relationships. For nonlinear relationships, logistic regression models may perform poorly.
2.3 Bayesian network
Bayesian Network (Bayesian Network) is a statistical learning method based on a probabilistic graphical model, which represents the probability dependence relationship between variables and can be used to infer the relationship between variables or, given the state of some variables, to infer other variables’ status (Wang et al., 2023).
In applying carbon-neutral enterprise environmental performance evaluation, the Bayesian network can be used to analyse the probability dependence between energy consumption and environmental pollution of enterprises or to predict the changing trend of some environmental indicators (Bu et al., 2022). However, the disadvantages of this method in carbon-neutral and corporate environmental performance evaluation are also obvious: the Bayesian network has a strong dependence on domain knowledge, and it needs to build a model based on this knowledge and be aware of the probability dependencies between variables. Make a priori assumptions. Insufficient domain knowledge or inaccurate prior assumptions may affect the model’s performance. Furthermore, Bayesian networks usually require training and optimisation on large data with high computational complexity. It needs a stronger processing ability for large-scale data, so it may face certain challenges when processing it. Due to the complexity of Bayesian networks, the interpretability of the model could be stronger. Some complex Bayesian networks may make it difficult for analysts to understand their internal structure and reasoning process. Also, the Bayesian network assumes too simple the relationship between variables. Usually, it builds a model based on the assumption of independence and conditional independence between variables, which may ignore the complex relationship between some variables.
3 Methodology
3.1 Overview of our network
This paper proposes a carbon neutral enterprise environmental performance assessment model based on BERT-GRU, which can help enterprises assess their own environmental performance and provide strong support for them to achieve carbon neutrality.
First, it is necessary to collect the enterprise data related to carbon neutrality, such as energy consumption, production volume, logistics and other data of the enterprise. At the same time, environmental data, such as meteorological data and air quality data around the enterprise, also need to be collected. These data will be used as input data for model construction and evaluation. Then the data will be cleaned, normalized and feature extracted to facilitate subsequent model training and prediction. The processed data are subjected to feature extraction using BERT to obtain a feature representation of the text data. GRU is then used to model and predict the sequential data to obtain the prediction results of corporate environmental performance. In the model application stage, the model can be used to predict the future environmental performance of the enterprise, and the optimal carbon neutral solution can be selected based on the prediction results to maximize the efficiency of the enterprise’s resource utilization.
The carbon neutral enterprise environmental performance assessment model based on BERT-GRU includes a total of two parts, BERT module and GRU module, which can complete the assessment and prediction of enterprise environmental performance through their own advantages, and provide strong support for enterprises to achieve carbon neutrality. The overall structure of the model is shown in Figure 1.
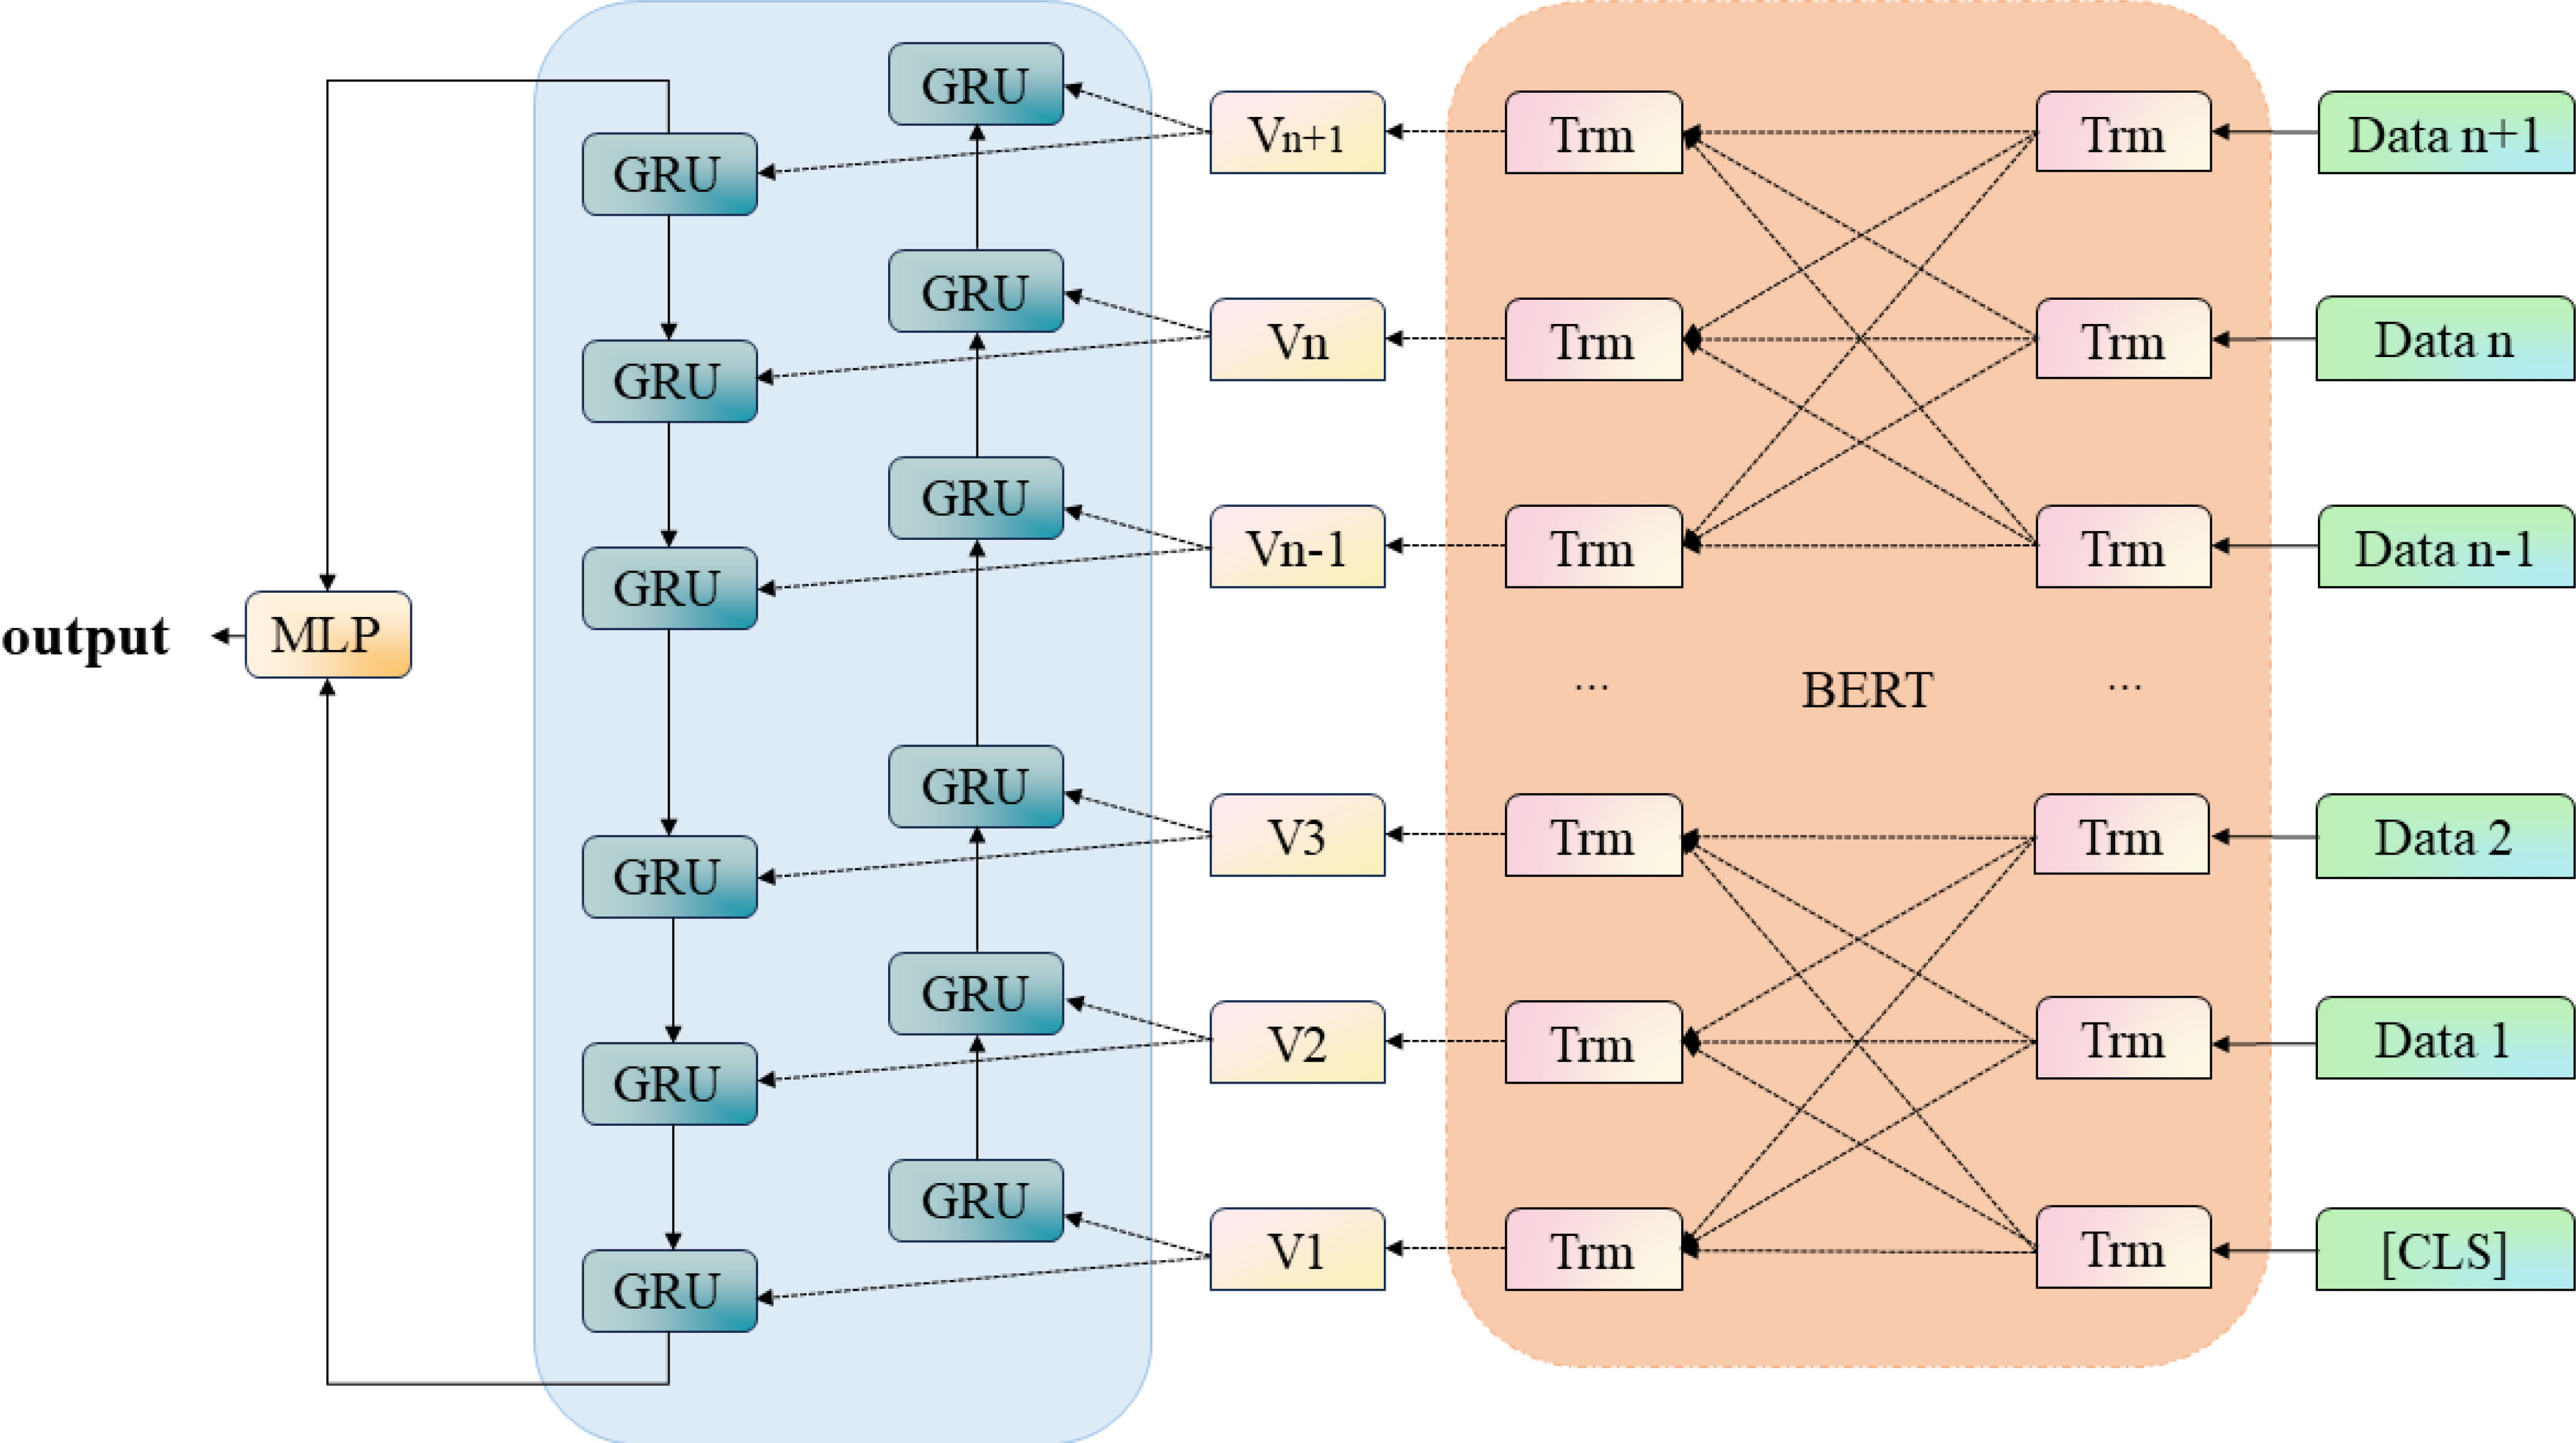
Figure 1 BERT-GRU structural unit.
This Algorithm1 is the algorithm flow chart of the model; firstly, input the carbon-neutral enterprise environmental performance data, pre-process and normalize the data in the data input layer, then put the data set into the BERT module for feature classification, and enhance the learning through its attention layer to output the feature sequence, then put the feature data into the GRU module to finally get the model optimal parameters to improve the accuracy of the prediction, and finally output the prediction results.
Algorithm 1 BERT-GRU Model Training.
3.2 BERT model
BERT (Bidirectional Encoder Representations from Transformers) is a Transformer-based pre-trained language model proposed by Google in 2018. Different from traditional language models based on recurrent neural network (RNN) and convolutional neural network (CNN), BERT adopts the self-attention mechanism in Transformer for sequence modelling, which can consider the relationship between context and words at the same time, and Handles input sequences of varying lengths with better modelling capabilities and performance (Su and Zhou, 2023). Its pre-training process mainly includes two tasks: masked language model (Masked Language Model, MLM) and next sentence prediction (Next Sentence Prediction, NSP). In the masked language model, BERT randomly masks some words in the input sequence and asks the model to predict the correctness of these words; in the next sentence prediction, BERT takes two consecutive sentences as input and asks the model to predict the correctness of these words.
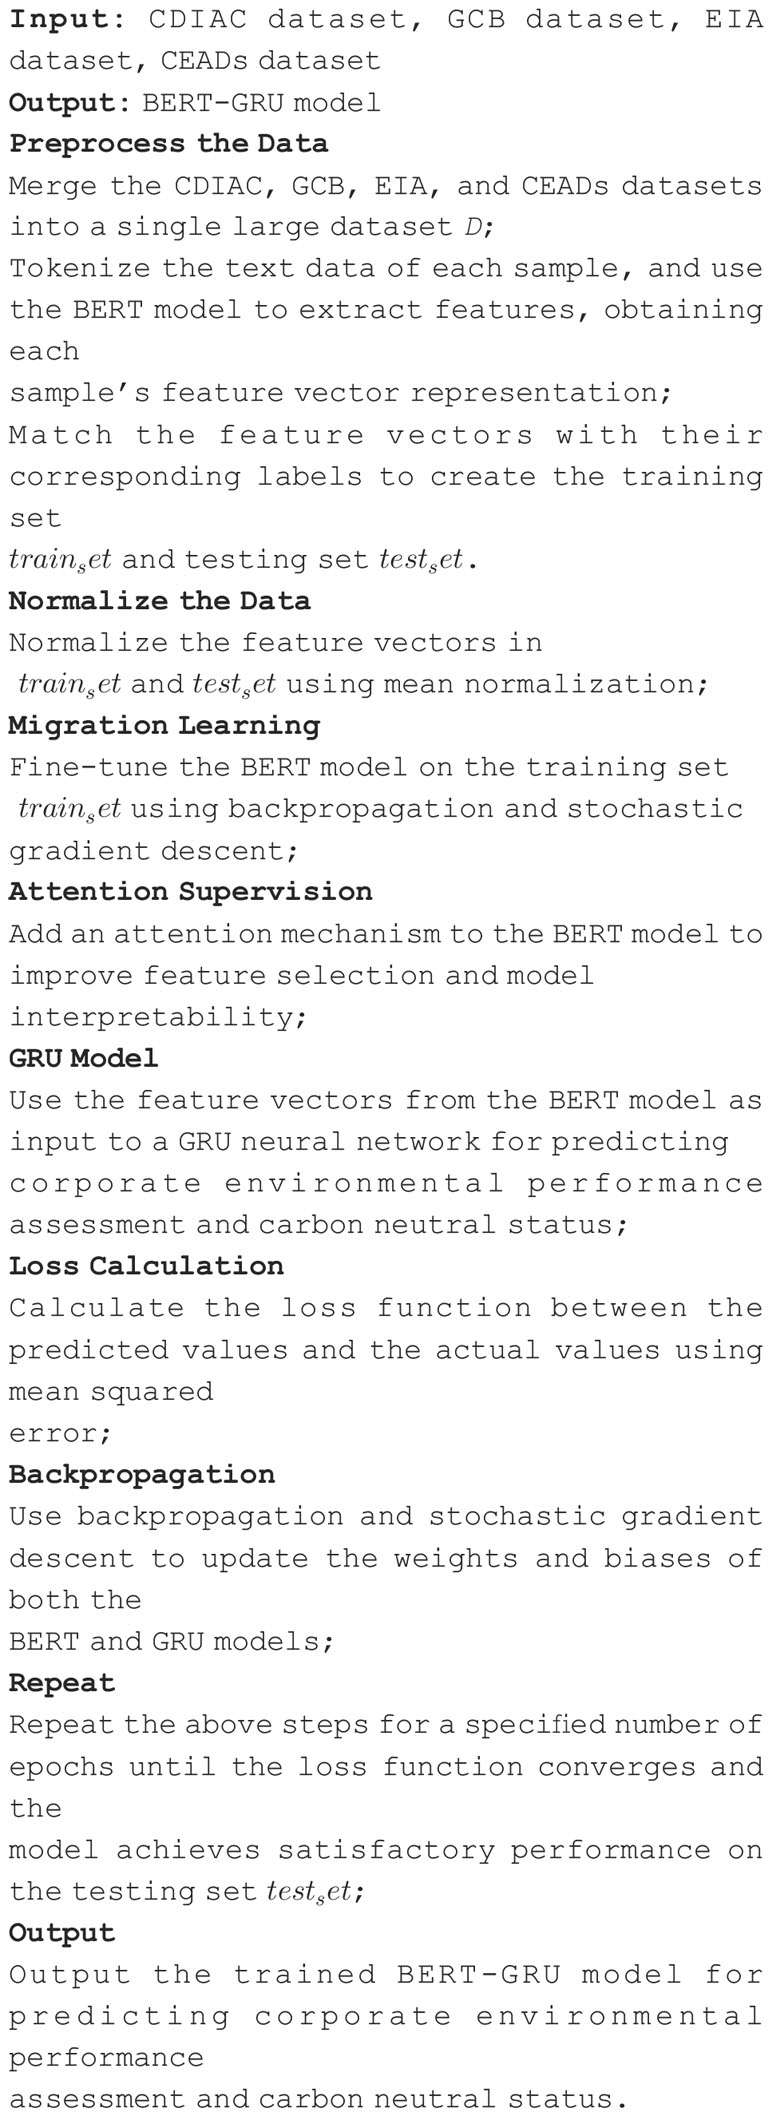
Whether the sentences are adjacent, this model has the following advantages in the construction of carbon-neutral corporate environmental performance evaluation models: a large amount of unstructured text data needs to be processed in the environmental performance evaluation process, such as corporate annual reports, news reports, policies and regulations. As a pre-trained language model, BERT can effectively model and represent these text data, extract key information and features, and perform excellently in processing unstructured text data. Environmental performance evaluation also needs to consider data in different languages and cultural backgrounds, such as international standards and corporate reports. BERT excels in multilingual modelling, which meets environmental performance evaluation needs. It can handle the conversion and alignment problems between different languages and improves the generalisation ability and applicability of the model. BERT can also learn rich language representations from a large amount of unsupervised data, improving the accuracy and robustness of the model. In environmental performance evaluation, BERT can extract environmental information in corporate annual reports, such as emission data, pollution control, energy conservation and emission reduction, with higher accuracy and reliability. In addition, the model can also be adapted to different tasks and scenarios through fine-tuning and can quickly build a model and perform iterative optimisation to improve modelling efficiency and effect. Its model structure diagram is shown in Figure 2.
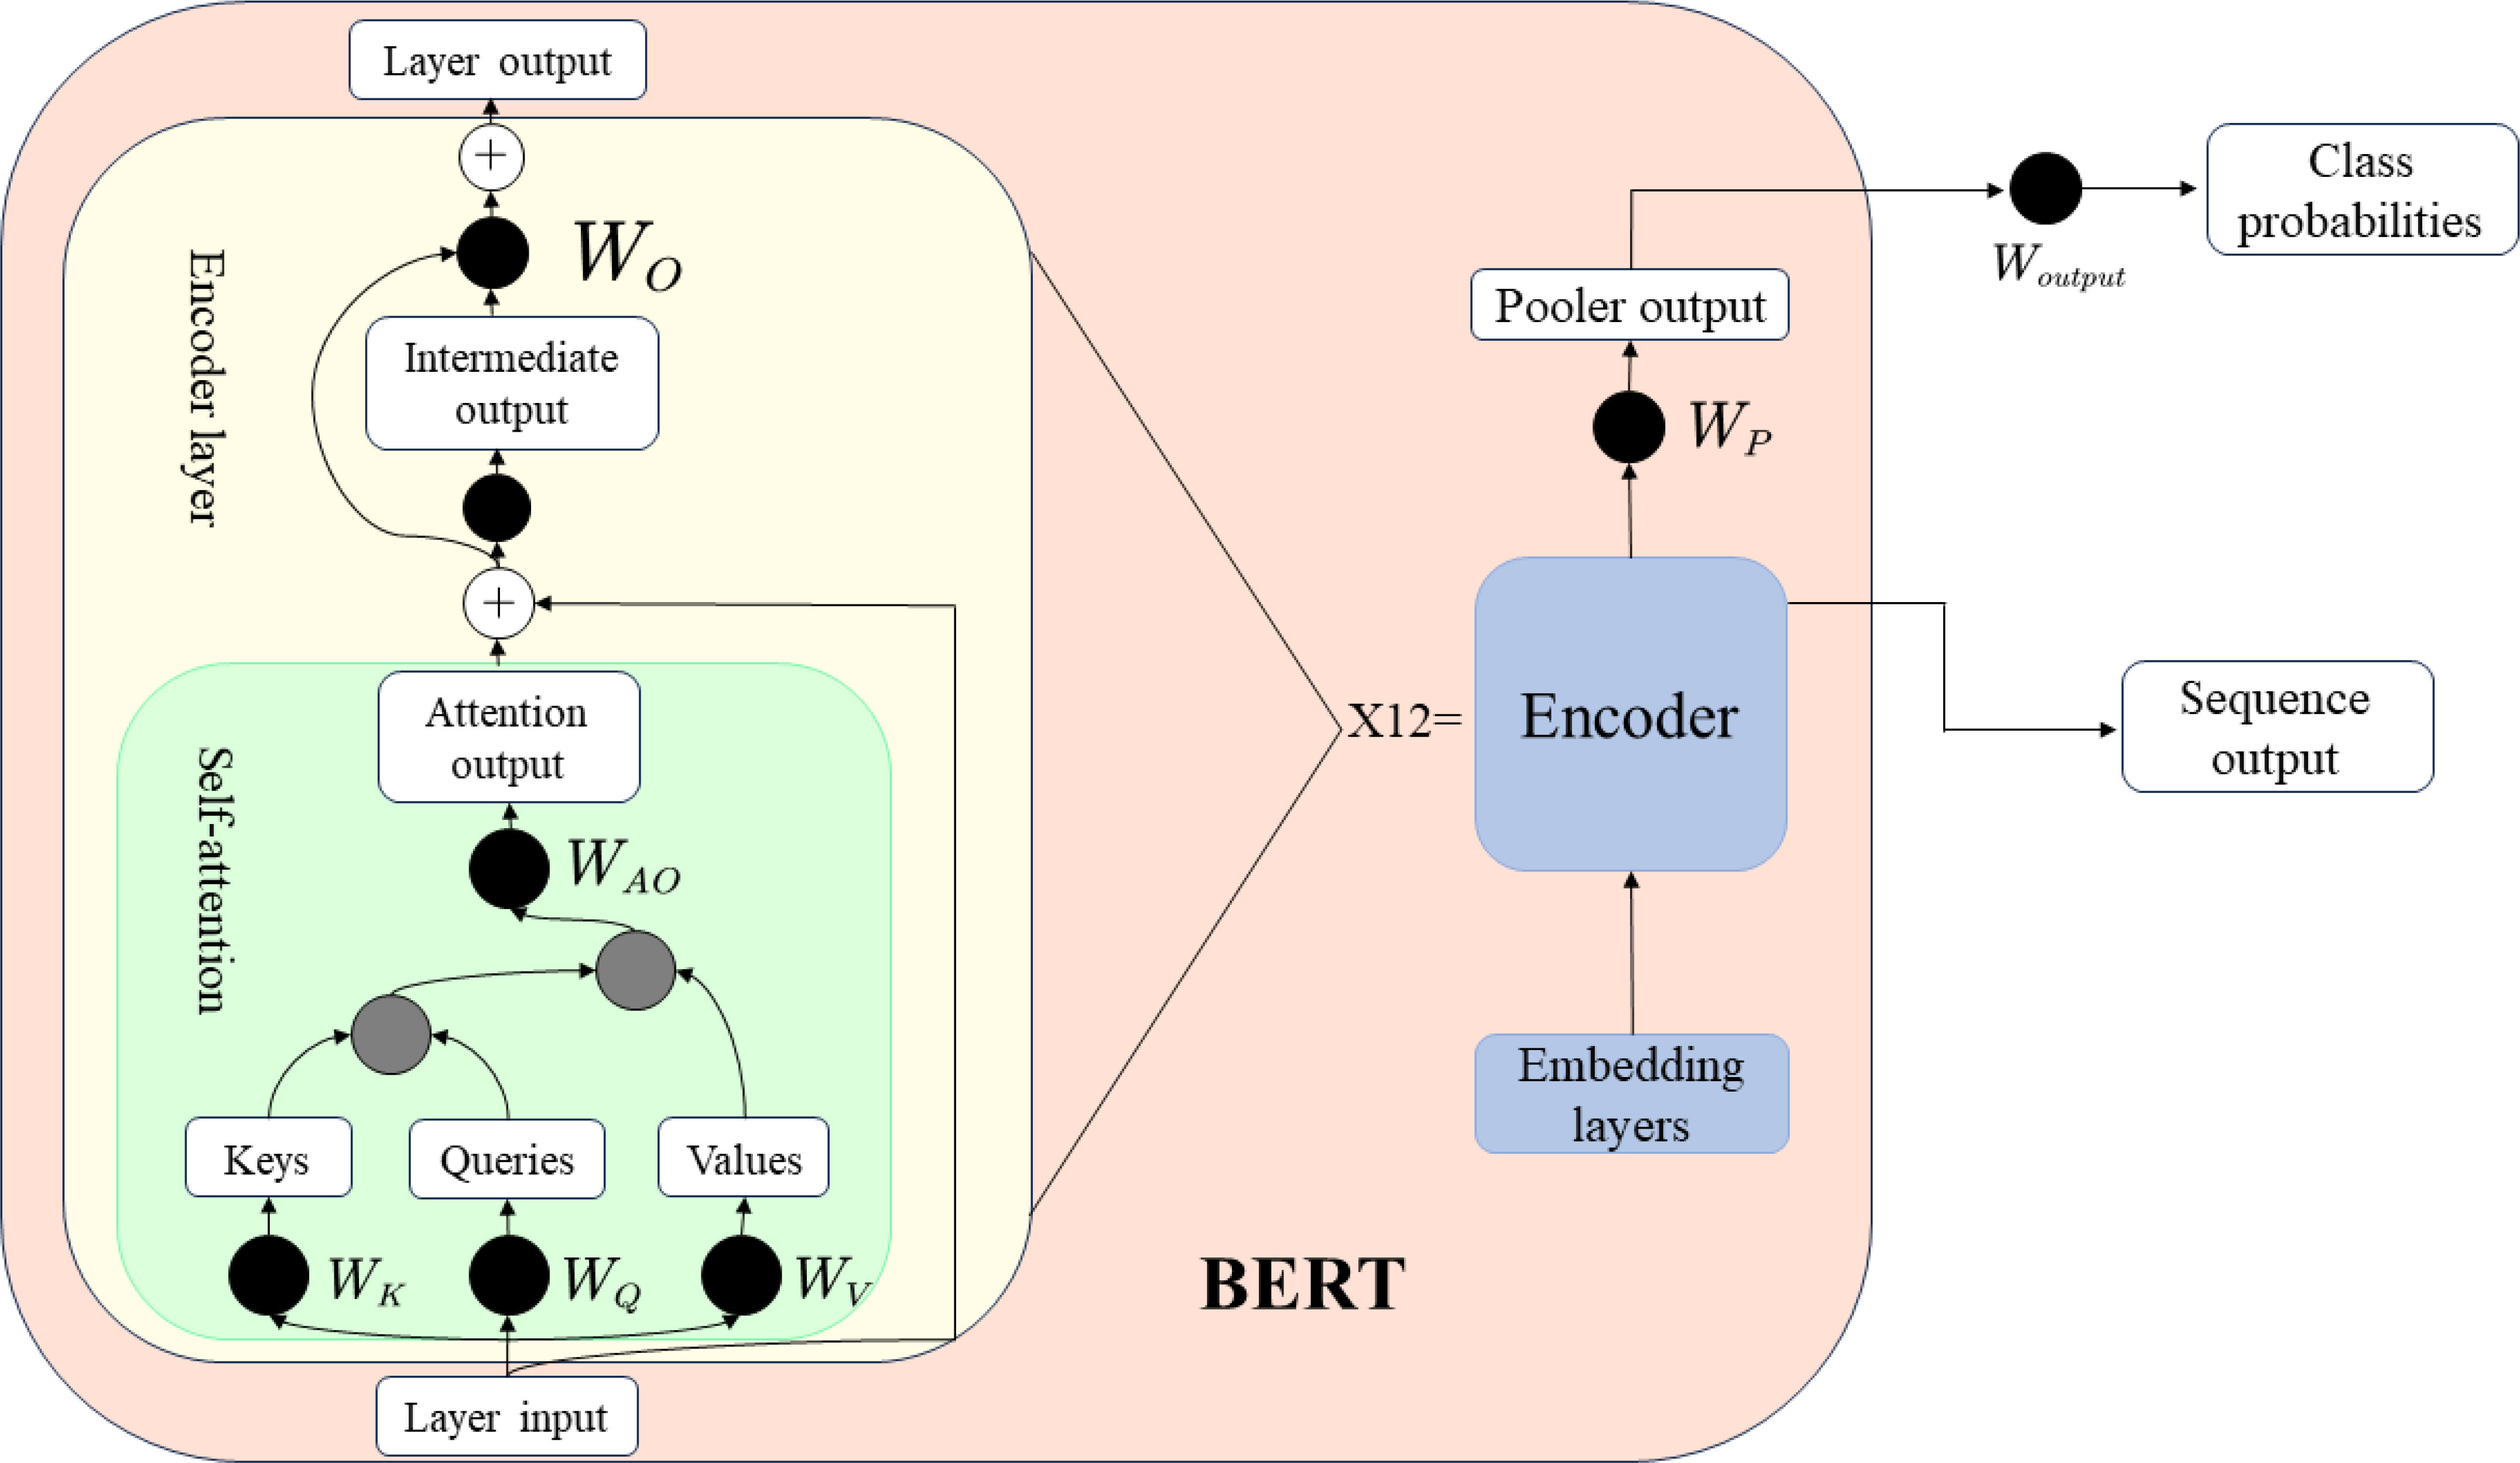
Figure 2 BERT structural unit.
The principle of BERT can be simplified by the following formula1.
The specific operation of Equation (1) is as follows:
In Equation 1 and Equation 2, denotes the loss function, denotes the number of input sentences, denotes the length of the th sentence, denotes the th word in the th sentence, denotes all the words before the th word in the th sentence words, denotes the parameters of the BERT model, and denote the word vectors of word and word , denotes the context vectors of word , and denotes the total number of words in the vocabulary. The meaning of the formula is that for each word , the probability of its occurrence in all words is calculated, and its negative logarithm is calculated as the loss function.
3.3 GRU model
GRU (Gated Recurrent Unit) is a variant of recurrent neural network (RNN) proposed by Cho et al. in 2014. Compared with the traditional RNN, GRU introduces a gating mechanism (Gating Mechanism), and its structure includes two gating units of Reset Gate and an Update Gate (Liu et al., 2022). The reset gate controls the dependency between the current input and the hidden state at the last moment, and the update gate controls the dependency between the current input and the hidden state at the current moment. By resetting and updating the gate control, GRU can better capture the dependencies in long sequences and avoid problems such as gradient vanishing and explosion.
In the construction of a carbon-neutral corporate environmental performance evaluation model, GRU has significant advantages: GRU is a cyclic neural network that can effectively process a large amount of time-series data in environmental performance evaluation, such as pollutant emission data, energy consumption data and can capture dependencies in sequences. By introducing a gating mechanism, GRU can better control the gradient flow, avoiding the problem of gradient disappearance or explosion that is prone to occur in traditional RNNs in the case of long sequences, and improves the robustness and stability of the model.
Moreover, GRU has fewer parameters and faster training speed. It can build models and perform iterative optimisation faster than other cyclic neural networks, such as LSTM. The gating mechanism of GRU makes the prediction process of the model more interpretable, can better understand the dependencies in the sequence and the decision-making process of the model, and has broad application prospects in the construction of carbon-neutral corporate environmental performance evaluation models.
The diagram is shown in Figure 3. The following is the formula of GRU operation. The equation 3 represents the calculation of the update gate in the following way:
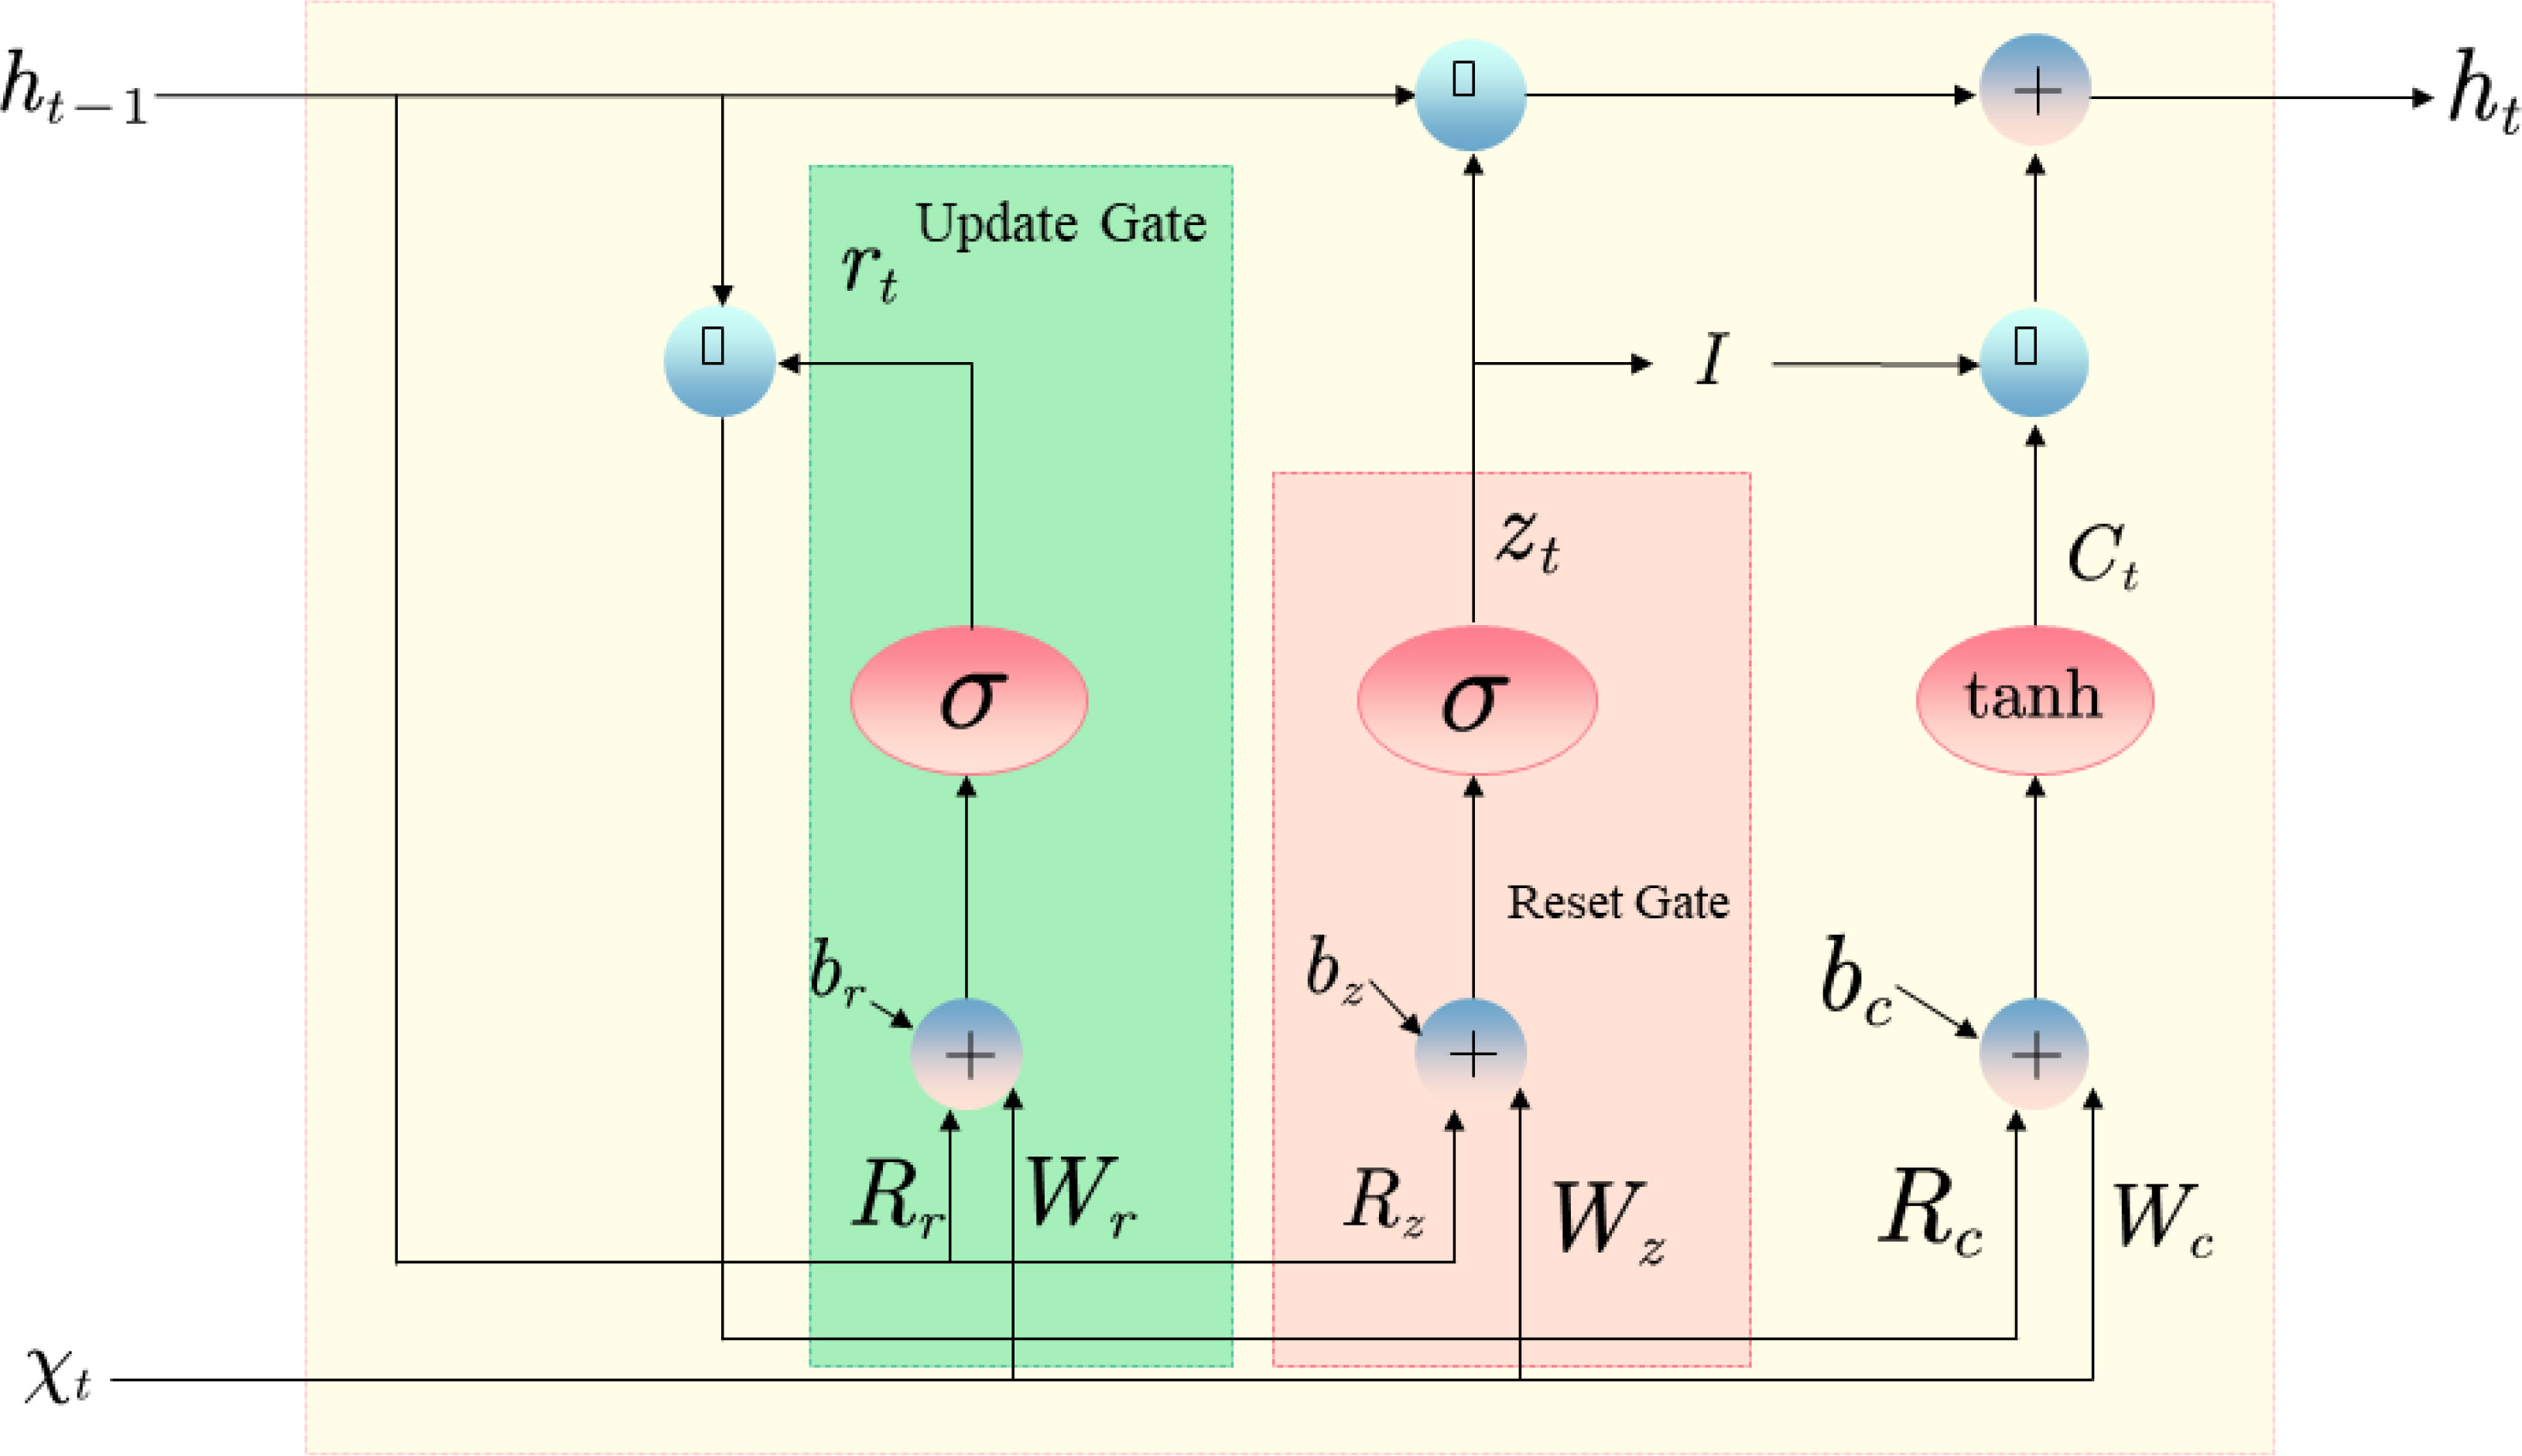
Figure 3 GRU structural unit.
In formula 3, , and are the parameter matrices and bias vectors of the update gate, denotes the sigmoid function, is the input vector of the current time step, and is the hidden state of the previous time step.
Equation 4 represents the calculation of the reset gate .
In Equation 4, , and are the parameter matrices and bias vectors of the reset gate, denotes the sigmoid function, is the input vector of the current time step, and is the hidden state of the previous time step.
Equation 5 represents the calculation of the candidate hidden state .
In Equation 5, and are the parameter matrices of the candidate hidden states, is the bias vector of the candidate hidden states, denotes multiplication by elements, tanh denotes the hyperbolic tangent function, is the input vector of the current time step, is the hidden state of the previous time step, and is the reset gate.
Equation6 represents the calculation of the hidden state for the current time step.
In Equation 6, is the update gate, is the candidate hidden state, denotes multiplication by elements, and denote forgetting the past information and updating the current state information, respectively, and is the hidden state of the previous time step.
4 Experiment
4.1 Datasets
In this paper, the data we use come from CDIAC, GCB, EIA, and CEADs databases as the original data.
CDIAC: Carbon Dioxide Information Analysis Center (CDIAC) is an organization aimed at managing, evaluating, and distributing global greenhouse gas emissions data, headquartered in Oakland, New Hampshire, USA. CDIAC is an agency under the US Department of Energy (Jia J.-J. et al., 2022). It was established in 1982. Its main task is to collect, compile and publish carbon dioxide and other greenhouse gas emissions data to facilitate scientific research and environmental policy formulation by environmental scientists and policymakers.
CDIAC is one of the world’s largest greenhouse gas emission data archives. Its data covers global greenhouse gas emission data from the past few hundred years to modern times. It includes emission data of important greenhouse gases such as carbon dioxide, methane, and nitrogen oxides (Jia J. et al., 2022). Includes data on the impact of energy consumption, land use change, and other human activities on greenhouse gas emissions. CDIAC’s data archive is significant to global climate change research, policy formulation, and environmental protection.
GCB: The Global Carbon Budget database (Global Carbon Budget, GCB) is a global carbon cycle and climate change research project jointly established by the international scientific community to provide a comprehensive assessment and prediction of global carbon emissions and absorption (Ji et al., 2021). Founded in 2007, the GCB project is jointly carried out by scientists and research institutions from many countries and regions worldwide.
The GCB project mainly collects, organizes, and analyzes carbon emission and absorption data worldwide and establishes a global carbon budget model to monitor and predict the global carbon cycle and climate change trends (Zhang et al., 2023). These include the analysis of sources of global carbon emissions, such as energy consumption, industrial processes, land use change, etc., and the analysis of global carbon uptake, such as carbon uptake by vegetation and soils.
The GCB project annually publishes a global carbon budget report, widely regarded as one of the authoritative sources on global carbon emissions and absorption. The GCB report provides the latest data and trends on global carbon emissions and uptake, as well as projections and simulations of future carbon emissions and uptake. These data and predictions are significant to global climate change research, policy formulation, and environmental protection.
EIA: The U.S. Energy Information Administration (Energy Information Administration, EIA) is an independent statistical and analytical agency under the U.S. Department of Energy (Too et al., 2022). Its main task is to collect, analyze and publish data and information on energy production and consumption, energy prices, energy policies, and environmental impacts to support policy formulation, business decision-making, and academic research.
EIA’s data and information cover multiple energy sectors, including oil, natural gas, coal, nuclear, and renewable energy. It provides a variety of reports, databases, tools, and analyses to government agencies,
academic institutions, businesses, and the general public to facilitate an in-depth understanding and analysis of energy markets and policies (Yoshino et al., 2023). EIA provides the public with easy-to-understand and uses energy data and information through its website, reports, press releases, social media, and other channels.
EIA’s data and information are significant to U.S. and global energy policymaking, market forecasts, and investment decisions. At the same time, it also provides opportunities for academics, researchers, and the public to gain an in-depth understanding and analysis of global energy markets and environmental impacts.
CEADs: China Emission Accounts and Datasets (CEADs) is a national-level data platform jointly established by the National Bureau of Statistics of China and the Ministry of Environmental Protection of China (Juvonen 2023). It aims to provide accurate, comprehensive, timely data support for China’s carbon emission and climate change policy formulation.
The CEADs project mainly collects, integrates, and analyzes carbon emission data nationwide, including carbon emission data in energy consumption, industrial processes, transportation, construction, and agriculture (Klaaßen and Stoll, 2021). At the same time, CEADs also include emission data of air pollutants, energy and resource consumption data, and other data related to carbon emissions and climate change.
CEADs database includes a variety of data types and formats, including statistical data, model data, charts, reports. These data and information can help government agencies, enterprises, and scholars understand China’s carbon emissions and climate change trends and the effective evaluation and optimization suggestions of relevant policies and measures (Wang et al., 2022). This project is significant for formulating and implementing China’s carbon emissions and climate change policies. It has an enlightening effect on global carbon emissions and climate change research and policy formulation.
Here we use four databases as raw data, the following is our database Table 1.
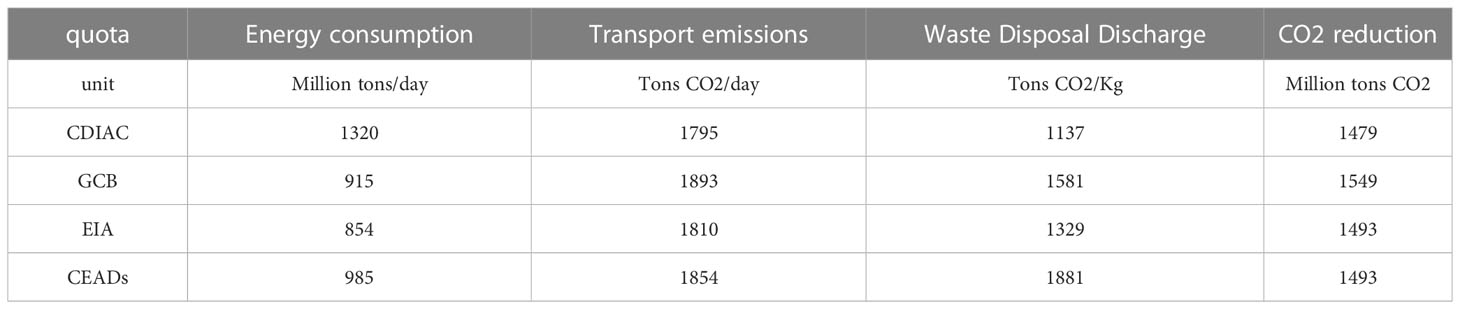
Table 1 Selected dataset data.
We use the first 85% of the data in the selected database as the training set, and the last 15% of the data as the test set. Giving the model more training data can make our model prediction results more accurate and the prediction results more convincing.
4.2 Experimental setup and details
To verify that our model can be applied to carbon-neutral corporate environmental performance assessment and lead to better applications, we selected several models to conduct a series of experiments to verify the applicability of our carbon-neutral corporate environmental performance assessment model to the field. Our sets of experiments revolve around recall, F1-Score, MSE, mAP, AUC, precision and accuracy indicators; our practical steps are as follows:
4.2.1 Step 1: data pre-processing
● Determine the data set: select the data set of carbon emission, energy consumption and environmental pollution to ensure the data quality and applicability.
● Data cleaning: Perform missing value processing, outlier processing, noise processing, to ensure the integrity and accuracy of the data.
● Feature extraction: feature extraction of data, including statistical features, time-series features, spatial features, to extract advanced feature expressions of data.
● Normalization: Normalize the data to ensure comparability and consistency among different data.
4.2.2 Step 2: model design
● Determine the model structure: BERT-GRU-based model structure is adopted to use the data’s temporal and spatial features extensively.
● Determine the hyperparameters of each algorithm: Hyperparameters of SVM: penalty factor C=10, kernel function (kernel) = polynomial kernel function. Hyperparameters of LSTM: number of recurrent layers = 2, number of hidden layer neurons = 128. Hyperparameters of GAN: number of layers of generator and discriminator = 3,number of neurons = 128. Hyperparameters of CNN: convolutional kernel size = 3x3, pooling size = 2x2.
● Hyperparameter adjustment: Adjust the model’s hyperparameters according to the experimental requirements and data characteristics, such as learning rate, batch size, optimiser,to improve the training effect of the model.
4.2.3 Step 3: experimental design
● Data set selection: Select four data sets, CDIAC, GCB, EIA and CEADs, for experiments to ensure the generalisation ability and applicability of the model.
● Experimental metrics selection: recall, F1-Score, MSE, mAP, AUC, precision and accuracy metrics were selected to evaluate the performance and generalisation ability of the model.
● Experimental steps and process design: Design the practical steps and process, including data preprocessing, model training, and model evaluation, to ensure the credibility and reproducibility of the experimental results.
4.2.4 Step 4: model training and evaluation
● Model training: Adopt cross-validation, adaptive learning rate and other techniques to improve the training effect of the model.
● Model evaluation: recall, F1-Score, MSE, mAP, AUC, precision and accuracy metrics are used to evaluate the performance and generalisation ability of the model.
4.2.5 Step 5: experimental results analysis and discussion
● Model performance analysis: The experimental results are analysed, including the accuracy, recall, F1-score, mAP, AUC and other metrics to evaluate the performance and generalisation ability.
● Model optimisation space analysis: Analyze the optimisation space of the model, including the optimisation of model structure, hyperparameters, to improve the performance and application value of the model.
● Analysis of model application scenarios: Explore the application of the model in the fields of carbon emission reduction and enterprise environmental performance assessment, and explore the model’s potential value and application prospects.
Through the experimental data results, it is easy to find that the performance of the selected model varies in the face of different data sets and data volumes. However, our model is still the least affected and outperforms the models of other groups. Meanwhile, to find out which part of our model plays a key role, we designed ablation experiments, and through the experimental results, we found that the BERT model in our fusion model has a greater impact overall. We used a ten-fold cross-validation approach to evaluate the predictive performance and stability of our proposed model. Specifically, we divide the dataset into ten equal parts and use 9 of them as the training set and another part as the test set each time, repeating the process ten times, using a different test set each time. We use the training set to train the model and use the test set to evaluate the predictive performance of the model.
In each cross-validation, we use the Transformer model to extract features from the data and feed them into the GRU model for sequence modeling. In this way, we obtained ten sets of model prediction results; each calculated using a different test set. We calculated the mean and standard deviation of these results to evaluate our proposed model’s predictive performance and stability. The experimental results show that our proposed Transformer-GRU model-based environmental performance assessment model for carbon-neutral enterprises has high prediction accuracy and stability. The conclusions of several groups of experiments all name that our Transformer-GRU-based carbon-neutral enterprise environmental performance assessment model can be well applied in the field of carbon-neutral enterprise environmental performance assessment, which can accurately predict the indicators of carbon emission and energy consumption of enterprises and help them achieve the goals of carbon emission reduction and environmental protection.
4.3 Experimental results and analysis
In Figure 4, we compare the Transformer-GRU-based carbon-neutral corporate environmental performance assessment model with other models for Recall, which is the ratio of positive samples correctly predicted by the model to the total number of actual positive samples and is usually used to evaluate the recall and coverage of the model.
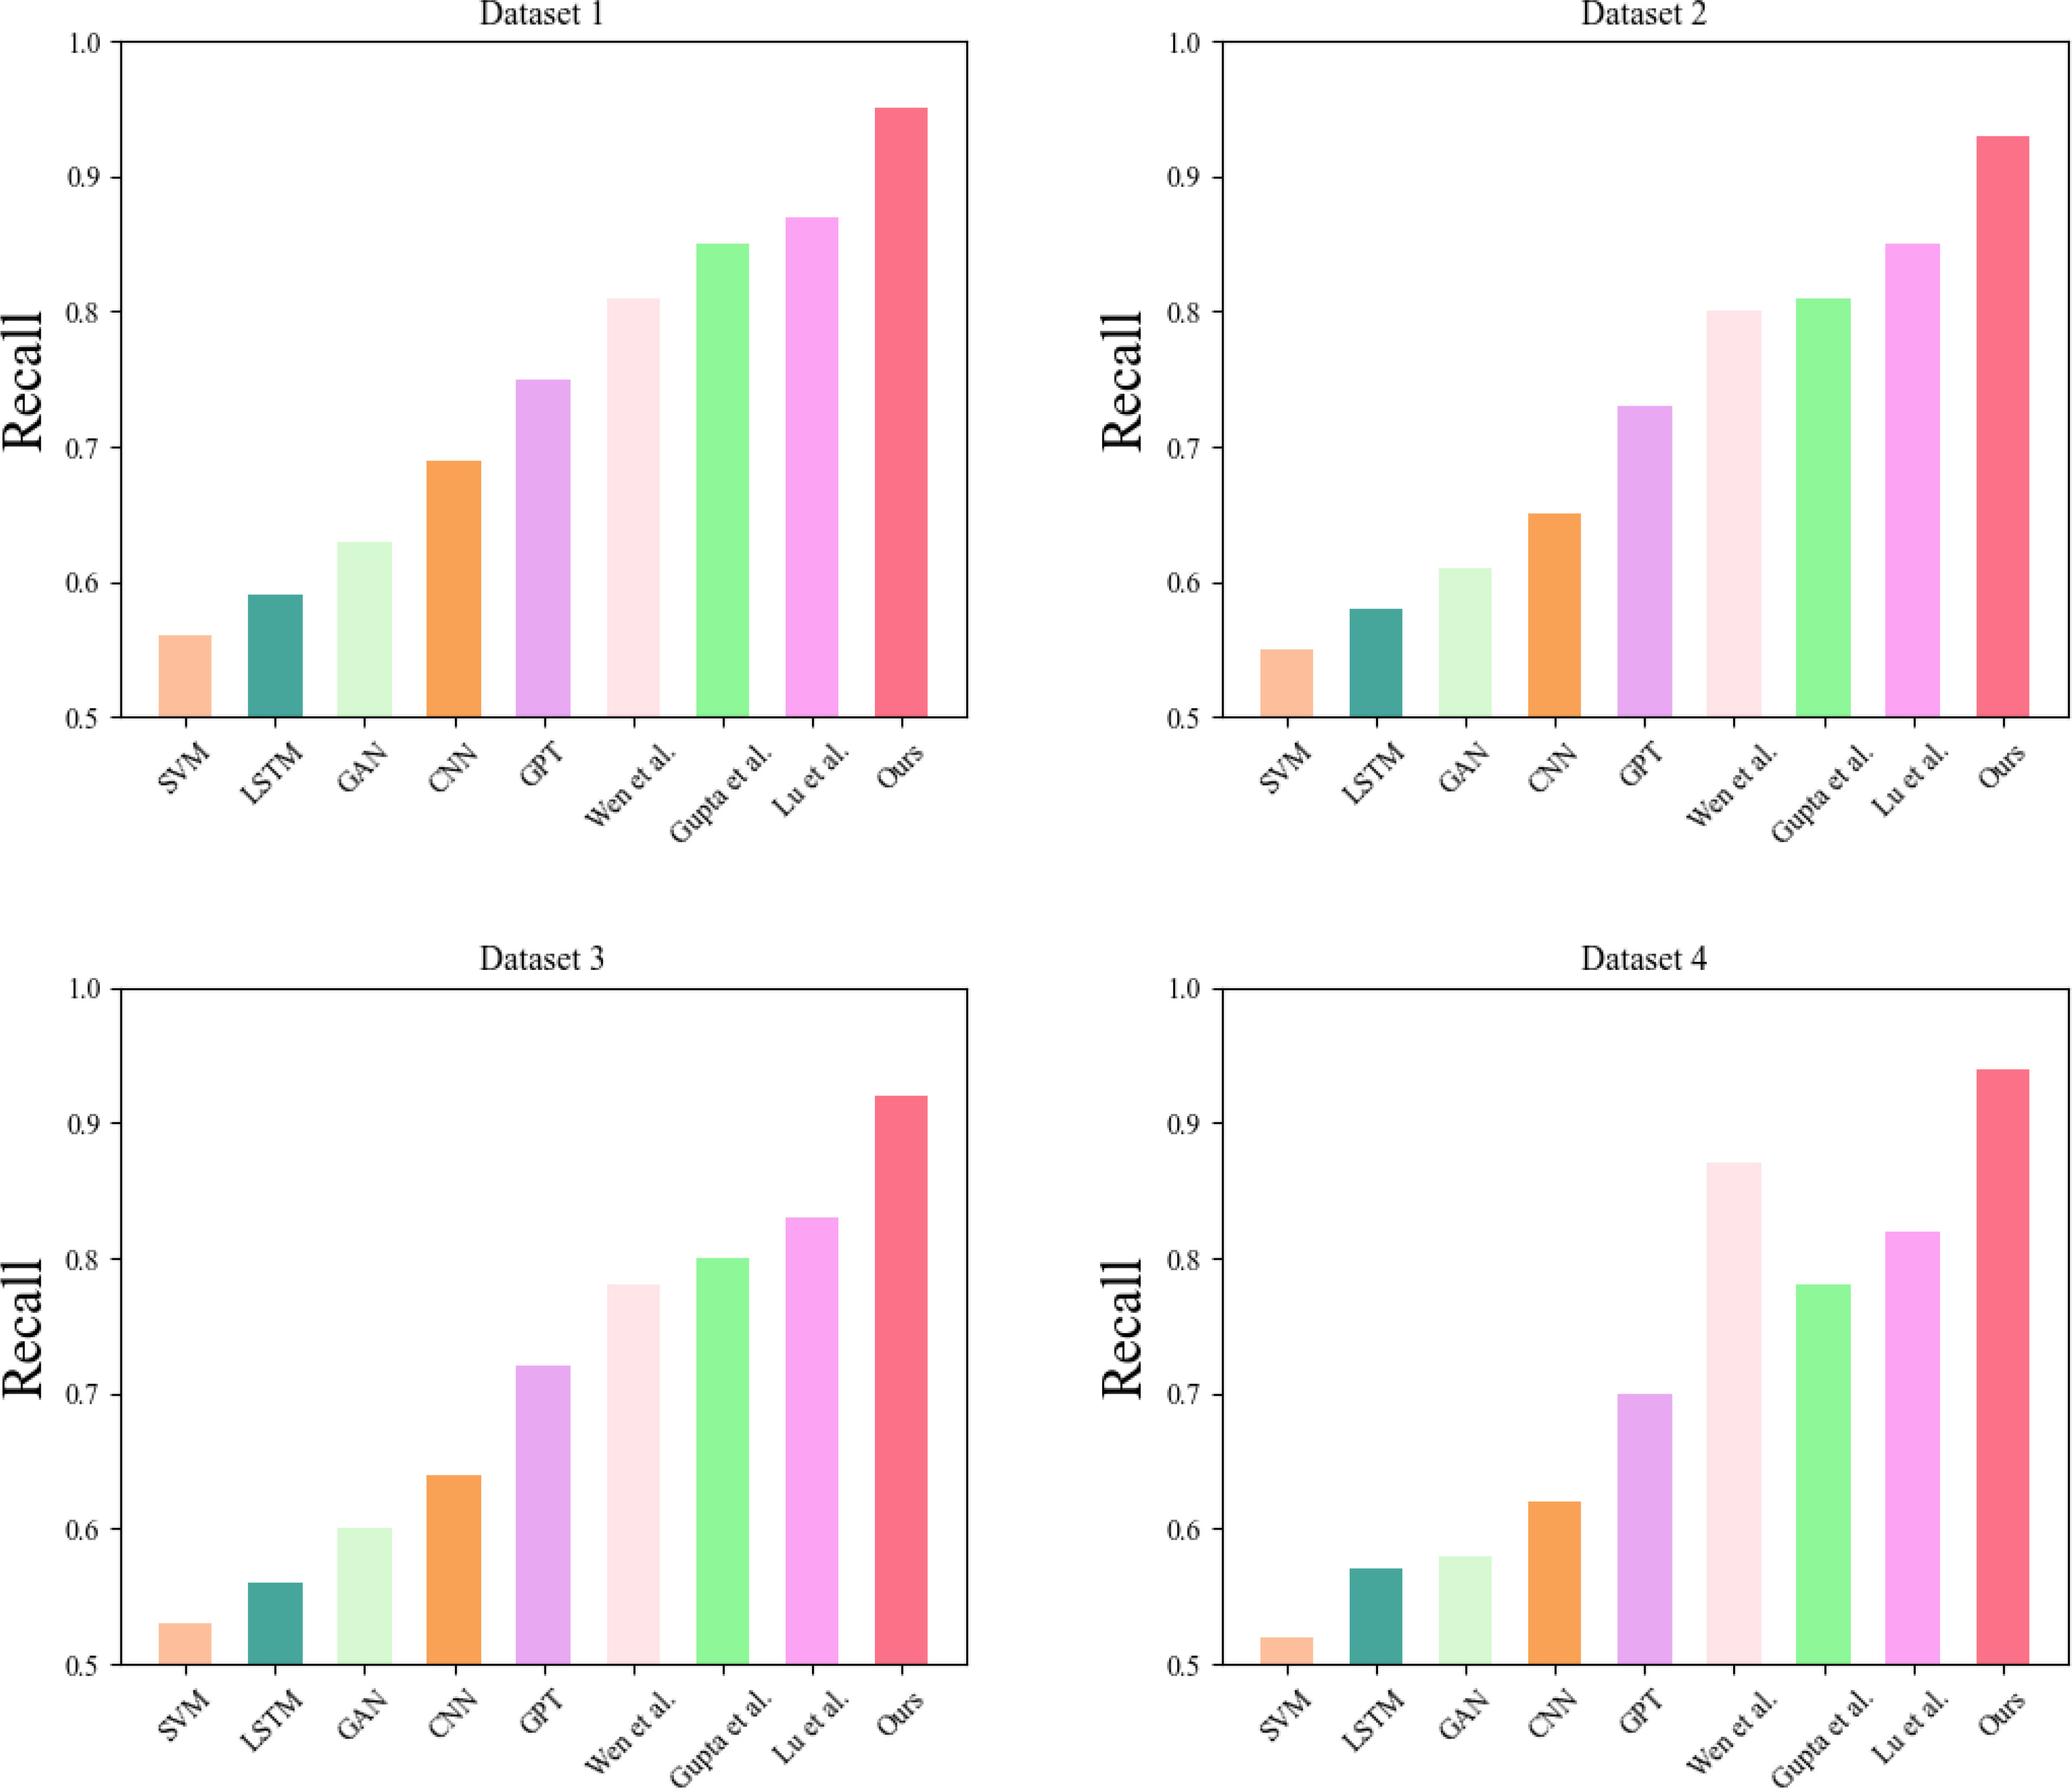
Figure 4 Recall comparison experiment results chart required for each model operation.
Through the experimental results, we found that the performance of each model varies with different data sets and volumes. However, our model exhibits high Recall values and outperforms the other models on most datasets. This indicates that our model can effectively detect and identify environmental anomalies and problems and is expected to play an important role in carbon neutral and corporate environmental performance assessment. The Recall of the model is a very important indicator because it can help us to detect and identify more anomalies and problems, which can help companies to achieve their goals better, such as carbon reduction and environmental protection. Therefore, our model has a wide application prospect in carbon neutral and corporate environmental performance assessment.
In Figure 5, we compare each model with the F1-Score. This metric combines the precision and recall of the model and is usually used to evaluate the overall performance of the model. The experimental results showed that each model performs differently with different data sets and volumes. Regarding F1-Score, our model shows high scores and outperforms the other models on most datasets. This indicates that our model can show better overall performance in detecting and identifying anomalies and problems in carbon neutral and corporate environmental performance assessment and has better application prospects.
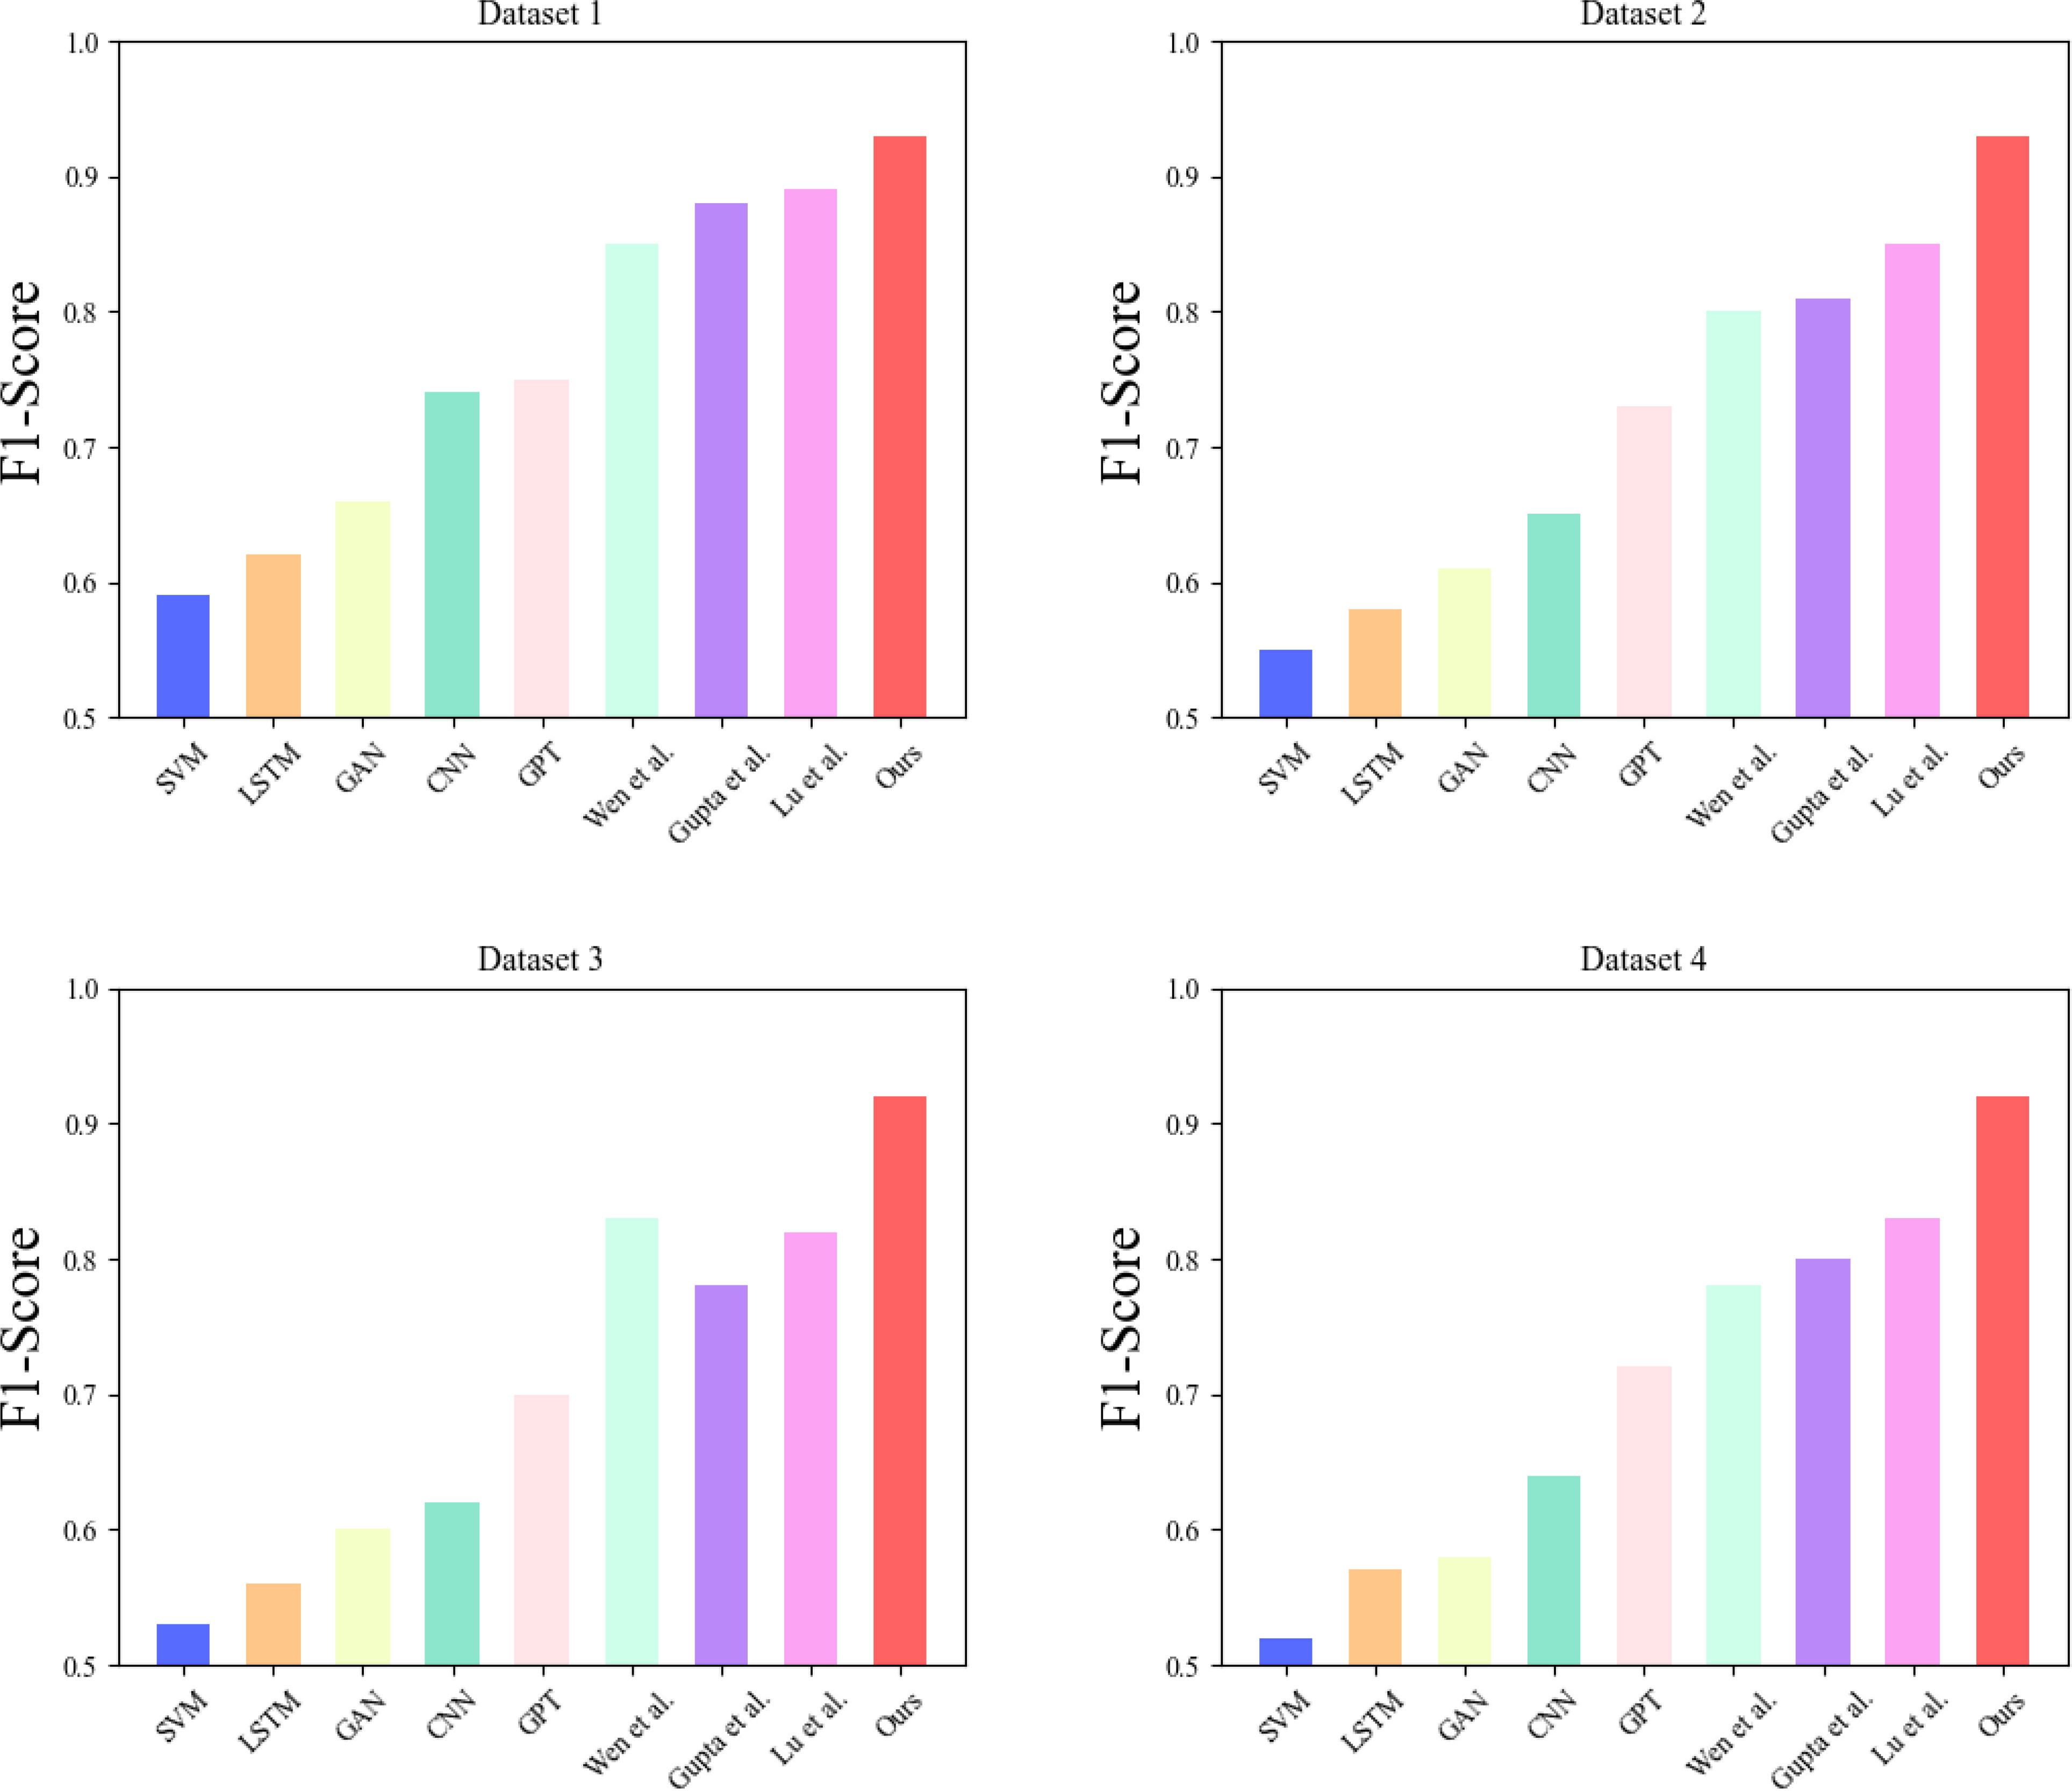
Figure 5 Comparative experimental results of F1-Score metrics for each model - based on CDIAC, GCB, EIA and CEADs datasets.
In Figure 6, we compared the MSE metrics of each model in carbon-neutral corporate environmental performance assessment, which measures the sum of squares of the model’s errors in the prediction process. Through the experimental results, we found that the performance of each model varies with different data sets and volumes. It can be seen that the SVM model performs the worst and is more influenced by the data set. However, our model shows the most stable and lowest MSE metrics in the face of different datasets, which means that our model can perform the task more accurately and has a reliable performance in practical application scenarios.
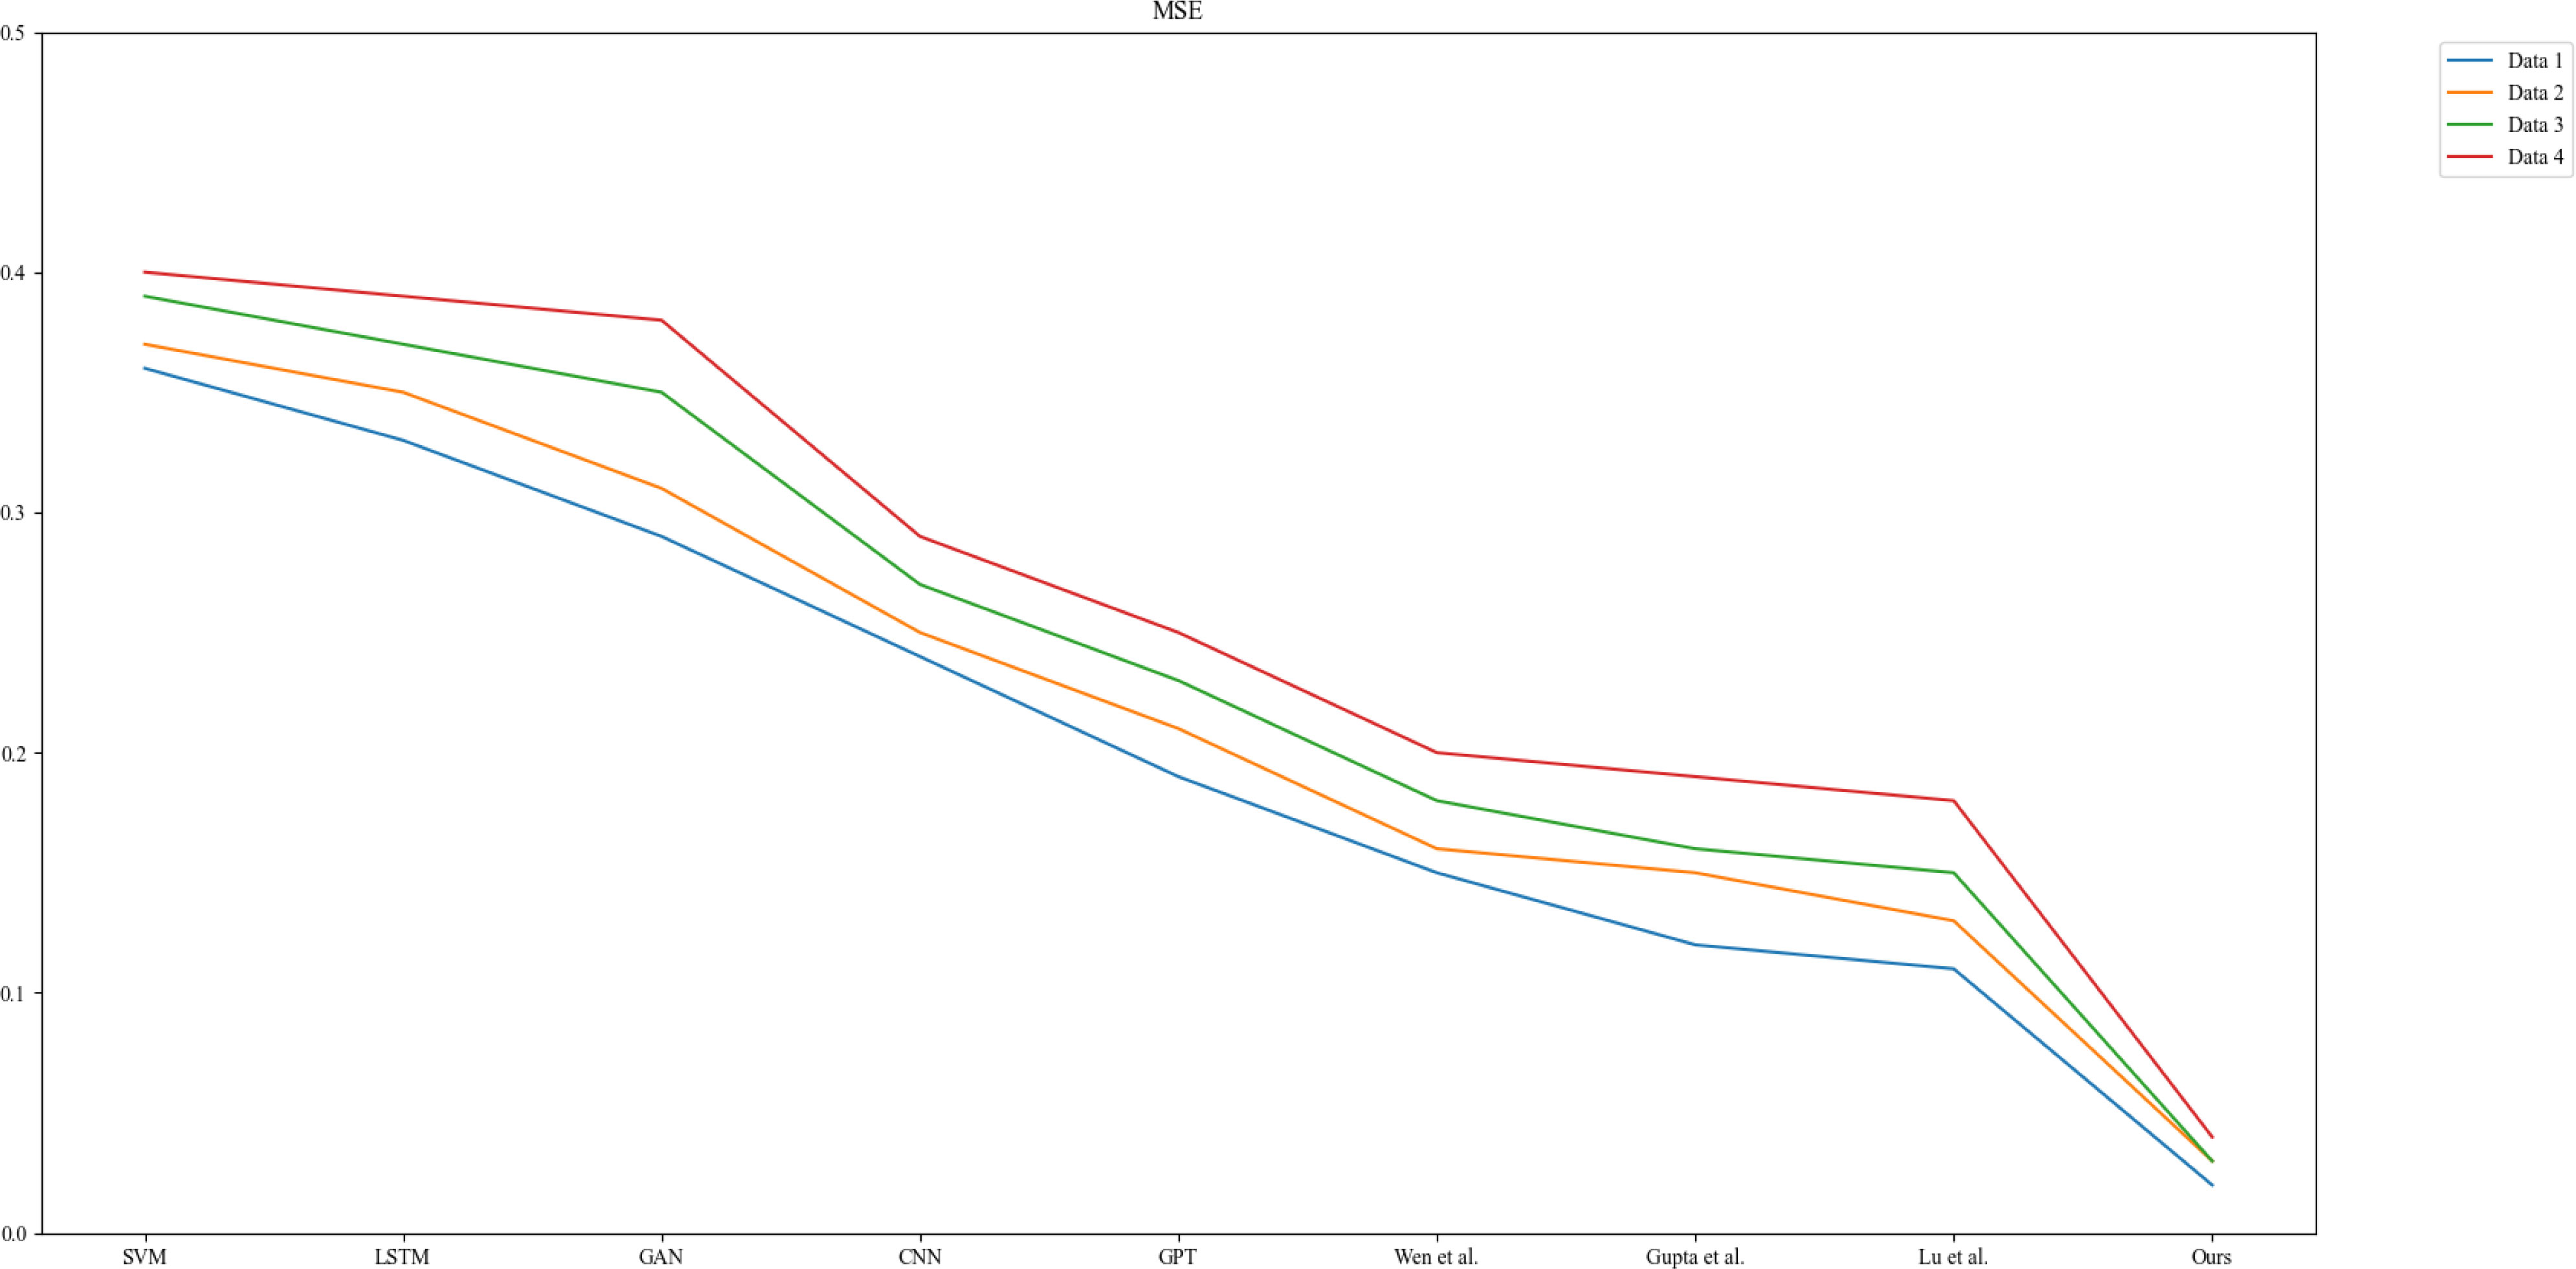
Figure 6 Comparative experimental results of MSE indicators for each model.
MSE is also a very important metric in the field of carbon neutral and corporate environmental performance assessment, as it helps us evaluate our model’s performance and reliability, which in turn guides us in making decisions on environmental protection and carbon reduction. Our model shows strengths in MSE and is more suitable for applications in this field.
In Figure 7, we compare the precision metrics of each model. Precision is the proportion of samples for which the model predicts positive samples that are positive samples and is usually used to evaluate the precision and accuracy of the model.

Figure 7 Comparison experimental results of Precision index of each model.
The experimental results showed that each model performs differently with different data sets and volumes. Compared to other models, our model exhibits higher precision values and outperforms other models on most data sets. The higher precision means that the model’s results are more realistic and can better help companies assess their environmental performance and formulate corresponding environmental strategies, which is more beneficial to sustainable development.
In Figure 8, we compare each model’s AUC and mAP performance when facing different datasets. aUC and mAP are important metrics to evaluate the performance of models in classification tasks. Through the experimental results, we found that the datasets highly influence the performance of different models. Still, our models show the most stable and highest AUC and mAP when facing different datasets. This means that our models have better performance in classification tasks and can more accurately assess the environmental performance of enterprises and provide more meaningful results. Therefore, our model can be better applied to the carbon-neutral corporate environmental performance assessment field, providing more accurate and reliable environmental performance assessment services to help companies improve their environmental performance assessment and social recognition.
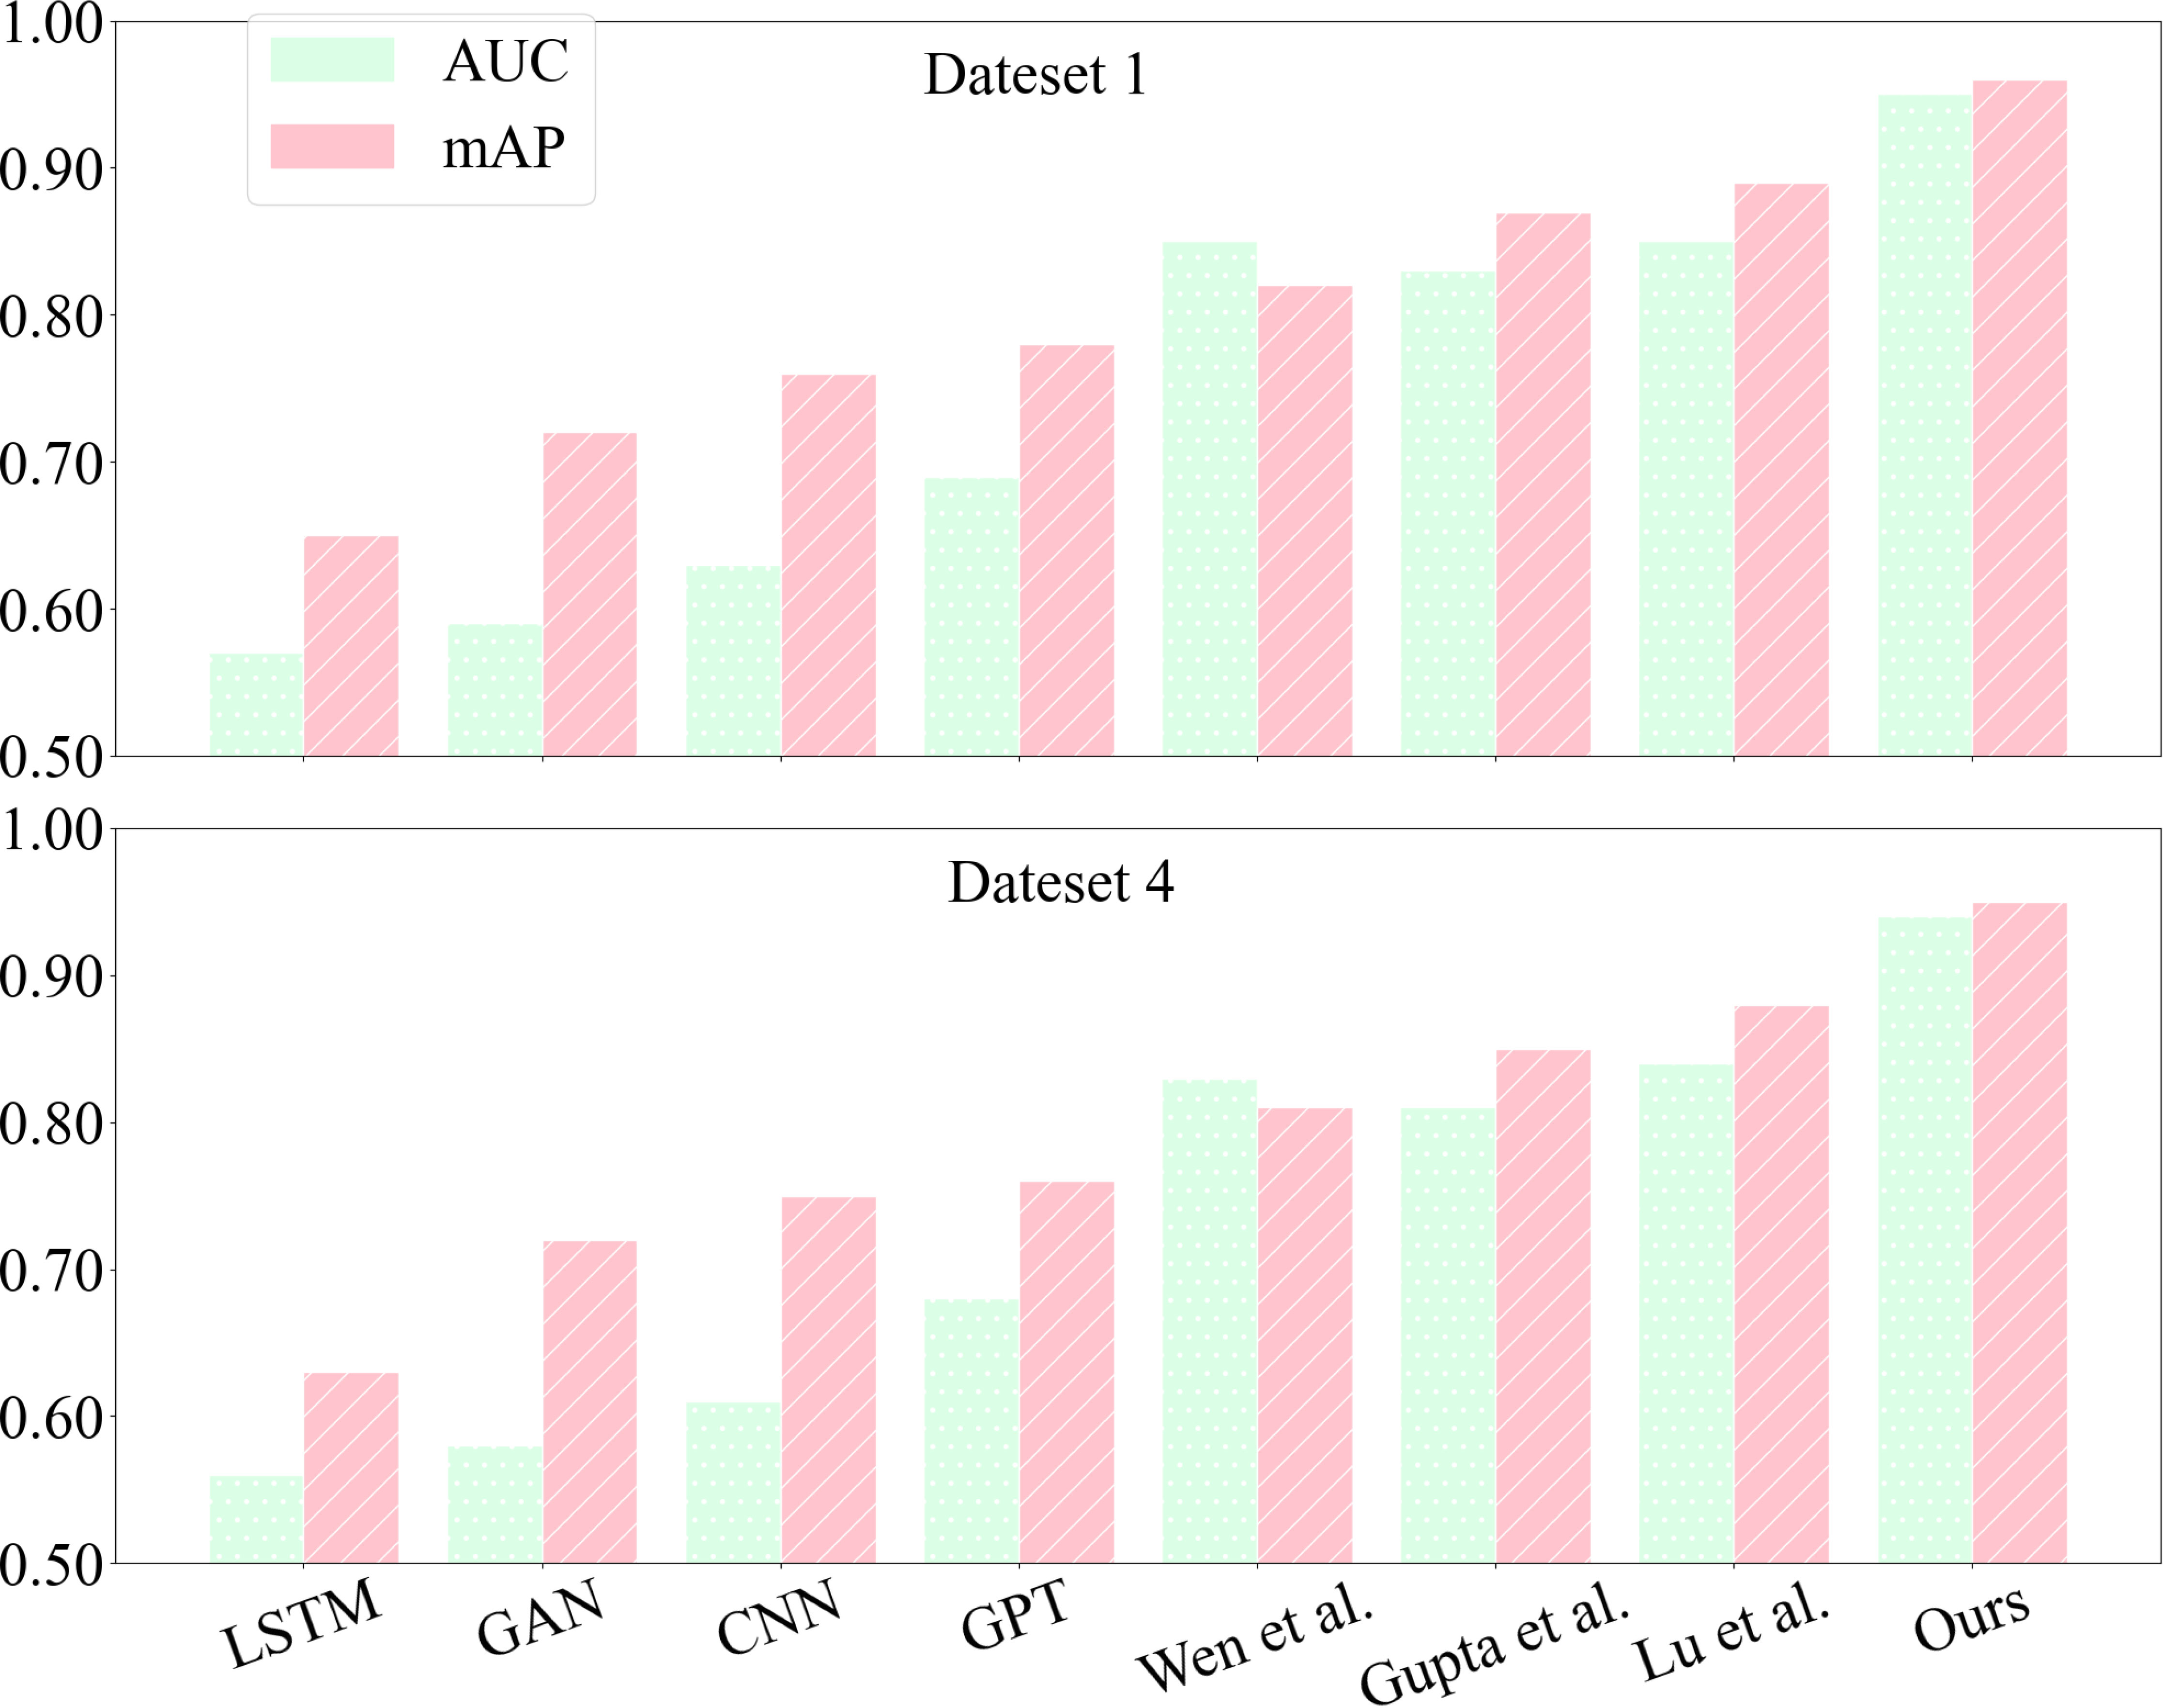
Figure 8 Plot of experimental results comparing AUC and mAP metrics for each model - based on CDIAC dataset and CEADs dataset.
High AUC and mAP indicators improve the classification accuracy and reliability of the model, increase user satisfaction and trust and increase the application value of the model. In the carbon-neutral enterprise environmental performance assessment field, these indicators are important for assessing enterprises’ level of carbon-neutral environmental performance. Therefore, our model will be able to provide more accurate and reliable data prediction services for enterprises in practical applications and thus gain better business value.
To find which part is the most important in our model, we designed ablation experiments for parameters, training time, inference time and Flops metrics; Figure 9 shows the comparison test of parameters for each model, and Figure 2 shows the comparison test of Flops and inference times for each model. Figure 10 compares the Flops and inference times of each model. In these three sets of experiments, we compare BERT, GRU, BERT-BiGRU and our model; from this figure, we can learn that the BERT model has a greater influence on our experimental metrics and plays a major role, BERT model has a good pre-training ability and migration learning ability, which can better adapt to different tasks and data sets. By fine-tuning the GRU model through BERT, our model can be better adapted to the task requirements of carbon-neutral corporate environmental performance assessment and improve classification accuracy and reliability. Therefore, our model will provide more accurate and reliable environmental assessment services for enterprises in practical applications, improve their environmental protection level and social recognition, and achieve carbon emission reduction and sustainable development goals.
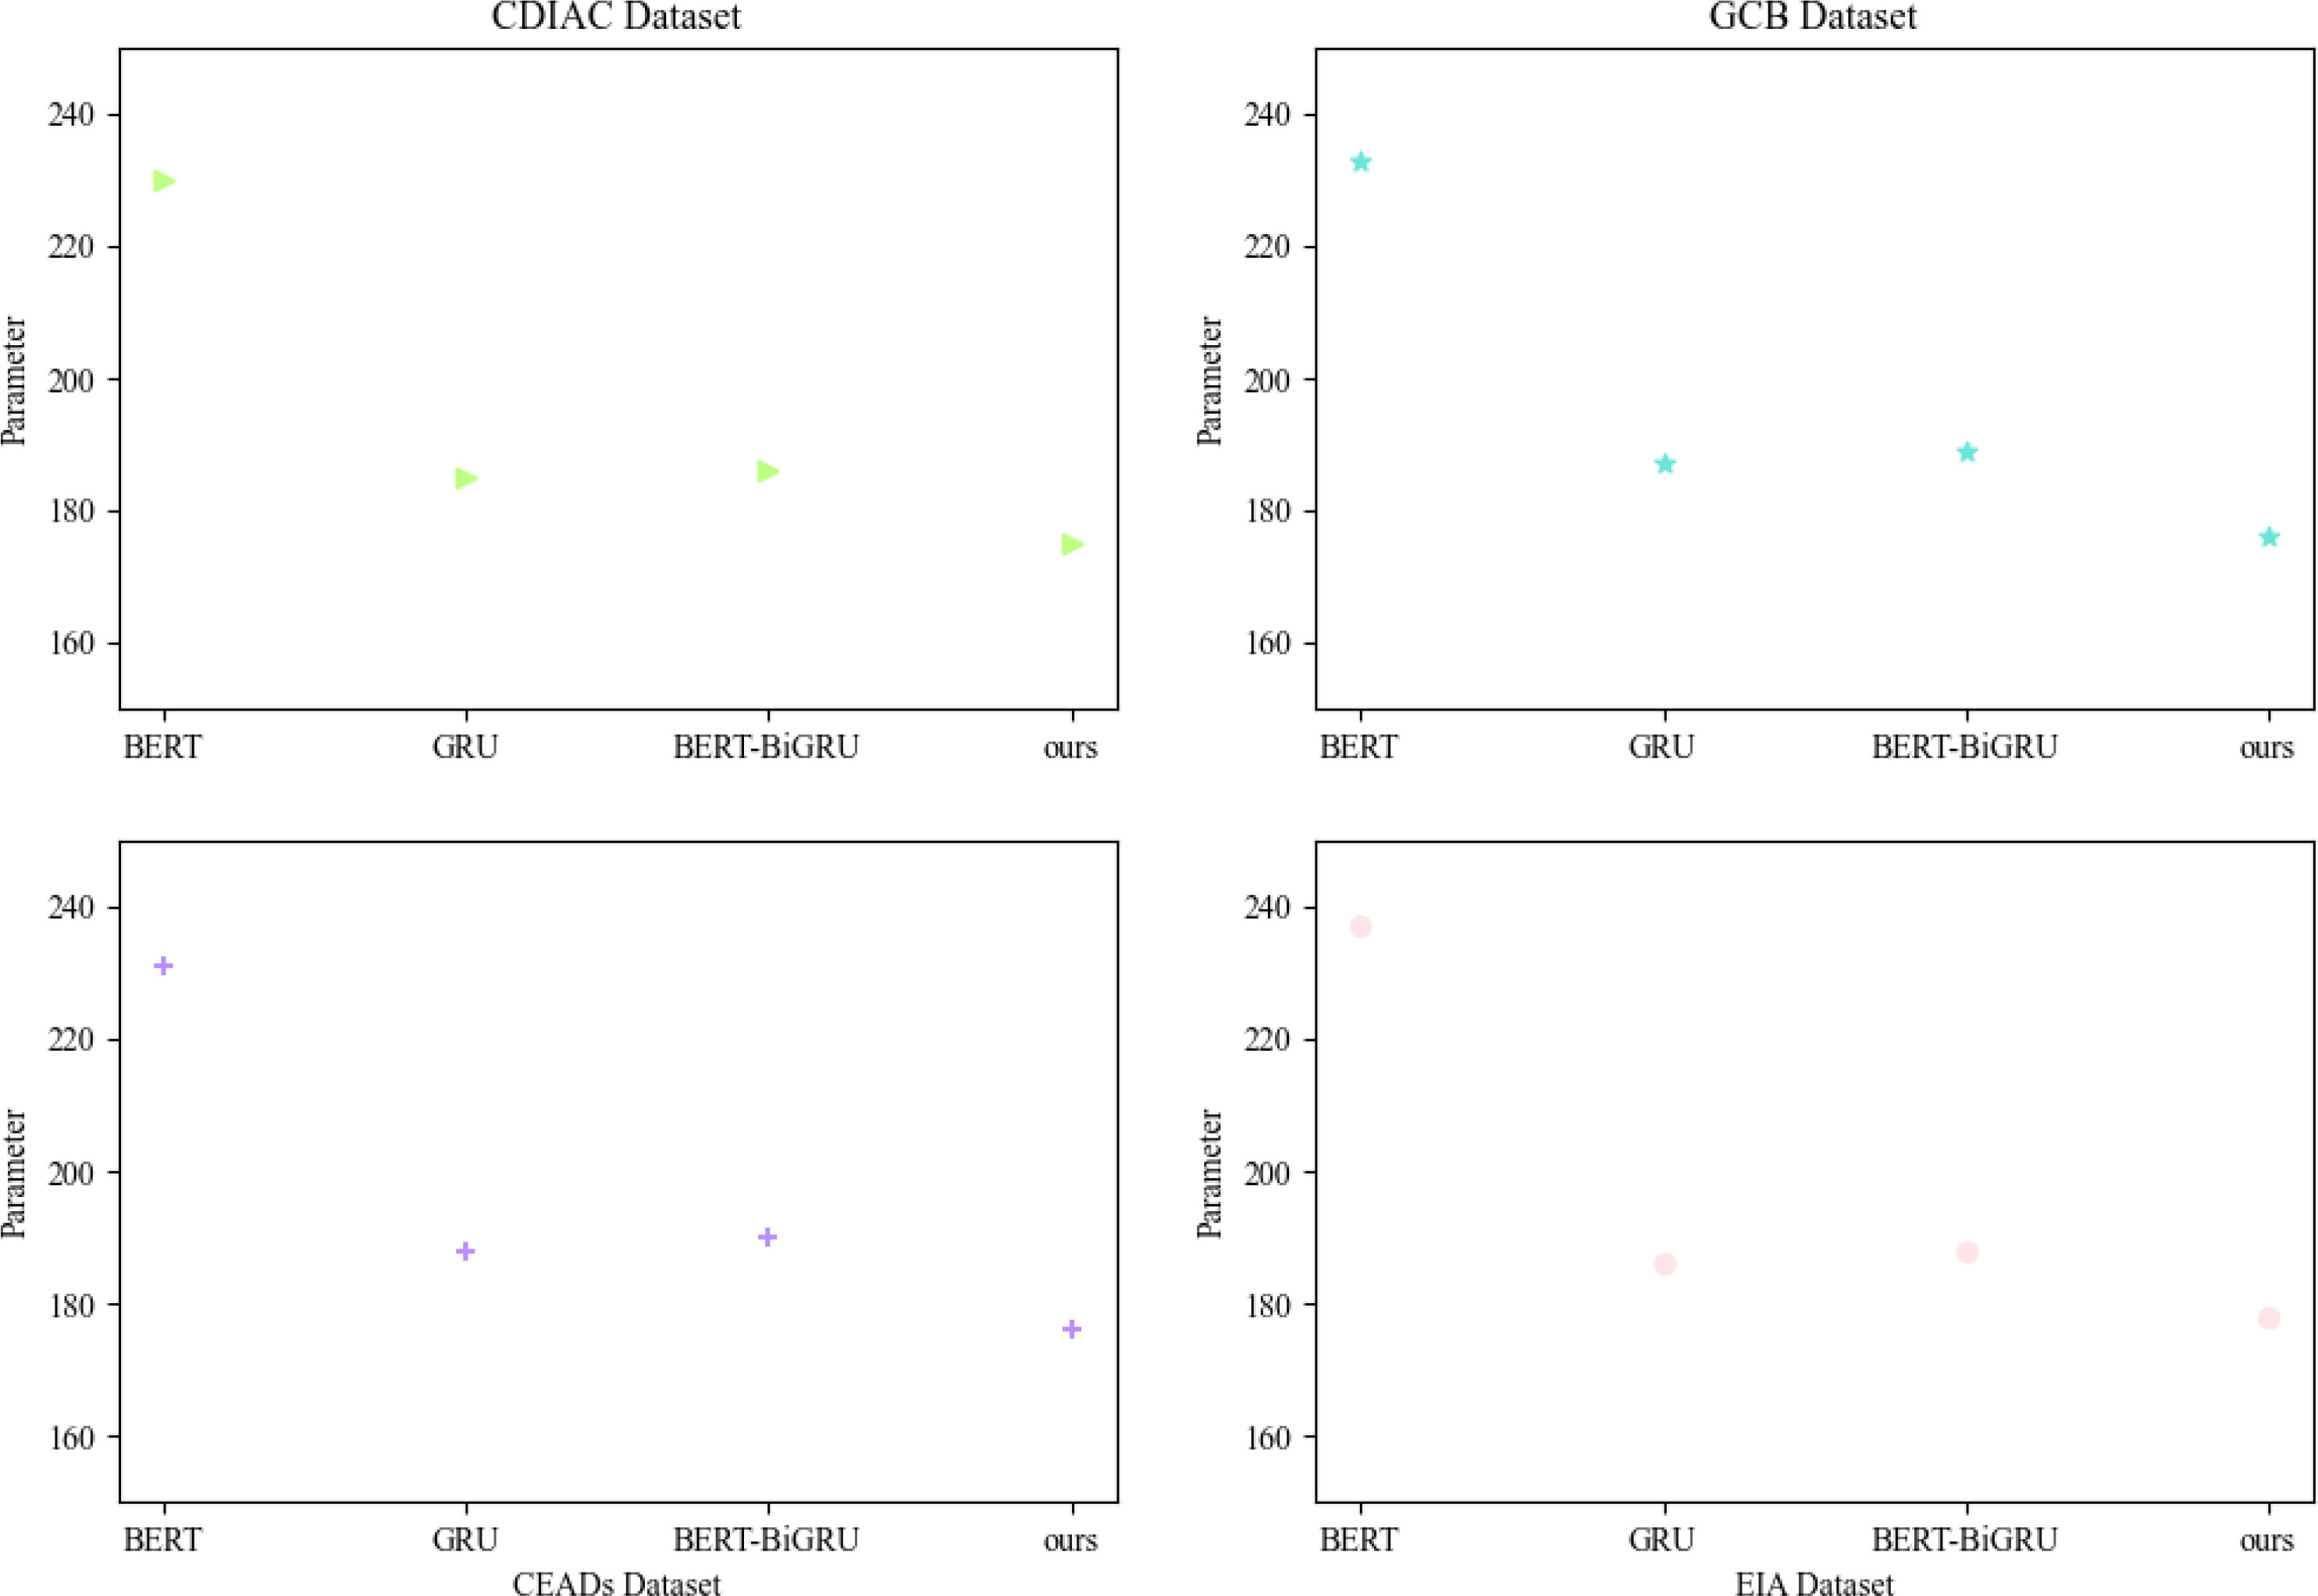
Figure 9 Plots of experimental results of ablation of Parameters indicators for each model - based on CDIAC dataset, GCB dataset, EIA dataset and CEADs dataset.
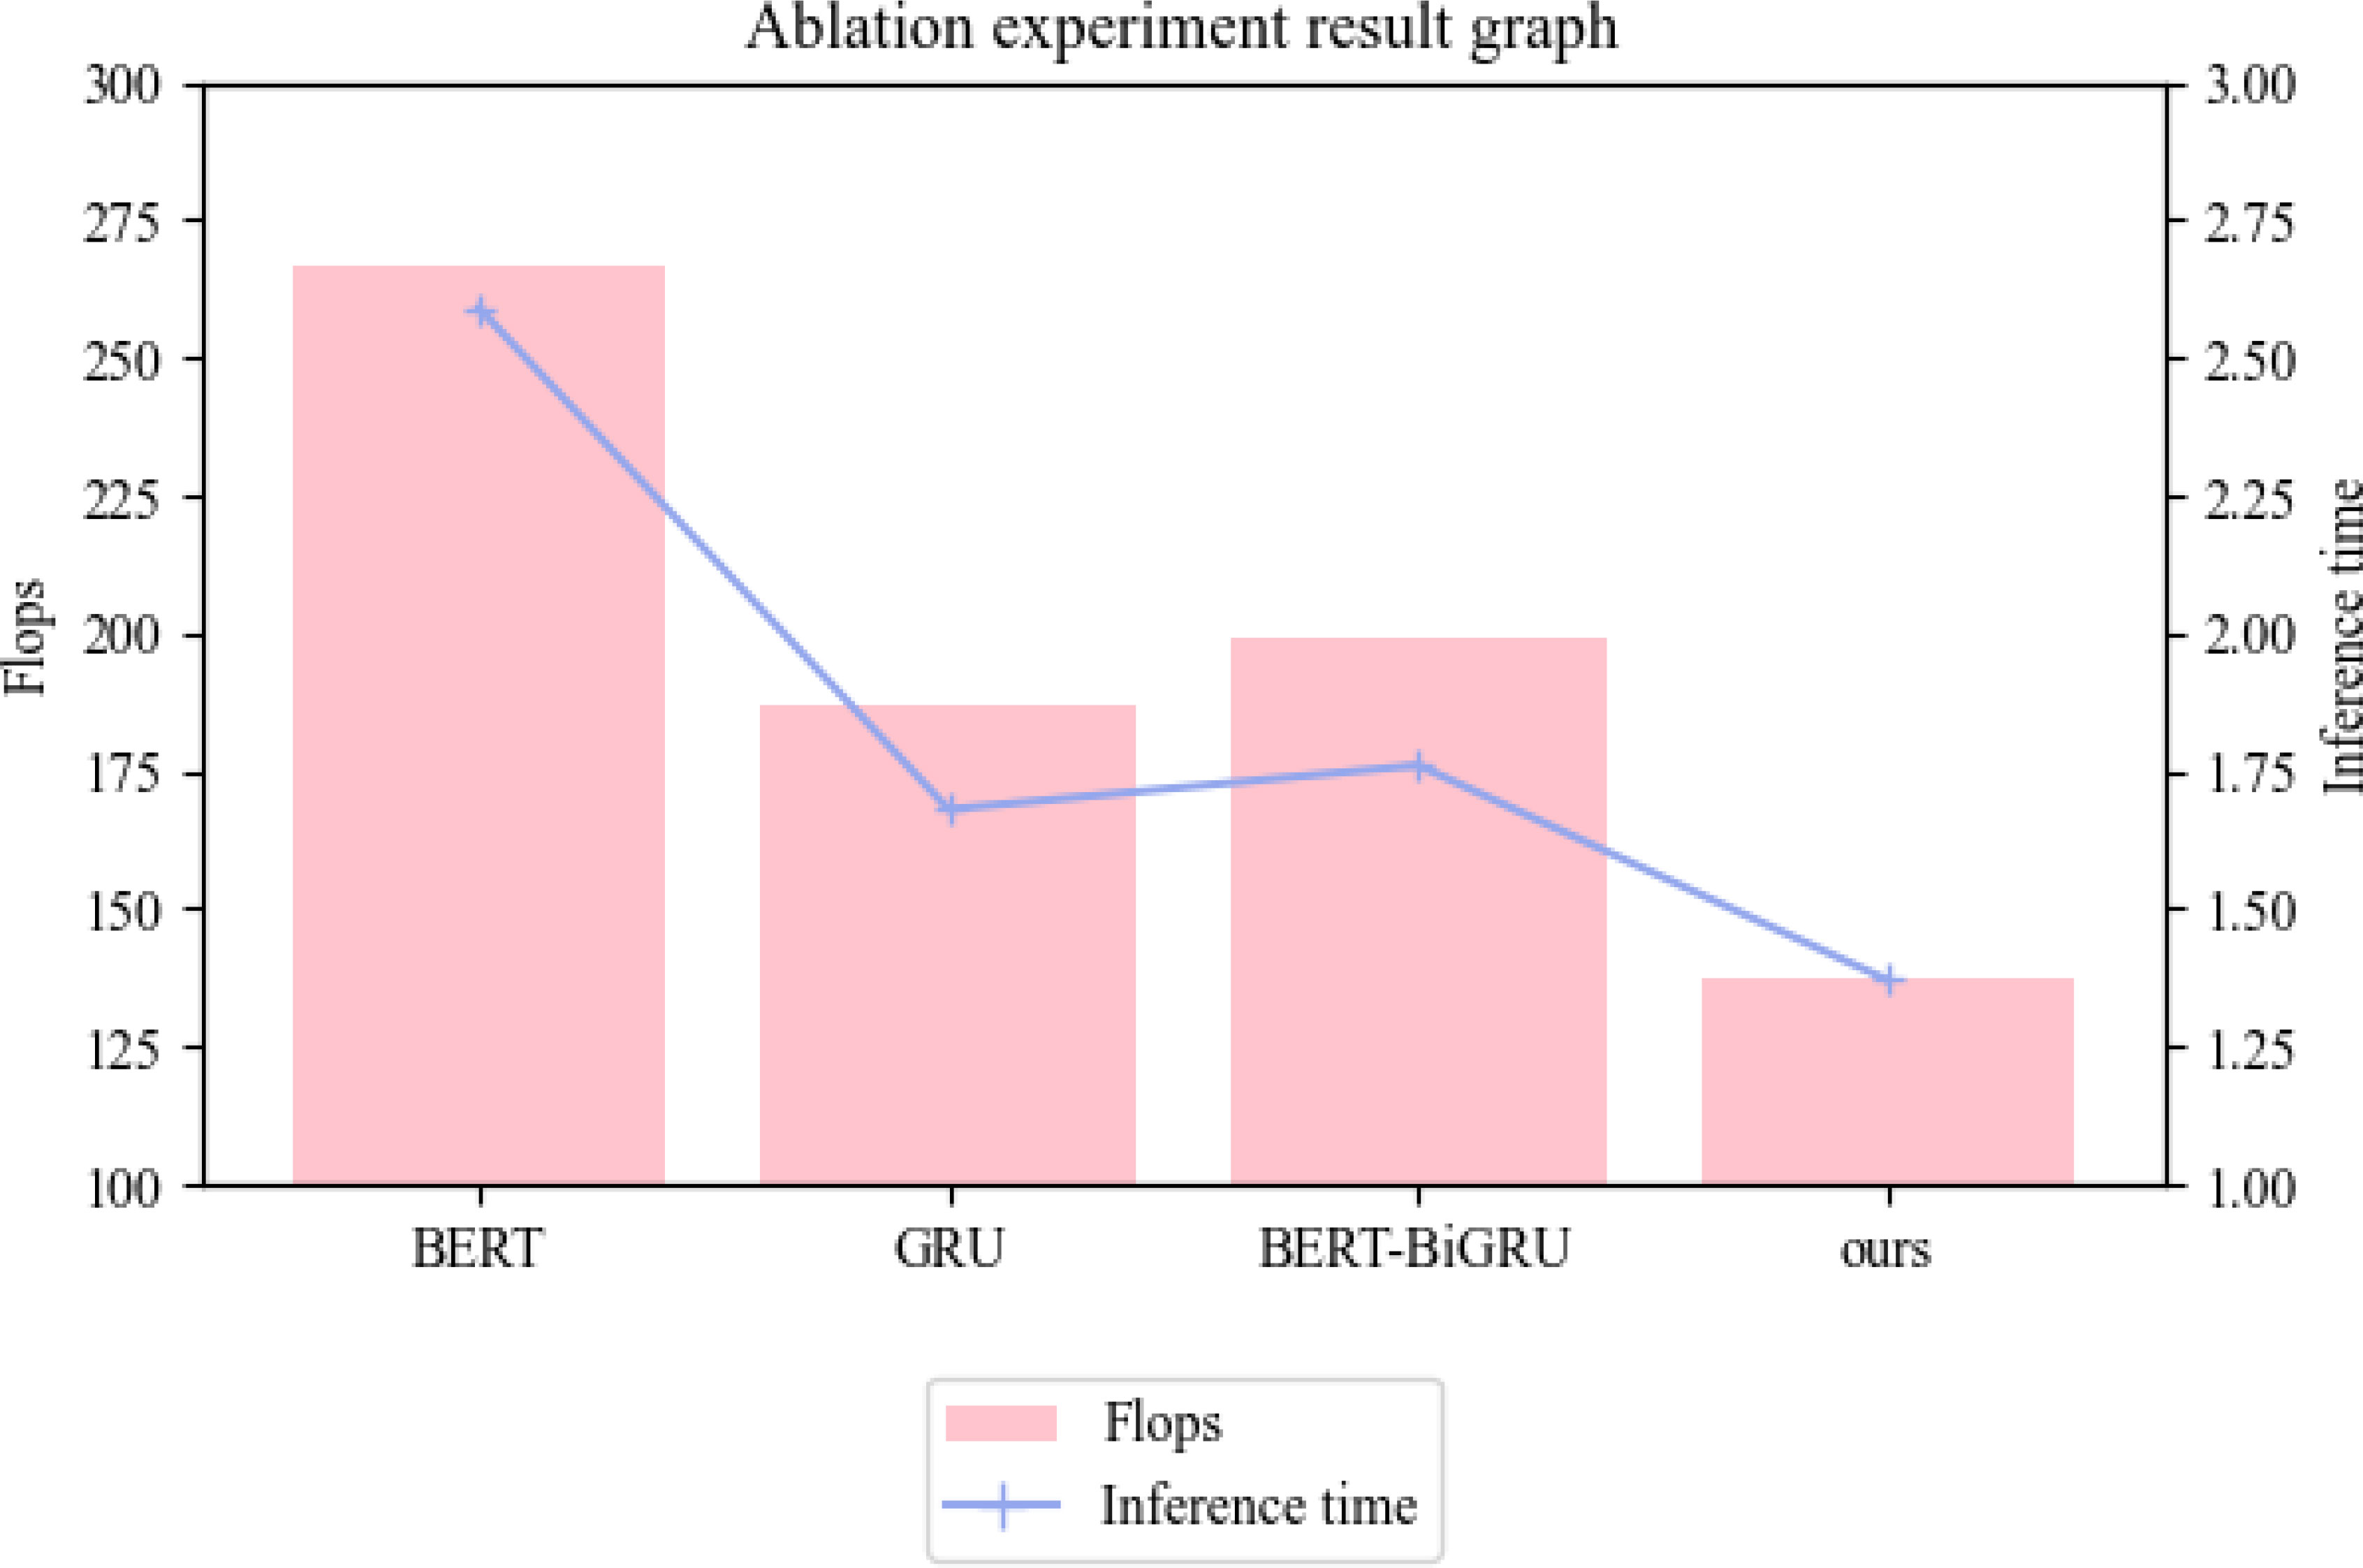
Figure 10 Plots of ablation experimental results for each model Flops, Inference time index - based on CDIAC dataset, GCB dataset, EIA dataset and CEADs dataset.
The Table 2 is summary of our ablation experimental data, where the bolded parts are the best performing data in the table.
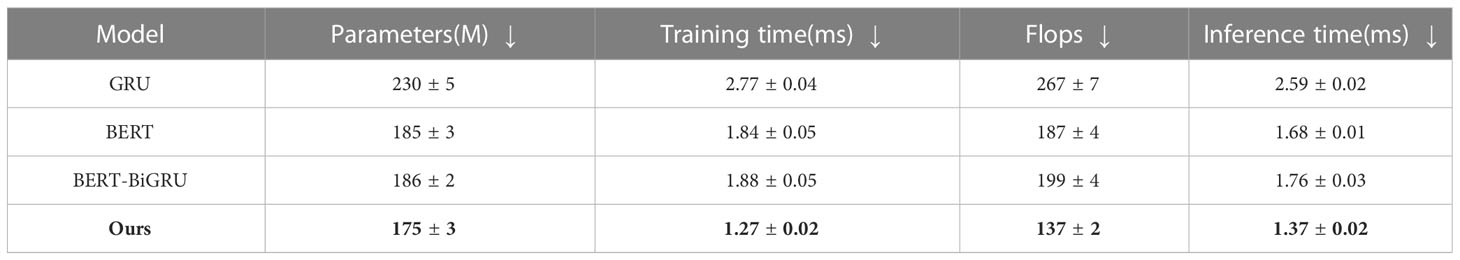
Table 2 Ablation experiment comparison experiment data result graph.
This is the general data table of our experiments. In Table 3, we have selected several important metrics and the best data values for each group of models to visualize the results of our experiments. The bolded parts of the table represent the best data in each group of experiments.

Table 3 Summary chart of experimental results.
5 Conclusion and discussion
In the carbon-neutral enterprise environmental performance assessment field, it is important to evaluate and predict the environmental protection level of enterprises by using natural language processing techniques. To improve the accuracy and reliability of the assessment, we construct a deep learning model based on BERT-GRU for analysing the environmental reports and related text data of enterprises to assess and predict the environmental protection level of enterprises.
In constructing the BERT-GRU model, we first extract features from the text data through the BERT model and convert the text data into a vector representation. Then, the GRU model processes the vectors to extract semantic features of the text data and perform classification and prediction. The model can learn the features of text data adaptively to improve the accuracy and prediction of the environmental level of the enterprise.
Through the experimental results, we find that the BERT-GRU model shows stable and excellent performance in the face of different data sets and can more accurately assess the environmental protection level of enterprises and provide more meaningful results. The model also has high generalisation ability and scalability and can be adapted to different tasks and dataset requirements.
Although the BERT-GRU model has high accuracy and reliability in the field of carbon neutral and corporate environmental performance assessment, it has some shortcomings, such as the model requires a large amount of text data for training and fine-tuning, which may lead to the waste of computational resources and increase in time cost, and the model may have the problem of information loss or confusion when dealing with long text data, which needs further improvement The structure and algorithm of the model.
It remains important to study the field of carbon-neutral corporate environmental performance assessment. First, environmental protection and carbon reduction have become important global issues, and the level of environmental protection and social responsibility of enterprises have become important indicators for assessing the performance and risk of enterprises. Second, using natural language processing technology and deep learning technology to assess and predict the environmental protection level of enterprises can improve the accuracy and reliability of the assessment and provide more meaningful data support for enterprises, and most importantly, studying the field of carbon neutral enterprise environmental performance assessment can also help promote the achievement of sustainable development goals for the whole society and promote the joint development of environmental protection and social economy.
Therefore, we need to further explore and study the relevant technologies and methods in the field of carbon-neutral corporate environmental performance assessment, improve the accuracy and reliability of the assessment, and make greater contributions to the sustainable development of enterprises and society. At the same time, we also need to pay attention to the real problems of environmental protection and carbon emission reduction and continuously promote the innovation and progress of technology and policy to achieve a win-win situation for both the environmental protection cause and the society and economy.
Data availability statement
The original contributions presented in the study are included in the article/supplementary material. Further inquiries can be directed to the corresponding author.
Author contributions
YC contributed to conception and formal analysis of the studey. YC contributed to investigation, resources, and data curation. YC wrote the original draft of the manuscript. YC performed the visualization and project administration, YC provided the funding acquisition. All authors have read and agreed to the published version of the manuscript.
Conflict of interest
The author declares that the research was conducted in the absence of any commercial or financial relationships that could be construed as a potential conflict of interest.
Publisher’s note
All claims expressed in this article are solely those of the authors and do not necessarily represent those of their affiliated organizations, or those of the publisher, the editors and the reviewers. Any product that may be evaluated in this article, or claim that may be made by its manufacturer, is not guaranteed or endorsed by the publisher.
References
Bu Y., Wang E., Qiu Y., Most D. (2022). Impact assessment of population migration on energy consumption and carbon emissions in China: A spatial econometric investigation. Environ. Impact Assess. Rev. 93, 106744. doi: 10.1016/j.eiar.2022.106744
Desai K., Dharaskar S., Pandya J., Shinde S., Vakharia V. (2022). Experimental investigation and validation of ultrasound-assisted extractive/oxidative desulfurization of oil using environmentally benign ionic liquid. Process Saf. Environ. Prot. 166, 512–523. doi: 10.1016/j.psep.2022.08.029
Elnour M., Fadli F., Himeur Y., Petri I., Rezgui Y., Meskin N., et al. (2022a). Performance and energy optimization of building automation and management systems: Towards smart sustainable carbon-neutral sports facilities. Renewable Sustain. Energy Rev. 162, 112401. doi: 10.1016/j.rser.2022.112401
Elnour M., Himeur Y., Fadli F., Mohammedsherif H., Meskin N., Ahmad A. M., et al. (2022b). Neural network-based model predictive control system for optimizing building automation and management systems of sports facilities. Appl. Energy 318, 119153. doi: 10.1016/j.apenergy.2022.119153
Gupta U., Elgamal M., Hills G., Wei G.-Y., Lee H.-H. S., Brooks D., et al. (2022). “Act: Designing sustainable computer systems with an architectural carbon modeling tool,” in Proceedings of the 49th Annual International Symposium on Computer Architecture. 784–799. doi: 10.1145/3470496.3527408
Himeur Y., Elnour M., Fadli F., Meskin N., Petri I., Rezgui Y., et al. (2022). Next-generation energy systems for sustainable smart cities: Roles of transfer learning. Sustain. Cities Soc., 104059. doi: 10.1016/j.scs.2022.104059
Himeur Y., Elnour M., Fadli F., Meskin N., Petri I., Rezgui Y., et al. (2023). Ai-big data analytics for building automation and management systems: a survey, actual challenges and future perspectives. Artif. Intell. Rev. 56, 4929–5021. doi: 10.1007/s10462-022-10286-2
Ji X., Zhang Y., Mirza N., Umar M., Rizvi S. K. A. (2021). The impact of carbon neutrality on the investment performance: Evidence from the equity mutual funds in brics. J. Environ. Manage. 297, 113228. doi: 10.1016/j.jenvman.2021.113228
Jia J., Huang Z., Deng J., Hu F., Li L. (2022). Government performance evaluation in the context of carbon neutrality: Energy-saving of new residential building projects. Sustainability 14, 1274. doi: 10.3390/su14031274
Jia J.-J., Zhu M., Wei C. (2022). Household cooking in the context of carbon neutrality: A machine-learning-based review. Renewable Sustain. Energy Rev. 168, 112856. doi: 10.1016/j.rser.2022.112856
Juvonen J. (2023). Corporate carbon neutrality claims and the legal effects of double counting. Available at: http://urn.fi/URN:NBN:fi:hulib-202305232083.
Klaaßen L., Stoll C. (2021). Harmonizing corporate carbon footprints. Nat. Commun. 12, 1–13. doi: 10.1038/s41467-021-26349-x
Lee O., Joo H., Choi H., Cheon M. (2022). Proposing an integrated approach to analyzing esg data via machine learning and deep learning algorithms. Sustainability 14, 8745. doi: 10.3390/su14148745
Liu Z., Sun Y., Xing C., Liu J., He Y., Zhou Y., et al. (2022). Artificial intelligence powered large-scale renewable integrations in multi-energy systems for carbon neutrality transition: Challenges and future perspectives. Energy AI, 100195. doi: 10.1016/j.egyai.2022.100195
Lu C., Wang B., Chen T., Yang J. (2022). A document analysis of peak carbon emissions and carbon neutrality policies based on a pmc index model in China. Int. J. Environ. Res. Public Health 19, 9312. doi: 10.3390/ijerph19159312
Su Y., Zhou X. (2023). “Bert-lda for key technology identification: An experimental study on carbon neutralization,” in Proceedings of the world conference on intelligent and 3-D technologies (WCI3DT 2022) methods, algorithms and applications. 435–445 (Springer). doi: 10.1007/978-981-19-7184-6_36
Tan J., Wang R. (2021). Research on evaluation and influencing factors of regional ecological efficiency from the perspective of carbon neutrality. J. Environ. Manage. 294, 113030. doi: 10.1016/j.jenvman.2021.113030
Too J., Ejohwomu O. A., Hui F. K., Duffield C., Bukoye O. T., Edwards D. J. (2022). Framework for standardising carbon neutrality in building projects. J. Cleaner Production, 133858. doi: 10.1016/j.jclepro.2022.133858
Udemba E. N. (2021). Nexus of ecological footprint and foreign direct investment pattern in carbon neutrality: new insight for United Arab Emirates (uae). Environ. Sci. Pollut. Res. 28, 34367–34385. doi: 10.1007/s11356-021-12678-3
Vakharia V., Shah M., Nair P., Borade H., Sahlot P., Wankhede V. (2023). Estimation of lithium-ion battery discharge capacity by integrating optimized explainable-ai and stacked lstm model. Batteries 9. doi: 10.3390/batteries9020125
Wang X., Huang J., Liu H. (2022). Can China’s carbon trading policy help achieve carbon neutrality?—a study of policy effects from the five-sphere integrated plan perspective. J. Environ. Manage. 305, 114357. doi: 10.1016/j.jenvman.2021.114357
Wang G., Si H., Zhao X., Wu G. (2023). Carbon neutrality approaches in buildings and agriculture sectors. Front. Environ. Sci. 11, 1133587. doi: 10.3389/fenvs.2023.1133587
Wen H., Liang W., Lee C.-C. (2023). China’s progress toward sustainable development in pursuit of carbon neutrality: Regional differences and dynamic evolution. Environ. Impact Assess. Rev. 98, 106959. doi: 10.1016/j.eiar.2022.106959
Wu J., Li X., Jin R. (2022). The response of the industrial system to the interrelationship approaching to carbon neutrality of carbon sources and sinks from carbon metabolism: Coal chemical case study. Energy 261, 125172. doi: 10.1016/j.energy.2022.125172
Xi H., Wu X., Chen X., Sha P. (2021). Artificial intelligent based energy scheduling of steel mill gas utilization system towards carbon neutrality. Appl. Energy 295, 117069. doi: 10.1016/j.apenergy.2021.117069
Yoshino N., Rasoulinezhad E., Phoumin H., Taghizadeh-Hesary F. (2023). Smes and carbon neutrality in asean: the need to revisit sustainability policies. Economic Research-Ekonomska Istrazivanjaˇ 36, 2177180. doi: 10.1080/1331677X.2023.2177180
Zhang Y.-h., Feng T.-t. (2022). How does the design of personal carbon trading system affect willingness to participate under carbon neutrality goal?—evidence from a choice experiment. Environ. Sci. Pollut. Res. 29, 81970–81992. doi: 10.1007/s11356-022-21549-4
Zhang A., Tay H. L., Alvi M. F., Wang J. X., Gong Y. (2023). Carbon neutrality drivers and implications for firm performance and supply chain management. Business Strategy Environ. 32, 1966–1980. doi: 10.1002/bse.3230
Keywords: BERT, GRU, carbon neutral, corporate environmental performance assessment, transformer
Citation: Chen Y (2023) Construction of a carbon neutral enterprise environmental performance assessment model based on transformer-GRU. Front. Ecol. Evol. 11:1247644. doi: 10.3389/fevo.2023.1247644
Received: 26 June 2023; Accepted: 13 July 2023;
Published: 10 August 2023.
Edited by:
Praveen Kumar Donta, Vienna University of Technology, AustriaReviewed by:
Vinay Vakharia, Pandit Deendayal Petroleum University, IndiaYassine Himeur, University of Dubai, United Arab Emirates
Copyright © 2023 Chen. This is an open-access article distributed under the terms of the Creative Commons Attribution License (CC BY). The use, distribution or reproduction in other forums is permitted, provided the original author(s) and the copyright owner(s) are credited and that the original publication in this journal is cited, in accordance with accepted academic practice. No use, distribution or reproduction is permitted which does not comply with these terms.
*Correspondence: Yanqing Chen, Y2hlbnlhbnFpbmcyMDIzQDE2My5jb20=