 Caixia Li1,2Guoqi Chai1,2Zhiyuan Li3Xiang Jia1,2Lingting Lei1,2Long Chen1,2Yunfan Li1,2Yunfeng Cao1,2Ruoning Zhu4Xiaoli Mei4
 Xiaoli Zhang1,2*
- 1Precision Forestry Key Laboratory of Beijing, College of Forestry, Beijing Forestry University, Beijing, China
- 2The Key Laboratory for Silviculture and Conservation of Ministry of Education, Beijing Forestry University, Beijing, China
- 3School of Geosciences, Yangtze University, Wuhan, China
- 4The Third Construction CO., LTD of China Construction First Group, Beijing, China
Due to global climate change and the intensification of human activities, the ecological function of Wuliangsu Lake Basin has been seriously degraded. Obtaining accurate spatial–temporal dynamics of regional ecological environment quality is essential for the evaluation of ecological management and restoration effects. This study assessed the trend changes and drivers of the Remote Sensing Ecological Index (RSEI) in the Wuliangsu Lake Basin from 2000−2020. Firstly, the trend analysis method and hurst index were used to analyze the temporal and spatial variation of RSEI. Then the main factors of RSEI variation were analyzed using meteorological data, integrated nighttime lighting data, and population density data. Overall, the RSEI shows an increasing trend from the west to the east with a rate of 0.0034 year−1 over the last 21 years. The area change of RSEI was 54.22%, 63.80% and 52.43% for 2000−2006, 2007−2013 and 2014−2020, respectively, which indicates that most areas have a stable ecological environment. However, the overall Future Improvement Trend (FIT) area of RSEI is 42.21%, mainly in Dengkou area, Urad Qianqi and central area. This indicates that the RSEI remains stable locally and shows an overall improving trend. The results of the correlation analysis showed that the areas influenced by meteorological and human factors were highly coincident, mainly in Dengkou and northern Linhe areas and Urad Qianqi. Considering the lagging effect of ecological engineering, the sustainable development status of RSEI in the western and eastern regions will maintain an improving trend in the future. Our study confirms the complex relationship between RSEI and meteorological and human activities, which is crucial for the scientific management of watershed ecosystems under the influence of anthropogenic factors.
1 Introduction
Eco-environmental quality assessment is essential for quantitatively measuring the strengths, weaknesses and impacts of regional ecological environments (Balsamo et al., 2015). It is a significant basis for formulating regional socio-economic sustainable development plans and eco-environmental protection measures, and also a crucial assessment for the stability of ecosystems in desertification areas (Sun et al., 2015). The vegetation in desertification areas has the function of conserving water sources preventing wind and fixing sand. However, due to the lack of water resources and the impacts human activities, most of the vegetation has been degraded in the arid and semi-arid regions of northwest China, leading to environmental problems such as land exposure, soil erosion and sandstorm. In order to solve these environmental problems, the Chinese government launched the “Return the Grain plots to Forestry” program (Zhang et al., 2012). The rapid development of China’s economy has brought challenges to ecological and environmental management. Subsequently, the government has carried out a series of ecological restoration and treatment projects. The ecological protection red line was set in forests, lakes and wetlands in accordance with the concept of “mountains, water, forests, fields, lakes and grasses are a community of life”. In recent years, ecological restoration projects have been implemented in desertification areas based on this concept, aiming to improve the local ecological environment. Therefore, ecological monitoring has become an important element of environmental protection and management, and large-scale, long time series dynamic monitoring is conducive to timely adjustment of policies and directions. With China’s rapid economic development and increased awareness of environmental protection, China has launched a series of ecological restoration and conservation programs aimed at improving the ecological environment in ecologically fragile desert areas. However, arid and semi-arid areas are restricted by natural conditions, and traditional “greening” monitoring indices are limited by region, scale, and time. As a result, it is often impossible to obtain complete data for achieving long-term prediction and environmental dynamic monitoring in desert areas.
Remote sensing data has been applied to ecological environment monitoring due to its advantages of easy access to long-time series data and repeated observation at regional scale (Yang et al., 2002). Ecological monitoring not only includes land, but changes in the oceans are also an important element of dynamic monitoring. (Chen et al, 2022). used remote sensing images from 2000 to 2018 to extract coastline information, and the results showed that remote sensing images help to extract coastline information, which plays an important role in marine ecological protection. Chen et al. (2023). analyzed the spatial and temporal characteristics of Harmful algal blooms (HABs) using remotely sensed data from 1990 to 2019 and explored correlations with chlorophyll concentration, salinity, and temperature. (Liang et al, 2023). analyzed the characteristics of land use and land cover (LUCC) and coastline changes in Hangzhou Bay from 1985 to 2020 based on the GEE platform and remote sensing technical methods.
The single vegetation indices commonly used to characterize the ecological changes of vegetation in the early days were Normalized Vegetation Index (NDVI) (Rouse et al., 1974; Myneni and Williams, 1994), Enhanced Vegetation Index (EVI) (Nemani et al., 2003; Panigrahi et al., 2021) and Leaf Area Index (LAI) (Pettorelli et al., 2005; Nanzad et al., 2019). However, relying on a single ecological index to describe the change state of the entire ecological environment has limitations, because it is a highly complex system. Therefore, the ecological environmental status index (EI) (Zhi et al., 2009) evaluates the ecological environment status by weighting different indicators. Nevertheless, how to determine the weights of different indicators and reduce the subjective human influence are the difficulties in the application of EI. In addition, obtaining long-term series of socioeconomic data is also one of the challenges. In order to characterize the environmental conditions of complex ecosystems, Remote Sensing Ecological Index (RSEI) (Xu, 2013) has been applied to the monitoring of vegetation dynamic changes and urban ecological environment since it was proposed. RSEI can reflect the responses of urbanization to changes in the vegetation cover and the climate change (Jiang et al., 2009; Zheng et al., 2021). Besides, it can avoid the uncertainty or errors in the definition of weights caused by subjective factors and is useful for quantitative evaluation of changes in the eco-environment (Xin et al., 2008a; Wang et al., 2016).
Climate change and the intensification of human activities will alter the quality of the ecological environment in arid and semi-arid zones (Chen et al., 2023). Distinguishing between the impacts of climate change and human activities on ecological and environmental quality can help to reflect changes in regional vegetation, and provide scientific guidance for regional environmental management and sustainable development (Fan et al., 2023). Studies have shown that precipitation is an important factor in improving ecological quality. The ecological environment in arid and semi-arid regions of Northwest China is showing a trend of improvement (Geng et al., 2022). In the 21st century, the challenge is to quantify the impact of human activities under the dual influence of climate change and human activities. Commonly used methods for studying the factors influencing ecological changes include partial derivative analysis (An et al., 2022), multivariate analysis (Bartkowiak et al., 2019), and principal component analysis (Cao et al., 2022). Methods used to quantify human activities include the difference-in-difference method and correlation analysis, among others (Gorelick et al., 2017). Although the difference-in-difference method can quantitatively distinguish the effects of climate change and human activities, it relies on actual measurement data and has linear limitations when studying large-scale ecological and environmental changes (Zhang et al., 2022). The residual analysis method can quantify anthropogenic factors and, to some extent, eliminate the linear error between ecological quality and meteorological factors in traditional methods, thereby distinguishing anthropogenic factors (Kumar and Mutanga, 2018).
The special geographical location of the Wuliangsu Lake Basin (WLB) determines the different functions roles of the region. It serves as a green barrier against the wind and sand of the Ulan Buh Desert to the west (Jia et al., 2023). It serves as a reservoir of water, and the grasslands of the Yinshan Mountains to the east and the Urad Qianqi to the north have been able to grow rapidly. The WLB is a typical representative of an ecological management and restoration area in China that plays a crucial role in protecting the local ecological environment. The local ecological environment is improved by planting Haloxylon ammodendron and establishing grass squares in desert areas. The mine was built by leveling the hills, laying down soil and planting drought tolerant Hippophae rhamnoides Linn and other vegetation. There are differences in the processes and effects of different restoration projects in ecological quality enhancement. valuating the effect of ecological environment restoration projects is an important core content of the current ecological restoration area. However, there is still a lack of monitoring research on long-term environmental dynamic changes in ecological governance areas.
This study uses MODIS data to build a RSEI index on GEE platform to evaluate the ecological environment quality of WLB area from 2000 to 2020. With the liner regression methods and Hurst index, we can analyze the overall trend of RSEI and predict future change trends in ecological quality. The residual analysis was used to analyze the influencing factors of RSEI. We assessed the relationships between the RSEI, climate variables, and variables characterizing human activity using meteorological data, Comprehensive Nighttime Light Index (CNLI) data and population density statistics. The main research questions are:
(1) What are the spatial and temporal trends of RSEI?
(2) What are the areas of sustainable improvement or degradation in the future?
(3) What are the main drivers influencing the changes in RSEI?
This study uses multi‐source remote sensing data to evaluate the regional effects of similar ecological restoration, which is an important complement to the study cases of ecological special zones and has a good demonstration effect. This can not only provide an objective perspective for the ecological quality assessment of watershed systems but also allow for long‐term dynamic monitoring of the effects of ecological restoration projects.
2 Materials and methodology
2.1 Study area
The study area is located in the central part of Inner Mongolia Autonomous Region, China (106°30′ E~109°30′ E, 40°10′N~41°20′N), which is an important geographical area, as shown in Figure 1. The area is situated between the Daxinganling vein system and the Taihang Mountains, including mountains, plateaus, plains, and lakes. The region has a temperate continental climate characterized by high temperature variations, low annual precipitation, and high evaporation rates. Additionally, the area has a significant natural ecological landscape of grasslands, forests, and wetlands, making it one of the important biodiversity reserves. The species of zonal vegetation in the basin include Stipa gobica desert steppe, Festuca pratensis Huds, Tamarix chinensis Lour, PopulusL and other cultivated vegetation.
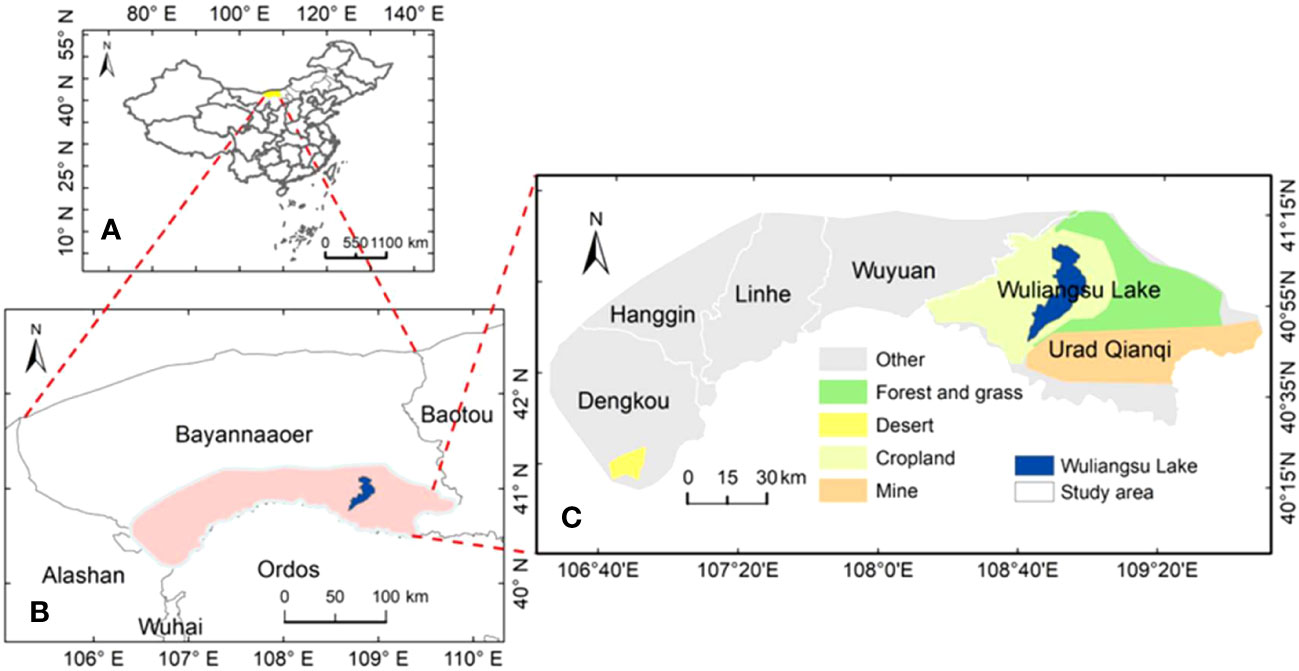
Figure 1 The location of the WLB. Chinese province (A), BayanNur, Inner Mongolia Autonomous Region (B), Study area (C).
2.2 Data and preprocessing
2.2.1 Remote sensing data
The construction of RSEI requires greenness, heat, wetness and dryness data (https://code.earthengine.google.com/). Among them, the greenness component is expressed using the vegetation index (NDVI), which is derived from MOD13Q1 product with a spatial and temporal resolution of 500 m and 16 d, respectively. Heat component is extracted from the daytime land surface temperature (DLST), which provides 8d average land surface temperatures at 1km spatial resolution (Wan, 2008). The wetness and dryness components were calculated from MOD09A1 with a spatial and temporal resolution of 500m and 8d, respectively. All the data are processed through the GEE platform, covering 2000 to 2020.
We used the GEE platform to process MOIDS data, and the detailed steps are shown below.
(1) Preprocessing of remote sensing data based on GEE platform. The GEE cloud masking algorithm was used to remove abnormal cloud pixels and cloud shadows.
(2) Calculating the component indicators. The NDVI and LST were used to express greenness and heat respectively. The Wet and NDBSI (Normalized Difference Bare Soil Index) were used to indicate wetness and dryness respectively, where NDBSI is composed of IBI (Index-based Built-up Index) and SI (Soil Index) (Xu, 2008). It is suitable for the calculation of arid and semi-arid regions and MODIS data in Northwest China (Zhang et al., 2002). The calculation equation of Wet and NDBSI are shown in equations (1) to (4).
Where , , , , , and represents Band 1 (620 to 670nm), Band 2 (841 to 876nm), Band 3 (459 to 479nm), Band 4 (545 to 565nm), Band 5 (1230 to 1250nm), Band 6 (1628 to 1652nm) and Band 7 (2105 to 2155nm), respectively.
(3) Calculating normalized data. The NDVI, LST, Wet, and NDBSI are normalized so that the data dimensions are the same, where the equation are as follows:
Where M is the original index, NI is the normalized index, Mmax and Mmin are the maximum and minimum values of the indicator, respectively.
We used Defense Meteorological Satellite Program (DMSP)/Operational Linescan System (OLS) stable light (STL) data to depict the influences of human activities and socioeconomic factors (https://www.ngdc.noaa.gov/eog/dmsp/) with from the period 1992 to 2013 (Xiong et al., 2016; Li et al., 2019c). To ensure continuity in the lighting data, we used the NPP/VIIRS cloud mask (VCM) dataset (https://www.ngdc.noaa.gov/eog/viirs/) for the period between 2014 and 2020 (Lee et al., 2014; Zheng et al., 2020). The detailed parameters used are presented in Table 1.
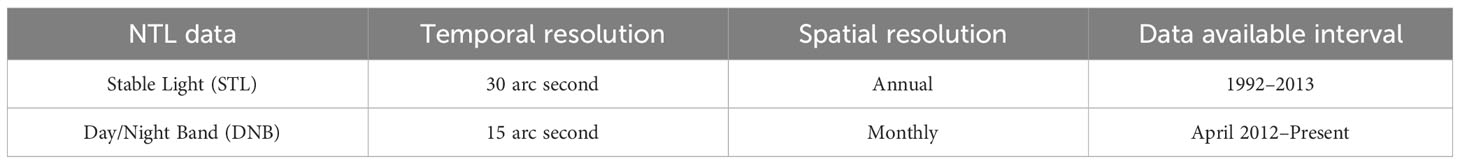
Table 1 Data parameters of nighttime light data.
The land use data were used to analyze changes in the WLB before and after ecological restoration (http://www.resd.cn) (Liu et al., 2005; Liu et al., 2018).
2.2.2 Climate data
We obtained temperature and precipitation data from the ERA5 dataset published by the European Centre for Medium-Range Weather Forecasts (ECMWF) for the period between 2000 and 2020 to assess the impact of meteorological factors on the distribution of the RSEI index. The ERA5 dataset has a spatial resolution of 0.1° and temporal resolution is a month scale. To match the spatial resolution of the RSEI data, we resampled the meteorological data using ArcGIS software.
2.2.3 Statistical data
Population distribution and its spatial–temporal variations are a direct representation of urbanization, and were used to characterize the ecological impact of urbanization. The population density dataset used was provided by WorldPop (https://www.worldpop.org/) with a spatial resolution of 30 arc second (around 1km at equator) and the time series from 2000 to 2020, based on the WGS-84 geographical reference system. In addition, the publicly available set of population numbers for 2000 to 2020 was obtained through the official website of the government of Inner Mongolia, China. We resampled the population density data using ArcGIS10.5 software to ensure consistency with the accuracy of RSEI.
2.3 Methods
Figure 2 shows the various steps involved in the study, which are as follows: (1) Construction of RSEI and preparation of data and pre-processing. (2) The process of spatial analysis. (3) The results of spatial and correlation analysis.
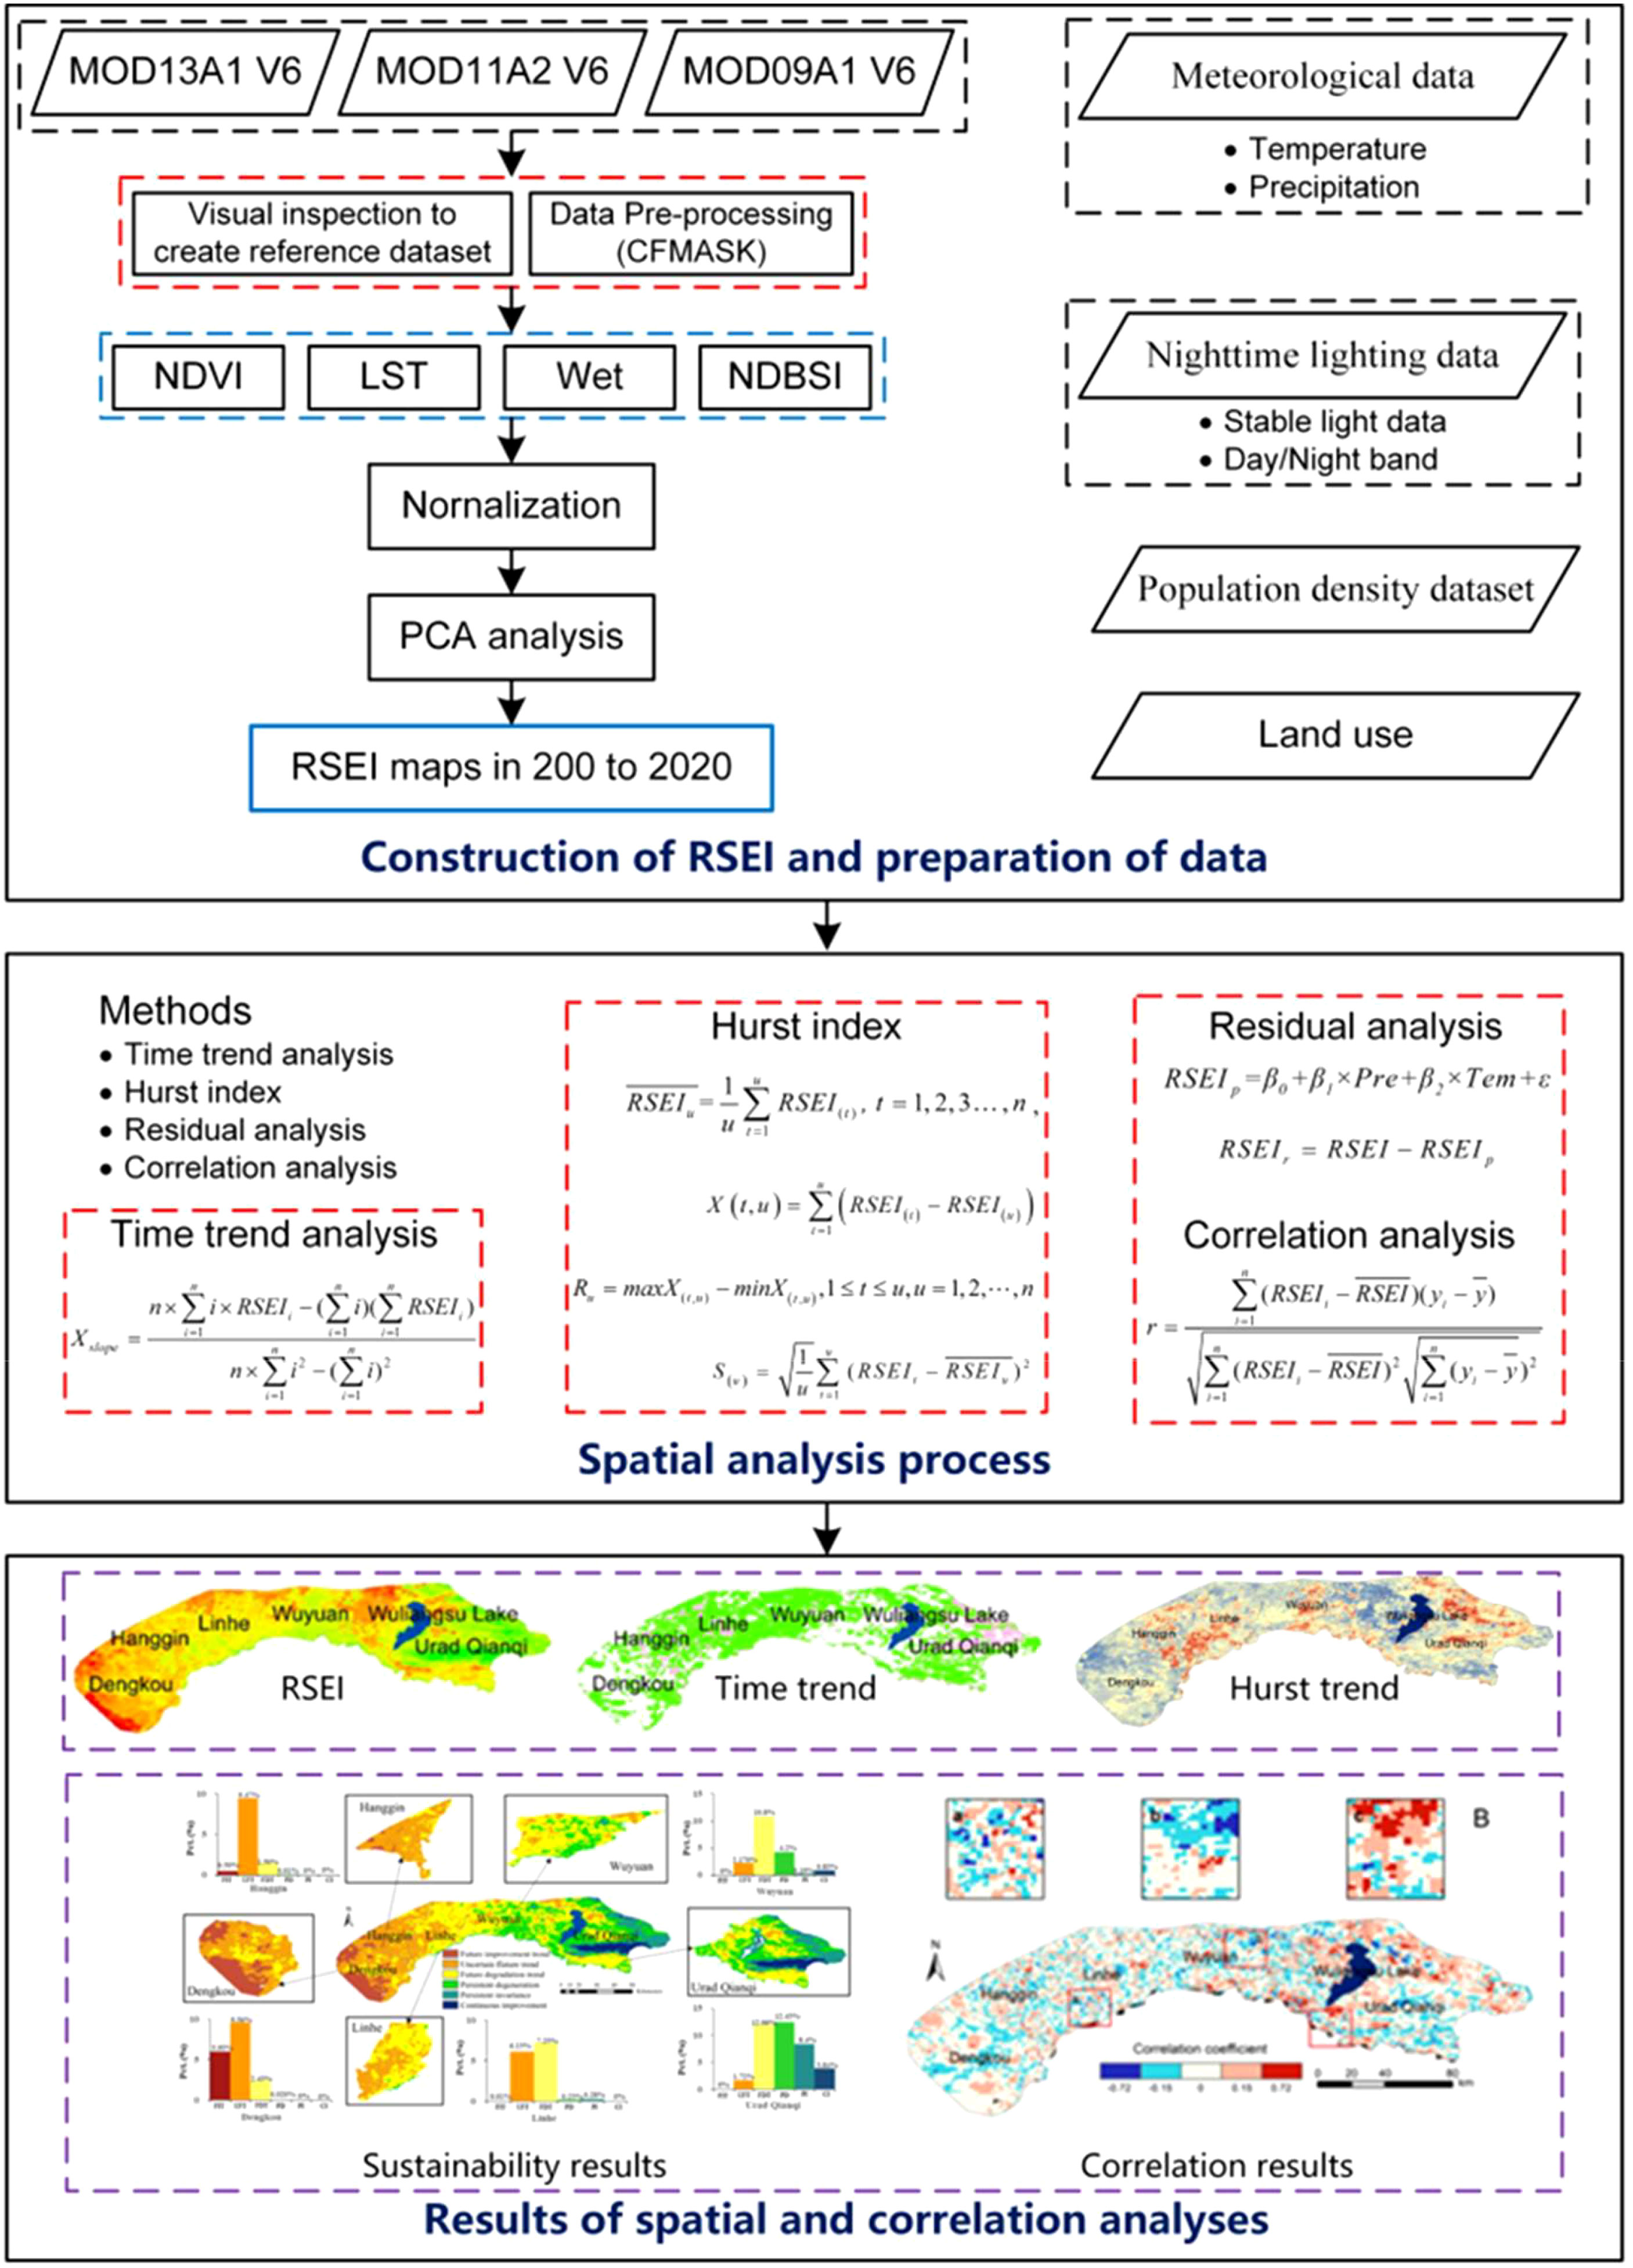
Figure 2 Research flow chart.
2.3.1 Construction of RSEI
The PCA method has been proved that the information is concentrated on the first principal component (Yu et al., 2006). In our analysis, we used the first principal component (PC1) to synthesize multiple indicators using the GEE platform. The calculation equation is as follows (Xu, 2013).
2.3.2 Time trend analysis
We conducted a time trend analysis of RSEI using linear propensity estimation and a statistical test of correlation coefficient. To quantitatively analyze the interannual change trend of RSEI, we used the least squares linear regression equation to calculate the slope of its interannual variation. The calculation equation for the slope is as follows.
Where Xslope is the slope of RSEI, indicating the changing trend of RSEI, n is the monitoring year, RSEIi is the maximum RSEI in the i year. When Xslope is positive, it indicates that RSEI shows a upward trend; when Xslope is negative, indicating that RSEI shows a downward trend; when Xslope is zero, it indicates that RSEI has hardly changed.
In order to more visually compare and analyze the changes in the WLB area over the 21 years from 2000–2020. We used the time trend analysis method to obtain the spatial trend change maps of the RSEI of the WLB for three time periods 2000 to 2006, 2007 to 2013 and 2014 to 2020, respectively. There is variability in China’s conservation measures in response to the ecological problems faced at different times. China implemented measures to remain “Green” in 1990. With rapid economic development, China continued to increase its efforts to protect the ecological environment and raise human awareness of environmental protection in 2010. The WLB area was designated as a protected area for ecological restoration for China in 2017. We quantify the Chinese government’s efforts to protect the ecological environment by dividing these three representative time periods and comparing the trends in the three phases, in order to make the results of the analysis more convincing. As well as the spatial trend change maps of the population density and nighttime light data of the WLB from 2000 to 2020, respectively.
2.3.3 Hurst index
The Hurst Exponent is an analytical method that measures whether a time series has long-term memory (Cao et al., 2014). Defining a time series, for any positive integer u, the mean, cumulative difference, extreme difference, and standard deviation of RSEI were calculated as shown in (8) to (11).
and X(t,u) is represents the mean series and the mean cumulative deviation, respectively. Ru represents the range and S(u) represents the standard deviation. When it appears , which shows that there is a hurst phenomenon at this time series, and the Hurst index is represented by the value of H. Based on the H value, we can determine whether the RSEI changes are completely random or there is a continuous. If 0<H<0.5, it shows consistent changes in the time series before and after. If H=0.5, it represents that it is random or irrelevant and does not affect the future now. When H>0.5, it indicates that there is long-term correlation and has a certain continuity. When H=1, it indicates that the future can be predicted with the present status.
2.3.4 Residual analysis
Residual analysis is a statistical technique used to assess the goodness of fit of a model or to evaluate the assumptions of a regression or predictive model (Evans and Geerken, 2004; Wessels et al., 2012). The residual analysis method can separate the effects of climatic elements and human activities on RSEI changes (Chu et al., 2019). Based on the correlation between climate factors and RSEI, the contribution of climate change to RSEI was extracted, followed by a regression model of climate factors and RSEI to predict the RSEI values. The residual difference between the actual RSEI values and the climate change-based projections, without considering other non-deterministic factors, represents the fraction contributed by human activities. In the absence of anthropogenic impacts, the inter-annual variation of the residuals is characterized by random variation around the zero value, and if the inter–annual variation of the residuals shows a significant downward trend, it indicates that anthropogenic activities have caused vegetation degradation. Conversely, a positive trend shows that human activities have improved the ecosystem (Jiang et al., 2017; Liu et al., 2022). Based on this, we use the climate data to calculate the predicted values of RSEI by applying the regression model calculation equation shown in (12). Secondly, we used the real values of RSEI and the predicted values of RSEI from 2000 to 2020 for the residual calculation, and the calculation formula is shown in (13). Finally, we completed the experiments of residual analysis by MATLAB (R2017b) software.
Where the RESI, RSEIp and RSEIr represents the true, predicted and residual values of RSEI from 2000 to 2020, respectively. where the residual value (RSEIr) is used as a parameter to characterize human activity. P is precipitation (mm). T is temperature (°C). is regression intercept. is the random error. is the coefficient.
2.3.5 Construction of the comprehensive nighttime light index
The Comprehensive Nighttime Light Index (CNLI) is widely used to quantify the impact of human activities on different regions (Jeong et al., 2011; Hao et al., 2012). The CNLI index for WLB 2000 to 2020 was constructed by using MATLAB (R2017b) software.
2.3.6 Correlation analysis
We correlated the RSEI values of WLB from 2000 to 2020 with precipitation, temperature, CNLI data, and population density data, respectively, using MATLAB (R2017b) software. The calculation formula is shown in (14).
Where y is the precipitation factor, temperature factor, CNLI factor, population density factor, and are the means of the variables during the research period, RSEIi is the variables of i th month of the year.
3 Results
3.1 Characteristic analysis of ecological quality levels
Figure 3 and Table 2 illustrates the distribution of percent eigenvalue in twenty-one historical images from 2000 to 2020 in the WLB. As seem from Table 3 of the RSEI results in 2000 to 2020, the characteristic percent eigenvalue ranges from 61.80% to 76.00%, showing a fluctuating trend of change. The years 2000, 2006, 2012, and 2018 are low eigenvalue areas, which are influenced by NDVI, LST, Wet, and NDBSI. The results show that the 2000 to 2003, 2006 to 2011, 2012 to 2016 and 2018 to 2020 show a fluctuating upward trend
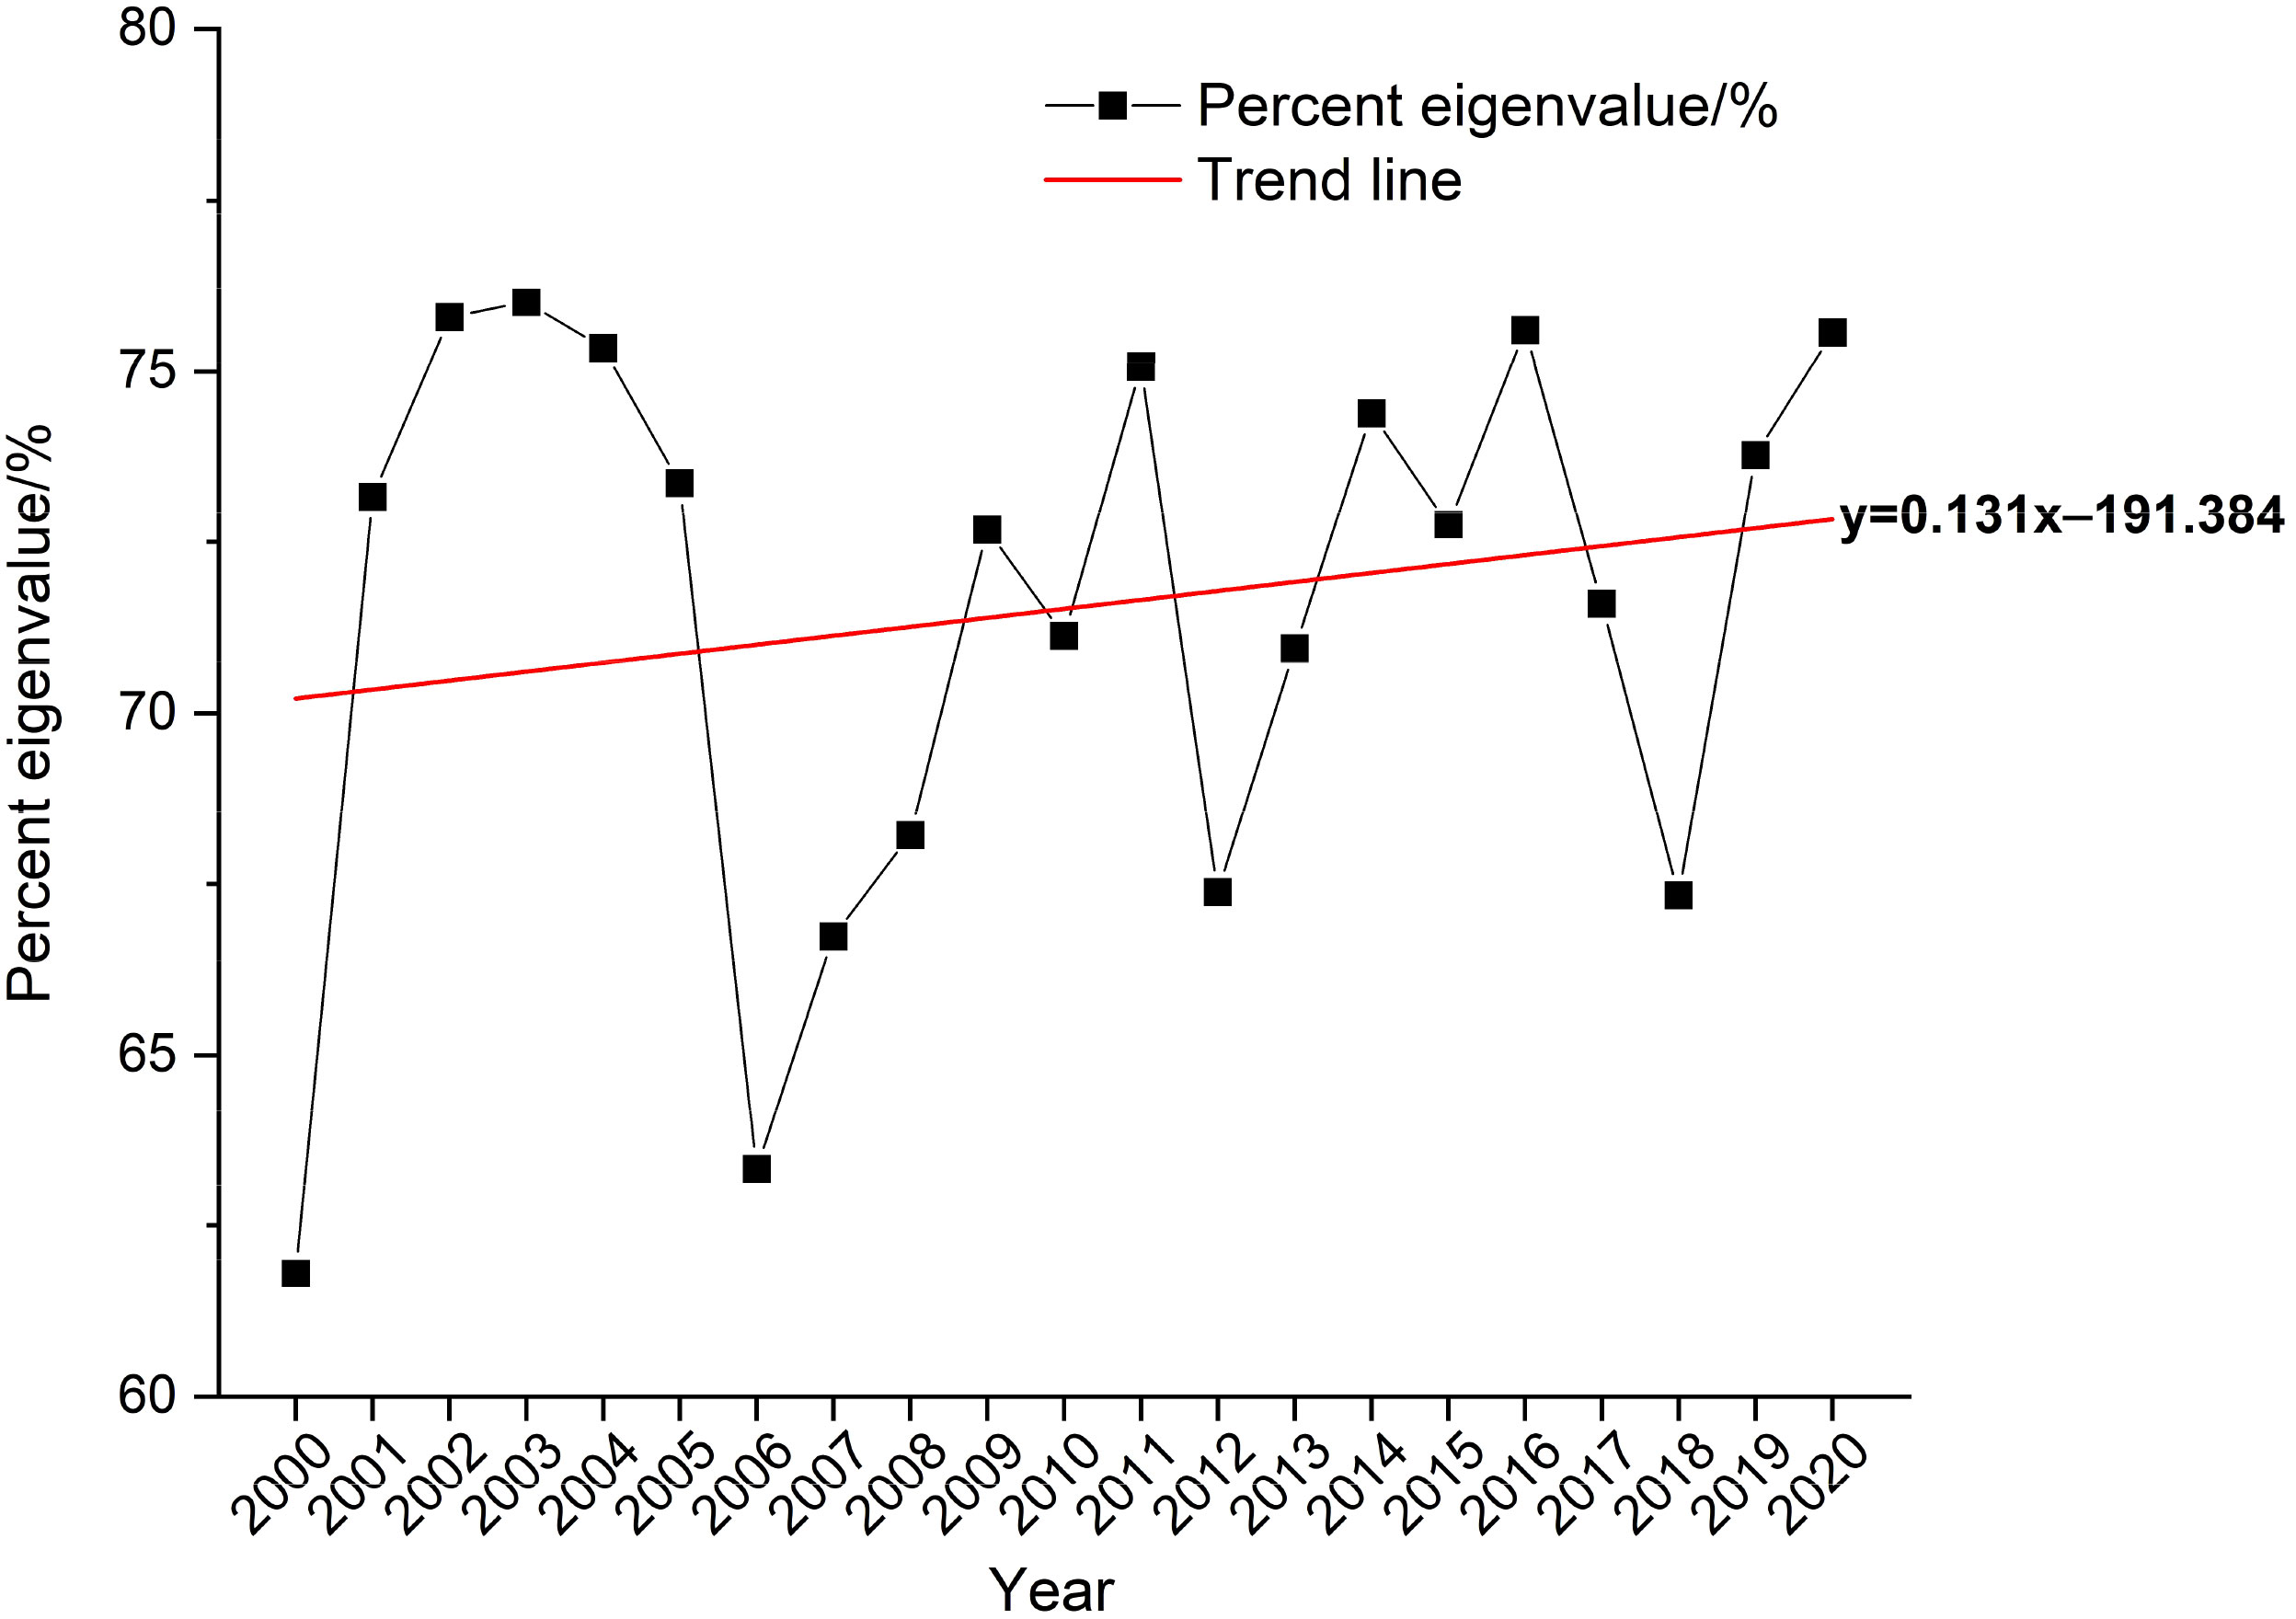
Figure 3 Percent eigenvalue percentage curve for 2000 to 2020.
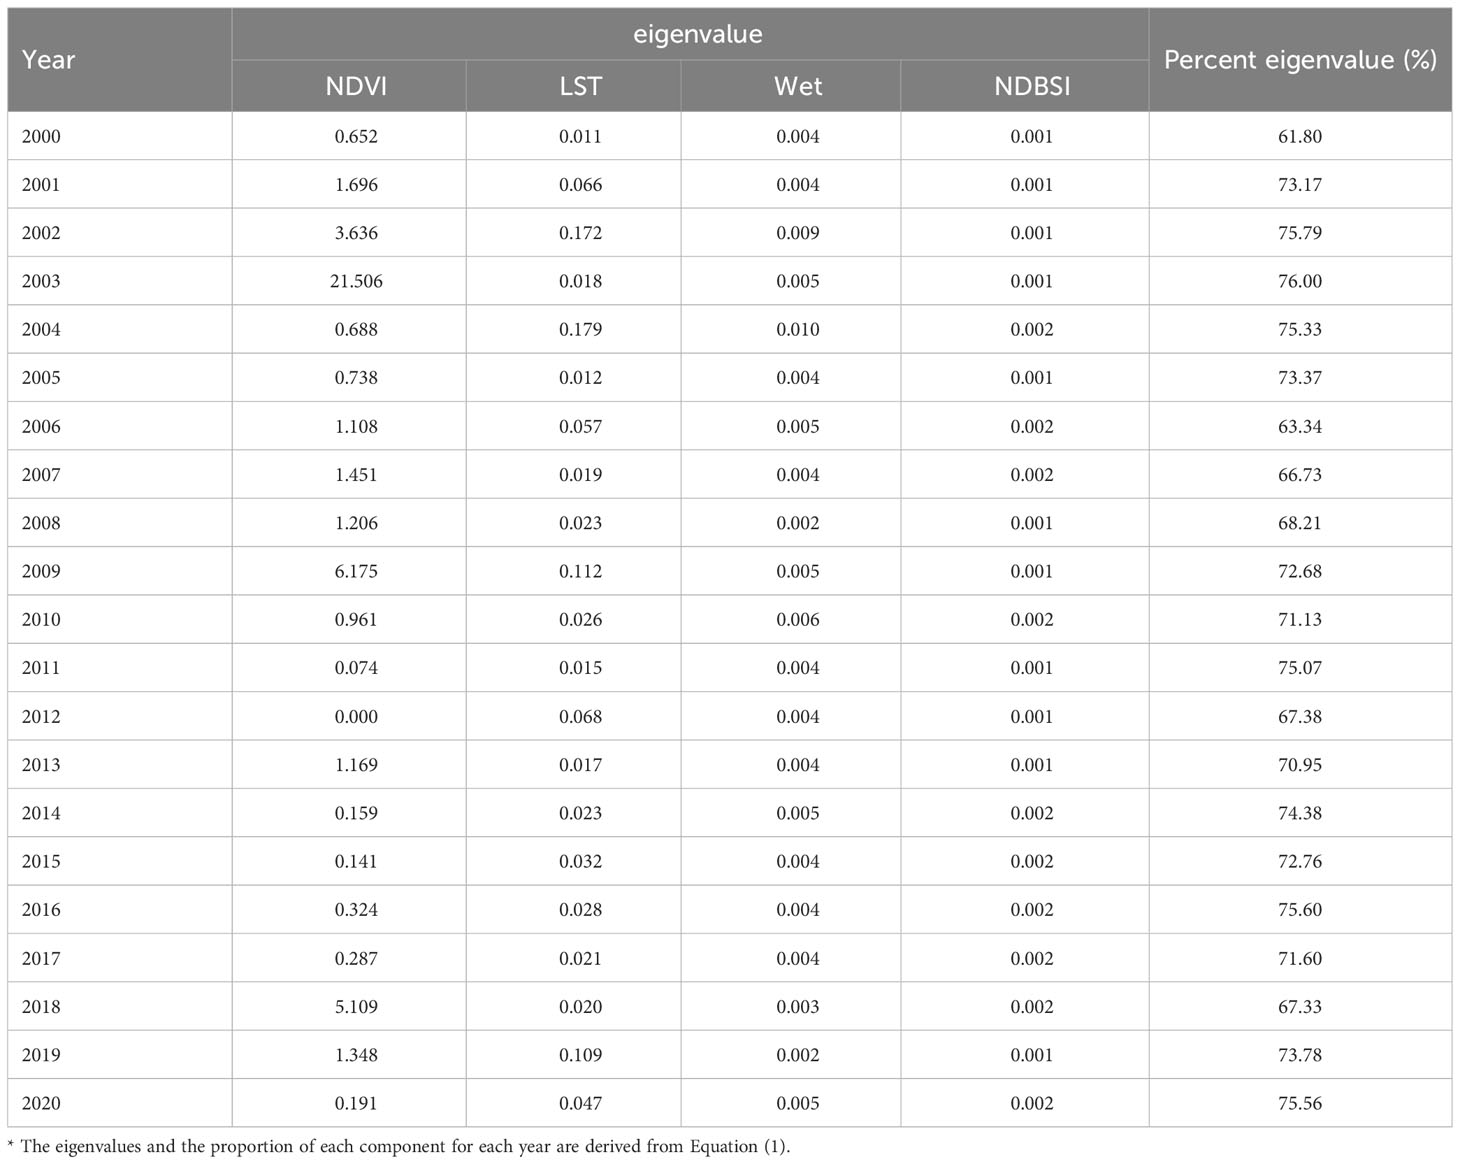
Table 2 PC1 results of RSEI in 2000 to 2020.
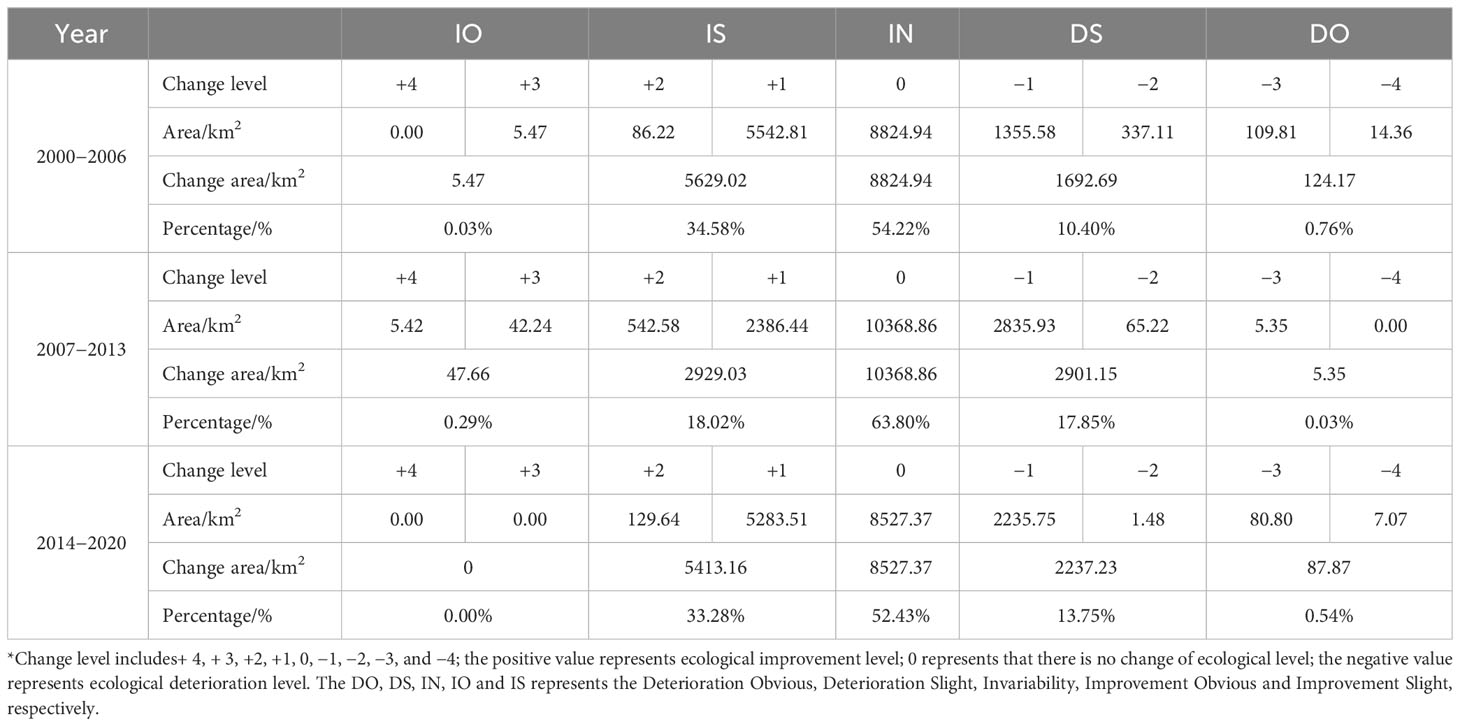
Table 3 Change detection of RSEI level from 2000 to 2020.
We classified the RSEI into five levels: Poor (0–0.2), Fair (0.2–0.4), Moderate (0.4–0.6), Good (0.6–0.8), and Excellent (0.8–1). Figure 4A shows that the overall improvement of eco-environment quality in WLB was not obvious, and it was at fair level during the 2000 to 2006. It mainly distributed in Dengkou, Hanggin, Linhe, Wuyuan and Urad Qianqi. Those areas with a level of moderate or higher were mainly in Urad Qianqi and around the WLB, and most of the improvement areas were concentrated in the northwestern region. The project includes reforestation and grazing ban protection to improve the vegetation growth and reduce soil erosion in the area, which is the main reason for vegetation restoration.
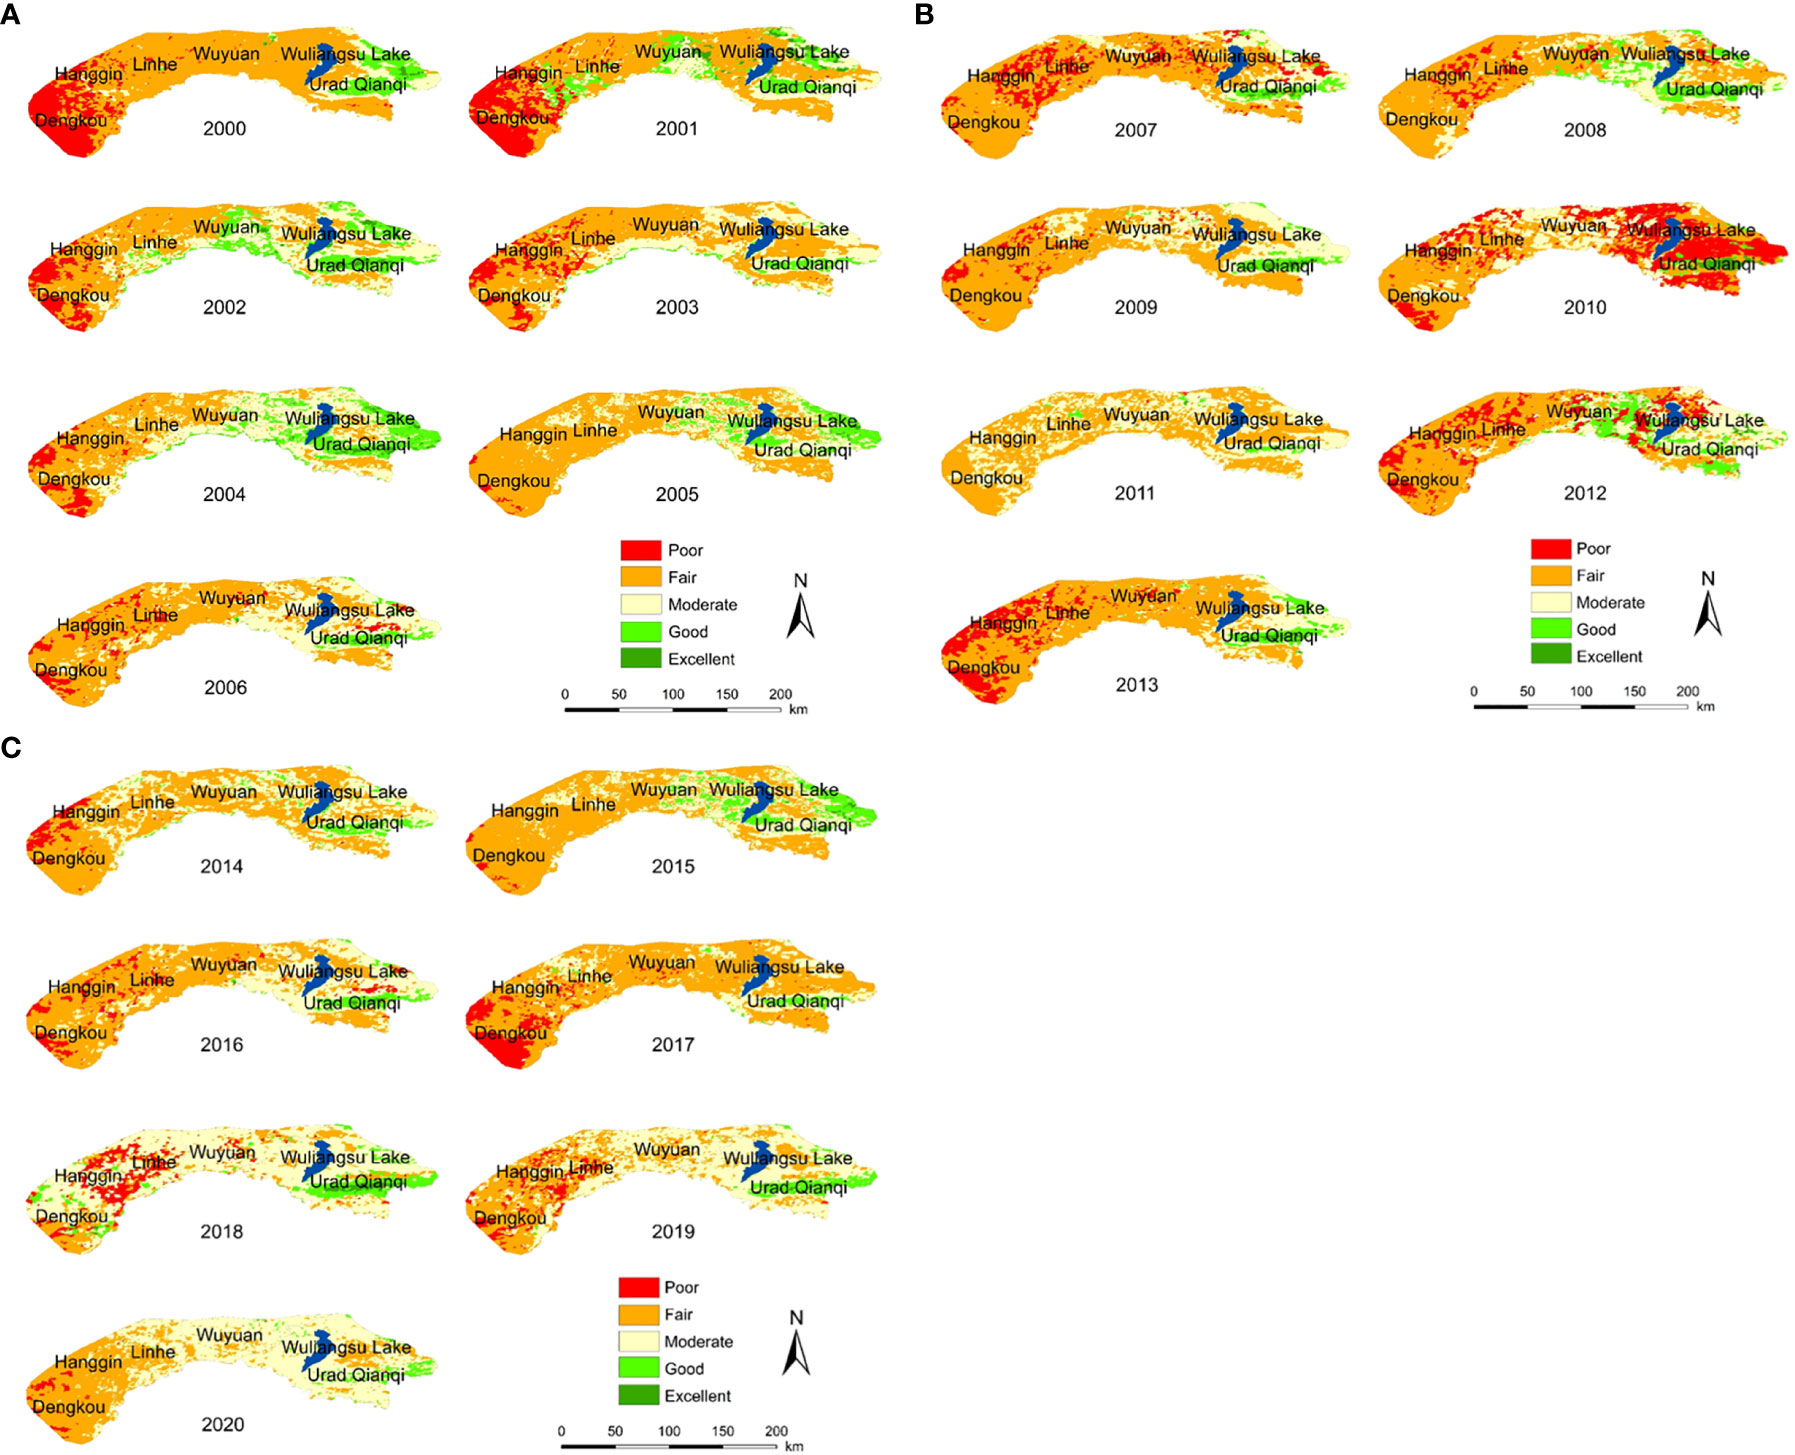
Figure 4 The spatial distribution of RSEI levels in WLB from 2000 to 2020, the spatial distribution of RSEI levels in WLB from 2000 to 2006 (A), the spatial distribution of RSEI levels in WLB from 2007 to 2013 (B), and the spatial distribution of RSEI levels in WLB from 2014 to 2020 (C).
Compared with 2000 to 2006, the most notable feature of the spatial variation of RSEI showed a decreasing trend in the overall ecology, especially in Urad Qianqi in 2010 (Figure 4B). In recent years, the ecological environment had changed unstably, both for policy reasons and human activities. The economy was in a rapid development stage, and all regions took the development of urbanization as the top priority in 2010. In addition, the unreasonable exploitation of the mining area in Urad Qianqi has caused long-term damage to the ecological environment.
Compared with 2007 to 2013, the obvious features of the spatial variation of the RSEI in 2014 to 2020 showed significant improvement (Figure 4C). It was at a poor level from 2014 to 2017, and remained at a moderate level after 2017, mainly in the central region. Since 2018, the Chinese government has taken the ecological civilization construction as a major national strategic policy, and ecological restoration is an important part of ecological construction. The artificial afforestation and other measures in the western mining ecological restoration area have brought a positive impact, which is the main reason for the overall good ecological environment quality in 2020
The percentage of each level shows a fluctuating trend (Figure 5). From 2000 to 2010, the poor levels show a fluctuate upward, reaching a maximum of 31.79% in 2010 and a minimum of 0.12% in 2011, with a fluctuating decreasing trend from 2012 to 2020. The fair levels increased from 2000 to 2018, reaching a maximum of 66.66% in 2017 and a minimum of 17.18% in 2018, with a gradual decrease from 2019 to 2020. The moderate level in general shows a fluctuating upward trend, with a minimum proportion of 11.10% in 2000 and a maximum proportion of 52.57% in 2020. The good levels increase from 2000 to 2004, reaching a maximum of 16.00% in 2004, decreasing from 2005 to 2011, with a minimum of 1.36% in 2010, and then gradually increasing from 2012 to 2020. The excellent level reached a maximum of 2.91% in 2001 and decreased from 2001 to 2017, with a statistical percentage of 0 in 2017. The mine was over-exploited and the ecological environment’s preservation received little attention before 2010. Therefore, the local government started working on a large number of ecological restoration projects such as afforestation in 2017. Then increase from 2018 to 2020.
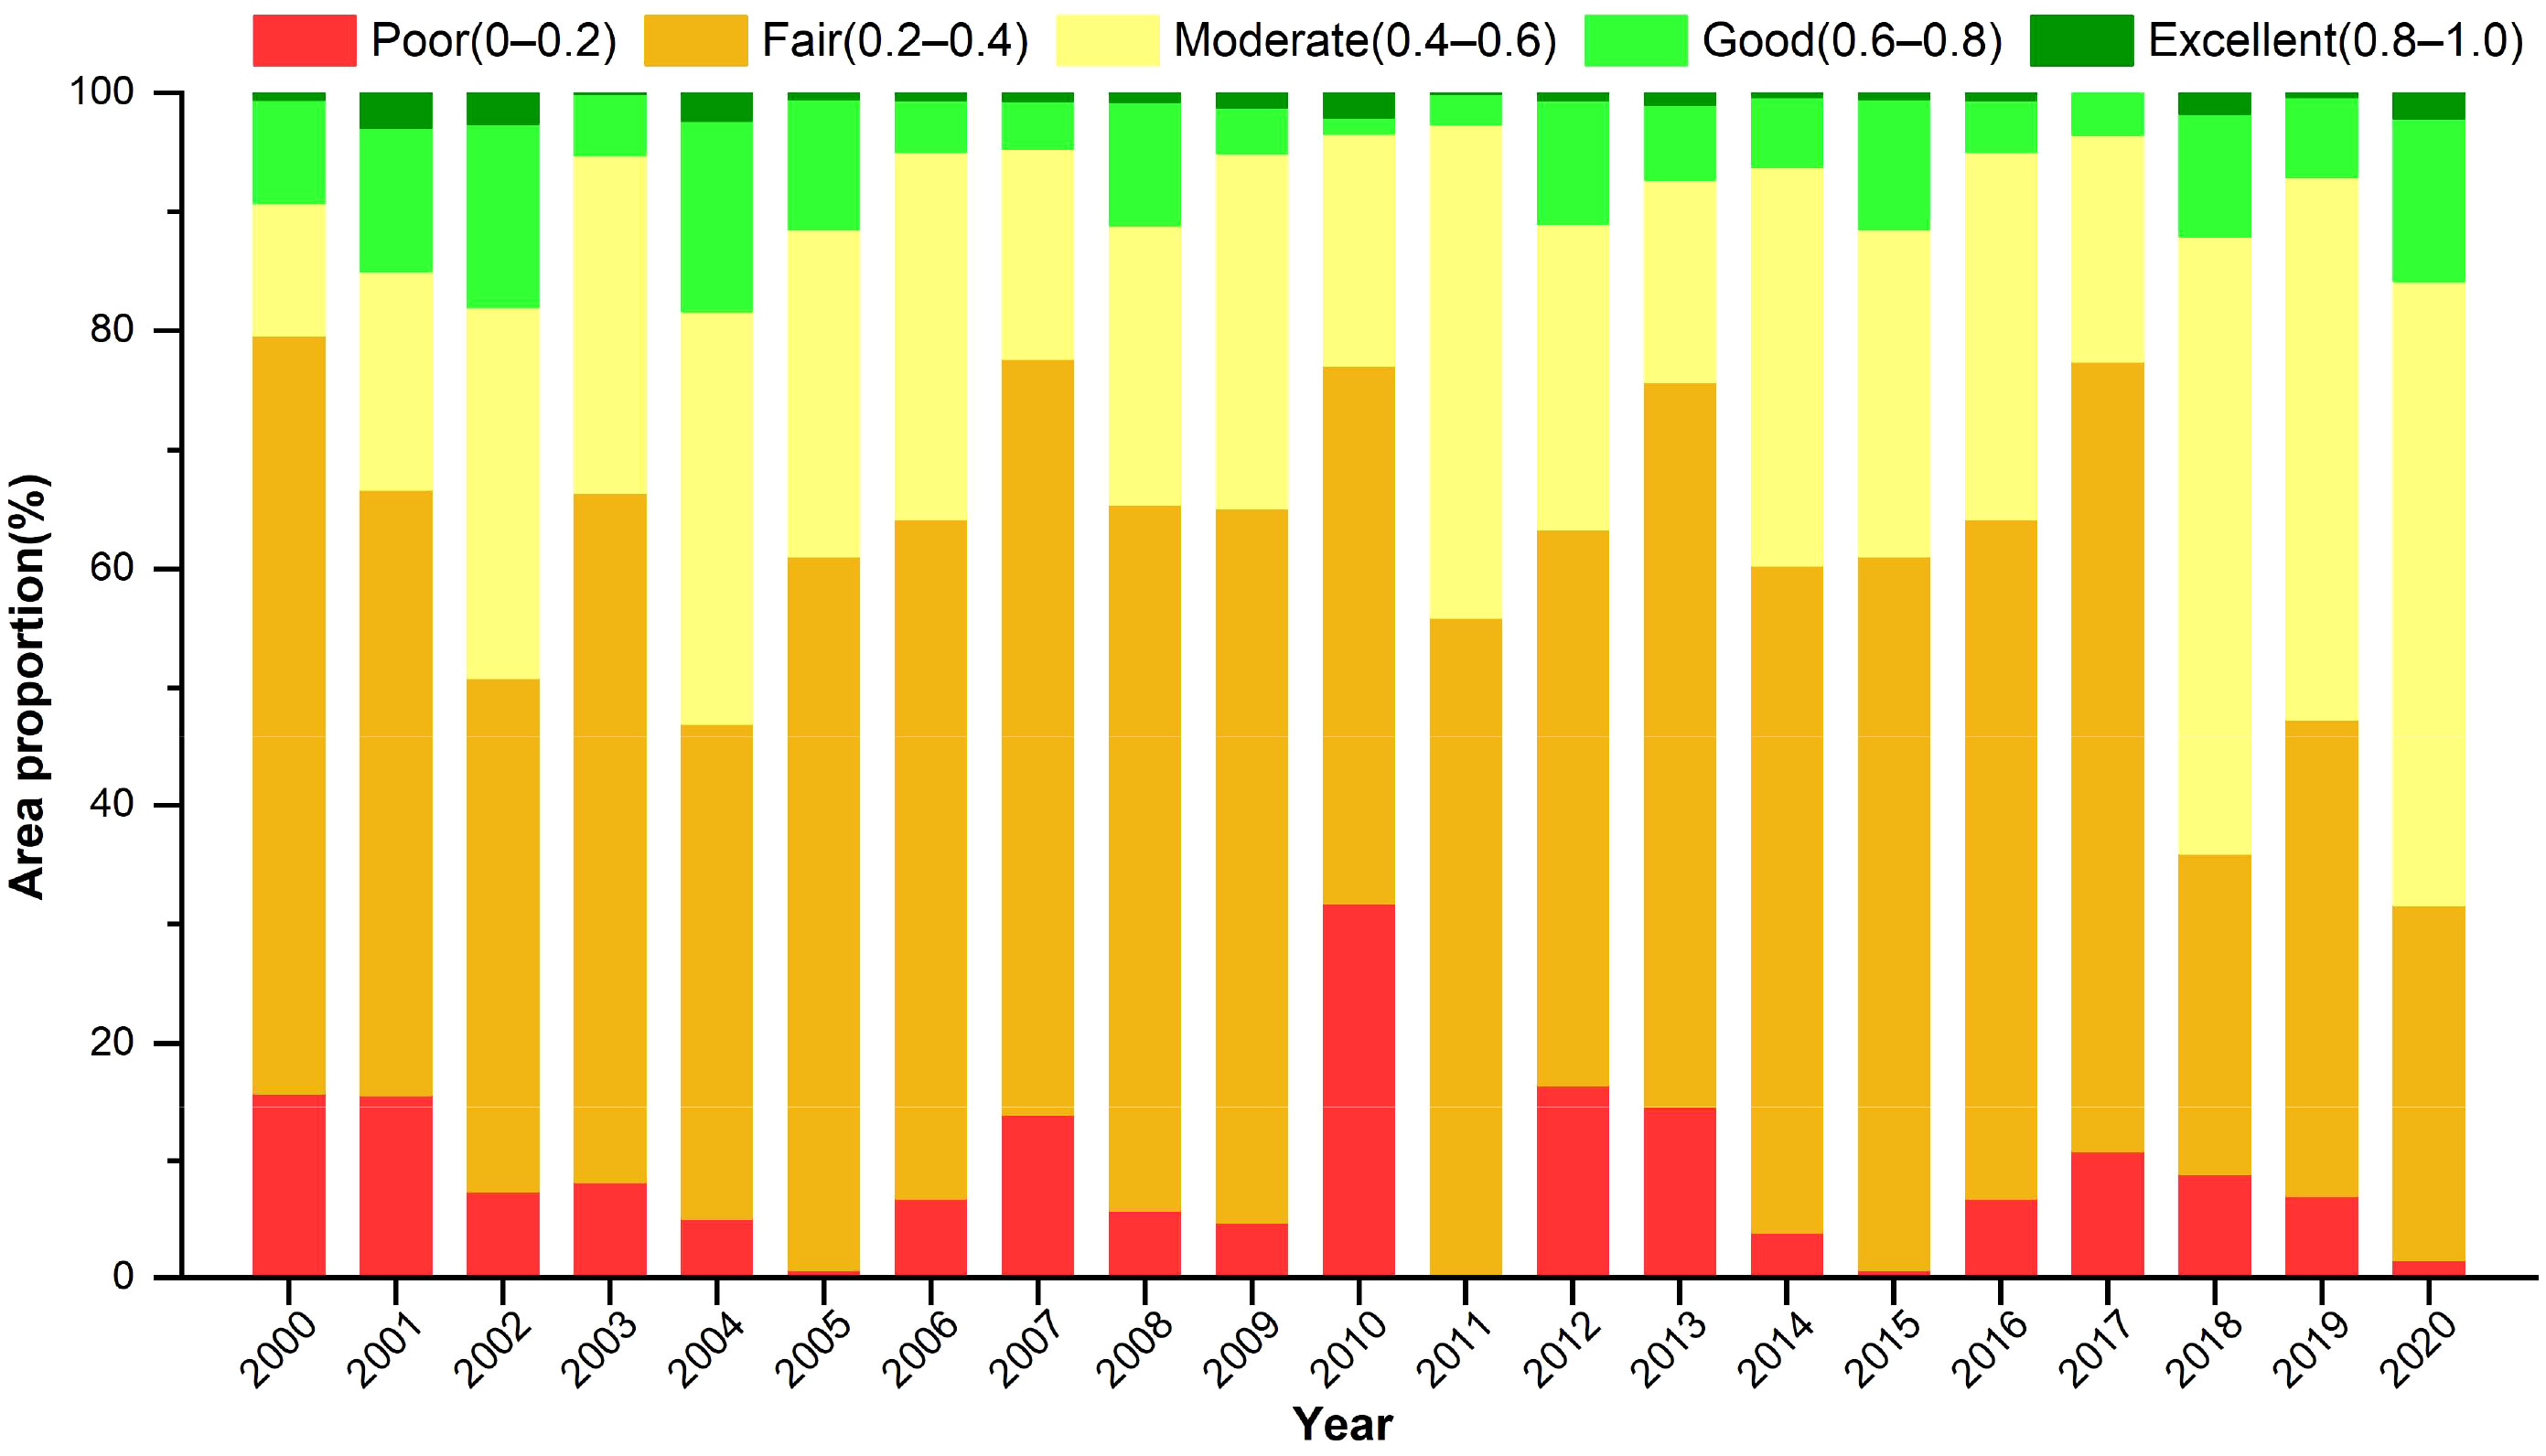
Figure 5 Area distribution of RSEI level in the WLB from 2000 to 2020.
3.2 Spatial distribution and trend variation of RSEI
Figures 6, 7 indicates that the spatial distribution of annual RSEI in the three periods of 2000 to 2006, 2007 to 2013 and 2014 to 2020 showed an increasing trend from west to east. The RSEI below 0.3 covered Dengkou, Hanggin and Linhe in the southeast, and Wuyuan. The RSEI above 0.6 mainly increased from the middle to the northwest of Urad Qianqi, located in the WLB natural reserve and ecological restoration project area, which means that the ecological restoration measures in WLB improved the ecological quality during the last 20 years.
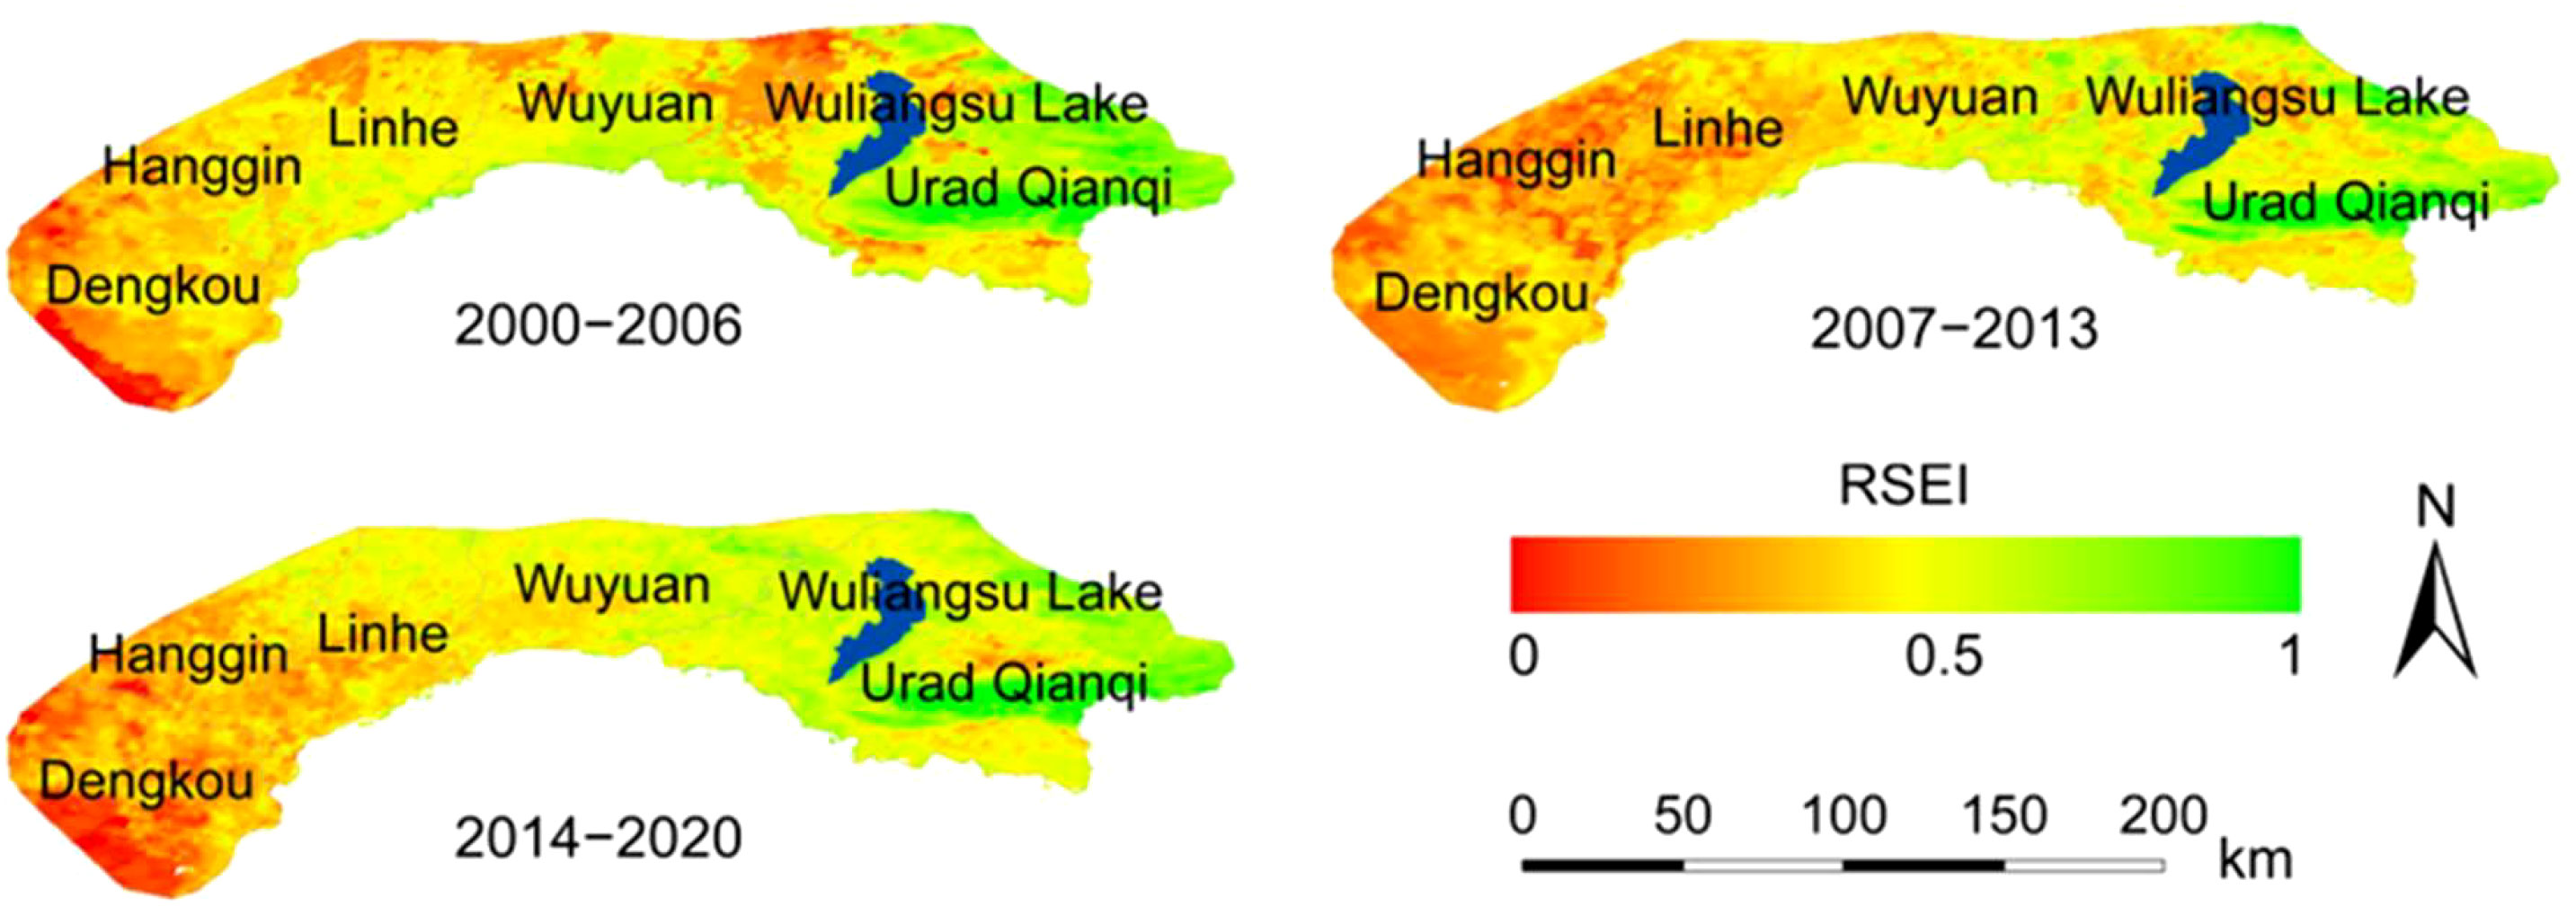
Figure 6 The spatial distribution of annual RSEI values in the WLB from 2000 to 2006, 2007 to 2013 and 2014 to 2020.
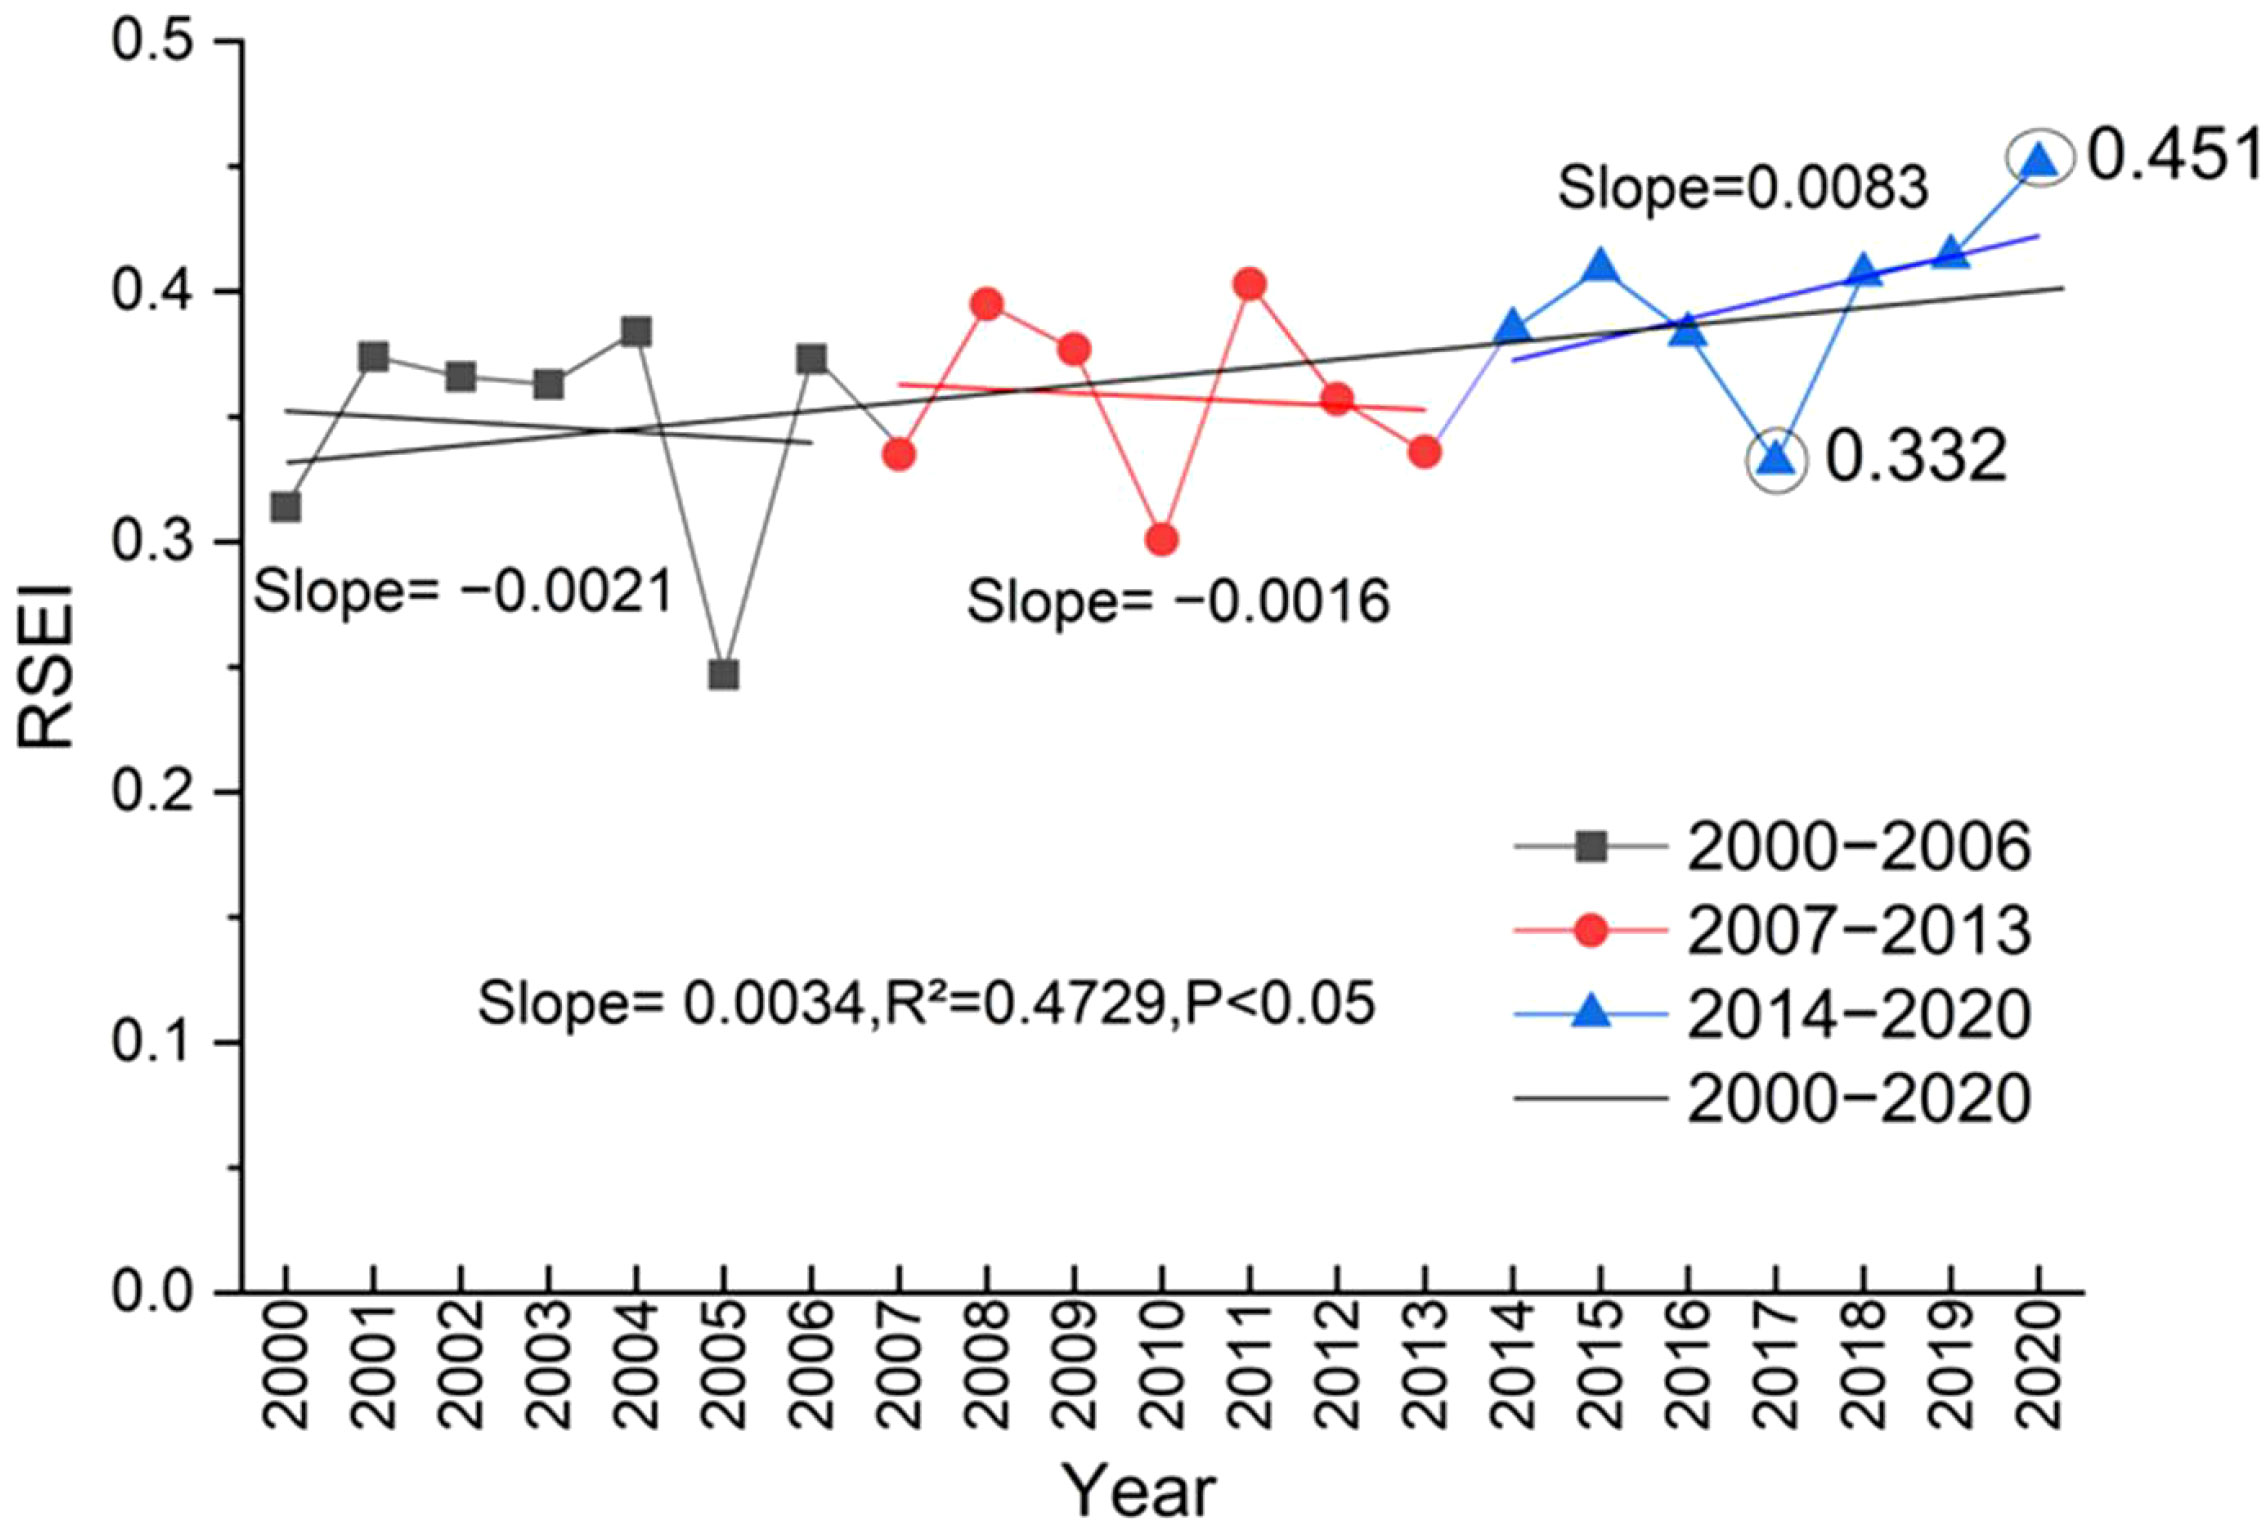
Figure 7 The trends in the RSEI values over the WLB from 2000 to 2006, 2007 to 2013 and 2014 to 2020.
The trend curves of 2000 to 2006, 2007 to 2013 and 2014 to 2020 and the spatial distribution of the trends were obtained by using the time trend analysis. The trends of RSEI in the WLB from 2000 to 2020 shows a fluctuating upward trend. The annual RSEI over the whole region has increased by 0.0034 year−1 in the last 21 years. The RSEI of the WLB decreased by −0.0021 year−1 and −0.0016 year−1 respectively in 2000 to 2006 and 2007 to 2013. Besides, The RSEI of the WLB shows an increasing trend at 0.0083 year−1 from 2014 to 2020. Compared with 2000 to 2006 and 2007 to 2013, the rising trend is more obvious in 2014 to 2020.
The annual RSEI values declined from 2007 to 2013, as shown in Figure 8. Compared with 2007 to 2013, the most distinctive of the annual dynamics of RSEI in 2000 to 2006 were influenced by the “Grain to Green” project. Compared with 2000 to 2006 and 2007 to 2013, the annual dynamics of the RSEI in 2014 to 2020 were influenced by the ecological restoration project, such as artificial afforestation and fly-sown afforestation, and these measures brought a positive impact on vegetation growth in the WLB. The positive change rate of RSEI value in these areas is more than 0.05 year−1, and the negative change rate is less than 0.01 year−1. RSEI values increased in most of the Northwest region from 2000 to 2006, decreased partially in the Dengkou region from 2007 to 2013.
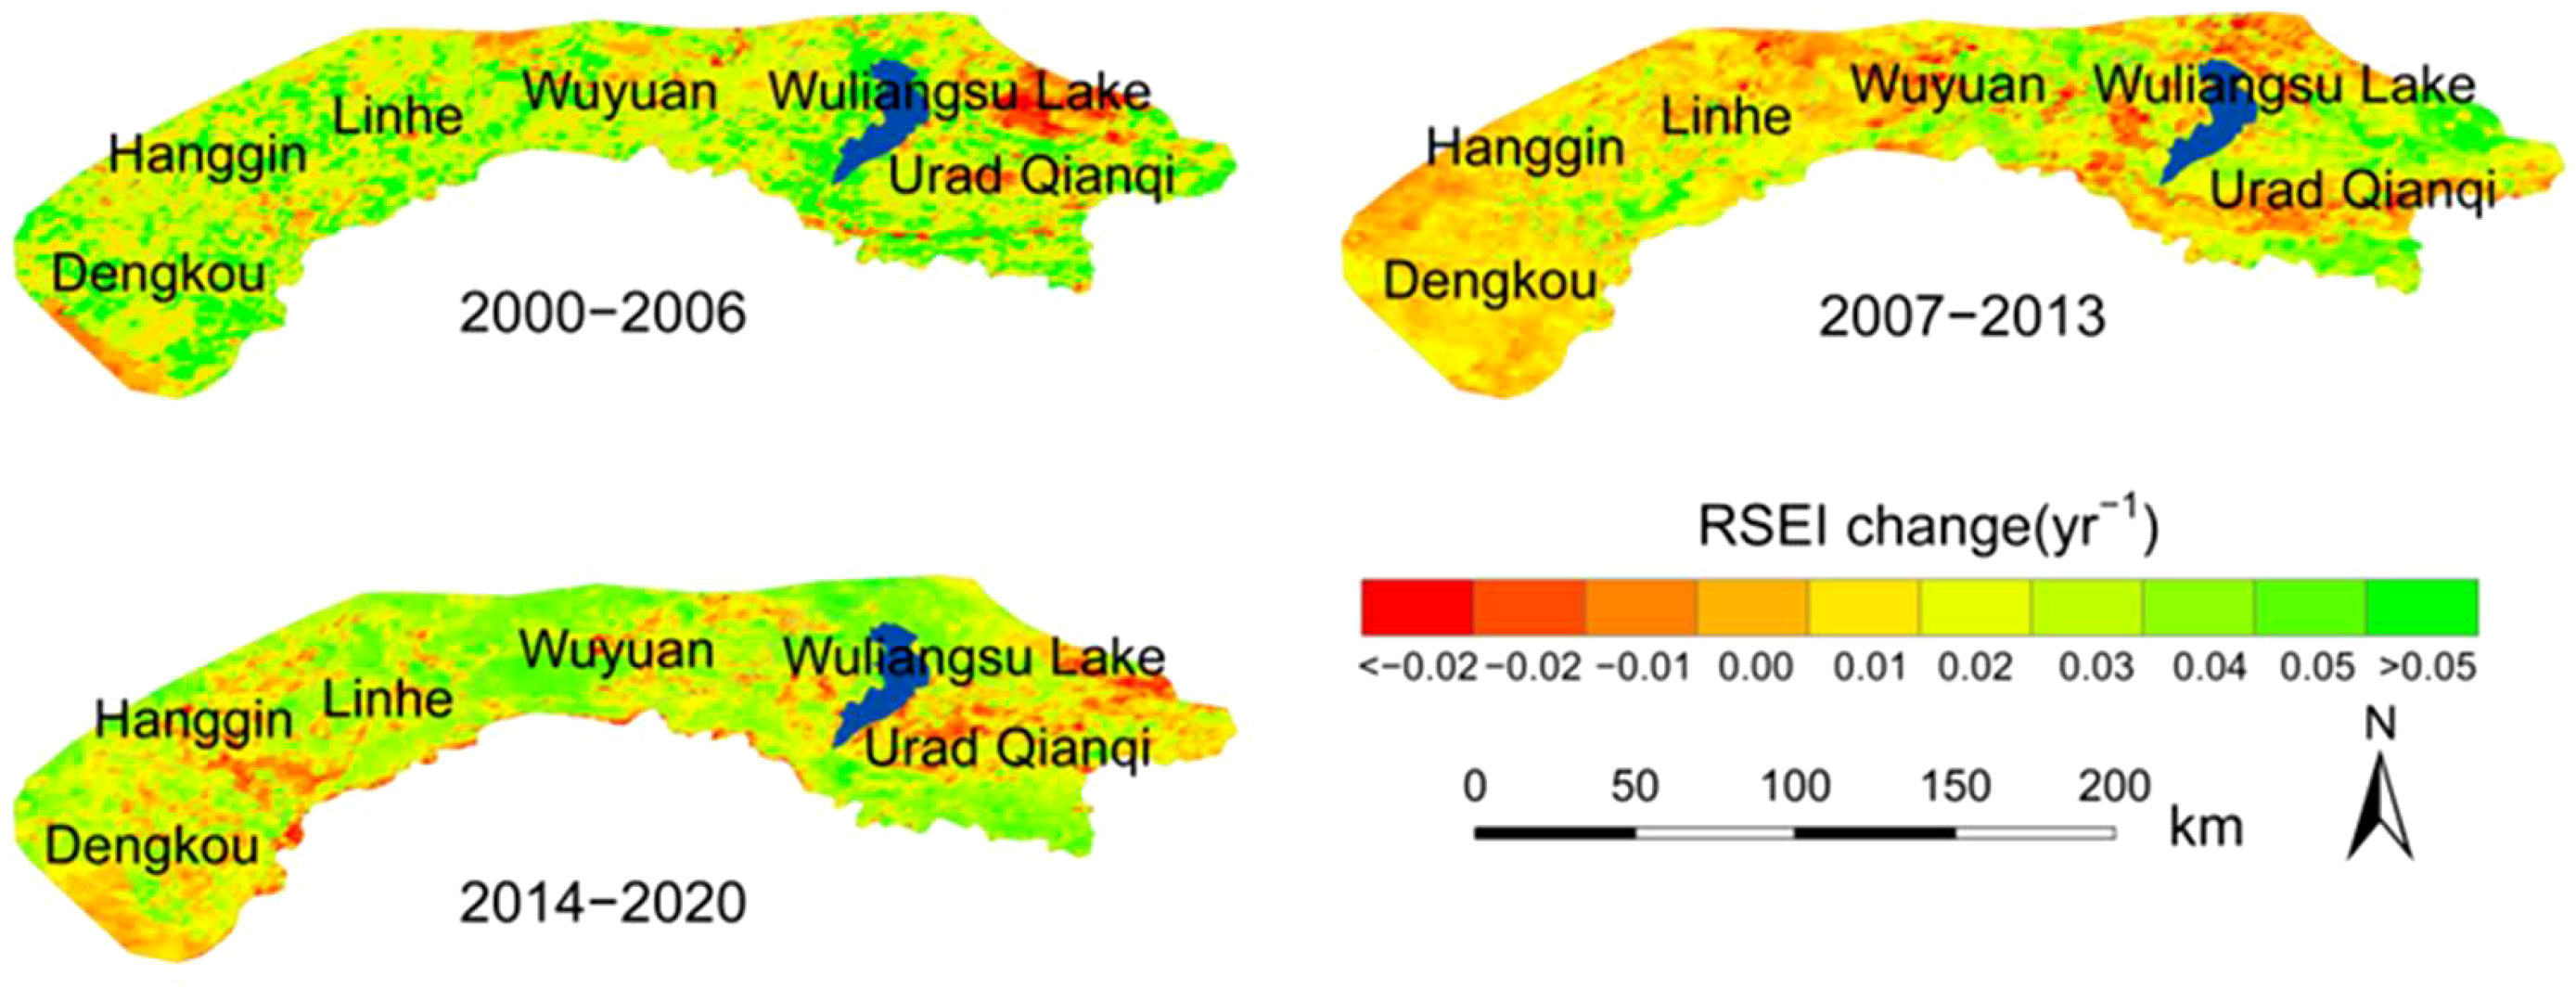
Figure 8 The spatial distribution of RSEI trends in the WLB from 2000 to 2006, 2007 to 2013 and 2014 to 2020.
3.3 Dynamic changes in the eco-environment quality
The results of WLB 2000 to 2006, 2007 to 2013 and 2014 to 2020 were obtained by dynamic change subtraction method (Table 3, Figure 9). The levels of Invariability (IN) change for the three periods were 54.22%, 63.80% and 52.43%, respectively. It is mainly in the central region, indicating that the ecological environment quality remains relatively stable in most regions. The proportions of Improvement Obvious (IO) and Deterioration Obvious (DO) in the ecological environment quality change levels were both less than 1%, which indicates that there were almost no areas significant changes in the WLB from 2000 to 2006. The proportion of Improvement Slight (IS) in the three periods from high to low was 34.58% (2000 to 2006), 33.28% (2014 to 2020) and 18.02% (2007 to 2013), of which the overall improvement was obvious in 2000 to 2006 and 2014 to 2020, and it shifted from the central to the eastern. The proportion of Deterioration Slight (DS) was 10.40% (2000 to 2006), 17.85% (2007 to 2013), and 13.75% (2014 to 2020) in the three periods, showing a gradually decreasing from the northwest to the southeast. The Dengkou showed an improvement trend during the period 2000 to 2006, which benefited from the implementation of vegetation restoration project called “Grain to Green”.
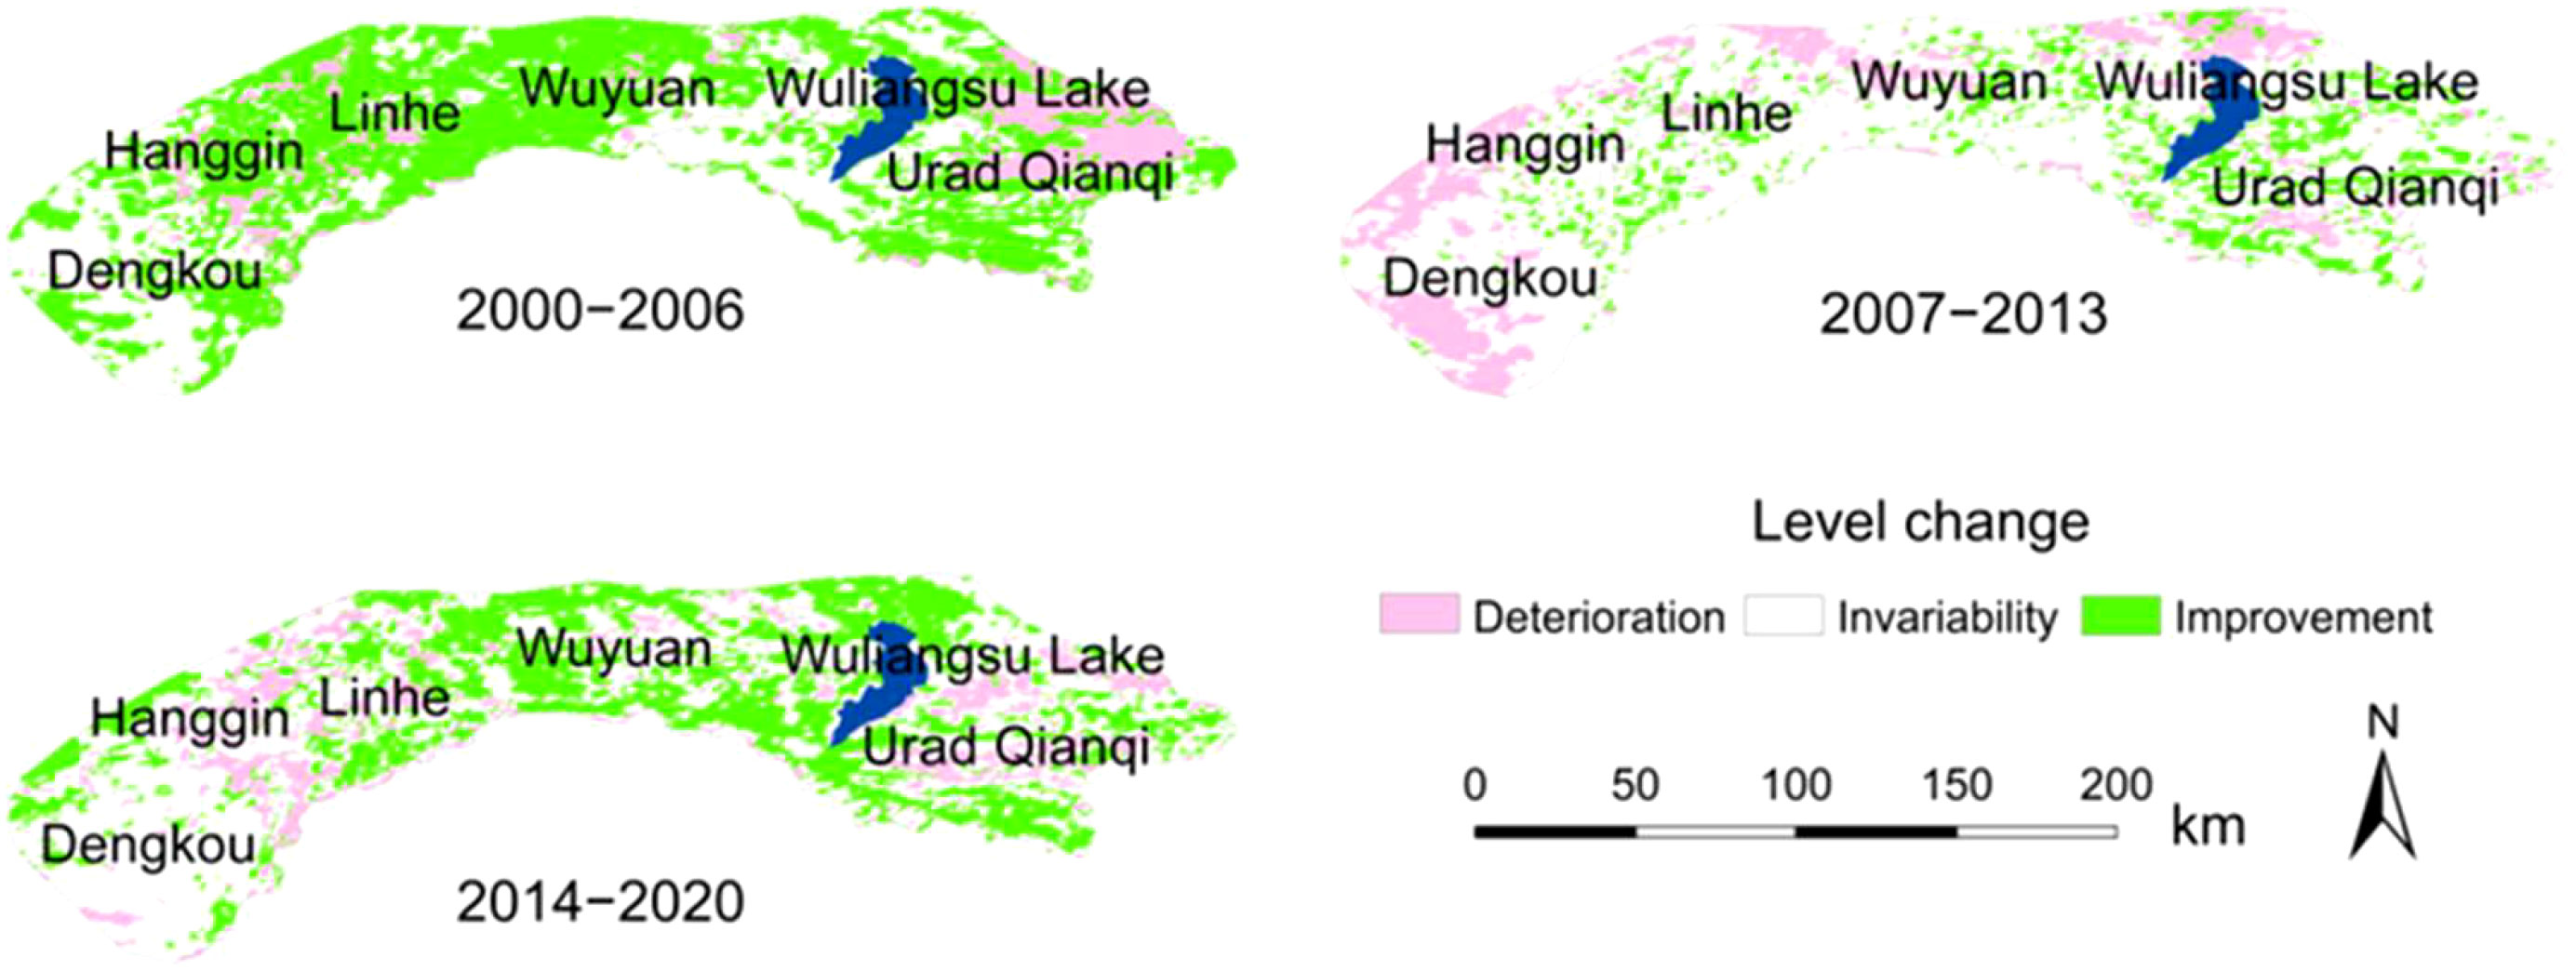
Figure 9 The level changes of RSEI during 2000 to 2006, 2007 to 2013, and 2014 to 2020 (the positive level is unified as Improvement, 0 is level Invariability, the negative level is unified as Deterioration).
3.4 Sustainable analysis of RSEI
The Hurst index is used to reflect the correlation intensity of sequence autocorrelation and sequence development. The results of sustainability trend of RSEI change were superimposed with Hurst index and change trend (Figure 10, Table 4). It is divided into six levels according to the results, which were Future Improvement Trend (FIT), Uncertain Future Trend (UFT), Future Degradation Trend (FDT), Persistent Degeneration (PD), Persistent Invariance (PI) and Continuous Improvement (CI).
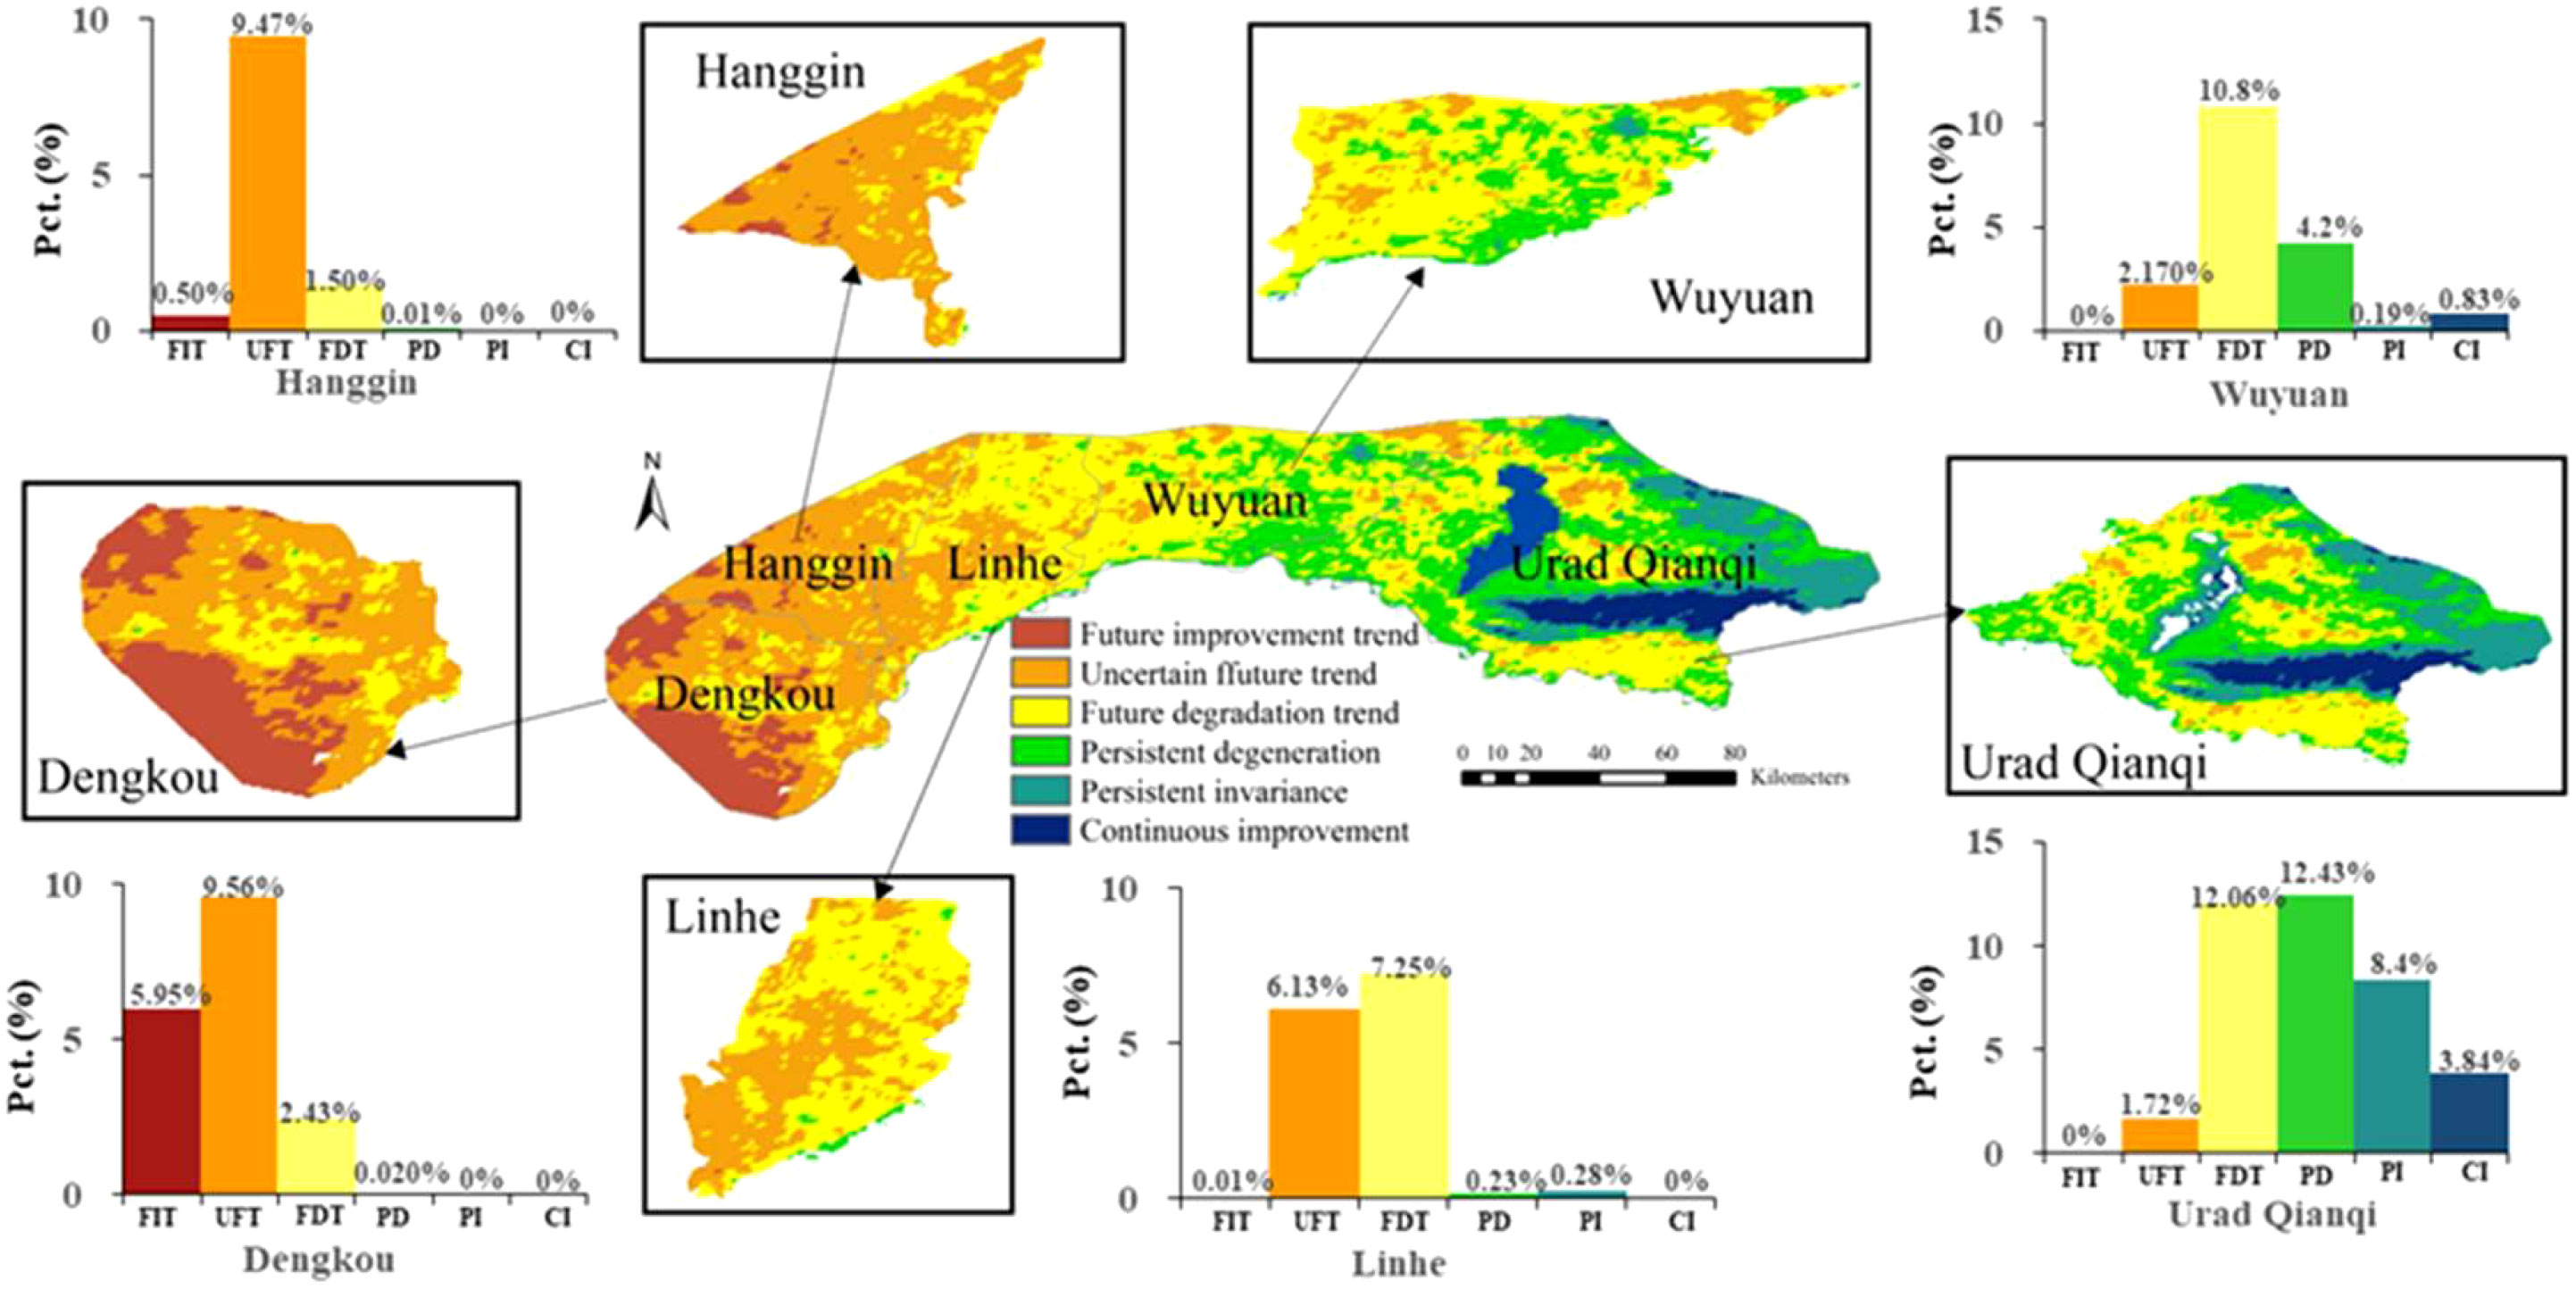
Figure 10 Future trend of RSEI in different regions of WLB.
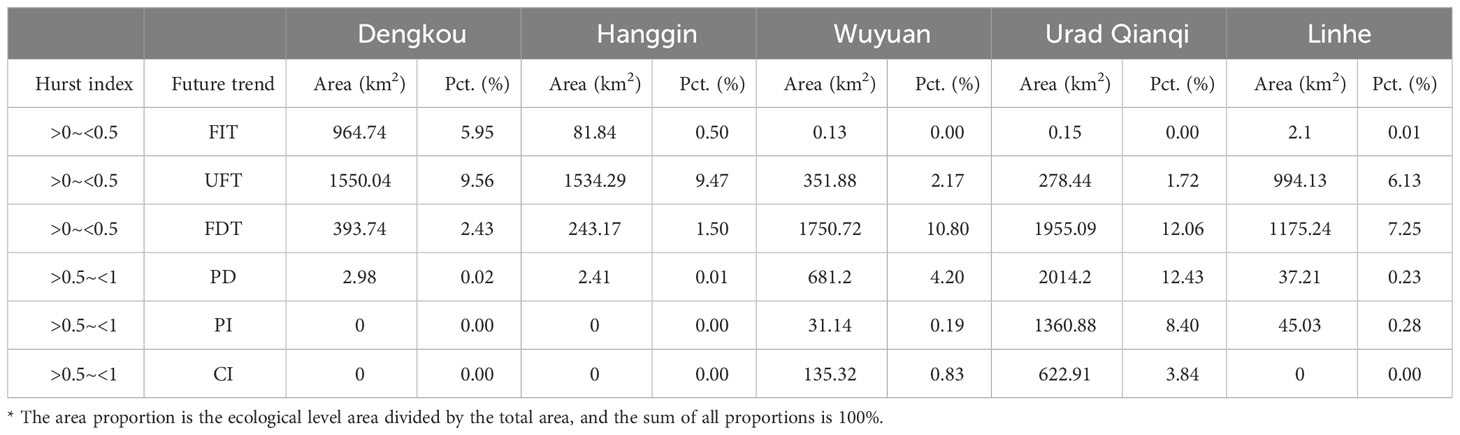
Table 4 Superposition analysis of change and sustainability in WLB.
The FIT area mainly distributed in Dengkou and Hanggin, accounting for 33.14% and 4.40% respectively. There was a large area of desert in Dengkou area and was the key county of desertification control project. According to the report from the National Forest and Grass Administration, the desert areas were treated with 47983.34km2, and grass squares carried out an area of 20400.67km2 in Inner Mongolia, China. The UFT decreased from the northwest to southeast, followed by Hanggin (9.56%), Dengkou (9.47%), Linhe (6.13%), and Urad Qianqi (1.72%). The FDT showed the distribution characteristics of “high in the West and low in the East”, with Wuyuan accounting for 10.80%, Linhe 7.26%, Urad Qianqi 12.06%, and the proportion of Dengkou and Hanggin not exceeding 10%, which is mainly due to the scarcity of vegetation. The PD level mainly distributed in the Urad Qianqi and Wuyuan areas, accounting for 12.43% and 4.20% respectively, and the rest of the areas are less than 5%, due to urban expansion and frequent human activities. CI areas mainly distributed in the Urad Qianqi and Wuyuan, accounting for 3.84% and 0.83% respectively, with 0% in the rest of the region. Overall, the RSEI in the western section of the WLB shows a trend of improvement in the future, while the RSEI in the eastern area shows degradation and uncertainty in the future, which requires sustained attention.
3.5 The relationships between RSEI dynamics and climatic factors
The WLB is located in an ecologically fragile area in northwestern China, with an annual average temperature of close to 7.3° and an annual precipitation of close to 300mm. We used raster data of precipitation and temperature from 2000 to 2020 to generate annual average precipitation and temperature data using the image-by-image method (Figures 11A, B). The spatial distribution characteristics of precipitation and temperature gradually increase from west to east, and the main reason is that the region has a large desert area and dry temperatures. The Urad Qianqi area belongs to the ecological restoration area of the mining area. The region had implemented ecological management measures like afforestation since China began ecological management and restoration.
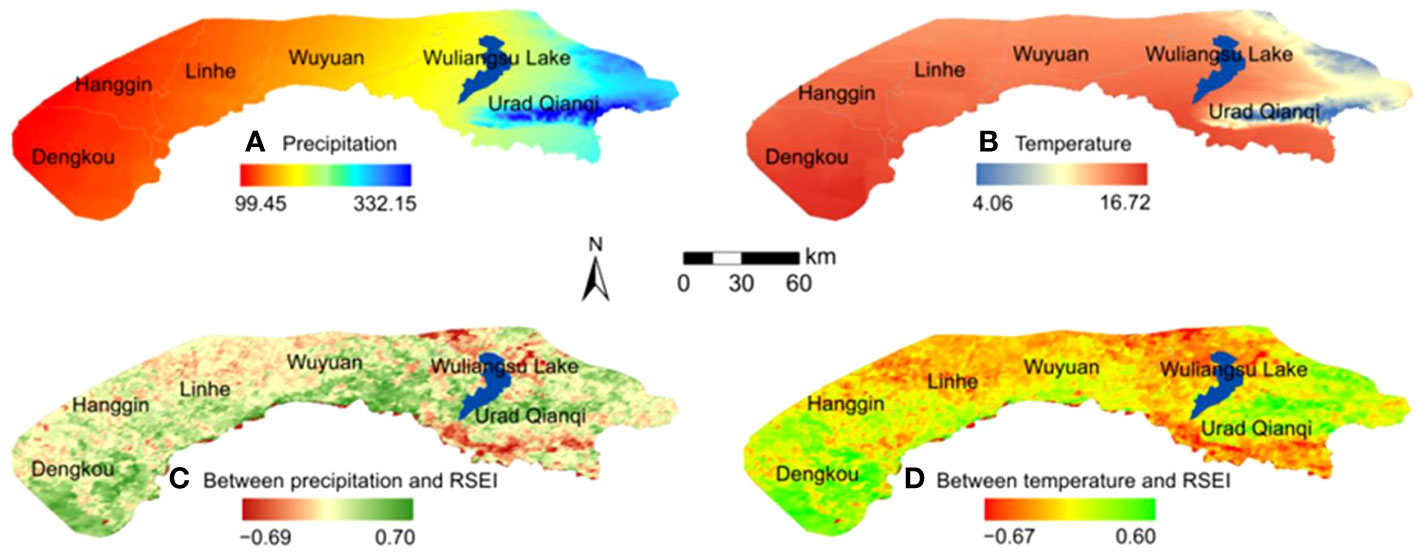
Figure 11 The spatial distributions of precipitation (A), temperature (B), and spatial distribution of correlation coefficients between RSEI and precipitation (C) and temperature (D) in the 2000 to 2020.
We used raster data of precipitation and temperature from 2000 to 2020 and RSEI data for correlation analysis. As shown in Figure 11C, the negative correlation area between RSEI and precipitation is mainly in the northeastern around the WLB, and the positive correlation area is distributed in the central to western region. Particularly, the positive correlation in the Dengkou area reaches 0.70, indicating that precipitation is one of the important factors limiting the growth of vegetation in this area. As shown in Figure 11D, the positive correlation areas between RSEI and temperature are distributed in the western and eastern regions, and the negative correlation regions are distributed in the southeastern and central regions of Urad Qianqi. The greater the extent of urbanization in the central region, the more obvious the heat island effect, that results in higher land surface temperatures, thereby inhibiting vegetation growth and ecological restoration.
3.6 The relationships between RSEI dynamics and anthropogenic factors
3.6.1 Analysis of residual results
Figure 12 shows the positive values represent a continued increase in the impact of human activities, while negative values represent a decrease in the impact of human activities. The WLB area showed an increasing trend with 0.029/a, indicating that human activities continued to strengthen. The north of Dengkou is significantly affected by human activities. The decrease area is located near the north of Linhe, Wuyuan and around the watershed, and the annual rate of change was as low as −0.039/a. It shows that the variation of RSEI residual is spatially different.

Figure 12 Spatial distribution of trend changes in residual analysis results in the WLB.
3.6.2 Correlation of RSEI and population density
Figure 13 showed the trend of population density changes and the correlation between population density and RSEI, respectively. As shown in Figure 13A, the impact trend of population density is increasing at a rate of 191.01 year−1 which shows human activities is continuing to intensify. The regions with more pronounced changes, which locates in urban economic development areas. As shown in Figure 13B, the positive value mainly distributed around the WLB. The negative value regions mainly located in the Dengkou, Linhe and around the Urad Qianqi, with a scattered distribution trend from northwest to southeast. The human activities to RSEI in Dengkou area are positive, but some areas are negative. The ecology of the Dengkou area has been significantly improved through human activities.
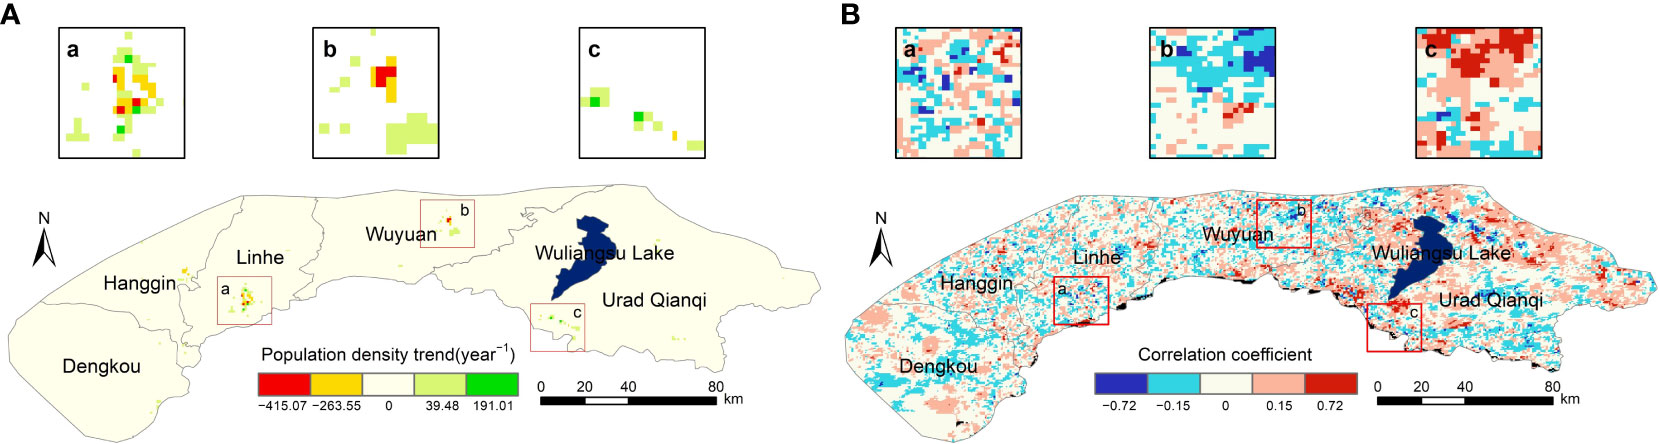
Figure 13 The Spatial distribution of population density trends in the WLB from 2000 to 2020 (A), and the spatial correlation between population density and RSEI from 2000 to 2020 (B).
As shown in Figure 14, we also complement 21 years of changes in farmland, forest, and grassland to deeply explore the impact of human activities on regional RSEI. The farmland peaked in 2018 and then gradually decreased, while grassland, in contrast to farmland, fell to a trough in 2018 and then gradually increased. The increasing trend in population density indicates the force is positive, and the decreasing trend indicates that the force is negative.
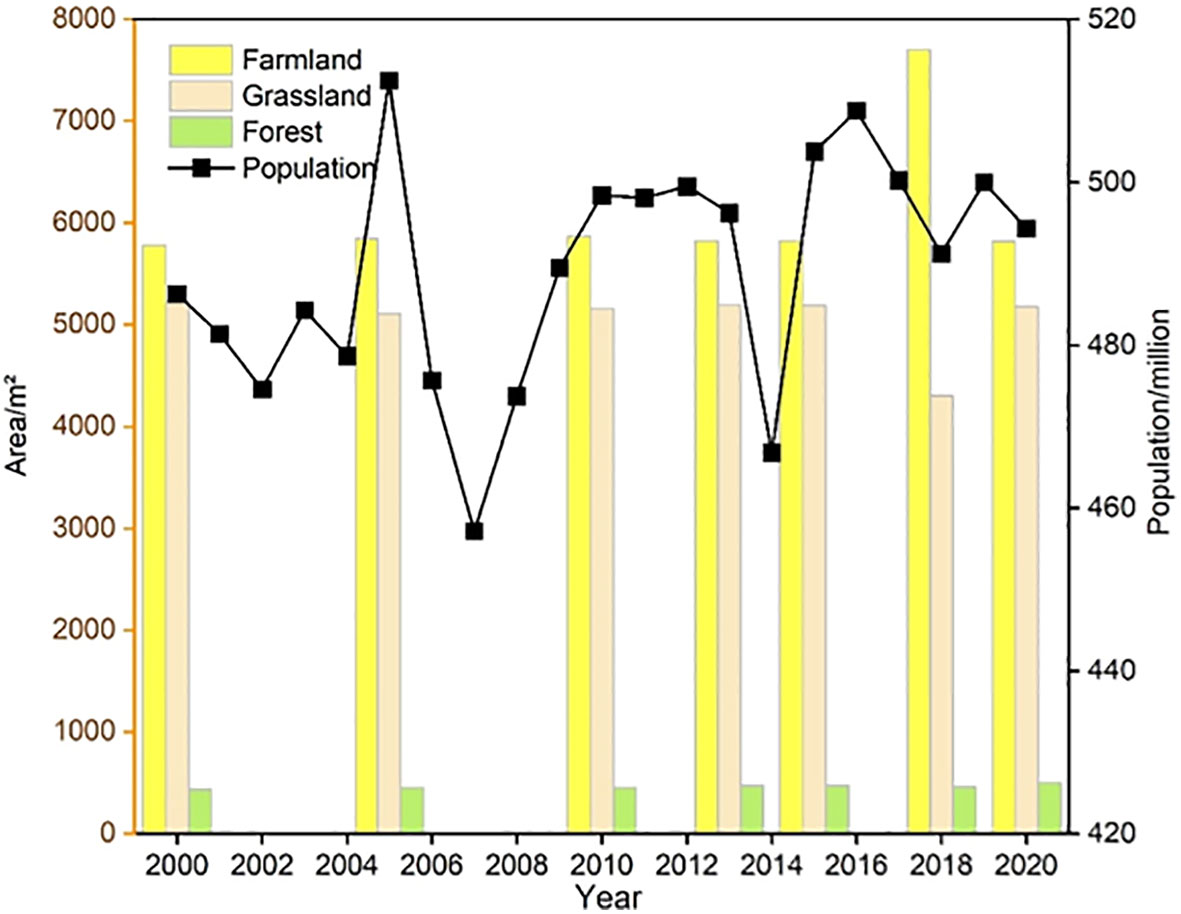
Figure 14 Dynamics of the different land covers and population in WLB.
3.6.3 Correlation of RSEI and CNLI data
The urbanization can affect the impervious surface construction which can influence the radiation of surface temperature. The CNLI can monitor the relationship between urbanization and the regional environment conditions. The CNLI trend from 2000 to 2020 is shown in Figure 15A. The average annual rate of change was 0.15 year−1, and the areas distributed in the central metropolitan areas of Linhe and Hanggin, Wuyuan and Urad Qianqi.
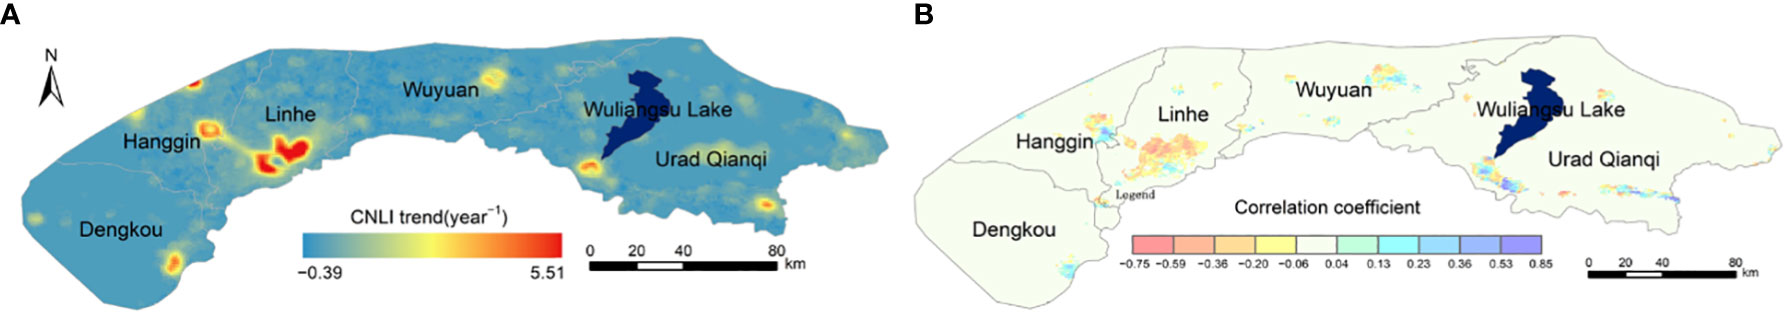
Figure 15 Spatial distribution of nighttime lighting data trends in the WLB from 2000 to 2020 (A), and the spatial correlation between CNLI and RSEI from 2000 to 2020 in the WLB (B).
As shown in Figure 15B, the correlation coefficients between CNLI data and WLB is more than 0.42, which is mainly in the Urad Qianqi, Linhe, Wuyuan, and the other value was 0. The positive values in all these areas indicate that CNLI is an unnatural factor affecting RSEI changes in the Dengkou region. The negative value is distributed in the center Linhe, which is an economic development area that focuses on urbanization progress and neglects the ecological environment protection. This was significantly and positively correlation with the influence of human activities. The anthropogenic drivers of RSEI change in the region include ecological restoration projects on the improvement of vegetation cover. For example, forest restoration, natural forest protection and other ecological protection projects have contributed to the improvement of ecological habitat.
3.6.4 Impacts of human activities on land use
From 2000 to 2020, the overall ecological environment of the WLB has shown a gradual and steady improvement. The proportion of moderate, good, and excellent RSEI averaged at 29.95%, 7.46%, and 0.91%, respectively. In contrast, the proportion of poor and fair RSEI showed a fluctuating downward trend. As shown in Table 5, the forest increased greatly from 1.14 km2 in 2000 to 109.49 km2 in 2020, and the grassland decreased from 3620.84 km2 to 1745.35km2. Besides, the areas of cropland and building increased by 5.89%, 35.34%, respectively. Compared with the large-scale improvement of vegetation quality in the WLB area, the human destructive activities belong to a small scope, but it also needs attention. It is feasible for us to quantify the human factors affecting the RSEI in the WLB through the residual analysis method. The CNLI data and population density data have a high correlation with the RSEI of the WLB. Anthropogenic factors are highly sensitive to changes in the WLB area.
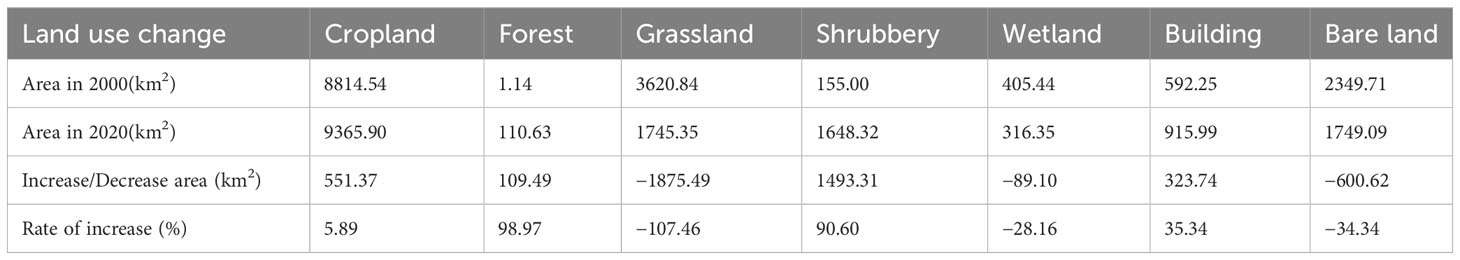
Table 5 Land use types and changes in WLB from 2000 to 2020.
4 Discussion
4.1 Availability of remote sensing data sources for ecological monitoring
We used MODIS products, night lighting data, land cover data, population density data, and combined with spatial analysis methods to achieve dynamic monitoring of ecological and environmental quality in the WLB area from 2000−2020. The fusion of low spatial resolution (LR) hyperspectral (HS) data and high spatial resolution (HR) multispectral data can increase the possibility of using remote sensing data sources (Zou et al., 2022). The datasets formed by web-based deep learning models based on remotely sensed images also have a high potential for characterizing changes in ecosystem quality (Sun et al., 2022). Therefore, the diversification of remote sensing data provides important basic data for large scale and long time series earth observation (Mahyari and Yazdi, 2011; Tuia et al., 2017). Currently, there are limitations in the collection of complete multi-time series and multi-scale socio‐economic statistics. The availability and completeness of data are the key factors limiting the dynamic monitoring of regional ecological environment (Ryu et al., 2019; Cao et al., 2020). Although this study reduces the effect of absolute error by using the RSEI trend and Hurst trend, the “scale shift” derived from the inconsistent resolution in multi-source remote sensing data is still a problem that needs to be solved in greater depth (Wang et al., 2020).
4.2 Factors affecting the change of RSEI
The ecological and environmental quality of the WLB area shows a fluctuating upward trend and tends to improve in general, but some parts are not effective. Among them, the RSEI shows an increasing trend in the eastern changes, but the changes are not particularly significant, which is most likely influenced by the topography, the land cover types are grass and shrubs, and the influence of human activities has a certain positive effect, so the RSEI remains relatively stable. Changes in RSEI in the central region occur mainly in towns, watersheds and wetlands, where human activity is high.
This study uses a residual model to analyze the trend of human activities by combining nighttime lighting data, population density data and land use change data. The trend changes results of the residual analysis and the correlations indicate that the combination of natural vegetation growth and plantation is effective. In the past two decades, a series of measures such as carrying out reforestation and afforestation ecological projects have played a role in the recovery of vegetation in the area (Xiong et al., 2021; Fan et al., 2023). Climatic factors (precipitation and temperature) are important factors for vegetation growth and recovery, and their influence is especially pronounced at long time series scales (Chen et al., 2022; Chakraborti and Bays, 2023). However, the effects of fire, drought and storms can inhibit vegetation growth, especially in areas with poor ecological stability.
In this study, the RSEI changes were explored from two perspectives: climatic factors and human activities, using multi-source remote sensing data. Although there is a lag in the ecological impacts of climate change and inconsistencies in the quantification of human activities, this is an important basis for moving to the next step of the study. The contributions of other vegetation indices, such as Enhanced Vegetation Index (EVI), Gross Primary Productivity (GPP), and important government-led factors, need to be considered in future studies to explore more deeply the factors and influencing mechanisms of inconsistent RSEI changes.
4.3 Impact of ecological engineering on RSEI
Currently, there is a general trend of “greening” of the global environment, with China and India making the largest contributions (Chen et al., 2019). Ecological restoration projects have become an important measure in the “greening” of China. The Chinese Ant Forest project is spread across the arid areas, there is a need to plant vegetation with well-developed root systems and strong adaptability, which will improve the survival rate of the vegetation. The RSEI in the WLB area shows an increasing trend from the west to the east (Zarei et al., 2019). In 2018, the local government actively responded to the call of “green water and green mountains are golden mountains” by implementing projects such as comprehensive management of Ulanbh Desert, comprehensive improvement of mining geological environment, desert ecological environment restoration and water pollution treatment. Among them, the water diversion project between the government and social enterprises has solved the difficulties of lacking water resources in arid and desert areas, and provided important conditions for vegetation growth. Arid and semi-arid areas are seeded by artificial afforestation and fly‐seeded afforestation, and this form can improve the survival rate of vegetation. However, in the face of ecologically fragile areas, increasing the construction works while reducing the involvement of human activities to maintain the stability of the ecosystem (Xu and Zhou, 2003; Zheng et al., 2022). Therefore, how to keep “green” for a long time is an important topic for future research in ecological engineering.
4.4 The importance of applying research results
Remote sensing technology plays a role in the timely correction and management of monitoring changes in ecological restoration projects, such as plantations and reforestation. Our research at the watershed scale cannot be based on a single “greening” indicator, but needs to combine social, economic, and hydrological data. Ecological engineering requires long-term fixed systematic monitoring sites to provide physiological verification of vegetation on the one hand, and to improve the accuracy of monitoring models for accurate assessment of ecological engineering on the other. In the face of vulnerability, arid and semi-arid areas, etc., the type of planting, seeding method, irrigation method and other measures need to be developed according to local conditions to improve the probability of forest success (Doelman et al., 2020; Gao et al., 2020). Vegetation management uses an intensive approach to select appropriate tree species types or change land use types to maximize economic benefits (Su et al., 2016; Cai et al., 2022). How to balance economic management and ecological benefits is the focus of future research to increase the scale of watershed studies and provide data support for future ecological and environmental quality assessment in watershed system demonstration areas.
5 Conclusions
This study uses MODIS data to assess the spatial–temporal changes of eco-environment quality in the WLB from 2000 to 2020 supported by GEE cloud service platform, and explored the driving forces of RSEI dynamics based on meteorological data, anthropogenic activities related data and CNLI data. The ecological environment of WLB areas have slowly and gradually improved from 2000 to 2020. The northern Dengkou, Linhe and Wuyuan regions are still degraded. The ecological status of the Dengkou desert management area and the mining area of Urad Qianqi has been significantly improved. There are positive and negative feedbacks for the long-term effects of different restoration measures of the WLB. Anthropogenic factors are the main drivers of changes in the ecological quality of the WLB. Evaluation of the ecological status of typical restoration and treatment areas provides a reference for the application of the same type of areas.
Data availability statement
The original contributions presented in the study are included in the article/supplementary material. Further inquiries can be directed to the corresponding author.
Author contributions
CL proposed methods, completed experiments and wrote the paper. GC provided valuable suggestions on the layout of the paper. ZL Processing data. XJ visualized the data. LL gives advice of the formal. LC modified the code of the bug. YL provided auxiliary data. YC provided valuable suggestions on the layout of the paper. RZ and XM gives advice of the formal. XZ modified and directed the writing of the paper. All authors have read and agreed to the published version of the manuscript.
Funding
This research was funded by Science and Technology R&D Program of the China State Construction Engineering Corporation (CSCEC) “Research and Application of Key Technologies for Restoration of Ecological Environmental Protection in Northwest China” (Grant number, CSCEC-2020-Z-5) and the National Key Research and Development Program of China “Cooperation project between China and Europe in Earth Observation on forest monitoring technology and demonstration applications” (2021YFE0117700) and Dragon 5 Cooperation (ID: 59257).
Conflict of interest
RZ and XM were employed by the company The Third Construction CO., LTD of China Construction First Group.
The remaining authors declare that the research was conducted in the absence of any commercial or financial relationships that could be construed as a potential conflict of interest.
Publisher’s note
All claims expressed in this article are solely those of the authors and do not necessarily represent those of their affiliated organizations, or those of the publisher, the editors and the reviewers. Any product that may be evaluated in this article, or claim that may be made by its manufacturer, is not guaranteed or endorsed by the publisher.
References
An M., Xie P., He W., Wang B., Huang J., Khanal R. (2022). Spatiotemporal change of ecologic environment quality and human interaction factors in three gorges ecologic economic corridor, based on RSEI. Ecol. Indic 141, 109090. doi: 10.1016/j.ecolind.2022.109090
Balsamo G., Albergel C., Beljaars A., Boussetta S., Brun E., Cloke H., et al. (2015). ERA-Interim/Land: A global land surface reanalysis data set. Hydrology Earth System Sci. 19, 389–407. doi: 10.5194/hess-19-389-2015
Bartkowiak P., Castelli M., Notarnicola C. (2019). Downscaling land surface temperature from MODIS dataset with random forest approach over Alpine vegetated areas. Remote Sens. 11, 1319. doi: 10.3390/rs11111319
Cai Y., Zhang F., Duan P., Yung Jim C., Weng Chan N., Shi J., et al. (2022). Vegetation cover changes in China induced by ecological restoration-protection projects and land-use changes from 2000 to 2020. CATENA 217, 106530. doi: 10.1016/j.catena.2022.106530
Cao R., Jiang W., Yuan L. (2014). Inter-annual variations are vegetation and their response to climatic factors in the upper catchments of the Yellow River from 2000 to 2010. J. Geographical Science. 24, 963–979. doi: 10.1007/s11442-014-1131-1
Cao J., Law S. H., Samad A. R. B. A., Mohamad W. N. B. W., Wang J., Yang X. (2022). Effect of financial development and technological innovation on green growth—Analysis based on spatial Durbin model. J. Clean. Prod. 365, 132865. doi: 10.1016/j.jclepro.2022.132865
Cao S., Suo X., Xia C. (2020). Payoff from afforestation under the three-North shelter forest program. J. Cleaner Production 256, 120461. doi: 10.1016/j.jclepro.2020.120461
Chakraborti R. K., Bays J. S. (2023). Constructed wetlands using treated membrane concentrate for coastal wetland restoration and the renewal of multiple ecosystem services. Land 12, 847. doi: 10.3390/land12040847
Chen C., Park T., Wang X., Piao S., Xu B., Chaturvedi R. K., et al. (2019). … China and India lead in greening of the world through land-use management. Nat. sustainability 2 (2), 122–129. doi: 10.1038/s41893-019-0220-7
Chen Y., Yang J., Yang R., Xiao X., Xia J. C. (2022). Contribution of urban functional zones to the spatial distribution of urban thermal environment. Build. Environ. 216, 109000. doi: 10.1016/j.buildenv.2022.109000
Chen C., Liang J., Xie F., Hu Z., Sun W., Yang G., et al. (2022). Temporal and spatial variation of coastline using remote sensing images for Zhoushan archipelago, China. Int. J. Appl. Earth Observation Geoinformation 107, 102711. doi: 10.1016/j.jag.2022.102711
Chen C., Liang J., Yang G., Sun W. (2023). Spatio-temporal distribution of harmful algal blooms and their correlations with marine hydrological elements in offshore areas, China. Ocean Coast. Manage. 238, 106554. doi: 10.1016/j.ocecoaman.2023.106554
Chen Y., Yang J., Yu W., Ren J., Xiao X., Xia J. (2023). Relationship between urban spatial form and seasonal land surface temperature under different grid scales. Sustain. Cities Soc 89, 104374. doi: 10.1016/j.scs.2022.104374
Chu H., Venevsky S., Wu C., Wang M. (2019). NDVI-based vegetation dynamics and its response to climate changes at Amur-Heilongjiang River Basin from 1982 to 2015. Sci. Total Environ. 650, 2051–2062. doi: 10.1016/j.scitotenv.2018.09.115
Doelman J. C., Stehfest E., van Vuuren D. P., Tabeau A., Hof A. F., Braakhekke M. C., et al. (2020). … Afforestation for climate change mitigation: Potentials, risks and trade-offs. Global Change Biol. 26 (3), 1576–1591. doi: 10.1111/gcb.14887
Evans J., Geerken R. (2004). Discrimination between climate and human-induced dryland degradation. J. Arid Environments 57, 535–554. doi: 10.1016/S0140-1963(03)00121-6
Fan Q., Shi Y., Song X., Cong N. (2023). Study on factors affecting remote sensing ecological quality combined with sentinel-2. Remote Sens 15, 2156. doi: 10.3390/rs15082156
Fan C., Yang J., Zhao G., Dai J., Zhu M., Dong J., et al. (2023). Mapping phenology of complicated wetland landscapes through harmonizing landsat and sentinel-2 imagery. Remote Sens 15, 2413. doi: 10.3390/rs15092413
Gao L., Wang X., Johnson B. A., Tian Q., Wang Y., Verrelst J., et al. (2020). Remote sensing algorithms for estimation of fractional vegetation cover using pure vegetation index values: A review. SPRS J. Photogrammetry Remote Sens. 159, 364–377. doi: 10.1016/j.isprsjprs.2019.11.018
Geng J., Yu K., Xie Z., Zhao G., Ai J., Yang L., et al. (2022). Analysis of spatiotemporal variation and drivers of ecological quality in Fuzhou based on RSEI. Remote Sens. 14, 4900. doi: 10.3390/rs14194900
Gorelick N., Hancher M., Dixon M., Ilyushchenko S., Thau D., Moore R. (2017). Google Earth Engine: Planetary-scale geospatial analysis for everyone. Remote Sens. Environ. 202, 18–27. doi: 10.1016/j.rse.2017.06.031
Hao F., Zhang X., Ouyang W., Skidmore A. K., Toxopeus A. (2012). Vegetation NDVI linked to temperature and precipitation in the upper catchments of Yellow River. Environ. Model. Assess. 17, 389–398. doi: 10.1007/s10666-011-9297-8
Jeong S. J., Ho C. H., Gim H. J., Brown M. E. (2011). Phenology shifts at start vs. end of growing season in temperate vegetation over the Northern Hemisphere for the period 1982–2008. Global Change Biol. 17, 2385–2399. doi: 10.1111/j.1365-2486.2011.02397.x
Jia X., Jin Z., Mei X., Wang D., Zhu R., Zhang X., et al. (2023). Zhang X.Monitoring and effect evaluation of an ecological restoration project using multi-source remote sensing: A case study of wuliangsuhai watershed in China. Land. 12, 349. doi: 10.3390/land12020349
Jiang L., Bao A., Guo H., Ndayisaba F. (2017). Vegetation dynamics and responses to climate change and human activities in Central Asia. Sci. Total Environ. 599-600, 967–980. doi: 10.1016/j.scitotenv.2017.05.012
Jiang W. G., Pan Y. Z., Hou P., Li X., Ji W., Zheng J. R. (2009). Assessment and analysis of wetland ecosystem health in Dongting Lake. Geographical Res. 28, 1665–1672. doi: 10.11821/yj2009060022
Kumar L., Mutanga O. (2018). Google earth engine applications since inception: usage, trends, and potential. Remote Sensing. 10, 1509. doi: 10.3390/rs10101509
Lee S., Chiang K., Xiong X., Sun C., Anderson S. (2014). The S-NPP VIIRS day-night band on-orbit calibration/characterization and current state of SDR products. Remote Sens. 6, 12427–12446. doi: 10.3390/rs61212427
Liang J., Chen C., Song Y., Sun W., Yang G. (2023). Long-term mapping of land use and cover changes using Landsat images on the Google Earth Engine Cloud Platform in bay area - A case study of Hangzhou Bay, China. Sustain. Horizons 7, 100061. doi: 10.1016/j.horiz.2023.100061
Li G., Cai Z., Liu X., Liu X., Liu J., Su S. (2019c). A comparison of machine learning approaches for identifying high-poverty counties: robust features of DMSP/OLS night-time light imagery. Int. J. Remote Sens 40, 5716–5736. doi: 10.1080/01431161.2019.1580820
Liu Y., Liu H., Chen Y., Gang C., Shen Y. (2022). Quantifying the contributions of climate change and human activities to vegetation dynamic in China based on multiple indices. Sci. Total Environ. 838, 156553. doi: 10.1016/j.scitotenv.2022.156553
Liu J., Liu M., Tian H., Zhang D., Zhang Z., Zhang W., et al. (2005). Spatial and temporal patterns of China’s cropland during 1990-2000: an analysis based on Landsat TM data. Remote Sens. Environment. 98, 442–456. doi: 10.1016/j.rse.2005.08.012
Liu J., Ning J., Kuang W., Xu X., Zhang S., Yan C., et al. (2018). Spatio-temporal patterns and characteristics of land-use change in China during 2010–2015. Acta Geogr. Sin. 73, 789–802. doi: 10.11821/dlxb201805001
Mahyari A. G., Yazdi M. (2011). Panchromatic and multispectral image fusion based on maximization of both spectral and spatial similarities. IEEE Trans. Geosci. Remote Sens. 49 (6), 1976–1985. doi: 10.1109/TGRS.2010.2103944
Myneni R. B., Williams D. L. (1994). On the relationship between FAPAR and NDVI. Remote Sens. Environment. 49, 200–211. doi: 10.1016/00344257(94)90016-7
Nanzad L., Zhang J., Tuvdendorj B., Nabil M., Zhang S., Bai Y. (2019). NDVI anomaly for drought monitoring and its correlation with climate factors over Mongolia from 2000 to 2016. J. Arid Environments. 164, 69–77. doi: 10.1016/j.jaridenv.2019.01.019
Nemani R. R., Keeling C. D., Hashimoto H., Jolly W. M., Piper S. C., Tucker C. J., et al. (2003). Climate-driven increases in global terrestrial net primary production from 1982 to 1999. Science 300 (5625), 1560–1563. doi: 10.1126/science.1082750
Panigrahi S., Verma K., Tripathi P. (2020). Review of MODIS EVI and NDVI data for data mining applications. Data Deduplication Approaches 12, 231–253. doi: 10.1016/b9780-12-823395-5.00018-5
Pettorelli N., Vik J. O., Mysterud A., Gaillard J. M., Tucker C. J., Stenseth N. C. (2005). Using the satellite-derived NDVI to assess ecological responses to environmental change. Trends Ecol. Evol. 20, 503–510. doi: 10.1016/j.tree.2005.05.011
Rouse J. W., Haas R. H., Schell J. A., Deering D. W. (1974). Monitoring vegetation systems in the Great Plains with ERTS. NASA Special Publication. 351, 309.
Ryu Y., Berry J. A., Baldocchi D. D. (2019). What is global photosynthesis? History, uncertainties and opportunities. Remote Sens. Environ. 223, 95–114. doi: 10.1016/j.rse.2019.01.016
Su Y., Guo Q., Xue B., Hu T., Alvarez O., Tao S., et al. (2016). Spatial distribution of forest aboveground biomass in China: Estimation through combination of spaceborne lidar, optical imagery, and forest inventory data. Remote Sens. Environ. 173, 187–199. doi: 10.1016/j.rse.2015.12.002
Sun W., Ren K., Meng C., Yang G., Xiao C., Peng J., et al. (2022). MLR-DBPFN: A multi-scale low rank deep back projection fusion network for anti-noise hyperspectral and multispectral image fusion. IEEE transactions on geoscience and remote sensing. 60, 1–14. doi: 10.1109/TGRS.2022.3146296
Sun W. Y., Song X. Y., Mu X. M., Gao P., Wang F., Zhao G. J. (2015). Spatiotemporal vegetation cover variations associated with climate change and ecological restoration in the Loess Plateau. Agric. For. Meteorology. 209, 87–99. doi: 10.1016/j.agrformet.2015.05.002
Tuia D., Moser G., Le Saux B., Bechtel B and See L. (2017). The 2017 IEEE geoscience and remote sensing society data fusion contest: open data for global multimodal land use classification [Technical Committees]. IEEE Geosci. Remote Sens. Magazine 5 (4), 110–114. doi: 10.1109/MGRS.2017.2760346
Wan Z. M. (2008). New refinements and validation of the MODIS land-surface temperature/emissivity products. Remote Sens. Environ. 112, 59–74. doi: 10.1016/j.rse.2006.06.026
Wang G. F., Bi R. T., Zhang W. P., Zhang Q., Jing Y. D. (2020). Temporal and spatial distribution characteristics and influencing factors of vegetation coverage in typical mining areas. Acta Ecol. Sin. 40 (17), 6046. doi: 10.1016/j.ecolind.2022.109429
Wang S. Y., Zhang X. X., Zhu T., Yang W., Zhao J. Y. (2016). Assessment of ecological environment quality in the Changbai Mountain Nature Reserve based on remote sensing technology. Rorgress Geogr. 35, 1269–1278. doi: 10.18306/dlkxjz.2016.10.010
Wessels K. J., Van D., Scholes R. J. (2012). Limits to detectability of land degradation by trend analysis of vegetation index data. Remote Sens. Environ. 125, 10–22. doi: 10.1016/j.rse.2012.06.022
Xin Z., Xu J., Zheng W. (2008a). Spatiotemporal variations of vegetation cover on the Chinese Loess Plateau (1981–2006): impacts of climate changes and human activities. Sci. China Ser. D: Earth Sci. 51, 67–78. doi: 10.1007/S11430-007-0137-2
Xiong X., Butler J., Chiang K., Efremova B., Fulbright J., Lei N., et al. (2016). Assessment of s-npp viirs on-orbit radiometric calibration and performance. Remote Sens. 8, 84–104. doi: 10.3390/rs8020084
Xiong Y., Xu W. H., Lu N., Huang S. D., Wu C., Wang L. G., et al. (2021). Assessment of spatial–temporal changes of ecological environment quality based on RSEI and GEE: A case study in Erhai Lake Basin, Yunnan province, China. Ecol. Indic. 125, 107518. doi: 10.1016/j.ecolind.2021.107518
Xu H. (2008). A new index for delineating built-up land features in satellite imagery. Int. J. Remote Sens. 29 (14), 4269–4276. doi: 10.1080/01431160802039957
Xu H. (2013). A remote sensing index for assessment of regional ecological changes. China Environ. Science. 33, 889–897. doi: 10.3969/j.issn.1000-6923.2013.05.019
Xu Y., Zhou H. R. (2003). A preliminary study on advances in assessment of eco- environmental quality in China. Arid Land Geography. 26, 166–172. doi: 10.13826/j.cnki.cn65-1103/x.2003.02.013
Yang S. T., Liu C. M., Yang Z. F., Sun R., Zhou X. D. (2002). Natural eco- environmental evaluation of west route area of Inter basin water transfer project. Acta Geographica Sinica. 57, 11–18. doi: 10.11821/xb200201002
Yu F., Li X. B., Wang H., Yu H. J. (2006). Land use change and eco-security assessment of Huangfuchuan Watershed. Acta Geographica Sinica. 61, 645–653. doi: 10.11821/xb200606008
Zarei A. R., Moghimi M. M., Bahrami M. (2019). Comparison of reconnaissance drought index (RDI) and effective reconnaissance drought index (eRDI) to evaluate drought severity. Sustain. Water Resour. Manage. 5, 1345–1356. doi: 10.1007/s40899-019-00310-9
Zhang X. Y., Schaaf C. B., Friedl M. A., Strahler A. H., Gao F., Hodges J. C. F. (2002). MODIS tasseled cap transformation and its utility//Proceedings of IEEE International Geoscience and Remote Sensing Symposium (Toronto: IEEE), 1063–1065. doi: 10.1109/IGARSS.2002.1025776
Zhang Y., She J., Long X., Zhang M. (2022). Spatio-temporal evolution and driving factors of eco-environmental quality based on RSEI in Chang-Zhu-Tan metropolitan circle, central China. Ecol. Indic 144, 109436. doi: 10.1016/j.ecolind.2022.109436
Zhang Y. Y., Zhang S. F., Zhai X. Y., Xia J. (2012). Runoff variation in the three rivers source region and its response to climate change. Acta Geographica Sinica. 67, 71–82. doi: 10.1007/s11442-012-0963-9
Zheng Y., Du S., Zhang X., Bai L., Wang H. (2022). Estimating carbon emissions in urban functional zones using multi-source data: A case study in Beijing. Build. Environ. 212, 108804. doi: 10.1016/j.buildenv.2022.108804
Zheng Z. H., Wu Z. F., Chen Y. B., Yang Z. W., Francesco· M. (2021). Analyzing the ecological environment and urbanization characteristics of the Yangtze River Delta Urban Agglomeration based on Google Earth Engine. Acta Ecologica Sinica. 02, 717–729. doi: 10.5846/stxb202003250687
Zheng Z., Wu Z., Chen Y., Yang Z., Marinello F. (2020). Exploration of eco-environment and urbanization changes in coastal zones: A case study in China over the past 20 years. Ecol. Indic. 119, 106847. doi: 10.1016/j.ecolind.2020.106847
Zhi Y. B., Wang Z. L., Ma Z., Han X., Li J. M., Ren P., et al. (2009). Research on Ningxia’s resource and environmental performance and changing trends. Acta Ecologica Sinica. 29, 6490–6498. doi: 10.3321/j.issn:1000-0933.2009.12.022
Keywords: CNLI, ecological environment quality, Google Earth Engine, RSEI, spatial–temporal variation, Wuliangsu Lake Basin
Citation: Li C, Chai G, Li Z, Jia X, Lei L, Chen L, Li Y, Cao Y, Zhu R, Mei X and Zhang X (2023) Spatial−temporal variation of ecological environment quality and driving factors from 2000 to 2020 in Wuliangsu Lake Basin, Northern China. Front. Ecol. Evol. 11:1240514. doi: 10.3389/fevo.2023.1240514
Received: 15 June 2023; Accepted: 21 August 2023;
Published: 18 September 2023.
Edited by:
Changchun Huang, Nanjing Normal University, ChinaReviewed by:
Ling Yao, Chinese Academy of Sciences (CAS), ChinaChao Chen, Suzhou University of Science and Technology, China
Copyright © 2023 Li, Chai, Li, Jia, Lei, Chen, Li, Cao, Zhu, Mei and Zhang. This is an open-access article distributed under the terms of the Creative Commons Attribution License (CC BY). The use, distribution or reproduction in other forums is permitted, provided the original author(s) and the copyright owner(s) are credited and that the original publication in this journal is cited, in accordance with accepted academic practice. No use, distribution or reproduction is permitted which does not comply with these terms.
*Correspondence: Xiaoli Zhang, emhhbmcteGxAMjYzLm5ldA==