 Yazhu Wang
 Yuxiang Wang
- Nanjing Institute of Geography and Limnology, Chinese Academy of Sciences, Nanjing, Jiangsu, China
The escalation in carbon dioxide concentration has precipitated global climate warming, accentuating ecological and environmental concerns. Notably, China stands as the world’s largest carbon emitter, with the Taihu Lake basin emerging as a carbon-intensive region within the country. This paper undertakes a comprehensive analysis spanning 2005 to 2020, calculating the economic contribution coefficient of carbon emissions and the ecological carrying coefficient of carbon absorption in the Taihu Lake basin. The study includes a delineation of carbon balance zones and an exploration of the geographical and spatial influences of both ecosystem and economic factors. The overarching trend in carbon emissions within the Taihu Lake Basin initially exhibited rapid growth, followed by a fluctuating decline, with the pivotal year being 2012, recording the apex of emissions at 575.8293 million tons. Concurrently, total carbon absorption demonstrated a fluctuating growth trajectory, ascending from 82.3503 million tons in 2005 to 85.6488 million tons in 2020. The carbon emission intensity in the basin manifested a pattern of high concentration in the northeast and low concentration in the southwest, while the carbon absorption intensity displayed the inverse pattern. The carbon balance across the Taihu Lake Basin revealed a spatial incongruity, characterized by a suboptimal pattern in the northeast and a favorable pattern in the southwest. Zhejiang Province emerged as an ecological stronghold within the basin, acting as the primary carbon sink functional area. Urban built-up areas and forested regions emerged as principal influencers of carbon balance in the Taihu Lake basin. Urban construction land, population density, and arable land area were identified as primary contributors to carbon emissions, whereas per capita GDP, forests, grasslands, and water bodies were identified as main contributors to carbon absorption in the watershed.
1 Introduction
Since the advent of the Industrial Revolution, the global community has expressed widespread apprehension concerning the issue of global climate change, originating from the upswing in carbon emissions (Meinshausen et al., 2009; Al-Arkawazi, 2018). This phenomenon poses a substantial long-term challenge to human society, primarily materializing as greenhouse effects resulting from heightened energy consumption and carbon dioxide emissions (Kerr, 2001; Wang and Zhao, 2018). In a bid to address global climate change and facilitate worldwide carbon emission reduction (Chowdhury, 2012), more than 130 countries and regions have articulated ambitious goals or visions centered around “carbon neutrality” (Dhakal, 2009; Taylor et al., 2016). In alignment with the 2020 Paris Agreement, the Chinese government has pledged to attain its peak carbon emissions by 2030 and achieve carbon neutrality by 2060 (Dong et al., 2019). However, China currently contends with the status of harboring the highest urban population, the most substantial energy consumption, and the largest carbon emissions globally, thereby confronting considerable pressure to mitigate its carbon footprint (Dong et al., 2018). It is imperative to acknowledge that the climate impacts of carbon are not solely contingent upon carbon emissions but also on carbon sequestration (Sahe et al., 2018). Through the application of carbon balance partitioning, the scrutiny of carbon balance across diverse spatial units becomes feasible, providing a valuable tool for realizing regional carbon neutrality. Consequently, this approach assumes paramount significance in China’s pursuit of its climate goals (Madlener and Sunak, 2011).
Carbon balance assumes a pivotal role in global climate change research, constituting a fundamental aspect of green and low-carbon development (Davis and Caldeira, 2010; Friedlingstein et al., 2010). Scholars have extensively delved into diverse facets of carbon accounting, spatiotemporal differentiation, the interaction between carbon balance and industrial structure (Abd Rashid and Yusoff, 2015), economic growth (Chuai et al., 2012), and land use patterns (Anderson et al., 1996), as well as factors influencing carbon balance (Feng et al., 2013). Furthermore, regional disparities have given rise to divergent capacities for carbon balance across various areas (Yao et al., 2021). The emerging field of carbon compensation has garnered attention in the context of global climate change and green and low-carbon development. Numerous literature reviews have scrutinized carbon balance, carbon equilibrium, and carbon cycling from different research perspectives, spanning global scales (Hong et al., 2021), national levels (Liu et al., 2020), urban agglomerations (Fu et al., 2019; Liu et al., 2022), provincial regions (Xiong et al., 2022), cities (Wang et al., 2017), and counties (Xiong et al., 2019). Quantitative research models have emerged as a prominent methodological approach, encompassing input-output analysis (Huang et al., 2018), time series regression models (Acquaye and Duffffy, 2010), fixed-effects models, STIRPAT model (Fu et al., 2015), IPAT environmental pollution model (Kopidou et al., 2016), and Granger causality tests, among others.
The relationship between urbanization and carbon balance is also a research hotspot (Lv et al., 2019). The impact of urbanization on carbon balance is intricate, involving multiple factors and complex transmission processes (Poumanyvong and Kaneko, 2010). Generally, driving factors encompass population size, economic level (Auffffhammer and Carson, 2008), technological factors, industrial structure, energy consumption structure (Simões et al., 2016), and degree of openness. The urbanization process significantly influences CO2 balance (Ponce de Leon Barido and Marshall, 2014), as it represents a major contributor to global carbon emissions (Dhakal, 2009; Chen and Lin, 2021) and a key factor altering land carbon balance (Zhang et al., 2022). Moreover, ecosystem carbon sequestration can modify carbon emissions within human activity-intensive areas, thereby exerting a substantial influence on global carbon balance (Lai et al., 2016).
Reflecting on prior research, the majority of studies have predominantly examined changes in carbon emissions resulting from human activities within cities (Satterthwaite, 2008), while investigations on the integrated changes stemming from the interplay between human activities and ecosystems at the river basin scale have received less attention (Wang and Feng, 2017). Existing studies have generally overlooked the spatial interdependence of carbon balance among research units and the spatial heterogeneity of influential factors (Chen et al., 2018). Moreover, they have neglected the endogenous spatial expansion mechanism of carbon emissions, driven by variations in multi-subject ecological and economic elements, as well as the spatial interaction mechanism of carbon emissions within the region (Corrado and Fingleton, 2012). Consequently, this oversight introduces potential contingencies in research conclusions pertaining to spatial effects (Maddison, 2006).
To bridge these gaps, this study aims to address existing gaps by making four primary contributions. Firstly, we computed the geographical and spatiotemporal characteristics of CO2 balance in the Taihu Basin, investigating the patterns and scale of spatial spillover effects. This facilitates the differentiation of emission reduction responsibilities among regions and offers evidence for carbon emission quota allocation (Kanaroglou et al., 2013). Secondly, we assessed the spatial heterogeneity of ecosystem impact factors and mechanisms related to CO2 emissions in the Taihu Basin, a critical perspective often overlooked in numerous studies despite its significance for CO2 emission reduction practices. Thirdly, the research findings substantiate the spatial partitioning of carbon balance, quantify the relationship between ecosystems, economic development, and carbon emissions, and advocate for diverse government departments to implement measures for carbon emission control (Zhang et al., 2011). Finally, a robust spatial correlation exists within the carbon balance. This article utilizes the multiscale geographically weighted regression model, accounting for spatial effects and thereby enhancing the precision of the research findings (Huang et al., 2020).
The Taihu Basin holds significant importance as a terrestrial ecological carbon sink within China. Simultaneously, it represents an economically developed and densely populated region characterized by substantial carbon emissions. Given the interconnectedness and integrity of the basin’s ecological environment, studying regional carbon balance and implementing optimization measures within the basin becomes of immense practical significance (Ma et al., 2022). In this study, the research area focuses specifically on the Taihu Basin, integrating carbon emission data from 2005 to 2020. The county serves as the fundamental unit, and the MGWR model is employed to examine the spatial distribution and influencing factors of carbon emissions and carbon absorption intensity within the basin. Additionally, the study aims to delineate carbon balance zones, thereby providing a scientific foundation for addressing carbon balance, ecological governance, restoration, and consolidation efforts within the Taihu Basin.
2 Data and methods
2.1 Study area
The Taihu Lake Basin is situated between 119°11’–121°53’ E and 30°28’–32°15’ N at the heart of the Yangtze River Delta. Renowned for its economic prowess, this region stands as one of China’s most developed and densely populated areas, serving as a focal point for the nation’s most advanced technologies. The region contends with a conspicuous contradiction involving economic growth, environmental considerations, and resource management (Figure 1). Within the core of the Yangtze River Delta lies Taihu Lake, encompassing the most thriving urban agglomeration in China, which includes cities such as Shanghai, Suzhou, Changzhou, Wuxi, Zhenjiang, Hangzhou, Jiaxing, Huzhou, and several others located within the basin. Since 1980, the basin’s economy has experienced substantial growth, marked by an average annual gross domestic product (GDP) growth rate of 15.7%, a population growth rate of 3.0%, and an urbanization rate of 9.2%. By 2020, the total population residing in the region reached 67.55 million, while the total GDP amounted to 9,997.8 billion yuan. Despite occupying a mere 0.4% of China’s total land area, the Taihu Lake Basin accounts for 4.80% of the total population and 9.80% of the total GDP (Yang et al., 2023). However, it consumes 17.5% of China’s total energy and is responsible for 15.5% of the nation’s total carbon emissions. Industrial activities predominantly drive carbon emissions exhibiting a general upward trend, with a 2.5-fold increase from 2,076,300 tons in 2005 to 5,232,500 tons in 2020. The region has experienced swift industrialization and urbanization, leading to substantial changes in patterns of industrial energy consumption, industrial enterprise, and carbon emissions. Consequently, the Taihu Lake Basin holds pivotal significance in China’s endeavors to achieve its “carbon peak” and “carbon neutrality” commitments (Wu et al., 2018).
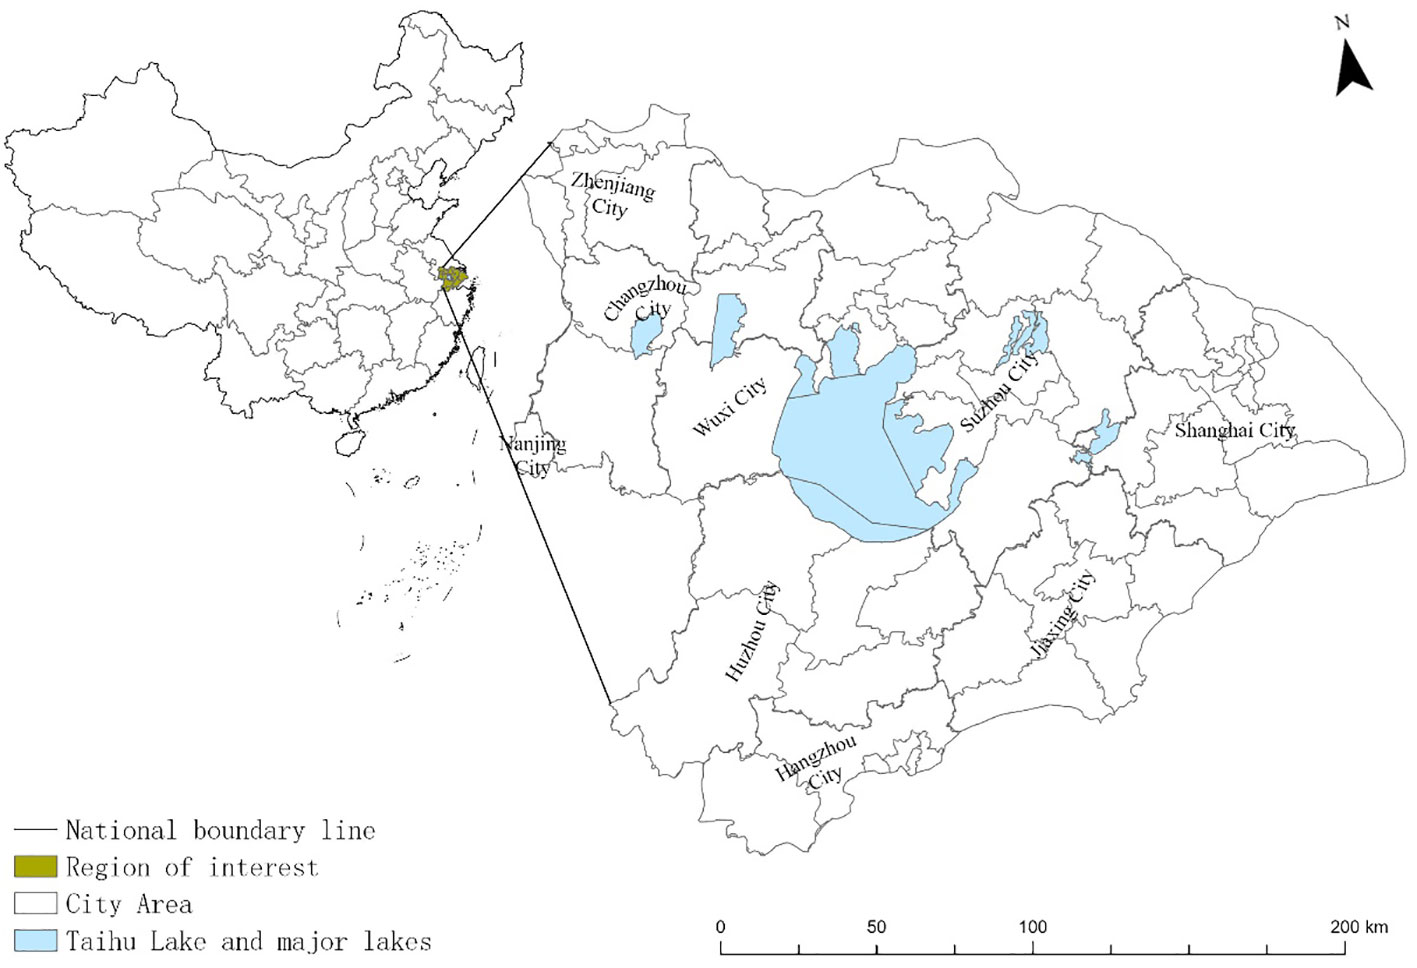
Figure 1 Overview of the Taihu Lake Basin Urban Study Area.
2.2 Data sources
The research incorporated adjustments for recent changes in counties and cities based on the administrative divisions of Jiangsu Province, Zhejiang Province, and Shanghai in 2020. The investigation covered the period from 2005 to 2020 and utilized GDP spatial data and land use data (1 km grid) obtained from the Science and Environment Data Center at the Chinese Academy of Sciences (HTTP://www.resdc.cn/). The population data is sourced from the “China Urban Statistical Yearbook” (2001-2021) and the statistical yearbooks of various provinces. Carbon emissions and carbon absorption data were obtained from the China carbon accounting database CEADS (https://www.ceads.net.cn/), which employs the particle swarm optimization-backpropagation (PSO-BP) algorithm to harmonize and standardize DMSP/OLS and NPP/VIIRS satellite data with nighttime artificial light data, representing China’s provinces and cities, as well as CO2 emission data indicating fossil energy consumption in China. The approach utilizes a top-down method to estimate CO2 emissions from fossil energy consumption at the district and county levels, leveraging the total artificial light in each district and county as a weighting factor. Lastly, the carbon sequestration associated with terrestrial vegetation was assessed using the conversion coefficient for vegetation dry matter and CO2 absorption (https://www.resdc.cn/data.aspx?DATAID=343).
2.3 Methods
2.3.1 Economy contributive coefficient of carbon emissions
The Economy Contributive Coefficient (ECC) was employed to gauge the variations in carbon emissions within the basin through an economic benefit lens (Rong et al., 2020). The calculation formula for ECC is as follows:
In the formula, Cn and Dn denote the GDP and carbon emissions of the nth county, while C and D represent the GDP and carbon emissions of the Taihu Lake Basin, respectively. An ECC value greater than 1 signifies a high economic contribution coefficient for carbon emissions in a county, whereas a value less than 1 indicates the opposite scenario.
2.3.2 Carbon absorption ecological carrying coefficient
The Ecological Support Coefficient (ESC) is a metric that quantifies the ratio of carbon absorption to carbon emissions within a specific region relative to a larger area, thereby serving as an indicator of the carbon sink capacity of a given watershed (Fotheringham et al., 2017). The calculation formula for ESC is as follows:
In the formula, Em and Dm denote the carbon absorption and carbon emissions of the mth county, while E and D represent the carbon absorption and carbon emissions of the entire Taihu Lake Basin, respectively. An ESC value greater than 1 signifies a high carbon absorption ecological carrying capacity in a county, while a value less than 1 indicates the opposite scenario.
2.3.3 Carbon balance zoning method
In this study, the SOM-K-means clustering model is employed to delineate the carbon balance zoning within the Taihu Basin. The self-organizing feature mapping neural network (SOM) is a type of unsupervised classification neural network that effectively addresses classification problems. Conversely, the K-means clustering algorithm is a clustering analysis technique that utilizes the sum of squared errors as a criterion function to organize data samples with similar features (Arima et al., 2003). By integrating the self-organizing, adaptive, and fault-tolerant properties of SOM with the high efficiency, interpretability, and rapid convergence rate of K-means, the SOM-K-means clustering model conducts a two-stage clustering approach on the data samples. In the first stage, SOM is utilized to perform preliminary clustering and determine the number of categories as well as the center points for each category. Subsequently, in the second stage, the clustering results from the first stage are utilized as input values, and the K-means clustering algorithm is applied to generate the final clustering outcomes.
2.3.4 The multiscale geographically weighted regression model
The MGWR model incorporates varying levels of spatial smoothing for individual variables and employs distinct bandwidths for each independent variable to capture the extent of geographic spatial effects on dependent variables. In contrast to the geographically weighted regression (GWR) model and multiple linear regression models (OLS), the MGWR model better accommodates the spatial heterogeneity inherent in geographical processes. It was a statistical inference method for this model was subsequently (Yu et al., 2020). The model’s structure can be outlined as follows:
where is the attribute value of indicates the coordinates at position i; is the intercept of the model at ; represents the bandwidth used by the regression coefficient of the first variable for which the relationship between the explanatory variable and the dependent variable allows to change in space, the regression coefficient is the first variable, and is the error term of the model. The quadratic kernel function and corrected Akaike information criterion (AICc), respectively, were adopted in this study as the model kernel function and the broadband selection criterion (Brunsdon et al., 2002).
3 Results and discussion
3.1 Carbon emissions and their spatiotemporal characteristics in the Taihu Lake Basin
The results indicate a noteworthy trend in the carbon emissions of the Taihu Lake Basin from 2005 to 2020, characterized by rapid growth followed by fluctuating decline with 2012 as the turning point (Figure 2). In 2005, the basin produced a total of 207.632 million tons of carbon emissions, which escalated sharply to 523.2451 million tons by 2020, reflecting an average annual growth rate of 10.13%. In 2012, the discharge within the Taihu Lake Basin peaked at 575.8293 million tons, representing the highest recorded volume during the specified period. Rapid urbanization and industrialization have brought about sharp energy consumption and increased carbon emissions (Miao et al., 2019). This period can be divided into two stages: 2005 to 2012 marked by rapid growth, and 2013 to 2020 characterized by volatile decline. Examining different regions within the basin, Jiangsu Province stood out with carbon emissions reaching 252.4574 million tons in 2020, surpassing Shanghai as the highest emitter. After stabilizing with an average annual growth rate of 9.22% post-2011, the province held the second position with 173.5355 million tons of emissions, yet experienced a rapid growth due to an average annual growth rate of 9.91%. Shanghai, driven by industrial development, claimed the leading role in carbon emissions in 2015; however, emissions decreased with an average annual growth rate of -3.5% after that. Zhejiang Province, with carbon emissions totaling 97.2522 million tons, ranked third in the basin from 2005 to 2012, showcasing an average annual carbon emissions growth rate of 17.84%. Post-2012, carbon emissions fluctuated and declined with an average annual growth rate of -8.11%.
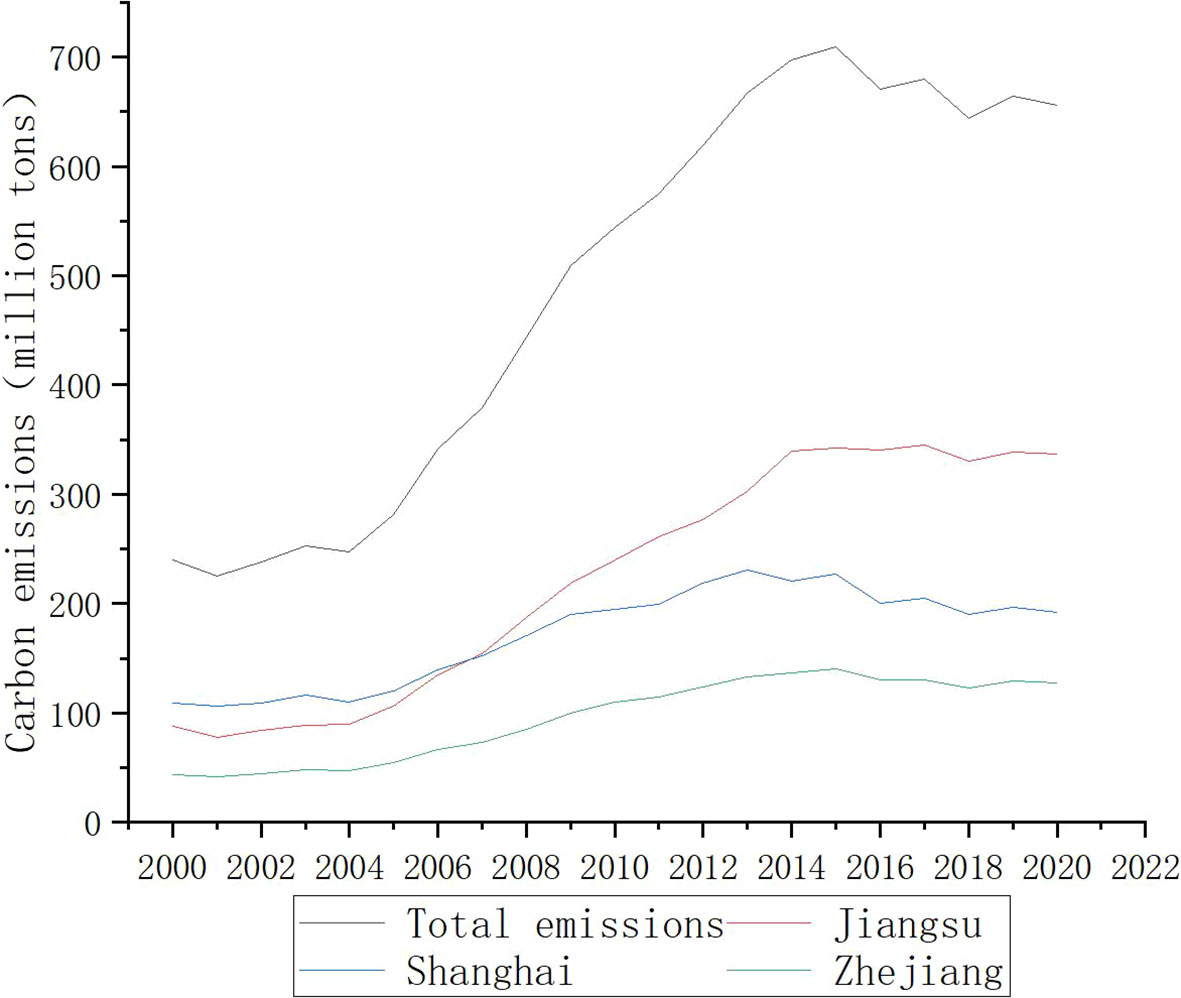
Figure 2 Trend of carbon emissions from 2005 to 2020 in the Taihu Lake Basin.
From 2005 to 2020, there were notable changes in the carbon emission intensity across different districts and counties within the Taihu Lake Basin (Figure 3). In 2005, high-value areas of carbon emission intensity were concentrated in the eastern Shanghai area, extending throughout the basin. At that time, only Putuo District in Shanghai displayed a carbon emission intensity above 6, while 35 districts and counties exhibited carbon emission intensities below 0.5, spread across Jiangsu Province and Zhejiang Province excluding Shanghai. Throughout this period, carbon emissions were generally higher in the east and lower in the west. By 2020, the area of high carbon emission gradually expanded from Shanghai, forming a region of elevated carbon emission intensity covering the entire northern part of the basin with Shanghai at its center. During this time, two districts, Putuo District and Hongkou District in Shanghai, exhibited carbon emission intensities above 6. The number of districts and counties with carbon emission intensity below 0.5 decreased to 7, primarily located in the southwest region of the watershed bordering Zhejiang Province. Consequently, three levels of carbon emission intensity emerged in the basin: high intensity in the northern region along the Yangtze River, moderate intensity running through the middle of the basin from northwest to southeast, and low intensity in the western part, aligning in a north-south direction. Therefore, the spatial pattern of carbon emission intensity in the Taihu Lake Basin demonstrates higher levels in the east compared to the west and higher levels in the north compared to the south during this period. This finding aligns with previous research indicating substantial variations in CO2 emissions among counties (Xiong et al., 2020).
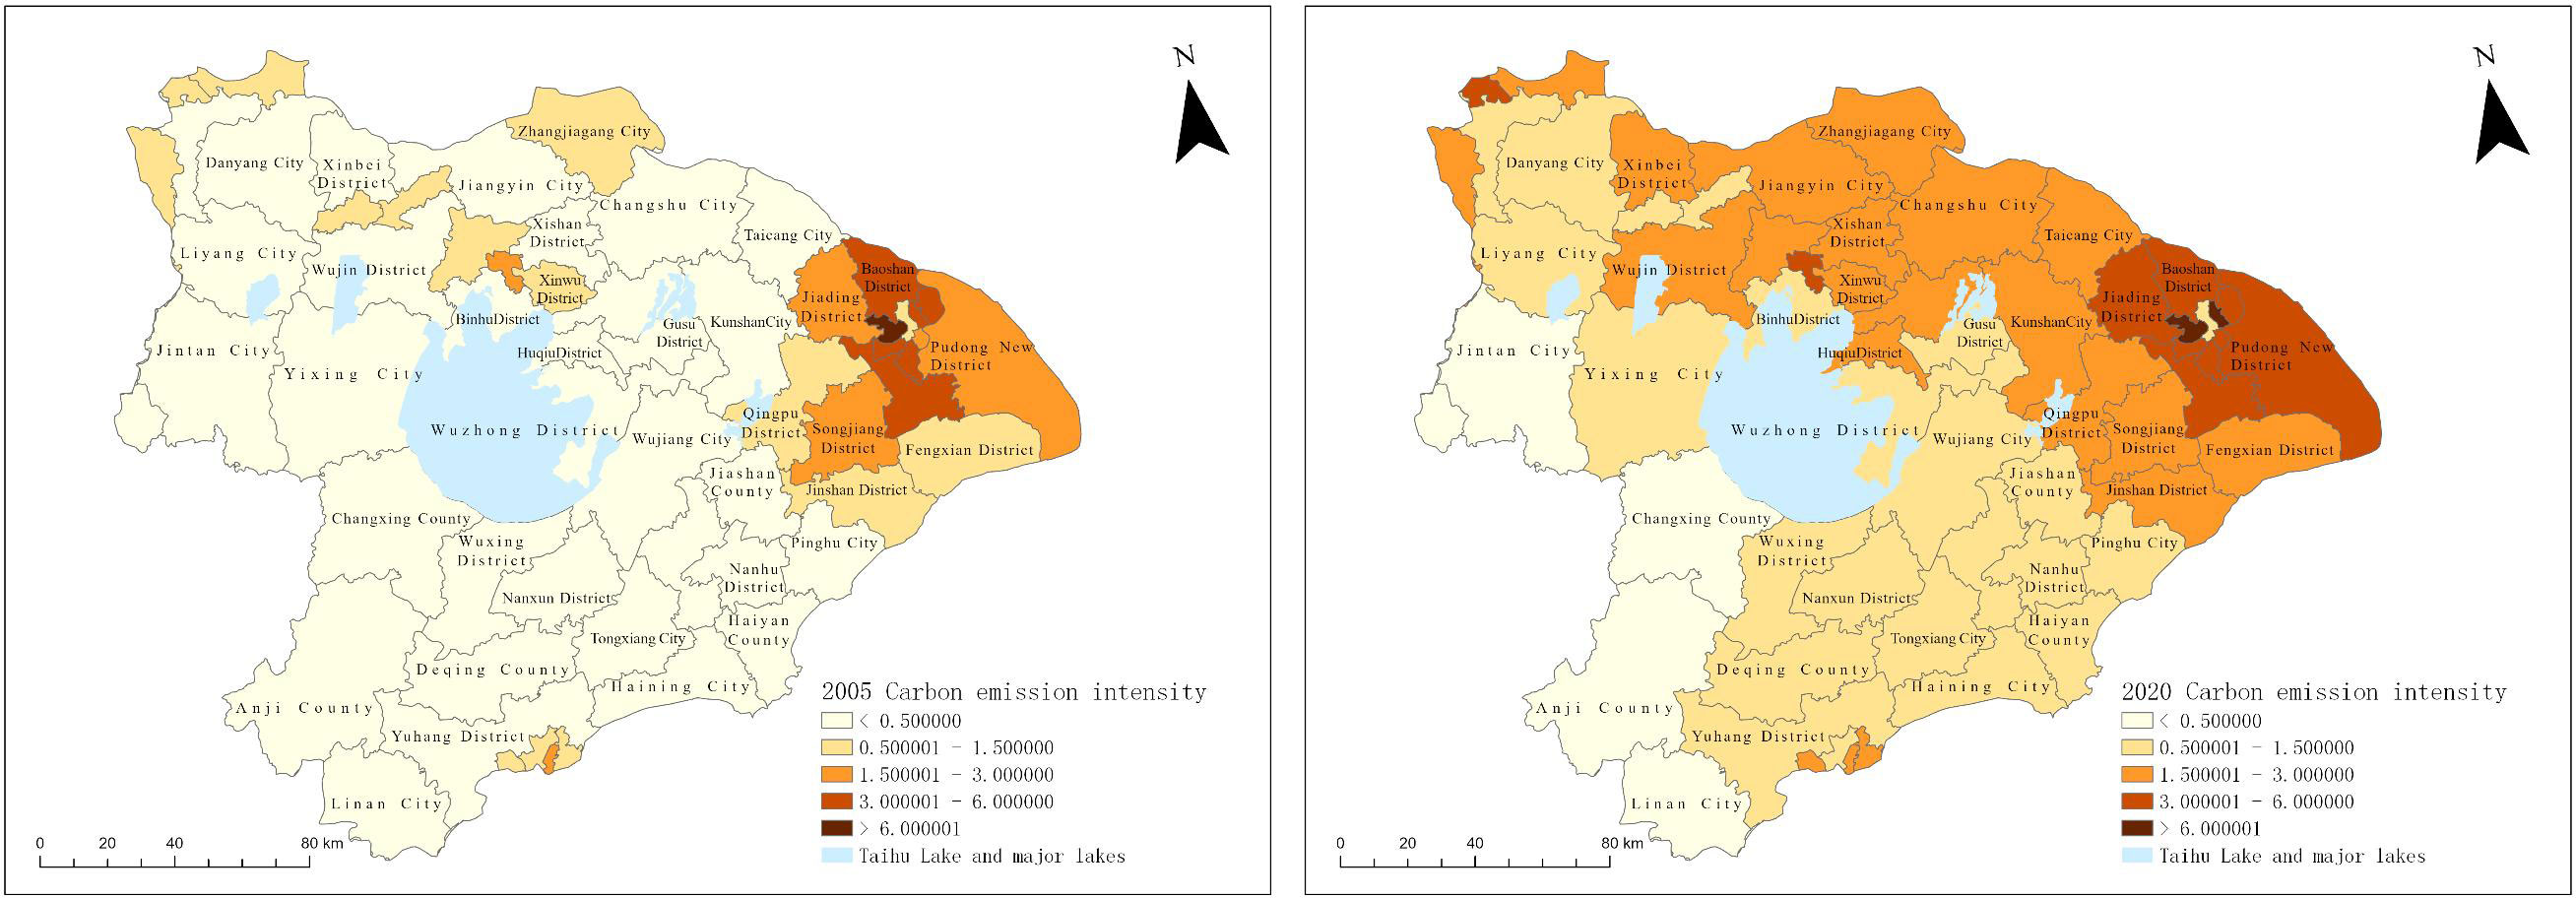
Figure 3 Carbon emission intensity from 2005 to 2020 in the Taihu Lake Basin.
3.2 Carbon uptake and its spatiotemporal characteristics in the Taihu Lake Basin
From 2005 to 2020, the total carbon absorption exhibited a fluctuating growth trend, rising from 82.3503 million tons in 2005 to 85.6488 million tons in 2020, with an average annual growth rate of 0.26% (Figure 4). This increase can be segmented into three stages: 2005 to 2008, during which absorption declined with an average annual growth rate of -3.1%; 2009 to 2011, characterized by relatively stable absorption and an average annual growth rate of -0.42%; and 2012 to 2020, when absorption experienced rapid growth with an average annual growth rate of 0.18%. Examining different regions within the basin, Jiangsu Province exhibited a fluctuating growth trend in carbon absorption from 2005 to 2020, with an average annual growth rate of 0.31%, resulting in an annual carbon absorption of 39.1067 million tons in 2020, ranking first in terms of carbon absorption. Zhejiang Province ranked second, with a carbon absorption of 35.4185 million tons, also following a fluctuating growth trend from 2005 to 2020 but with a higher average annual growth rate of 0.43% compared to Jiangsu Province. Shanghai experienced a fluctuating downward trend in carbon absorption from 2005 to 2020, with an average annual growth rate of -0.32%. The variability in carbon uptake across the basin is evident, likely due to the varying regions and land use types. This has been confirmed by numerous studies (Houghton et al., 2012; Gui et al., 2023).
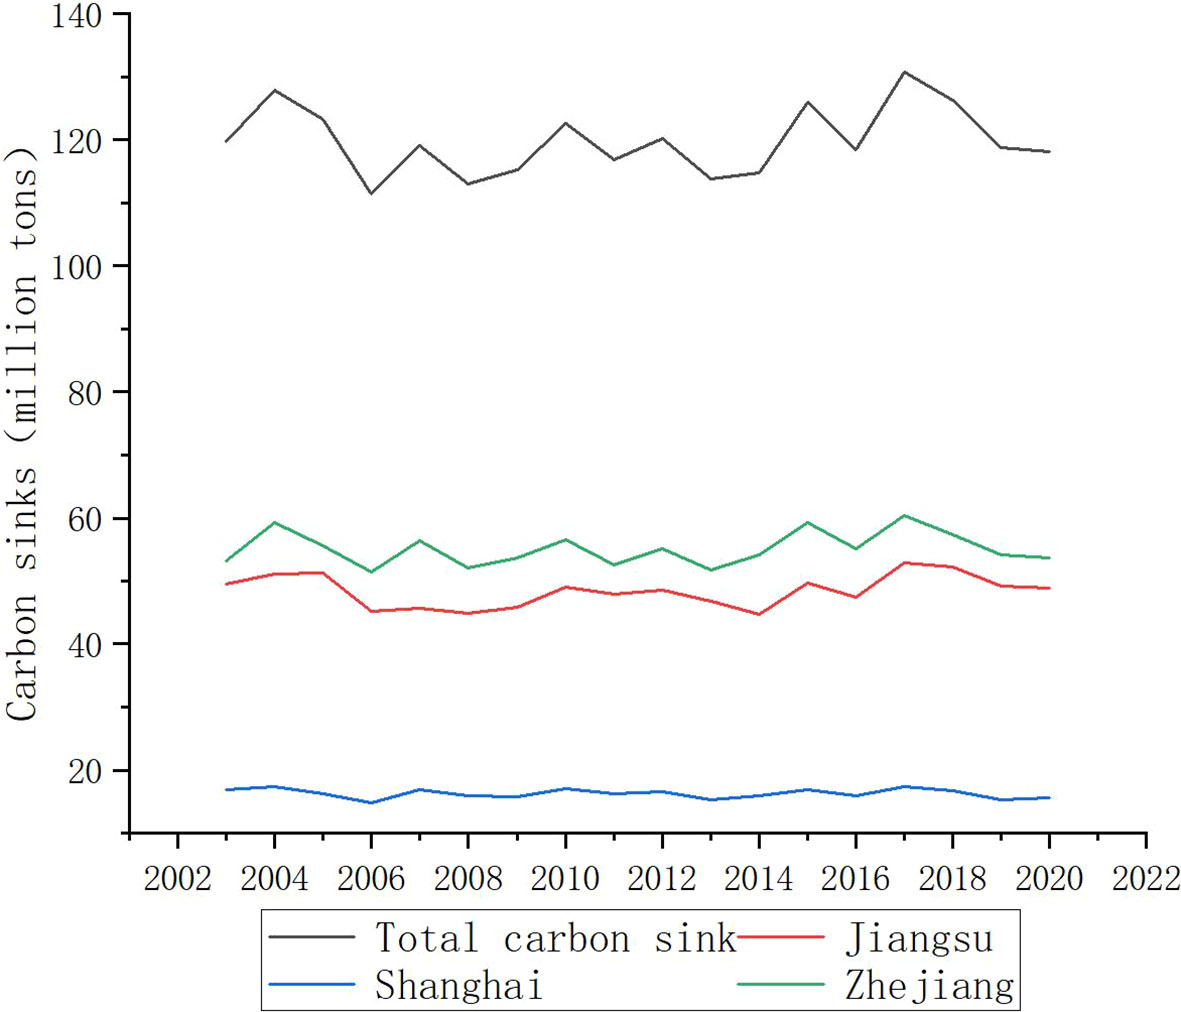
Figure 4 Carbon uptake trend in the Taihu Lake Basin from 2005 to 2020.
The changes in carbon absorption intensity among the districts and counties of the Taihu Lake Basin exhibited significant fluctuations during the period from 2005 to 2020 (Figure 5). In 2005, areas with high carbon absorption were primarily concentrated in the western and southeastern margins of the basin, with three districts and counties showing carbon absorption intensities above 0.5: Jurong City, Pinghu City, and Xinwu District. During this period, nine districts and counties displayed a carbon absorption intensity below 0.1, mostly comprising large cities in the central part of the basin. By 2020, 31 districts and counties in the western and southeastern regions demonstrated varying degrees of increase in carbon absorption intensity, while the number of districts and counties with carbon absorption intensities below 0.1 increased to 11, and the carbon absorption intensity in the urban cores further decreased. The carbon absorption intensity in the watershed exhibited a pattern of high intensity around the perimeter and low intensity within the urban core located in the middle. Overall, the pattern displayed lower intensity in the central area and higher intensity in the surrounding regions, accompanied by significant topographical differences.
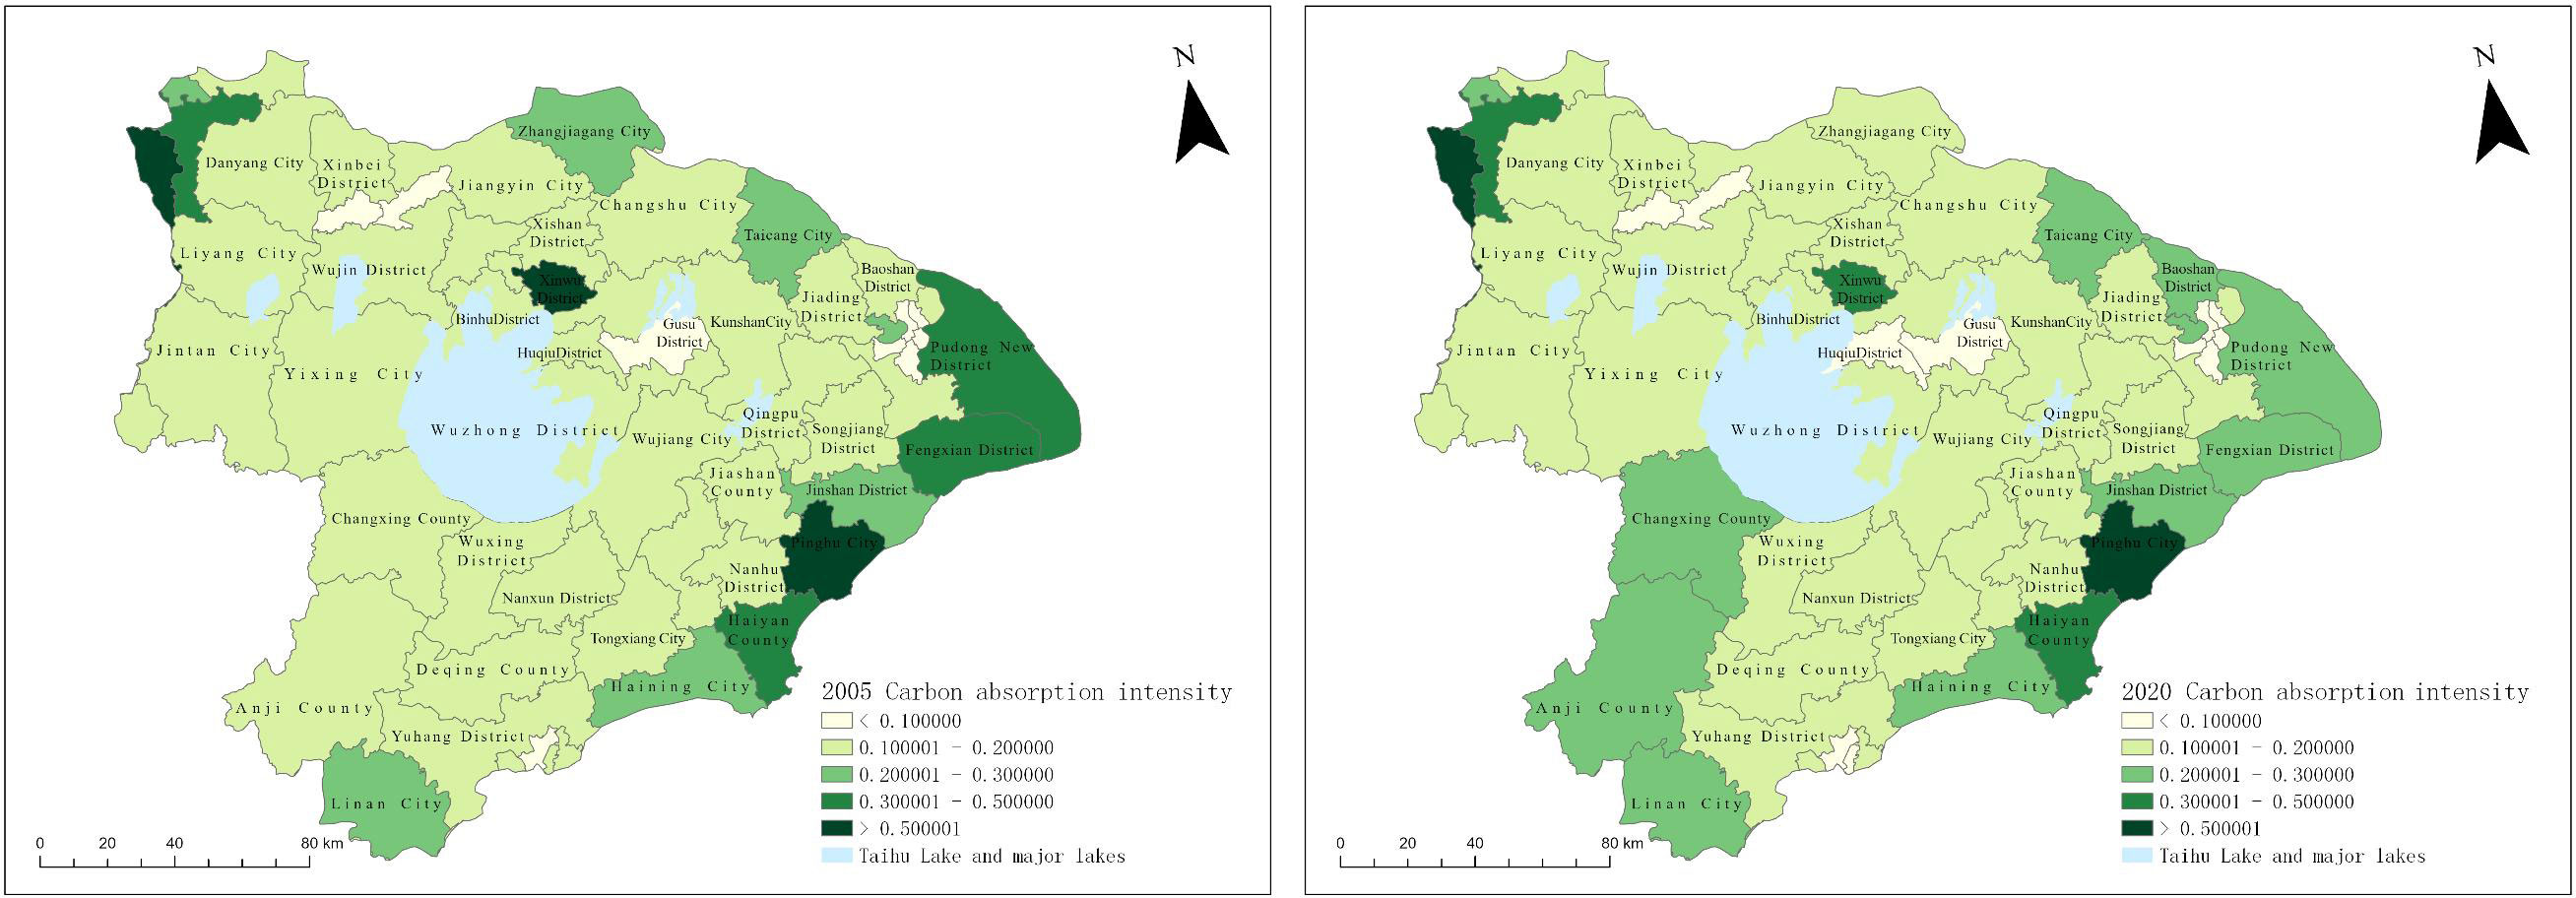
Figure 5 Carbon uptake intensity map for the Taihu Lake Basin from 2005 to 2020.
3.3 Analysis of spatiotemporal ECC and ESC characteristics in the Taihu Lake Basin
The results are presented in Table 1. The mean values of the carbon emission economic contribution coefficient (ECC) for the entire basin exhibited a downward trend, decreasing from 2.84 to 2.69 over the four time periods of 2005, 2010, 2015, and 2020. Shanghai consistently ranked first across all four periods, while Zhejiang Province surpassed Jiangsu Province to secure the second position. In Shanghai, the average ECC dropped to 5.37 in 2015 and then increased to 7.52 in 2020, indicating an overall growth trend. Conversely, Jiangsu Province experienced a continuous decline in the average ECC, dropping from 1.8 to 0.73. As for Zhejiang Province, the average ECC rose to 2.22 in 2015 and then declined to 1.86 in 2020, signifying an overall increase. Shanghai exhibited significantly higher ECC values compared to Jiangsu and Zhejiang, indicating superior economic efficiency and energy utilization during this period. Turning to the carbon ecological carrying coefficient (ESC), the average value for the four time periods decreased from 1.46 in 2005 to 1.25 in 2020, displaying a noticeable downward trend. Zhejiang Province ranked first, followed by Jiangsu Province, while Shanghai had the lowest average ESC. Shanghai’s average ESC value steadily increased, while Jiangsu Province displayed a downward trend on an annual basis. In contrast, Zhejiang Province maintained a relatively stable average ESC value, suggesting a higher carbon sink capacity compared to Jiangsu Province and Shanghai.
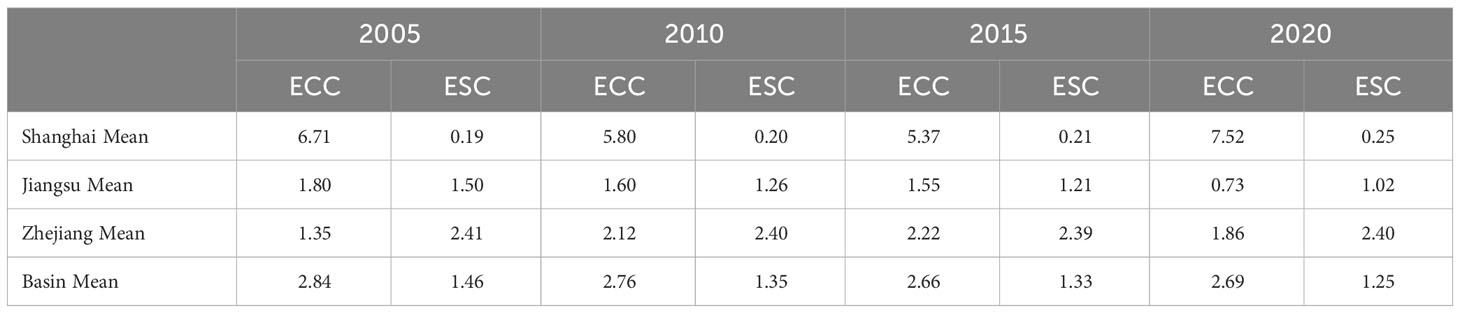
Table 1 Average ECC and ESC values from 2005 to 2020 in the Taihu Lake Basin.
In order to provide a more comprehensive understanding of the differences observed in the ECC and ESC across different regions over time, the analysis focused on the time periods of 2005, 2010, 2015, and 2020, and nuclear density curves were plotted (Figures 6, 7). The ECC exhibited a clear unimodal pattern in all four periods, with the majority of values below 1. The degree of polarization was high in 2005, slightly decreased in 2010, and then increased again in 2020. Overall, there was a rightward shift from 2005 to 2020, indicating a downward trend in the basin’s ECC. The ESCs showed significant elongation in all four periods, suggesting an increasing divergence in the ESCs and expanding spatial disparities in ecological carrying capacity within the watershed. Most ESC values for the four time periods were above 1, indicating a right-skewed distribution and higher ESCs from 2005 to 2020. The curve for the period between 2010 and 2015 exhibited a bimodal pattern, with peaks around one and three. The first peak was notably higher than the second, suggesting a relatively low degree of polarization in ESCs during this period. The curve narrowed in 2020, indicating a higher degree of polarization in ESCs during this period. From 2015 to 2020, the nuclear density curve remained relatively stable, but the density of ESCs above 3 decreased significantly, indicating an overall decline in ESC. These findings illustrate that rapid social development has led to varying degrees of ecosystem damage attributable to increased human activity. This observation aligns with prior research results (Cui et al., 2018).
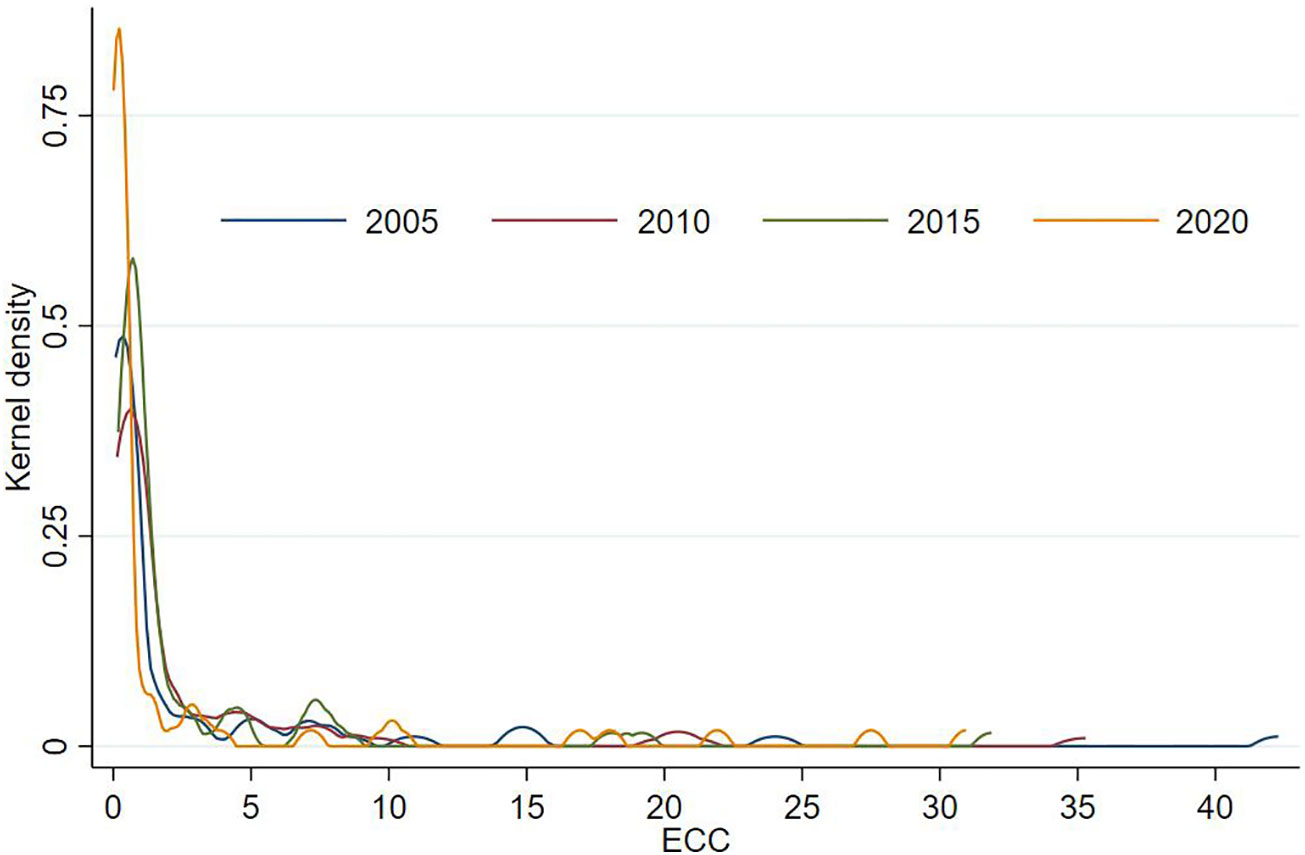
Figure 6 ECC core density map for Taihu Lake basin.
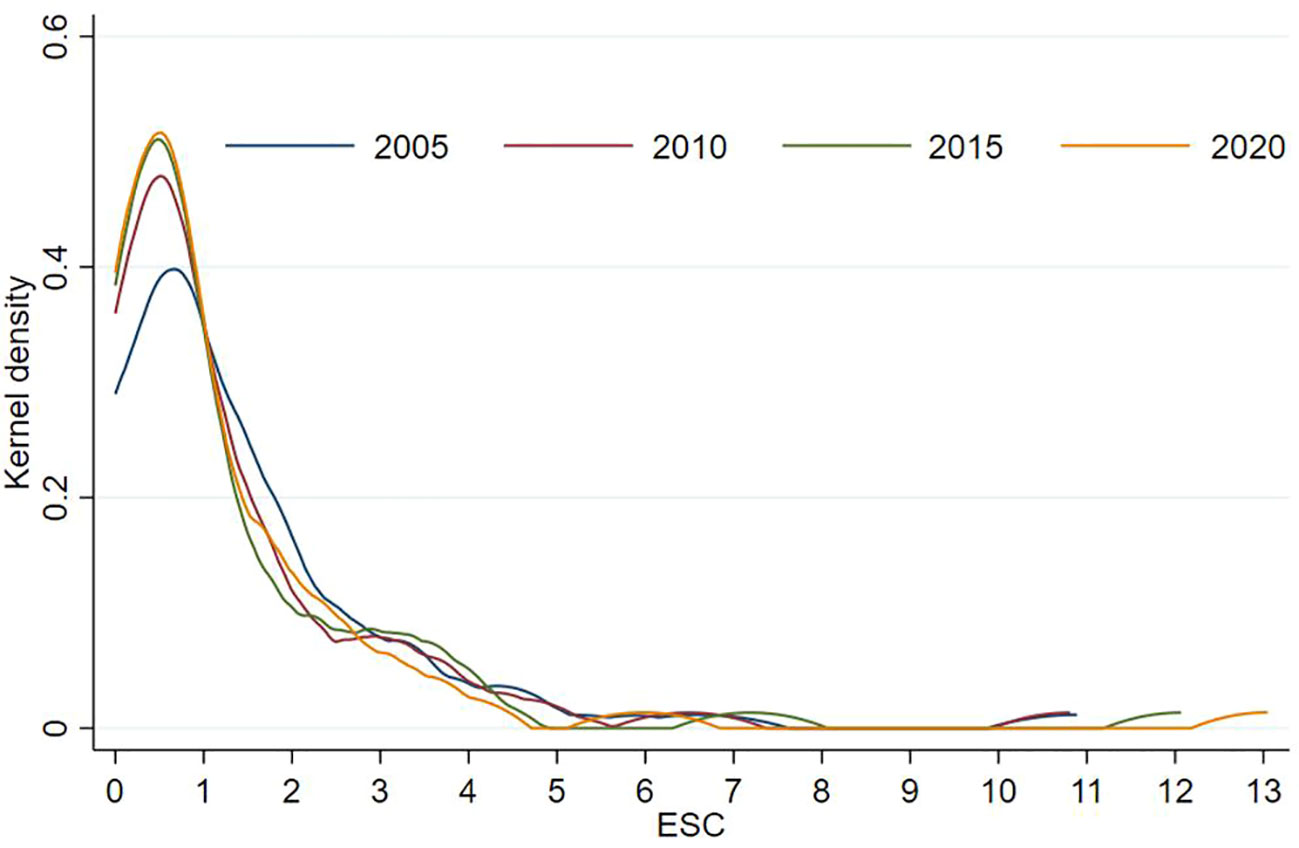
Figure 7 ESC core density map for Taihu Lake basin.
3.4 Carbon balance zoning in the Taihu Lake Basin
The carbon balance zones were identified for the years 2005, 2010, 2015, and 2020, and a comparative analysis was conducted based on administrative divisions. Through calculations of total carbon emissions, carbon emission intensity, economic contribution rate, and ecological carrying coefficient for each district and county, the basin was classified into four distinct areas: the carbon balance area, carbon intensity control area, carbon sink functional zone, and high-carbon optimization zone. The carbon balance area encompasses counties and cities with ECC > 1 and ESC > 1. These regions exhibit either low total carbon emissions or low carbon emissions per unit of GDP, high carbon absorption, and relatively limited ecological pressure. The carbon intensity control areas consist of counties and cities where ECC > 1 and ESC< 1. Despite their economic development, these districts and counties have relatively small carbon emissions per unit of GDP but face challenges due to insufficient ecosystem planning and construction, resulting in high overall carbon emissions. The carbon sink functional areas comprise districts and counties with low absorption and ecological carrying coefficients, characterized by ECC< 1 and ESC > 1. These regions experience high carbon emissions per unit of GDP and possess extensive economies, but their total carbon emissions remain low due to favorable ecological conditions. Lastly, the high carbon optimization areas include counties and cities with ECC< 1 and ESC< 1. These regions exhibit high carbon absorption and low ecological pressure; however, they face challenges of relatively large total carbon emissions or high carbon emissions per unit of GDP, coupled with lower carbon absorption. The findings are presented in Figure 8.
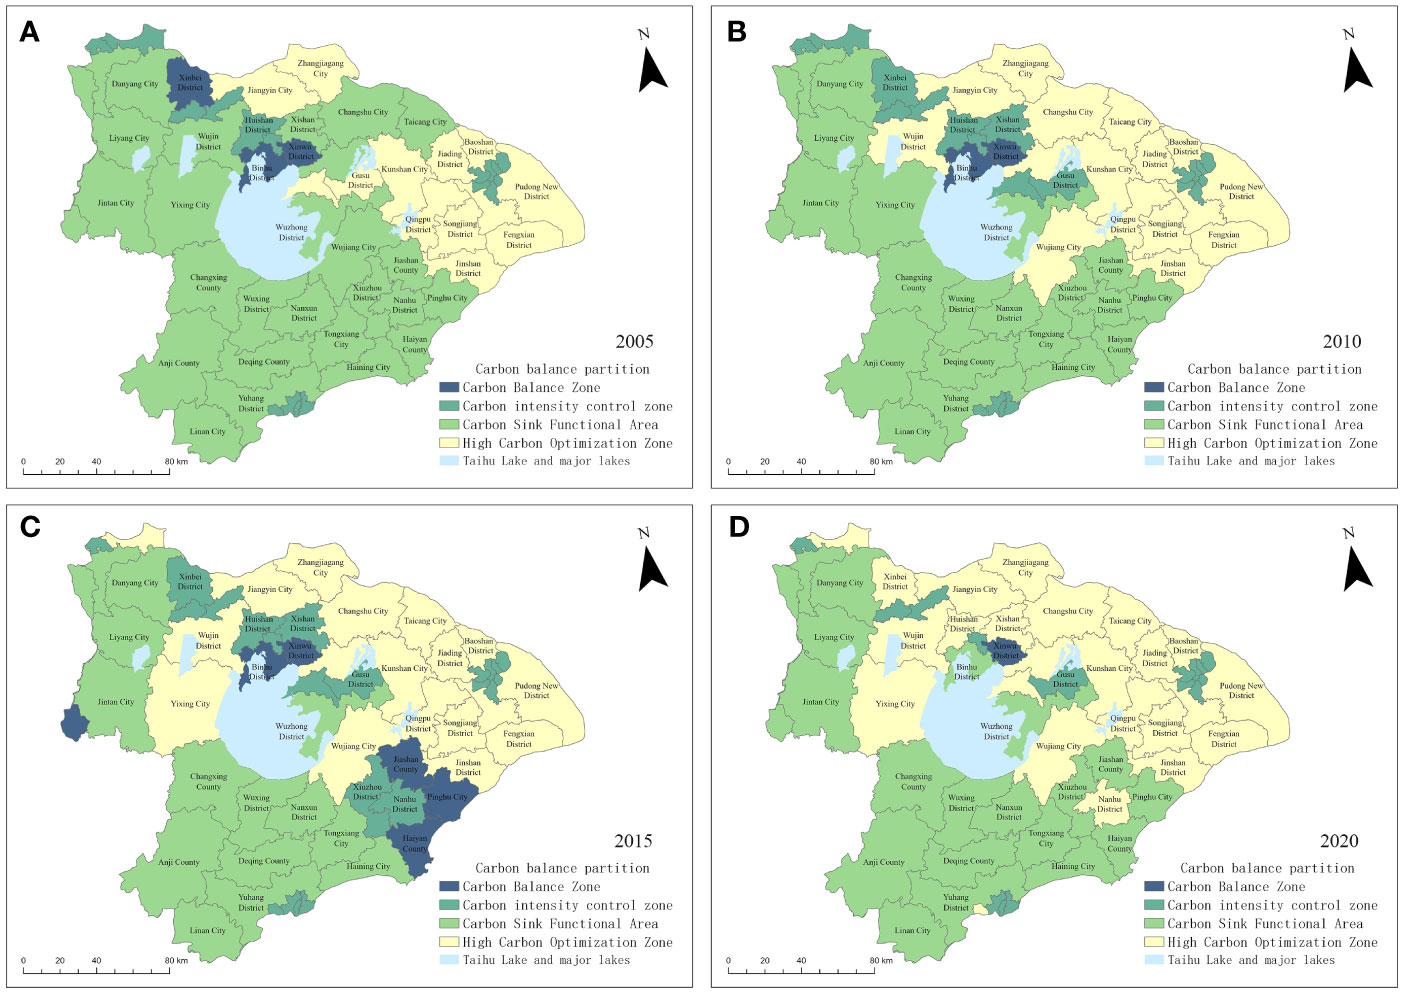
Figure 8 Regional map showing the carbon balance in the Taihu Lake Basin in (A) 2005, (B) 2010, (C) 2015, and (D) 2020.
From a basin-wide perspective, the spatial characteristics reveal that the eastern and northern areas, primarily Shanghai, exhibit high carbon emission intensity but low carbon absorption intensity. Improving carbon reduction technologies in the region is the most important. There are two types of areas: high-carbon optimization and carbon intensity control. The western and southern areas, on the other hand, display low carbon emission intensity and high carbon absorption intensity. Additionally, there are two types of areas: carbon sink function and carbon balance. Over the 15-year period from 2005 to 2020, the number of carbon balance areas, where ECC>1 and ESC>1, decreased from 3 in 2005 to 1 in 2020, constituting only 1.59% of the total area. Compared to other regions, these areas not only demonstrate high carbon emission economic efficiency but also exhibit high carbon offset rates. The number of carbon intensity control areas, with ECC>1 and ESC<1, decreased to 15 in 2020, accounting for 23.81% of the total area. Most of these areas consist of municipal districts in various cities with relatively developed economies and high carbon intensity. Despite their greater economic contributions, these regions had relatively low ecological carrying coefficients, indicating a lack of harmony between economic development and ecological sustainability. The number of carbon sink functional areas, with ECC<1 and ESC>1, decreased from 30 in 2005 to 23 in 2020, accounting for 36.51% of the total area. These areas exhibit relatively poor economic efficiency and small economic contribution coefficients. However, they have extensive crop planting areas, abundant forest resources, high carbon absorption, and higher carbon compensation rates compared to other regions. The number of high carbon-optimized areas, where ECC<1 and ESC<1, increased from 13 in 2005 to 24 in 2020, comprising 38.10% of the total area. These areas demonstrate low economic efficiency, relatively limited ecological carrying capacities, and carbon sink capacities significantly lower than the carbon emissions resulting from human activities.
3.5 Analysis of ecological and economic factors influencing carbon balance based on MGWR
The MGWR model utilizes the modified AICc as its criterion for bandwidth selection. The bandwidth in this model is defined as the number of sample points involved in the regression, thereby influencing the regression coefficients. In this study, the bandwidth unit is determined by the number of districts, indicating the level of influence for a specific variable. To derive meaningful calculation outcomes, the model incorporates various indicators include population density, per capita GDP, construction land area, cultivated land area, forest area, grassland area, water area, and others (Chikaraishi et al., 2015; Shahbaz et al., 2016).The VIFs of the explanatory variables are all less than 10, and there is no multicollinearity. The obtained results reveal R2 and adjusted R2 values of 0.934 and 0.907, respectively, indicating a substantial fit of the MGWR model to the actual circumstances (Table 2).
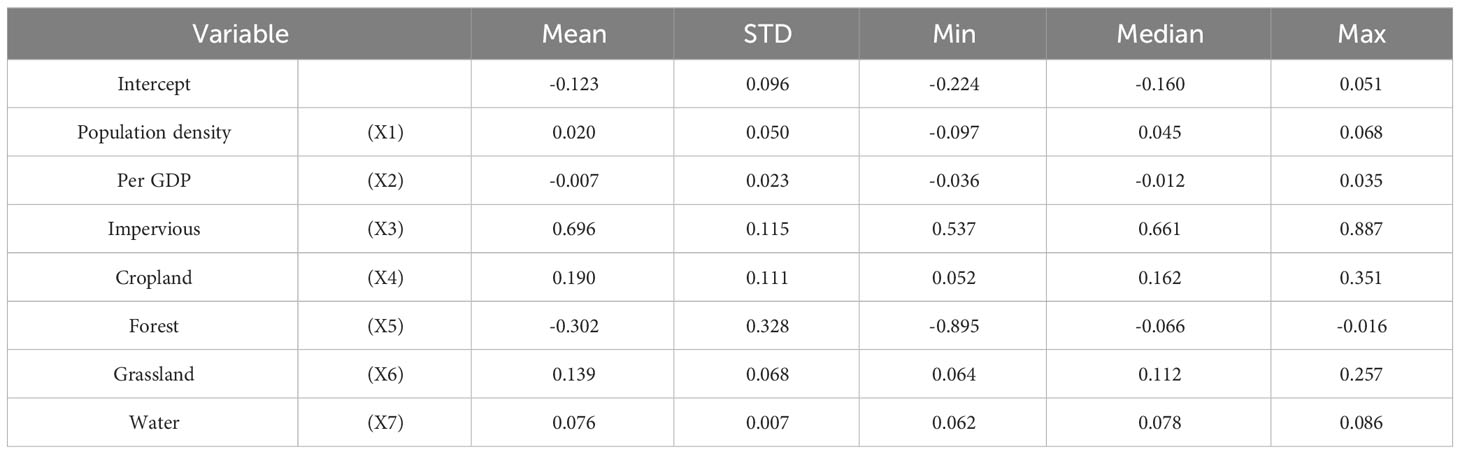
Table 2 Statistical description of regression coefficients in the MGWR model.
In general, the regression coefficient for urban construction land ranges from 0.537 to 0.887, demonstrating a positive correlation in various regions. The mean regression coefficient of 0.696 reveals a notable impact on the elevation of carbon emission intensity, suggesting that regions characterized by urban construction land tend to produce heightened levels of carbon emissions (refer to Figure 9A). The presence of compact urban construction land contributes to the mitigation of urban carbon emissions. Analogous findings are supported by Onafowora and Owoye (2014). Notably, the cities in Shanghai have experienced considerable urbanization, resulting in a distinct spatial differentiation pattern where high-emission areas are predominantly situated in the eastern region. Conversely, the carbon emission intensity in the southwestern part of the watershed, which is less impacted by urban construction, remains relatively low compared to the rest of the watershed. Specifically, the presence of urban construction areas exerts a substantial impact on carbon emissions in the eastern region, where Shanghai is located, contributing to higher carbon emission intensity in this area relative to the remainder of the watershed.
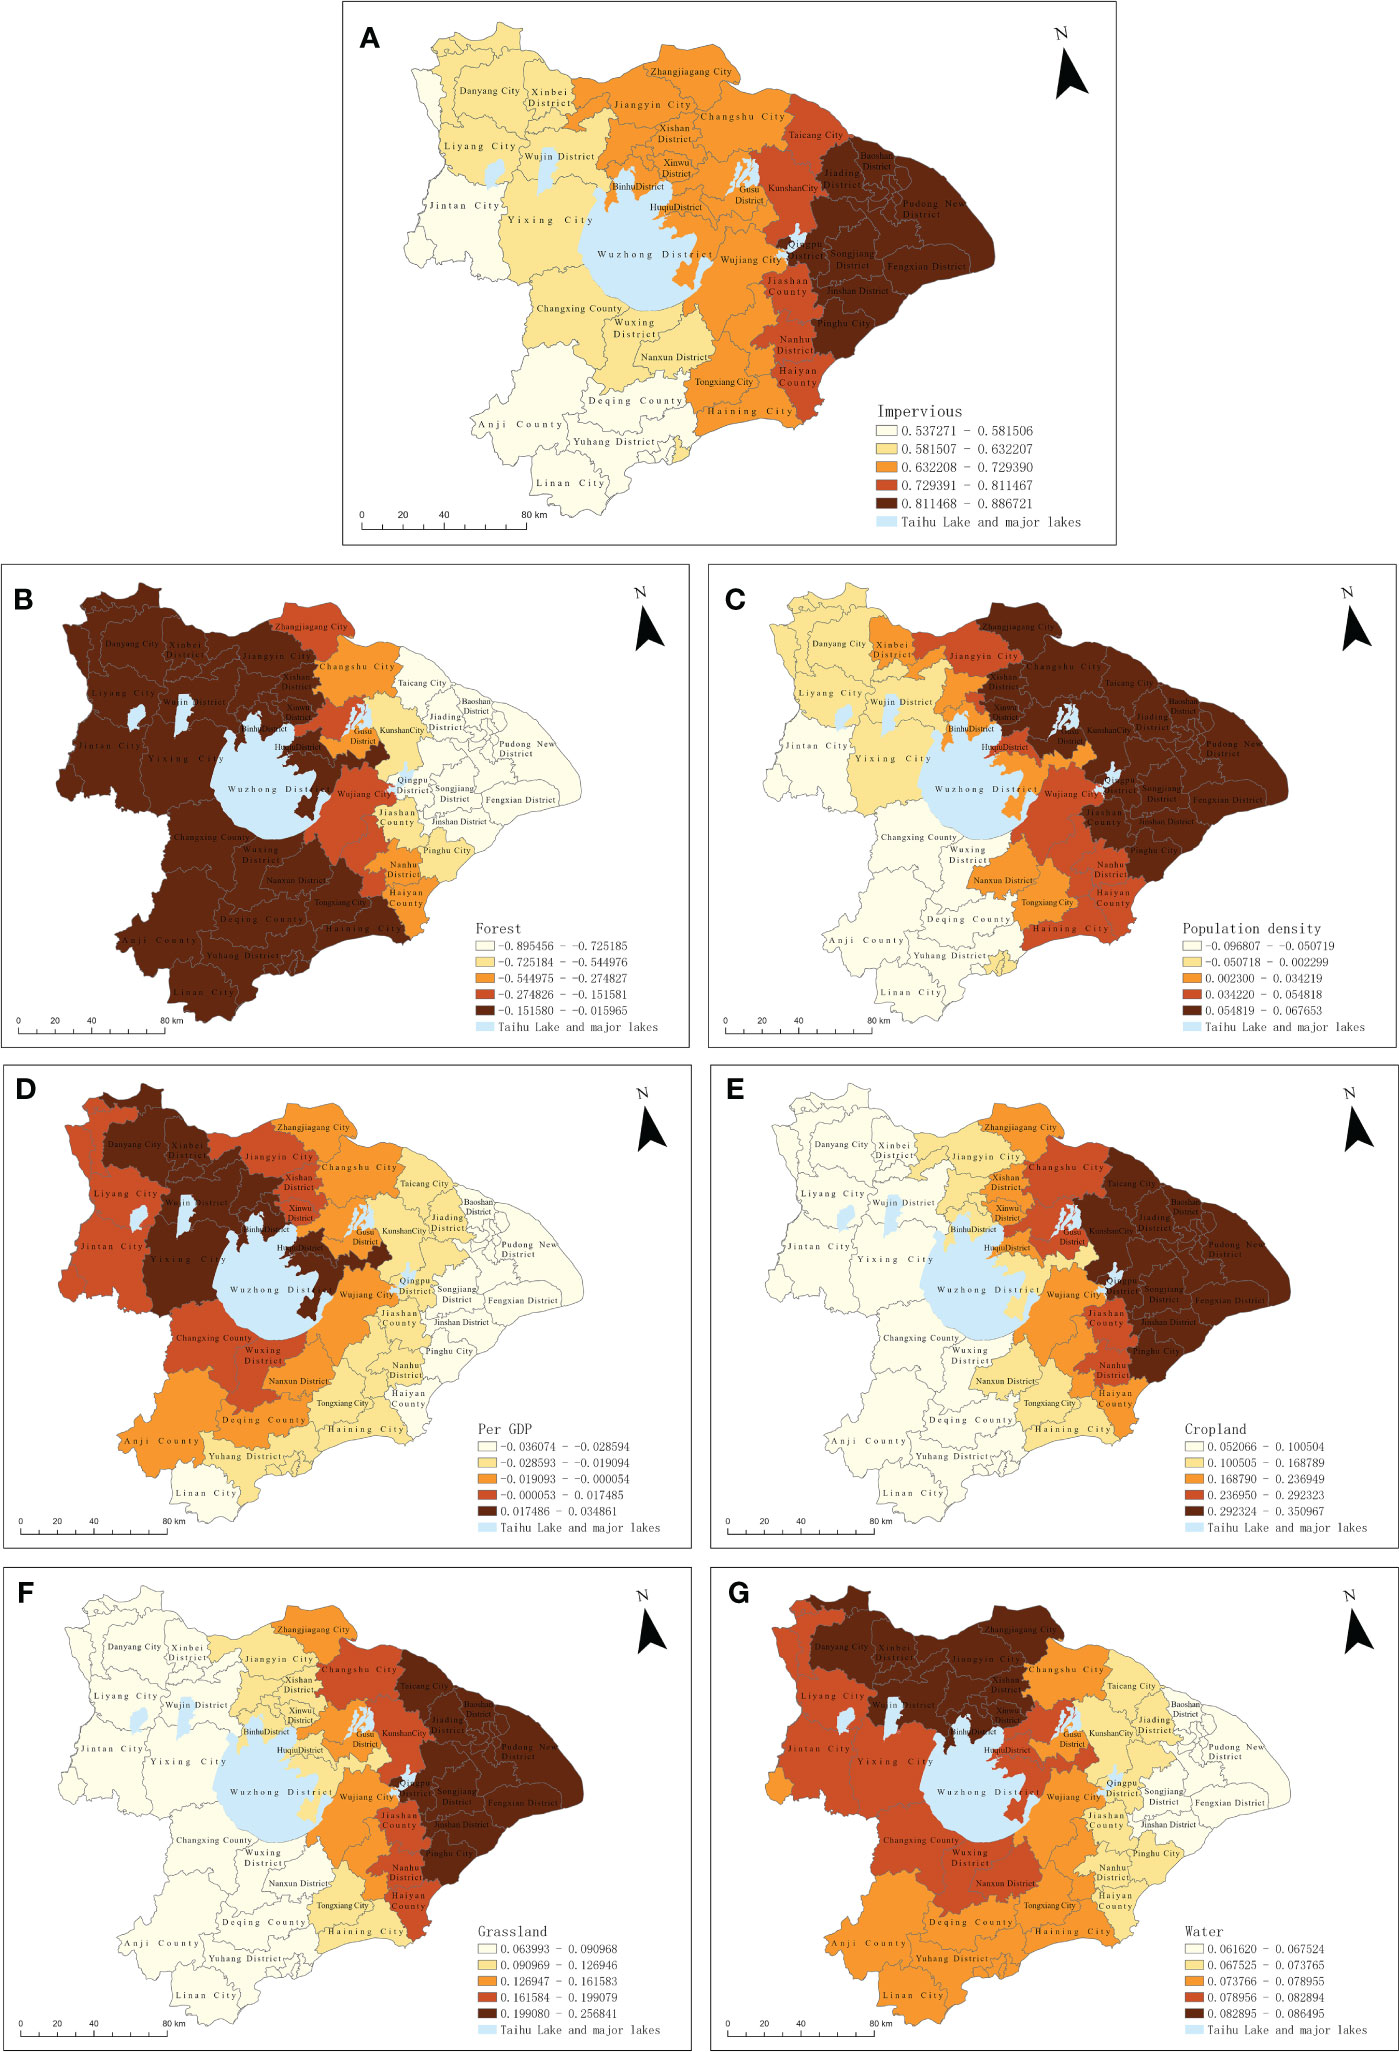
Figure 9 Spatial distribution pattern of MGWR regression coefficients. (A) Impervious, (B) Forest, (C) Population density, (D) Per GDP, (E) Cropland, (F) Grassland, (G) Water.
The regression coefficients associated with forest area in the Taihu Lake Basin exhibited a range of -0.016 to -0.895, indicating negative values across various spatial ranges (Figure 9B). The average regression coefficient of -0.302 significantly contributes to an increase in carbon absorption intensity. These findings suggest that a larger forest area corresponds to a higher carbon absorption intensity (Tang et al., 2023). Forest ecosystems have the function of fixing carbon and storing carbon. The positive impact of forests on carbon absorption intensity reveals a spatial differentiation pattern, characterized by higher values in the western regions and lower values in the eastern regions. In the Taihu Lake Basin, the western areas, primarily governed by Jiangsu and Zhejiang, feature abundant low mountains, hills, dense vegetation, larger forest areas, and a high carbon absorption intensity, making them significant contributors to carbon absorption. Conversely, the eastern part of the watershed, which is dominated by major cities such as Shanghai, exhibits lower forest coverage and the lowest carbon sequestration intensity.
The regression coefficients for population density across distinct regions within the basin exhibit a range from -0.097 to 0.068, indicative of varied impact outcomes. The average regression coefficient, standing at 0.020, contributes to an overarching escalation in carbon emission intensity across the basin, as illustrated in Figure 9C. More specifically, in the northeastern watershed predominantly under the jurisdiction of Shanghai, the regression coefficient associated with population density amplifies the overall carbon emission intensity. In contrast, within the southwestern segment of the watershed, primarily governed by Zhejiang Province, the regression coefficient linked to population density significantly influences carbon absorption intensity, resulting in a positive effect. This observation aligns with the findings reported by Qin et al. (2019).
The regression coefficients for per capita GDP, ranging from -0.036 to 0.035, demonstrate diverse effects on carbon emission intensity and carbon absorption intensity in different regions. The influence of economic development on carbon emissions exhibits a non-linear pattern, aligning with findings from prior research (Poumanyvong and Kaneko, 2010). The average regression coefficient of -0.007 enhances the carbon absorption intensity, as depicted in Figure 9D. Notably, the areas within the watershed experiencing the most substantial increase in carbon absorption, according to the regression coefficient for per capita GDP, are primarily located in the southeast, encompassing Shanghai and Zhejiang Province. This suggests that these regions, characterized by a combination of technological innovation and economic development, optimize their industrial growth, aligning with the findings of Coondoo and Dinda (2008). Furthermore, the intensity of carbon emissions has progressively decreased, while the intensity of carbon absorption has gradually increased. In the northwestern part of the basin, primarily represented by Jiangsu Province, the regression coefficient of per capita GDP amplifies the carbon emission intensity, reflecting a slightly lower level of economic development compared to eastern Shanghai in this specific region.
The regression coefficient for cultivated land area ranges from 0.052 to 0.351, while the plot regression coefficient for grassland area ranges from 0.064 to 0.257. These coefficients exhibit positive values across different spatial ranges, with average regression coefficients of 0.190 and 0.139, respectively. The slight enhancement in these coefficients suggests a relatively similar distribution of influence (Figures 9E, F). Within the watershed, areas experiencing the most significant enhancement in carbon absorption, attributed to the cultivated land area coefficient and the grassland area coefficient, are primarily situated in the eastern part of the watershed, dominated by Shanghai. On the contrary, the western segment of the watershed, comprising Jiangsu and Zhejiang Provinces, exhibits a notable rise in carbon emissions concerning the coefficients of cultivated land area and grassland area. The extensive exploitation of arable land is identified as a factor contributing to the escalation in carbon emissions (Luo et al., 2020).
The regression coefficient for water area ranges from 0.062 to 0.086, consistently exhibiting positive values across all regions, and yielding an average regression coefficient of 0.076. This positive coefficient is indicative of its role in augmenting carbon emissions, as depicted in Figure 9G. Within the watershed, noteworthy amplification in carbon absorption, attributed to the water area coefficient, is predominantly observed in the northern segment between the Yangtze River and Taihu Lake. These areas delineate a ring-like structure, with the intensity of carbon emissions impact diminishing progressively in outward spatial progression. Notably, the water area coefficient exerts the weakest effect on carbon emissions in the eastern part of the watershed, dominated by Shanghai.
4 Conclusions
From 2005 to 2020, the cumulative carbon emissions in the Taihu Lake Basin witnessed an annual upswing, reaching 523.2451 million tons. Throughout this timeframe, the total carbon emissions consistently exceeded the overall carbon absorption. Districts and counties within the Taihu Lake Basin manifested divergent spatial attributes regarding carbon emissions and absorption.
The carbon equilibrium delineation in the Taihu Lake Basin is intricately linked to the socio-economic scale of each unit. The eastern and northern sectors of the basin, centered around Shanghai, predominantly constitute zones marked by high-carbon optimization and carbon intensity control. These regions exhibit elevated carbon emission intensity coupled with diminished carbon absorption intensity.
In the Taihu Lake Basin, urbanized areas emerge as the primary contributors to carbon emissions, while forested areas play a pivotal role in carbon absorption. Both population size and density exhibit robust positive correlations with CO2 emission levels. Larger population sizes correlate with heightened energy consumption and increased CO2 emissions. Per capita GDP, forest area, arable land area, grassland area, and water area are pivotal determinants influencing carbon absorption within the basin.
Data availability statement
The raw data supporting the conclusions of this article will be made available by the authors, without undue reservation.
Author contributions
YzW: conceptualization, software, validation, writing—original draft preparation, review and editing. YxW: formal analysis, data curation, writing—original draft preparation, project administration. XD: validation, visualization, supervision, funding acquisition. All authors contributed to the article and approved the submitted version.
Funding
The author(s) declare that no financial support was received for the research, authorship, and/or publication of this article.
Acknowledgments
We would like to acknowledge the reviewers for their helpful comments on this paper.
Conflict of interest
The authors declare that the research was conducted in the absence of any commercial or financial relationships that could be construed as a potential conflict of interest.
Publisher’s note
All claims expressed in this article are solely those of the authors and do not necessarily represent those of their affiliated organizations, or those of the publisher, the editors and the reviewers. Any product that may be evaluated in this article, or claim that may be made by its manufacturer, is not guaranteed or endorsed by the publisher.
References
Abd Rashid A. F., Yusoff S. (2015). A review of life cycle assessment method for building industry. Renew. Sustain. Energy Rev. 45, 244–248. doi: 10.1016/j.rser.2015.01.043
Acquaye A. A., Duffffy A. P. (2010). Input–output analysis of Irish construction sector greenhouse gas emissions. Build Environ. 45, 784–791. doi: 10.1016/j.buildenv.2009.08.022
Al-Arkawazi S. A. F. (2018). Measuring the inflfluences and impacts of signalized intersection delay reduction on the fuel consumption, operation cost and exhaust emissions. Civ Eng. J. 4, 552. doi: 10.28991/cej-0309115
Anderson W. P., Kanaroglou P. S., Miller E. J. (1996). Urban form, energy and the Environment: a review of issues, evidence and policy. Urban Stud. 33, 7–35. doi: 10.1080/00420989650012095
Arima C., Hanai T., Okamoto M. (2003). Gene expression analysis using fuzzy k-means clustering. Genome Inf. 14, 334–335. doi: 10.11234/gi1990.14.334
Auffffhammer M., Carson R. T. (2008). Forecasting the path of China’s CO2 emissions using province-level information. J. Environ. Econ Manag. 55, 229–247. doi: 10.1016/j.jeem.2007.10.002
Brunsdon C., Fotheringham A. S., Charlton M. E. (2002). Geographically weighted summary statistics—a framework for localised exploratory data analysis. Comput. Environ. Urban Syst. 26, 501–524. doi: 10.1016/S0198-9715(01)00009-6
Chen J., Zhou C., Wang S., Hu J. (2018). Identifying the socioeconomic determinants of population exposure to particulate matter (PM2.5) in China using geographically weighted regression modeling. Environ. Pollut. 241, 494–503. doi: 10.1016/j.envpol.2018.05.083
Chen X., Lin B. (2021). Towards carbon neutrality by implementing carbon emissions trading scheme: Policy evaluation in China. Energy Pol. 157, 112510. doi: 10.1016/j.enpol.2021.112510
Chikaraishi M., Fujiwara A., Kaneko S. (2015). The moderating effects of urbanization on carbon dioxide emissions: a latent class modeling approach. Technol. Forecast Soc. Change 90, 302–317. doi: 10.1016/j.techfore.2013.12.025
Chowdhury R. R. (2012). Revisiting the Environmental Kuznets curve: an introduction to the special issue. Appl. Geogr. 1, 1–2. doi: 10.1016/j.apgeog.2010.11.010
Chuai X., Huang X., Wang W., Wen J., Chen Q., Peng J. (2012). Spatial econometric analysis of carbon emissions from energy consumption in China. J. Geogr. Sci. 22, 630–642. doi: 10.1007/s11442-012-0952-z
Coondoo D., Dinda S. (2008). Carbon dioxide emission and income. A temporal analysis of cross-country distributional patterns. Ecol. Econ 65, 375–385. doi: 10.1016/j.ecolecon.2007.07.001
Corrado L., Fingleton B. (2012). Where is the economics in spatial econometrics? J. Reg. Sci. 52, 210–239. doi: 10.1111/j.1467-9787.2011.00726.x
Cui Y., Li L., Chen L., Zhang Y., Cheng L., Zhou X., et al. (2018). Land-use carbon emissions estimation for the Yangtze River Delta Urban Agglomeration using 1994–2016 Landsat image data. Remote Sens-basel 10 (9), 1334. doi: 10.3390/rs10091334
Davis S. J., Caldeira K. (2010). Consumption-based accounting of CO2 emissions. Proc. Natl. Acad. Sci. 107, 5687–5692. doi: 10.1073/pnas.0906974107
Dhakal S. (2009). Urban energy use and carbon emissions from cities in China and policy implications. Energ. Policy 37, 4208–4219. doi: 10.1016/j.enpol.2009.05.020
Dong F., Li J., Wang Y., Zhang X., Zhang S., Zhang S. (2019). Drivers of the decoupling indicator between the economic growth and energy-related CO2 in China: a revisit from the perspectives of decomposition and spatiotemporal heterogeneity. Sci. Total Environ. 685, 631–658. doi: 10.1016/j.scitotenv.2019.05.269
Dong F., Yu B., Tergel H., Dai Y., Wang Y., Zhang S., et al. (2018). Drivers of carbon emissions intensity change in China. Resour. Conserv. Recy 129, 187–201. doi: 10.1016/j.resconrec.2017.10.035
Feng Y. Y., Chen S. Q., Zhang L. X. (2013). System dynamics modeling for urban energy consumption and CO2 emissions: A case study of Beijing, China. Ecol. Model. 252, 44–52. doi: 10.1016/j.ecolmodel.2012.09.008
Fotheringham A. S., Yang W., Kang W. (2017). Multiscale geographically weighted regression (MGWR). Ann. Am. Assoc. Geogr. 107, 1247–1265. doi: 10.1080/24694452.2017.1352480
Friedlingstein P., Houghton R. A., Marland G., Hackler J., Boden T. A., Conway T. J., et al. (2010). Update on CO2 emissions. Nat. Geosci. 3, 811. doi: 10.1038/ngeo1022
Fu B., Wu M., Che Y., Wang M., Huang Y., Bai Y. (2015). The strategy of a low-carbon economy based on the STIRPAT and SD models. Acta Ecol. Sin. 35, 76–82. doi: 10.1016/j.chnaes.2015.06.008
Fu Q., Xu L., Zheng H., Chen J. (2019). Spatiotemporal dynamics of carbon storage in response to urbanization: A case study in the Su-Xi-Chang region, China. Processes 7, 836. doi: 10.3390/pr7110836
Gui D., He H., Liu C., Han S. (2023). Spatio-temporal dynamic evolution of carbon emissions from land use change in Guangdong Province, China. 2000–2020. Ecol. Indic 156, 111131. doi: 10.1016/j.ecolind.2023.111131
Hong C., Burney J. A., Pongratz J., Nabel J. E., Mueller N. D., Jackson R. B., et al. (2021). Global and regional drivers of land-use emissions in 1961–2017. Nature 589, 554–561. doi: 10.1038/s41586-020-03138-y
Houghton R. A., House J. I., Pongratz J., van der Werf G. R., Defries R. S., Hansen M. C., et al. (2012). Carbon emissions from land use and land-cover change. Biogeosciences 9, 5125–5142. doi: 10.5194/bg-9-5125-2012
Huang J., Chen X., Yu K., Cai X. (2020). Effect of technological progress on carbon emissions: New evidence from a decomposition and spatiotemporal perspective in China. J. Environ. Manage 274, 110953. doi: 10.1016/j.jenvman.2020.110953
Huang L., Krigsvoll G., Johansen F., Liu Y., Zhang X. (2018). Carbon emission of global construction sector. Renew. Sustain. Energy Rev. 81, 1906–1916. doi: 10.1016/j.rser.2017.06.001
Kanaroglou P. S., Adams M. D., De Luca P. F., Corr D., Sohel N. (2013). Estimation of sulfur dioxide air pollution concentrations with a spatial autoregressive model. Atmos. Environ. 79, 421–427. doi: 10.1016/j.atmosenv.2013.07.014
Kerr R. A. (2001). Climate change. It’s official: humans are behind most of global warming. Science 291, 566. doi: 10.1038/s41586-020-03138-y
Kopidou D., Tsakanikas A., Diakoulaki D. (2016). Common trends and drivers of CO2 emissions and employment: a decomposition analysis in the industrial sector of selected European Union countries. J. Clean Prod 112, 4159–4172. doi: 10.1016/j.jclepro.2015.06.079
Lai L., Huang X., Yang H., Chuai X., Zhang M., Zhong T., et al. (2016). Carbon emissions from land-use change and Management in China between 1990 and 2010. Sci. Adv. 2, 1–9. doi: 10.1126/sciadv.1601063
Liu Q., Wang S., Li B., Zhang W. (2020). Dynamics, differences, influencing factors of eco-efficiency in China: A spatiotemporal perspective analysis. J. Environ. Manage 264, 110442. doi: 10.1016/j.jenvman.2020.110442
Liu X., Zhang Y., Li J., Duan K. (2022). Measuring the urban land use efficiency of three urban agglomerations in China under carbon emissions. Environ. Sci. Pollut. Res. 29, 36443–36474. doi: 10.1007/s11356-021-18124-8
Luo X., Ao X., Zhang Z., Wan Q., Liu X. (2020). Spatiotemporal variations of cultivated land use efficiency in the Yangtze River Economic Belt based on carbon emission constraints. J. Geogr. Sci. 30, 535–552. doi: 10.1007/s11442-020-1741-8
Lv Q., Liu H., Yang D., Liu H. (2019). Effects of urbanization on freight transport carbon emissions in China: Common characteristics and regional disparity. J. Clean Prod 211, 481–489. doi: 10.1016/j.jclepro.2018.11.182
Ma Z., Chen S., Shahi C., Chen H. Y., Chen H. (2022). Trade-offs between economic gains and carbon stocks across a range of management alternatives in boreal forests. Forests 13, 1777. doi: 10.3390/f13111777
Maddison D. (2006). Environmental Kuznets curves. A spatial econometric approach. J. Environ. Econ Manag. 51, 218–230. doi: 10.1016/j.jeem.2005.07.002
Madlener R., Sunak Y. (2011). Impacts of urbanization on urban structures and energy demand: What can we learn for urban energy planning and urbanization Management? Sustain. Cities Soc. 1, 45–53. doi: 10.1016/j.scs.2010.08.006
Meinshausen M., Meinshausen N., Hare W., Raper S. C., Frieler K., Knutti R., et al. (2009). Greenhouse-gas emission targets for limiting global warming to 2 C. Nature 458, 1158–1162. doi: 10.1038/nature08017
Miao Y., Kong C., Wang L., Mu J., Lu X., Bao J., et al. (2019). A provincial lateral carbon emissions compensation plan in China based on carbon budget perspective. Sci. Total Environ. 692, 1086–1096. doi: 10.1016/j.scitotenv.2019.07.174
Onafowora O. A., Owoye O. (2014). Bounds testing approach to analysis of the Environment Kuznets curve hypothesis. Energy Econ 44, 47–62. doi: 10.1016/j.eneco.2014.03.025
Ponce de Leon Barido D., Marshall J. D. (2014). Relationship between urbanization and CO2 emissions depends on income level and policy. Environ. Sci. Technol. 48, 3632–3639. doi: 10.1021/es405117n
Poumanyvong P., Kaneko S. (2010). Does urbanization lead to less energy use and lower CO2 emissions? A cross-country analysis. Ecol. Econ 70, 434–444. doi: 10.1016/j.ecolecon.2010.09.029
Qin H., Huang Q., Zhang Z., Lu Y., Li M., Xu L., et al. (2019). Carbon dioxide emission driving factors analysis and policy implications of Chinese cities: combining geographically weighted regression with two-step cluster. Sci. Total Environ. 684, 413–424. doi: 10.1016/j.scitotenv.2019.05.352
Rong T., Zhang P., Jing W., Zhang Y., Li Y., Yang D., et al. (2020). Carbon dioxide emissions and their driving forces of land use change based on economic contributive coefficient (ecc) and ecological support coefficient (esc) in the lower yellow river region, (1995–2018). Energies 13, 2600. doi: 10.3390/en13102600
Sahe M., Saito O., Fürst C., Yeshitela K. (2018). Quantifi cation and mapping of the supply of and demand for carbon storage and sequestration service in woody biomass and soil to mitigate climate change in the socio-ecological Environment. Sci. Total Environ. 624, 342–354. doi: 10.1016/j.scitotenv.2017.12.033
Satterthwaite D. (2008). Cities’ contribution to global warming: notes on the allocation of greenhouse gas emissions. Environ. Urban 20, 539–549. doi: 10.1177/0956247808096127
Shahbaz M., Loganathan N., Muzaffar A. T., Ahmed K., Jabran M. A. (2016). How urbanization affects CO2 emissions in Malaysia? The application of STIRPAT model. Renew. Sustain. Energy Rev. 57, 83–93. doi: 10.1016/j.rser.2015.12.096
Simões D., Santin L. G., Fenner P. T. (2016). Ergonomic characterization of three sugar cane harvester machinery models. Afr J. Agr Res. 11, 724–729. doi: 10.5897/AJAR2015.10695
Tang C., Dong Y., Mao L. (2023). Optimized plant diversity and carbon storage for priority protection areas in China. Forests 14, 621. doi: 10.3390/f14030621
Taylor D., Kienberger S., Malone J. B., Tompkins A. M. (2016). Health, Environmental change and adaptive capacity; mapping, examining and anticipating future risks of water-related vector-borne diseases in eastern Africa. Geospat. Health 11, 464. doi: 10.4081/gh.2016.464
Wang M., Feng C. (2017). Decomposition of energy-related CO2 emissions in China: an empirical analysis based on provincial panel data of three sectors. Appl. Energy 190, 772–787. doi: 10.1016/j.apenergy.2017.01.007
Wang S., Liu X., Zhou C., Hu J., Ou J. (2017). Examining the impacts of socioeconomic factors, urban form, and transportation networks on CO2 emissions in China’s megacities. Appl. energ. 185, 189–200. doi: 10.1016/j.apenergy.2016.10.052
Wang Y., Zhao T. (2018). Impacts of urbanization-related factors on CO2 emissions: evidence from China’s three regions with varied urbanization levels. Atmos. pollut. Res. 9, 15–26. doi: 10.1016/j.apr.2017.06.002
Wu Z., Wang X., Chen Y., Cai Y., Deng J. (2018). Assessing river water quality using water quality index in Lake Taihu Basin, China. Sci. Total Environ. 612, 914–922. doi: 10.1016/j.scitotenv.2017.08.293
Xiong C., Chen S., Yang D. (2019). Selecting counties to participate in agricultural carbon compensation in China. Pol. J. Environ. Stud. 28, 1443–1449. doi: 10.15244/pjoes/85949
Xiong W., Liu Z., Wang S., Li Y. (2020). Visualizing the evolution of per capita carbon emissions of Chinese cities 2001–2016. Environ. Plan A 52, 702–706. doi: 10.1177/0308518X198816
Xiong C., Su W., Li H., Guo Z. (2022). Influencing mechanism of non-CO2 greenhouse gas emissions and mitigation strategies of livestock sector in developed regions of eastern China: a case study of Jiangsu province. Environ. Sci. Pollut. R 29, 39937–39947. doi: 10.1007/s11356-022-18937-1
Yang S., Wan R., Yang G., Li B., Dong L. (2023). Combining historical maps and landsat images to delineate the centennial-scale changes of lake wetlands in Taihu Lake Basin, China. J. Environ. Manage 329, 117110. doi: 10.1016/j.jenvman.2022.117110
Yao F., Zhu H., Wang M. (2021). The impact of multiple dimensions of urbanization on CO2 emissions: A spatial and threshold analysis of panel data on China’s prefecture-level cities. Sustain. Cities Soc. 73, 103113. doi: 10.1016/j.scs.2021.103113
Yu H., Fotheringham A. S., Li Z., Oshan T., Kang W., Wolf L. J. (2020). Inference in multiscale geographically weighted regression. Geogr. Anal. 52, 87–106. doi: 10.1111/gean.12189
Zhang L. X., Feng Y. Y., Chen B. (2011). Alternative scenarios for the development of a low-carbon city: a case study of Beijing, China. Energies 4, 2295–2310. doi: 10.3390/en4122295
Keywords: multiscale geographically weighted regression (MGWR), carbon balance, carbon balance zoning, Taihu lake basin, carbon neutrality
Citation: Wang Y, Wang Y and Duan X (2024) Ecological and economic influencing factors on the spatial and temporal evolution of carbon balance zoning in the Taihu Basin. Front. Ecol. Evol. 11:1230919. doi: 10.3389/fevo.2023.1230919
Received: 01 June 2023; Accepted: 30 November 2023;
Published: 17 January 2024.
Edited by:
Changchun Huang, Nanjing Normal University, ChinaReviewed by:
Shicheng Li, China University of Geosciences Wuhan, ChinaYu Chen, Nanjing Normal University, China
Chenjing Fan, Nanjing Forestry University, China
Copyright © 2024 Wang, Wang and Duan. This is an open-access article distributed under the terms of the Creative Commons Attribution License (CC BY). The use, distribution or reproduction in other forums is permitted, provided the original author(s) and the copyright owner(s) are credited and that the original publication in this journal is cited, in accordance with accepted academic practice. No use, distribution or reproduction is permitted which does not comply with these terms.
*Correspondence: Xuejun Duan, eGpkdWFuQG5pZ2xhcy5hYy5jbg==