 Xinyu Wang
 Xudong Guo
 Haoxin Li
 Frank Yonghong Li
- Ministry of Education Key Laboratory of Ecology and Resource Use of the Mongolian Plateau & Inner Mongolia Key Laboratory of Grassland Ecology, School of Ecology and Environment, Inner Mongolia University, Hohhot, China
Introduction: The changes in grassland management and grassland types are strongly linked with dynamics in soil physico-chemical properties and vegetation attributes, with important implications for carbon/nitrogen cycling and greenhouse gas (GHG) fluxes. However, the seasonal variations of GHG emissions from sheepfolds, and the underlying biotic and abiotic drivers affecting GHG exchanges across different steppe and management types remain largely unclear.
Methods: Taking the Inner Mongolian grassland as a model system, we measured the fluxes of CO2, CH4 and N2O, as well as soil and vegetation variables, in three contrasting grassland management areas (grazing, sheepfold, enclosure) and in three representative (wet typical, dry typical, desert) grassland ecosystems in July, September and November 2016.
Results: Our results showed that: (1) GHG fluxes were mostly higher in the plant growing season (July and September) than in the nongrowing season (November); sheepfold area had significantly higher GHG emissions (in July and mean over the season) than enclosed and grazing areas, with the effects being most pronounced in dry typical steppe. (2) The high GHG emissions in dry typical steppe were closely associated with the interactions among favorable soil temperature and moisture, high total organic carbon (TOC) content, and high aboveground biomass. The important predictors for CO2 emission were soil TOC and pH, whereas that for CH4 and N2O emissions were soil temperature and moisture content, in sheepfold areas. (3) Three GHG emissions were negatively affected by species richness across all steppe and management types, which might be a consequence of indirect effects through the changes in soil TOC and total nitrogen (TN).
Discussion: These results indicate that sheepfold areas are intensive hotspot sources of GHGs in the steppes, and it is of great importance to help to account GHG emissions and develop mitigation strategies for sheepfold areas for sustainable grassland management in the natural steppe based pastoral production ecosystems.
Introduction
The atmospheric concentrations of the three most important greenhouse gases (GHGs) carbon dioxide (CO2), methane (CH4), and nitrous oxide (N2O) have been increasing at unprecedented rates since 1750 due to anthropogenic activities, such as burning of fossil fuels, deforestation and land use changes (Hewitt and Jackson, 2003; IPCC, 2022). From 2010 to 2019, global net anthropogenic GHG emissions have continued to rise, and the annual average GHG emissions during this decade are higher than at any previous time in human history (IPCC, 2022). Temperate steppes account for approximately 10% of the total land area of the world, and play pivotal roles in regulating the emissions and uptakes of GHGs (Suttie et al., 2005). Steppe soil has the capacity to produce, store, and cycle C and N substrates, and is therefore an important base of soil–atmosphere GHG exchanges (Wang et al., 2005; Chen et al., 2019). Given the large area and mitigation potential, it is of major significance to clarify the soil–atmosphere GHG exchanges in temperate steppes for our better understanding of the global C/N cycles and GHGs mitigation options.
Livestock grazing is the most common land use in the steppe region of northern China, and has a strong impact on the flux patterns of GHGs, the C and N cycles of grassland ecosystems and climate changes (Skiba et al., 2013; Wang et al., 2014). Globally, livestock production contributes 20% of non-CO2 emissions of GHGs, mainly from the release of CH4 from enteric fermentation by ruminants and generation of CH4 and N2O from decomposition of animal excreta. The animal excreta emit CH4 and N2O directly, and meanwhile promote the production of CH4 and N2O indirectly by altering the availability of organic C and N and plant community attributes (EPA, 2012; Braun et al., 2013; Chen et al., 2022). These excreta are deposited all over the pastures during grazing, but the depositions are concentrated around the sheepfolds when livestock stay overnight there (Chen et al., 2011). While the effects of grassland management on GHG exchanges in the temperate pastures have been receiving increasing attention, the efforts are skewed towards the effects of grazing intensities or excretal deposition in grassland soils, with less attention given to quantify GHG emissions from sheepfolds (Wolf et al., 2010; Koncz et al., 2017; Siqueira-Neto et al., 2021). A few researchers have examined the GHG fluxes from sheepfolds and indicated that they are potential hotspots for GHG emissions (Liu et al., 2009; Chen et al., 2022). For example, Chen et al. (2011) show that the annual total GHG emissions in CO2 equivalents are estimated to be 136.7 ± 15.9 t ha−1 for the sheepfolds during the grazing period, of which CO2 and N2O emissions account for about 59% and 40%, respectively; Chen et al. (2022) also show that GHG emissions from sheepfolds contribute to 83% of the annual GHG fluxes, and the annual N2O emission from livestock sheds is 70–250 times higher than nearby steppe soils. However, the seasonal variations of GHG emissions from sheepfolds and the underlying biotic and abiotic factors that drive GHG emissions in pasture management are largely unexplored.
The size of soil–atmosphere fluxes of GHGs in steppe grasslands is not merely controlled by management types but also considerably depends on grassland types (Frank et al., 2002; Garcia-Montiel et al., 2004). The emission or uptake rates of three GHG fluxes in response to livestock farm management are found to vary with grassland types that have different hydrothermal conditions, grazing history and soil nutrients (Tang et al., 2013; Shi et al., 2017). The GHG fluxes are sensitive to soil factors, especially soil temperature and moisture, and vegetation attributes, which influence the fundamental role played by microbes in the processes of production, consumption and gas transport in soil (Cavigelli and Robertson, 2001; Smith et al., 2003; Braun et al., 2013). As such, it is imperative to explore the effects of pasture management on GHG fluxes on different grassland types, with soil and vegetation drivers considered simultaneously, for regional GHG inventories and mitigation purposes.
The Inner Mongolian grassland is an important part of the Eurasian temperate grasslands, and has been widely used as grazing land for livestock production (Wang et al., 2019). Livestock numbers in Inner Mongolia in the past few decades have increased significantly, along with the areas of sheepfolds, which cover 78.1 million m2 in the early 21st century and still increase (Bureau of Statistic of Inner Mongol, 2007; Chen et al., 2019). That uncertainty in the seasonality and magnitude of GHG flux patterns from grazing animals may markedly affect regional GHG accounting. To clarify this, we measured CO2, CH4 and N2O fluxes as well as soil and vegetation factors in response to three grassland management areas (grazing, sheepfold, enclosure) in each of three family livestock farms in each of three representative steppe grassland types, i.e., wet typical steppe, dry typical steppe and desert steppe, on a climate gradient in Inner Mongolia. Our aim was to assess the seasonal variations of GHG exchanges at different grassland areas (in terms of grazing management) of the livestock farm and the impacts of climate gradients on GHG emissions in the three major steppe zones, and identify the important abiotic and biotic drivers of GHG fluxes across steppe and management types. We hypothesized that (i) sheepfold area has the highest GHG emissions compared to enclosed and grazing areas, especially in July, and the effects are most pronounced in dry typical steppe; (ii) the high GHG emissions in the dry typical steppe are the result of the interactions of soil and vegetation factors, and soil temperature and water content and soil organic matter are the key drivers of GHG emissions in sheep areas; and (iii) plant species richness is an important predictor of three GHG emissions across all steppe and management types. The study will help to develop efficient GHG mitigation strategies in the natural steppe based pastoral production ecosystems.
Materials and methods
Study site and experimental design
This study was conducted in nine family farms, located in the three regions of wet typical steppe, dry typical steppe and desert steppe from east to west along a climatic gradient in central Inner Mongolia (Figure 1). The regions experience a temperate semi-arid climate. Annual average temperature and precipitation (1960–2016) are 3.32 °C and 342 mm in the wet typical steppe site (45°43′N, 118°30′E, within West Ujimqin Banner), 2.67 °C and 278 mm in the dry typical steppe site (44°50′N, 116°36′E, within Maodeng farm of Xilinhot city), and 0.19 °C and 182 mm in the desert steppe site (43°51′N, 113°42′E, within Sunite Right Banner); the precipitation has a wide inter-annual fluctuation, and 75–85% of which falls in the plant growing season from May to September. In the year of 2016 (field experiment), the annual temperature and precipitation were 4.50°C and 299 mm, 3.49 °C and 309 mm, and 0.98 °C and 189 mm, and the plant growing season precipitation was 237, 215, and 153 mm, respectively in the wet typical steppe, the typical steppe, and the desert steppe region. The soil at the typical steppe is a chestnut soil, while that at the desert steppe is a calcic brown soil. The dominant plant species are Leymus chinensis, Stipa grandis, and Cleistogenes squarrosa for the wet typical steppe, L. chinensis, S. krylovii, and C. squarrosa for the dry typical steppe, and S. klemenzii, C. songorica, Salsola collina, and Allium bidentatum for the desert steppe.
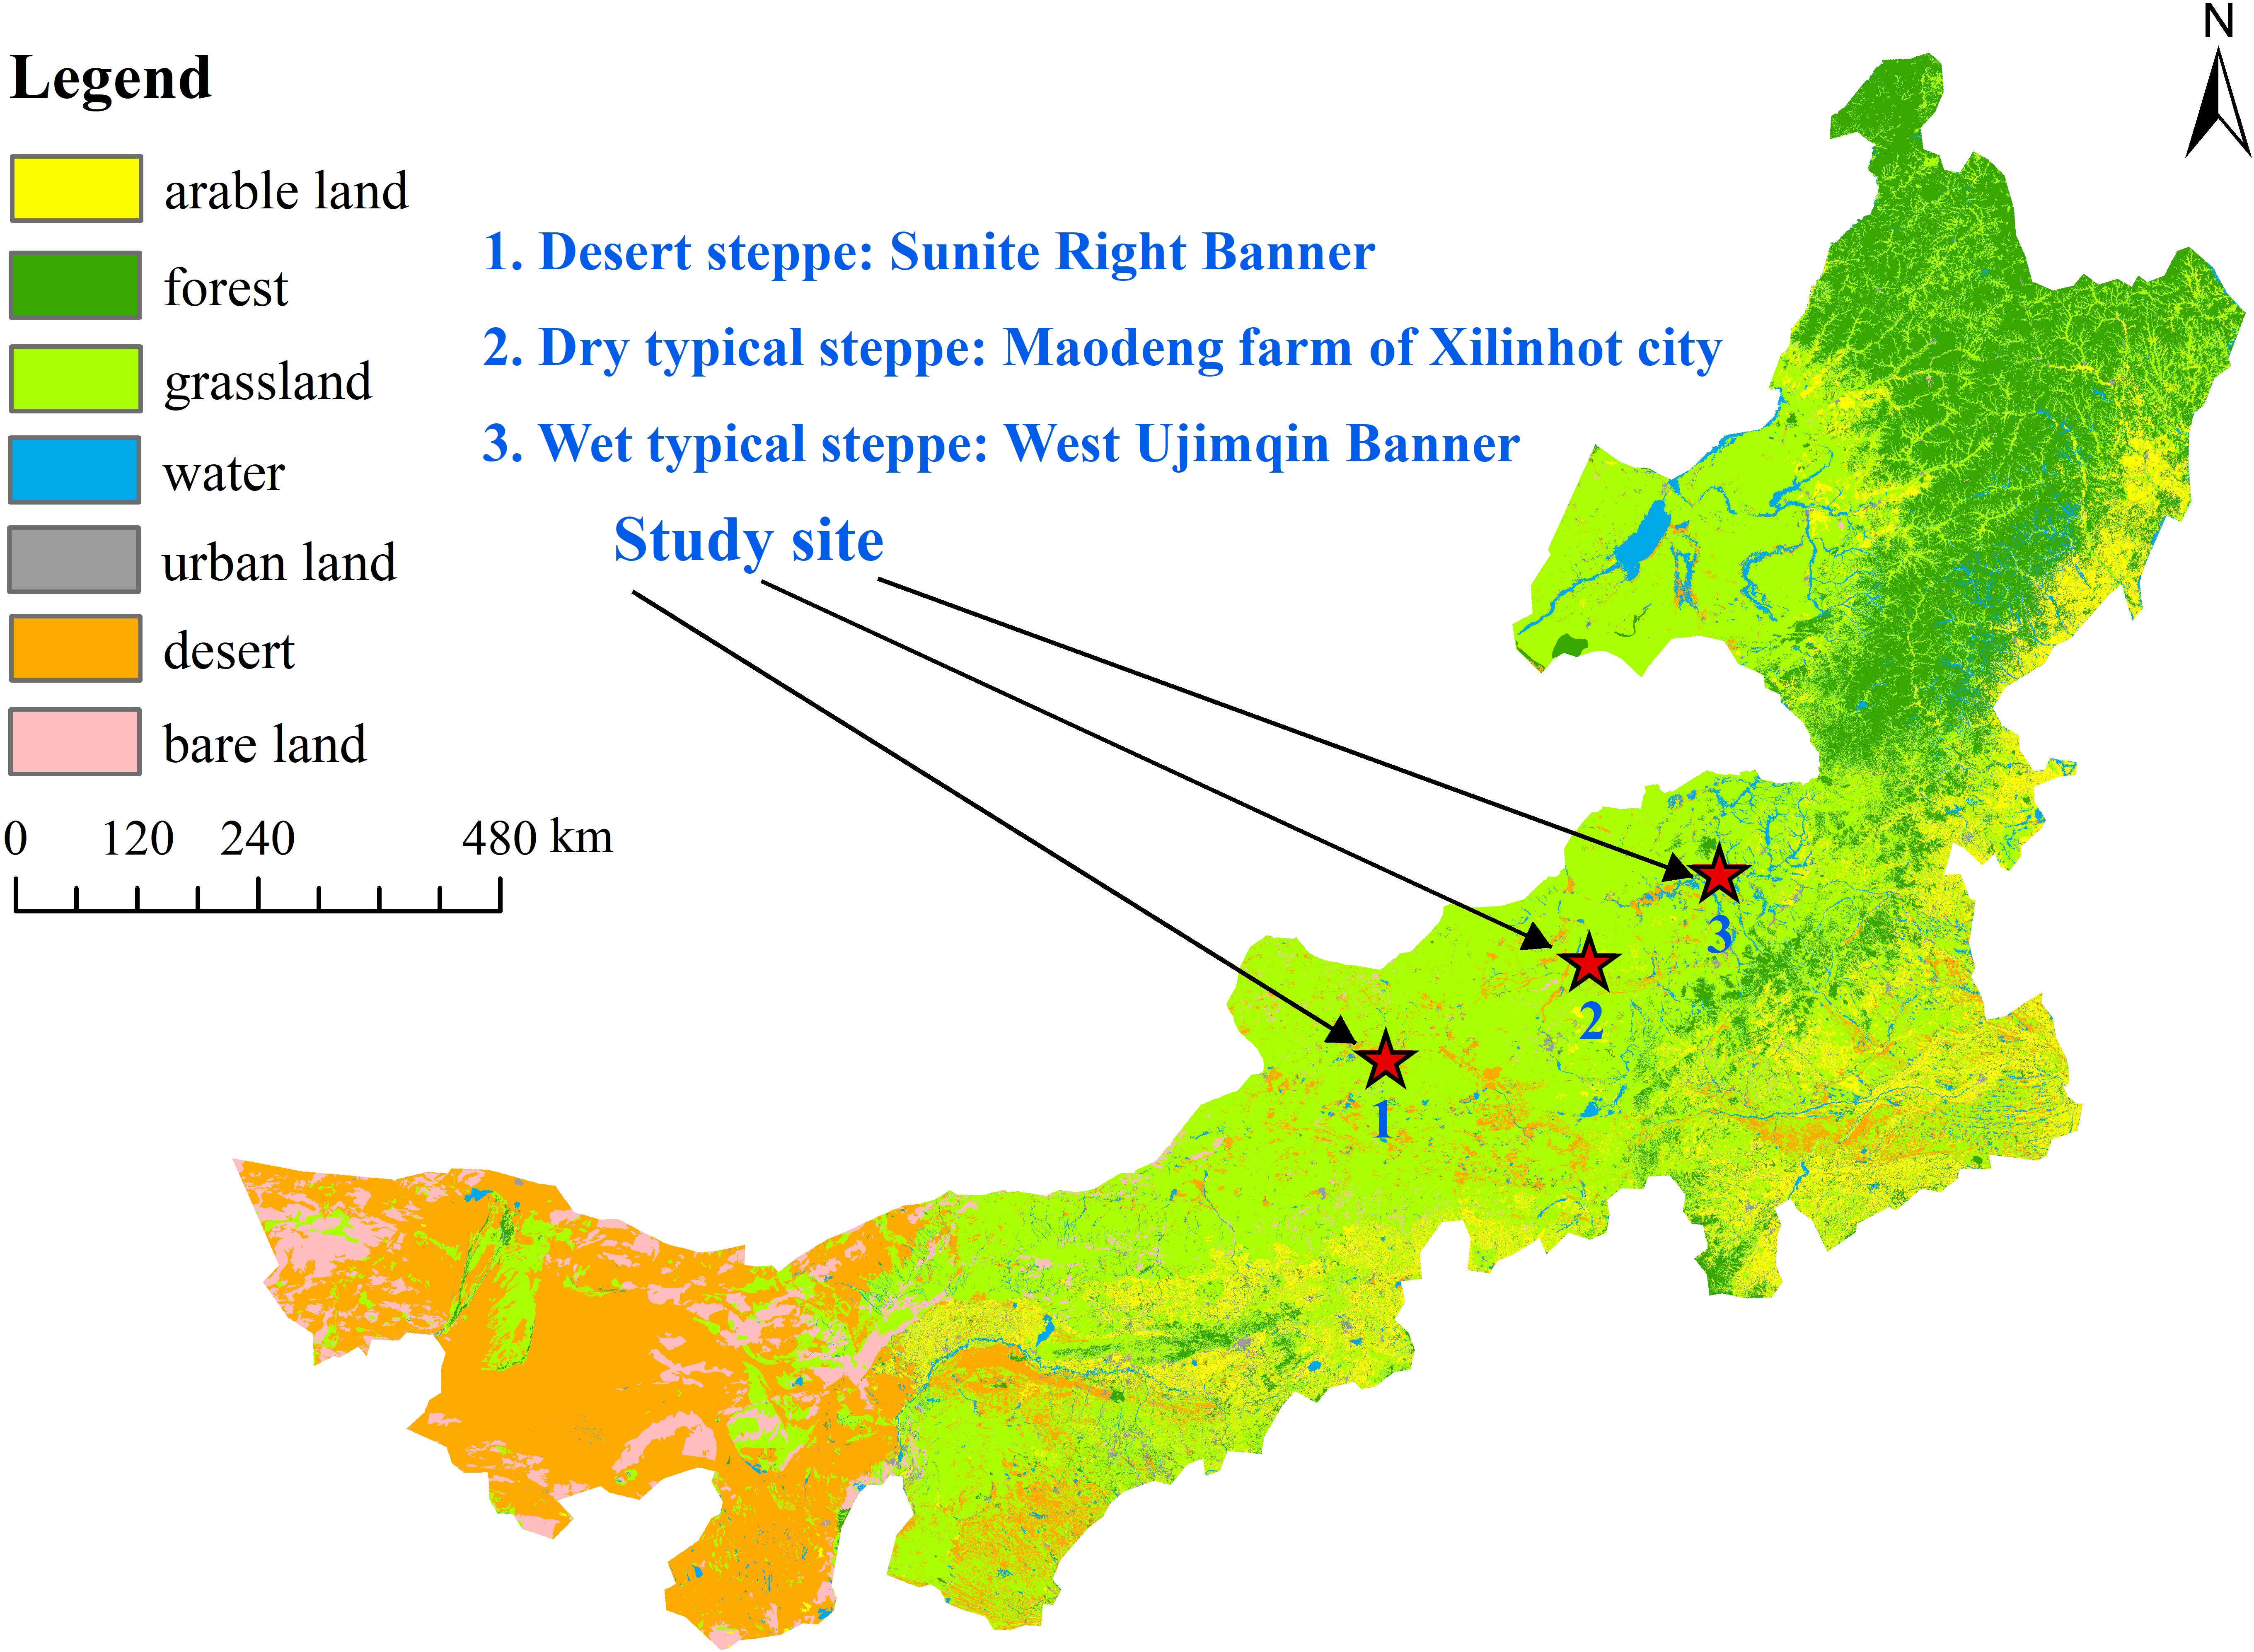
Figure 1 Location map of the study region and spatial distribution (red stars).
Three family pastures were selected on flat areas for the study at each of the three steppe regions. The main grazing livestock in these family pastures were sheep, accounting for 90% of the total grazing livestock, and the remaining 10% are cattle. Three grassland areas in each family pasture, i.e., sheepfold area, grazing area and enclosure, were selected for experimental observation and measurements. The grazing intensity in the selected grazing areas was moderate, and the stocking rates were estimated based on the farmers’ livestock number and pasture land area, and were 1.4, 1.2, 0.6 sheep unit per hm2, which were in line with the grassland production in the three regions. The sheepfold, also called summer sheepfold, was usually fenced or surrounded by brick or dung brick walls. It held livestock overnight during the grazing period, usually from June to January in the following year. Grassland within 10 m around the sheepfold was chosen as the sheepfold plots for GHG measurements. The enclosed plots were fenced in the grazing pastures to prohibit grazing for the experimental period.
GHG flux measurements
Three family pastures in each steppe region were selected, and the three management plots for sheepfold area, grazing area and enclosure were established in each family pasture in early 2016 before plant growing season. The fluxes of CO2, CH4 and N2O were determined in spring (May), summer (July), autumn (September) and late autumn (November) at these 27 plots (three steppe types × three family pastures × three management types). However, due to weather conditions, we did not obtain complete gas data in May (data missing for one family pasture in desert steppe and two family pastures in dry typical steppe), resulting in a mismatch in the number of replicates of gas data between this month and the other three months. Thus, we only put the results of the variations of gas fluxes among different grassland management and grassland types in May into the Supporting Information (Figure S1), while the results of the variations of gas fluxes in July, September and November were shown in the main text.
GHG fluxes were measured using an enclosed static chamber with an inner dimension of 40 cm (length) × 40 cm (width) × 40 cm (height). The external surface of the chamber was coated with thermal and reflective insulation materials to minimize heating effect during sampling. A fan (12 cm × 12 cm) and an air thermometer were equipped with in the chamber to mix the gas sufficiently and record the internal temperature, respectively. Three chambers matched with U-grooves were set up within each of the 27 plots and inserted into the 5 cm deep soil, and sealed with water to prevent gas leakage during sampling. Gas samples were taken from the chamber at 0, 10, 20 and 30 min after the gases were mixed in closed space for five minutes, using a 200 mL plastic syringe and injected immediately into a gas collection bag. To ensure comparable conditions, GHG fluxes were determined only between 9:00 and 11:00 am. Soil temperature and moisture were monitored and recorded by the HH2 Moisture Meter during gas collection. All gas samples were returned to the laboratory within two days and analyzed using a high-performance gas chromatography, which was equipped with a hydrogen flame ionization detector for CO2 and CH4 analysis and an electron capture detector for N2O analysis (7890A, Agilent Technologies, California, USA).
The GHG fluxes were calculated as follows (1):
where F is the CO2 (mg·m−2·h−1), CH4 (μg·m−2·h−1), or N2O (μg·m−2·h−1) flux; ρ is the gas density (mg·m−3 or μg·m−3); V and A are the volume (m3) and surface area (m2) of the chamber, respectively; T0 (°C) is the temperature in the standard state, T is the temperature in the chamber; P0 (Pa) represents the atmospheric pressure in the standard state, P represents the atmospheric pressure in the chamber; dc/dt is the rate of change in gas concentration over time in the chamber (m3·m−3·h−1). To assess the effects of management and steppe types on the total GHG emissions in different seasons, we also converted CH4 and N2O fluxes into CO2 equivalents (CO2:1, CH4: 25, and N2O: 298) using the global warming potential factor (GWP).
Vegetation and soil sampling and analysis
In mid-July 2016, grassland vegetation was investigated using three 1m × 1m quadrats adjacent to the chambers in each plot. Plant species richness was recorded, and aboveground biomass (AGB) was harvested by species and weighed after 48 h oven-drying at 65°C. After removing plant materials in each quadrat of each plot, three soil cores with a diameter of 5 cm and a depth of 0−10 cm were collected and homogenized into a composite sample. Each fresh soil sample was sieved through a 2 mm mesh, and air-dried for further soil properties analysis. Total organic carbon (TOC) and total nitrogen (TN) were determined by a liquiTOC analyzer (Elementar, Hanau, Germany) and a Vario MACRO cube elemental analyzer (Elementar, Hanau, Germany), respectively. Soil pH was determined at a ratio of 1:5 soil to deionized water slurry on a pH meter (FE20, Mettler-Toledo, Shanghai, China).
Statistical analyses
A three-way repeated measures ANOVA was conducted using the ‘aov’ function in the ‘stats’ package in R to test the effects of month, steppe type, management type, and their interactions on soil temperature, soil moisture, and GHG fluxes. A two-way ANOVA was conducted using the ‘aov’ function in the ‘stats’ package to test the effects of steppe type, management type, and their interactions on average GHG fluxes, average soil temperature and moisture (in July, September and November), and other soil and vegetation factors. Duncan’s multiple comparisons at P< 0.05 were performed as a post hoc analysis to compare the differences in GHG fluxes and soil and vegetation factors among management and steppe types using the ‘duncan.test’ function in the R package ‘agricolae’. Then, ordinary linear regression (OLR) was applied using the ‘lm’ function in the R package ‘stats’ to check significant positive or negative relationships of soil and vegetation factors with GHG fluxes across different management and steppe types. And, partial linear regression (PLR) was also fitted using the residuals of variables and the ‘lm’ function in the ‘stats’ package to tease apart the exclusive effects of every soil and vegetation factor (excluding the effects of other abiotic and biotic factors) on GHG fluxes (Quinn and Keough, 2002). The purpose of using PLR is to distinguish whether the significant relationship between a certain factor and GHG flux based on OLR really exists or is the result of the combined influence of other factors. Finally, variation partitioning analysis and stepwise regression analysis were used to identify the relative contributions of soil and vegetation variables to GHG fluxes using the ‘varpart’ function and ‘step’ function in the R packages ‘vegan’ and ‘stats’, respectively. These variables were divided into three groups of soil physical factors (temperature and moisture), soil chemical factors (TOC, TN and pH), and vegetation attributes (AGB and species richness). All analyses were performed in R version 4.0.5 (R Core Team, 2021).
Results
Variations of soil and vegetation characteristics among different management and steppe types
The soil temperature and moisture showed clear seasonal variations at three steppe types, which were significantly affected by month, steppe type, management type, and the two- or three-way interactions for month, steppe type and management type, respectively (Tables 1, 2). Soil temperature was highest in July and lowest in November at all regions, and it was significantly lower in dry typical steppe than in other two steppe types irrespective of in July, September or November (Figure S2). In July, soil temperature was obviously lower in sheepfold area than in enclosure and grazing areas for wet and dry typical steppe grasslands (Figures S2A, D), whereas the reverse was true for all steppe types in November (Figures S2C, F). Mean soil temperature was lowest in dry typical steppe; and was significantly lower in sheepfold area than in enclosure and grazing area only in wet typical steppe (Figures 2A; S4A). Soil moisture was highest at desert steppe and lowest at wet typical steppe in July, highest at dry typical steppe and lowest at desert steppe in September, and highest at wet typical steppe and lowest at desert steppe in November (Figure S3). Soil moisture in sheepfold area was significantly lower in September, but higher in November, than that in enclosure and grazing areas at dry typical steppe (Figures S3B, C). Mean soil moisture was highest in dry typical steppe, followed by wet typical steppe and finally desert steppe; and mean soil moisture was significantly lower in sheepfold area than in enclosure and grazing areas in dry typical steppe (Figures 2B; S4B).
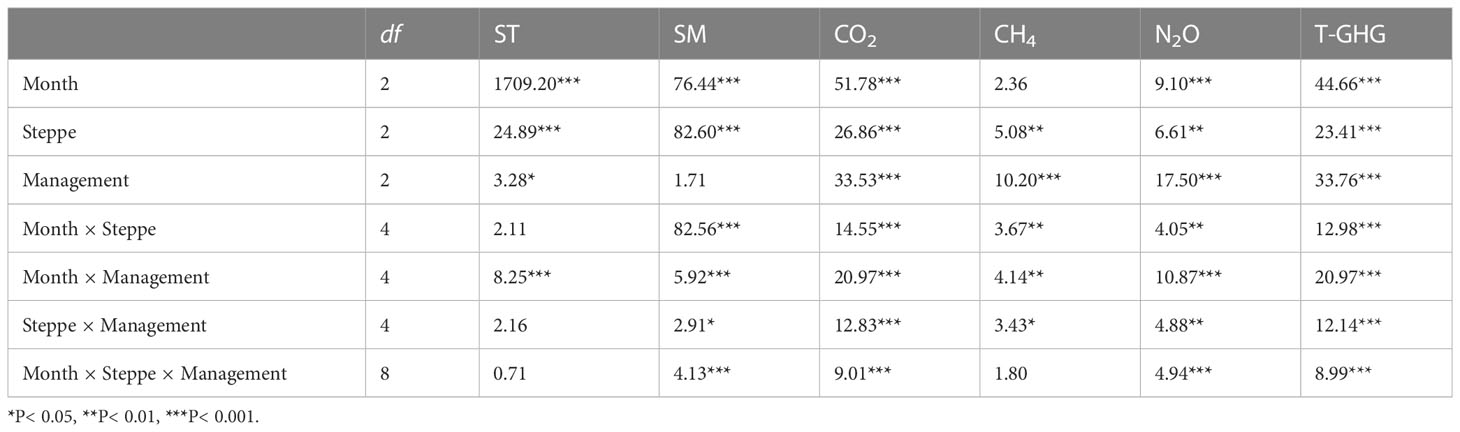
Table 1 Results (F-values) of a three-way repeated measures ANOVA for the effects of month, steppe type, management type, and their interactions on soil temperature (ST), soil moisture (SM), CO2 flux, CH4 flux, N2O flux, and the total GHG fluxes (T-GHG).
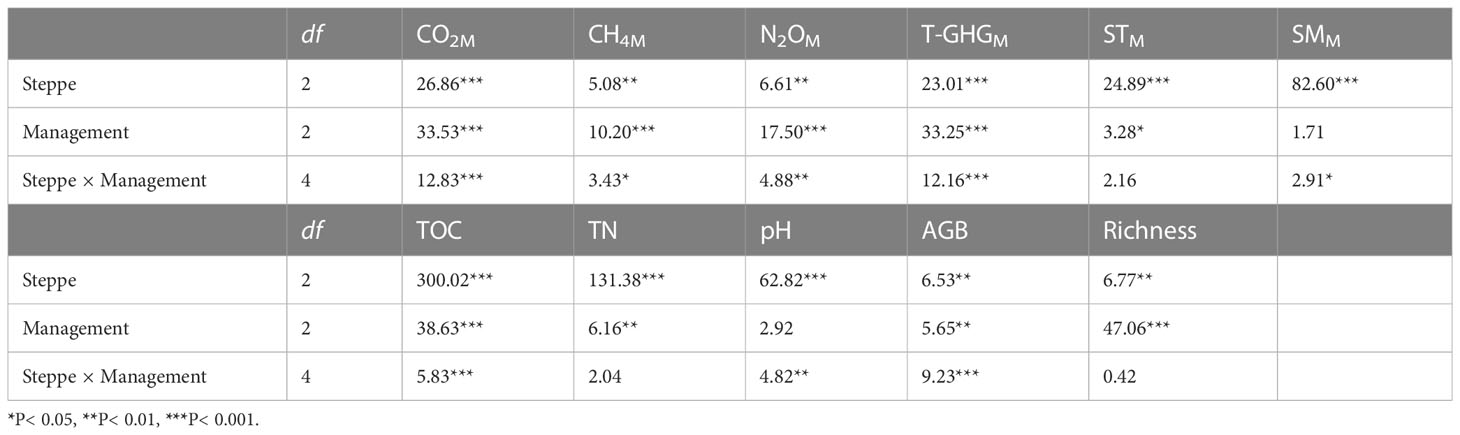
Table 2 Results (F-values) of a two-way ANOVA for the effects of steppe type, management type, and their interactions on mean fluxes of CO2 (CO2M), CH4 (CH4M), N2O (N2OM), and the total GHGs (T-GHGM) (July, September and November), mean soil temperature (STM), mean soil moisture (SMM), total organ carbon (TOC), total nitrogen (TN), soil pH, aboveground biomass (AGB), and species richness.
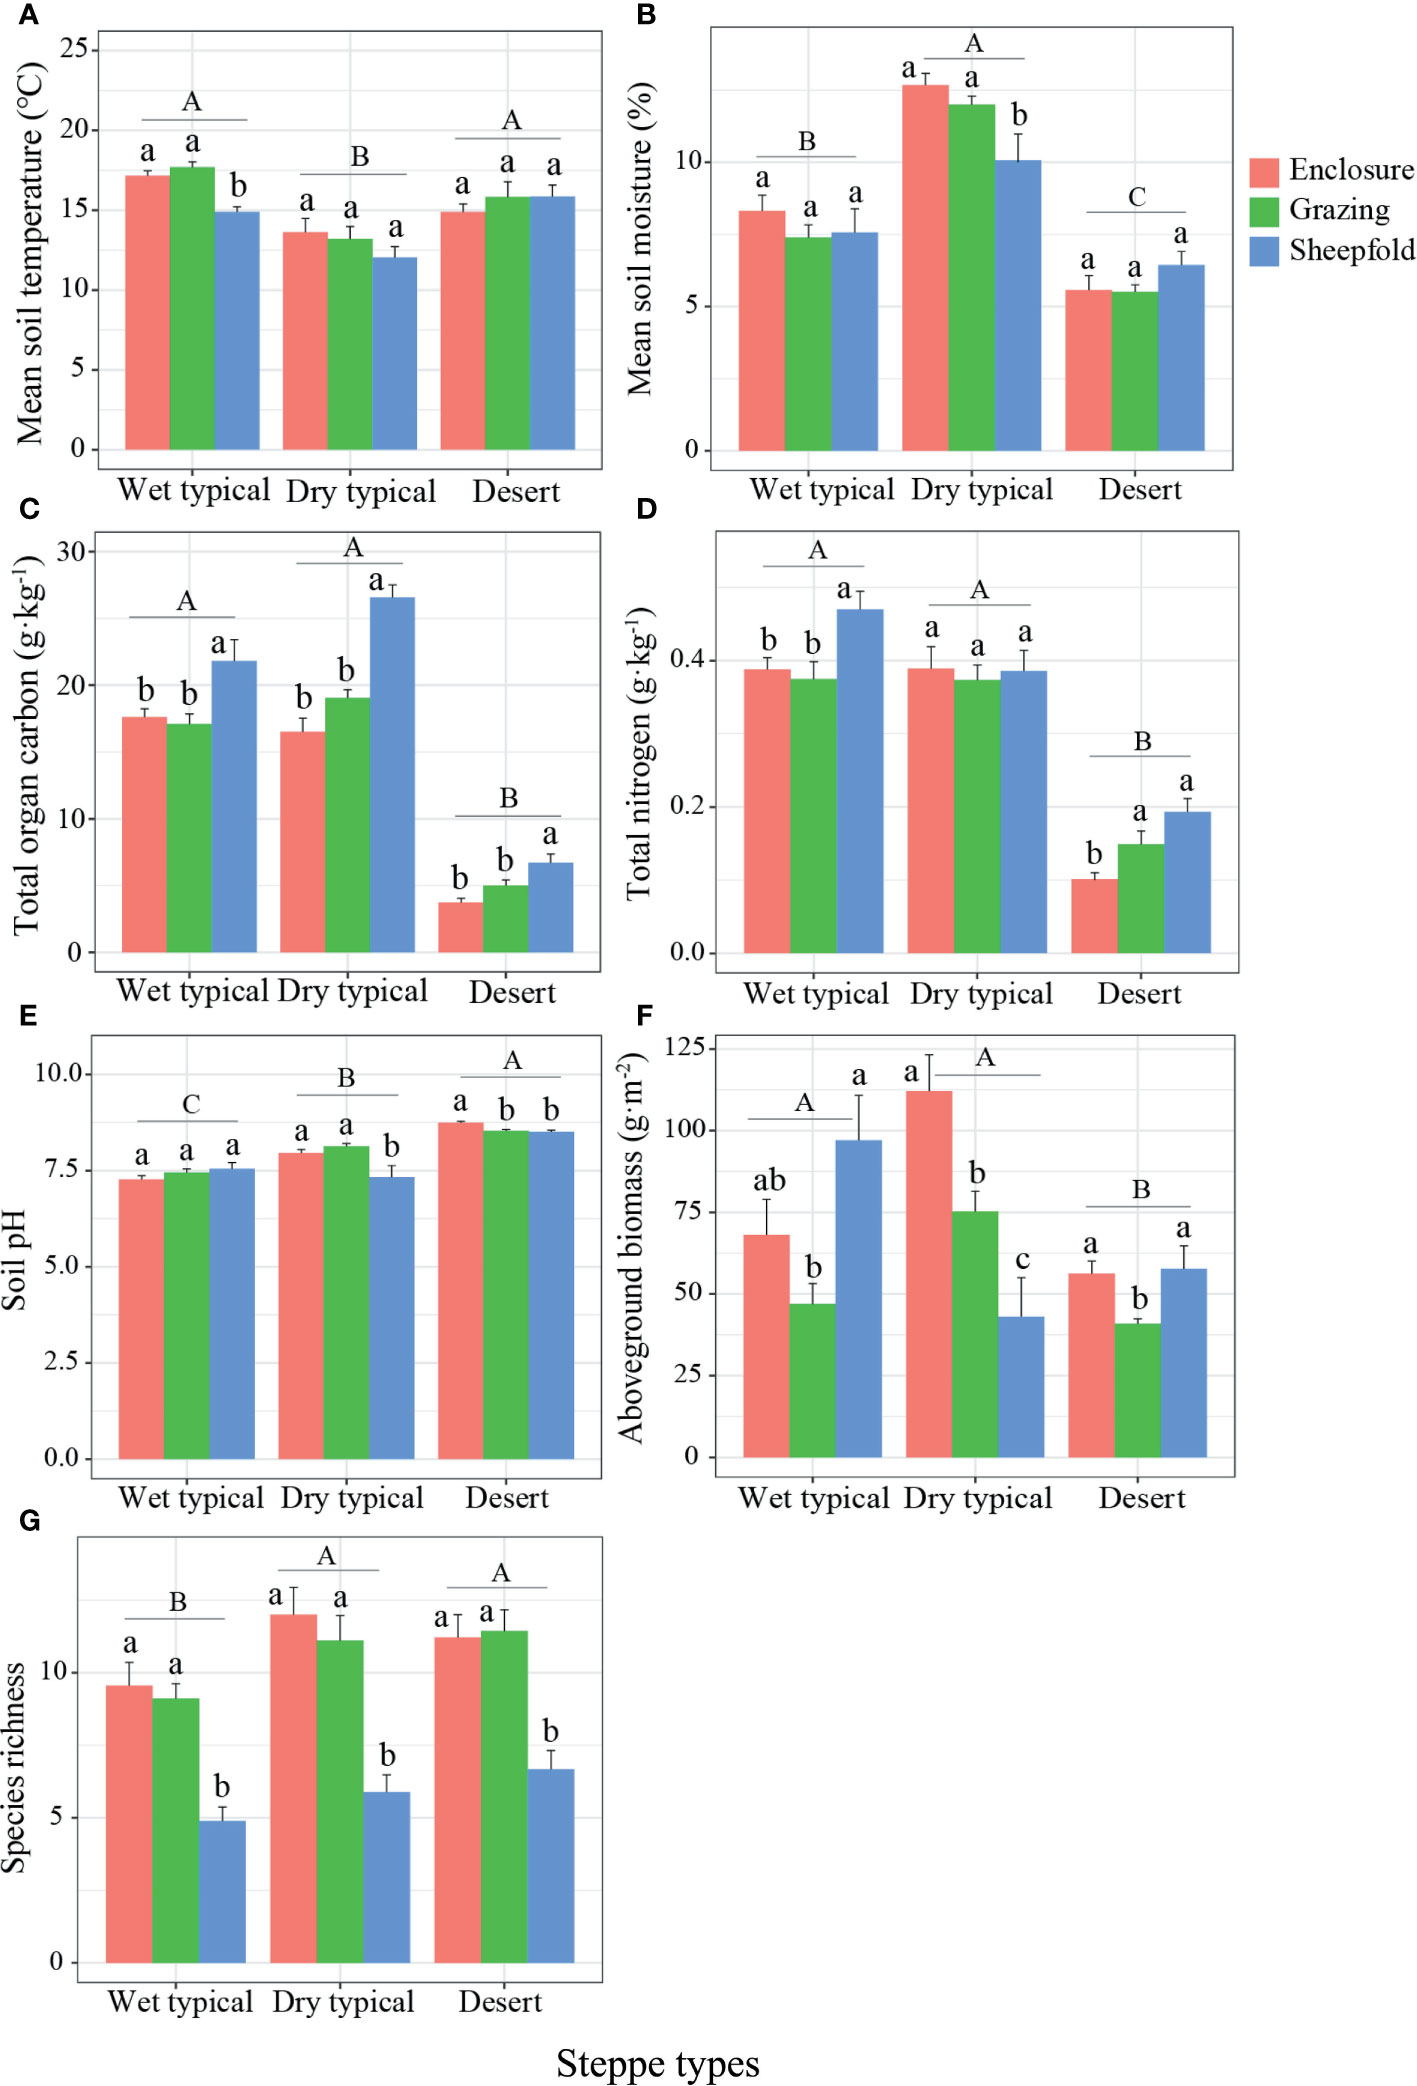
Figure 2 Variation in soil (A–E) and vegetation attributes (F, G) at different management areas (enclosure, grazing, sheepfold) across three steppe sites (wet typical, dry typical, desert) in Inner Mongolia. Different lowercase and uppercase letters indicate significant differences (P< 0.05) between management types (n=9) and steppe types (n=27), respectively, after using Duncan’s test for post hoc comparisons. Error bars represent ±1 SE.
Soil and vegetation properties at peak plant growing season markedly differed among the three management and steppe types, and there were significant interactions between steppe type and management type on the TOC, pH, and AGB (Table 2). Soil TOC and TN contents in two typical steppe sites were significantly higher than in desert steppe site; sheepfold area had obviously higher TOC in all three steppes, and higher TN in wet typical and desert steppes, than enclosed area (Figures 2C, D; S4C, D). Soil pH significantly increased from the wet typical steppe to dry typical steppe, and desert steppe; and was significantly lower in sheepfold area than in enclosure area in the dry typical and desert steppes (Figures 2E; S4E). Vegetation attributes varied with grassland types. Plant AGB was significantly higher, but species richness was significantly lower, in wet typical steppe than in desert steppe; AGB was also significantly lower in sheepfold than in enclosure and grazing areas in dry typical steppe, but species richness was lower in sheepfold than in enclosure and grazing areas in all steppes (Figures 2F, G; S4F, G).
Effects of management and steppe types on GHG fluxes
All three GHG emissions were mostly higher in plant growing season (July and September) than non-growing season (November) (Figures 3–6; S5–8). The fluxes of CO2, N2O and total GHGs were significantly affected by month, steppe type, management type and their interactions. CH4 flux was also affected by these factors except for month and the interaction among month, steppe type and management type (Tables 1, 2). In July and September, CO2 flux was significantly higher in the dry typical steppe than in other two steppe types; the flux was also significantly higher in sheepfold area than in enclosure and grazing areas at dry typical and desert steppes in July, and higher in sheepfold area than in grazing area at wet typical and desert steppes in September (Figures 3A, B; S5A, B). In November, there was no significant difference in CO2 flux among steppe types; but CO2 flux was significantly higher in sheepfold area than enclosure and grazing areas in dry typical steppe (Figure 3C). Moreover, mean seasonal CO2 flux was 177.79% and 136.26% higher in dry typical steppe than in wet typical and desert steppes; and the flux in sheepfold area was higher than in enclosed and grazing areas, by 227.02% and 402.52% in dry typical steppe, and 142.46% and 188.55% in desert steppe (Figures 3D; S5D).
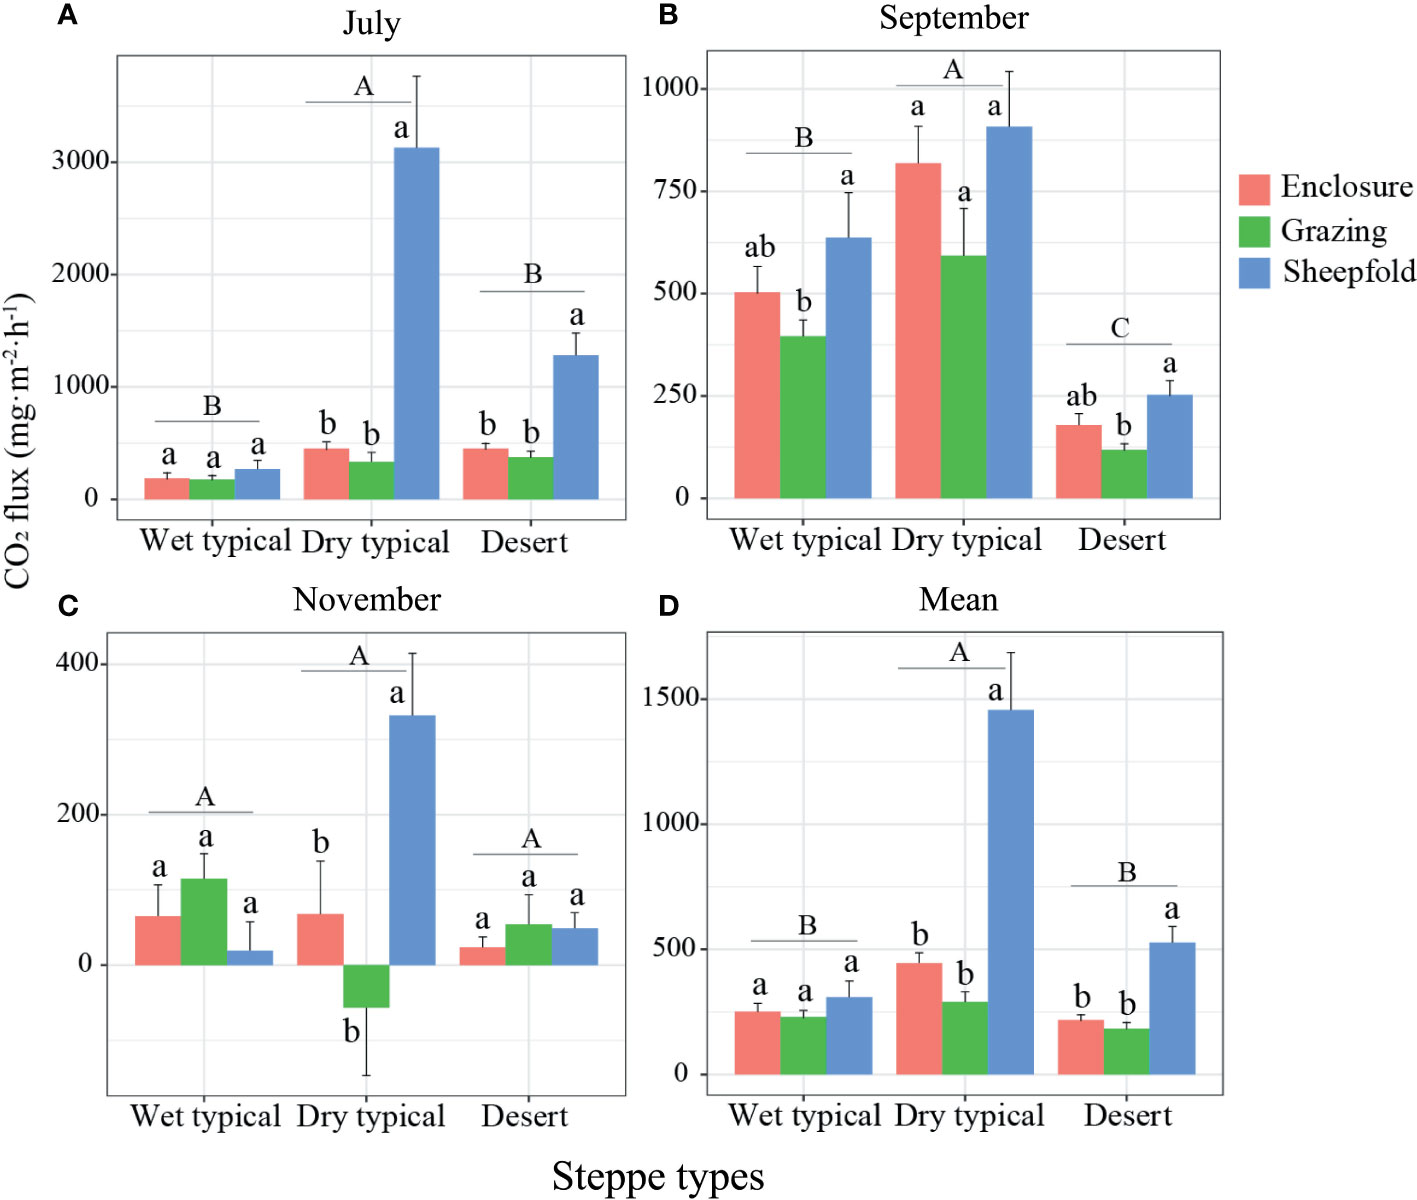
Figure 3 Variation in CO2 emission in July (A), September (B) and November (C), and their mean across the season (D) at different management areas (enclosure, grazing, sheepfold) across three steppe sites (wet typical, dry typical, desert) in Inner Mongolia. Different lowercase and uppercase letters indicate significant differences (P< 0.05) between management types (n=9) and steppe types (n=27), respectively, after using Duncan’s test for post hoc comparisons. Error bars represent ±1 SE.
Grassland was generally a sink of CH4 across the season, management and steppe types, except for sheepfold area in dry typical steppe (Figures 4; S6). In July and September, CH4 flux was significantly higher in the dry typical steppe than in other two steppes; CH4 flux was also significantly higher in sheepfold area than in enclosed or grazing areas at dry typical and desert steppes in July, and at three steppes in September (Figures 4A, B; S6A, B). In November, no significant difference was detected in CH4 flux among steppe types, but the flux was significantly higher in sheepfold area than in enclosure in dry typical and desert steppes (Figures 4C; S6C). Mean seasonal CH4 flux showed a similar trend with mean seasonal CO2 emission (Figures 4D; S6D).
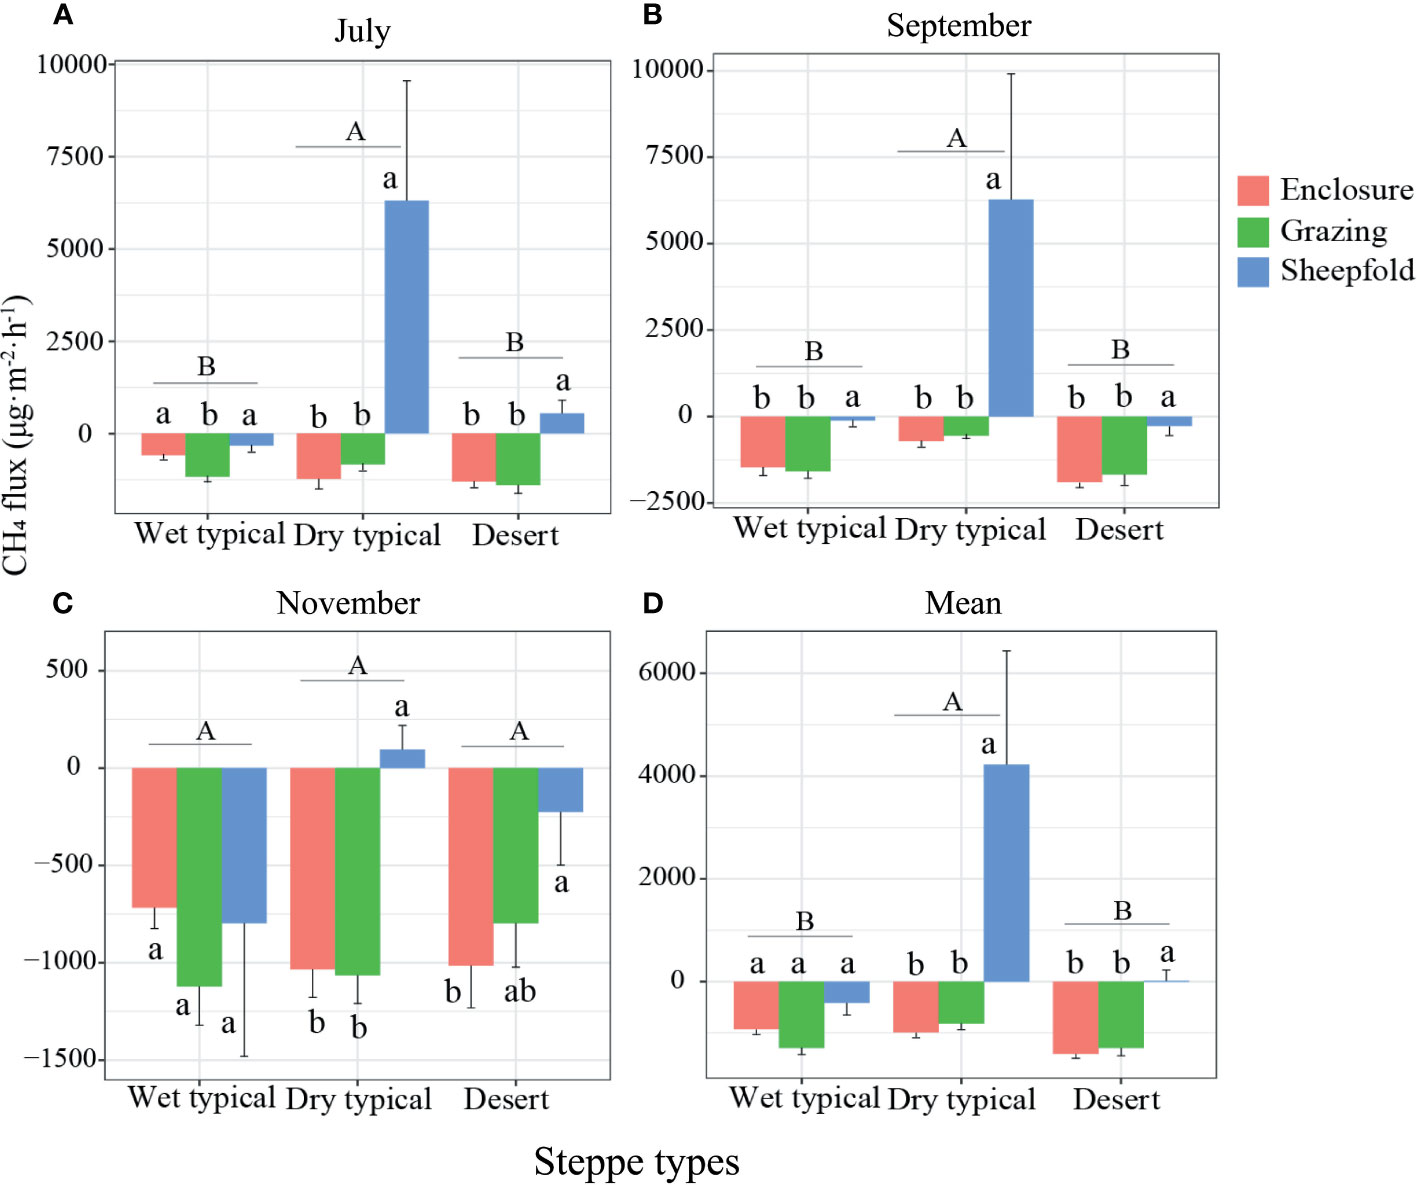
Figure 4 Variation in CH4 emission in July (A), September (B) and November (C), and their mean across the season (D) at different management areas (enclosure, grazing, sheepfold) across three steppe sites (wet typical, dry typical, desert) in Inner Mongolia. Different lowercase and uppercase letters indicate significant differences (P< 0.05) between management types (n=9) and steppe types (n=27), respectively, after using Duncan’s test for post hoc comparisons. Error bars represent ±1 SE.
In July and November, N2O flux was higher in the dry typical steppe than in other two steppe types; and N2O flux was also significantly higher in sheepfold area than in enclosed or grazing areas at all steppes in July, and at dry typical and desert steppes in November (Figures 5A, C; S7A, C). In September, no significant difference was detected in N2O flux among steppe types, but the flux was significantly higher in sheepfold area than in enclosure or grazing areas in wet typical steppe and desert steppe (Figures 5B; S7B). In addition, mean seasonal N2O emission was 946.99% and 190.64% higher in dry typical steppe than in wet typical and desert steppes; and the emission was also 2392.61% and 24836.33% higher in sheepfold area than enclosed and grazing areas for wet typical steppe, and 1462.34% and 3892.62% higher for dry typical steppe, and 10409.68% higher in sheepfold area than enclosed area for desert steppe (Figures 5D; S7D).
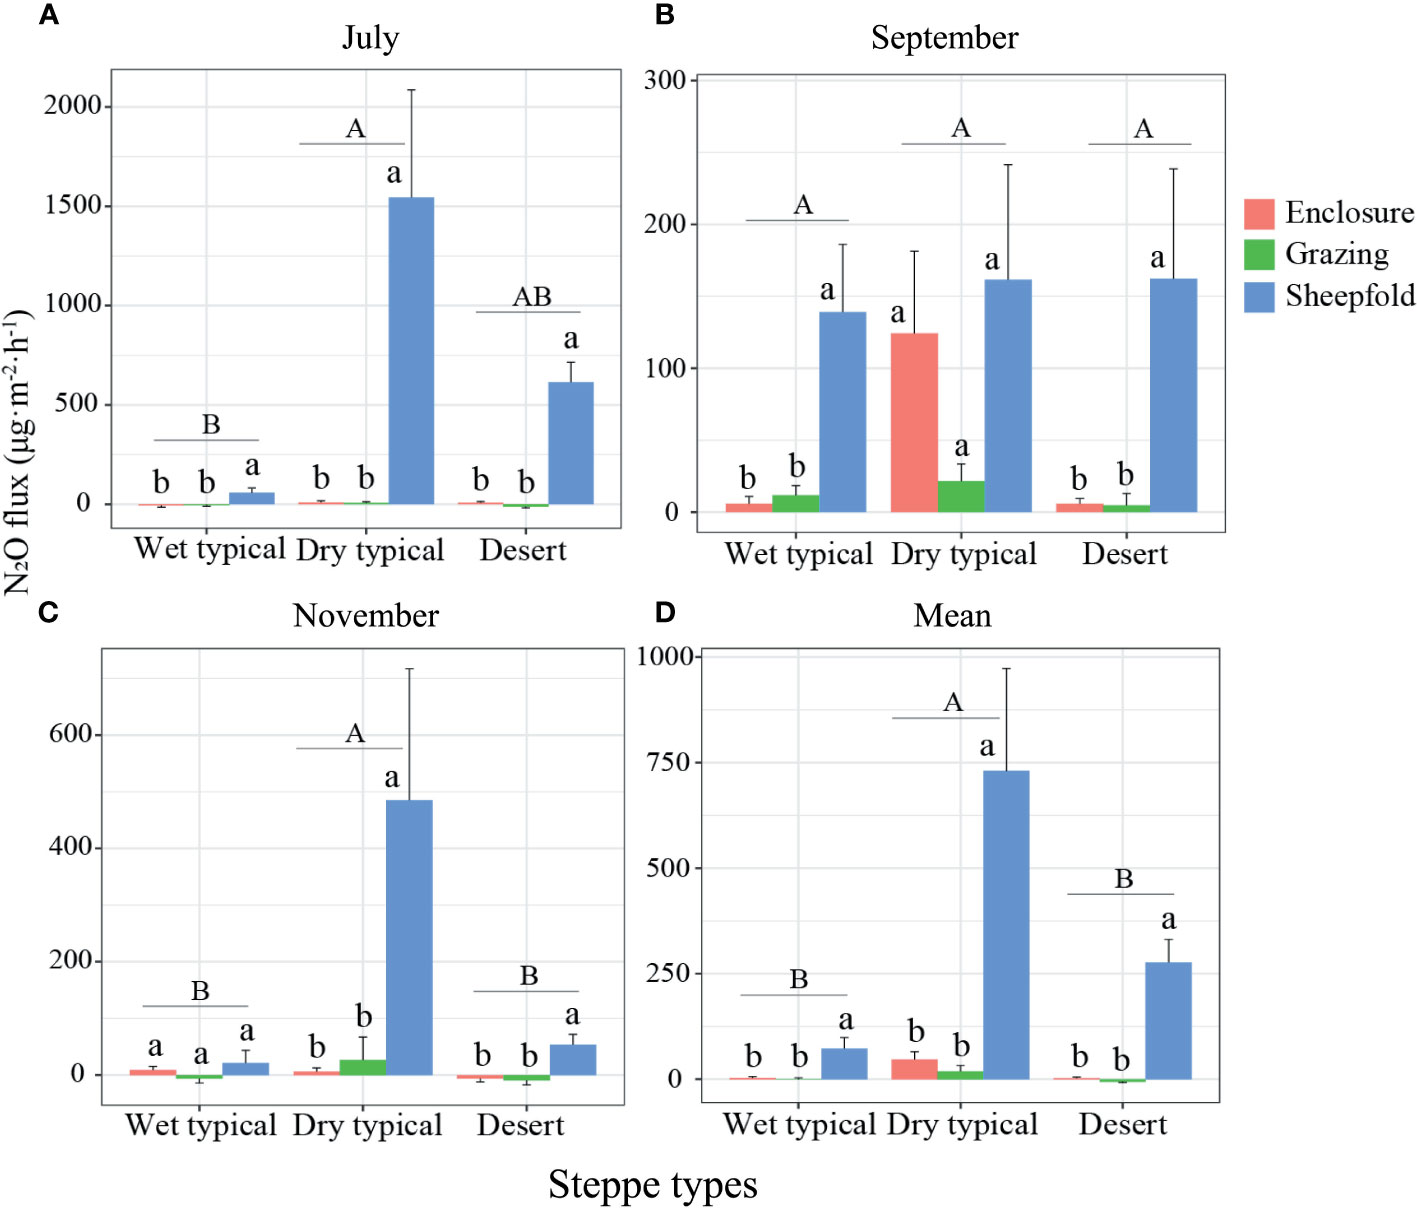
Figure 5 Variation in N2O emission in July (A), September (B) and November (C), and their mean across the season (D) at different management areas (enclosure, grazing, sheepfold) across three steppe sites (wet typical, dry typical, desert) in Inner Mongolia. Different lowercase and uppercase letters indicate significant differences (P< 0.05) between management types (n=9) and steppe types (n=27), respectively, after using Duncan’s test for post hoc comparisons. Error bars represent ±1 SE.
Similarly, the total GWPs of GHG emissions were significantly higher in the dry typical steppe than in other two steppe types in July and September; the emissions were also significantly higher in sheepfold area than in enclosed and grazing areas at dry typical and desert steppes in July, and higher in sheepfold area than in grazing area at three steppes in September (Figures 6A, B; S7A, B). In November, although no significant difference was detected in the total GHG emissions among steppe types, the emissions were significantly higher in sheepfold area than in enclosed and grazing areas in dry typical steppe (Figures 6C; S8C). Mean seasonal emissions of the total GHGs were 233.69% and 156.47% higher in dry typical steppe than in wet typical and desert steppes; and the emissions in sheepfold area were significantly higher than in enclosed and grazing areas, by 309.56% and 547.53% in dry typical steppe, and 188.50% and 310.02% in desert steppe (Figures 6D; S8D).
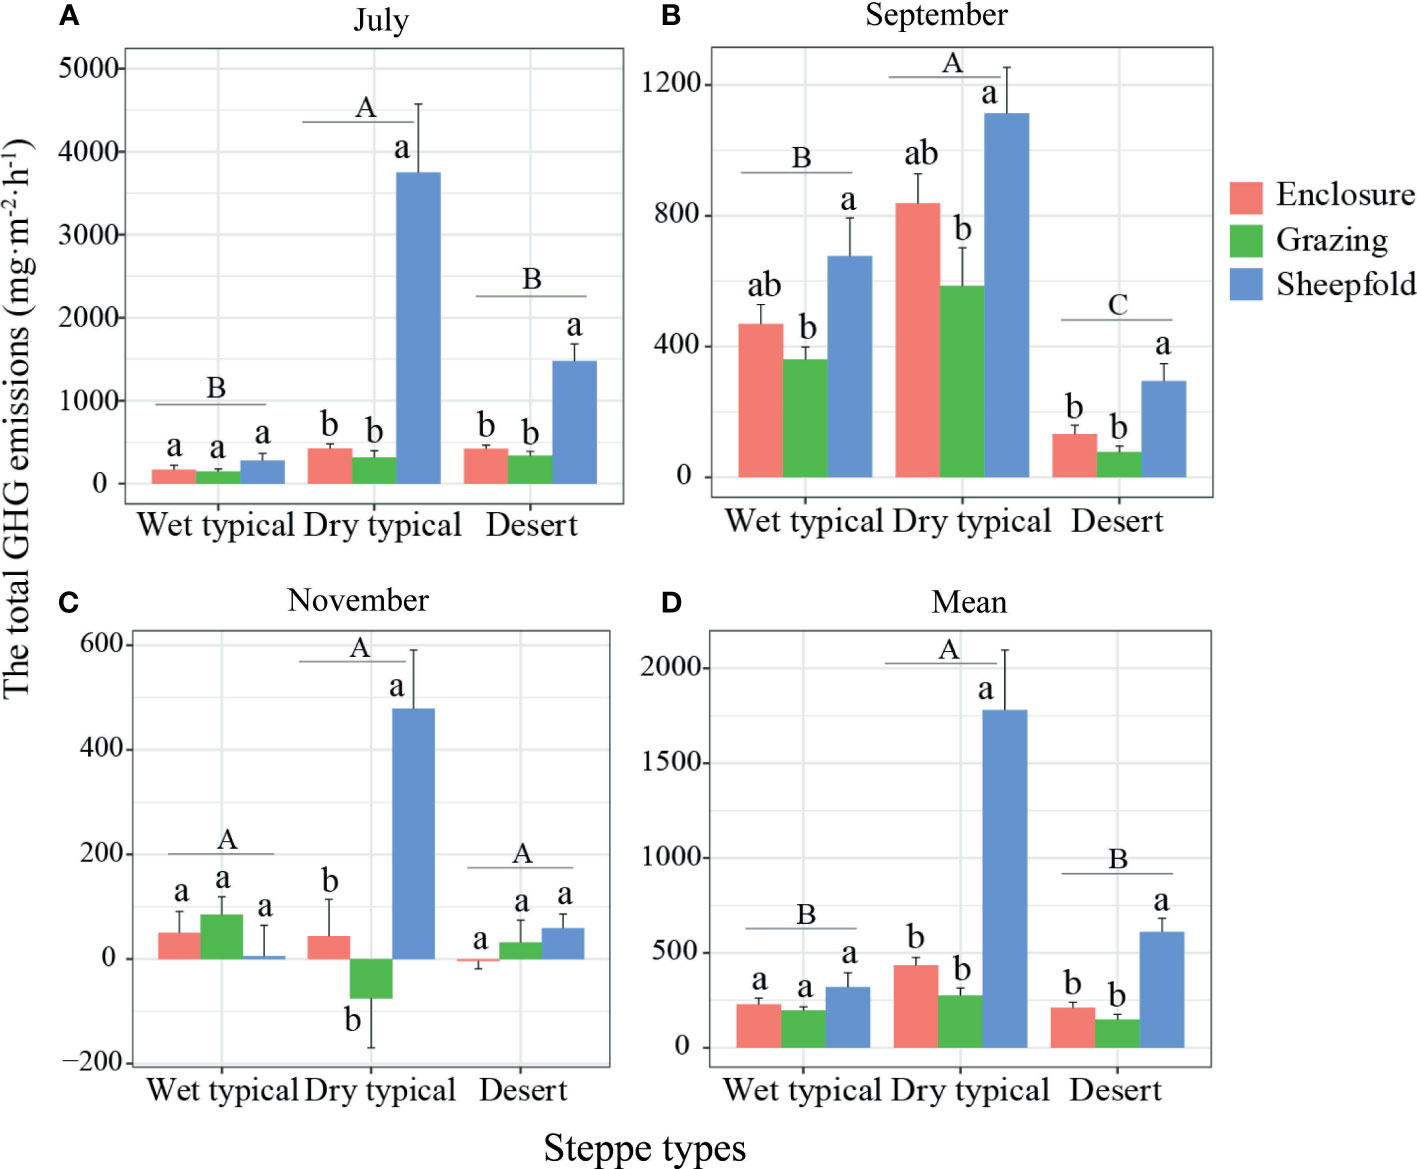
Figure 6 Variation in the total GHG emissions in July (A), September (B) and November (C) and their mean across the season (D) at different management areas (enclosure, grazing, sheepfold) across three steppe sites (wet typical, dry typical, desert) in Inner Mongolia. Different lowercase and uppercase letters indicate significant differences (P< 0.05) between management types (n=9) and steppe types (n=27), respectively, after using Duncan’s test for post hoc comparisons. Error bars represent <1 SE.
Relative effects of soil and vegetation factors on GHG fluxes
CO2 flux
The relationships of GHG fluxes with soil and vegetation factors varied with steppe and management types. OLR showed that CO2 flux was positively related with TOC but negatively related with soil temperature and species richness, whereas PLR showed that CO2 flux could be significantly explained by TOC, TN, pH and species richness, in all steppe regions and management areas (Table S1; Figures 7A–D). Both OLR and PLR showed that soil moisture and species richness had significant effects on CO2 flux in wet typical and desert steppes, respectively; CO2 flux was positively related with TOC but negatively related with soil temperature, AGB and species richness based on OLR, whereas this could only be explained by soil temperature and species richness based on PLR, in dry typical steppe (Table S1). In sheepfold area, although no significant relations were detected between CO2 flux and soil/vegetation factors based on OLR, CO2 flux could be significantly explained by TOC and soil pH based on PLR (Table S1).
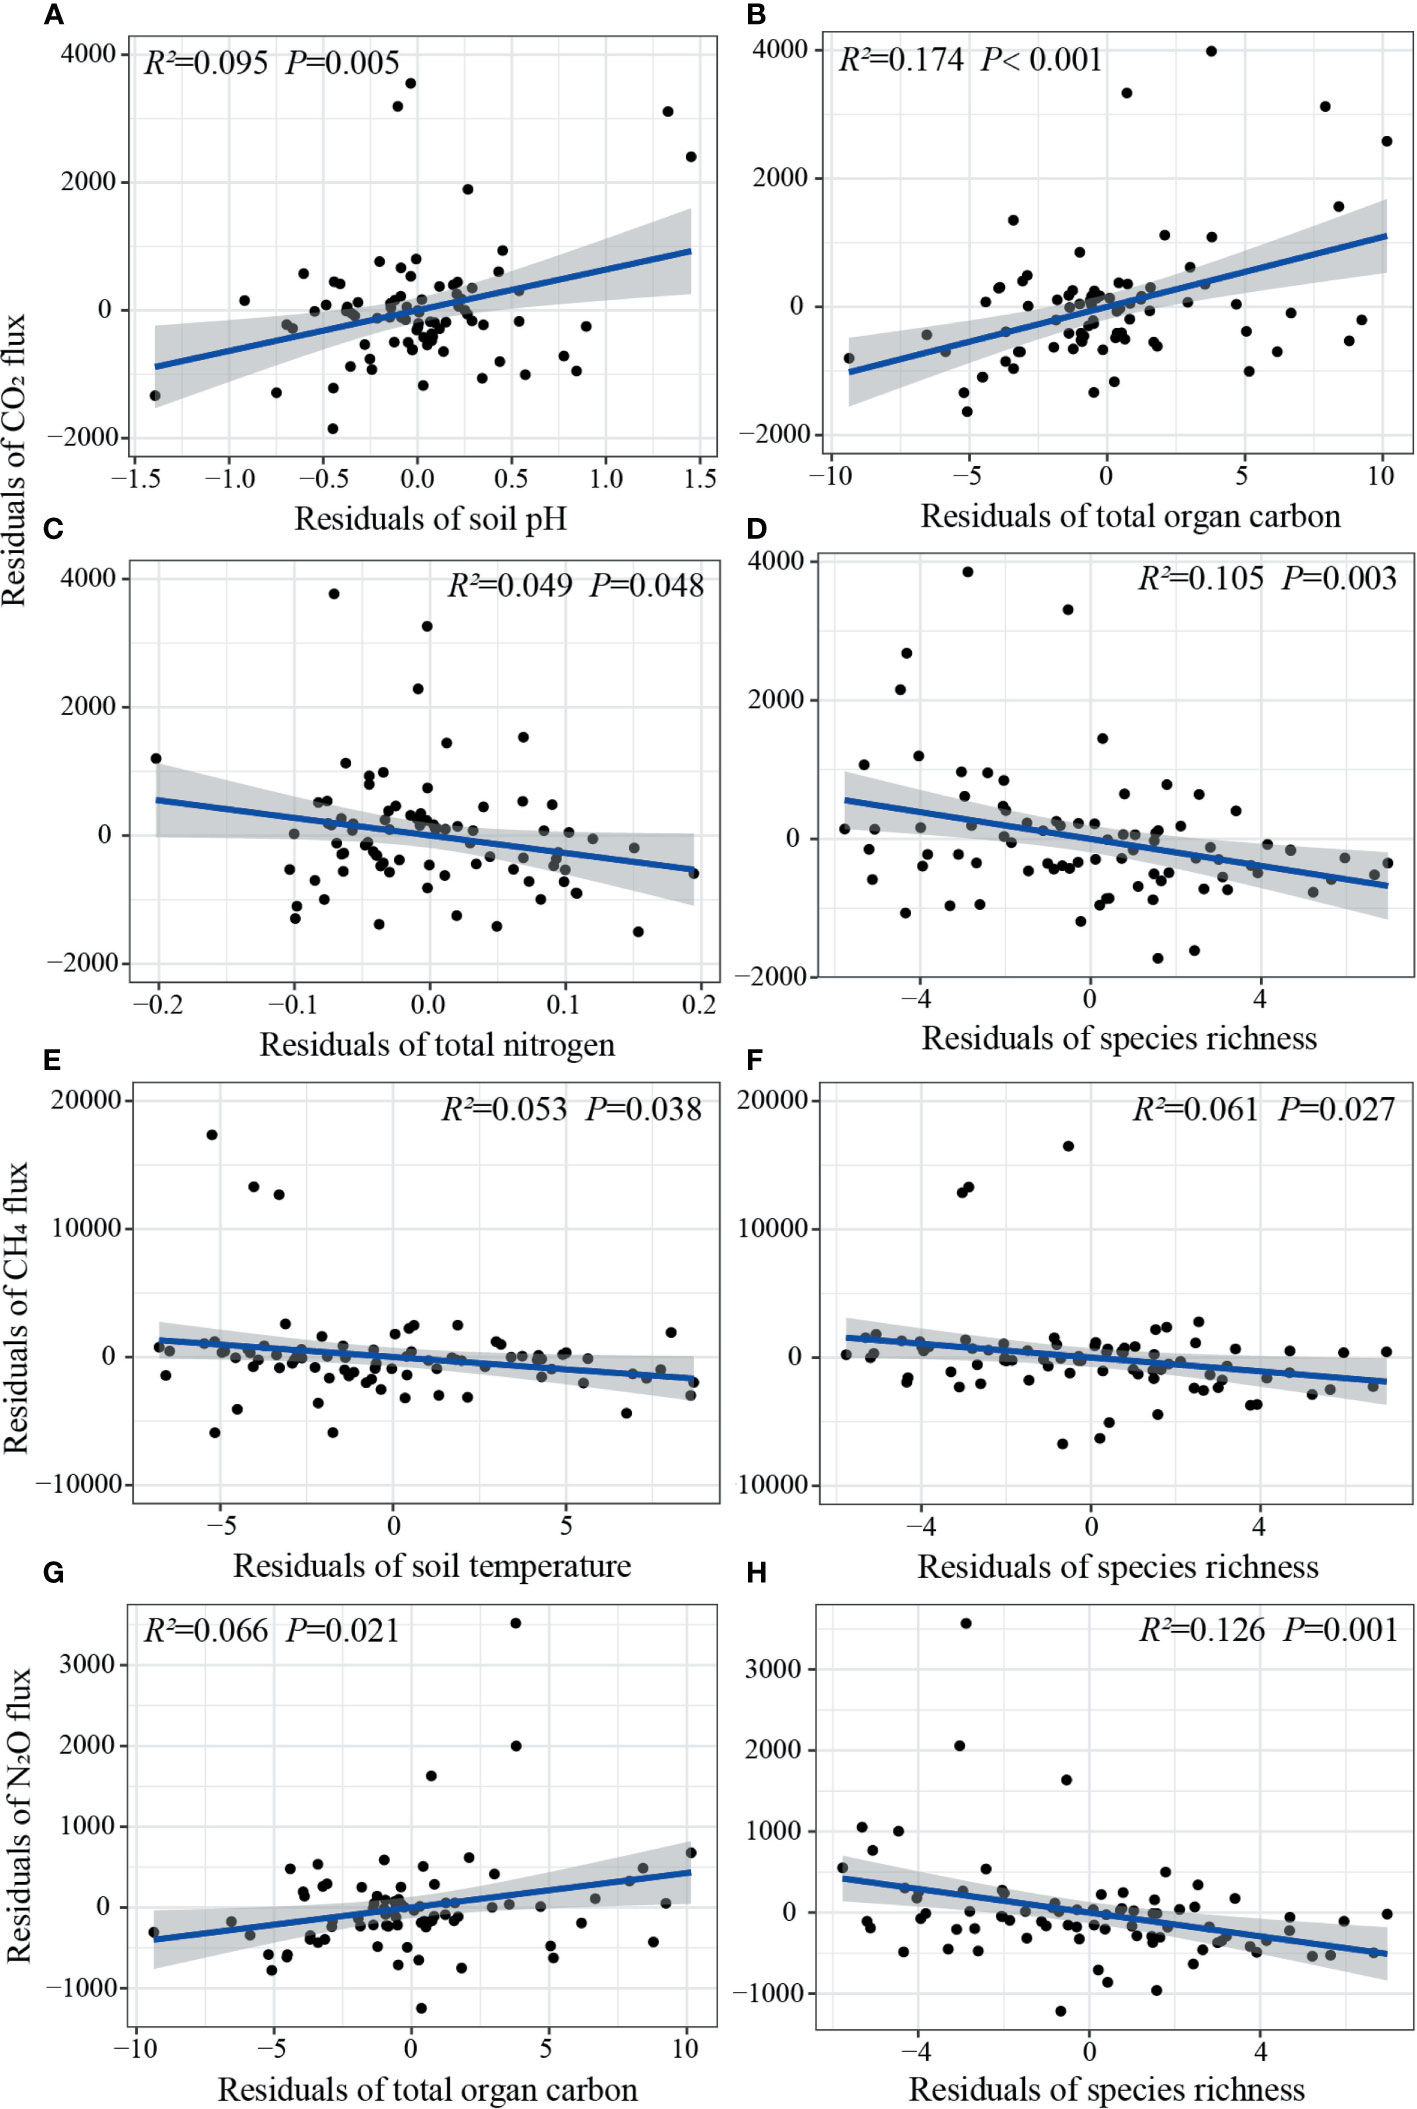
Figure 7 The relative effects of soil and vegetation factors on CO2 (A–D), CH4 (E, F), and N2O (G, H) fluxes (n=81). The blue line is fitted from a partial linear regression (PLR), with only significant lines (P< 0.05) shown. Shaded areas show 95% confidence interval of the fit.
A total of 33.6% of the variation of CO2 flux across all steppe regions and management areas could be explained by these selected factors based on variance partition analysis, which identified that soil chemical factors (11.8%) were the most important contributors to the variation of CO2 flux (Figure 8A). The analysis also identified that soil physical factors in wet typical steppe (34.4%), soil physical, chemical and vegetation factors together in dry typical steppe (22.0%), vegetation attributes in desert steppe (24.9%), soil physical and chemical factors together in enclosed area (22.1%), soil physical and vegetation factors together in grazing area (19.8%), and soil chemical factors in sheepfold area (28.5%), were the most important contributors to the variation of CO2 flux (Figures S9; S10A, D, G).
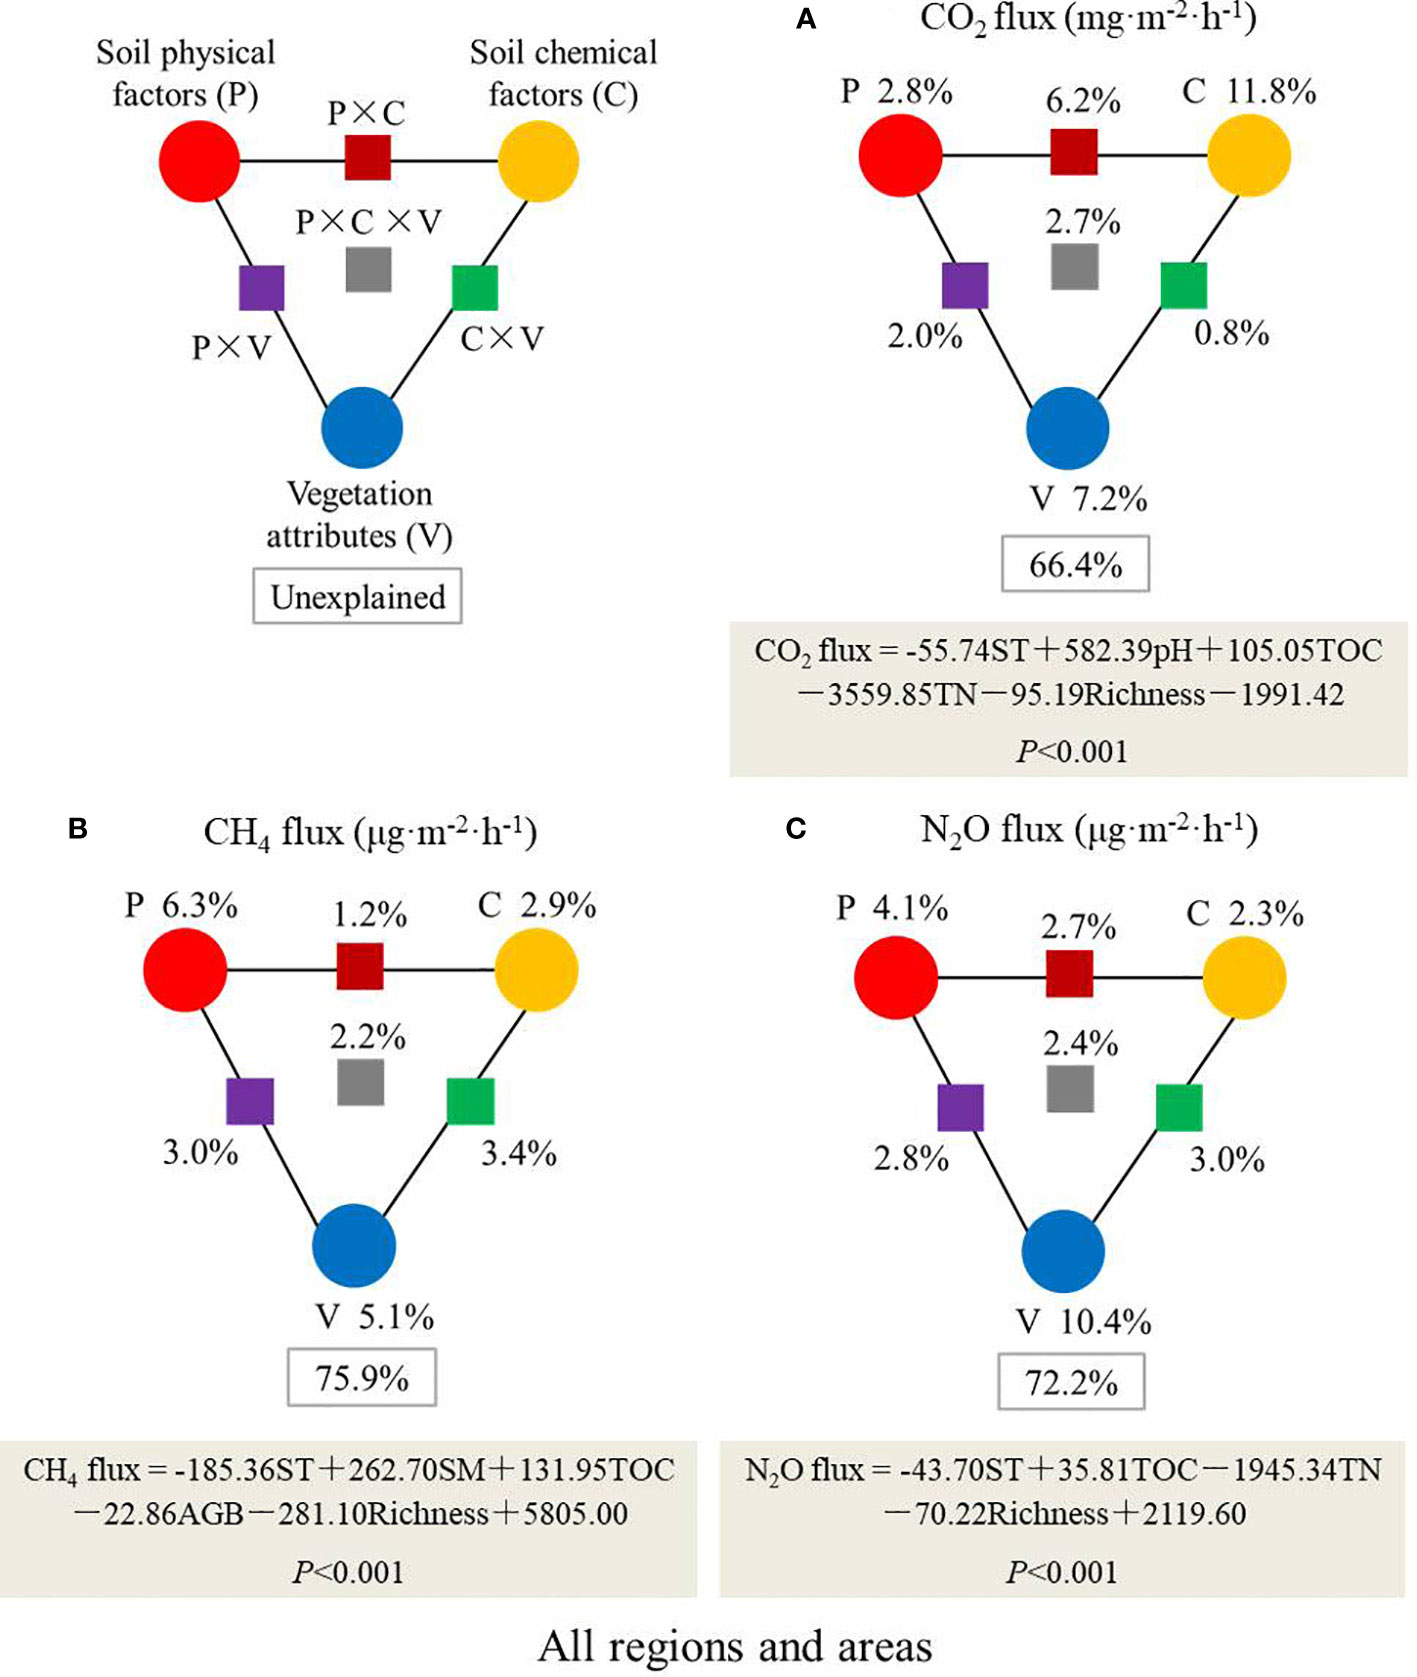
Figure 8 Variation partitioning and stepwise regression analyses identify the relative contributions of soil physical factors (temperature [ST] and moisture [SM]), chemical factors (total organ carbon [TOC], total nitrogen [TN] and pH), and vegetation attributes (aboveground biomass [AGB] and species richness) to GHG fluxes (A: CO2 flux; B: CH4 flux; C: N2O flux) across all steppe regions and management areas (n=81). The circles indicate individual group by dissecting out the effects of other groups. The squares indicate the interactive effects between different groups. The gray boxes indicate the formula and P value of the stepwise regression for each GHG.
CH4 flux
Based on OLR, CH4 flux had a significant positive relationship with TOC but negative relationships with soil temperature, AGB and species richness, whereas only soil temperature and species richness had main effects on CH4 flux based on PLR, in all steppe regions and management areas (Table S1; Figures 7E, F). OLR also showed that CH4 flux had significant negative relationships with soil temperature, AGB, and species richness in dry typical steppe, and significant negative relationships with soil temperature and AGB in sheepfold area; however, PLR showed that only species richness in dry typical steppe, and soil temperature and soil moisture in sheepfold area, significantly affected CH4 flux (Table S1).
Soil and vegetation factors together explained 24.1% of the variation of CH4 flux, and the variance partition analysis identified that soil physical factors (6.3%) were the most important contributors to the variation of CH4 flux across all regions and areas (Figure 8B). The interactions among soil physical, chemical and vegetation factors in wet (17.9%) and dry (15.3%) typical steppes, vegetation attributes in desert steppe (25.2%), soil physical factors in enclosed area (22.7%), sheepfold area (32.5%), and soil chemical factors in grazing area (16.5%), were the main contributors to the variation of CH4 flux (Figures S9; S10B, E, H).
N2O flux
OLR showed that N2O flux was positively related with TOC but negatively related with soil temperature, AGB and species richness in all steppe regions and management areas and in dry typical steppe, whereas PLR showed that only TOC and species richness in all regions and areas, species richness in dry typical steppe, significantly accounted for N2O emission (Table S1; Figures 7G, H); although N2O flux was significantly related with different soil and vegetation factors in wet typical or desert steppe based on OLR, soil moisture in wet typical steppe and TN and species richness in desert steppe significantly affected N2O emission based on PLR. OLR also showed that N2O emission was negatively related with soil temperature and AGB, whereas PLR showed that soil temperature, pH and species richness significantly accounted for N2O emission, in sheepfold area (Table S1).
A total of 27.8% of the variation of N2O flux across all regions and areas could be explained by these soil and vegetation factors, and the variance partition analysis identified that vegetation attributes (10.4%) were the most important contributors affecting N2O emission (Figure 8C). Moreover, soil physical factor in wet typical steppe (29.6%), soil physical, chemical and vegetation factors together in dry typical steppe (18.2%), vegetation attributes in desert steppe (33.8%), soil chemical factors in grazing area (15.9%), and soil physical factors in sheepfold area (12.4%), were the most important contributors affecting N2O emission (Figures S9; S10C, F, I).
Discussion
Response of soil and vegetation variables across management and steppe types
Our results show that soil and vegetation factors vary with management and steppe types. The higher soil TOC and TN contents in wet and dry typical steppes than desert steppe is likely resulted from the higher plant biomass and higher contents of silt and clay formed under a relatively less dry climate (Xu et al., 2018) (Figures 2C, D; S4C, D). Sheepfold plots show a higher soil TOC content in all three steppes and TN content in wet typical and desert steppes than enclosed plots (Figures 2C, D; S4C). This could be associated with large inputs of urine and dung deposition at sheepfold plots (Shi et al., 2017). Universally, soil drying may have higher soil pH caused by higher content of CaCO3 and cations in top layers in arid and semi-arid zones (Bhattacharyya et al., 2004; Cui et al., 2005). This is in consistence with the result of our study showing that soil pH is highest, whereas mean soil moisture is lowest in desert steppe (Figures 2B, E; S4B, E). Low soil moisture and high soil pH, moreover, also have adverse influences on nutrient uptake and availability, and subsequently on plant growth (Proulx and Mazumder, 1998), resulting in a lower AGB in desert steppe (Figures 2F; S4F). Despite the lowest AGB, the plant species richness in the studied desert steppe site is significantly higher than that in wet typical steppe site (Figures 2G; S4G). Inspection of species data reveals that the richness of annual or biennial plants in desert steppe increases remarkably, such as Eragrostis minor, S. collina and Corispermum declinatum. As such, we speculate that the large increase of these species following more summer precipitation in desert steppe in July contributes to the increase in plant diversity (Figures S3A, D). The low plant richness in sheepfold area compared to enclosed and grazing areas across three steppe types may be attributed to the high soil compactness and low soil nutrients availability induced by high grazing intensity (Davidson et al., 2017; Sugai et al., 2020) (Figures 2G; S4G).
Seasonal variations of greenhouse gas emissions and their driving factors across management and steppe types
CO2 emission
Our results show a seasonal variation of CO2 emission in grassland soils of the Inner Mongolia, and the highest CO2 emission (in July or mean over the season) occurs in dry typical steppe while the lowest in wet typical steppe (Figure 3). Previous studies have indicated that favorable soil temperature and moisture are the two predominant environmental factors for massive emissions of CO2 (Jiang et al., 2010; Chen et al., 2019). As such, suitable soil temperature and moisture and high TOC content and AGB at dry typical steppe could be responsible for high level of CO2 emission (Figures 2; S4), which may enhance soil organic carbon mineralization by improving microbial activity (Wu et al., 2010). This finding is also supported by the result of variance partition analysis that the interactions among soil physical, chemical and vegetation factors are the most important contributors affecting CO2 emission in dry typical steppe (Figure S9D). The low soil moisture at plant peak growing season (July) in wet typical steppe region may be related to the recorded low CO2 emission (Figure S3A), as it reduces soil respiration (Wei et al., 2012). We have observed significantly higher CO2 emission in sheepfold area than other areas in dry typical and desert steppes (Figures 3A, D; S5A, D), which confirms the findings in previous studies that sheepfolds are intensive hot spot sources of GHG in semi-arid grasslands (Chen et al., 2011; Chen et al., 2022). The high CO2 emission in sheepfold area is closely associated with the deposition of large amounts of excreted urine and feces and the high TOC content (Figures 2C; S4C). We also show that soil TOC content and pH in sheepfold plots can exclusively explain the variation of CO2 flux, and soil chemical factors are the major factors affecting CO2 emission (Table S1; Figure S10G). Thus, we speculate that animal excretions enhance CO2 emissions directly via hydrolysis of urea and indirectly via decomposition of organic carbon stimulated by newly excreted nitrogen in the topsoil (Petersen et al., 2004; Saggar et al., 2004; Chen et al., 2011).
Moreover, CO2 flux can be significantly and positively explained by soil TOC content and pH based on PLR, and soil chemical factors are the main drivers for CO2 emission across all steppe regions and management areas (Figures 7A, B; 8A). Several studies have suggested that soil microbial respiration seems to be higher at high pH than at low pH (Nambu et al., 2008; Wang et al., 2013). The higher soil pH has significantly higher CO2-to-TOC ratio, resulting in enhanced soil TOC mineralization in alkaline soils (Nambu et al., 2008). CO2 flux, however, can also be significantly and negatively explained by species richness in all regions and areas (Figure 7D). The reason may be that increasing plant diversity positively regulates C storage and reduces C losses due to complementarity effects in the soil, and consequently decreases CO2 release and mitigates the greenhouse effect (Maucieri et al., 2016).
CH4 emission
Sheepfold area is generally a CH4 source, which is most apparent in July and September in dry typical steppe, while other grassland areas are commonly a CH4 sink (Figure 4). CH4 emission or uptake primarily depends on the balance of the consumption by methanotrophs and the production by methanogens (Li et al., 2015). Studies have suggested that higher soil moisture is beneficial to the production of CH4 in the soil, but not to the oxidization of CH4 and the diffusion of atmospheric CH4 into soil (Shi et al., 2017). We assume that the high soil moisture, TOC content and AGB in dry typical steppe provide favorable conditions and sufficient substrates for the activities of methanogenic microbes, thus promoting the release of CH4 (Figures 2; S4), as indicated by the results of variation partition analysis that soil physical, chemical and vegetation factors jointly drive the variation of CH4 flux in dry typical steppe (Figure S9E).
In addition, sheepfold areas also have significantly bigger CH4 flux (in July and mean over the season) than enclosed and grazing areas in dry typical and desert steppes (Figures 4A, D; S6A, D), and CH4 emission in sheepfold areas can be independently explained by soil temperature and moisture (soil physical factors) (Table S1; Figure S10H). Some studies have indicated that the optimum soil temperature for the CH4 uptake/emission is close to 25°C (Mohanty et al., 2007; Xu and Inubushi, 2009). The dramatically enhanced CH4 emission in sheepfold area in July might be attributed to accelerated stimulation of methanogenic activities and CH4 release from the fresh urine and feces deposition induced by advantageous soil temperature and water conditions (Saggar et al., 2004; Chen et al., 2011) (Figures S2; S3A, D); also, the reduction of soil aeration due to soil compaction may further promote the production of CH4 (Shi et al., 2017).
The magnitude of CH4 flux is mainly affected by soil temperature and species richness when all steppe regions and management areas are taken into account (Figures 7EF). As mentioned above, CH4 emission is temperature sensitive, and the emission possibly decreases as temperature rises above a certain point (Xu and Inubushi, 2009). Significantly negative relationship of CH4 flux with plant richness may be related to the increased inorganic N concentrations induced by decreased plant diversity, such as NH4-N, which has been shown to inhibit CH4 oxidation (Wu et al., 2010; Niklaus et al., 2016).
N2O emission
N2O production in soils is mainly driven by nitrification and denitrification mediated by microorganisms under aerobic and anaerobic conditions, respectively (Li et al., 2015). Similar to the results for CO2 emission, N2O emission (in July and mean over the season) is also highest in dry typical steppe and lowest in wet typical steppe (Figure 5), which may indicate dry typical steppe having the optimal soil physiochemical conditions for nitrification and denitrification (Li et al., 2015) (Figures 2, S4; S9F). Although soil temperature in wet typical steppe is relatively higher, the N2O flux is still lowest due to low soil moisture in July (Figures S2; S3A, D), which is also consistent with our finding showing that soil water content is the most important predictor for N2O emission in wet typical steppe (Table S1; Figure S9C). As expected, sheepfold area also has significantly higher N2O flux (in July and mean over the season) than enclosed and grazing areas, with the effect being more pronounced in dry typical and desert steppes than in wet typical steppe (Figures 5A, D; S7A, D). It is also shown, in the present study, that soil temperature is the key predictor of N2O emission in sheepfold plots (Table S1; Figure S9I). Previous studies have suggested that soil temperature between 5°C and 20°C plays a crucial role in N2O production, and heat stress on substances probably occurs when soil temperature is much higher than 20°C, which may lead to a decrease of N2O emission (Horváth et al., 2010). Combined with the favorable soil temperature in July and the increased soil compactness by animal trampling, these elevate the denitrification rate and may be one of the reasons for the high N2O emission in sheepfold plots (Hu et al., 2010) (Figures S2A, D). Another possible reason is that large amounts of fresh urine and feces provide degradable carbon and nitrogen substrates, which can directly motivate the nitrifiers and denitrifiers in soil to generate N2O (Chen et al., 2011; Chen et al., 2022).
C and N cycles are tightly coupled, and the rate of C cycle determines the size of soil inorganic N pool (Thornton et al., 2009). As such, our results show that soil TOC content is the key predictor for N2O emission across all steppe regions and management areas (Figure 7G). N2O emission is also largely and negatively affected by species richness, and vegetation attributes are the important contributors affecting N2O emission in all regions and areas (Figures 7H; 8C). This finding is in agreement with previous studies of Niklaus et al. (2016) stating that high plant diversity constrains soil N loss by niche complementarity and promotes more efficient resource capture, that is, decreases soil NH+4 and NO−3 concentrations and thereby decreases N2O production.
Based on the above results, we further evaluate the contribution rate of GHG emissions from sheep areas to the total grassland ecosystems. The mean seasonal emissions of CO2, N2O and the total GHGs from the sheepfolds account for 4.99%, 57.00% and 6.56% of the total emissions, respectively, and mean seasonal CH4 emission from the sheepfolds accounts for 1.82% of the total absorptions. This result again suggests that sheep areas are an intensive source of GHGs, especially for N2O. However, in the present study, we also note that all results of GHG fluxes are based on only three measurements in July, September, and November in one year, and that the gas fluxes vary greatly from season to season or even day to day. Future studies need to increase sampling frequencies and sampling points for continuous measurement in different seasons and years to verify these results. Despite this caveat, our study does indicate it critically important to develop effective mitigation strategies for sustainable grassland management in sheepfold areas.
Conclusion
From this study, we find that grassland management and grassland types significantly influence soil GHG (CO2, CH4 and N2O) emissions. The highest GHG emission (in July and the mean over the season) occurs in dry typical steppe, and the high emission is closely related to better soil temperature and moisture conditions, high TOC content, and high AGB. Compared to the enclosed and grazing areas, sheepfold areas are intensive hotspot sources of GHGs and significantly increase the mean seasonal emissions of the total GHGs by 309.56% and 547.53% in dry typical steppe, and 188.50% and 310.02% in desert steppe. The reason may be due to the sufficient substrate supply from fresh urine and feces and favorable soil temperature and moisture conditions for fermentation and nitrification/denitrification. The key factors affecting CO2 emission in sheepfold areas are soil TOC content and pH, while those affecting CH4 and N2O emissions are soil temperature and moisture. Across all steppe regions and management areas, the emissions of three GHGs can be significantly and negatively explained by species richness, which may be the result of indirect effects by the changes in soil TOC and TN. These results are conducive to estimating the contributions of sheepfold areas to the regional GHG production in different steppe regions under the projected global change, as well as to developing grassland management for mitigating GHG emissions by applying more intensive management in sheepfold areas.
Data availability statement
The raw data supporting the conclusions of this article will be made available by the authors, without undue reservation.
Author contributions
XW: Formal Analysis, Visualization, Writing—Original Draft, Writing—Review and Editing. XG: Investigation. DZ: Investigation. HW: Investigation. HL: Visualization. FL: Conceptualization, Writing—Review and Editing.
Funding
This study was supported by the Ministry of Science and Technology of China (Science and Technology Support Plan Project 2015BAC02B04) and by the Inner Mongolia Department of Science and Technology (Key Fundamental Research Project 201503001 and the Funding for building Grassland Ecosystem Research Capability).
Conflict of interest
The authors declare that the research was conducted in the absence of any commercial or financial relationships that could be construed as a potential conflict of interest.
Publisher’s note
All claims expressed in this article are solely those of the authors and do not necessarily represent those of their affiliated organizations, or those of the publisher, the editors and the reviewers. Any product that may be evaluated in this article, or claim that may be made by its manufacturer, is not guaranteed or endorsed by the publisher.
Supplementary material
The Supplementary Material for this article can be found online at: https://www.frontiersin.org/articles/10.3389/fevo.2023.1229208/full#supplementary-material
References
Bhattacharyya T., Pal D., Chandran P., Mandai M., Ray S., Gupta R., et al. (2004). Managing Soil Carbon Stocks in the Indo-Gangetic Plains, India. (New Delhi: Rice-Wheat Consortium for the Indo-Gangetic Plains).
Braun M., Bai Y., McConkey B. G., Farrell R., Romo J., Pennock D. (2013). Greenhouse gas flux in a temperate grassland as affected by landform and disturbance. Landscape Ecol. 28, 709–723. doi: 10.1007/s10980-013-9878-9
Bureau of Statistic of Inner Mongol. (2007). Inner Mongolia yearbook 2007. (Beijing, China: Statistic Press).
Cavigelli M. A., Robertson G. P. (2001). Role of denitrifier diversity in rates of nitrous oxide consumption in a terrestrial ecosystem. Soil Biol. Biochem. 33, 297–310. doi: 10.1016/S0038-0717(00)00141-3
Chen H., Li S., Zheng X., Liu C., Kuzyakov Y. (2022). Annual greenhouse gas emissions from sheepfolds and cattle sheds. Soil Use Manage 38, 369–380. doi: 10.1111/sum.12735
Chen W., Wolf B., Brüggemann N., Butterbach-Bahl K., Zheng X. (2011). Annual emission of greenhouse gases from sheepfolds in Inner Mongolia. Plant Soil 340, 291–301. doi: 10.1007/s11104-010-0367-5
Chen W., Zheng X., Wolf B., Yao Z., Liu C., Butterbach-Bahl K., et al. (2019). Long-term grazing effects on soil-atmosphere exchanges of CO2 , CH4 and N2O at different grasslands in Inner Mongolia: a soil core study. Ecol. Indic 105, 316–328. doi: 10.1016/j.ecolind.2017.09.035
Cui X., Wang Y., Niu H., Wu J., Wang S., Schnug E., et al. (2005). Effect of long-term grazing on soil organic carbon content in semiarid steppes in Inner Mongolia. Ecol. Res. 20, 519–527. doi: 10.1007/s11284-005-0063-8
Davidson K., Fowler M., Skov M., Doerr S. H., Beaumont N., Griffin J. (2017). Livestock grazing alters multiple ecosystem properties and services in salt marshes: a meta-analysis. J. Appl. Ecol. 54, 1395–1405. doi: 10.1111/1365-2664.12892
EPA (2012). Summary Report: Global Anthropogenic Non-CO2 Greenhouse Gas Emissions: 1990–2030 (Washington, D.C., United States: Office of Atmospheric Programs, Climate Change Division, US Environmental Protection Agency).
Frank A. B., Liebig M. A., Hanson J. D. (2002). Soil carbon dioxide fluxes in northern semiarid grasslands. Soil Biol. Biochem. 34, 1235–1241. doi: 10.1016/S0038-0717(02)00062-7
Garcia-Montiel D. C., Melillo J. M., Steudler P. A., Tian H., Neill C., Kicklighter D. W., et al. (2004). Emissions of N2O and CO2 from terra firme forests in Rondonia, Brazil. Ecol. Appl. 14, 214–220. doi: 10.1890/01-6023
Hewitt C. N., Jackson A. V. (2003). Handbook of Atmospheric Science: Principles and Applications (Malden: Blackwell Publishing).
Horváth L., Grosz B., Machon A., Tuba Z., Nagy Z., Czóbel S., et al. (2010). Estimation of nitrous oxide emission from Hungarian semi-arid sandy and loess grasslands; effect of soil parameters, grazing, irrigation and use of fertilizer. Agr Ecosyst. Environ. 139, 255–263. doi: 10.1016/j.agee.2010.08.011
Hu Y., Chang X., Lin X., Wang Y., Wang S., Duan J., et al. (2010). Effects of warming and grazing on N2O fluxes in an alpine meadow ecosystem on the Tibetan plateau. Soil Biol. Biochem. 42, 944–952. doi: 10.1016/j.soilbio.2010.02.011
IPCC (2022). “Climate Change 2022: Mitigation of Climate Change,” in Contribution of Working Group III to the Sixth Assessment. Report of the Intergovernmental Panel on Climate Change. Computational Geometry (Cambridge, UK and New York, NY, USA: Cambridge University Press).
Jiang C., Yu G., Fang H., Cao G., Li Y. (2010). Short-term effect of increasing nitrogen deposition on CO2, CH4 and N2O fluxes in an alpine meadow on the Qinghai-Tibetan Plateau, China. Atmos Environ. 44, 2920–2926. doi: 10.1016/j.atmosenv.2010.03.030
Koncz P., Pintér K., Balogh J., Papp M., Hidy D., Csintalan Z., et al. (2017). Extensive grazing in contrast to mowing is climate-friendly based on the farm-scale greenhouse gas balance. Agr Ecosyst. Environ. 240, 121–134. doi: 10.1016/j.agee.2017.02.022
Li Y., Liu S., Zhou H., Gao Q., Cao G., Wang X., et al. (2015). Seasonal changes of CO2, CH4 and N2O fluxes in different types of alpine grassland in the Qinghai-Tibetan Plateau of China. Soil Biol. Biochem. 80, 306–314. doi: 10.1016/j.soilbio.2014.10.026
Liu C., Holst J., Yao Z., Brüggemann N., Butterbach-Bahl K., Han S., et al. (2009). Growing season methane budget of an Inner Mongolian steppe. Atmos Environ. 43, 3086–3095. doi: 10.1016/j.atmosenv.2009.03.014
Maucieri C., Mietto A., Barbera A., Borin M. (2016). Treatment performance and greenhouse gas emission of a pilot hybrid constructed wetland system treating digestate liquid fraction. Ecol. Eng. 94, 406–417. doi: 10.1016/j.ecoleng.2016.05.062
Mohanty S. R., Bodelier P. L. E., Conrad R. (2007). Effect of temperature on composition of the methanotrophic community in rice field and forest soil. FEMS Microbiol. Ecol. 62, 24–31. doi: 10.1111/j.1574-6941.2007.00370.x
Nambu K., Hees P. A. W., Jones D., Vinogradoff S., Lundström U. S. (2008). Composition of organic solutes and respiration in soils derived from alkaline and non-alkaline parent materials. Geoderma 144, 468–477. doi: 10.1016/j.geoderma.2007.12.014
Niklaus P., Roux X., Poly F., Buchmann N., Scherer-Lorenzen M., Weigelt A., et al. (2016). Plant species diversity affects soil–atmosphere fluxes of methane and nitrous oxide. Oecologia 181, 919–930. doi: 10.1007/s00442-016-3611-8
Petersen S., Stamatiadis S., Christofides C. (2004). Short-term nitrous oxide emissions from pasture soil as influenced by urea level and soil nitrate. Plant Soil 267, 117–127. doi: 10.1007/s11104-005-4688-8
Proulx M., Mazumder A. (1998). Reversal of grazing impact on plant species richness in nutrient-poor vs. nutrient-rich ecosystems. Ecology 79, 2581–2592. doi: 10.1890/0012-9658(1998)079[2581:ROGIOP]2.0.CO;2
Quinn G. P., Keough M. J. (2002). “Multiple and complex regression,” in Experimental Design and Data Analysis for Biologists: Multiple and complex regression. Eds. Quinn G. P., Keough M. J. (New York, NY: Cambridge University Press), 111–154.
R Core Team (2021). R: A language and environment for statistical computing (Vienna, Austria: R Foundation for Statistical Computing).
Saggar S., Bolan N., Bhandral R., Hedley C. B., Luo J. (2004). A review of emissions of methane, ammonia, and nitrous oxide from animal excreta deposition and farm effluent application in grazed pastures. New Zeal J. Agr Res. 47, 513–544. doi: 10.1080/00288233.2004.9513618
Shi H., Hou L., Yang L., wu D., Zhang L., Li L. (2017). Effects of grazing on CO2 , CH4 , and N2O fluxes in three temperate steppe ecosystems. Ecosphere 8, e01760. doi: 10.1002/ecs2.1760
Siqueira-Neto M., Popin G. V., Piccolo M. C., Corbeels M., Scopel E., Camargo P. B., et al. (2021). Impacts of land use and cropland management on soil organic matter and greenhouse gas emissions in the Brazilian Cerrado. Eur. J. Soil Sci. 72, 1431–1446. doi: 10.1111/ejss.13059
Skiba U., Jones S., Drewer J., Helfter C., Anderson M., Dinsmore K., et al. (2013). Comparison of soil greenhouse gas fluxes from extensive and intensive grazing in a temperate maritime climate. Biogeosciences 10, 1231–1241. doi: 10.5194/bg-10-1231-2013
Smith K. A., Ball T., Conen F. K., Dobbie K. E., Massheder J. M., Rey A. (2003). Exchange of greenhouse gases between soil and atmosphere: interactions of soil physical factors and biological processes. Eur. J. Soil Sci. 54, 779–791. doi: 10.1046/j.1351-0754.2003.0567.x
Sugai T., Yokoyama S., Tamai Y., Mori H., Marchi E., Watanabe T., et al. (2020). Evaluating soil–root interaction of hybrid larch seedlings planted under soil compaction and nitrogen loading. Forests 11, 947. doi: 10.3390/f11090947
Suttie J. M., Reynolds S. G., Batello C. (2005). Grasslands of the World: Plant Production and Protection Series, No. 34 (Rome: Food and Agriculture Organization of the United Nations).
Tang S., Wang C., Wilkes A., Zhou P., Jiang Y., Han G., et al. (2013). Contribution of grazing to soil atmosphere CH4 exchange during the growing season in a continental steppe. Atmos Environ. 67, 170–176. doi: 10.1016/j.atmosenv.2012.10.037
Thornton P., Doney S., Lindsay K., Moore J., Mahowald N., Randerson J., et al. (2009). Carbon-nitrogen interactions regulate climate-carbon cycle feedbacks: results from an atmosphere-ocean general circulation model. Biogeosciences 6, 2099–2120. doi: 10.5194/bg-6-2099-2009
Wang Y., Chen H., Zhu Q., Peng C., Wu N., Yang G., et al. (2014). Soil methane uptake by grasslands and forests in China. Soil Biol. Biochem. 74, 70–81. doi: 10.1016/j.soilbio.2014.02.023
Wang L., Delgado-Baquerizo M., Wang D., Isbell F., Liu J., Feng C., et al. (2019). Diversifying livestock promotes multidiversity and multifunctionality in managed grasslands. Proc. Natl. Acad. Sci. U.S.A. 116, 6187–6192. doi: 10.1073/pnas.1807354116
Wang L., Du H., Han Z., Zhang X. (2013). Nitrous oxide emissions from black soils with different pH. J. Environ. Sci. 25, 1071–1076. doi: 10.1016/S1001-0742(12)60129-6
Wang Y., Xue M., Zheng X., Ji B., Du R., Wang Y. (2005). Effects of environmental factors on N2O emission from and CH4 uptake by the typical grasslands in the Inner Mongolia. Chemosphere 58, 205–215. doi: 10.1016/j.chemosphere.2004.04.043
Wei D., Xu R., Wang Y., Wang Y., Liu Y., Yao T. (2012). Responses of CO2, CH4 and N2O fluxes to livestock exclosure in an alpine steppe on the Tibetan Plateau, China. Plant Soil 359, 45–55. doi: 10.1007/s11104-011-1105-3
Wolf B., Zheng X., Brüggemann N., Chen W., Dannenmann M., Han X.-G., et al. (2010). Grazing-induced reduction of natural nitrous oxide release from continental steppe. Nature 464, 881–884. doi: 10.1038/nature08931
Wu X., Yao Z., Brüggemann N., Shen Z., Wolf B., Dannenmann M., et al. (2010). Effects of soil moisture and temperature on CO2 and CH4 soil–atmosphere exchange of various land use/cover types in a semi-arid grassland in Inner Mongolia, China. Soil Biol. Biochem. 42, 773–787. doi: 10.1016/j.soilbio.2010.01.013
Xu X., Inubushi K. (2009). Responses of ethylene and methane consumption to temperature and pH in temperate volcanic forest soils. Eur. J. Soil Sci. 60, 489–498. doi: 10.1111/j.1365-2389.2009.01155.x
Keywords: greenhouse gas, steppe type, grassland management, vegetation attribute, soil factor, grazing
Citation: Wang X, Guo X, Zhou D, Wang H, Li H and Li FY (2023) Sheepfolds induce significant increase of seasonal CO2, CH4 and N2O emissions in temperate steppes of Inner Mongolia. Front. Ecol. Evol. 11:1229208. doi: 10.3389/fevo.2023.1229208
Received: 26 May 2023; Accepted: 10 July 2023;
Published: 24 July 2023.
Edited by:
Orsolya Valkó, Hungarian Academy of Sciences, HungaryReviewed by:
Shiming Tang, Chinese Academy of Agricultural Sciences, ChinaWeiwei Chen, Chinese Academy of Sciences (CAS), China
Longyu Hou, Chinese Academy of Sciences (CAS), China
Copyright © 2023 Wang, Guo, Zhou, Wang, Li and Li. This is an open-access article distributed under the terms of the Creative Commons Attribution License (CC BY). The use, distribution or reproduction in other forums is permitted, provided the original author(s) and the copyright owner(s) are credited and that the original publication in this journal is cited, in accordance with accepted academic practice. No use, distribution or reproduction is permitted which does not comply with these terms.
*Correspondence: Frank Yonghong Li, bGlmeWhvbmdAMTI2LmNvbQ==