 Yanglong Chen
 Zhilin He
 Tianming Yue
 Weichen Mu
 Fen Qin1,2,3,4*
- 1College of Geography and Environmental Science, Henan University, Kaifeng, China
- 2Key Laboratory of Geospatial Technology for the Middle and Lower Yellow River Regions, Ministry of Education, Henan University, Kaifeng, China
- 3Henan Industrial Technology Academy of Spatio-Temporal Big Data, Henan University, Kaifeng, China
- 4Henan Technology Innovation Center of Spatial-Temporal Big Data, Henan University, Kaifeng, China
Introduction: The Yellow River Basin (YRB) is not only a vital area for maintaining ecological security but also a key area for China’s economic and social development. Understanding its land-use change trends and habitat quality change patterns is essential for regional ecological conservation and effective resource allocation.
Methods: This study used the patch-generating land-use simulation (PLUS) and Integrated Valuation of Ecosystem Services and Trade-offs (InVEST) models to analyze and predict the spatial and temporal trends of habitat quality in the YRB from 2000 to 2030 under natural development (ND) and ecological conservation and high-quality development (ECD) scenarios. The PLUS model was used to predict land-use change in 2030 under different scenarios, after which the InVEST model was used to obtain the habitat quality distribution characteristics from the 2000–2030 period.
Results: (1) The mean values of habitat quality in the YRB in 2000, 2010, and 2020 were 0.6849, 0.6992, and 0.7001, respectively. The mean habitat quality values were moderately high. Spatial distribution characteristics were high in the west and low in the east and along the water. In 2030, habitat quality (0.6993) started to decline under ND, whereas under ECD, there was an indication of substantial improvement in habitat quality (0.7186). (2) The mean habitat degradation values in 2000, 2010, and 2020 were 0.0223, 0.0219, and 0.0231, respectively. The level of habitat degradation showed a decreasing trend, followed by an increasing trend with a stable spatial distribution pattern. The mean level of habitat degradation in 2030 (0.0241) continued to increase under ND, while a substantial decrease in the level of habitat degradation occurred under ECD (0.0214), suggesting that the level of habitat degradation could be effectively contained under the ECD scenario. (3) During the study period, the conversion of building land—both negative and positive—had the most pronounced impact on habitat quality per unit area. Further, the conversion of grassland was shown to be a key land transformation that may either lead to the deterioration or improvement of the ecological environment. The results provide scientifific theoretical support and a decision basis for ecological conservation and the high-quality development of the YRB.
1 Introduction
The United Nations conducted a Millennium Ecosystem Assessment and discovered a significant and overwhelming irreversible loss of biodiversity on Earth (Zhao and Zhang, 2004) China is considered one of the world’s most biologically diverse nations, while also being one of the most challenged and threatened. Especially since the 21st century, rapid urbanization has led to large-scale land-use conversion. The continuous outward expansion of urban areas has fragmented, degraded, and even led to the loss of several natural areas, resulting in a series of environmental problems such as habitat degradation and ecosystem imbalance (Esbah et al., 2009; Huang et al., 2020a).
“Habitat quality” is the term used to describe a habitat’s capacity to provide adequate living conditions for both individuals and populations (Hall et al., 1997; Goldstein et al., 2012). It is the foundation and prerequisite for all ecosystem services (Wang and Wang, 2021) as well as the key link between regional ecological security and human well-being (Fellman et al., 2015), serving as an important reflection of biodiversity (Terrado et al., 2016; Hillard et al., 2017). All types of human productive and living activities are based on the use and utilization of land. With the continuous development of land, the pattern, depth, and intensity of land use are constantly changing. These changes affect the material and energy flows between habitat blocks, thus changing the distribution patterns and functions of regional habitats. Therefore, land-use change can, to a certain extent, reflect the ecological quality of a site (Wan et al., 2017; Zhong and Wang, 2017; Huang et al., 2020b; Li et al., 2022). Hence, an in-depth analysis of how land-use changes affect local habitat quality is fundamental to achieve sustainable resource development and construct regional ecological conservation policies.
Presently, there are two types of methods for assessing ecological environment quality based on land-use: one establishes habitat quality research by constructing an ecological environment evaluation index system, and the other uses ecological assessment models for simulation. The common assessment models are the Multiscale Integrated Model of Ecosystem Services (Boumans et al., 2015), Social Values for Ecosystem Services (Brown and Brabyn, 2012), and Integrated Valuation of Ecosystem Services and Trade-offs (InVEST) models. Among them, the InVEST model has numerous advantages, including fewer input parameters, a friendly model interface, and simple operation. Furthermore, the inputs and outputs of the model, which are spatially distributed data, can be used directly for analysis, so InVEST models have been used in many studies. For instance, Li et al. (2022) assessed the spatial and temporal variation of habitat quality of the Yangtze River and found the normalized difference vegetation index to be significantly correlated with habitat quality. This and other studies have conducted habitat quality assessments at different regions and scales using the InVEST model, demonstrating its scientific validity and wide applicability.
Many researchers have developed land-use simulations and predictions using various methods such as cellular automaton (Van Dessel et al., 2011), Conversion of Land Use and its Effects at Small Region Extent (Verburg et al., 2002), and Future Land-Use Simulation models (Liu et al., 2017). However, existing land-use models are poorly equipped to determine the causes of land-use change, and simulating multiple land-use types from spatial and temporal dynamics is difficult. The patch-generating land-use simulation (PLUS) model can improve transformational rule mining and landscape dynamics simulation deficiencies. Numerous studies have used the PLUS model. For instance, Liang et al. (2021) found that it can obtain higher simulation accuracy by comparison. Wei et al. (2022) simulated the land-use in the Ebenezer Lake watershed under natural development and ecological conservation scenarios, and Zhang et al. (2022a) predicted the landscape ecological risks in the Fujian delta region in order to evaluate land-use efficiency more effectively. The simulation predictions of these studies were highly accurate, indicating that the PLUS model has universal applicability.
There are two main lines of research on habitat quality. The first one aims to quantify habitat quality changes in an area based on existing land-use changes, whereas the second aims to simulate future land-use patterns by establishing different scenarios to predict habitat quality changes. The scenarios used in the latter are mainly applicable to study areas of small size and relatively simple ecosystems. These scenarios are clearly not applicable for the YRB, where spatial heterogeneity is prominent. In a simulation study of land-use change in the YRB, it is important to fully consider the real characteristics of the region, especially because no relevant simulation study has been conducted since the “Outline of the Plan for Ecological Protection and High-Quality Development of YRB” became a national strategy. The launch of this planning outline has brought important opportunities and challenges for the ecological protection and high-quality development of the YRB; thus, it is necessary to improve existing methods and more accurately reflect land-use changes in this new context. Another contribution is to thoroughly explore the response relationship and contribution rate of land-use shifts to habitat quality in YRB in the last 20 years. Therefore, in this study, we evaluated and analyzed the spatial and temporal evolution of habitat quality in the YRB from 2000 to 2020. Our method, based on the PLUS model proposed in the last two years coupled with the InVEST model, was used to predict and analyze the land-use change and habitat quality in the YRB in 2030 under different scenarios. The aims of this study were to understand the trend of land-use change, explore the evolution pattern of habitat quality, reveal the relationship between these two variables, and provide a reference basis for ecological spatial restoration and high-quality development in the study area.
2 Materials and methods
2.1 Overview of the study area
The YRB, located between 96–119° E and 32–42° N (Figure 1), is the geographical and ecological area affected by the Yellow River system. The annual, daily, and seasonal temperature differences are relatively large throughout the basin, while precipitation is concentrated, unevenly distributed, and inter-annual. The YRB is surrounded by the Bayankara Mountain in the west, Bohai Sea to the east, Qinling Mountain to the south, and Yinshan Mountain to the north. The altitude is higher in the west and lower in the east. The Tibetan Plateau area, dominated by the plateau and mountains, lies to the west, with a more rugged terrain. The central region is mainly composed of plateaus and hills, where the surface is uneven, and soil erosion is severe. The east is mainly an alluvial plain, with a relatively flat terrain. It is rich in biological resources and has a diverse ecology with several important ecological features, including the natural ecological corridor of the Yellow River, the Three Rivers Source, the Qilian Mountains, and Ruo’ergai. This area in particular is important for biodiversity conservation. However, the YRB has shown a decreasing runoff trend in recent years, while some of the main stem and tributaries have become seriously polluted, and the grasslands have been clearly degraded. While the desertification trend has been curbed, the overall environmental state is still severe, with urban land areas continuing to rise. Because the development of urbanization is high but the degree of basin coordination is low, the difference between east and west expansion is evident. This is leading to large-scale land-use conversion, natural ecological fragility, and other issues, which are becoming increasingly prominent.
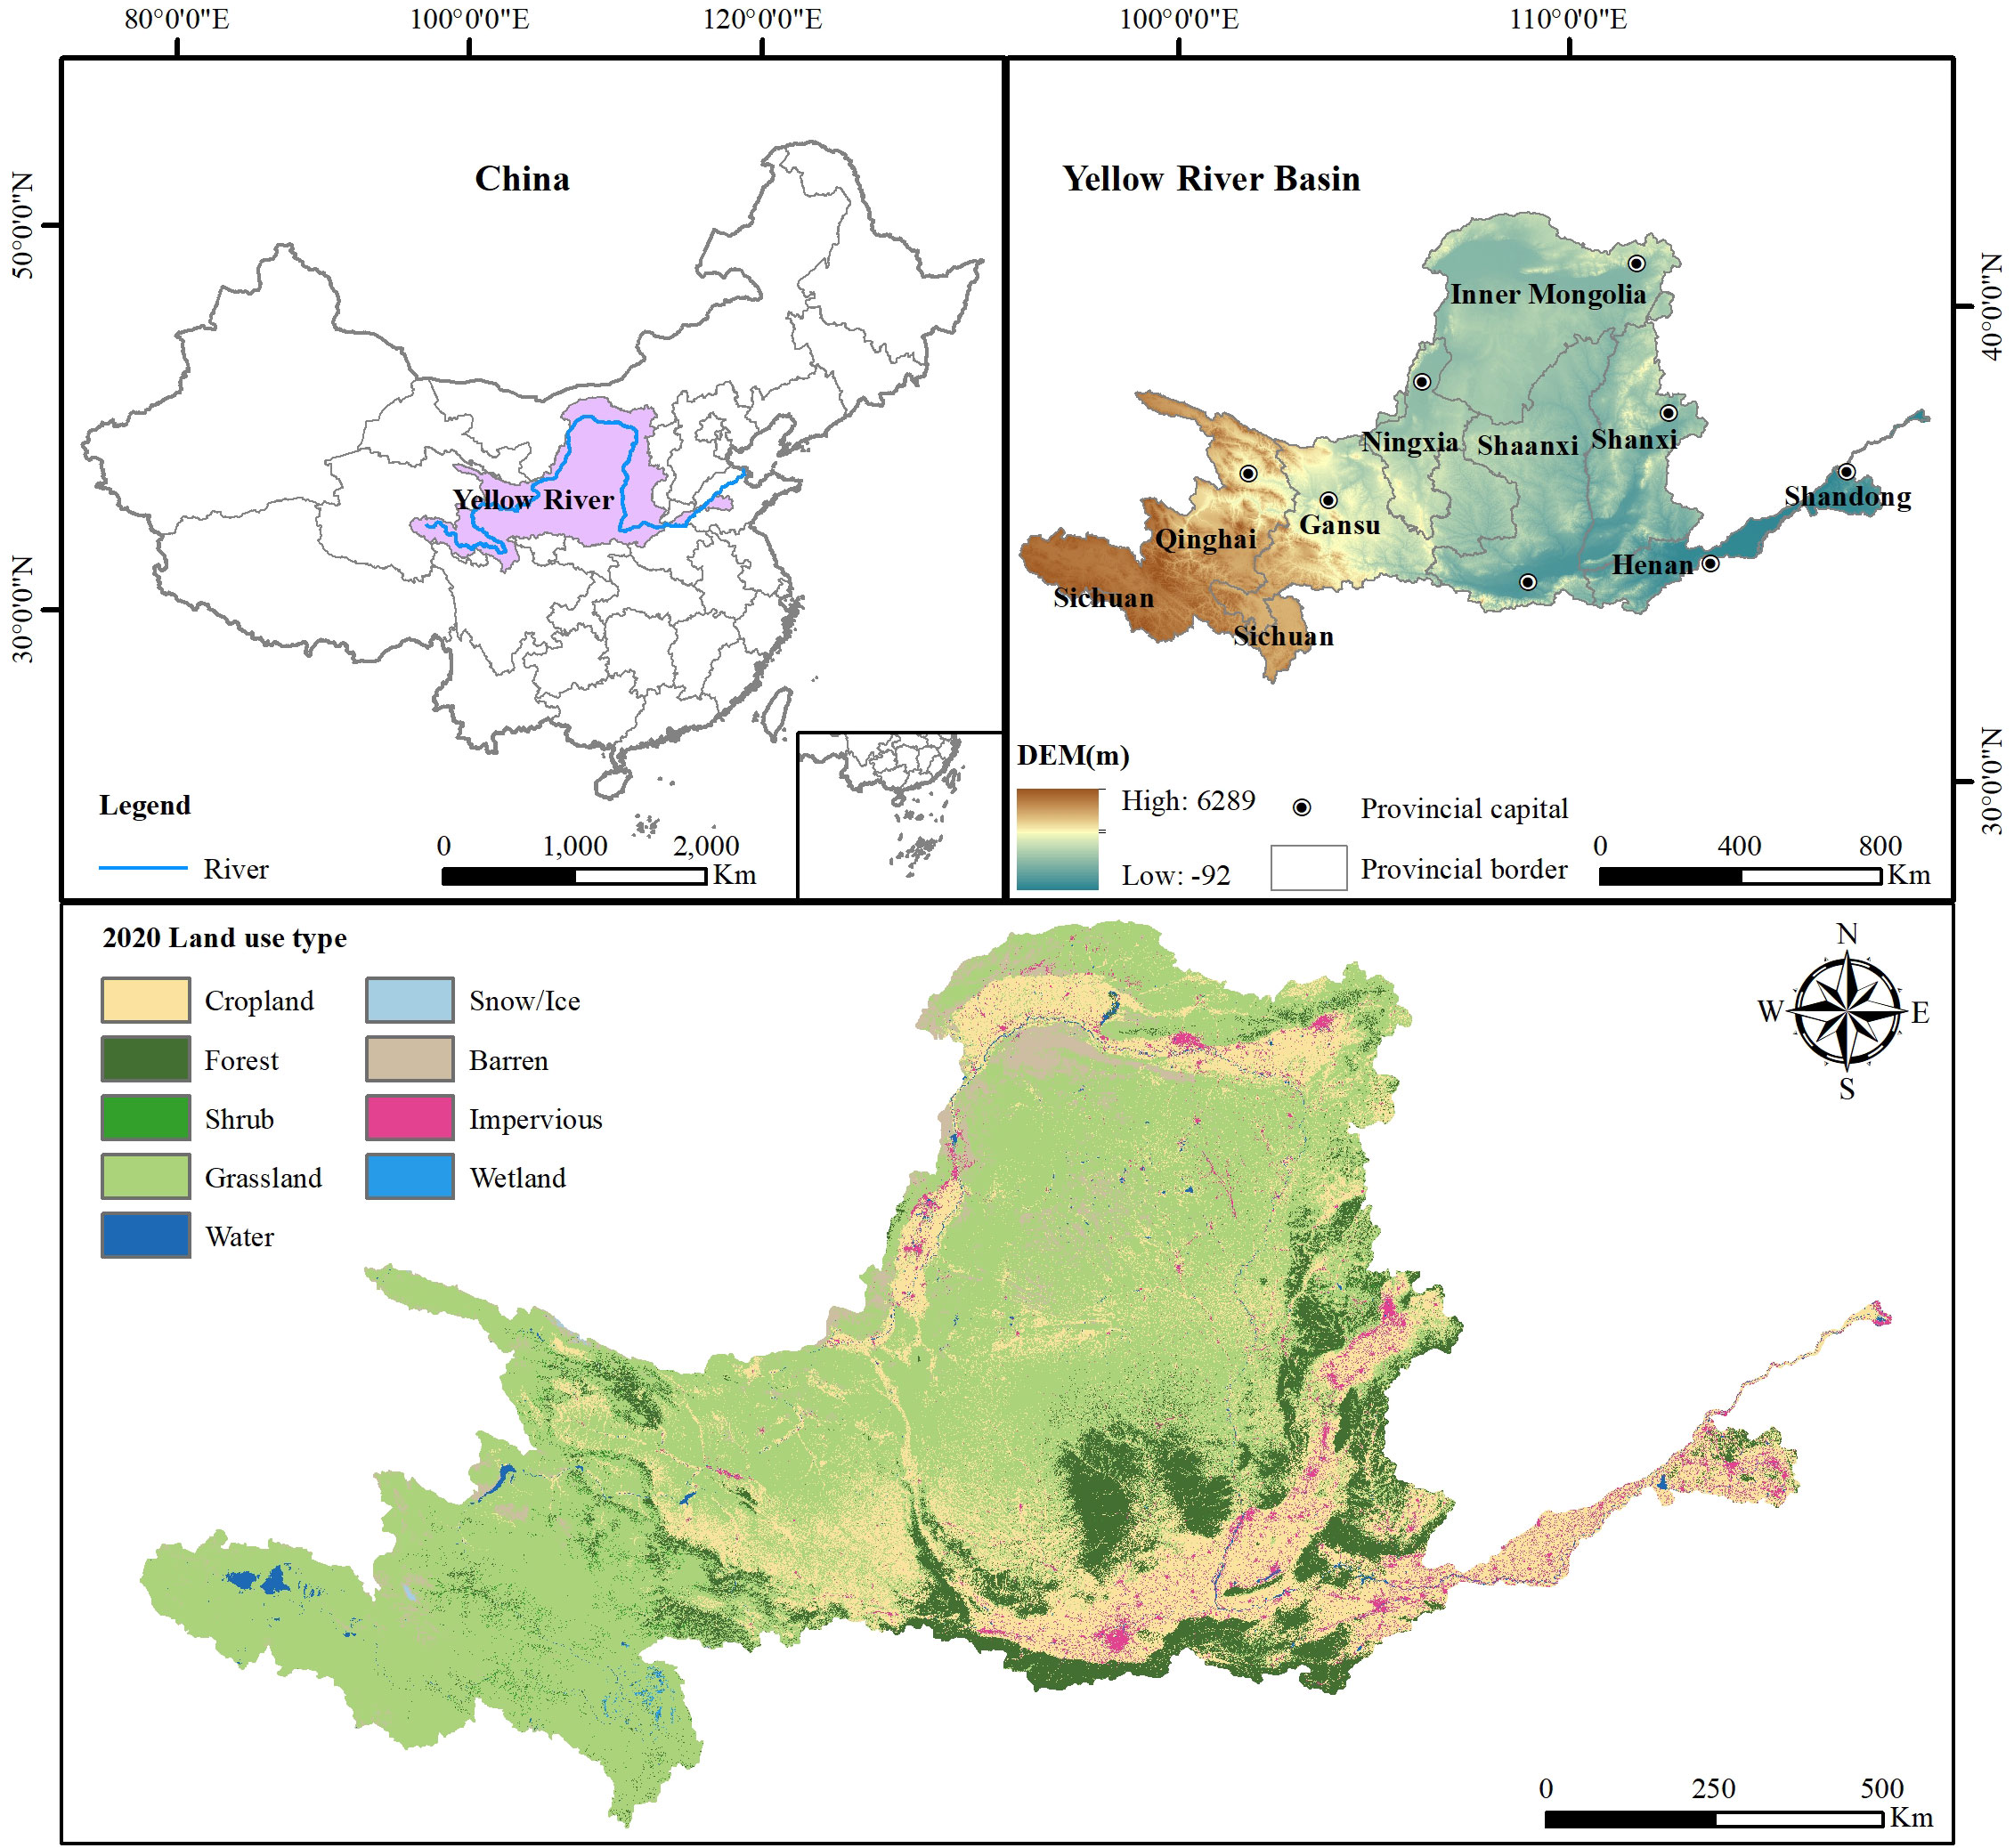
Figure 1 Overview of the study area.
2.2 Data source and preprocessing
The data used in this study are land-use data with a spatial resolution of 30 m from three periods: the 2000s, 2010s, and 2020s (Figure 1). This dataset (Yang and Huang, 2021) is a year-by-year land cover dataset from China based on Landsat imagery on the Google Earth Engine, which has a more uniform classification standard and is easier to compare with the 30-m land-use data obtained from the Chinese Academy of Sciences. Land-use changes were divided into six categories after reclassification: cropland, forest, grassland, water, building land, and unused land. Fifteen driving factors affecting land-use change in the YRB were selected based on relevant studies on land-use prediction (Tang et al., 2022; Wang et al., 2023b), the accuracy of the PLUS model, and the accessibility, significance, and timeliness of the data as well as that of two restricted land change areas (Table 1). The road data included urban 1-, 2-, and 3-level roads as well as railroads, provincial roads, and national roads. The road, river, and municipal government data were processed to obtain Euclidean distance data, and the protected area vector data were converted to raster data. All data were input according to the requirements of the PLUS model, and the results were obtained considering the scope of the YRB. Hence, a uniform resolution of 300 m, uniform row number, and uniform projection coordinate system WGS_1984_World_Mercator were used (Figure 2).
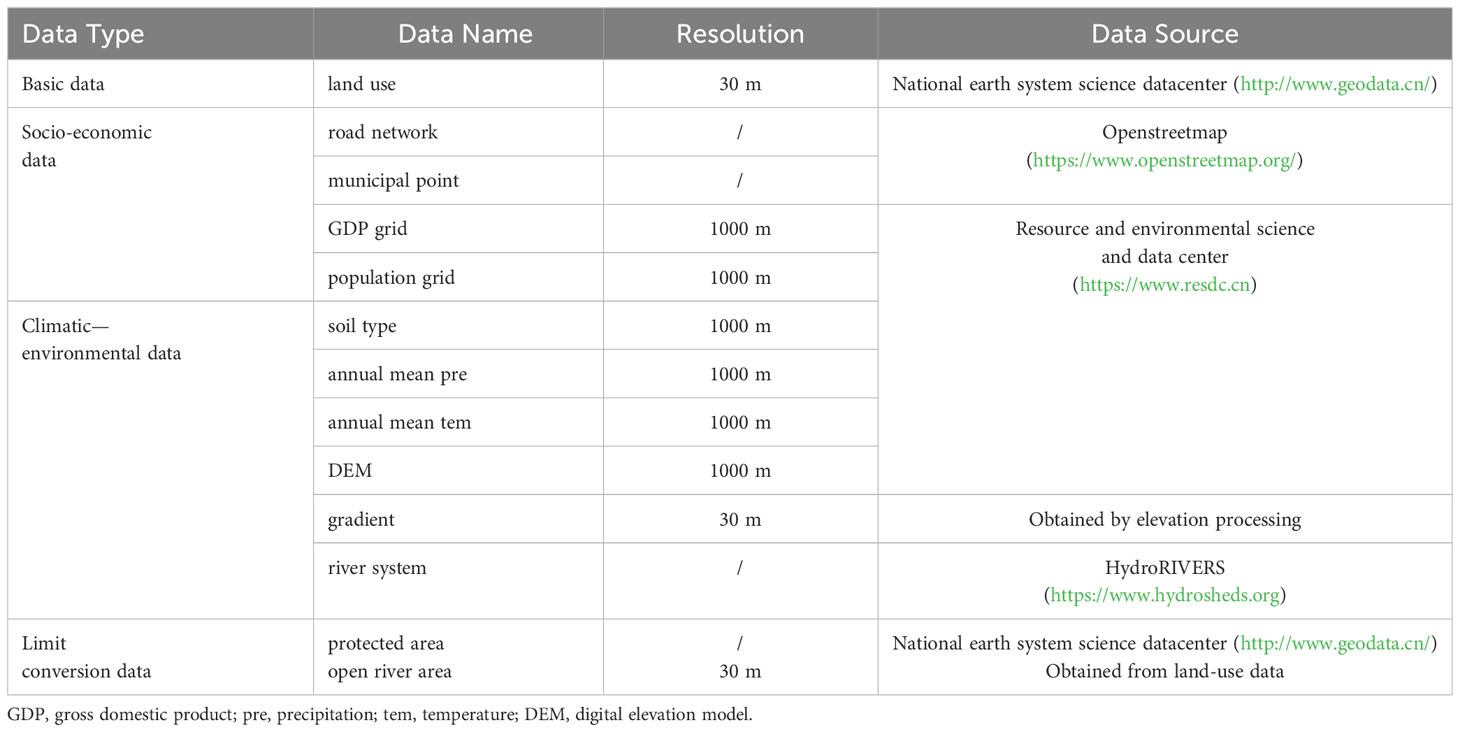
Table 1 Data source information.
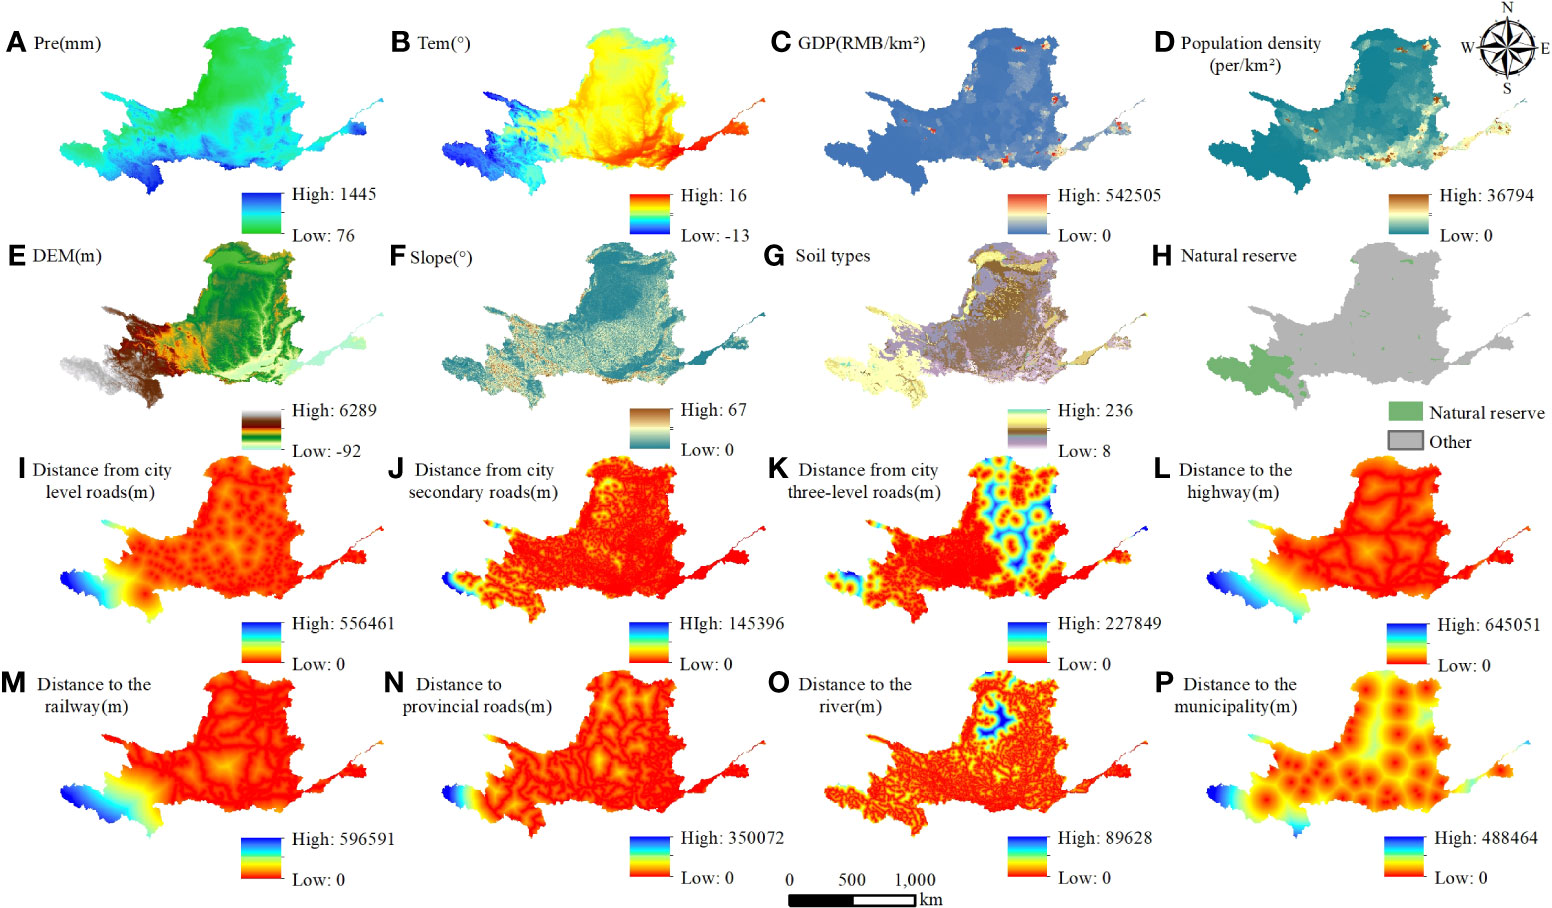
Figure 2 The main influencing factors of land-use distribution. (A) Pre: precipitation, (B) Tem: temperature, (C) GDP: gross domestic product, (D) population density, (E) DEM: digital elevation model, (F) slope, (G) soil types, (H) natural reserve, (I) distance from city level roads, (J) distance from city secondary roads, (K) distance from city three-level roads, (L) distance to the highways, (M) distance to the railways, (N) distance to provincial roads, (O) distance to the river, (P) distance to the municipality.
2.3 PLUS model
The PLUS model (Liang et al., 2021) is a raster data-based cellular automaton model that can be used to simulate land-use change at the patch scale. The PLUS model consists of two main components: (1) a land expansion analysis strategy and (2) a cellular automaton model based on multiple types of stochastic patch seeds (CARS).
2.3.1 Land expansion analysis strategy
The strategy extracts the portion of land-use expansion for each type of land between two periods of land-use change. Sampling from the increased portion of, the random forest algorithm is used to mine the factors of each type of land-use expansion and drivers one at a time. The development probability of each land-use type and the contribution of the drivers to their expansion during that period are obtained.
2.3.2 CARS model
The CARS model is a scenario-driven land-use simulation model that integrates “top-down” (land-use demand) and “bottom-up” (land-use competition) effects. The “bottom-up” effect integrates factors such as neighborhood weights, a conversion cost matrix, and decreasing thresholds. During the simulation, land-use demand influences local land-use competition through an adaptive factor that drives the amount of land-use to reach future demand.
2.3.2.1 Domain weight
The domain weights were mainly used to reflect the ease of interconversion between different land-use types. The complexity of the relationship between drivers and land-use change makes it difficult to directly calculate the expansion intensity of each land type. However, the expansion pattern of each land-use type over the course of its history is the best representation of its expansion capacity (Wang et al., 2019). This study analyzed the use of patch area (TA) and number of patches (NP) as the basis for domain weight measurement, showing that the pattern of TA variation at the patch-type scale is a qualitative characterization of the expansion capacity of each site type, and the variation of TA can be used to quantitatively characterize the expansion intensity of each site type. We used equation (1):
where wi is the domain weight of the ith land type, TAi is the expansion area of the ith land-use type, TAmin is the minimum expansion area of each land-use type, and TAmax is the maximum expansion area of each land-use type. Therefore, in this study, considering the actual situation in the YRB, the domain weight parameters were set as shown in Table 2.
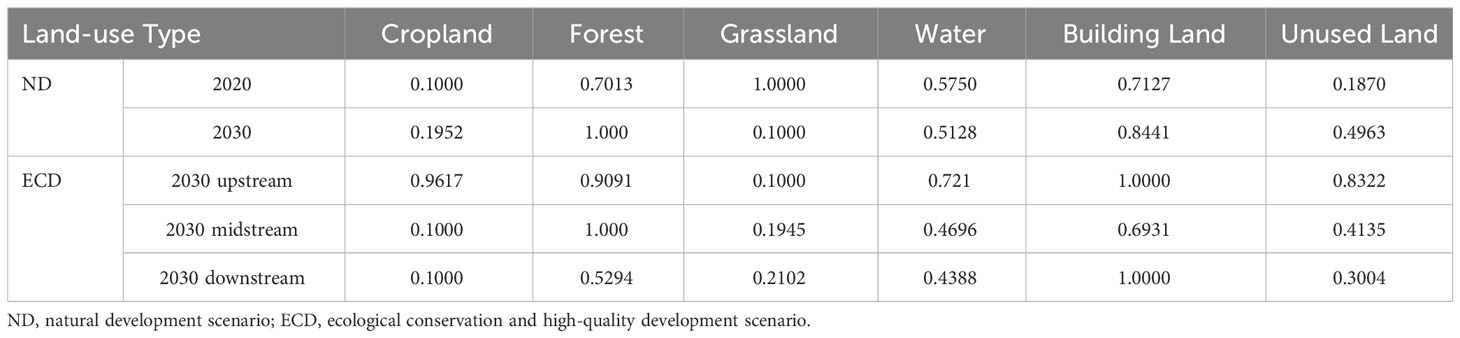
Table 2 Domain weight parameters.
2.3.2.2 Transition transfer matrix
The transition matrix was used to define whether land-use types can be converted to other land-use types, effectively restraining the unreasonable conversion between land-use types. Simultaneously, the threshold decay coefficient of patch generation was set to restrain the spontaneous growth process of land-use types and determine the final land-use pattern. Transition matrices were constructed based on the characteristics of land-use change in the YRB and existing research experience (La et al., 2021; Wang et al., 2022a; Luo et al., 2023) (Table 3).
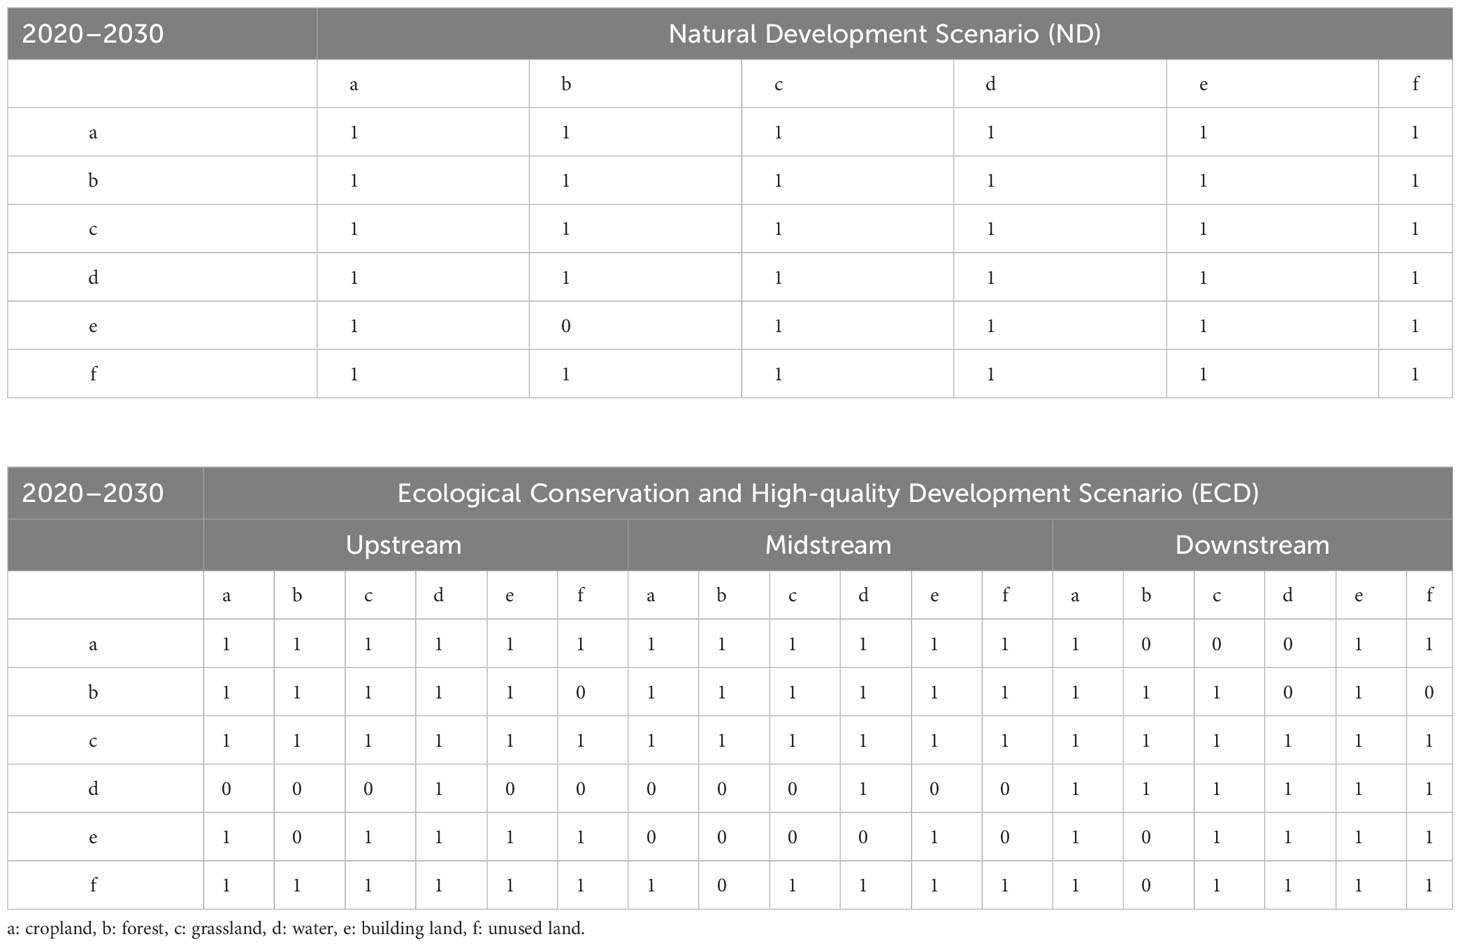
Table 3 Transition matrices.
2.4 InVEST model
The Habitat Quality module of the InVEST model assesses the extent of habitat degradation and measures habitat quality indices using data on land use and biodiversity threat factors, among other things. It was created and refined in collaboration with Stanford University, the World Wildlife Federation, and The Nature Conservancy.
Based on the actual situation in the YRB, cropland, building land, and unused land were set as threat factors, while the parameters for this study were determined based on the InVEST model manual and related studies (Zhang et al., 2020a; Zhang et al., 2020b; Xu et al., 2021; Yang et al., 2021; Zhang et al., 2022b). The threat factors and their influence on distances and weights are shown in Table 4, while the suitability of different habitats and their sensitivity to threat factors are shown in Table 5.
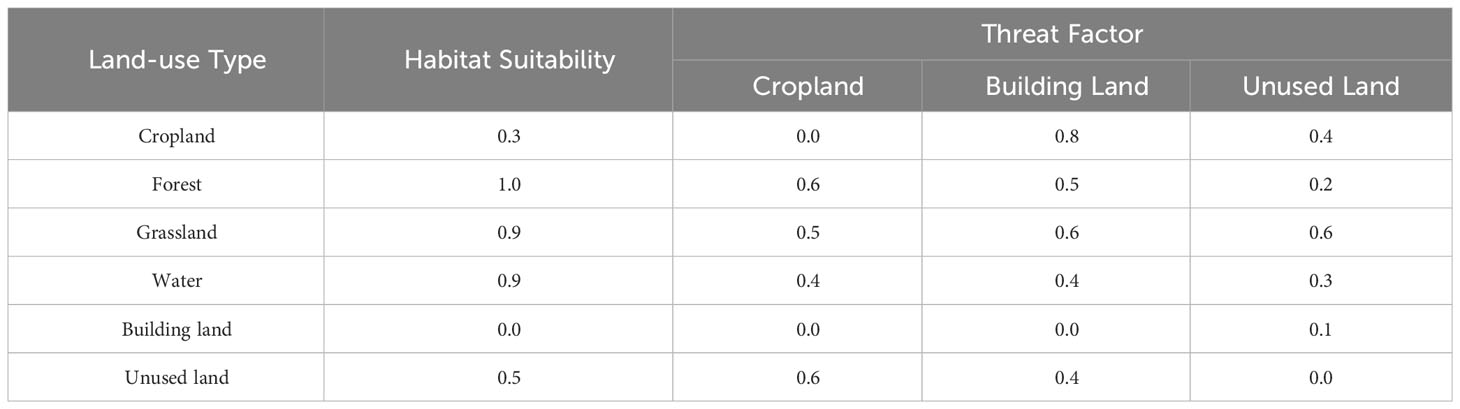
Table 4 Sensitivity of land-use types to habitat threat factors.
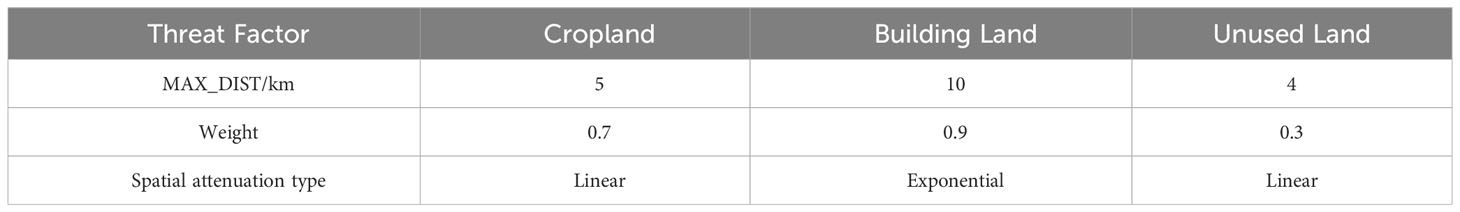
Table 5 Maximum influence distance and weight of threat factors.
2.5 Land-use simulation scenario setting
In this study, two scenarios were developed based on existing research (Gao et al., 2022; Yang et al., 2022; Hu et al., 2023; Reheman et al., 2023; Wang et al., 2023a) and taking into account the actual situation of the YRB: a natural development scenario (ND) and an ecological conservation and high-quality development scenario (ECD).
Scenario I: The ND does not consider any policy interventions or the rate of change of both population and economy. It continues the historical trend from the 2010–2020 period, based on which the land-use demand in 2030 is projected using the Markov quantity forecasting model. The PLUS model is used to simulate the land-use pattern in 2030 without other constraints.
Scenario II: The ECD takes into consideration the different areas in the upper, middle, and lower reaches of the YRB, which have very different natural conditions and ecological priorities. The ECD allows for improved targeting and effectiveness of policies and engineering measures while promoting protection and action by zoning and classification. In the “Outline of the Plan for Ecological Protection and High-Quality Development of YRB,” it is clearly stated that the upstream should strengthen its water-containing capacity, protect important ecosystems, and implement more projects, such as returning cropland to forestland and grassland and reducing grazing. In terms of the midstream, soil and water conservation should be strengthened, the level of urbanization should be steadily improved, and forests and grasslands should be protected, and cropland should be continuously returned to forestland and grassland as should grazing areas to grasslands. Finally, the downstream should strengthen its wetland protection and return wetlands to cropland. Because the downstream represents the most important food base in the YRB, croplands in it must also be protected. The ECD represents a sustainable development model that considers the actual situation in the YRB. It also draws on previous experience to implement differentiated land-use efficiency paths based on local conditions and zoning by dividing the YRB into three regions (upper, middle, and lower) for projections.
In summary, the ECD considers the ecological restrictions of alpine meadows, grasslands, wetlands, forest ecosystems, and other nature reserves in the ecological conservation red line control range on conversion. Based on the transfer probabilities of each land type for 2010–2020 using the Markov quantitative prediction model, the transfer probabilities under the ECD in the upper region of YRB were set to increase the transfer probability of cropland to forest and grassland by 30%, decrease the transfer probability of forest to other land types except water by 50%, and decrease the transfer probability of grassland to other land types except water and forest by 50%. The transfer probabilities under the ECD in the middle region of the Yellow River were set to reduce the transfer probability of forest to other land types except water by 30%, reduce the transfer probability of grassland to other land types except water and forest by 50%, and increase the transfer probability of cropland to forest and grassland by 20%. In the lower region of YRB under the ECD, water was not converted, cropland was not converted to other land types except for building land and unused land, nature reserves were not converted, and the probability of converting cropland into unused land increased by 20%.
2.6 Ecological contribution rate of land-use transfer
The ecological contribution (Li et al., 2003) is the change in the quality of the regional ecological environment caused by a certain land-use change using the following formula:
where LEI is the ecological contribution rate; LE0 and LE1 are the ecological environment quality indices of land-use types in the early and late stages of change, respectively, LA is the area of changed land, and TA is the total study area.
3 Results
3.1 Land-use change and prediction
3.1.1 Land-use change analysis
The distribution of land-use types in the YRB in 2000, 2010, and 2020 is shown in Figure 3. Based on the land-use data in ArcGIS, the area and percentage of each category were extracted, the rate of change was calculated (Figure 4), and 2000–2010 and 2010–2020 land-use transfer maps for YRB were obtained (Figure 5).

Figure 3 Land-use distribution from 2000–2020.
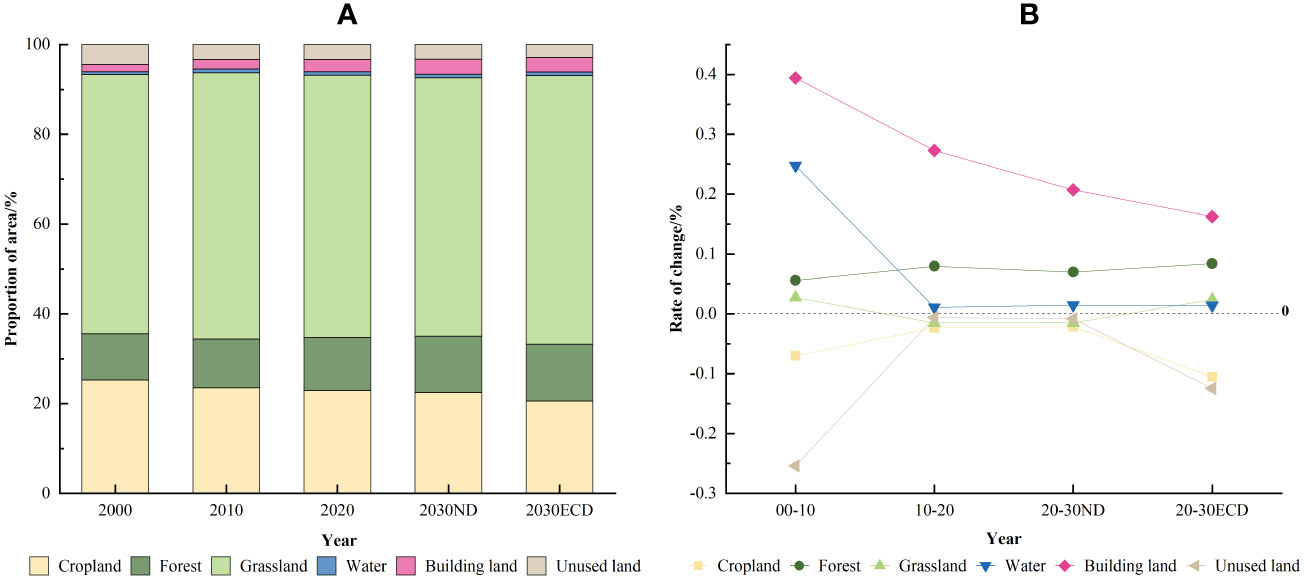
Figure 4 Land-use distribution changes. (A) Change in the percentage area by category. (B) Change in rate.
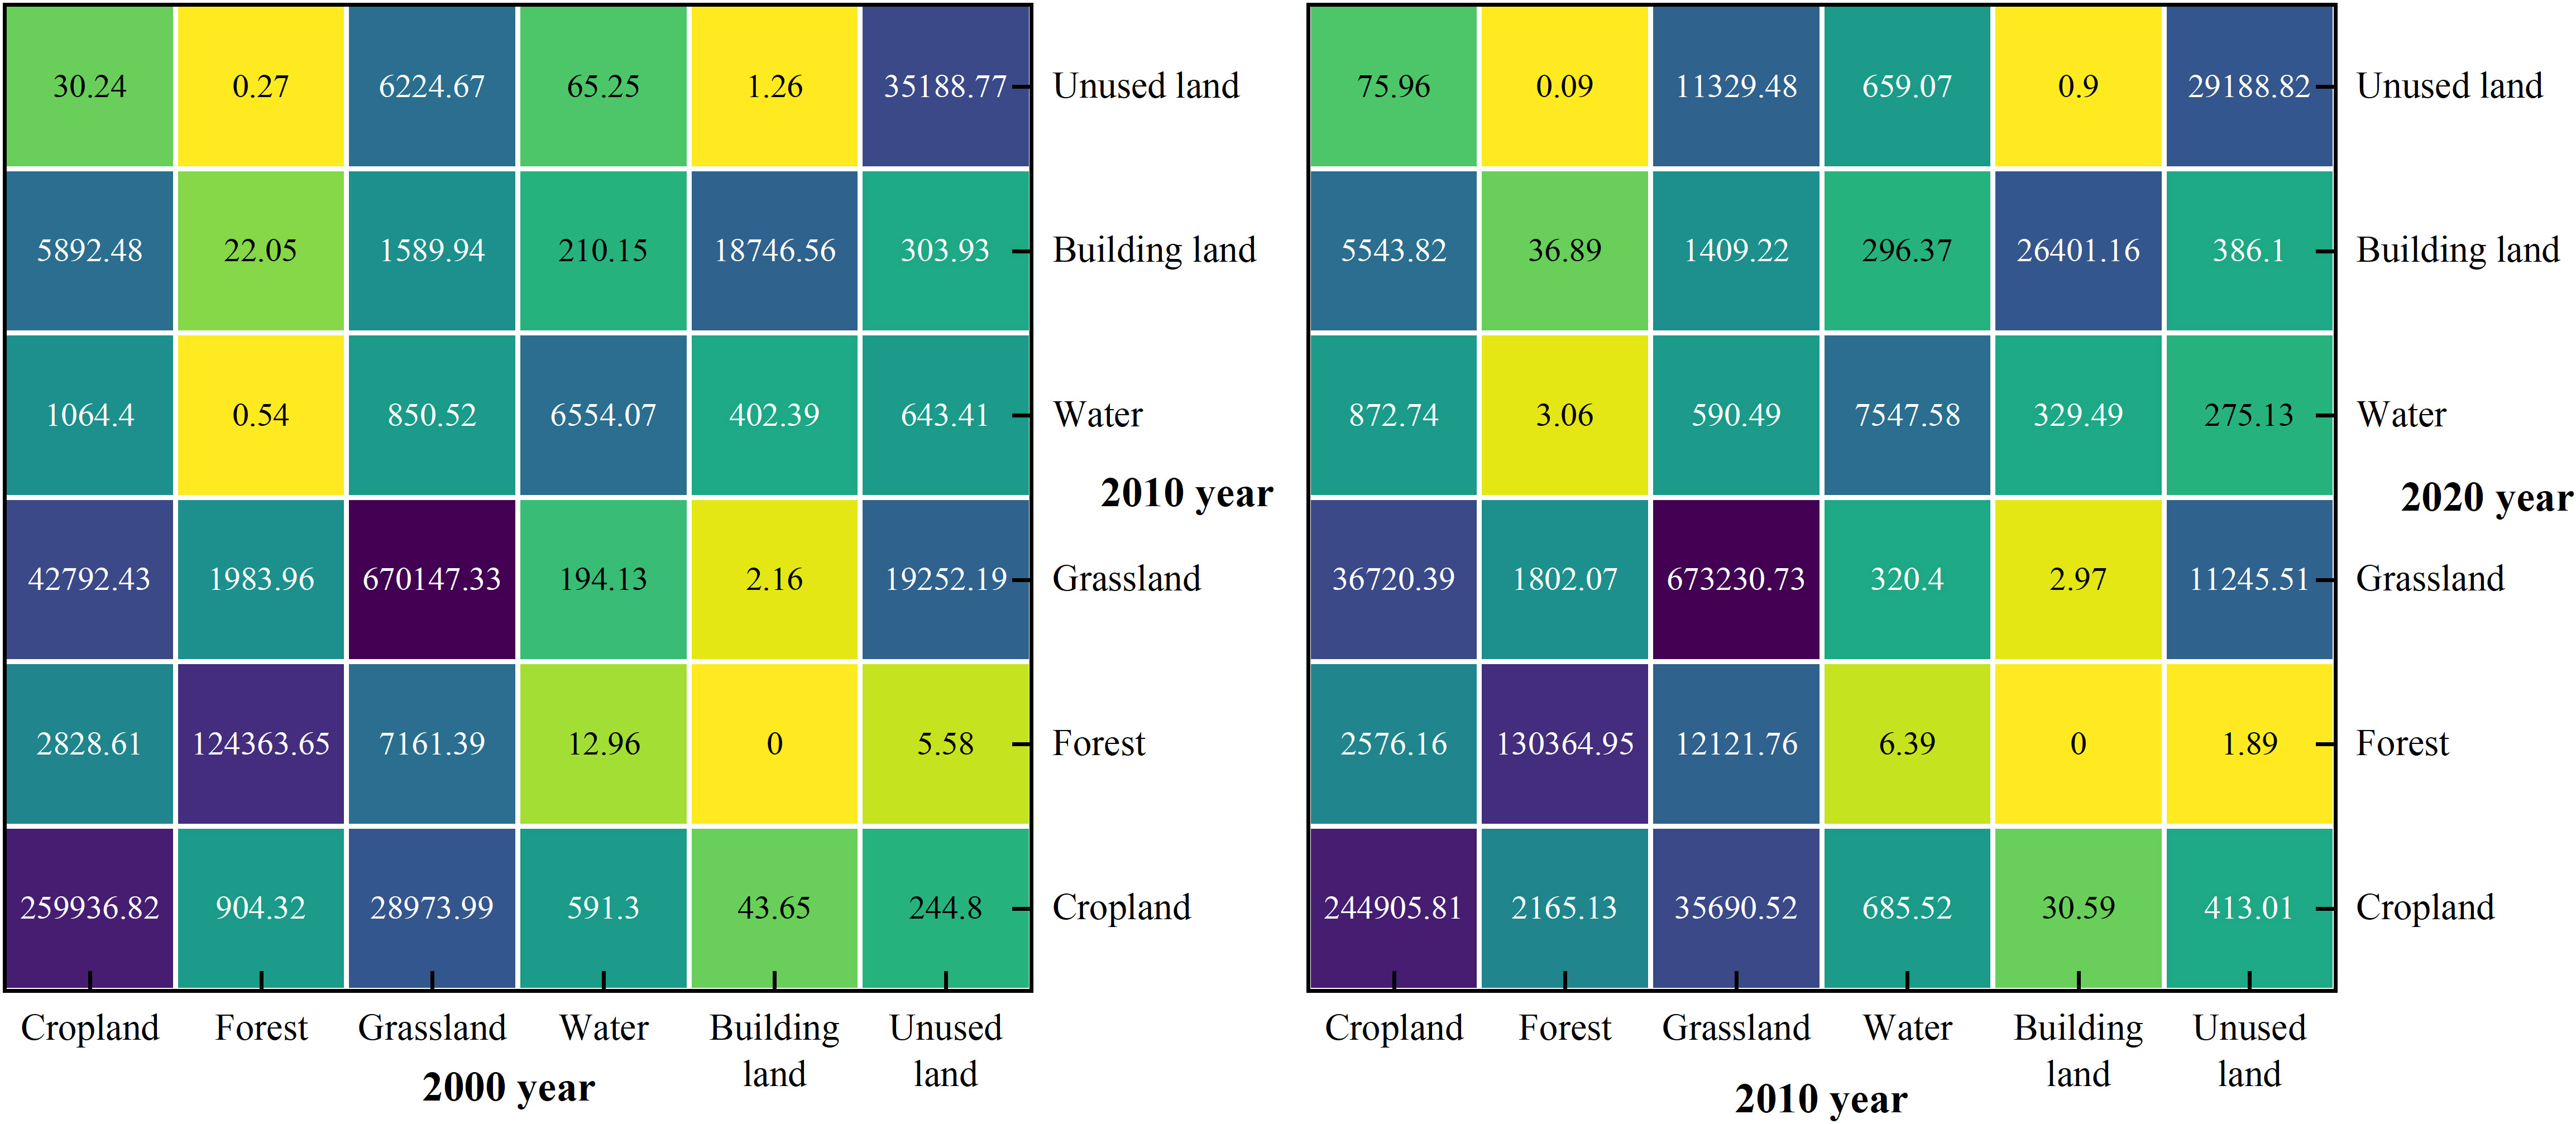
Figure 5 Land-use transfer map from 2000–2020.
The land-use change in the YRB from the past 20 years showed a trend of “four increases and two decreases,” that is, the areas of grassland, forest, building land, and water increased, while the areas of cropland and unused land decreased. Figures 3–5 show that in 2000–2010, the grassland area increased from 57.79% to 59.36% and then decreased to 58.46% in 2020, with a total increase of 8374.23 km² of grassland area in 20 years. Grassland was mostly transformed into cropland, indicating that over-exploitation of agriculture was an important reason for the continuous reduction of grassland area. The largest decrease was in the proportion of arable land area, followed by unused land, decreased by 28,654.4 km² and 14,384.36 km², respectively. Cropland was mostly transformed into forest in the Loess Plateau area, indicating that the results of the project to return cropland to forest were significant. Unused land areas were mostly converted into grassland, indicating that the desertification trend has slowed. The area of forest increased by 17796.36 km², and it was mostly converted from grassland and cropland. Building land area increased by 14877.54 km², indicating that urbanization increased. Building land was mostly converted from cropland, indicating that cropland conservation is still a prevalent issue. The growth rate of urban areas in 2010–2020 was lower than in 2000–2010, indicating that urbanization is gradually slowing down. The water area increased by 1990.63 km² and was mostly converted from cropland.
In terms of spatial changes, the YRB is dominated by grassland, cropland, and forests, with a mostly stable spatial distribution pattern. In 2000–2020, some fragmented cropland in the middle region was gradually transformed into grassland. Forest conservation and building restoration achievements were outstanding, and the area of forest expanded. Furthermore, as a result of urbanization, several provincial capitals exhibited radial expansion characteristics and encroached on a large amount of cropland, indicating cropland was the primary land type occupied by ecological restoration and urbanization development over the last 20 years. Striking a balance between cropland conservation and measures to return cropland to forest and grassland is a pressing issue that must be addressed. The water area in the YRB increased slightly, but this increase was not obvious, indicating that water conservation in the Yellow River is still a serious issue that cannot allow for unreasonable and large-scale expansion of human activities. Owing to the significant impact of actions in Mawusu Sand and Kubuqi Desert (Wang et al., 2022b; Wu et al., 2022), most of the sandy land has been converted to grassland or forestland, and the desertification trend has been slowed.
3.1.2 Land-use prediction
The Kappa statistical tool was used to compare and verify the actual 2020 land-use data. The results showed that the overall accuracy of the 2020 land-use simulation was 88.91%, and the Kappa coefficient was 80.99% (see Table 6). This was significantly consistent in the evaluation, indicating that the data could be used for the 2030 land-use simulation prediction. The ND and ECD scenarios after the simulation are shown in Figure 6.
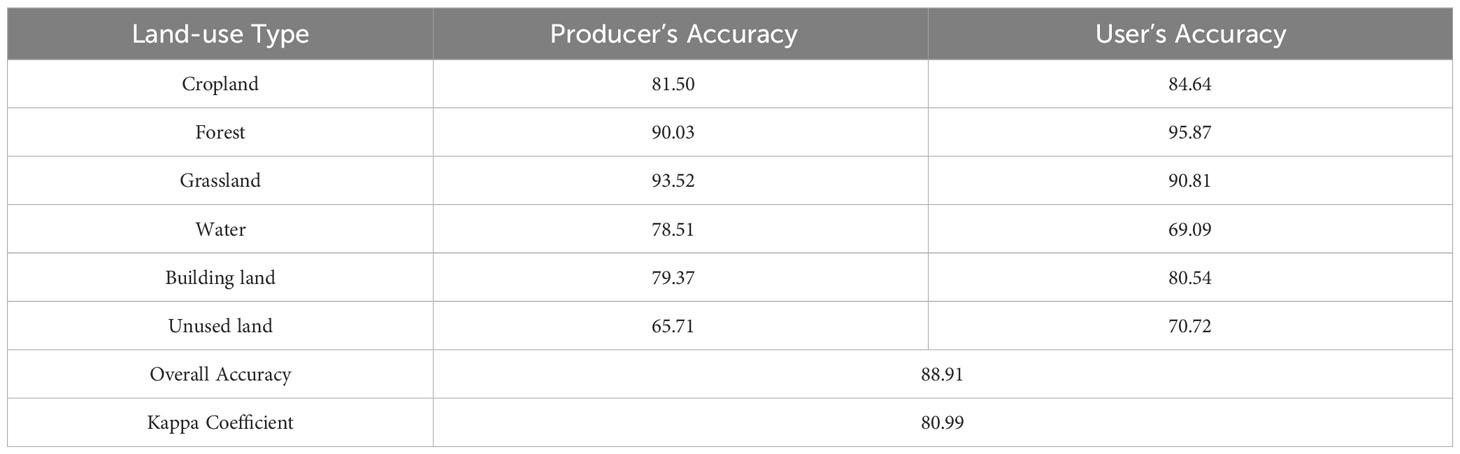
Table 6 Evaluation of the accuracy of the simulation results of land use types in YRB in 2020.
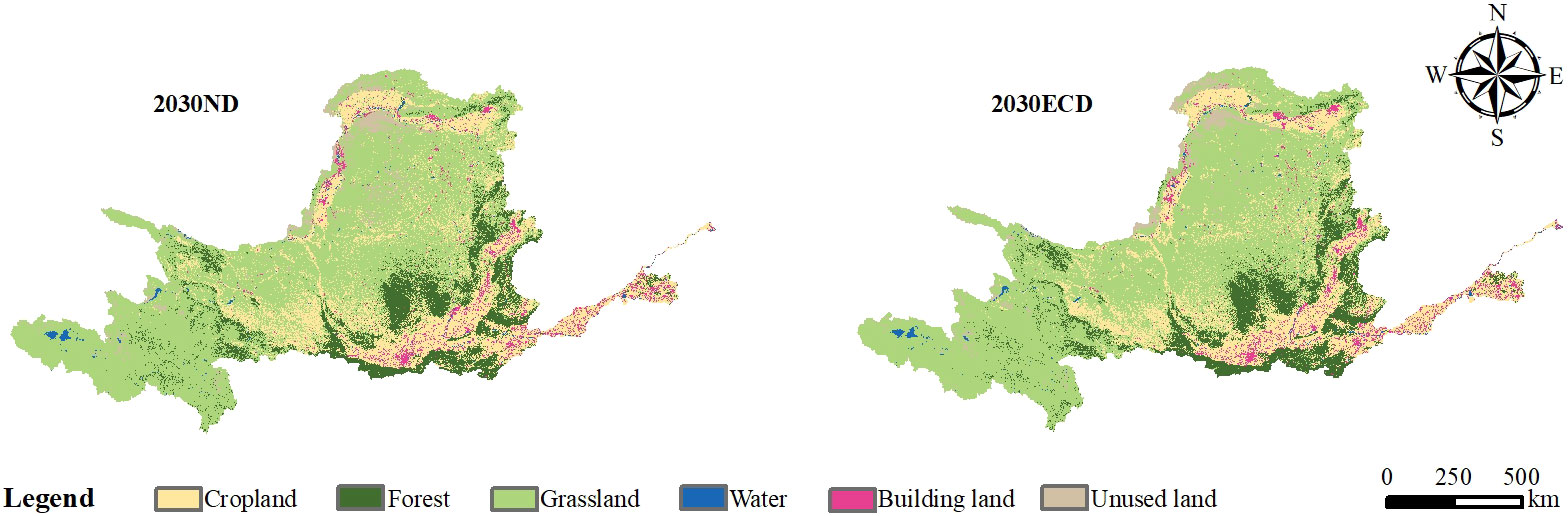
Figure 6 Land-use projections for 2030.
Under the ND, the overall change in the YRB in 2020–2030 would continue the trend of the previous decade, so land use would be characterized by “three increases and three decreases.” The grassland area would continue to decrease to 57.58%, with a total area lower than 714947.84 km² in 2000. Its overall trend was decreasing during three decades, so it would continue to decrease in the future in the absence of human interference. The forest, building land, and water areas would continue to increase by 12.54%, 3.32%, and 0.79%, respectively, with respective increased areas of 10,137.25, 7,061.86, and 140.76 km². The cropland and unused land areas would show a decreasing trend, with decreases to 22.45% and 3.33%, respectively, with their total areas decreasing to 6083.73 and 344.88 km², respectively.
Under the ECD, the land use of the YRB would be characterized by “four increases and two decreases” between 2020 and 2030. Owing to ecological restoration and protection initiatives, such as the policy promoting the return of cropland to forests and grasses, the decreasing trend of grassland areas would be reversed. The grassland area would increase by 17,202.96 km², while the forest area would also increase by 12,186.27 km². Simultaneously, the cropland area would decrease by 29,921.67 km² because of the policy promoting the conversion of cropland to forest and grassland. The areas of water and building land would show increasing trends, increasing by 135 km² and 5540.13 km², respectively. The decreasing trend of unused land area would accelerate sharply, with a decrease of 5142.69 km².
Comparing the two scenarios, the main difference that arises is that under the ECD, the grassland area changes from decreasing to increasing, whereas the rate of decrease in cropland and unused land areas increase sharply, the rate of increase in forest area accelerated, the trend of change in water was similar, and the rate of increase in building land decreased. This can be mainly attributed to the policies promoting the return of cropland to forest and grass and of grazing land to wetland characterizing this scenario. At the same time, protecting forests and grassland decreases the main source of cropland transfer, resulting in income not being enough to cover the expenses of converting cropland, which leads to a significant overall decrease. Simultaneously, the ecological restoration policy converts a large amount of unused land to grassland. The building land growth rate gradually slows down because of the implementation of high-quality urban and rural habitat building action, optimization of urban spatial layout, comprehensive urban building transformation and quality improvement, and the transformation of the “pie” type of development model.
3.2 Evolution and prediction of spatiotemporal patterns of habitat quality
3.2.1 Evolution of spatiotemporal patterns of habitat quality
The InVEST model combines information on land cover and biodiversity threats to generate habitat quality maps. Using the equal spacing method based on the actual situation of habitat quality in the YRB, five habitat quality classes were established: low (0–0.2), relatively low (0.2–0.4), medium (0.4–0.6), relatively high (0.6–0.8), and high (0.8–1) (Figure 7). From the overall analysis of the YRB, the average habitat quality indices in 2000, 2010, and 2020 were 0.6849, 0.6992, and 0.7001, respectively. Thus, habitat quality was moderately high and demonstrated a gradually increasing trend.
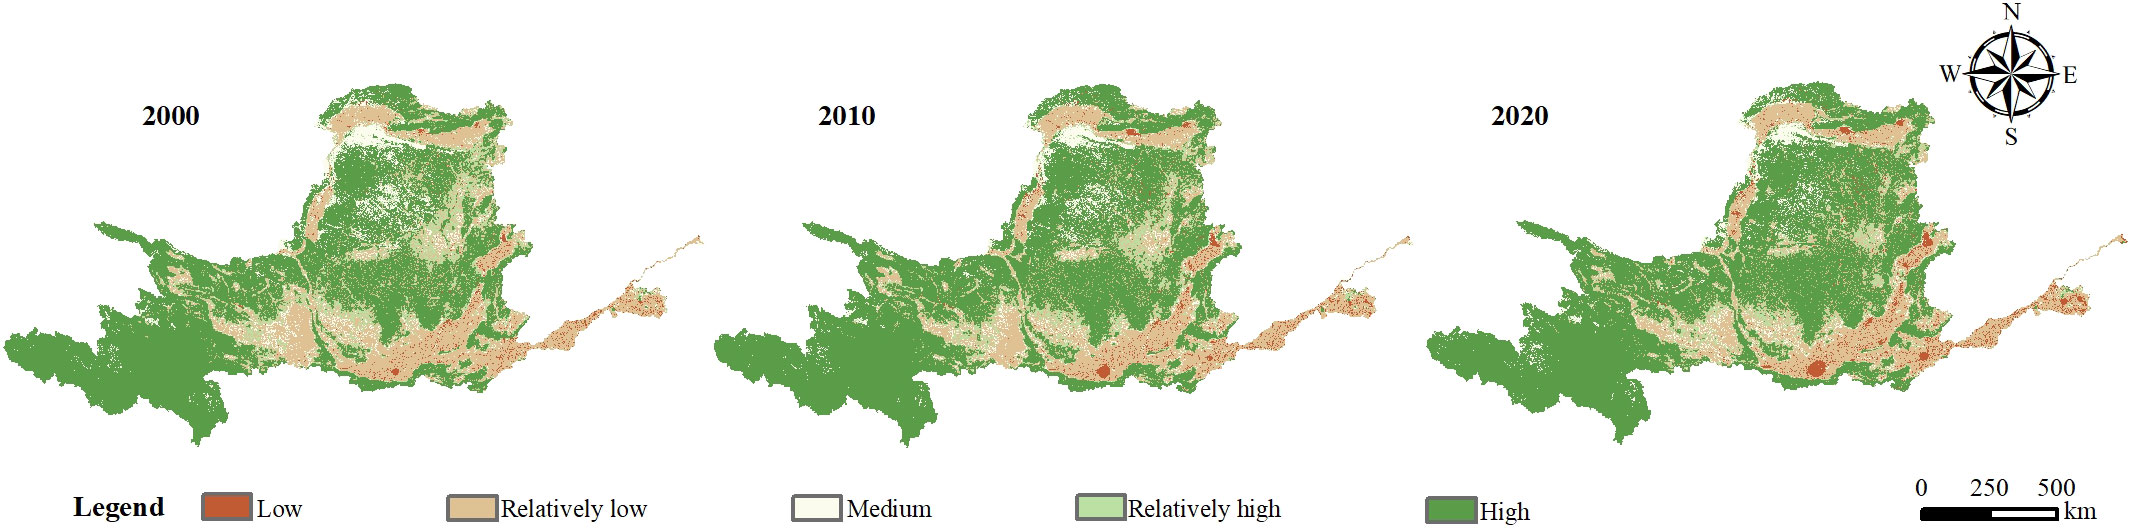
Figure 7 Map of habitat quality distribution from 2000–2020.
Based on the habitat quality distribution data, the area and percentage of each class was extracted and the rate of change was calculated (Figure 8). The area of high habitat quality increased continuously between 2000 and 2020, with an absolute increase of 62537.23 km² and a relative increase from 57.24% to 62.29%. The rate of increase was fastest between 2000 and 2010, when the area percentage increased by 3.95%, while it only increased by 1.1% over the next 10 years. This was also the class with the largest number of changes over 20 years. The relatively high, medium, and relatively low habitat quality areas decreased by 22203.28, 22365.36, and 35929.8 km², respectively over 20 years, with their area proportions decreasing to 5.63%, 5.56%, and 23.48% respectively. The low habitat quality area gradually increased, almost doubling, with an absolute increase of 17961.21 km², accounting for the most dramatic change in 20 years.
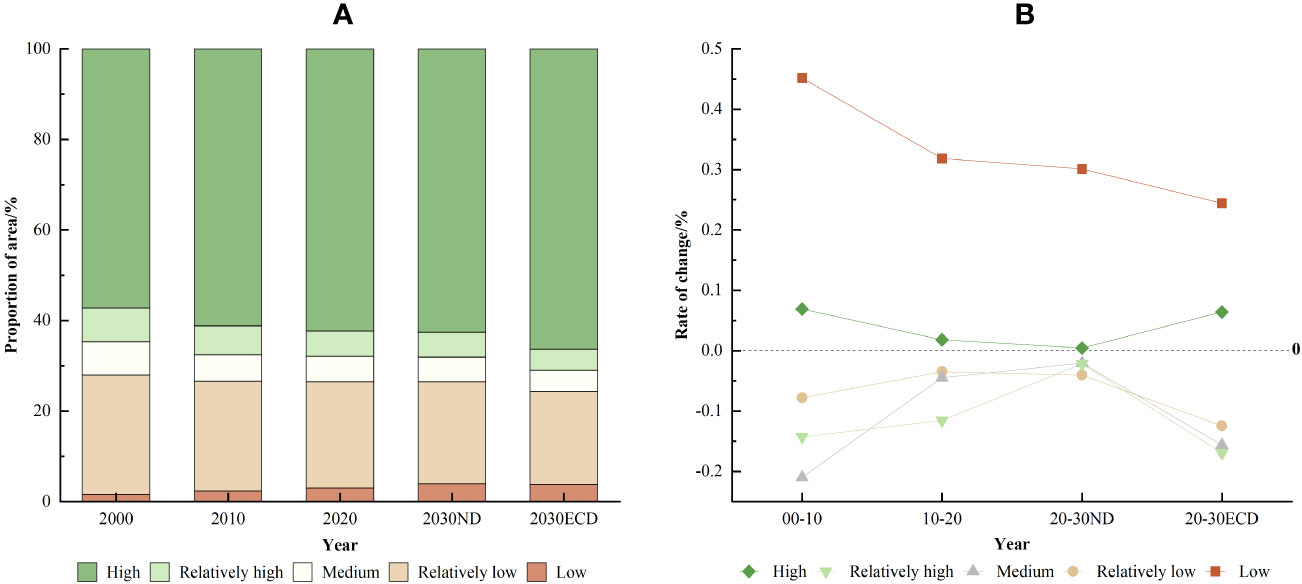
Figure 8 Habitat quality class distribution changes. (A) Change in the percentage area by category. (B) Change in rate.
The spatial distribution pattern of habitat quality in the YRB showed the characteristics of “high in the west and low in the east, high in the middle and low along the stream” over the past 20 years. The areas with high and relatively high habitat quality classes were mostly located in the Sanjiangyuan National Building Park, Qilian Mountain National Park, and Ordos Plateau in the upper regions of the YRB; Weihe River Basin and Qinling Region in the middle regions; and Taihang Mountains and Daru River Basin in the lower regions. The areas with medium habitat quality were mostly located in the Kubuqi Desert and Mawusu Sands. The areas with relatively low and low habitat quality classes were mostly located in the Loop Plain and Ningxia Plain in the upper regions; Fen River and Guanzhong Basins in the middle regions; and North China Plain in the lower regions. This distribution was highly consistent with that of building land.
To better discern the spatial dynamics of habitat quality, habitat quality distribution maps of the study area for the 2000–2020 period were overlaid and analyzed using ArcGIS software to obtain habitat quality changes in the YRB (Figure 9). During the 2000–2010 period, the regions with improved habitat quality were mostly distributed in the border area between southern Ningxia and Gansu and the Mawusu Sands in the upper region of the Yellow River; northern Shaanxi and northwestern Shanxi in the middle region; and northwestern Henan and central Shandong in the lower region. Additionally, changes were mostly moderate, and slight rises were observed. The declining regions were mainly distributed in the several-bends metropolitan area in the upstream region and southwestern Shanxi in the midstream region. In addition, some regions in the downstream also had a small decline in habitat quality, but the changes were mostly slight decreases. During 2010–2020, the habitat quality improvement areas were mainly distributed in the northwestern part of Qinghai, southern Ningxia, southern Gansu, and the Mawusu Sands upstream, which showed a slight increase. The northern part of the border between Shanxi and Shaanxi in the midstream showed a moderate rise, while the northwestern part of Henan in the downstream showed a slight rise. The declining areas were widely distributed in all provinces, indicating serious declines in habitat quality. In general, habitat quality increased mainly owing to ecological protection and restoration projects. However, with the socioeconomic improvement, the clearest manifestations were the expansion of building land, concentration of population, and improvement of transportation facilities, which widened the range of human activity, coerced the surrounding habitats, increased the degree of habitat degradation, and gradually declined habitat quality.
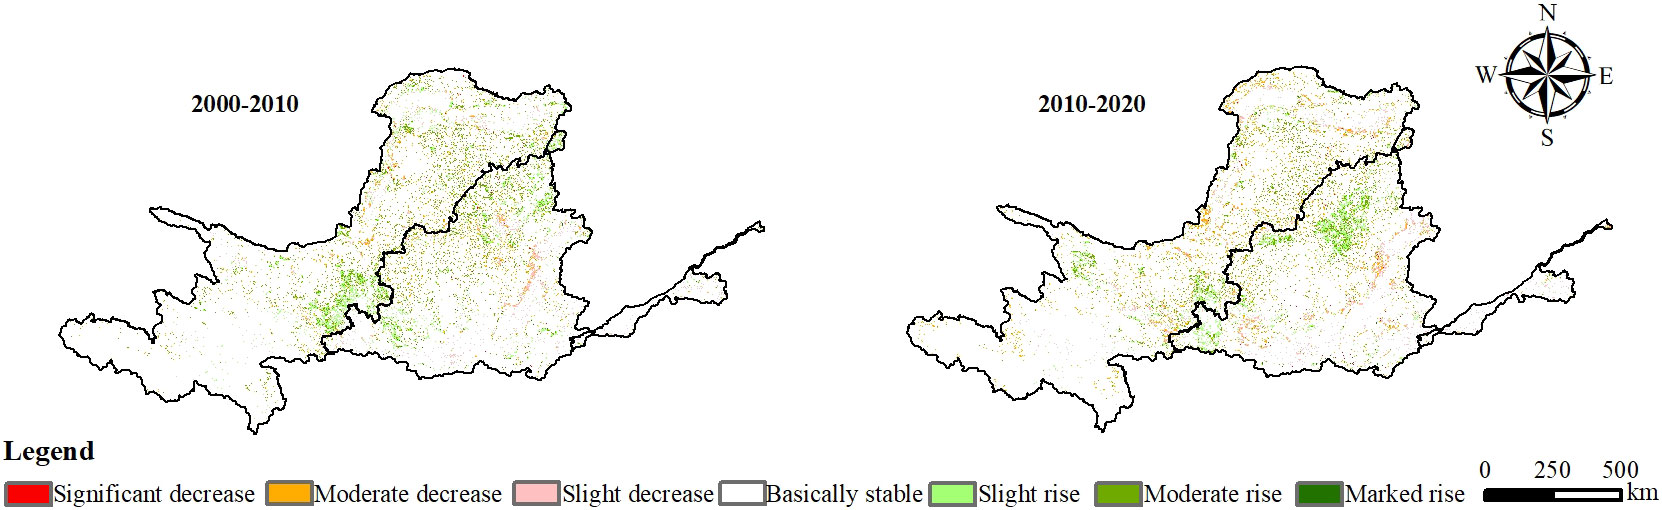
Figure 9 Spatial change map of habitat quality from 2000–2020.
3.2.2 Habitat quality prediction
Based on the land-use prediction results, the distribution of habitat quality in the YRB under ND and ECD was obtained using the InVEST model (Figure 10). The average habitat quality index was 0.6993 for the ND and 0.7186 for the ECD.
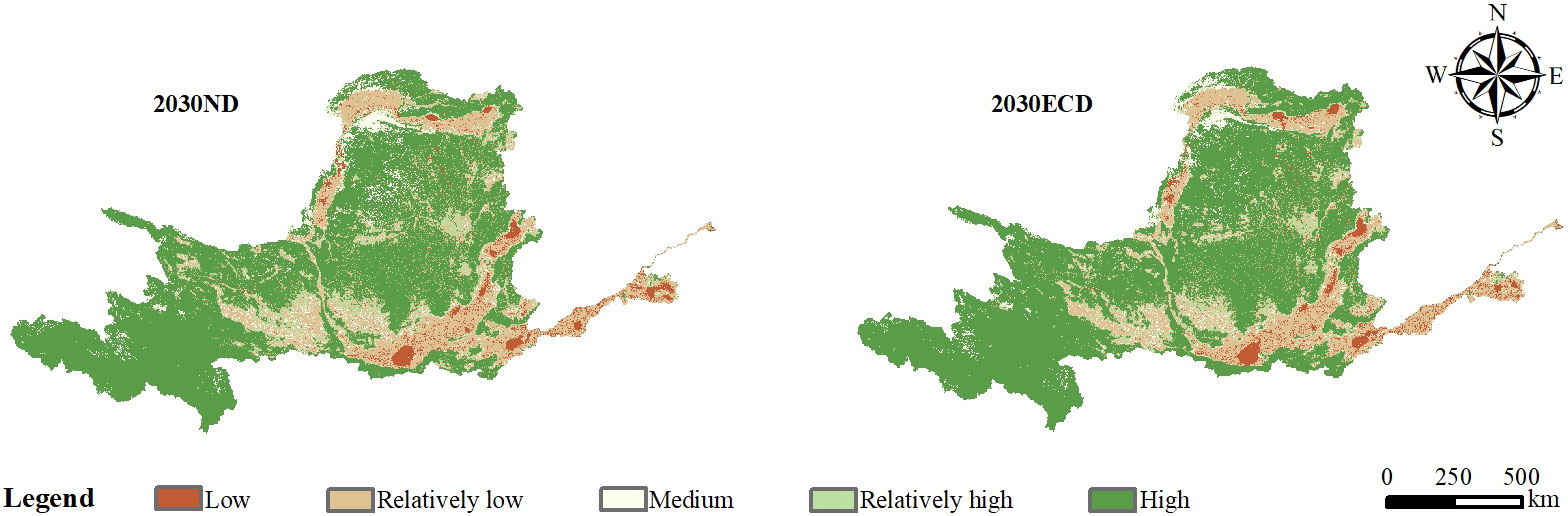
Figure 10 Habitat quality distribution in 2030.
Under the ND, the overall habitat quality decreased by 0.0008 compared with that in 2020. The change in the area of habitat quality for each class was stable, and the area of high value of habitat quality increased by 3357.44 km² to 62.57% (from 62.29% in 2020), which represents a small change. The relatively high, medium, and relatively low habitat quality areas continued to show a gradual decrease compared to the previous 20 years, decreasing by 1525.04, 1413.81, and 11742.57 km², respectively and accounting for decreases of 0.13%, 0.11%, and 0.95% respectively. Low habitat quality areas showed the largest change, with a gradually increasing trend and an area increase of 11323.98 km², accounting for an increase from 3.04% to 3.96%.
Under the ECD, the overall level of habitat quality improved significantly compared to that in 2020, with an increase of 0.185. The area of each level of habitat quality changed significantly while still showing a pattern of “three decreases and two increases.” The area of high value habitat area increased from 62.29% in 2020 to 66.29%, with an increase of 49,502.78 km². The high-value habitat area increased from 62.29% in 2020 to 66.29%, representing an increase of 49502.78 km². The areas of relatively high, medium, and relatively low habitat quality maintained a gradually decreasing trend, with their area proportions decreasing by 0.95%, 0.87%, and 2.92%, respectively, with respective decreases of 11,805.11, 10,775.8, and 36,112.14 km². The rate of increase in the area of low habitat quality under the ECD slowed compared with that under ND, while the proportion and area increased by 0.74% and 9189.27 km², respectively.
Under the ECD, habitat quality improved significantly, the area of high-value habitat quality areas increased significantly, the rate of reduction in the areas of relatively high, medium, and relatively low habitat quality areas further accelerated, and the rate of increase in the area of low habitat quality slowed. In 2000–2020, China was in a high-speed development stage, after which a stage of sustainable development was entered under the scenario of ECD. This stage insisted on simultaneous ecological protection and economic development, vigorously implementing projects such as forest and grassland protection and converting cropland to forest and grassland, which strongly promotes the further improvement of habitat quality in the YRB.
3.3 Habitat degradation analysis
3.3.1 Analysis of habitat quality degradation
The degree of habitat degradation is the extent to which the grid is affected by threat factors. With greater habitat degradation, the surface is more affected, and degradation is more severe. The level of habitat degradation in the YRB was obtained using the InVEST model, further dividing the degree of habitat degradation into five levels: stable (0–0.01), slightly degraded (0.01–0.03), moderately degraded (0.03–0.06), severely degraded (0.06–0.11) and extremely degraded (> 0.11) (Figure 11). From the overall analysis of the YRB, the average habitat degradation levels in 2000, 2010, and 2020 were 0.0223, 0.0219, and 0.0231, respectively, with a first decreasing and then increasing trend.
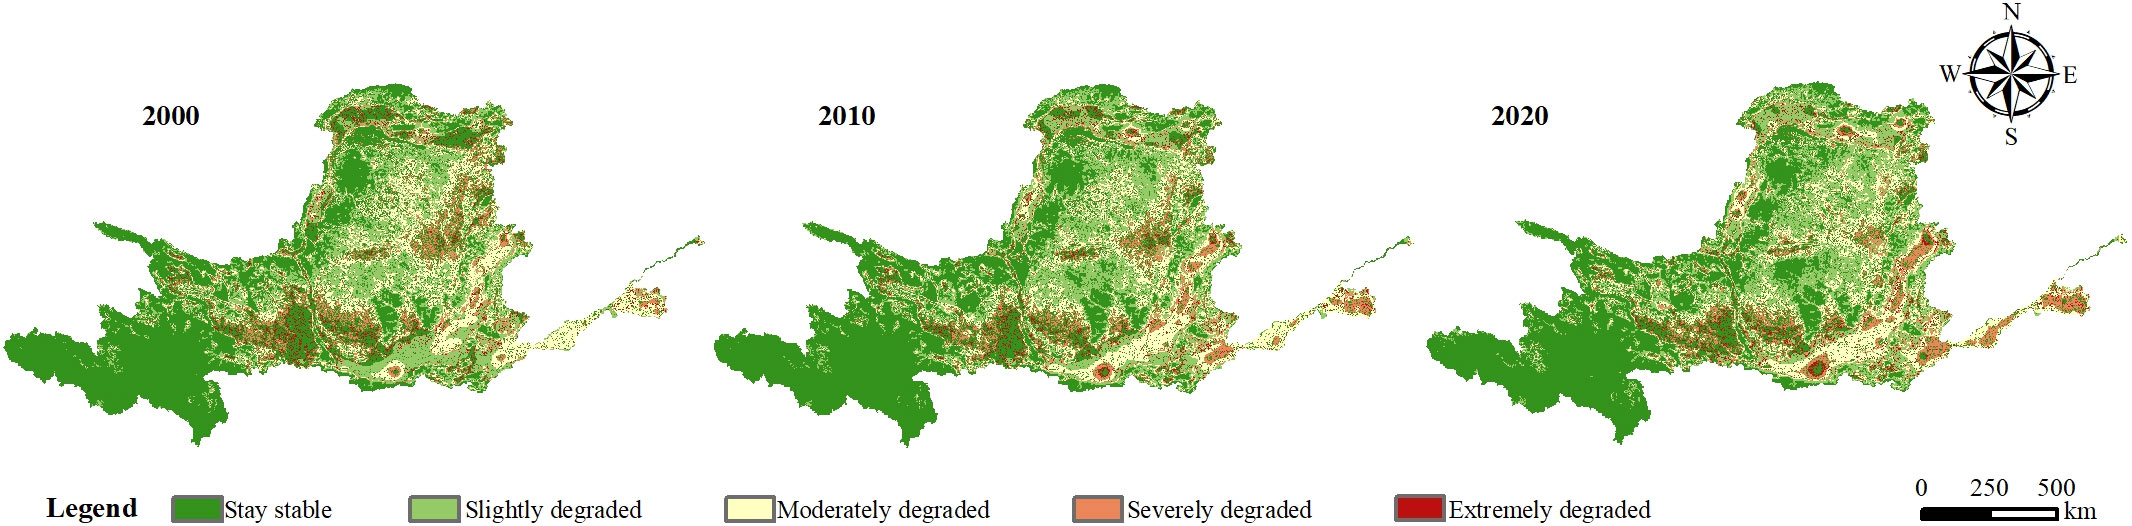
Figure 11 Distribution of habitat degradation levels from 2000–2020.
The habitat degradation distribution map was used to extract the area and percentage of each degradation level and calculate the rate of change (see Figure 12). In terms of temporal changes, the area where habitat degradation remained stable gradually decreased, with an area decrease of 33,867.91 km² and an area share decrease from 50.76% to 48.04%. The slightly degraded areas increased by 30136.43 km², with a proportional increase of 2.43% during the 2 decades. The moderately, severely, and extremely degraded areas had proportional decreases from 16.96, 8.04, and 2.59% in 2000 to 16.57, 7.95, and 2.37% in 2010, respectively and then increases to 16.69, 8.66, and 2.53% in 2020, respectively. The moderately degraded area decreased 3392.46 km², the severely degraded area increased by 7783.84 km², and the extremely degraded area decreased by 659.9 km², with overall non-significant changes.
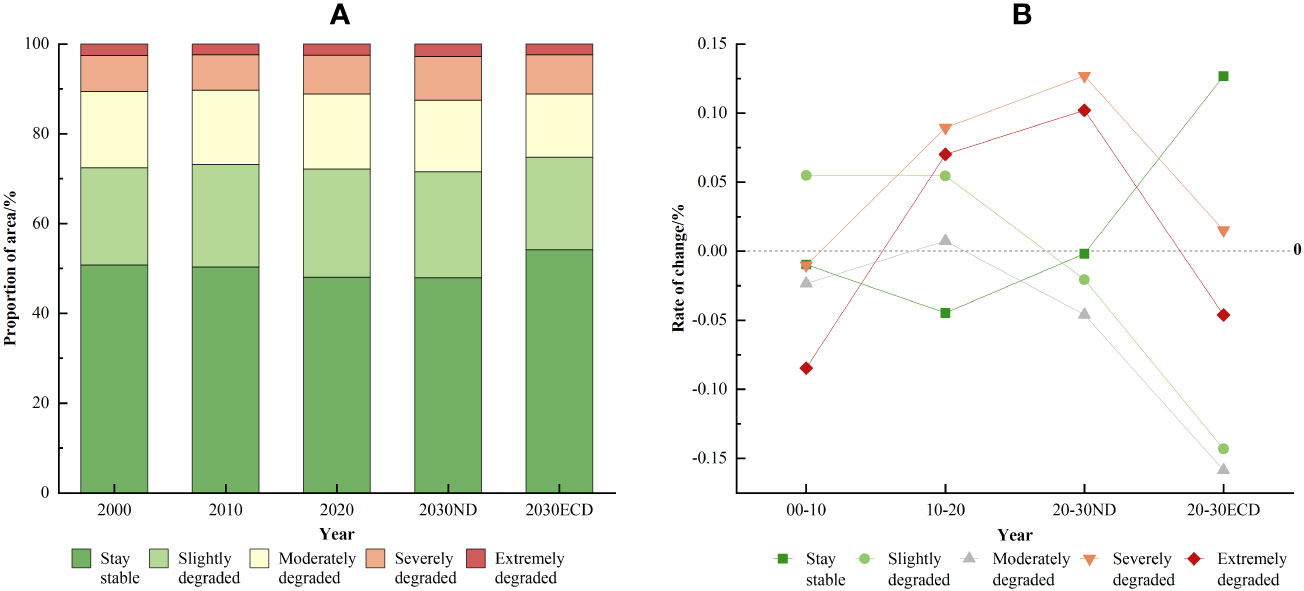
Figure 12 Habitat degradation changes. (A) Change in the percentage area by category. (B) Change in rate.
The habitat degradation pattern was stable in 2000–2020, with more than 40% of the total watershed remaining stable. The areas where the degree of habitat degradation remained stable were mainly distributed in the upstream Sanjiangyuan National Building Park, northwestern Qilianshan National Park, Kubuqi Desert, Ordos Plateau, midstream areas of the Ziwu Ridge and Qinling, and downstream areas of the Taihang Mountains. They were mostly distributed in the upstream area, mainly because it has a higher altitude, the scope of human activity was relatively small, and the land-use types were mainly grassland and forest. Therefore, the ecological restoration level was higher than that of other regions. The slightly degraded areas were more fragmented, mainly in the upper reaches of the Loop Plain, the Mawusu Sands, and the middle reaches of the Loess Plateau. Moderately degraded areas were mainly distributed in the middle and lower regions, particularly in the Guanzhong and North China Plains as these areas are basically dominated by cropland and water, which have a lower impact on habitats. The severely degraded areas were mainly distributed between the building land and cropland of major urban clusters, which are heavily influenced by human activity and suffer severe damage to the ecological environment. Extremely degraded areas were mainly distributed within each urban agglomeration, where high intensity human activities and rapidly expanding building land, accelerated urbanization, and industrialization have a coercive effect on the ecological environment, making the areas extremely degraded.
3.3.2 Prediction of degradation degree of habitat quality
Under the 2030 ND, the average level of habitat degradation was 0.0241, representing an increase of 0.001. Under the ECD, the average level of habitat degradation was 0.0214, with a significant decrease of 0.017 (Figure 13).
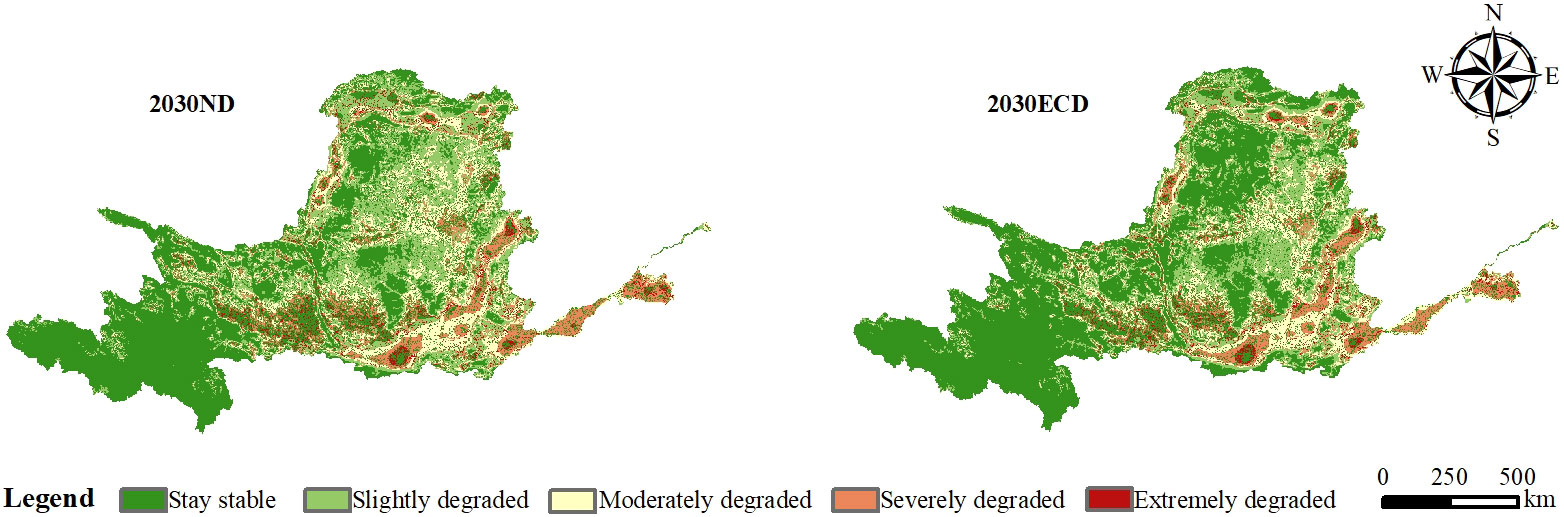
Figure 13 Distribution of habitat degradation levels in 2030.
Under the ND, the areas where the level of degradation remained stable between 2020 and 2030 continued to show a decreasing trend, decreasing by 1101.51 km² and from 48.04% to 47.93% in 2020. The slightly degraded area changed from a gradual increase to a small decrease, with a decrease of 6148.52 km², from 24.08% to 23.6%. Moderately degraded areas showed a significant downward trend compared with 2020, with an absolute area decrease of 9588.52 km² and a proportional decrease from 16.69% to 15.92%. The severely degraded area was the degradation type with the largest change, increasing by 13,620.6 km² and 1.1%. Extremely degraded areas also increased (by 3217.95 km²) due to the expansion of building land, with a proportional increase from 2.53% to 2.79%.
Under the ECD, the most significant change observed was the steep increase in the area where the degradation level remained stable (Figure 12B), with a proportional increase from 48.04% to 54.13% in 2020 and an absolute increase of 75,280.15 km². This indicates a clear improvement in the overall habitat quality. The rates of decline of slightly and moderately degraded areas were accelerated compared with those of the ND, decreasing by 42,736.07 km² and 32,724.28 km², respectively, with proportional areas decreasing from 24.08% and 16.69% to 20.63% and 14.05%, respectively. Although the area of severely degraded areas increased, the growth rate was much lower than that e under the ND, with an area increase of 1630.98 km² and a proportional increase from 8.66% to 8.79%. Extremely degraded areas began to decline, with a decrease of 1450.8 km² and from 2.53% to 2.4%.
Comparing the two scenarios, the areas where degradation levels remained stable under the ECD increased rather than decreased, mainly owing to the implementation of restoration projects curbing the level of habitat degradation. The rates of decline in the slightly and moderately degraded areas accelerated significantly, increasing by several times. In addition, the severely degraded areas no longer rose in a straight line, with the rising trend slowing down and turning into a steady, increasing trend. Extremely degraded areas no longer increased and instead declined, which is inextricably linked to the fact that building land was no longer focused on endless expansion but rather on optimizing the spatial layout.
4 Discussion
4.1 Positive and negative responses of land-use shift on habitat quality
Land-use change has both positive and negative impacts on habitat quality, with varying degrees of impact. Zonal statistics were conducted using geographical information systems to calculate the impact index of land-use change per unit area on habitat quality by dividing the amount of habitat quality change at the time of land-use transfer with the area of land-use transfer (Zhang et al., 2020a) (Figure 14).
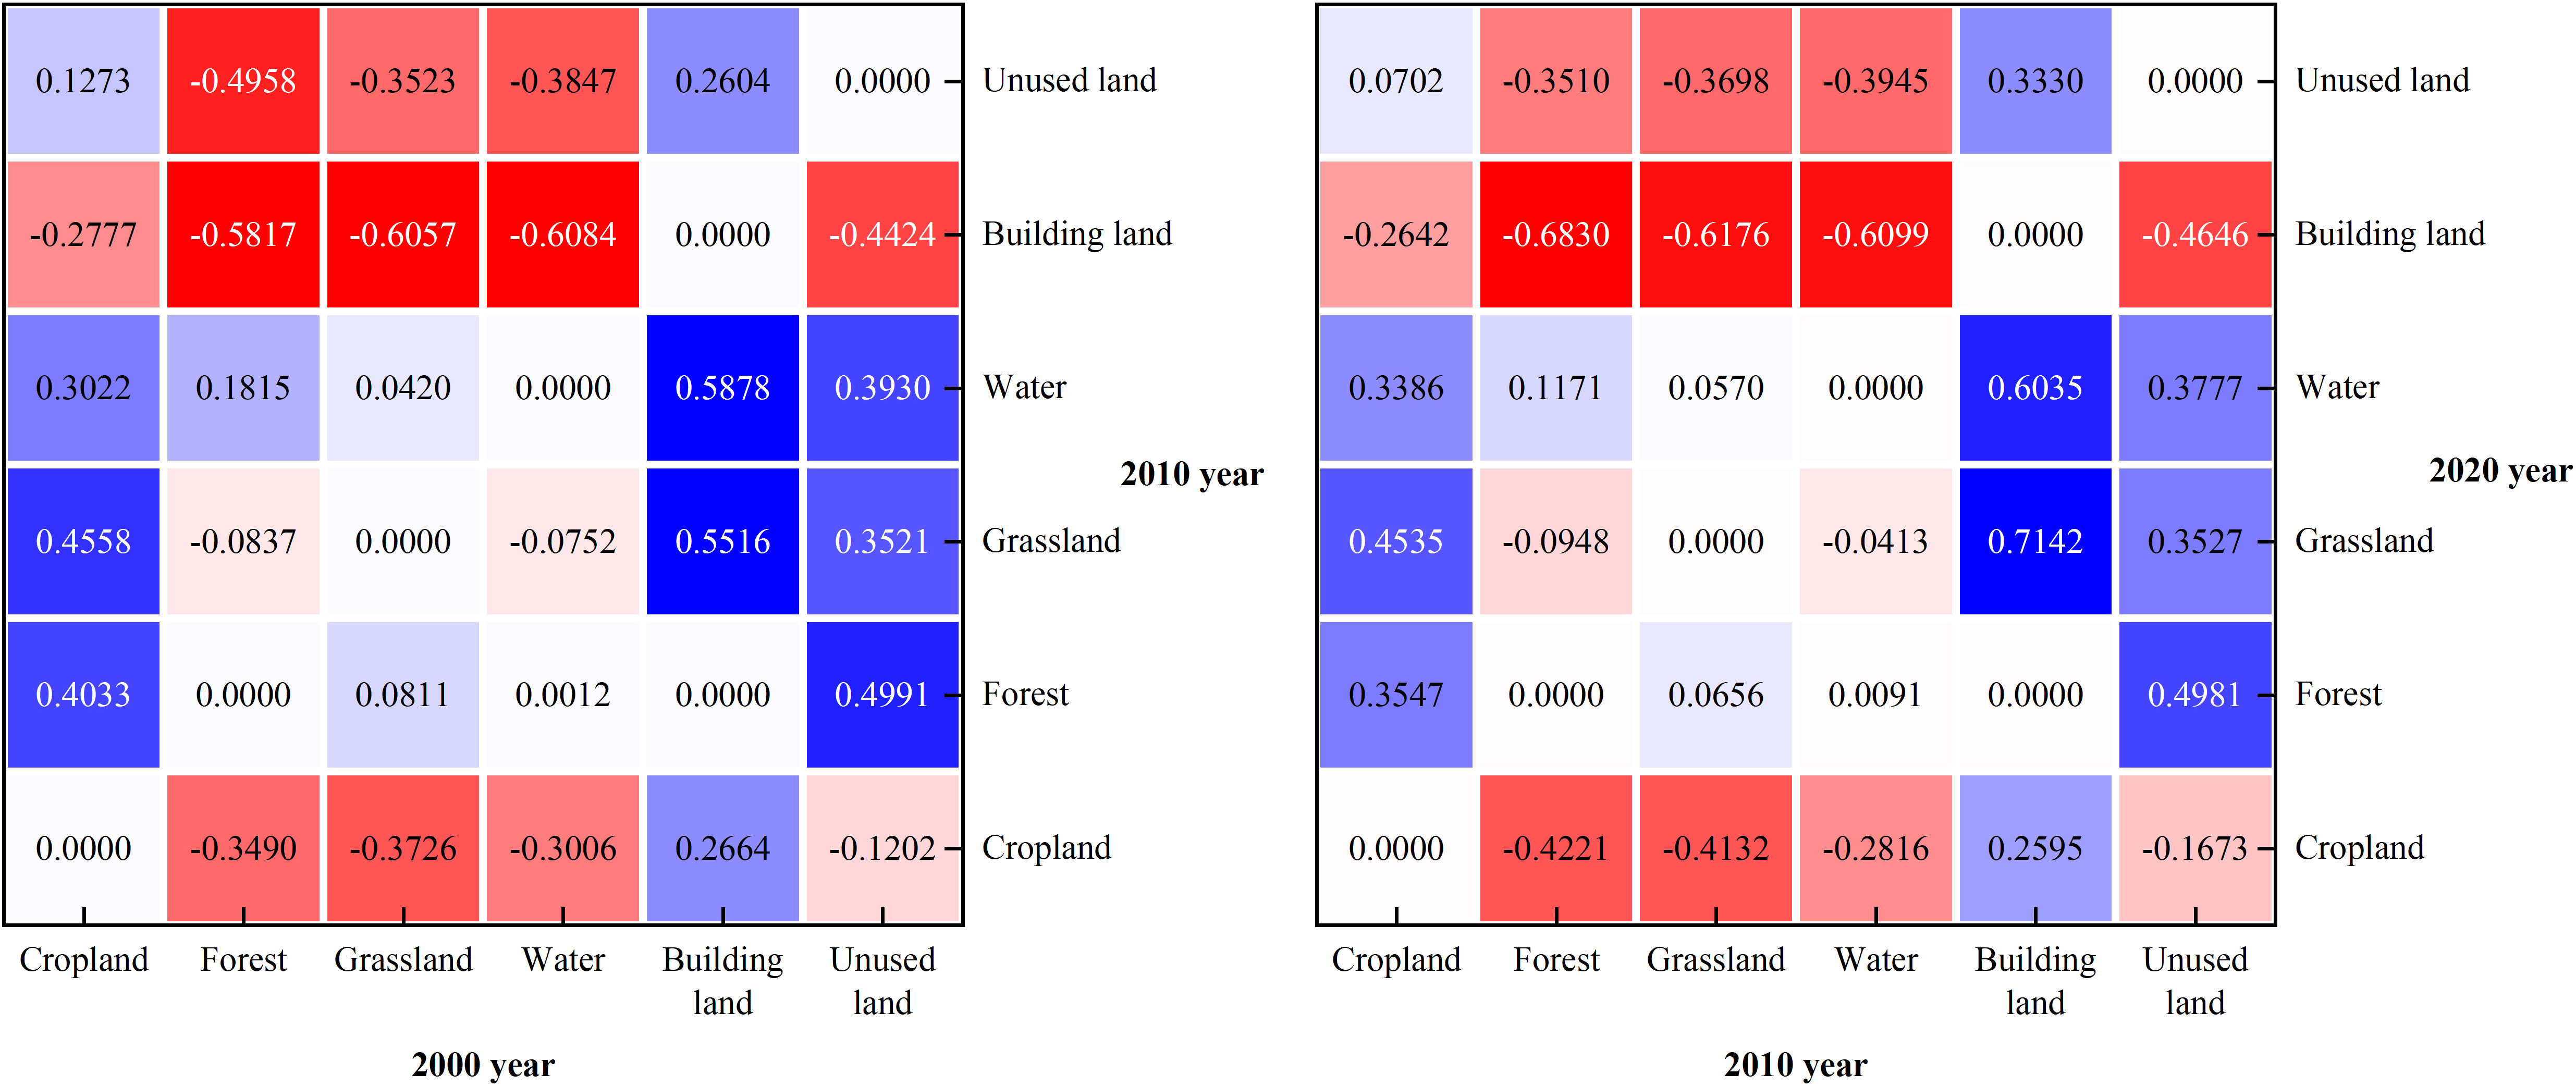
Figure 14 Map of the impact index of land use shift per unit area on habitat quality.
From Figure 14, it can be concluded that the conversion of cropland to forest and grassland, of building land to grassland and water, and of unused land to forest per unit area significantly improved habitat quality during the 2000–2010 period. Among them, the conversion of building land to water per unit area (0.5878) was the most influential land conversion. However, the conversion of water and grassland in the unit area to building land and that of forest to building land and unused land resulted in a significant decrease in habitat quality. This decrease is particularly evident in the conversion of water to building land per unit area (−0.6084). The top five land conversions that positively impacted habitat quality during 2010–2020 were: building land to grassland (0.7142), building land to water (0.6035), unused land to forest, cropland to grassland, and unused land to water. The land conversions that negatively impacted habitat quality were those of forest to building land (−0.6830), grassland to building land (−0.6176), water to building land (−0.6099), and unused land to building land.
The conversion of building land to water and grasslands, within the study period per unit area, The conversion of unused land to forest is the land type conversion that has the greatest impact on habitat quality enhancement. Conversely, the conversion of forest, grassland, and water to building land per unit area is the largest land type conversion promoting habitat quality decline. Therefore, for future development, different provinces, cities and counties in the YRB should combine their own regional planning and rational layout to reduce the phenomenon of construction land encroaching on forest land, grassland, and water bodies. Moreover, they should moderate the reclamation of wasteland for afforestation and sustainable urbanization development in order to achieve simultaneous ecological protection and high-quality development.
4.2 Contribution of land-use change on habitat quality
To better explore the changes within the overall ecological environment of the YRB, the contribution of land conversion to the improvement or deterioration of the ecological environment in 2000–2020 was calculated according to Equation 2 (Figure 15). The conversion types leading to ecological improvement in the YRB in 2000–2010 mainly included the conversions of cropland to grassland, cropland to forest, grassland to forest, and unused land to grassland. Among them, the conversions of cropland and unused land to grassland were the largest contributors to habitat quality improvement, ranking in the top two, with 67.59% and 23.49% proportional contributions, respectively, adding up to more than 90% of the total. These results indicate that the cropland to grassland project and reasonable development of unused land achieved great results during this decade. This was followed by the conversions of cropland and grassland to forest, with contribution rates of 3.95% and 2.01%, respectively. There was no shortage of different types of ecological degradation in the YRB, including the conversion of grassland to cropland, grassland to unused land, cropland to building land, and grassland to building land, with contribution rates of 65.06%, 13.21%, 9.86%, and 5.87%, respectively. The contribution rate of these four conversions exceeded 90%, indicating that the serious reclamation of grassland to agricultural land, encroachment of grassland to unused land, and development and occupation of cultivated land and grassland for building land have become the main reasons for deterioration over the past decade.
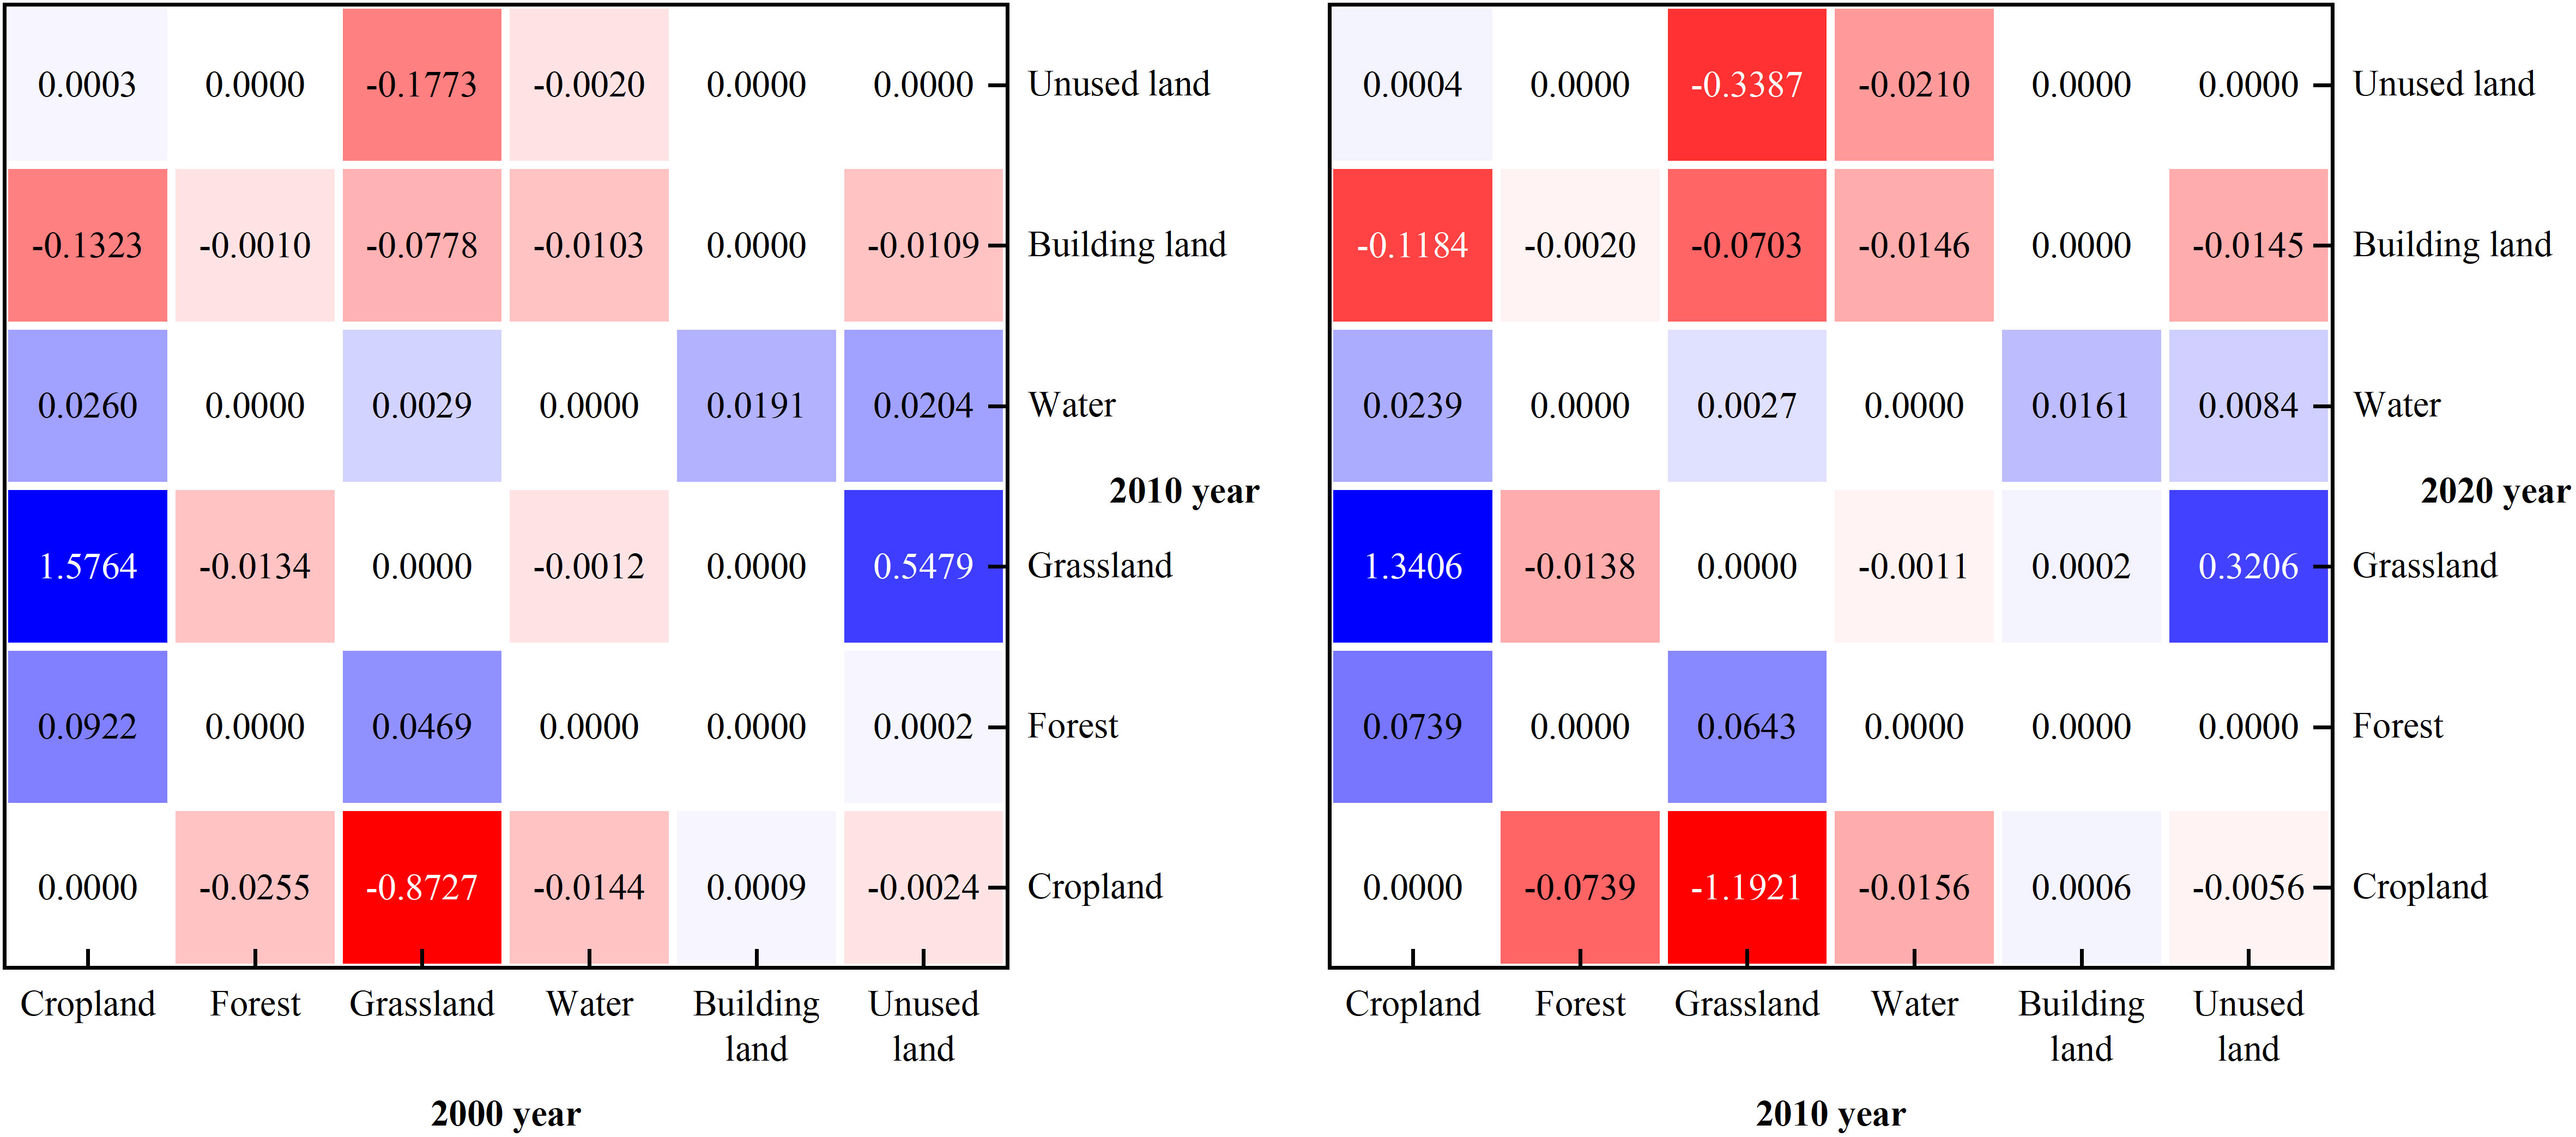
Figure 15 Habitat quality contribution from 2000–2020.
During 2010–2020, the return of cultivated land to grassland and forest, water conservation, and nature restoration became the main reasons for the improvement of ecological environment, among which the conversion of cropland to grassland, unused land to grassland, cropland to forest, and grassland to forest were the top four contributors, accounting for 72.39%, 17.31%, 3.99%, and 3.47%, respectively, with a summed contribution rate of more than 97%. While human activities encroaching on grassland and forest as cropland, building land occupying grassland and cropland, and natural deterioration were the main causes of environmental degradation, the top five categories of land conversion were grassland to cropland, grassland to unused land, cropland to building land, grassland to building land, and forest to cropland, with contribution proportions of 63.35%, 18%, 6.29%, 3.92%, and 3.73%, respectively.
The improvement and deterioration of the ecological environment in the YRB coexisted during the study period. From 2000 to 2020, the conversion of grassland to cropland and of unused land and cropland to building land were the main land conversions promoting ecological degradation. Contrastingly, the conversion of cropland and unused land to grassland and that of cropland to forest were the main land conversions promoting ecological environment improvement. Thus, the project of returning cropland to forest and grassland had the most significant effect on improving the ecological environment, whereas human encroachment on cropland and natural deterioration were the primary causes of environmental deterioration. Therefore, if the quality of the ecological environment is to continue to improve in future developments, previous achievements should first be consolidated, and the project of returning cropland to forest and grass should continue to be implemented, curbing the endless encroachment of grasslands for cultivation. Additionally, the protection of forest and grassland should be strengthened to reduce the trend of turning grassland into unused land.
4.3 Recommendation
Habitat quality in the YRB is closely related to land-use patterns. Owing to the heterogeneity of the YRB, provinces, cities, and counties should consider their local situation and reasonably plan and limit the conversion of certain land types that have a greater impact on habitat quality. In particular, the conversion of building land should be limited (Zhao et al., 2022). From a macro perspective, the continuous improvement in habitat quality in the YRB is mostly owing to the major ecological restoration and measures carried out in recent years, such as returning cropland to forest and grassland, forest closure, and planting of grasses for sand fixation (Yang et al., 2021). In addition to human encroachment on cropland, natural deterioration (conversion of grassland to unused land) is another important cause of environmental degradation. Therefore, strengthening grassland protection should be a top priority over the next decade. To sum up, we should do the ecological forest and grassland project along the Yellow River according to local conditions, classify and apply policies, forest if it is suitable for forest, grass if it is suitable for grass, and seal if it is suitable for sealing, realize the upstream and downstream integrated planning, focus on protection, and combine the natural restoration and artificial restoration, and realize the ecological protection of the Yellow River Basin and the requirements of high-quality development from the natural and practical point of view.
Furthermore, the expansion and occupation of land for building will result in the loss of large amounts of high-quality cropland, while the project of converting cropland to forest and grass also continues to shrink cropland the area (Ji et al., 2022). Yearly cropland loss has been a trend in the YRB for decades and will continue into the next decade, but the YRB also serves as an important production base for agricultural products (Li et al., 2021). The unrestricted reduction of cropland will certainly affect the future agricultural economy. Therefore, it is critical to protect high-quality cropland while decreasing poor-quality and fragmented cropland areas. In addition, it is necessary to avoid the “pie” development model of urbanization, optimize the spatial layout of cities, and construct high-quality metropolitan areas and urban clusters.
4.4 Shortcomings and prospects
This study combined the PLUS and InVEST models to predict and analyze the spatiotemporal evolution patterns of habitat quality in the YRB, providing an important reference for its ecological protection and sustainable development. However, because the YRB spans a large area, the factors affecting habitat quality are spatially diverse. To develop a more targeted ecosystem management approach in the future, the identification and detection of key factors affecting habitat quality in the YRB at different spatial scales needs to be strengthened. In addition, in the scenario prediction of the PLUS and InVEST models, the relevant parameters had some human subjectivity, such as the setting of transfer probability and the maximum distance setting of threat factors, which can only be established after consulting with experts and referring to relevant literature. In the future, the assessment and prediction models should be furthered amended and improved to enhance objectivity and provide a more accurate reference for regional ecological building and related policy formulation (Tang et al., 2020).
5 Conclusions
In this study, we simulated the land use in the YRB in 2030 under different scenarios based on the PLUS model and assessed the habitat quality status in 2000, 2010, 2020, and 2030 under different scenarios using the InVEST model. The response and contribution of land-use change to habitat quality in the YRB were also discussed. The main conclusions drawn are as follows.
1. The habitat quality of the YRB is showed a slightly upward trend from 2000 to 2020, with stable spatial distribution patterns. The average habitat quality in 2030 under the ND showed a small decreasing trend. The mean value of habitat quality in 2030 under the ECD showed significant improvement in habitat conditions. The mean values of habitat degradation in 2000, 2010, and 2020 were 0.0223, 0.0219, and 0.0231, respectively, with the level of habitat degradation showing a first decreasing and then increasing trend; the spatial distribution pattern of habitat degradation was mostly stable. The average value of habitat degradation in 2030 under the ND was 0.0241, indicating it continues to increase. The average value of habitat degradation under the ECD was 0.0214, which represents a significant decrease.
2. Habitat quality is closely tied to changes in land use. Our study indicated that the conversion of land for construction, both positive and negative, had the greatest impact on habitat quality between 2000 and 2020. The main types of land conversion that contribute to improving the ecological environment are the transformation of arable land and unused land into grassland and forest land. Conversely, the conversion of grassland into arable land and unused land and that of arable land into construction land are the main promoters of ecological degradation. Therefore, in the future development of the YRB, attention should be given to the protection of grasslands from a macro perspective. At the micro level, it is necessary for provinces, cities, and counties to pay attention to the rational planning and layout of construction land in order to achieve a balance between ecological protection and economic development.
Data availability statement
The original contributions presented in the study are included in the article/supplementary materials, further inquiries can be directed to the corresponding author.
Author contributions
Project administration and funding acquisition, FQ. Writing—review and editing, FQ. Writing—original draft and methodology, YC. Investigation, ZH, TY, WM. All authors contributed to the article and approved the submitted version.
Funding
This study was supported by the High-Resolution Satellite Project of the State Administration of Science, Technology and Industry for National Defense of the PRC, grant number 80-Y50G19-9001-22/23; the National Science and Technology Platform Construction Project, grant number 2005DKA32300; the Key Projects of National Regional Innovation Joint Fund, grant number U21A2014; the Major Research Projects of the Ministry of Education, grant number 16JJD770019; and the Open Program of Collaborative Innovation Center of Geo-Information Technology for Smart Central Plains Henan Province, grant number G202006.
Acknowledgments
The authors would like to express their sincere gratitude to the reviewers for their constructive comments and useful suggestions that help us improve this study. In addition, I would like to express my sincere thanks to the Ideal Editing Agency for their support in editing this article.
Conflict of interest
The authors declare that the research was conducted in the absence of any commercial or financial relationships that could be construed as a potential conflict of interest.
Publisher’s note
All claims expressed in this article are solely those of the authors and do not necessarily represent those of their affiliated organizations, or those of the publisher, the editors and the reviewers. Any product that may be evaluated in this article, or claim that may be made by its manufacturer, is not guaranteed or endorsed by the publisher.
Abbreviations
YRB, Yellow River Basin; ND, natural development scenario; ECD, ecological conservation and high-quality development scenario; InVEST, Integrated Valuation of Ecosystem Services and Trade-offs; PLUS, patch-generating land-use simulation; CARS, CA model based on multiple types of stochastic patch seeds.
References
Boumans R., ROman J., Altman I., Kaufman L. (2015). The Multiscale Integrated Model of Ecosystem Services (MIMES): Simulating the interactions of coupled human and natural systems. Ecosyst. Serv. 12, 30–41. doi: 10.1016/j.ecoser.2015.01.004
Brown G., Brabyn L. (2012). The extrapolation of social landscape values to a national level in New Zealand using landscape character classification. Appl. Geogr. 35, 84–94. doi: 10.1016/j.apgeog.2012.06.002
Esbah H., Cook E. A., Ewan J. (2009). Effects of increasing urbanization on the ecological integrity of open space preserves. Environ. Manag 43, 846–862. doi: 10.1007/s00267-009-9274-z
Fellman J. B., Hood E., Dryer W., Pyare S. (2015). Stream physical characteristics impact habitat quality for pacific salmon in two temperate coastal watersheds. PLoS One 10, 16. doi: 10.1371/journal.pone.0132652
Gao Z. B., Wang X. R., Sui X. Y., Wang X., Fan Y. T., Zhu Q., et al. (2022). Multi-scenario prediction of habitat quality in Nanjing based on FLUS and InVEST models. J. Agric. Res. Environ. 39, 1001–1013. doi: 10.13254/j.jare.2021.0411
Goldstein J. H., Caldarone G., Duarte T. K., Ennaanay D., Hannahs N., Mendoza G., et al. (2012). Integrating ecosystem-service tradeoffs into land-use decisions. Proc. Nat. Acad. Sci. 109, 7565–7570. doi: 10.1073/pnas.1201040109
Hall L. S., Krausman P. R., Morrison M. L. (1997). The habitat concept and a plea for standard terminology. Wildl. Soc. Bull. 25, 173–182.
Hillard E. M., Nielsen C. K., Groninger J. W. (2017). Swamp rabbits as indicators of wildlife habitat quality in bottomland hardwood forest ecosystems. Ecol. Indic 79, 47–53. doi: 10.1016/j.ecolind.2017.03.024
Hu N., Xu D., Zou N., Fan S. X., Wang P. Y., Li Y. Y. (2023). Multi-scenario simulations of land use and habitat quality based on a PLUS-inVEST model: A case study of baoding, China. Sustain 15, 17. doi: 10.3390/su15010557
Huang J. L., Tang Z., Liu D. F., He J. H. (2020a). Ecological response to urban development in a changing socio-economic and climate context: Policy implications for balancing regional development and habitat conservation. Land Use Policy 97, 9. doi: 10.1016/j.landusepol.2020.104772
Huang M. Y., Yue W. Z., Feng S. R., Zhang J. H. (2020b). Spatial-temporal evolution of habitat quality and analysis of landscape patterns in Dabie Mountain area of west Anhui province based on InVEST model. Acta Ecologica Sin. 40, 2895–2906. doi: 10.5846/stxb201904260858
Ji Q. L., Liang W., Fu B. J., Lu Y. H., Yan J. W., Zhang W. B., et al. (2022). Land use/cover change in the Yellow River Basin based on Google Earth Engine and complex network. Acta Ecologica Sin. 42, 2122–2135. doi: 10.5846/stxb202011132938
La L. M., Gou M. M., Li L., Wang N., Hu J. W., Liu C. F., et al. (2021). Spatiotemporal dynamics and scenarios analysis on trade-offs between ecosystem service in three gorges reservoir area: A case study of zigui county. J. Ecol. Rural Environ. 37, 1368–1377. doi: 10.19741/j.issn.1673-4831.2021.0224
Li Y. Y., Chang J. X., Fan J. J., Yu B. (2021). Agricultural drought evolution characteristics and driving mechanisms in the Yellow River Basin under climate and land use changes. Transact Chin. Soc. Agric. Eng. 37, 84–93. doi: 10.11975/j.issn.1002-6819.2021.19.010
Li Y. N., Duo L. H., Zhang M. (2022). Evolution and prediction of land use pattern and habitat quality based on CA-Markov and InVEST model–A case study of nanchang city in jiangxi province. Res. Soil Water Conserv. 29, 345–354. doi: 10.13869/j.cnki.rswc.20210930.001
Li X. W., Fang C. L., Huang J. C., Mao H. Y. (2003). The urban land use transformations and associated effects on eco-environment in northwest China arid region: A case study in Hexi region, Gansu province. Quat Sci. 23, 280–290. doi: 10.3321/j.issn:1001-7410.2003.03.006
Liang X., Guan Q. F., Clarke K. C., Liu S. S., Wang B. Y., Yao Y. (2021). Understanding the drivers of sustainable land expansion using a patch-generating land use simulation (PLUS) model: A case study in Wuhan, China. Comput. Environ. Urban Syst. 85, 14. doi: 10.1016/j.compenvurbsys.2020.101569
Liu X. P., Liang X., Li X., Xu X. C., Ou J. P., Chen Y. M., et al. (2017). A future land use simulation model (FLUS) for simulating multiple land use scenarios by coupling human and natural effects. Landsc Urban Plan 168, 94–116. doi: 10.1016/j.landurbplan.2017.09.019
Luo S. Q., Hu X. M., Sun Y., Yan C., Zhang X. (2023). Multi-scenario land use change and its impact on carbon storage based on coupled Plus-Invest model. Chin. J. Eco-Agric 31, 300–314. doi: 10.12357/cjea.20220520
Reheman R., Kasimu A., Duolaiti X., Wei B. H., Zhao Y. Y. (2023). Research on the change in prediction of water production in urban agglomerations on the northern slopes of the tianshan mountains based on the inVEST-PLUS model. Water 15, 19. doi: 10.3390/w15040776
Tang F., Fu M. C., Wang L., Zhang P. T. (2020). Land-use change in Changli County, China: Predicting its spatio-temporal evolution in habitat quality. Ecol. Indic 117, 8. doi: 10.1016/j.ecolind.2020.106719
Tang J., Hu X., Wei B., Luo Z., Zhao S., Wang Y. (2022). Land use change prediction and hydrological response assessment of watershed based on FLUS model. J. Yangtze River Sci. Res. Inst 39, 63–69. doi: 10.11988/ckyyb.20210182
Terrado M., Sabater S., Chaplin-Kramer B., Mandle L., Ziv G., Acuna V. (2016). Model development for the assessment of terrestrial and aquatic habitat quality in conservation planning. Sci. Total Environ. 540, 63–70. doi: 10.1016/j.scitotenv.2015.03.064
Van Dessel W., Van Rompaey A., Szilassi P. (2011). Sensitivity analysis of logistic regression parameterization for land use and land cover probability estimation. Int. J. Geogr. Inf Sci. 25, 489–508. doi: 10.1080/13658810903194256
Verburg P. H., Soepboer W., Veldkamp A., Limpiada R., Espaldon V., Mastura S. S. (2002). Modeling the spatial dynamics of regional land use: the CLUE-S model. Environ. Manag 30, 391–405. doi: 10.1007/s00267-002-2630-x
Wan W., Wei W., Qian D. W., Wei X. X., Feng K. (2017). Progress on the environmental effects of land use and land cover change. J. Fujian Agric. For Univ. Nat. Sci. 46, 361–372. doi: 10.13323/j.cnki.j.fafu(nat.sci.).2017.04.001
Wang C. Y., Li T. Z., Guo X. H., Xia L. L., Lu C. D., Wang C. B. (2022a). Plus-inVEST study of the chengdu-chongqing urban agglomeration's land-use change and carbon storage. Land 11, 19. doi: 10.3390/land11101617
Wang B. S., Liao J. F., Zhu W., Qiu Q. Y., Wagn L., Tang L. (2019). The weight of neighborhood setting of the FLUS model based on a historical scenario: A case study of land use simulation of urban agglomeration of the Golden Triangle of Southern Fujian in 2030. Acta Ecologica Sin. 39, 4284–4298. doi: 10.5846/stxb201808021649
Wang Y., Liu X., Hasi E. (2022b). Spatiotemporal differentiation and driving factors of coupling coordination degree of economic-ecological-social benefits from desertification control in the Mu Us Sandy Land. Resour. Sci. 44, 1224–1237. doi: 10.18402/resci.2022.06.10
Wang G., Wang J. W. (2021). Study on the impact of land use change on habitat quality in dandong coastal area. Ecol. Environ. Sci. 30, 621–630. doi: 10.16258/j.cnki.1674-5906.2021.03.021
Wang J. B., Wu Y. F., Gou A. P. (2023a). Habitat quality evolution characteristics and multi-scenario prediction in Shenzhen based on PLUS and InVEST models. Front. Environ. Sci. 11. doi: 10.3389/fenvs.2023.1146347
Wang R. Y., Zhao J. S., Chen G. P., Lin Y. L., Yang A. R., Cheng J. Q. (2023b). Coupling PLUS-inVEST model for ecosystem service research in yunnan province, China. Sustain 15, 19. doi: 10.3390/su15010271
Wei Q. Q., Abudureheman M., Halike A., Yao K. X., Yao L., Tang H., et al. (2022). Temporal and spatial variation analysis of habitat quality on the PLUS-InVEST model for Ebinur Lake Basin, China. Ecol. Indic 145, 15. doi: 10.1016/j.ecolind.2022.109632
Wu X. Y., Gao Y., Dang X. H., Zhang C., Du B., Zhang H. L., et al. (2022). Temporal and spatial variation of vegetation coverage in kubuqi desert from 1989to 2019. Bull. Soil Water Conserv. 42, 300–306. doi: 10.13961/j.cnki.stbctb.2022.02.040
Xu B. R., Liu Y. C., Dong Y., Zhu G., Zhang Y. Z., Lu Z. X., et al. (2021). Evaluation of habitat quality in Lanzhou Region based on InVEST model. J. Desert Res. 41, 120–129. doi: 10.7522/j.issn.1000-694X.2021.00049
Yang J., Huang X. (2021). The 30 m annual land cover dataset and its dynamics in China from 1990 to 2019. Earth Syst. Sci. Data 13, 3907–3925. doi: 10.5194/essd-13-3907-2021
Yang J., Xie B. P., Zhang D. G. (2021). Spatial-temporal evolution of habitat quality and its influencing factors in the Yellow River Basin based on InVEST model and GeoDetector. J. Desert Res. 41, 12–22. doi: 10.7522/j.issn.1000-694X.2021.00026
Yang L. W., Zhao J., Zhu J. T., Liu L., Zhang P. (2022). Spatial- temporal change and prediction of carbon stock in the ecosystem of Xi'an based on PLUS and InVEST models. Remote Sens Nat. Resour 34, 175–182. doi: 10.6046/zrzyyg.2021348
Zhang X., Lyu C. J., Fan X., Bi R. T., Xia L., Xu C. C., et al. (2022b). Spatiotemporal variation and influence factors of habitat quality in loess hilly and gully area of yellow river basin: A case study of liulin county, China. Land 11, 17. doi: 10.3390/land11010127
Zhang X. R., Song W., Lang Y. Q., Feng X. M., Yuan Q. Z., Wang J. T. (2020a). Land use changes in the coastal zone of China's Hebei Province and the corresponding impacts on habitat quality. Land Use Policy 99, 14. doi: 10.1016/j.landusepol.2020.104957
Zhang S. H., Zhong Q. L., Cheng D. L., Xu C. B., Chang Y. N., Lin Y. Y., et al. (2022a). Landscape ecological risk projection based on the PLUS model under the localized shared socioeconomic pathways in the Fujian Delta region. Ecol. Indic 136, 13. doi: 10.1016/j.ecolind.2022.108642
Zhang X. R., Zhou J., Li G. N., Chen C., Li M. M., Luo J. M. (2020b). Spatial pattern reconstruction of regional habitat quality based on the simulation of land use changes from 1975 to 2010. J. Geogr. Sci. 30, 601–620. doi: 10.1007/s11442-020-1745-4
Zhao Y. H., Qu Z., Zhang Y., Ao Y., Han L., Kang S. Z., et al. (2022). Effects of human activity intensity on habitat quality based on nighttime light remote sensing: A case study of Northern Shaanxi, China. Sci. Total Environ. 851, 10. doi: 10.1016/j.scitotenv.2022.158037
Zhao S. D., Zhang Y. M. (2004). Concepts, contents and challenges of ecosystem assessment -Introduction to "Ecosystems and Human Well-being: A Framework for Assessment". Adv. Earth Sci. 19, 650–657. doi: 10.11867/j.issn.1001-8166.2004.04.0650
Keywords: PLUS model, InVEST model, Yellow River Basin, habitat quality, multi-scenario prediction, ecological conservation and high-quality development
Citation: Chen Y, He Z, Yue T, Mu W and Qin F (2023) Spatiotemporal evolution and multi-scenario prediction of habitat quality in the Yellow River Basin. Front. Ecol. Evol. 11:1226676. doi: 10.3389/fevo.2023.1226676
Received: 22 May 2023; Accepted: 21 August 2023;
Published: 07 September 2023.
Edited by:
Longshan Zhao, Guizhou University, ChinaCopyright © 2023 Chen, He, Yue, Mu and Qin. This is an open-access article distributed under the terms of the Creative Commons Attribution License (CC BY). The use, distribution or reproduction in other forums is permitted, provided the original author(s) and the copyright owner(s) are credited and that the original publication in this journal is cited, in accordance with accepted academic practice. No use, distribution or reproduction is permitted which does not comply with these terms.
*Correspondence: Fen Qin, cWluZmVuQGhlbnUuZWR1LmNu